Evidence of Evolution This PowerPoint was revised Jan 1, 2010 for Unique.
25
Evidence of Evolution This PowerPoint was revised Jan 1, 2010 for Unique
-
Upload
gwendolyn-lester -
Category
Documents
-
view
214 -
download
0
Transcript of Evidence of Evolution This PowerPoint was revised Jan 1, 2010 for Unique.

Evidence of Evolution
This PowerPoint was revised Jan 1, 2010 for Unique
EVOLUTION IS
GENETIC CHANGE IN A POPULATION THROUGH TIME.
GENETIC CHANGE IN A POPULATION THROUGH TIME.
EVIDENCES OF EVOLUTION
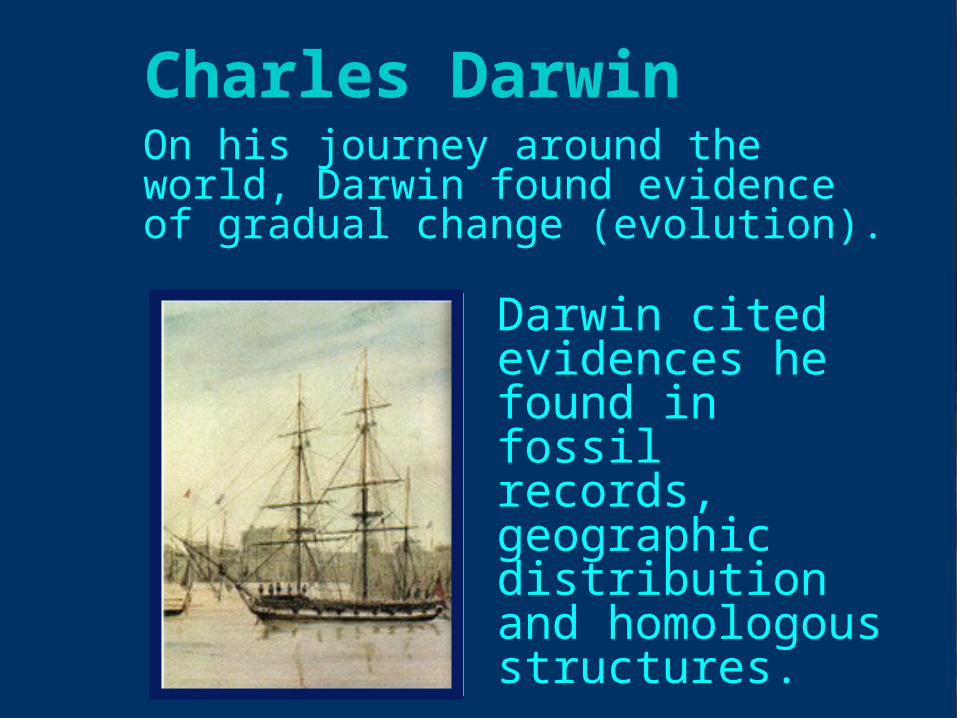
Charles DarwinOn his journey around the world, Darwin found evidence of gradual change (evolution).
Darwin cited evidences he found in fossil records, geographic distribution and homologous structures.
Evidences of EvolutionToday most evidences for evolution are grouped into five main categories:
BiochemicalFossil RecordComparative
AnatomyBiogeographyObservable Events
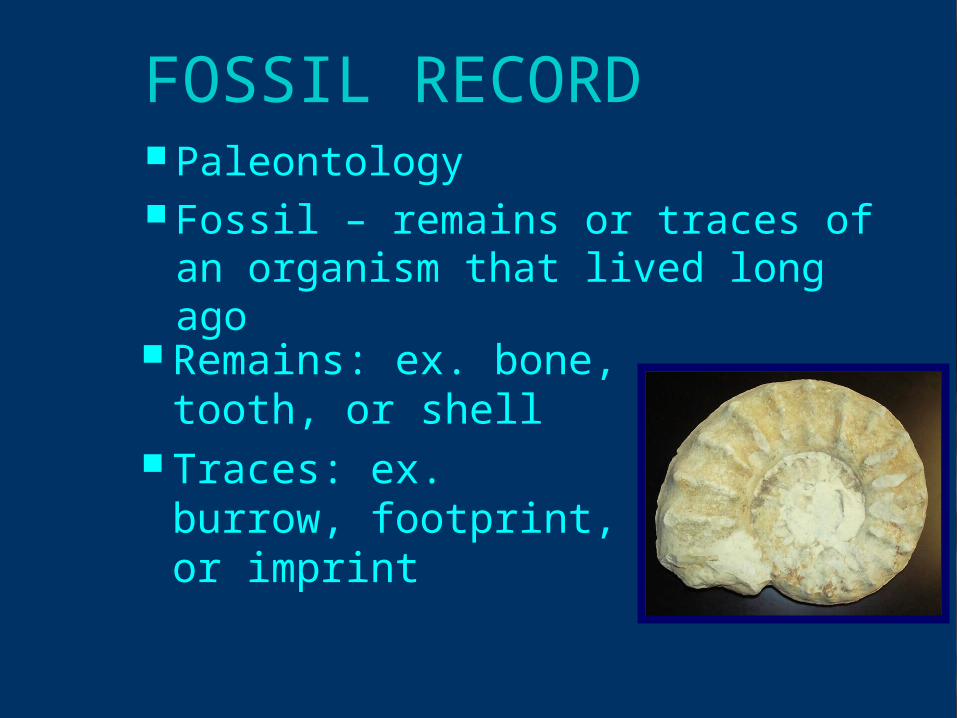
FOSSIL RECORD Paleontology Fossil – remains or traces of an
organism that lived long ago
Remains: ex. bone, tooth, or shell
Traces: ex. burrow, footprint, or imprint
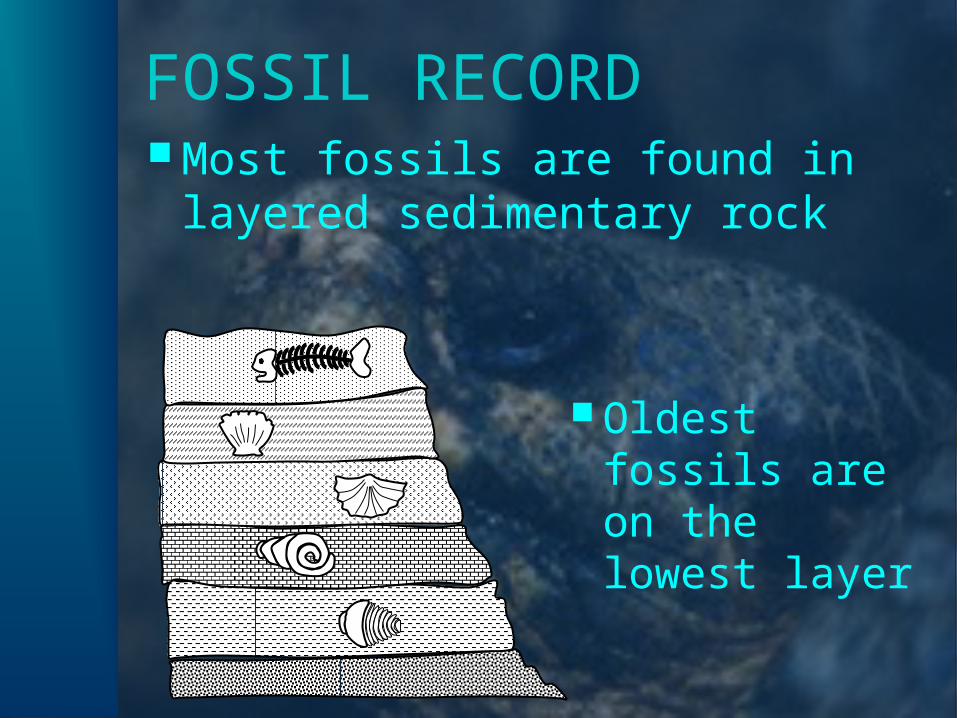
FOSSIL RECORD Most fossils are found in
layered sedimentary rock
Oldest fossils are on the lowest layer
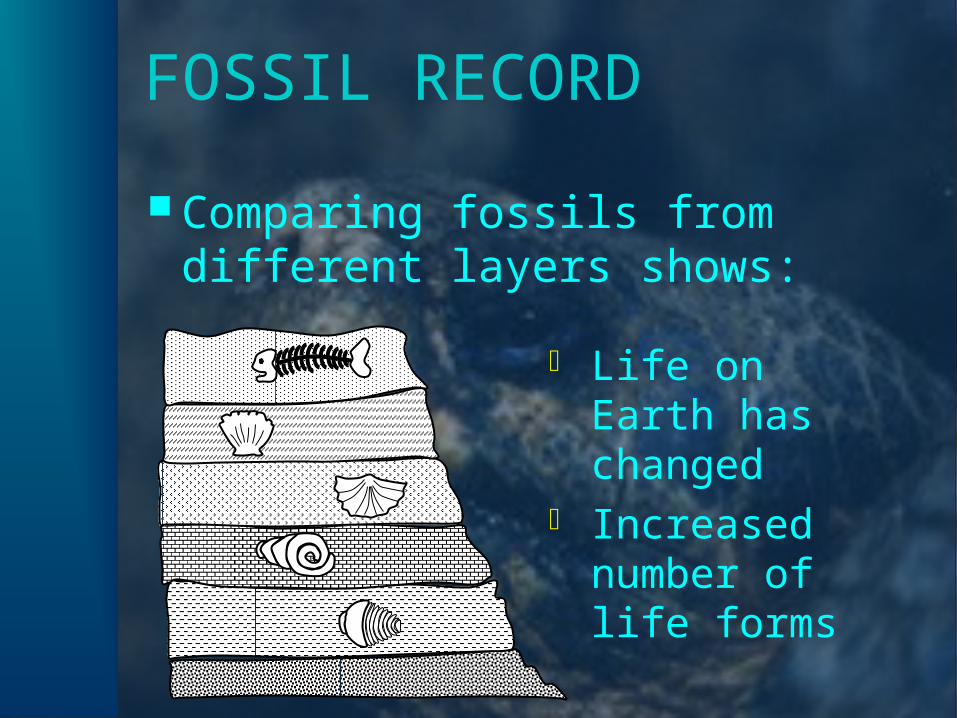
FOSSIL RECORD
Comparing fossils from different layers shows:
Life on Earth has changed
Increased number of life forms
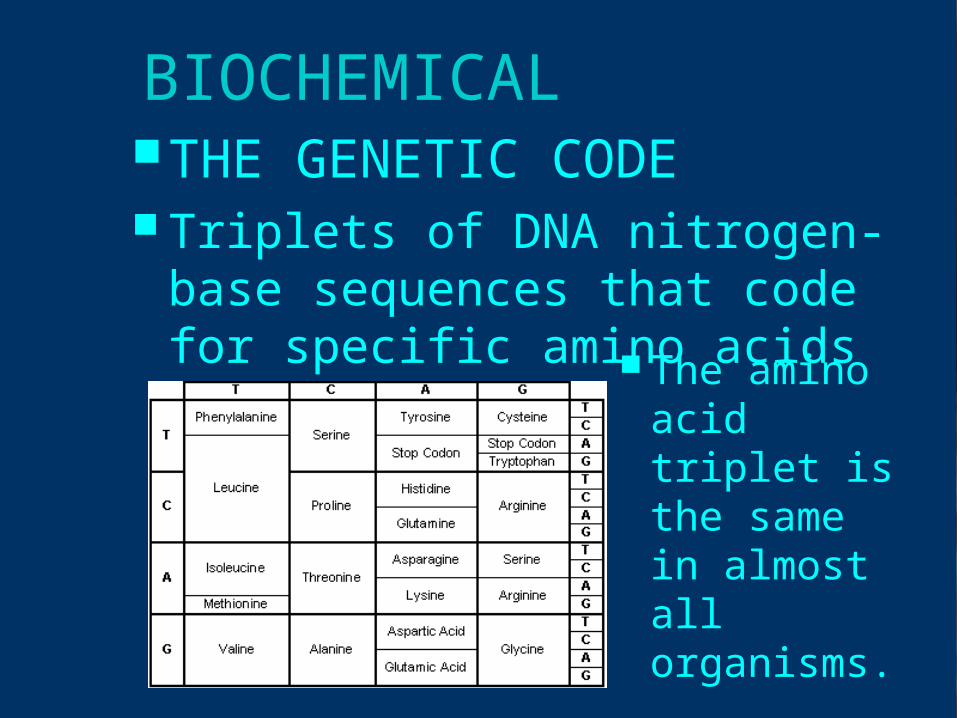
BIOCHEMICALTHE GENETIC CODE Triplets of DNA nitrogen-base
sequences that code for specific amino acids The amino
acid triplet is the same in almost all organisms.
BIOCHEMICAL
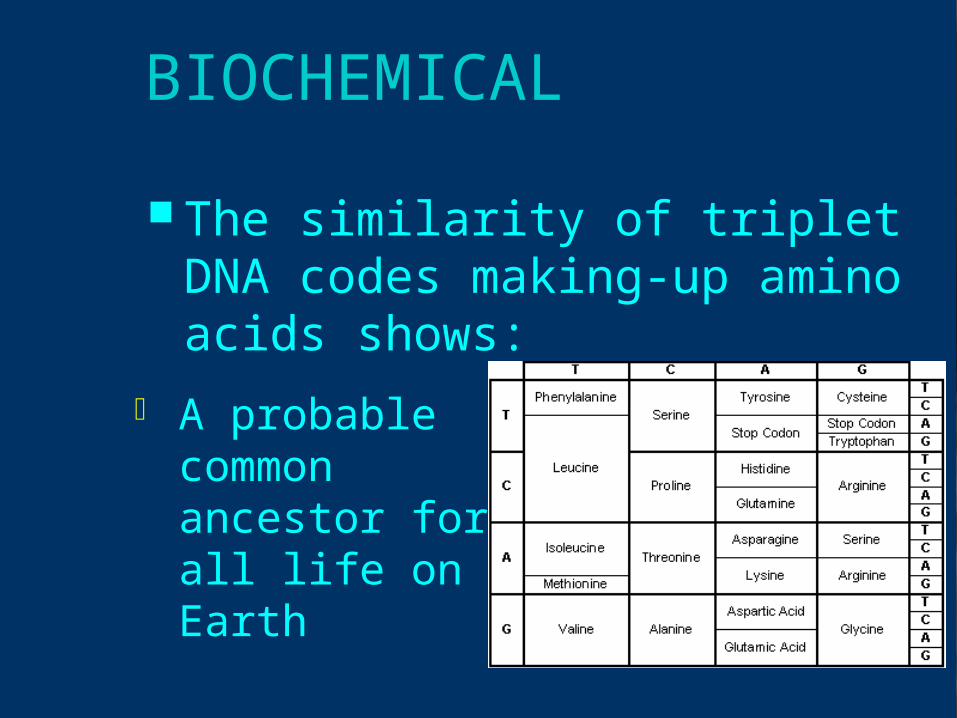
The similarity of triplet DNA codes making-up amino acids shows:
A probable common ancestor for all life on Earth

BIOCHEMICAL
“Universal” GENETIC CODE Similar genes Over the ages, the genetic code
has passed unchanged (or nearly so) from parent to offspring.

BIOCHEMICAL AMINO ACID SEQUENCING
The amino acid sequence in a particular protein is compared between organisms. Number of differences
from human hemoglobin
45
167
8
27
125
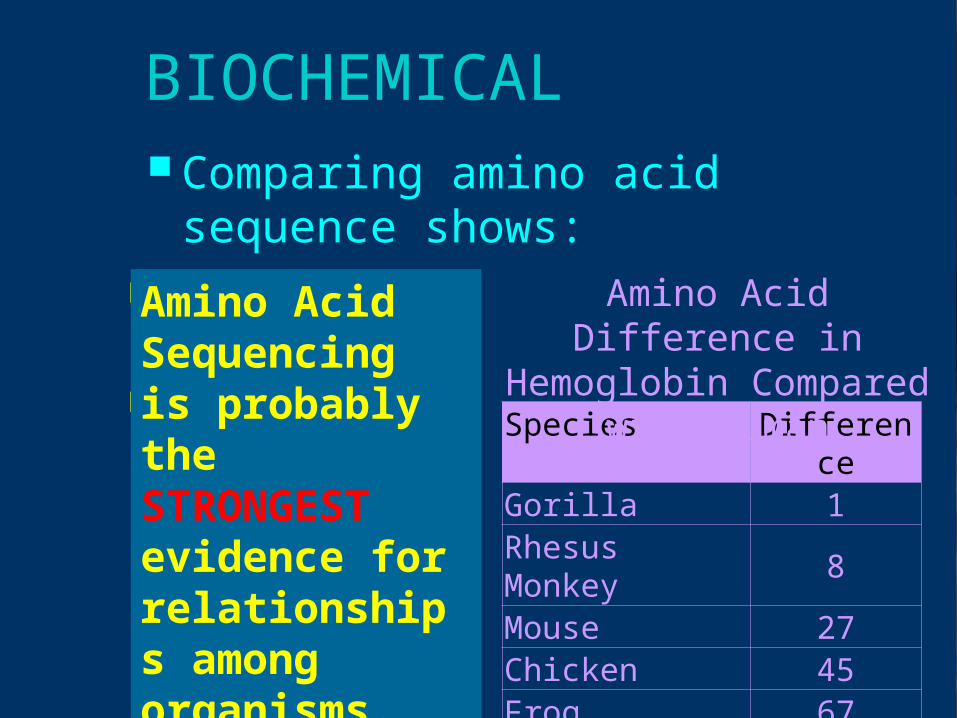
BIOCHEMICAL Comparing amino acid sequence
shows: Closeness of
relationship A probable
common ancestor
Species DifferenceGorilla 1Rhesus Monkey
8
Mouse 27Chicken 45Frog 67Lamprey 125
Amino Acid Difference in Hemoglobin
Compared with Human
Human hemoglobin has 146 amino acids
Amino Acid Sequencing is probably the STRONGEST evidence for relationships among organisms.
What organism belongs at
each branch?
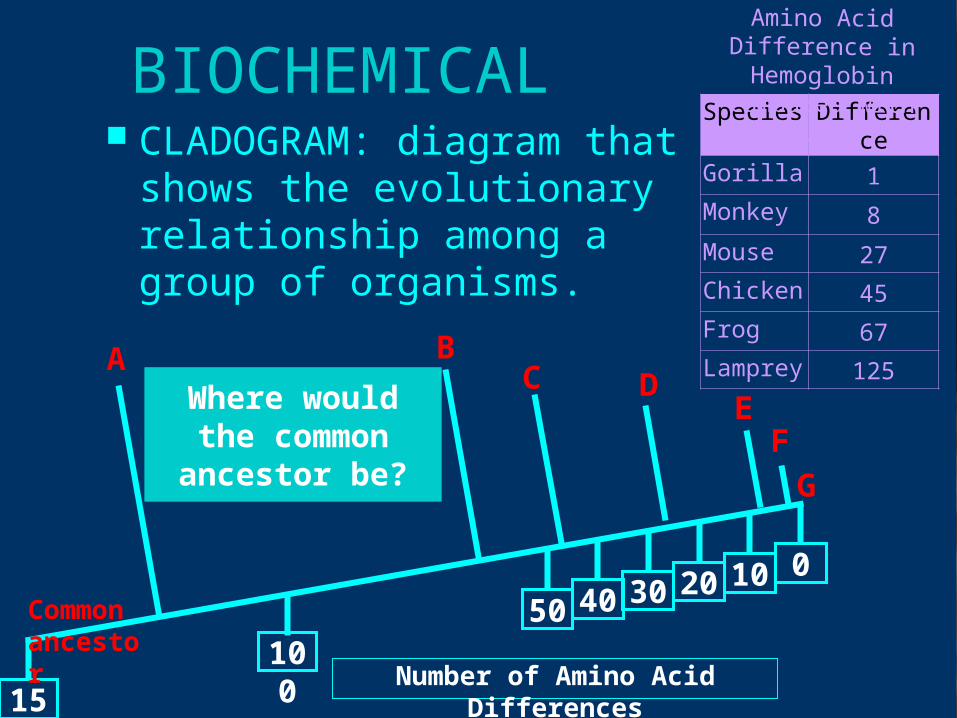
BIOCHEMICAL CLADOGRAM: diagram that
shows the evolutionary relationship among a group of organisms.
Species Difference
Gorilla 1Monkey 8Mouse 27Chicken 45Frog 67Lamprey
125
Amino Acid Difference in Hemoglobin
Compared with Human
Number of Amino Acid Differences150
10050
040 2030 10
G
FE
DCBA
Common ancestor
Where would the common ancestor be?
COMPARATIVE ANATOMY
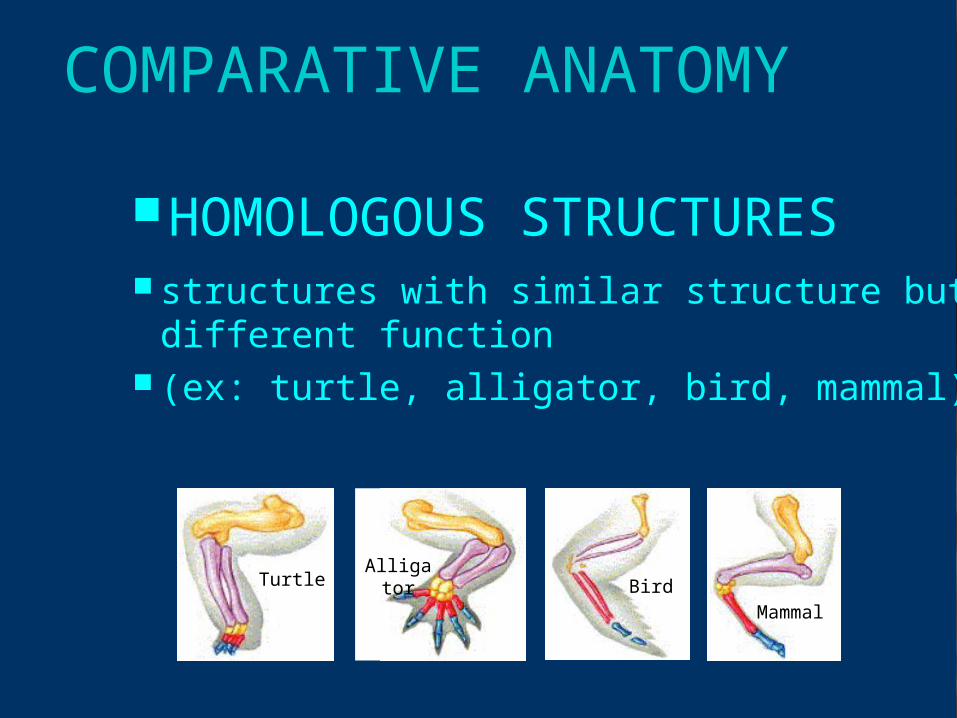
HOMOLOGOUS STRUCTURES
structures with similar structure but different function
(ex: turtle, alligator, bird, mammal)
TurtleAlligator
BirdMammal
COMPARATIVE ANATOMY
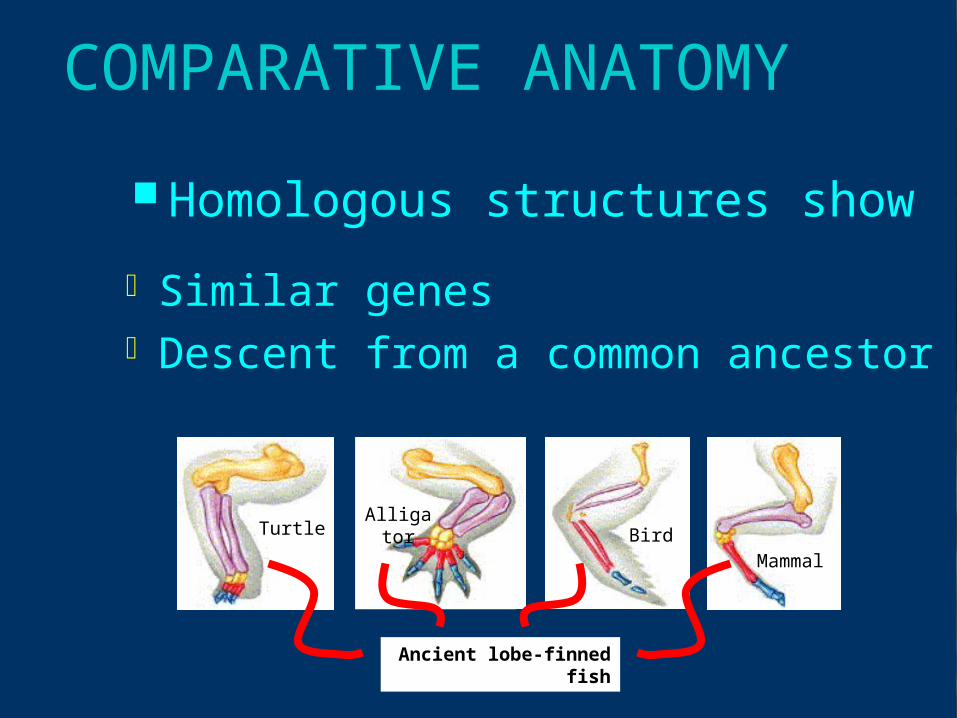
Homologous structures show
Similar genes Descent from a common ancestor
TurtleAlligator
BirdMammal
Ancient lobe-finned fish
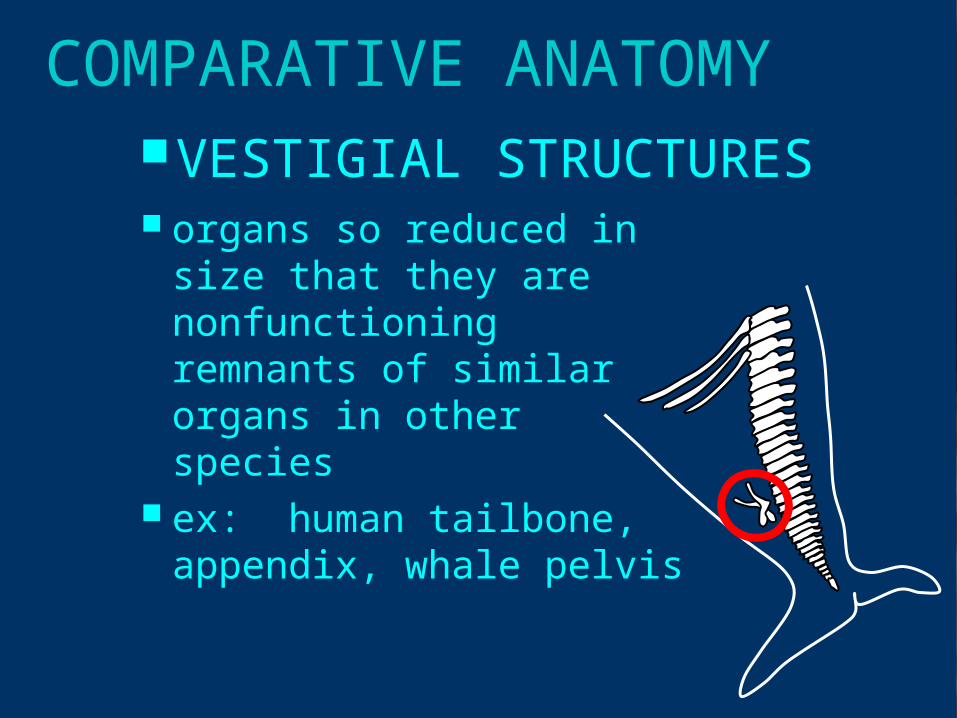
COMPARATIVE ANATOMYVESTIGIAL STRUCTURES organs so reduced in
size that they are nonfunctioning remnants of similar organs in other species
ex: human tailbone, appendix, whale pelvis

COMPARATIVE ANATOMY
Vestigial structures show:
an organism’s evolutionary past
a common ancestor with species that have similar structures that are still functioning

Analogous Structures
COMPARATIVE ANATOMY
Unrelated species have evolved to have similar adaptations

COMPARATIVE ANATOMY
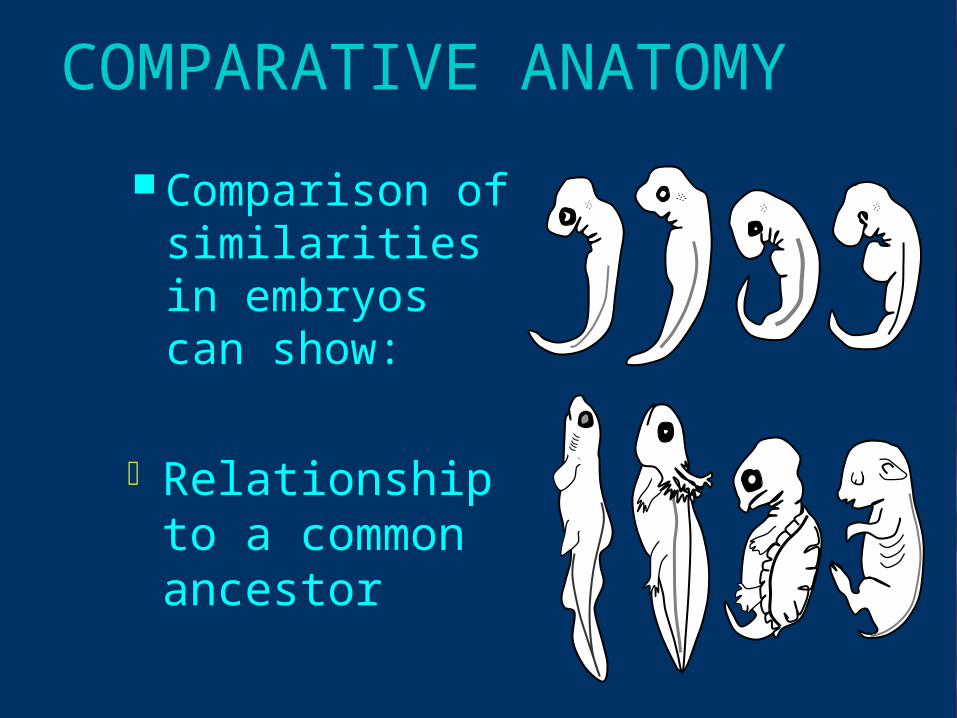
EMBRYOLOGY Embryos of different species
may appear similar in early stages of development
ex: vertebrate development
COMPARATIVE ANATOMY
Comparison of similarities in embryos can show:
Relationship to a common ancestor

BIOGEOGRAPHY GEOGRAPHIC DISTRIBUTION
OF ORGANISMS organisms living
widely apart (even different continents) may be similar because they share a common ancestor
Beaver
Muskrat
Beaver andMuskrat
Coypu
Capybara
Coypu andCapybara
Shows common ancestor
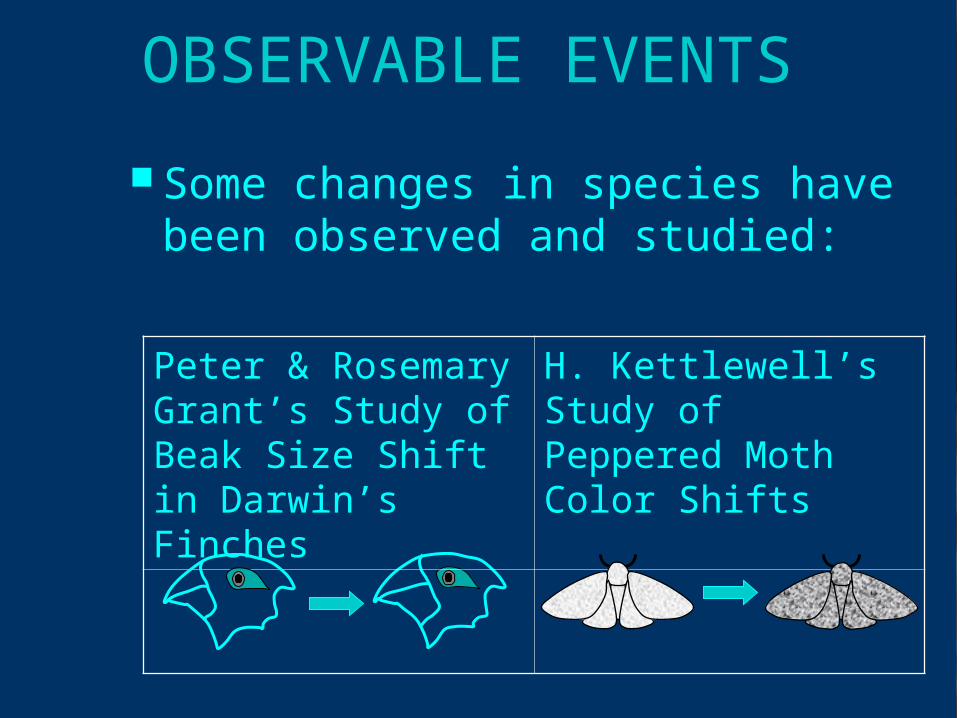
OBSERVABLE EVENTS
Some changes in species have been observed and studied:
Peter & Rosemary Grant’s Study of Beak Size Shift in Darwin’s Finches
H. Kettlewell’s Study of Peppered Moth Color Shifts
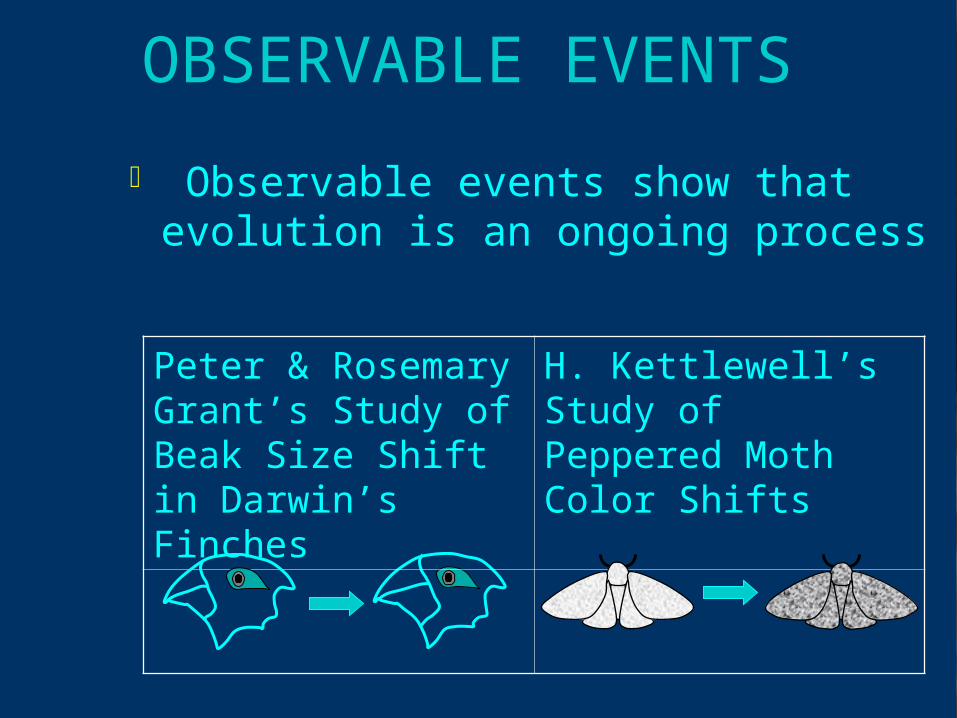
OBSERVABLE EVENTS
Observable events show that evolution is an ongoing process
Peter & Rosemary Grant’s Study of Beak Size Shift in Darwin’s Finches
H. Kettlewell’s Study of Peppered Moth Color Shifts

Works Cited
Miller, Kenneth and Levine, Joseph. (2004). Biology. Prentice Hall.