Evidence for superconductivity in Li-decorated monolayer … · Although superconductivity is...
5
Evidence for superconductivity in Li-decorated monolayer graphene B. M. Ludbrook a,b , G. Levy a,b , P. Nigge a,b , M. Zonno a,b , M. Schneider a,b , D. J. Dvorak a,b , C. N. Veenstra a,b , S. Zhdanovich b,c , D. Wong a,b , P. Dosanjh a,b , C. Straßer d , A. Stöhr d , S. Forti d , C. R. Ast d , U. Starke d , and A. Damascelli a,b,1 a Department of Physics and Astronomy, University of British Columbia, Vancouver, BC V6T 1Z1, Canada; b Quantum Matter Institute, University of British Columbia, Vancouver, BC V6T 1Z4, Canada; c Department of Chemistry, University of British Columbia, Vancouver, BC V6T 1Z1, Canada; and d Max Planck Institute for Solid State Research, 70569 Stuttgart, Germany Edited by J. C. Séamus Davis, Cornell University, Ithaca, NY, and approved August 10, 2015 (received for review May 28, 2015) Monolayer graphene exhibits many spectacular electronic properties, with superconductivity being arguably the most notable exception. It was theoretically proposed that superconductivity might be in- duced by enhancing the electron–phonon coupling through the dec- oration of graphene with an alkali adatom superlattice [Profeta G, Calandra M, Mauri F (2012) Nat Phys 8(2):131–134]. Although experiments have shown an adatom-induced enhancement of the electron–phonon coupling, superconductivity has never been ob- served. Using angle-resolved photoemission spectroscopy (ARPES), we show that lithium deposited on graphene at low temperature strongly modifies the phonon density of states, leading to an en- hancement of the electron–phonon coupling of up to λ ≃ 0.58. On part of the graphene-derived π*-band Fermi surface, we then observe the opening of a Δ ≃ 0.9-meV temperature-dependent pairing gap. This result suggests for the first time, to our knowledge, that Li-decorated monolayer graphene is indeed superconducting, with T c ≃ 5.9 K. graphene | superconductivity | ARPES A lthough not observed in pure bulk graphite, superconduc- tivity occurs in certain graphite intercalated compounds (GICs), with T c values of up to 11.5 K in the case of CaC 6 (1, 2). The origin of superconductivity in these materials has been identified in the enhancement of electron–phonon coupling in- duced by the intercalant layers (3, 4). The observation of a superconducting gap on the graphitic π p -bands in bulk CaC 6 (5) suggests that realizing superconductivity in monolayer graphene might be a real possibility. This prospect has, indeed, attracted intense theoretical and experimental efforts (6–12). In particular, recent density functional theory calculations have suggested that, analogous to the case of intercalated bulk graphite, super- conductivity can be induced in monolayer graphene through the adsorption of certain alkali metals (8). Although the Li-based GIC—bulk LiC 6 —is not known to be superconducting, Li-decorated graphene emerges as a particu- larly interesting case with a predicted superconducting T c of up to 8.1 K (8). The proposed mechanism for this enhancement of T c is the removal of the confining potential of the graphite C 6 layers, which changes both the occupancy of the Li 2s band (or the ionization of the Li) and its position with respect to the graphene layer. These modifications lead to an increase of the electron–phonon coupling constant from λ = 0.33 to λ = 0.61, in going from bulk to monolayer LiC 6 . It has been argued that the LiC 6 monolayer should exhibit the largest values of both λ and T c among all alkali–metal–C 6 superlattices (8). Nevertheless, although there is thorough experimental evidence for adatom-enhanced electron–phonon coupling in graphene (7, 11, 13), superconduc- tivity has not yet been observed in decorated monolayer graphene. Angle-resolved photoemission spectroscopy (ARPES) mea- surements of the electronic dispersion of pristine and Li-decorated graphene at 8 K, characterized by the distinctive Dirac cones at the corners of the hexagonal Brillouin zone (Fig. 1E), are shown in Fig. 1 A and B. Li adatoms electron-dope the graphene sheet by charge transfer doping, leading to a shift of the Dirac point to higher binding energies. As evidenced by the evolution of the graphene sheet carrier density in Fig. 1F, this trend begins to saturate after several minutes of Li deposition. Concomitantly, we observe the emergence of a new spectral weight (Fig. 1E) at the Brillouin zone center (the comparison of the Γ-point ARPES dispersion for pris- tine and 10-min Li-decorated graphene is shown in Fig. 1 C and D). The origin of this spectral weight is probably the Li-2s band expected for this system (8) superimposed with the folded gra- phene bands caused by a Li superstructure, which were observed in Li and Ca bulk GIC systems (5, 14). This spectral weight, which disappears above ∼ 50 K and is not recovered on subsequent cooling, is associated with the strong enhancement of electron– phonon coupling (discussed later, see Fig. 3 and SI Appendix). Next, we use high-resolution, low-temperature ARPES to search for the opening of a temperature-dependent pairing gap along the π p -band Fermi surface as a direct spectroscopic signature of the realization of a superconducting state in monolayer LiC 6 . To in- crease our experimental sensitivity, as illustrated in Fig. 2A, using the approach introduced for FeAs (17) and cuprate (18) super- conductors, we perform an analysis of ARPES energy distribution curves (EDCs) integrated in dk along a 1D momentum–space cut perpendicular to the Fermi surface. This method also provides the added benefit that the integrated EDCs can be modeled in terms of a simple Dynes gap function (19) multiplied by a linear background and the Fermi–Dirac distribution, all convolved with a Gaussian resolution function (Methods and Eq. 4). As shown in Fig. 2A and especially, Fig. 2B, for data from the k-space location indicated by Significance Although superconductivity is well-known in intercalated bulk graphite, the ultimate goal of inducing superconductivity in single-layer graphene has not yet been achieved. We have here developed an experiment that combines ultralow-temperature (5 K) and ultrahigh-vacuum (10 −11 torr) sample preparation with high-resolution angle-resolved photoemission spectros- copy (ARPES). We show that decorating monolayer graphene with a layer of lithium atoms enhances the electron–phonon coupling to the point where a superconducting state can be stabilized at low temperature. Measurements of the size of the superconducting gap by ARPES suggest a T c of about 5.9 K. This result constitutes the first observation, to our knowledge, of superconductivity in monolayer graphene. Given the massive sci- entific and technological interest in graphene, our findings will have significant cross-disciplinary impact. Author contributions: B.M.L., C.R.A., and A.D. designed research; B.M.L., G.L., P.N., M.Z., D.J.D., and S.Z. performed research; B.M.L., G.L., M.Z., M.S., C.N.V., S.Z., D.W., P.D., C.S., A.S., S.F., C.R.A., and U.S. contributed new reagents/analytic tools; B.M.L., P.N., D.J.D., and S.Z. analyzed data; and B.M.L. and A.D. wrote the paper. The authors declare no conflict of interest. This article is a PNAS Direct Submission. 1 To whom correspondence should be addressed. Email: [email protected]. This article contains supporting information online at www.pnas.org/lookup/suppl/doi:10. 1073/pnas.1510435112/-/DCSupplemental. www.pnas.org/cgi/doi/10.1073/pnas.1510435112 PNAS | September 22, 2015 | vol. 112 | no. 38 | 11795–11799 PHYSICS Downloaded by guest on May 8, 2020
Transcript of Evidence for superconductivity in Li-decorated monolayer … · Although superconductivity is...

Evidence for superconductivity in Li-decoratedmonolayer grapheneB. M. Ludbrooka,b, G. Levya,b, P. Niggea,b, M. Zonnoa,b, M. Schneidera,b, D. J. Dvoraka,b, C. N. Veenstraa,b,S. Zhdanovichb,c, D. Wonga,b, P. Dosanjha,b, C. Straßerd, A. Stöhrd, S. Fortid, C. R. Astd, U. Starked, and A. Damascellia,b,1
aDepartment of Physics and Astronomy, University of British Columbia, Vancouver, BC V6T 1Z1, Canada; bQuantum Matter Institute, University of BritishColumbia, Vancouver, BC V6T 1Z4, Canada; cDepartment of Chemistry, University of British Columbia, Vancouver, BC V6T 1Z1, Canada; and dMax PlanckInstitute for Solid State Research, 70569 Stuttgart, Germany
Edited by J. C. Séamus Davis, Cornell University, Ithaca, NY, and approved August 10, 2015 (received for review May 28, 2015)
Monolayer graphene exhibits many spectacular electronic properties,with superconductivity being arguably the most notable exception.It was theoretically proposed that superconductivity might be in-duced by enhancing the electron–phonon coupling through the dec-oration of graphene with an alkali adatom superlattice [Profeta G,Calandra M, Mauri F (2012) Nat Phys 8(2):131–134]. Althoughexperiments have shown an adatom-induced enhancement ofthe electron–phonon coupling, superconductivity has never been ob-served. Using angle-resolved photoemission spectroscopy (ARPES),we show that lithium deposited on graphene at low temperaturestrongly modifies the phonon density of states, leading to an en-hancement of the electron–phonon coupling of up to λ≃ 0.58. On partof the graphene-derived π*-band Fermi surface, we then observe theopening of a Δ≃ 0.9-meV temperature-dependent pairing gap. Thisresult suggests for the first time, to our knowledge, that Li-decoratedmonolayer graphene is indeed superconducting, with Tc ≃5.9 K.
graphene | superconductivity | ARPES
Although not observed in pure bulk graphite, superconduc-tivity occurs in certain graphite intercalated compounds
(GICs), with Tc values of up to 11.5 K in the case of CaC6 (1, 2).The origin of superconductivity in these materials has beenidentified in the enhancement of electron–phonon coupling in-duced by the intercalant layers (3, 4). The observation of asuperconducting gap on the graphitic πp-bands in bulk CaC6 (5)suggests that realizing superconductivity in monolayer graphenemight be a real possibility. This prospect has, indeed, attractedintense theoretical and experimental efforts (6–12). In particular,recent density functional theory calculations have suggestedthat, analogous to the case of intercalated bulk graphite, super-conductivity can be induced in monolayer graphene through theadsorption of certain alkali metals (8).Although the Li-based GIC—bulk LiC6—is not known to be
superconducting, Li-decorated graphene emerges as a particu-larly interesting case with a predicted superconducting Tc of upto 8.1 K (8). The proposed mechanism for this enhancement ofTc is the removal of the confining potential of the graphite C6layers, which changes both the occupancy of the Li 2s band (orthe ionization of the Li) and its position with respect to thegraphene layer. These modifications lead to an increase of theelectron–phonon coupling constant from λ= 0.33 to λ= 0.61, ingoing from bulk to monolayer LiC6. It has been argued that theLiC6 monolayer should exhibit the largest values of both λ and Tcamong all alkali–metal–C6 superlattices (8). Nevertheless, althoughthere is thorough experimental evidence for adatom-enhancedelectron–phonon coupling in graphene (7, 11, 13), superconduc-tivity has not yet been observed in decorated monolayer graphene.Angle-resolved photoemission spectroscopy (ARPES) mea-
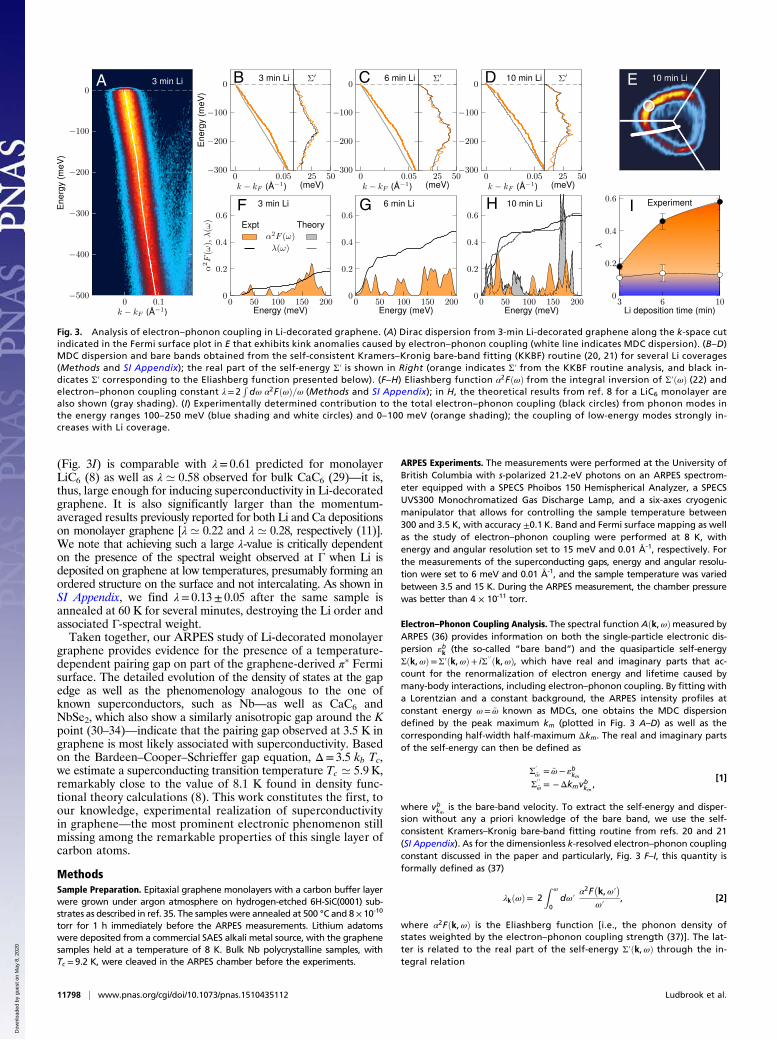
surements of the electronic dispersion of pristine and Li-decoratedgraphene at 8 K, characterized by the distinctive Dirac cones at thecorners of the hexagonal Brillouin zone (Fig. 1E), are shown in Fig.1 A and B. Li adatoms electron-dope the graphene sheet by chargetransfer doping, leading to a shift of the Dirac point to higher
binding energies. As evidenced by the evolution of the graphenesheet carrier density in Fig. 1F, this trend begins to saturate afterseveral minutes of Li deposition. Concomitantly, we observe theemergence of a new spectral weight (Fig. 1E) at the Brillouin zonecenter (the comparison of the Γ-point ARPES dispersion for pris-tine and 10-min Li-decorated graphene is shown in Fig. 1 C andD).The origin of this spectral weight is probably the Li-2s bandexpected for this system (8) superimposed with the folded gra-phene bands caused by a Li superstructure, which were observedin Li and Ca bulk GIC systems (5, 14). This spectral weight, whichdisappears above ∼ 50 K and is not recovered on subsequentcooling, is associated with the strong enhancement of electron–phonon coupling (discussed later, see Fig. 3 and SI Appendix).Next, we use high-resolution, low-temperature ARPES to search
for the opening of a temperature-dependent pairing gap along theπp-band Fermi surface as a direct spectroscopic signature of therealization of a superconducting state in monolayer LiC6. To in-crease our experimental sensitivity, as illustrated in Fig. 2A, usingthe approach introduced for FeAs (17) and cuprate (18) super-conductors, we perform an analysis of ARPES energy distributioncurves (EDCs) integrated in dk along a 1D momentum–space cutperpendicular to the Fermi surface. This method also provides theadded benefit that the integrated EDCs can be modeled in terms ofa simple Dynes gap function (19) multiplied by a linear backgroundand the Fermi–Dirac distribution, all convolved with a Gaussianresolution function (Methods and Eq. 4). As shown in Fig. 2A andespecially, Fig. 2B, for data from the k-space location indicated by
Significance
Although superconductivity is well-known in intercalated bulkgraphite, the ultimate goal of inducing superconductivity insingle-layer graphene has not yet been achieved. We have heredeveloped an experiment that combines ultralow-temperature(5 K) and ultrahigh-vacuum (10−11 torr) sample preparationwith high-resolution angle-resolved photoemission spectros-copy (ARPES). We show that decorating monolayer graphenewith a layer of lithium atoms enhances the electron–phononcoupling to the point where a superconducting state can bestabilized at low temperature. Measurements of the size of thesuperconducting gap by ARPES suggest a Tc of about 5.9 K. Thisresult constitutes the first observation, to our knowledge, ofsuperconductivity in monolayer graphene. Given the massive sci-entific and technological interest in graphene, our findings willhave significant cross-disciplinary impact.
Author contributions: B.M.L., C.R.A., and A.D. designed research; B.M.L., G.L., P.N., M.Z.,D.J.D., and S.Z. performed research; B.M.L., G.L., M.Z., M.S., C.N.V., S.Z., D.W., P.D., C.S.,A.S., S.F., C.R.A., and U.S. contributed new reagents/analytic tools; B.M.L., P.N., D.J.D., andS.Z. analyzed data; and B.M.L. and A.D. wrote the paper.
The authors declare no conflict of interest.
This article is a PNAS Direct Submission.1To whom correspondence should be addressed. Email: [email protected].
This article contains supporting information online at www.pnas.org/lookup/suppl/doi:10.1073/pnas.1510435112/-/DCSupplemental.
www.pnas.org/cgi/doi/10.1073/pnas.1510435112 PNAS | September 22, 2015 | vol. 112 | no. 38 | 11795–11799
PHYS
ICS
Dow
nloa
ded
by g
uest
on
May
8, 2
020

the white circles in Figs. 1E and 3E, a temperature dependencecharacteristic of the opening of a pairing gap can be observed nearEF. The leading-edge midpoints of the Li-graphene spectra moveaway from EF (Fig. 2B) in cooling from 15 to 3.5 K, which is atvariance with the case of Au spectra crossing precisely at EFaccording to the Fermi–Dirac distribution (Fig. 2D). Fitting thesedata with Eq. 4 returns a gap value of Δ= 0.9± 0.2 meV at 3.5 K(with Γ ’ 0.09 meV). [Note that the parameter Γ in the Dynesfitting function is not treated as a free-fitting parameter, because thebroadening of the coherence peaks and filling in of the gap aredominated by the experimental energy resolution. However, settingthis parameter to small realistic values (Γ∼ 0.1Δ) improves the fit atthe center of the gap (i.e., at E = 0 in the symmetrized data) withoutaffecting the value of the gap itself.] Given its small value comparedwith the experimental resolution, the gap opening is best visualizedin the symmetrized data in Fig. 2C, which minimize the effects ofthe Fermi function. Finally, we note that the gap appears to beanisotropic and is either absent or below our detection limit alongthe K −M direction (SI Appendix, Fig. S4).The detection of a temperature-dependent anisotropic gap at
the Fermi level with a leading-edge profile described by theDynes function—with its asymmetry about EF and associatedtransfer of spectral weight to just below the gap edge—is sug-gestive of a superconducting pairing gap. The phenomenologywould, in fact, be very different in the case of a Coulomb gap,which is typically observed in disordered semiconductors (23–25)because of the combination of disorder with long-range Coulombinteractions. A Coulomb gap would lead to a rigid shift of thespectra leading edge (isotropic in momentum) and result in avanishing of the momentum-integrated density of states at EF.Similarly, the observed gap is unlikely to have a charge densitywave origin, because the observed gap is tied to the Fermi energy
as opposed to a particular high-symmetry wavevector (the lattermight occur at the M points, when graphene is doped all of theway to the Van Hove singularity, resulting in a highly nestedhexagonal Fermi surface; or the K points, in the case of affiffiffi3
p ×
ffiffiffi3
p R 30° reconstruction, leading to a Dirac point gap).
Finally, we note that these measurements do not allow us tospeculate on the precise symmetry of the gap along a single Diraccone–Fermi surface or the relative phases of the gap on the sixdisconnected Fermi pockets. As such, our results do not rule outany of the recent proposals for a possible unconventional super-conducting order parameter in graphene (9, 26, 27).To further explore the nature of the gap observed on Li-
decorated graphene (and also show our ability to resolve a gap ofthe order of 1 meV), in Fig. 2 E and F, we show as a benchmarkcomparison the analogous results from a bulk polycrystallineniobium sample—a known conventional superconductor withTc ’ 9.2 K. The Dynes fit of the integrated EDCs Fermi edge inFig. 2E determines the gap to be Δ= 1.4± 0.2 meV (withΓ ’ 0.14meV), in excellent agreement with reported values (28).Although the leading-edge shift (Fig. 2E) and the dip in thesymmetrized spectra (Fig. 2F) are more pronounced than for Li-graphene owing to the larger gap, the behavior is qualitativelyvery similar. This similarity provides additional support to thesuperconducting origin of the temperature-dependent gap ob-served in Li-decorated graphene.If the spectroscopic gap observed in Li-graphene is, indeed, a
superconducting gap, the responsible mechanism may likely beelectron–phonon coupling, which was predicted by the theory formonolayer Li-graphene (8) and also, seen experimentally for thebulk GIC CaC6 (5). In direct support of this scenario, we presenta detailed analysis of the graphene πp-bands in Fig. 3, showingthat the Li-induced enhancement of the electron–phonon coupling
A B C E
FD
Fig. 1. Charge transfer doping of graphene by lithium adatoms. Dirac-cone dispersion measured by ARPES at 8 K (A) on pristine graphene and (B) after 3 min of Lievaporation along the K-point momentum cut indicated by the white line in the Fermi surface plot in E. The Dirac cone–Fermi surface was measured at this specificK point and then replicated at the other K points by symmetry (note that high-symmetry points are here defined for the Brillouin zone of pristine graphene andnot of
ffiffiffi3
p×
ffiffiffi3
pR30° reconstructed Li-graphene, which is, instead, the notation in ref. 8). The point at which the spectroscopic gap is studied is indicated by the
shaded white circle. The Dirac point, (A) already located below EF on pristine graphene because of the charge transfer from the SiC substrate, further shifts tohigher energies with (B) Li evaporation. The presence of a single well-defined Dirac cone indicates a macroscopically uniform Li-induced doping. (C) Although nobands are present at the Γ-point on pristine graphene, spectral weight is detected on 10-min Li-decorated graphene in D and E. As illustrated in the 8 K sheetcarrier density plot vs. Li deposition time in F, which accounts for the filling of the π* Fermi surface, the spectral weight at Γ is observed for charge densitiesn2D J 9× 1013 cm-2 (but completely disappears if the sample temperature is raised above ∼ 50 K and is not recovered on subsequent cooling) (SI Appendix).
11796 | www.pnas.org/cgi/doi/10.1073/pnas.1510435112 Ludbrook et al.
Dow
nloa
ded
by g
uest
on
May
8, 2
020

is, indeed, sufficient to stabilize a low-temperature superconductingstate. Graphene doped with alkali adatoms always shows a strongkink in the πp-band dispersion at a binding energy of about 160 meV(11). For the Li-graphene studied here, the same effect is seen in themomentum distribution curve (MDC) dispersions and the corre-sponding real part of the self-energy Σ′ in Fig. 3 B–D. This structurestems from the coupling to carbon in-plane (Cxy) phonons (4, 8).Despite the apparent strength of this kink, the interaction with thesephonon modes contributes little to the overall coupling parameterbecause of their high energy (note that ω is a weighting factor inthe integral calculation of λ) (Methods). As illustrated by the whitecircles in Fig. 3I, the contribution to λ from these high-energy(100–200 meV) modes is determined to be 0.14± 0.05, and it re-mains approximately constant for all Li coverages studied here.This value is, however, too small to stabilize a superconductingstate in this system (8, 11).With increasing Li coverage and the appearance of the spec-
tral weight at Γ, significant modifications to the low-energy partof the dispersion (K 100 meV) become apparent (Fig. 3 B–D).With 10 min of Li deposition (Fig. 3D), an additional kink isvisible at a binding energy of ∼30 meV along with the associ-ated peak in the real part of the self-energy Σ′. The extracted(Methods) Eliashberg functions and energy-resolved λðωÞ in Fig.
3 F–H show that, at high Li coverage, phonon modes at energiesbelow 60 meV are coupling strongly to the graphene electronicexcitations. The phonon modes in this energy range are of Li in-plane (Lixy) and C out-of-plane (Cz) character (4, 8). This as-signment is in agreement with predictions (8) as shown by thedirect comparison between theory and experiment in Fig. 3H.[As for the theoretical and experimental Eliashberg functionsα2Fðk,ωÞ in Fig. 3H, the agreement may, at first glance, appearnot as good as the one for λðωÞ. We note, however, that, in thisregard, the relevant information is in the macroscopic energydistribution of the α2Fðk,ωÞ weight rather than in its detailedstructure.] As for the total electron–phonon coupling λ for eachcoverage (black circles in Fig. 3I), our values measured on theπp-band Fermi surface at an intermediate location between Γ−Kand K −M directions (Fig. 3E) provide an effective estimate forthe momentum-averaged coupling strength. [The electron–phononcoupling parameter increases monotonically along the πp-bandFermi surface in going from the Γ−K to the K −M direction asobserved in both decorated graphene (11) and intercalatedgraphite (29). Empirically, the value measured at the interme-diate Fermi crossing corresponds to the momentum-averagedcoupling strength along the πp-band Fermi surface.] Remarkably,the value λ= 0.58± 0.05 observed at the highest Li coverage
A B C
D E F
Fig. 2. Spectroscopic observation of a pairing gap in Li-decorated graphene. (A) Dirac dispersion from 10-min Li-decorated graphene measured at 15 and3.5 K at the k-space location indicated by the white circles in Figs. 1E and 3E; the temperature dependence is here evaluated for EDCs integrated in the 0.1-Å-1
momentum region about kF shown by the white box in Lower, with (Upper) the only changes occurring near EF. (D) Although Au spectra cross at Ef asdescribed by the Fermi–Dirac distribution, (B) the crossing points of the Li-graphene spectra are shifted away from EF (cyan dashed line) because of the pullback of the leading edge at 3.5 K. A fit to the Dynes gap equation (Methods) yields a gap of Δ ’ 0.9 meV at 3.5 K (and 0 meV at 15 K). The superconductinggap opening is best visualized in the symmetrized data in C [i.e., by taking IðωÞ+ Ið−ωÞ, which minimizes the effects of the Fermi function, even in the case offinite energy and momentum resolutions (15, 16); blue and red symbols in C represent the smoothed data, whereas the light shading gives the rmsds of theraw data]. The qualitatively similar behavior observed on polycrystalline niobium—and returning a superconducting gap Δ ’ 1.4 meV—is shown in E and F.
Ludbrook et al. PNAS | September 22, 2015 | vol. 112 | no. 38 | 11797
PHYS
ICS
Dow
nloa
ded
by g
uest
on
May
8, 2
020
(Fig. 3I) is comparable with λ= 0.61 predicted for monolayerLiC6 (8) as well as λ ’ 0.58 observed for bulk CaC6 (29)—it is,thus, large enough for inducing superconductivity in Li-decoratedgraphene. It is also significantly larger than the momentum-averaged results previously reported for both Li and Ca depositionson monolayer graphene [λ ’ 0.22 and λ ’ 0.28, respectively (11)].We note that achieving such a large λ-value is critically dependenton the presence of the spectral weight observed at Γ when Li isdeposited on graphene at low temperatures, presumably forming anordered structure on the surface and not intercalating. As shown inSI Appendix, we find λ= 0.13± 0.05 after the same sample isannealed at 60 K for several minutes, destroying the Li order andassociated Γ-spectral weight.Taken together, our ARPES study of Li-decorated monolayer
graphene provides evidence for the presence of a temperature-dependent pairing gap on part of the graphene-derived πp Fermisurface. The detailed evolution of the density of states at the gapedge as well as the phenomenology analogous to the one ofknown superconductors, such as Nb—as well as CaC6 andNbSe2, which also show a similarly anisotropic gap around the Kpoint (30–34)—indicate that the pairing gap observed at 3.5 K ingraphene is most likely associated with superconductivity. Basedon the Bardeen–Cooper–Schrieffer gap equation, Δ= 3.5 kb Tc,we estimate a superconducting transition temperature Tc ’ 5.9 K,remarkably close to the value of 8.1 K found in density func-tional theory calculations (8). This work constitutes the first, toour knowledge, experimental realization of superconductivityin graphene—the most prominent electronic phenomenon stillmissing among the remarkable properties of this single layer ofcarbon atoms.
MethodsSample Preparation. Epitaxial graphene monolayers with a carbon buffer layerwere grown under argon atmosphere on hydrogen-etched 6H-SiC(0001) sub-strates as described in ref. 35. The samples were annealed at 500 °C and 8 × 10⁻¹⁰
torr for 1 h immediately before the ARPES measurements. Lithium adatomswere deposited from a commercial SAES alkali metal source, with the graphenesamples held at a temperature of 8 K. Bulk Nb polycrystalline samples, withTc = 9.2 K, were cleaved in the ARPES chamber before the experiments.
ARPES Experiments. The measurements were performed at the University ofBritish Columbia with s-polarized 21.2-eV photons on an ARPES spectrom-eter equipped with a SPECS Phoibos 150 Hemispherical Analyzer, a SPECSUVS300 Monochromatized Gas Discharge Lamp, and a six-axes cryogenicmanipulator that allows for controlling the sample temperature between300 and 3.5 K, with accuracy ±0.1 K. Band and Fermi surface mapping as wellas the study of electron–phonon coupling were performed at 8 K, withenergy and angular resolution set to 15 meV and 0.01 Å-1, respectively. Forthe measurements of the superconducting gaps, energy and angular resolu-tion were set to 6 meV and 0.01 Å-1, and the sample temperature was variedbetween 3.5 and 15 K. During the ARPES measurement, the chamber pressurewas better than 4 × 10-11 torr.
Electron–Phonon Coupling Analysis. The spectral function Aðk,ωÞmeasured byARPES (36) provides information on both the single-particle electronic dis-persion «bk (the so-called “bare band”) and the quasiparticle self-energyΣðk,ωÞ=Σ′ðk,ωÞ+ iΣ′′ðk,ωÞ, which have real and imaginary parts that ac-count for the renormalization of electron energy and lifetime caused bymany-body interactions, including electron–phonon coupling. By fitting witha Lorentzian and a constant background, the ARPES intensity profiles atconstant energy ω= ~ω known as MDCs, one obtains the MDC dispersiondefined by the peak maximum km (plotted in Fig. 3 A–D) as well as thecorresponding half-width half-maximum Δkm. The real and imaginary partsof the self-energy can then be defined as
Σ′~ω = ~ω− «bkm
Σ′′~ω = −Δkmvbkm ,
[1]
where vbkm is the bare-band velocity. To extract the self-energy and disper-sion without any a priori knowledge of the bare band, we use the self-consistent Kramers–Kronig bare-band fitting routine from refs. 20 and 21(SI Appendix). As for the dimensionless k-resolved electron–phonon couplingconstant discussed in the paper and particularly, Fig. 3 F–I, this quantity isformally defined as (37)
λkðωÞ= 2Z ω
0dω′
α2F�k,ω′
�ω′
, [2]
where α2Fðk,ωÞ is the Eliashberg function [i.e., the phonon density ofstates weighted by the electron–phonon coupling strength (37)]. The lat-ter is related to the real part of the self-energy Σ′ðk,ωÞ through the in-tegral relation
A B C D E
F G H I
Fig. 3. Analysis of electron–phonon coupling in Li-decorated graphene. (A) Dirac dispersion from 3-min Li-decorated graphene along the k-space cutindicated in the Fermi surface plot in E that exhibits kink anomalies caused by electron–phonon coupling (white line indicates MDC dispersion). (B–D)MDC dispersion and bare bands obtained from the self-consistent Kramers–Kronig bare-band fitting (KKBF) routine (20, 21) for several Li coverages(Methods and SI Appendix); the real part of the self-energy Σ′ is shown in Right (orange indicates Σ′ from the KKBF routine analysis, and black in-dicates Σ′ corresponding to the Eliashberg function presented below). (F–H) Eliashberg function α2FðωÞ from the integral inversion of Σ′ðωÞ (22) andelectron–phonon coupling constant λ= 2
Rdω α2FðωÞ=ω (Methods and SI Appendix); in H, the theoretical results from ref. 8 for a LiC6 monolayer are
also shown (gray shading). (I) Experimentally determined contribution to the total electron–phonon coupling (black circles) from phonon modes inthe energy ranges 100–250 meV (blue shading and white circles) and 0–100 meV (orange shading); the coupling of low-energy modes strongly in-creases with Li coverage.
11798 | www.pnas.org/cgi/doi/10.1073/pnas.1510435112 Ludbrook et al.
Dow
nloa
ded
by g
uest
on
May
8, 2
020

Σ′ðk,ωÞ=Z ∞
0dω′α2F
�k,ω′
� K
�ω
kT,ω′kT
� , [3]
where Kðy, y′Þ= R+∞−∞ dx fðx − yÞ 2y′=ðx2 − y ′ 2Þ and fðx − yÞ is the Fermi–Dirac
distribution. The momentum resolved α2Fðk,ωÞ function plotted in Fig. 3 F–Hcan then be extracted from the real part of the self-energy Σ′ðk,ωÞ probedby ARPES by the integral inversion procedure described in ref. 22. Ultimately,by means of Eq. 2, this approach also allows the calculation of the electron–phonon coupling constant shown in Fig. 3 (SI Appendix).
Superconducting Gap Fitting. As discussed in detail for the cases of FeAs andcuprate superconductors in refs. 17 and 18, respectively, when evaluating theopening of a superconducting gap based on the EDCs integrated in dk alonga 1D momentum–space cut perpendicular to the Fermi surface (such as thosepresented in Fig. 2), one can make use of the following formula:
IR dkðωÞ=
264fðω, TÞ ða+b ωÞ
�����Reω− iΓffiffiffiffiffiffiffiffiffiffiffiffiffiffiffiffiffiffiffiffiffiffiffiffiffiffiffiffiffi
ðω− iΓÞ2 −Δ2q
����� 375⊗Rω . [4]
This equation corresponds to the Dynes gap function [i.e., the Bardeen–Cooper–Schrieffer density of states with a superconducting gap Δ broad-ened by the pair-breaking scattering rate Γ (19)] multiplied by a linearbackground (with parameters a and b) and the Fermi–Dirac distribution
fðω, TÞ all convolved with a Gaussian function Rω accounting for the ex-perimental energy resolution [owing to the integration of the ARPES in-tensity in dk, this analysis is unaffected by momentum resolution (17)]. Thehigh- and low-temperature ARPES data in Fig. 2 are fitted simultaneouslyusing the above equation according to the following additional consider-ations. Because the integrated EDCs were observed not to change outsideof the gap region, the linear background is constrained to be the same forthe above and below Tc measurements. The temperatures are fixed to theknown measured values (with accuracy ±0.1 K). The Fermi energy EF andenergy resolution are determined from fitting the high-temperature datafrom either Nb or Li-graphene during each measurement and independentlyverified from measurements on polycrystalline gold.
ACKNOWLEDGMENTS. We thank D. A. Bonn, S. A. Burke, M. Calandra,A. Chubukov, E. H. da Silva Neto, J. A. Folk, M. Franz, P. Hofmann, A. F. Morpurgo,G. Profeta, G. A. Sawatzky, and S. Ulstrup for valuable discussions andP. Trochtchanovitch and M. O’Keane for technical assistance. This work wassupported by the Max Planck–UBC Centre for Quantum Materials; the Postdoc-toral Fellowship Program (S.Z.) of the Natural Sciences and Engineering Re-search Council of Canada (NSERC); the Killam, Alfred P. Sloan, Alexander vonHumboldt, and NSERC’s Steacie Memorial Fellowship Programs (A.D.); the Can-ada Research Chairs Program (A.D.); NSERC; the Canada Foundation for Inno-vation (CFI); the Quantum Materials Program of the Canadian Institute forAdvanced Research (CIFAR); and by the Deutsche Forschungsgemeinschaft(DFG) in the framework of the Priority Program SPP 1459, Graphene (A.S.and U.S.).
1. Emery N, et al. (2005) Superconductivity of bulk CaC6. Phys Rev Lett 95(8):087003.2. Weller TE, Ellerby M, Saxena SS, Smith RP, Skipper NT (2005) Superconductivity in the
intercalated graphite compounds C6Yb and C6Ca. Nat Phys 1(1):39–41.3. Mazin II (2005) Intercalant-driven superconductivity in YbC6 and CaC6. Phys Rev Lett
95(22):227001.4. Calandra M, Mauri F (2005) Theoretical explanation of superconductivity in C6Ca.
Phys Rev Lett 95(23):237002.5. Yang S-L, et al. (2014) Superconducting graphene sheets in CaC6 enabled by phonon-
mediated interband interactions. Nat Commun 5:3493.6. Uchoa B, Castro Neto AH (2007) Superconducting states of pure and doped graphene.
Phys Rev Lett 98(14):146801.7. McChesney JL, et al. (2010) Extended van Hove singularity and superconducting in-
stability in doped graphene. Phys Rev Lett 104(13):136803.8. Profeta G, Calandra M, Mauri F (2012) Phonon-mediated superconductivity in gra-
phene by lithium deposition. Nat Phys 8(2):131–134.9. Nandkishore R, Levitov LS, Chubukov AV (2012) Chiral superconductivity from re-
pulsive interactions in doped graphene. Nat Phys 8(2):158–163.10. Guzman D, Alyahyaei H, Jishi R (2013) Superconductivity in graphene-lithium. arXiv:
1310.3813v1.11. Fedorov AV, et al. (2014) Observation of a universal donor-dependent vibrational
mode in graphene. Nat Commun 5:3257.12. Margine ER, Giustino F (2014) Two-gap superconductivity in heavily n-doped gra-
phene: Ab initio Migdal-Eliashberg theory. Phys Rev B Condens Matter Mater Phys90(1):014518.
13. Bianchi M, et al. (2010) Electron-phonon coupling in potassium-doped graphene:Angle-resolved photoemission spectroscopy. Phys Rev B Condens Matter Mater Phys81(4):041403.
14. Sugawara K, Sato T, Takahashi T (2008) Fermi-surface-dependent superconductinggap in C6Ca. Nat Phys 5(1):40–43.
15. Norman M, et al. (1998) Destruction of the Fermi surface in underdoped high-Tc su-perconductors. Nature 392(6672):157–160.
16. Mesot J, et al. (2001) Determination of the Fermi surface in high-Tc superconductorsby angle-resolved photoemission spectroscopy. Phys Rev B Condens Matter MaterPhys 63(22):224516.
17. Evtushinsky DV, et al. (2009) Momentum dependence of the superconducting gap inBa1-x KxFe2 As2. Phys Rev B Condens Matter Mater Phys 79(5):054517.
18. Reber TJ, et al. (2012) The origin and non-quasiparticle nature of Fermi arcs in Bi2 Sr2CaCu2 O8+δ. Nat Phys 8(8):606–610.
19. Dynes R, Narayanamurti V, Garno J (1978) Direct measurement of quasiparticle-lifetime broadening in a strong-coupled superconductor. Phys Rev Lett 41(21):1509–1512.
20. Veenstra CN, Goodvin G, Berciu M, Damascelli A (2010) Elusive electron-phononcoupling in quantitative analyses of the spectral function. Phys Rev B Condens MatterMater Phys 82(1):012504.
21. Veenstra CN, Goodvin G, Berciu M, Damascelli A (2011) Spectral function tour ofelectron-phonon coupling outside the Migdal limit. Phys Rev B Condens Matter MaterPhys 84(8):085126.
22. Shi J, et al. (2004) Direct extraction of the Eliashberg function for electron-phononcoupling: A case study of Be(1010). Phys Rev Lett 92(18):186401.
23. Efros A, Shklovskii B (1975) Coulomb gap and low temperature conductivity of dis-ordered systems. J Phys Chem 8:L49.
24. Davies JH, Franz JR (1986) Coulomb gap in sodium tungsten bronzes. Phys Rev Lett57(4):475–478.
25. Massey JG, Lee M (1995) Direct observation of the coulomb correlation gap in anonmetallic semiconductor, Si:B. Phys Rev Lett 75(23):4266–4269.
26. Raghu S, Kivelson SA, Scalapino DJ (2010) Superconductivity in the repulsive Hubbardmodel: An asymptotically exact weak-coupling solution. Phys Rev B Condens MatterMater Phys 81(22):224505.
27. Nandkishore R, Thomale R, Chubukov AV (2014) Superconductivity from weak re-pulsion in hexagonal lattice systems. Phys Rev B Condens Matter Mater Phys 89(14):144501.
28. Carbotte JP (1990) Properties of boson-exchange superconductors. Rev Mod Phys62(4):1027–1157.
29. Valla T, et al. (2009) Anisotropic electron-phonon coupling and dynamical nesting onthe graphene sheets in superconducting CaC6 using angle-resolved photoemissionspectroscopy. Phys Rev Lett 102(10):107007.
30. Sanna A, et al. (2007) Anisotropic gap of superconducting CaC6: A first-principlesdensity functional calculation. Phys Rev B Condens Matter Mater 75(2):020511.
31. Sanna A, et al. (2012) Phononic self-energy effects and superconductivity in CaC6.Phys Rev B Condens Matter Mater Phys 85(18):184514.
32. Gonnelli RS, et al. (2008) Evidence for gap anisotropy in CaC6 from directional point-contact spectroscopy. Phys Rev Lett 100(20):207004.
33. Kiss T, et al. (2007) Charge-order-maximized momentum-dependent superconduc-tivity. Nat Phys 3(10):720.
34. Borisenko SV, et al. (2009) Two energy gaps and Fermi-surface “arcs” in NbSe2. PhysRev Lett 102(16):166402.
35. Forti S, Starke U (2014) Epitaxial graphene on SiC: From carrier density engineering toquasi-free standing graphene by atomic intercalation. J Phys D Appl Phys 47(9):094013.
36. Damascelli A (2004) Probing the electronic structure of complex systems by ARPES.Phys Scr T 109:61–74.
37. Grimvall G (1981) The Electron-Phonon Interaction in Metals, ed Wohlfart E (North-Holland, New York).
Ludbrook et al. PNAS | September 22, 2015 | vol. 112 | no. 38 | 11799
PHYS
ICS
Dow
nloa
ded
by g
uest
on
May
8, 2
020