Evidence for Germany - DIW · Kurt Geppert* Martin Gornig* Axel Werwatz* Economic Growth of...
24
Kurt Geppert Martin Gornig Axel Werwatz Economic Growth of Agglomerations and Geographic Concentration of Industries Evidence for Germany Discussion Papers Berlin, September 2005
Transcript of Evidence for Germany - DIW · Kurt Geppert* Martin Gornig* Axel Werwatz* Economic Growth of...

Kurt Geppert Martin Gornig Axel Werwatz
Economic Growth of Agglomerations and Geographic Concentration of Industries
Evidence for Germany
Discussion Papers
Berlin, September 2005

IMPRESSUM
© DIW Berlin, 2005
DIW Berlin Deutsches Institut für Wirtschaftsforschung Königin-Luise-Str. 5 14195 Berlin Tel. +49 (30) 897 89-0 Fax +49 (30) 897 89-200 www.diw.de
ISSN print edition 1433-0210 ISSN electronic edition 1619-4535
All rights reserved. Reproduction and distribution in any form, also in parts, requires the express written permission of DIW Berlin.
.

Discussion Papers 513 Kurt Geppert* Martin Gornig* Axel Werwatz* Economic Growth of Agglomerations and Geographic Concentration of Industries - Evidence for Germany Berlin, September 2005 * DIW Berlin, Department Innovation, Manufacturing, Service, [email protected];


Discussion Papers 513 Inhaltsverzeichnis
I
Inhaltsverzeichnis
1 The Question ........................................................................................................................ 3
2 Theoretical Background ..................................................................................................... 5
3 Empirical Approach............................................................................................................ 7
4 Classification of Regions and Sectors .............................................................................. 10
5 Estimates .......................................................................................................................... 14
6 Conclusions ........................................................................................................................ 18
7 References .......................................................................................................................... 19

Discussion Papers 513 Verzeichnis der Tabellen und Abbildungen
II
Verzeichnis der Tabellen
Table 1 Regions with above-average initial level and above-average growth of productivity .......................................................................................................... 11
Table 2 Sectors with increasing geographical concentration and above-average employment growth .............................................................................................. 13
Table 3 Results of the logit estimate ................................................................................. 14
Verzeichnis der Abbildungen
Figure 1 Regional distribution of productivity in West Germany ........................................ 4 Figure 2 Logit and non-parametric estimates of the conditional probability of a
region being atypical 1980-2000........................................................................... 15 Figure 3 Logit and non-parametric estimates of the conditional probability of a
region being atypical 1990-2000........................................................................... 16

1 The Question
This paper takes up a phenomenon in European geographical development: the simultaneity
of regional economic convergence on the one hand and the continued spatial concentration of
economic activities on the other. Overall, the disparities in productivity and income between
regions in the European Union have diminished considerably in the last two decades. The
poorest regions have caught up to a certain extent, while many of the relatively rich regions
have grown at only below-average rates. However, a small group of particularly high-
performing areas has developed contrary to this convergence trend and is moving further
away from the rest (CHESIRE and MAGRINI, 2000).
The picture is similar in West Germany. The regional density functions shown in Figure 1 for
gross domestic product (GDP) per person employed show the two opposing processes. The
number of lagging regions fell considerably between 1980 and 2000, and above the average
the density also decreased.1 Altogether the distribution is much more concentrated around the
middle than at the start of the period under review, in other words regional productivities have
converged. But at the same time the extension of the upper tail of the density function
indicates that there is also a contrary movement: agglomeration.
This latter tendency is examined in more detail in this paper. Unlike for Europe as a whole
disaggregated information is available on the economic structure of Germany. On that basis
we analyse the connection between the sectoral composition of regions, changes in the spatial
concentration of sectors and the development in regional productivity. Or to put it differently:
We examine whether the fact that a number of high-productivity regions have improved their
positions even further can also be attributed to the greater spatial concentration of economic
sectors. However, focussing on the sectoral perspective certainly does not mean that other
factors are unimportant in explaining differences in productivity growth. Recent studies on the
spatial structure of employment, for instance, have shown that the functional division of
labour between regions has continued to develop in favour of urban centres (DURANTON
and PUGA, 2004; BADE et al., 2004).
In the following Sections the theoretical background is sketched out (Section 2), and the
method and data bases are explained (Section 3). Section 4 lays the basis for our estimations.
Regions are classified according to the level and development of productivity, and sectors are
1 See further information on the data base in Section 4.

Discussion Papers 513 The Question
4
grouped according to the level and development of geographical concentration. Section 5
presents estimation results from a logit model and a bivariate non-parametric regression
approach, while Section 6 draws some conclusions.
Figure 1 Regional distribution of productivity in West Germany
0
.5
1
1.5
2
2.5
3
Den
sity
.8 1 1.2 1.4
Gaussian kernel with margin according to smoothed cross validation.
GDP per employee 1980GDP per employee 1990GDP per employee 2000
GDP per employee – West Germany = 1

2 Theoretical Background
The contrasting spatial developments can be explained theoretically in very different ways.
The neo-classical growth model, which is based on perfect competition and diminishing
returns to capital predicts convergence of all regions towards a unique growth path
determined by general technical progress (SOLOW, 1956 and 1957). In this model regional
differences in the level of productivity can only persist if regions differ in important
conditions or behaviours. The latter applies particularly to modified versions of the model that
explicitly take into account the endowment with human capital and institutional factors
(SALA-I-MARTIN, 1990 and 1996; MANKIW et al., 1992). But lasting regional differences
in productivity growth would only be possible if regions constantly diverged in these
fundamental conditions, too.
In more recent theories of endogenous growth that explicitly consider the process of
knowledge formation (ROMER, 1990; AGION and HOWITT, 1992), innovation and growth
depend on the input of labour in the production of knowledge and on the stock of knowledge
already available. Assuming that new knowledge does not spread freely across regions -
unlike the assumption in the traditional neo-classical model - areas with a relatively large
number of researchers will show relatively high growth in productivity and per capita income.
They are not only rich, but also grow faster than regions with a smaller research potential.
According to these approaches regional disparities can also evolve to the extent that backward
regions differ in their ability to imitate technical know-how and so reduce the gap to the
leading regions.
The explanation of the geographical distribution of economic activities made considerable
progress with the New Economic Geography established by KRUGMAN (1991) - at least
theoretically (FUJITA et al., 1999). In this theory economies of scale and distance-related
transaction costs are major factors. Access to markets and (sector-specific) inputs are the
decisive criteria in companies’ choice of location. Location decisions by individual firms add
up to cumulative processes of geographical concentration and specialisation. These, however,
do not only lead to increasing market potentials, the costs of immobile factors also rise
(PUGA, 1999). If transaction costs fall below a certain level (e.g. as obstacles to trade are
removed or the infrastructure is improved), the disadvantages of agglomeration in causing
higher production costs will be greater than its advantages in distribution costs. Firms react to
this by shifting plants to less dense areas.

Discussion Papers 513 Theoretical Background
6
While the New Economic Geography concentrates on externalities that are transmitted via
markets (input, output and labour markets), it is non-market interactions that predominate in
other agglomeration theories; such effects also play a central role in the theories of
endogenous growth. These localised spillovers of human capital and technical-organisational
knowledge can result from urban size and variety (urbanisation effects) or from sector-
specific interactions (localisation effects) (MARSHALL, 1925; LUCAS, 1988;
HENDERSON, 1988; FUJITA and THISSE, 2004). Here, the reasons for spatial
concentration are rather different from those in the New Economic Geography, but the side-
effects, i.e. congestion costs, are the same.
All the theoretical approaches outlined here can explain regional disparities in productivity
and income, and, except for the traditional neo-classical growth model, they can account both
for the rise and the fall of these disparities. The outcome depends on the specific assumptions
made concerning the relative power of centripetal and centrifugal forces, and to the degree
that these forces differ in strength between industries sectoral specialisation of regions are
likely to emerge. According to the New Economic Geography scale intensive and/or
transactions cost intensive industries will tend to concentrate spatially. And according to
agglomeration and growth theories that are based on technological externalities knowledge-
intensive activities that benefit greatly from local spillovers will tend to locate in densely
populated – and possibly specialised - areas, while standardised production processes and
routine operations will be shifted to less expensive areas.
In empirical research, agglomeration effects are generally shown to play a key role for
regional income levels. Estimates of the elasticity of productivity and wages in relation to
density of employment in a region show differences ranging from 20% to 50% between
densely and sparsely populated regions (CICCONE, 2002; ROSENTHAL and STRANGE,
2005). However, it is a matter of dispute what weight should be attached to effects of sectoral
specialisation (localisation) compared to urbanisation advantages (PORTER, 1990;
GLAESER et al., 1992; CAPELLO, 2001; BODE, 2002). Using West Germany as an
example, the present paper examines whether sectoral growth and concentration processes are
making a major contribution to regional income differentiation, and especially to spatial
agglomeration.

3 Empirical Approach
Does the probability that a region exhibits an above-average growth of GDP per employee
depend on the importance of sectors in that region that are both continuing to concentrate
geographically and increasing their employment? To answer this question, our empirical
analysis proceeds in two steps:
1. We first classify regions and sectors according to the development of their
productivity and geographical concentration, respectively.
2. We then estimate the relationship between the probability of a region exhibiting a non-
converging development of productivity and its share of employment in sectors with
increasing geographical concentration.
While the details of steps 1 and 2 are described in sections 4 and 5 below, the purpose of this
section is to give an overview of our empirical strategy.
We classify regions as showing an atypical, i.e. non-converging development of productivity,
if they have started from a high initial level of productivity and have further improved their
relative position. That is, they must show both an above-average development in productivity
during the period under study and an above-average initial level in the corresponding base
year.
Atypical regional development is thus converted into the following discrete dependent
variable:
If a region shows above-average productivity in the base period 1
and above-average development in productivity
0 otherwise
=
Y
Classifying sectors according to the development of their geographical concentration is not as
clear cut. There is a broad discussion in the literature regarding appropriate ways to measure
the geographical distribution of economic activities (e.g. OVERMAN, REDDING and
VENABLES, 2001). Accounting for the differences in specialisation between regions as
comprehensively as possible is often cited as the main challenge.
However, the focus of our examination is not the specialisation of regions but the
geographical concentration of sectors. To measure the latter, we use the Herfindahl Index as a
simple yet robust indicator. Sectors continuing to concentrate geographically are identified in

Discussion Papers 513 Empirical Approach
8
a straightforward way by examining their level of geographical concentration in the starting
year and its subsequent development in the relevant observation period. A region's share of
employment in atypical sectors, i.e. industries with increasing geographical concentration and
above-average employment growth in the period considered, serves as the explanatory
variable X.
To actually compute the values of Y and X for each region we need data on aggregate regional
productivity (regional GDP per employee) and on the distribution of sectoral activity across
regions. As is evident from both our research question and the definitions of Y and X we are
aiming at a long-term comparison of regions using West Germany as a reference. However,
an uninterrupted series of GDP per employee for the entire period (1980 to 2000) is not
available. The data from the old European System of National Accounts (ESNA79) covers the
period 1980 to 1996, while data according to the new system ESNA95 is available for the
years from 1991. We interlink these two time periods by using conversion factors for the
years 1991 and 1992. In our empirical work we focused on the years 1980, 1990 and 2000,
with the interim years 1985 and 1995 used for robustness checks.
Differentiated information on the regional distribution of production by individual economic
sectors is not routinely published in Germany. However, such information is available for the
input factor labour, which we use here as an approximation for the regional distribution of
sectoral production. Differentiated information on the sectoral structure can be obtained from
the statistics on employees paying statutory social insurance contributions. To obtain a long
series that matches the GDP data we use the pre-1993 sectoral classification of the Federal
Employment Agency.2 Our geographical units of observation are the planning regions defined
by the Federal Building Office.3
To model the relationship between the probability of a region being atypical (Y=1) and its
share of employment in atypical sectors (X) we initially employ the logit model defined as:
0 1
1( 1| )1 exp[ ( )]β β
= =+ − +
P Y XX
2 That system of classifying sectors has been replaced by the 1993/2003 systems. This does not result in any real disadvantages for our study, but it should be noted that the information technology sector is not treated as a separate entity in the old classification but is subsumed in engineering. The classification used here comprises 83 economic sectors. 3 The delimitation of these “Raumordnungsregionen” mainly follows commuting patterns and socio-economic linkages although the Federal State boundaries are observed. In the case of the city states this yields units that are hardly meaningful economically, and for that reason the planning regions that directly adjoin Hamburg and Bremen are grouped into one unit with the core city. Altogether this enables an analysis of 71 West German regions that remained unchanged from 1980 to 2000.

Discussion Papers 513 Empirical Approach
9
The logit model is easily estimated and interpreted and offers a first assessment of the
influence of the share in regional employment of atypical sectors on the probability of a
region showing an atypical trend in productivity. However, this advantage comes at the
expense of its relatively restrictive functional form it imposes on the relation between the
probability that a region will show an atypical growth of aggregate productivity and its share
of employment in atypical sectors. Hence, in a second step we non-parametrically modelled
the influence of a region's share of employment in atypical sectors on its probability of
exhibiting an atypical development in productivity.
The non-parametric regression model ( 1| ) ( )= =P Y X m X does not fix the form of the
regression function m(X) a priori. It merely assumes that ( 1| )=P Y X does not abruptly
change as a result of small changes in X, that is, that the function m(X) is assumed not to have
any jumps. The kernel method uses this property to form an estimate of m(X) at a particular
value X=x by averaging over the values of Y of those observations whose values of X are
within a narrow interval around X=x (HÄRDLE et al., 2004). The width of this interval has to
be chosen to determine how “local” the average is to be. In this paper an optimal data-driven
window width is chosen by employing a cross-validation criterion.
It is well known that estimates of a non-parametric regression are inflicted by the “curse of
dimensionality”, that is, they can be very imprecise if the number of explanatory variables is
large because the observations tend to spread “all over the place” in multidimensional space
with few observations left for forming local averages. Moreover, estimates of multivariate
nonparametric regressions can be hard to interpret and communicate as they may neither yield
a parametric formula (by definition) nor a graph (if there are more than two explanatory
variables). Neither is the case, however, in this paper as only one explanatory variable is
being considered.

4 Classification of Regions and Sectors
We identify atypical regions as those that, starting from a high level of performance in 1980
and 1990, respectively, even increased their relative productivities. The development between
1990 and 2000 is of particular interest, because it was in this sub-period that a number of
regions outgrew the productivity distribution, as described in Section 1. But to underpin the
results we also looked at the entire period from 1980 to 2000.
Table 1 shows the regions that exhibited both above-average productivity growth and an
above-average initial level in the respective base year. From 1980 to 2000, 11 of the 71
adjusted planning regions fulfilled both of these criteria, and 9 out of the 71 did so for the
years 1990 to 2000. In both periods, it was particularly the big agglomerations like Munich,
Rhine-Main and Hamburg that were able to move away from the general regional
convergence process in productivity. But the industrial region of Nuremberg, and the planning
regions of Starkenburg and South West Schleswig-Holstein, both in the vicinity of
agglomerations, also met the criteria in both periods. Then there are regions that had above-
average development in productivity and an above-average initial level in only one of the two
periods. Starting from a high level of productivity in 1980 the regions of Ingolstadt, Stuttgart
and Braunschweig – all well known for their strength in automotive production - increased
their performance even more in the 1980s, but not in the 1990s. In the 1990 to 2000 period
Düsseldorf and two less densely populated areas in Baden-Württemberg also fulfilled both
criteria.
Regarding sectoral classification, we seek to identify those industries that are increasing their
geographical concentration. Since disaggregated data on the regional distribution of output is
not available, the shares of employees paying statutory social insurance contributions are used
as proxies for the output shares. Atypical sectors are identified as industries that have both
increased their geographical concentration and shown an above-average employment growth.
The latter restriction is introduced because only if sectors also have grown can they contribute
to the explanation of the particular success of certain regions. When the additional criterion of
employment growth was applied chemical fibres, clothing, tobacco processing and railways
ceased to classify as atypical industries. The remaining sectors are listed in Table 2.

Discussion Papers 513 Classification of Regions and Sectors
11
Table 1 Regions with above-average initial level and above-average growth of productivity
GDP per employee
West Germany = 100 Change in index value
1980 1980 - 2000
Munich 119,0 19,4
Rhine-Main 113,3 17,5
Hamburg region 105,7 14,7
Starkenburg 106,3 10,6
Middle Upper Rhine 105,6 5,6
Central Franconia industrial region 106,1 4,9
Ingolstadt 103,8 3,8
South West Schleswig-Holstein 109,3 2,3
Stuttgart 114,8 2,1
Franconia 104,4 1,8
Braunschweig 106,4 1,3
1990 1990 - 2000
Munich 118,0 20,4
Starkenburg 101,6 15,3
Hamburg region 110,9 9,5
Central Franconia industrial region 104,7 6,3
Danube-Iler (Baden-Württemberg) 100,1 4,9
South West Schleswig-Holstein 108,1 3,5
Rhine Main 127,9 2,9
Lake Constance - Upper Swabia 101,4 0,2
Düsseldorf 117,8 0,2
Total number of regions: 71.
Sources: Employment statistics of the Federal Employment Agency and own calculations.

Discussion Papers 513 Classification of Regions and Sectors
12
Of the 83 sectors observed, 7 met the two criteria in the period from 1980 to 2000, and 10 did
so in the period from 1990 to 2000.4 Traded services are particularly prominent among the
industries that continued to concentrate geographically, and their employment has increased
significantly. In both sub-periods the film industry, business consultancy, engineering, legal
consultancy, arts/theatre and banking showed the necessary values to meet the two criteria.
But some services sectors that are more local in orientation also show atypical development
tendencies in their location patterns. Especially in the 1990s there was further geographical
concentration in security/courier services, cleaning of buildings, and real estate. At the same
time employment increased strongly. These local services likely continue to concentrate
because they are closely linked to traded services. If the latter are concentrating in a few
regions, as is evident here for many of them, the suppliers of local services follow this
geographical pattern.
4 For the entire period from 1980 to 2000 road haulage and education also showed a (slight) increase in spatial concentration and above-average employment growth. Nonetheless, they are not included in the category of atypical sectors because location decisions in these fields are strongly subject to state regulations.

Discussion Papers 513 Classification of Regions and Sectors
13
Table 2 Sectors with increasing geographical concentration and above-average employment growth
Herfindahl index of geographical concentration
Employment
Change in %
1980 - 2000
Security, courier services 32,0 301,6
Business consultancy 18,9 270,0
Film industry 7,3 146,9
Engineering 0,9 110,8
Legal consultancy 7,6 80,0
Arts/theatre 4,7 35,3
Banking 18,1 27,2
All sectors -2,4 9,3
1990 - 2000
Business consultancy 16,6 123,2
Security, courier services 20,2 119,5
Building cleaning 2,7 93,5
Film industry 5,4 89,2
Real estate 2,4 85,6
Engineering 0,0 48,7
Legal consultancy 8,4 36,0
Arts/theatre 6,6 10,2
Banking 14,0 7,6
Insurance 1,7 6,6
All sectors -1,3 2,4
Total number of sectors: 83.
Sources: Employment statistics of the Federal Employment Agency and own calculations.

5 Estimates
We will now test empirically whether the probability for a region to show an atypical
development in productivity depends on the importance of sectors in that region that are also
atypical in their geographical development patterns.
First, logit models are estimated using as the explanatory variable the share in regional
employment in those sectors that – contrary to the general trend - are concentrating
geographically (see Table 2). The dependent variable is the type of region coded with 0,
“normal development in productivity”, or 1 “atypical development in productivity” (see Table
1). According to our hypothesis, the higher the initial employment share is of sectors in a
region that are continuing to concentrate the greater is the probability that they are Type 1 and
can depart from the general trend towards regional convergence. The periods through which
the processes of concentration or growth take place are 1980-2000 or 1990-2000. The results
of the logit estimates for both periods are given in Table 3. The results confirm our
hypothesis. Both estimates show a statistically significant positive influence5 of a region’s
employment share of atypical sectors in the initial year on a region’s probability of
experiencing atypical productivity trends.
Table 3 Results of the logit estimate
Period observed
1980 - 2000 1990 - 2000
Coefficient t-value p-value Coefficient t-value p-value
Share in employment 0.91 2.80 0.005 0.57 3.04 0.002
Constant -6.00 -3.65 < 0.001 -6.59 -3.94 < 0.001
Pseudo-R² 0.16 0.25
n (number of regions) 71 71
The extent to which the share in regional employment of geographically concentrating sectors
is able to explain atypical regional development is noticeably greater in the period from 1990
5 The estimated coefficient of the share in regional employment is statistically significant in both cases at the 1% level.
Discussion Papers 513 Estimates
15
to 2000 than in the longer time span from 1980 to 2000.6 The Pseudo-R2 rises from 0.16 to
0.25. The better fit in the shorter period may be due to the fact that the variation in regions’
shares of sectoral employment were clearly higher in 1990 than in 1980.
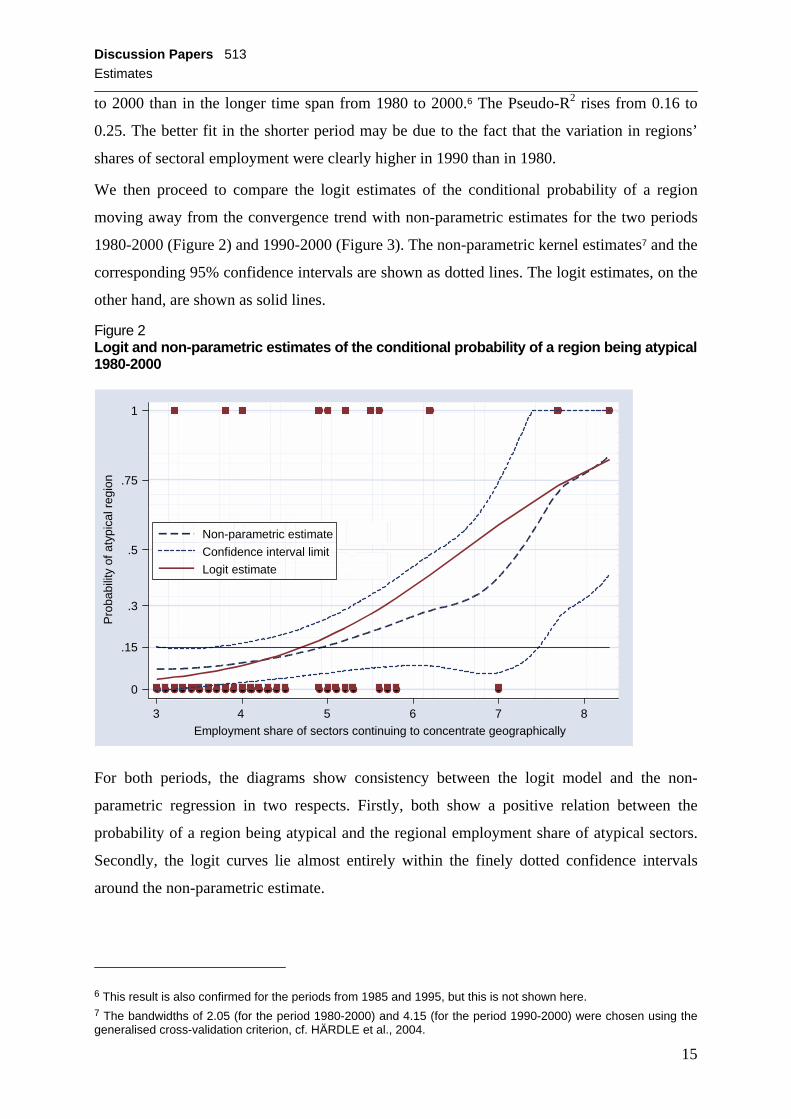
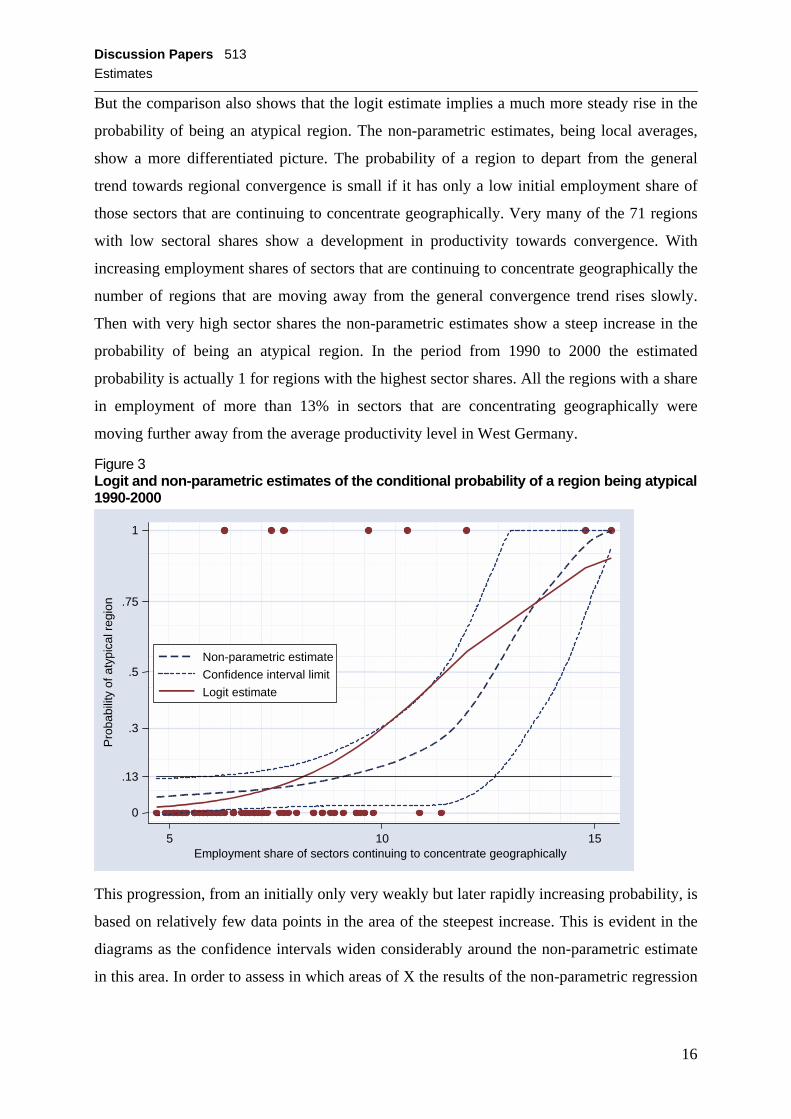
We then proceed to compare the logit estimates of the conditional probability of a region
moving away from the convergence trend with non-parametric estimates for the two periods
1980-2000 (Figure 2) and 1990-2000 (Figure 3). The non-parametric kernel estimates7 and the
corresponding 95% confidence intervals are shown as dotted lines. The logit estimates, on the
other hand, are shown as solid lines.
Figure 2 Logit and non-parametric estimates of the conditional probability of a region being atypical 1980-2000
0
.15
.3
.5
.75
1
3 4 5 6 7 8Employment share of sectors continuing to concentrate geographically
Non-parametric estimateConfidence interval limitLogit estimate
Pro
babi
lity
of a
typi
cal r
egio
n
For both periods, the diagrams show consistency between the logit model and the non-
parametric regression in two respects. Firstly, both show a positive relation between the
probability of a region being atypical and the regional employment share of atypical sectors.
Secondly, the logit curves lie almost entirely within the finely dotted confidence intervals
around the non-parametric estimate.
6 This result is also confirmed for the periods from 1985 and 1995, but this is not shown here. 7 The bandwidths of 2.05 (for the period 1980-2000) and 4.15 (for the period 1990-2000) were chosen using the generalised cross-validation criterion, cf. HÄRDLE et al., 2004.
Discussion Papers 513 Estimates
16
But the comparison also shows that the logit estimate implies a much more steady rise in the
probability of being an atypical region. The non-parametric estimates, being local averages,
show a more differentiated picture. The probability of a region to depart from the general
trend towards regional convergence is small if it has only a low initial employment share of
those sectors that are continuing to concentrate geographically. Very many of the 71 regions
with low sectoral shares show a development in productivity towards convergence. With
increasing employment shares of sectors that are continuing to concentrate geographically the
number of regions that are moving away from the general convergence trend rises slowly.
Then with very high sector shares the non-parametric estimates show a steep increase in the
probability of being an atypical region. In the period from 1990 to 2000 the estimated
probability is actually 1 for regions with the highest sector shares. All the regions with a share
in employment of more than 13% in sectors that are concentrating geographically were
moving further away from the average productivity level in West Germany.
Figure 3 Logit and non-parametric estimates of the conditional probability of a region being atypical 1990-2000
0
.13
.3
.5
.75
1
5 10 15Employment share of sectors continuing to concentrate geographically
Non-parametric estimateConfidence interval limitLogit estimate
Pro
babi
lity
of a
typi
cal r
egio
n
This progression, from an initially only very weakly but later rapidly increasing probability, is
based on relatively few data points in the area of the steepest increase. This is evident in the
diagrams as the confidence intervals widen considerably around the non-parametric estimate
in this area. In order to assess in which areas of X the results of the non-parametric regression

Discussion Papers 513 Estimates
17
are statistically significant, the horizontal line of the unconditional expected value for the
share of atypical regions in all regions is entered as a reference.8 The horizontal line at the
reference value represents the null hypothesis that there is no relation between the probability
of Y=1 and the initial employment share of concentrating sectors.
It is evident for both periods that the horizontal line of the absolute shares clearly moves out
of the curves delimiting the confidence interval on the extreme right edge only. This implies
that only if geographically concentrating sectors are of very great importance in a region will
their positive influence on the region’s ability to move away from the general regional
convergence trend be regarded as statistically significant.
8 The unconditional expected values for the shares of the atypical regions in all regions are 0.15 for 1980-2000 and 0.13 for 1990-2000.

6 Conclusions
In the 1980s and particularly the 1990s a number of rich regions in West Germany managed
to rise ever higher above the average productivity level. As our results show, one reason for
this is the heterogeneity of sector-specific developments. Most of the 83 sectors we looked at
do show geographical de-concentration, analogous to the regional convergence trend. Yet
some industries concentrated their activities even more in the 1980s and 1990s. Clearly,
regions that can move away from the general convergence trend are particularly favourable
locations for these sectors that both continue to concentrate spatially and grow faster than the
rest of the economy.
However, it remains to be seen what these specific location conditions are that create the high
affinity of certain sectors with individual regions. The identification and classification of
regions and sectors undertaken here can only support assumptions. Knowledge-intensive
services that are traded across regional boundaries predominate among the sectors that are
continuing to concentrate geographically, such as the film industry, business consultancy,
engineering, legal consultancy, arts/theatre and banking. At the same time major
agglomerations like Munich, Rhine-Main and Hamburg predominate among the regions that
can move away from the general trend of regional convergence.
This comparison suggests that a metropolitan environment attracts the knowledge-intensive
services sectors, because of its rich supply of skilled labour, high quality transport
infrastructure and many opportunities for cooperation between companies in the immediate
neighbourhood, and between companies and the local research scene. The particular
advantages of agglomeration for these sectors, and the particular dynamics of knowledge-
intensive services, evidently boost economic growth of large metropolitan regions. The
enormous progress in information and communications technology has apparently not
changed this at all. On the contrary, the process we observed was more marked in the 1990s
than a decade before.
But the empirical results also leave open questions. Why do some traded services , like
advertising, not show further geographical concentration? Why can other big city regions, like
Cologne, not benefit from the geographical concentration and dynamics of knowledge-
intensive services? Is the success of the Stuttgart and Nuremberg regions due less to traded
services and much more to clusters of high-performing manufacturing branches?

7 References
Aghion P. and P. Howitt (1992): A Model of Growth through Creative Destruction. Econometrica 60 (2), 323-351.
Bade F.-J., C.-F. Laaser and R. Soltwedel (2004): Urban Specialization in the Internet Age - Empirical Findings for Germany. Kiel Working Paper 1215.
Bode E. (2002): R&D, Localised Knowledge Spillovers and Endogenous Regional Growth: Evidence from Germany, in SCHÄTZL L. and REVILLA-DIEZ J. (Eds) Technological change and regional development in Europe. Heidelberg, Physika.
Capello R. (2001): Agglomeration economies and urban productivity: Urbanisation vs. localisation economies in the metropolitan area of Milan. Jahrbuch für Regionalwissenschaft 21, 1-23.
Ciccone A. (2002): Agglomeration effects in Europe. European Economic Review 46, 213-227. Cheshire P. and S. Magrini (2000): Endogenous Processes in European Regional Growth:
Convergence and Policy. Growth and Change 31 (Fall), 455-479. Duranton G. and H. Overman (2002): Testing for Localisation using Micro-Geographic Data. CEPR
Discussion Paper 3379. Duranton G. and D. Puga (2004): From sectoral to functional urban specialisation, CEPR Discussion
Paper 2971. Ellison G. and E. Glaeser (1997): Geographic Concentration in U.S. Manufacturing Industries: A
Dartboard Approach. Journal of Political Economy 105, 889-927. Fox J. (1990): Describing Univariate Distributions, in: FOX F. and LONG J. S. (Eds) Modern
Methods of Data Analysis. Newbury Park, Sage Publications. Fujita M., P. Krugman and A. J. Venables (1999): The Spatial Economy, Cities, Regions and
International Trade. Cambridge (MA), MIT Press. Fujita M. and J.-F. Thisse (2004): Economies of Agglomeration, Cities, Industrial Location and
Regional Growth. Cambridge, Cambridge University Press. Glaeser E., H. Kallal, J. Scheinkman and A. Shleifer. (1992): Growth in Cities. Journal of Political
Economy 100, 1126-1152. Härdle W. (1991): Smoothing Techniques, With Implementations in S, Springer, New York. Härdle W., M. Müller, S. T. Sperlich and A. Werwatz (2004): Nonparametric and Semiparametric
Models. Springer Verlag, Heidelberg. Henderson J. V. (1988): Urban Development Theory, Fact and Illusion. New York, Oxford University
Press. Krugman F. (1991): Increasing returns and economic geography. Journal of Political Economy 99,
483-499. Lucas R. (1988): On the Mechanics of Economic Development. Journal of Monetary Economics 22,
3-42. Mankiw N. G., D. Romer and D. Weil (1992): A Contribution to the Empirics of Economic Growth.
Quarterly Journal of Economics 107 (May), 407-438. Marshall A. (1925): Principles of Economics (eighth edition). London, Macmillan. Overman H. G., S. Redding and A. J. Venables (2001): The Economic Geography of Trade,
Production and Income: A Survey of Empirics. London School of Economics, CEP Discussion Papers 508.
Porter M. (1990): The Competitive Advantage of Nations. New York: Free Press. Puga D. (1999): The rise and fall of regional inequalities. European Economic Review 43, 303-334. Rosenthal S. and W. Strange (2005): Evidence on the nature and sources of agglomeration economies,
in Henderson V., J.-F. Thisse J.-F. (Eds) Handbook of Regional and Urban Economics, Vol. 4, North Holland, Amsterdam.

Discussion Papers 513 References
20
Sala-I-Martin X. (1996): On Growth and States. Ph.D. dissertation (Harvard University, Cambridge MA).
Sala-I-Martin X. (1996): Regional cohesion: Evidence and theories of regional growth and convergence. European Economic Review 40, 1325-1352.
Solow R. M. (1956): A Contribution to the Theory of Economic Growth. Quarterly Journal of Economics 70, 65-94.
Solow R. M. (1957): Technical Change and the Aggregate Production Function. Review of Economics and Statistics 39, 312-320.