
Evidence for an attentional priority map in …Evidence for an attentional priority map in...
9
Evidence for an attentional priority map in inferotemporal cortex Heiko Stemmann a,1 and Winrich A. Freiwald b,1 a Institute for Brain Research & Center for Advanced Imaging, University of Bremen, D-28334 Bremen, Germany; and b Center for Brain, Minds & Machines (CBMM), Laboratory of Neural Systems, The Rockefeller University, New York, NY 10065 Edited by Michael E. Goldberg, Columbia University, New York, NY, and approved October 7, 2019 (received for review December 24, 2018) From incoming sensory information, our brains make selections according to current behavioral goals. This process, selective attention, is controlled by parietal and frontal areas. Here, we show that another brain area, posterior inferotemporal cortex (PITd), also exhibits the defining properties of attentional control. We discov- ered this area with functional magnetic resonance imaging (fMRI) during an attentive motion discrimination task. Single-cell record- ings from PITd revealed strong attentional modulation across 3 attention tasks yet no tuning to task-relevant stimulus features, like motion direction or color. Instead, PITd neurons closely tracked the subject’s attention state and predicted upcoming errors of atten- tional selection. Furthermore, artificial electrical PITd stimulation controlled the location of attentional selection without altering fea- ture discrimination. These are the defining properties of a feature- blind priority map encoding the locus of attention. Together, these results suggest area PITd, located strategically to gather information about object properties, as an attentional priority map. attention | electrophysiology | cognition O ur brains are not passive analyzers of sensory information. Rather, they select important pieces of information at the expense of currently irrelevant ones (1). This active process, se- lective attention, constitutes a critical link between sensory pro- cessing and internal cognitive set. It is widely accepted, based on a wealth of data from human neuropsychology and imaging as well as nonhuman primate electrophysiology, that the focus of endog- enous attention is controlled by a network of areas in parietal and prefrontal cortex (2–6). In contrast, regions of the occipital and temporal lobe are thought to support the detailed processing of visual object information. When these regions are modulated by attention (7–9), this is thought to result from top-down influences from prefrontal regions, like the frontal eye fields (FEFs), or pa- rietal regions, like the lateral intraparietal (LIP) area (10–12). During functional magnetic resonance imaging (fMRI) in ma- caque monkeys performing an attention-demanding motion dis- crimination task (Fig. 1A), we found robust attentional modulation in a range of visual areas including but not limited to motion- selective area MT and areas LIP and FEF (13) (Fig. 1B). In this task, monkeys were required to track 1 of 2 random dot surfaces (RDSs) that were rapidly changing motion direction until direc- tions ceased changing. This prolonged motion event (PME) had to be detected, and the direction of motion had to be reported by an eye movement in the same direction (and onto 1 of 8 peripheral saccade targets [STs]) (Fig. 1A). Because the task emphasized motion discrimination, involve- ment of areas with strong directional tuning, like dorsal-stream area MT (14, 15), was expected. Because the task emphasized sustained endogenous attention, involvement of attentional control areas LIP and FEF made sense as well. Yet curiously, an addi- tional area located in posterior and dorsal inferotemporal cortex, area posterior inferotemporal cortex (PITd) (16–18) (Fig. 1B) (a ventral-stream area), stood out as the one strongly attention- modulated area known neither for motion selectivity nor for at- tention control. We thus set out to determine its functional properties and targeted PITd for electrophysiological recordings. The first multiunit signal that we recorded during the attentive motion discrimination task is shown in Fig. 1C. With attention paid into the receptive field (RF), activity was high; with atten- tion paid outside the RF, activity fell to the level of prestimulus activity. Because of strength and trial-to-trial reliability of at- tentional modulation, the attentional state of the animal could be predicted, with complete fidelity (receiver operator charac- teristics [ROC] analysis: area under curve [AUC] = 1) (Fig. 1 C, Right; sample recordings are in Movies S1–S3). An isolated single unit recorded simultaneously showed a similar degree of attentional modulation (Methods and Fig. 1D) (attention index [AI] 0.55, multiunit 0.69). In contrast, the activity of the cell was hardly, if at all, modulated by motion direction (Fig. 1 D, Right) (direction indices = 0.03 and 0.07 during rapid motion events and PMEs, respectively). Thus, this particular PITd site carried little information about the attended feature but a lot about the subject’s attentional state. This pattern of strong task dependence and weak direction dependence was characteristic for the population of PITd cells (n = 190) as a whole. The population response showed a separa- tion of response magnitude with attention direction growing over time (Fig. 2A). Attentional modulation was strong in the entire population of cells, with the distribution of AIs shifted almost entirely to positive values with a mean AI of 0.62 in the interval 1,500 to 3,500 ms after stimulus onset. This corresponds to a 426% increase of the attended over the nonattended response (Fig. 2B). PITd neurons were thus highly informative about the attentional state of the subject (average AUC = 0.86) (Fig. 2 B, Inset). In contrast, directional modulation was weak in the entire population (mean direction index 0.02, corresponding to a mean Significance A fundamental dogma in the cognitive neurosciences is that at- tention is controlled by parietal and prefrontal areas. Here, we show that an area in the temporal lobe exhibits the properties of a priority map coding the focus of attention. We show this through whole-brain functional magnetic resonance imaging, electrophysiological single-unit recordings, and causal electrical stimulation. This discovery changes our understanding of the organization of visual pathways and the functions of attention networks. Author contributions: H.S. and W.A.F. designed research, performed research, analyzed data, and wrote the paper. The authors declare no competing interest. This article is a PNAS Direct Submission. This open access article is distributed under Creative Commons Attribution-NonCommercial- NoDerivatives License 4.0 (CC BY-NC-ND). Data deposition: Data for this article have been deposited in figshare, https://doi.org/10. 6084/m9.figshare.c.4705649.v1. 1 To whom correspondence may be addressed. Email: [email protected] or [email protected]. This article contains supporting information online at www.pnas.org/lookup/suppl/doi:10. 1073/pnas.1821866116/-/DCSupplemental. First published November 4, 2019. www.pnas.org/cgi/doi/10.1073/pnas.1821866116 PNAS | November 19, 2019 | vol. 116 | no. 47 | 23797–23805 NEUROSCIENCE Downloaded by guest on January 26, 2020
Transcript of Evidence for an attentional priority map in …Evidence for an attentional priority map in...
Evidence for an attentional priority map ininferotemporal cortexHeiko Stemmanna,1 and Winrich A. Freiwaldb,1
aInstitute for Brain Research & Center for Advanced Imaging, University of Bremen, D-28334 Bremen, Germany; and bCenter for Brain, Minds & Machines(CBMM), Laboratory of Neural Systems, The Rockefeller University, New York, NY 10065
Edited by Michael E. Goldberg, Columbia University, New York, NY, and approved October 7, 2019 (received for review December 24, 2018)
From incoming sensory information, our brains make selectionsaccording to current behavioral goals. This process, selectiveattention, is controlled by parietal and frontal areas. Here, we showthat another brain area, posterior inferotemporal cortex (PITd), alsoexhibits the defining properties of attentional control. We discov-ered this area with functional magnetic resonance imaging (fMRI)during an attentive motion discrimination task. Single-cell record-ings from PITd revealed strong attentional modulation across 3attention tasks yet no tuning to task-relevant stimulus features, likemotion direction or color. Instead, PITd neurons closely tracked thesubject’s attention state and predicted upcoming errors of atten-tional selection. Furthermore, artificial electrical PITd stimulationcontrolled the location of attentional selection without altering fea-ture discrimination. These are the defining properties of a feature-blind priority map encoding the locus of attention. Together, theseresults suggest area PITd, located strategically to gather informationabout object properties, as an attentional priority map.
attention | electrophysiology | cognition
Our brains are not passive analyzers of sensory information.Rather, they select important pieces of information at the
expense of currently irrelevant ones (1). This active process, se-lective attention, constitutes a critical link between sensory pro-cessing and internal cognitive set. It is widely accepted, based on awealth of data from human neuropsychology and imaging as wellas nonhuman primate electrophysiology, that the focus of endog-enous attention is controlled by a network of areas in parietal andprefrontal cortex (2–6). In contrast, regions of the occipital andtemporal lobe are thought to support the detailed processing ofvisual object information. When these regions are modulated byattention (7–9), this is thought to result from top-down influencesfrom prefrontal regions, like the frontal eye fields (FEFs), or pa-rietal regions, like the lateral intraparietal (LIP) area (10–12).During functional magnetic resonance imaging (fMRI) in ma-
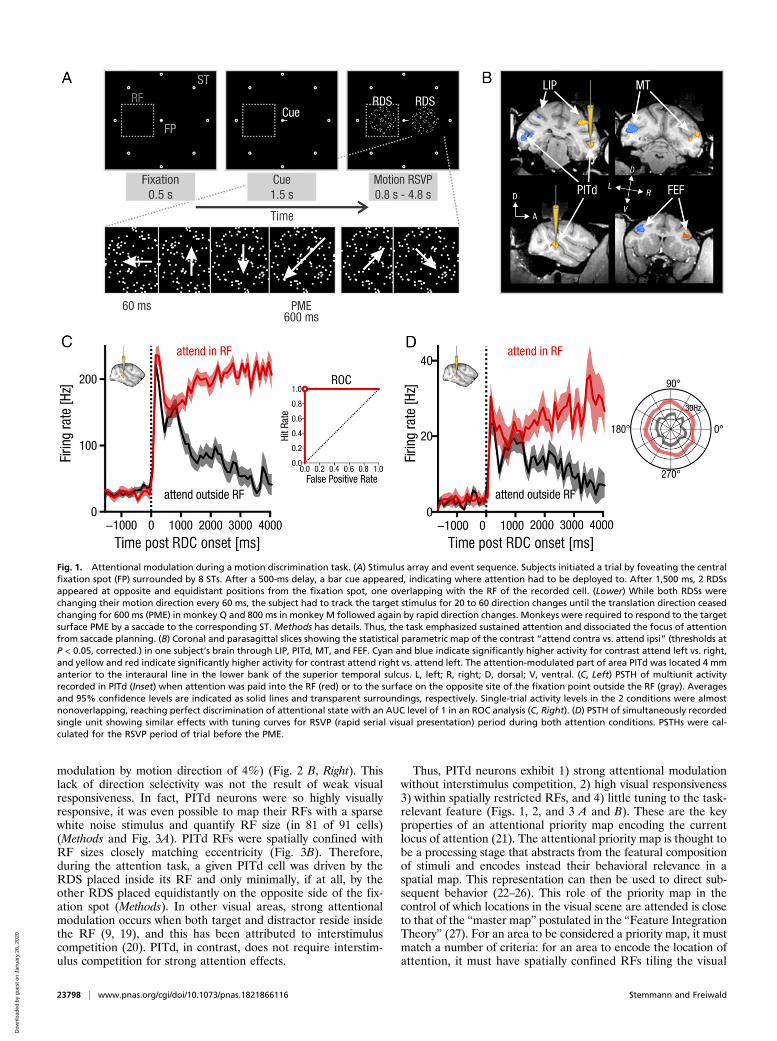
caque monkeys performing an attention-demanding motion dis-crimination task (Fig. 1A), we found robust attentional modulationin a range of visual areas including but not limited to motion-selective area MT and areas LIP and FEF (13) (Fig. 1B). In thistask, monkeys were required to track 1 of 2 random dot surfaces(RDSs) that were rapidly changing motion direction until direc-tions ceased changing. This prolonged motion event (PME) had tobe detected, and the direction of motion had to be reported by aneye movement in the same direction (and onto 1 of 8 peripheralsaccade targets [STs]) (Fig. 1A).Because the task emphasized motion discrimination, involve-
ment of areas with strong directional tuning, like dorsal-streamarea MT (14, 15), was expected. Because the task emphasizedsustained endogenous attention, involvement of attentional controlareas LIP and FEF made sense as well. Yet curiously, an addi-tional area located in posterior and dorsal inferotemporal cortex,area posterior inferotemporal cortex (PITd) (16–18) (Fig. 1B) (aventral-stream area), stood out as the one strongly attention-modulated area known neither for motion selectivity nor for at-tention control. We thus set out to determine its functionalproperties and targeted PITd for electrophysiological recordings.
The first multiunit signal that we recorded during the attentivemotion discrimination task is shown in Fig. 1C. With attentionpaid into the receptive field (RF), activity was high; with atten-tion paid outside the RF, activity fell to the level of prestimulusactivity. Because of strength and trial-to-trial reliability of at-tentional modulation, the attentional state of the animal couldbe predicted, with complete fidelity (receiver operator charac-teristics [ROC] analysis: area under curve [AUC] = 1) (Fig. 1 C,Right; sample recordings are in Movies S1–S3). An isolatedsingle unit recorded simultaneously showed a similar degree ofattentional modulation (Methods and Fig. 1D) (attention index[AI] 0.55, multiunit 0.69). In contrast, the activity of the cell washardly, if at all, modulated by motion direction (Fig. 1 D, Right)(direction indices = 0.03 and 0.07 during rapid motion eventsand PMEs, respectively). Thus, this particular PITd site carriedlittle information about the attended feature but a lot about thesubject’s attentional state.This pattern of strong task dependence and weak direction
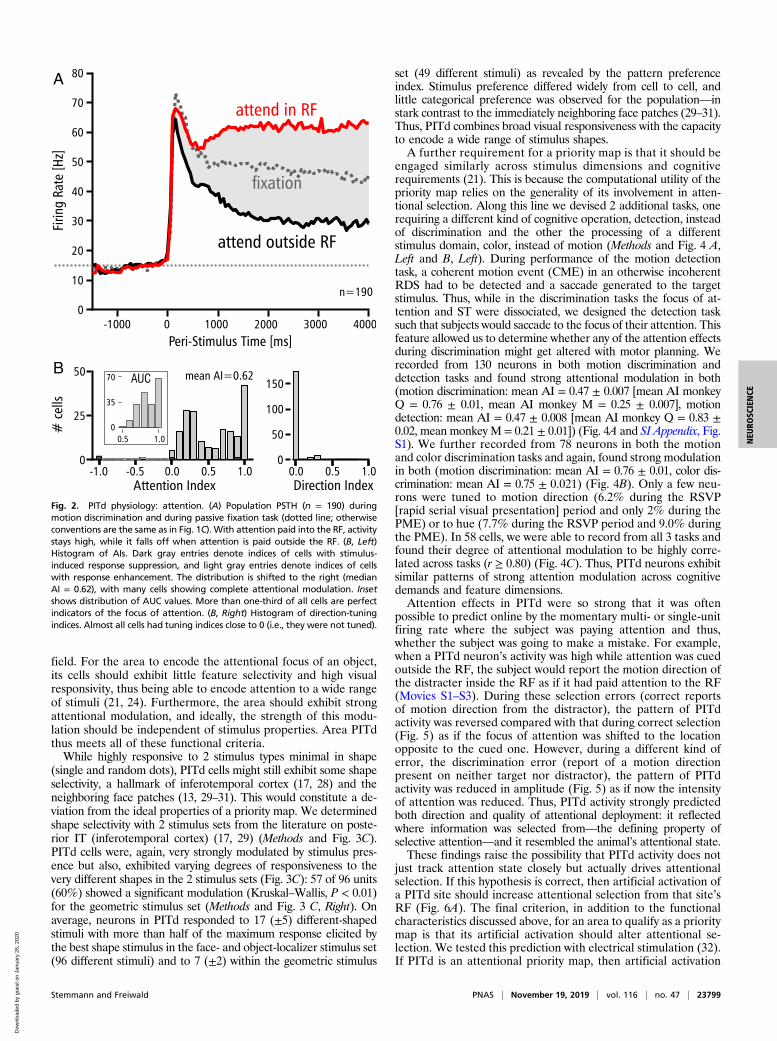
dependence was characteristic for the population of PITd cells(n = 190) as a whole. The population response showed a separa-tion of response magnitude with attention direction growing overtime (Fig. 2A). Attentional modulation was strong in the entirepopulation of cells, with the distribution of AIs shifted almostentirely to positive values with a mean AI of 0.62 in the interval1,500 to 3,500 ms after stimulus onset. This corresponds to a 426%increase of the attended over the nonattended response (Fig. 2B).PITd neurons were thus highly informative about the attentionalstate of the subject (average AUC = 0.86) (Fig. 2 B, Inset).In contrast, directional modulation was weak in the entire
population (mean direction index 0.02, corresponding to a mean
Significance
A fundamental dogma in the cognitive neurosciences is that at-tention is controlled by parietal and prefrontal areas. Here, weshow that an area in the temporal lobe exhibits the properties ofa priority map coding the focus of attention. We show thisthrough whole-brain functional magnetic resonance imaging,electrophysiological single-unit recordings, and causal electricalstimulation. This discovery changes our understanding ofthe organization of visual pathways and the functions ofattention networks.
Author contributions: H.S. and W.A.F. designed research, performed research, analyzeddata, and wrote the paper.
The authors declare no competing interest.
This article is a PNAS Direct Submission.
This open access article is distributed under Creative Commons Attribution-NonCommercial-NoDerivatives License 4.0 (CC BY-NC-ND).
Data deposition: Data for this article have been deposited in figshare, https://doi.org/10.6084/m9.figshare.c.4705649.v1.1To whom correspondence may be addressed. Email: [email protected] [email protected].
This article contains supporting information online at www.pnas.org/lookup/suppl/doi:10.1073/pnas.1821866116/-/DCSupplemental.
First published November 4, 2019.
www.pnas.org/cgi/doi/10.1073/pnas.1821866116 PNAS | November 19, 2019 | vol. 116 | no. 47 | 23797–23805
NEU
ROSC
IENCE
Dow
nloa
ded
by g
uest
on
Janu
ary
26, 2
020
modulation by motion direction of 4%) (Fig. 2 B, Right). Thislack of direction selectivity was not the result of weak visualresponsiveness. In fact, PITd neurons were so highly visuallyresponsive, it was even possible to map their RFs with a sparsewhite noise stimulus and quantify RF size (in 81 of 91 cells)(Methods and Fig. 3A). PITd RFs were spatially confined withRF sizes closely matching eccentricity (Fig. 3B). Therefore,during the attention task, a given PITd cell was driven by theRDS placed inside its RF and only minimally, if at all, by theother RDS placed equidistantly on the opposite side of the fix-ation spot (Methods). In other visual areas, strong attentionalmodulation occurs when both target and distractor reside insidethe RF (9, 19), and this has been attributed to interstimuluscompetition (20). PITd, in contrast, does not require interstim-ulus competition for strong attention effects.
Thus, PITd neurons exhibit 1) strong attentional modulationwithout interstimulus competition, 2) high visual responsiveness3) within spatially restricted RFs, and 4) little tuning to the task-relevant feature (Figs. 1, 2, and 3 A and B). These are the keyproperties of an attentional priority map encoding the currentlocus of attention (21). The attentional priority map is thought tobe a processing stage that abstracts from the featural compositionof stimuli and encodes instead their behavioral relevance in aspatial map. This representation can then be used to direct sub-sequent behavior (22–26). This role of the priority map in thecontrol of which locations in the visual scene are attended is closeto that of the “master map” postulated in the “Feature IntegrationTheory” (27). For an area to be considered a priority map, it mustmatch a number of criteria: for an area to encode the location ofattention, it must have spatially confined RFs tiling the visual
Fig. 1. Attentional modulation during a motion discrimination task. (A) Stimulus array and event sequence. Subjects initiated a trial by foveating the centralfixation spot (FP) surrounded by 8 STs. After a 500-ms delay, a bar cue appeared, indicating where attention had to be deployed to. After 1,500 ms, 2 RDSsappeared at opposite and equidistant positions from the fixation spot, one overlapping with the RF of the recorded cell. (Lower) While both RDSs werechanging their motion direction every 60 ms, the subject had to track the target stimulus for 20 to 60 direction changes until the translation direction ceasedchanging for 600 ms (PME) in monkey Q and 800 ms in monkey M followed again by rapid direction changes. Monkeys were required to respond to the targetsurface PME by a saccade to the corresponding ST. Methods has details. Thus, the task emphasized sustained attention and dissociated the focus of attentionfrom saccade planning. (B) Coronal and parasagittal slices showing the statistical parametric map of the contrast “attend contra vs. attend ipsi” (thresholds atP < 0.05, corrected.) in one subject’s brain through LIP, PITd, MT, and FEF. Cyan and blue indicate significantly higher activity for contrast attend left vs. right,and yellow and red indicate significantly higher activity for contrast attend right vs. attend left. The attention-modulated part of area PITd was located 4 mmanterior to the interaural line in the lower bank of the superior temporal sulcus. L, left; R, right; D, dorsal; V, ventral. (C, Left) PSTH of multiunit activityrecorded in PITd (Inset) when attention was paid into the RF (red) or to the surface on the opposite site of the fixation point outside the RF (gray). Averagesand 95% confidence levels are indicated as solid lines and transparent surroundings, respectively. Single-trial activity levels in the 2 conditions were almostnonoverlapping, reaching perfect discrimination of attentional state with an AUC level of 1 in an ROC analysis (C, Right). (D) PSTH of simultaneously recordedsingle unit showing similar effects with tuning curves for RSVP (rapid serial visual presentation) period during both attention conditions. PSTHs were cal-culated for the RSVP period of trial before the PME.
23798 | www.pnas.org/cgi/doi/10.1073/pnas.1821866116 Stemmann and Freiwald
Dow
nloa
ded
by g
uest
on
Janu
ary
26, 2
020
field. For the area to encode the attentional focus of an object,its cells should exhibit little feature selectivity and high visualresponsivity, thus being able to encode attention to a wide rangeof stimuli (21, 24). Furthermore, the area should exhibit strongattentional modulation, and ideally, the strength of this modu-lation should be independent of stimulus properties. Area PITdthus meets all of these functional criteria.While highly responsive to 2 stimulus types minimal in shape
(single and random dots), PITd cells might still exhibit some shapeselectivity, a hallmark of inferotemporal cortex (17, 28) and theneighboring face patches (13, 29–31). This would constitute a de-viation from the ideal properties of a priority map. We determinedshape selectivity with 2 stimulus sets from the literature on poste-rior IT (inferotemporal cortex) (17, 29) (Methods and Fig. 3C).PITd cells were, again, very strongly modulated by stimulus pres-ence but also, exhibited varying degrees of responsiveness to thevery different shapes in the 2 stimulus sets (Fig. 3C): 57 of 96 units(60%) showed a significant modulation (Kruskal–Wallis, P < 0.01)for the geometric stimulus set (Methods and Fig. 3 C, Right). Onaverage, neurons in PITd responded to 17 (±5) different-shapedstimuli with more than half of the maximum response elicited bythe best shape stimulus in the face- and object-localizer stimulus set(96 different stimuli) and to 7 (±2) within the geometric stimulus
set (49 different stimuli) as revealed by the pattern preferenceindex. Stimulus preference differed widely from cell to cell, andlittle categorical preference was observed for the population—instark contrast to the immediately neighboring face patches (29–31).Thus, PITd combines broad visual responsiveness with the capacityto encode a wide range of stimulus shapes.A further requirement for a priority map is that it should be
engaged similarly across stimulus dimensions and cognitiverequirements (21). This is because the computational utility of thepriority map relies on the generality of its involvement in atten-tional selection. Along this line we devised 2 additional tasks, onerequiring a different kind of cognitive operation, detection, insteadof discrimination and the other the processing of a differentstimulus domain, color, instead of motion (Methods and Fig. 4 A,Left and B, Left). During performance of the motion detectiontask, a coherent motion event (CME) in an otherwise incoherentRDS had to be detected and a saccade generated to the targetstimulus. Thus, while in the discrimination tasks the focus of at-tention and ST were dissociated, we designed the detection tasksuch that subjects would saccade to the focus of their attention. Thisfeature allowed us to determine whether any of the attention effectsduring discrimination might get altered with motor planning. Werecorded from 130 neurons in both motion discrimination anddetection tasks and found strong attentional modulation in both(motion discrimination: mean AI = 0.47 ± 0.007 [mean AI monkeyQ = 0.76 ± 0.01, mean AI monkey M = 0.25 ± 0.007], motiondetection: mean AI = 0.47 ± 0.008 [mean AI monkey Q = 0.83 ±0.02, mean monkey M = 0.21 ± 0.01]) (Fig. 4A and SI Appendix, Fig.S1). We further recorded from 78 neurons in both the motionand color discrimination tasks and again, found strong modulationin both (motion discrimination: mean AI = 0.76 ± 0.01, color dis-crimination: mean AI = 0.75 ± 0.021) (Fig. 4B). Only a few neu-rons were tuned to motion direction (6.2% during the RSVP[rapid serial visual presentation] period and only 2% during thePME) or to hue (7.7% during the RSVP period and 9.0% duringthe PME). In 58 cells, we were able to record from all 3 tasks andfound their degree of attentional modulation to be highly corre-lated across tasks (r ≥ 0.80) (Fig. 4C). Thus, PITd neurons exhibitsimilar patterns of strong attention modulation across cognitivedemands and feature dimensions.Attention effects in PITd were so strong that it was often
possible to predict online by the momentary multi- or single-unitfiring rate where the subject was paying attention and thus,whether the subject was going to make a mistake. For example,when a PITd neuron’s activity was high while attention was cuedoutside the RF, the subject would report the motion direction ofthe distracter inside the RF as if it had paid attention to the RF(Movies S1–S3). During these selection errors (correct reportsof motion direction from the distractor), the pattern of PITdactivity was reversed compared with that during correct selection(Fig. 5) as if the focus of attention was shifted to the locationopposite to the cued one. However, during a different kind oferror, the discrimination error (report of a motion directionpresent on neither target nor distractor), the pattern of PITdactivity was reduced in amplitude (Fig. 5) as if now the intensityof attention was reduced. Thus, PITd activity strongly predictedboth direction and quality of attentional deployment: it reflectedwhere information was selected from—the defining property ofselective attention—and it resembled the animal’s attentional state.These findings raise the possibility that PITd activity does not
just track attention state closely but actually drives attentionalselection. If this hypothesis is correct, then artificial activation ofa PITd site should increase attentional selection from that site’sRF (Fig. 6A). The final criterion, in addition to the functionalcharacteristics discussed above, for an area to qualify as a prioritymap is that its artificial activation should alter attentional se-lection. We tested this prediction with electrical stimulation (32).If PITd is an attentional priority map, then artificial activation
A
B
Fig. 2. PITd physiology: attention. (A) Population PSTH (n = 190) duringmotion discrimination and during passive fixation task (dotted line; otherwiseconventions are the same as in Fig. 1C). With attention paid into the RF, activitystays high, while it falls off when attention is paid outside the RF. (B, Left)Histogram of AIs. Dark gray entries denote indices of cells with stimulus-induced response suppression, and light gray entries denote indices of cellswith response enhancement. The distribution is shifted to the right (medianAI = 0.62), with many cells showing complete attentional modulation. Insetshows distribution of AUC values. More than one-third of all cells are perfectindicators of the focus of attention. (B, Right) Histogram of direction-tuningindices. Almost all cells had tuning indices close to 0 (i.e., they were not tuned).
Stemmann and Freiwald PNAS | November 19, 2019 | vol. 116 | no. 47 | 23799
NEU
ROSC
IENCE
Dow
nloa
ded
by g
uest
on
Janu
ary
26, 2
020

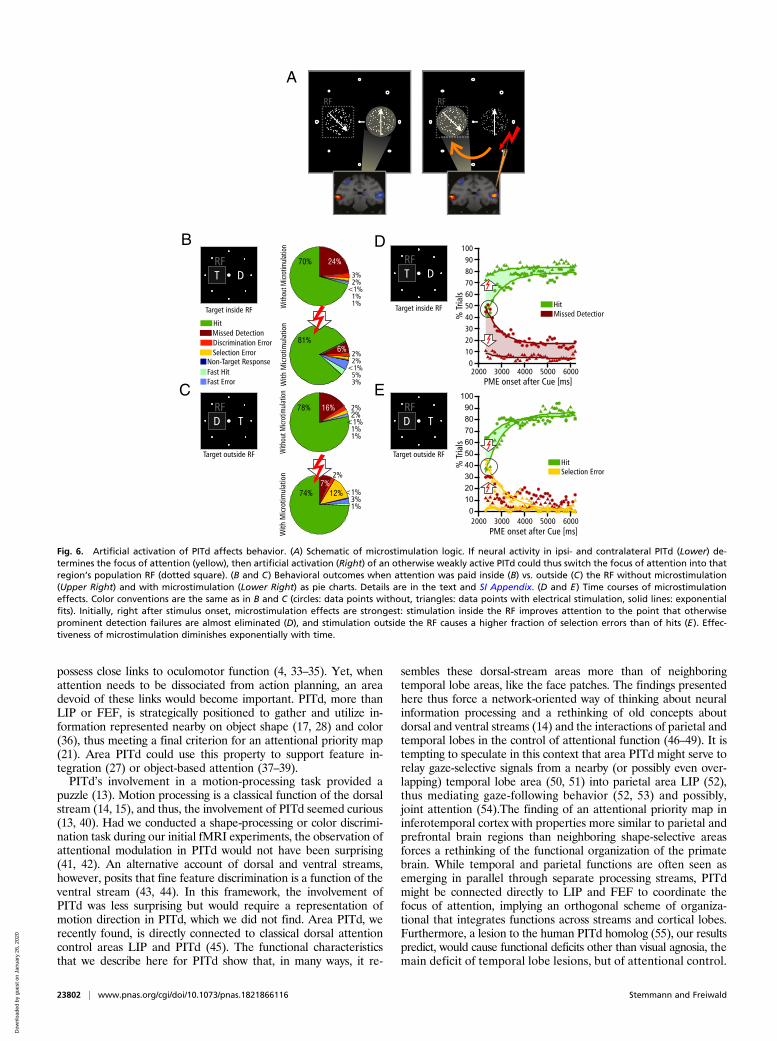
should enhance attention for stimuli within the RFs at thestimulation site and possibly reduce attention at other loca-tions. We wanted to test the role of PITd more specifically andthus, modified the motion discrimination task slightly to enhanceits sensitivity. To enhance behavioral readout sensitivity, we in-creased attentional load by lowering motion coherence (Methods).We also synchronized PMEs between surfaces to allow for both tobe paired with electrical stimulation (occurring randomly duringhalf the trials) (Methods). In each trial, of the 8 possible motiondirections, one was chosen for the target, and a different one waschosen for the distractor. Thus, 4 main behavioral outcomes couldoccur: the subject could saccade into the motion direction dis-played by the target (“hit”) or the direction of the distracter(“selection error”) or to 1 of 6 remaining STs (“discriminationerror”), or the subject could fail to respond to the PMEs (“misseddetection”). This set of behaviors allowed us to test, with very highgranularity, the critical predictions emerging from the hypothesesthat PITd is an attentional priority map.First, if PITd is a priority map, stimulation should increase
attention and thus, reduce the fraction of missed detection er-rors. Second, electrical stimulation in PITd should draw atten-tion to the stimulus processed by the site of stimulation (Fig. 6A):when the target stimulus is inside the RF, its processing shouldbe improved (increased fraction of hits); when the distractor isinside the RF, it should be erroneously selected but its motion
direction reported correctly (increased fraction of selection errors).Third, even the very strong and artificial activation of PITd shouldnot interfere with the quality of motion discrimination (no increasein discrimination errors). These are very specific and strong pre-dictions of the attentional priority map hypothesis.We found the following pattern of results (Fig. 6 B and C and
SI Appendix have statistics [multinomial logistic regression] anddetails). First, electrical stimulation in PITd reduced the fractionof missed detection events (from 20 to 7%). Second, when thetarget was inside the RF, electrical stimulation increased the frac-tion of hits (from 70 to 81%) (Fig. 6B), and when the distractor wasinside the RF, electrical stimulation increased selection errors in-stead (from 2 to 12%) (Fig. 6C). Third, electrical stimulation didnot alter the fraction of discrimination errors (2%). Thus, electricalstimulation in PITd caused a complex profile of behavioral im-provement and deterioration, and that pattern matched the pre-dictions of the attention priority map hypothesis of PITd precisely.This pattern of causality relaying artificial PITd activation to
behavior paralleled the electrophysiological profile of PITd activity(Fig. 2). First, at a time when PITd population activity did not yetdifferentiate very much between target and distractor (Fig. 2A),the effectiveness of electrical stimulation was highest (Fig. 6D and E):microstimulation of PITd at target location (Fig. 6D) was soeffective, it decreased the fraction of missed detections from about50 to 10%, while microstimulation of PITd at the distractor
A B
C
Fig. 3. PITd physiology: RFs and shape tuning. (A) Contour plots of 2 sample RF maps determined by sparse white noise mapping. Normalized activity (white: 1,black: 0) is shown as a function of dot position. Blue lines mark results of Gaussian fit (square root 2 times width and height, the area encompassing 85% of thesignal). (B) Scatter plot of RF size (square root of area) and eccentricity of RF center (n = 81 cells). (C) Comparison of PITd cell (n = 106) activation across 3 tasks: (Left)attentive motion discrimination, (Center) face/object selectivity (61), and (Right) shape selectivity (17, 62). Minimum–maximum normalized activity (color coded;yellow: 1, blue: 0) is shown as a function of cell number (top to bottom; sorted by strength of attention effect) and stimulus condition (left to right)—please notethat minimum–maximum normalization was applied over all 3 stimulus conditions (i.e., differences in color scale between stimulus conditions are representingdifferences in neural activity). Sample stimuli are shown in Top. PITd neurons are most strongly and systematically modulated by attention, not by shape. DifferentPITd neurons exhibit different pattern selectivity such that the mean population activity differs little across categories, including faces and scrambled patterns.
23800 | www.pnas.org/cgi/doi/10.1073/pnas.1821866116 Stemmann and Freiwald
Dow
nloa
ded
by g
uest
on
Janu
ary
26, 2
020

location (Fig. 6E) increased the fraction of selection errors from justabove 0 to about 45% (even surpassing the fraction of hits at38%). The effectiveness of microstimulation subsequently de-creased with decay constants of about 700 to 1,000 ms (Fig. 6 Dand E), slightly slower than the time course of attentional differ-entiation in the PITd population response (Fig. 2A) (τ = 582 ms).This relationship is expected when the focus of attention is de-termined by both natural PITd activity and the superposed artificialactivation: when the former is least differentiated, the effect of thelatter should be strongest, but after activity levels for target anddistractor have diverged, electrical stimulation becomes ineffective.Second, effectiveness of microstimulation (inducing selection er-rors) and strength of attention modulation (AI) correlated signif-icantly from site to site (r = 0.50, P < 0.01, n = 29) (SI Appendix).Thus, the temporal and spatial profiles of attentional modulationin PITd predict its causal impact on attentional selection.The pattern of microstimulation effects and the pattern of
correlation with the physiology provide support for the hypothesisthat PITd constitutes an attentional priority map with activity that
controls attention. Similarly, these patterns of results make alternativeaccounts implausible. We consider here the case of phosphenes,which any stimulation inside the visual system might generate. Thegeneration of a phosphene, which subsequently draws attention toits location, at a point in time related to the PMEs could explainthe increase in performance and reduction of missed detectionevents. However, phosphenes would interfere with feature dis-crimination and would thus predict an increase in discriminationerrors, contrary to what we observed. Furthermore, the strength ofphosphenes is not expected to be correlated with the strength ofattention effects that we observed. Most importantly, the timecourse of phosphene effects would be the opposite of what weobserved: phosphene visibility would be lowest in the beginning ofthe trial, when firing rates are already high, and would increaseover time as firing rates drop in the nonattended condition. Thus,the generation of phosphenes cannot explain the pattern of resultsthat artificial stimulation of PITd generated.Results from fMRI, electrophysiology, causal manipulation,
and behavior show that an area in PITd does not serve the pro-cessing of featural detail but attentional selection. This is a func-tion so far not associated with the temporal lobe, but usuallyassociated with parietal and prefrontal cortex, like areas LIP andFEF, which also exhibit several characteristics of a priority map (4,5). Why might there be a third area for attentional control, andwhy at such a remote location from the others? FEF and LIP both
A
B
Fig. 5. PITd activity predicts behavior. (A) PITd population activity (normalized)preceding PME onset in 2 behavioral contexts (target inside or outside of RF;filled and open circles, respectively) and 3 behavioral outcomes (green: correctresponses, yellow: selection errors, red: discrimination errors). PITd activityduring hits (green) is higher when the target is inside the RF than outside, butthe opposite is the case during selection errors (yellow). The pattern of activityduring selection errors is inverted relative to the one during hits, suggesting aswitch in the focus of attention, and it shows a weaker differentiation, implyingreduced attentional intensity. Activity patterns during discrimination errors(red), in contrast, exhibit greatly reduced (and insignificant) differentiation. (B)Time-resolved Kruskal–Wallis test results for 4 pairwise comparisons (Right).Colored stars at the top denote significance at P < 0.01. T, target; D, distractor.
Fig. 4. Generality of attentional effects in PITd. (A, Left) Attentive motiondetection task requiring subjects to detect a CME in a stream of random dotmotion on target surface (Methods). (A, Right) Population PSTH of all cells(n = 130) tested in this paradigm. Strength and time course of attentionalmodulation are similar to those in the motion discrimination task (Fig. 2A).(B, Left) Attentive color discrimination task requiring discrimination of a PCEon target surface (Methods). (B, Right) Population PSTH of all cells (n = 78)tested in this paradigm. (C) Scatter plots of AIs of all cells (n = 58) measuredacross all 3 attention paradigms. Correlation coefficients are shown in theupper right corner. The patterns of attentional modulation were highlycorrelated across the 3 paradigms.
Stemmann and Freiwald PNAS | November 19, 2019 | vol. 116 | no. 47 | 23801
NEU
ROSC
IENCE
Dow
nloa
ded
by g
uest
on
Janu
ary
26, 2
020
possess close links to oculomotor function (4, 33–35). Yet, whenattention needs to be dissociated from action planning, an areadevoid of these links would become important. PITd, more thanLIP or FEF, is strategically positioned to gather and utilize in-formation represented nearby on object shape (17, 28) and color(36), thus meeting a final criterion for an attentional priority map(21). Area PITd could use this property to support feature in-tegration (27) or object-based attention (37–39).PITd’s involvement in a motion-processing task provided a
puzzle (13). Motion processing is a classical function of the dorsalstream (14, 15), and thus, the involvement of PITd seemed curious(13, 40). Had we conducted a shape-processing or color discrimi-nation task during our initial fMRI experiments, the observation ofattentional modulation in PITd would not have been surprising(41, 42). An alternative account of dorsal and ventral streams,however, posits that fine feature discrimination is a function of theventral stream (43, 44). In this framework, the involvement ofPITd was less surprising but would require a representation ofmotion direction in PITd, which we did not find. Area PITd, werecently found, is directly connected to classical dorsal attentioncontrol areas LIP and PITd (45). The functional characteristicsthat we describe here for PITd show that, in many ways, it re-
sembles these dorsal-stream areas more than of neighboringtemporal lobe areas, like the face patches. The findings presentedhere thus force a network-oriented way of thinking about neuralinformation processing and a rethinking of old concepts aboutdorsal and ventral streams (14) and the interactions of parietal andtemporal lobes in the control of attentional function (46–49). It istempting to speculate in this context that area PITd might serve torelay gaze-selective signals from a nearby (or possibly even over-lapping) temporal lobe area (50, 51) into parietal area LIP (52),thus mediating gaze-following behavior (52, 53) and possibly,joint attention (54).The finding of an attentional priority map ininferotemporal cortex with properties more similar to parietal andprefrontal brain regions than neighboring shape-selective areasforces a rethinking of the functional organization of the primatebrain. While temporal and parietal functions are often seen asemerging in parallel through separate processing streams, PITdmight be connected directly to LIP and FEF to coordinate thefocus of attention, implying an orthogonal scheme of organiza-tional that integrates functions across streams and cortical lobes.Furthermore, a lesion to the human PITd homolog (55), our resultspredict, would cause functional deficits other than visual agnosia, themain deficit of temporal lobe lesions, but of attentional control.
A
B D
C E
Fig. 6. Artificial activation of PITd affects behavior. (A) Schematic of microstimulation logic. If neural activity in ipsi- and contralateral PITd (Lower) de-termines the focus of attention (yellow), then artificial activation (Right) of an otherwise weakly active PITd could thus switch the focus of attention into thatregion’s population RF (dotted square). (B and C) Behavioral outcomes when attention was paid inside (B) vs. outside (C) the RF without microstimulation(Upper Right) and with microstimulation (Lower Right) as pie charts. Details are in the text and SI Appendix. (D and E) Time courses of microstimulationeffects. Color conventions are the same as in B and C (circles: data points without, triangles: data points with electrical stimulation, solid lines: exponentialfits). Initially, right after stimulus onset, microstimulation effects are strongest: stimulation inside the RF improves attention to the point that otherwiseprominent detection failures are almost eliminated (D), and stimulation outside the RF causes a higher fraction of selection errors than of hits (E). Effec-tiveness of microstimulation diminishes exponentially with time.
23802 | www.pnas.org/cgi/doi/10.1073/pnas.1821866116 Stemmann and Freiwald
Dow
nloa
ded
by g
uest
on
Janu
ary
26, 2
020

MethodsAll animal procedures conformed to the National Research Council’s Guidefor the Care and Use of Laboratory Animals (56) regulations for the welfareof experimental animals issued by the Federal Government of Germany andwere in accordance with the guidelines of the Caltech Institutional AnimalCare and Use Committee. In brief, 2 rhesus monkeys, in which area PITd hadbeen localized with fMRI during the performance of an attentive motiondiscrimination task, performed several attention and fixation tasks duringelectrophysiological recordings to determine basic response properties ofPITd neurons and their role in selective visual attention. Recording experi-ments were then combined with electrical microstimulation to determinethe causal role of PITd in attentive motion discrimination.
Subjects and Surgical Procedures. Two male rhesus monkeys (Macaca mulatta,6 to 10 kg) were used in this study. Animals were implanted with an MR-compatible plastic head post (Ultem; General Electric Plastics) and recordingchamber (Crist Instruments) attached to the skull by ceramic screws (zirco-nium oxide; Thomas Recording) and dental cement. All procedure followedstandard anesthetic, aseptic, and postoperative treatment protocols de-scribed in detail in refs. 57 and 58.
Visual Stimulation and Tasks. Each recording day, a varnish-coated electrode(FHC Inc., 0.5- to 20-MΩ impedance) was lowered into PITd through a guidetube held in place by an fMRI-compatible recording grid (Crist Instruments).The electrode location of different guide tube positions was verified byacquiring a structural MRI before recording started. The sequence of grayand white matter passages and passages through sulci were monitoredonline and documented each day. All visual stimuli were generated, andbehavior was controlled by a custom-made software (Visiko) running on aWindows computer system. Monkeys viewed stimuli on a CRT monitor(Iiyama HM204 DT A, 22 inches, eye-screen distance 83 cm) with a refreshrate of 100 Hz. An identical monitor was used for the experimenter tocontrol and manually determine location and size of stimuli and RFs outsidethe recording room. All electrophysiological data as well as eye-positiondata (Iscan, Inc.) and behavioral markers from the presentation systemwere recorded with a data acquisition system (MAP; Plexon Inc.); behavioraland visual presentation data were stored in a Visiko log file.
When the target area in PITd was reached, location and size of the RF weremanually identified with the help of amanually controlled white bar stimulus(59). Bar position and orientation were controlled by a computer mouse.PITd neurons responded vigorously to the bar stimulus inside their RF. AfterRF location was determined, stimuli for subsequent experiments were ad-justed: in attention experiments, one stimulus was presented inside the RF,while the other was positioned at equal eccentricity rotated by 180° aroundthe central fixation spot. On a typical day, data were recorded at eachelectrode location first for the main attention tasks (motion discriminationtask I and motion detection task in an interleaved fashion; see below), ifapplicable for the color attention task, and subsequently, if recording sta-bility allowed for it, for 2 different shape-tuning tasks and an automated RFmapping procedure. On average, it was possible to record from 2 to 3 dif-ferent recording positions each day for an approximate duration of 40 to50 min per site. For some recording sites, the whole set of paradigms couldnot be completed due to lack of recording stability or because the subjectmonkey chose to terminate the experiment. On days with electrical micro-stimulation, data from the motion discrimination task were recorded beforeand after the electrical stimulation session. If possible, characterization ofrecording/stimulation site with shape tuning and RF mapping was attemptedbefore and after microstimulation.
In all tasks, monkeys were required to keep fixation inside a central fix-ation window 1.5° and 1.75° of visual angle wide for monkeys Q and M,respectively, and 2.0° and 2.75° of visual angle high for monkeys Qand M, respectively.Motion discrimination task I. The main task, an attentive motion-tracking task,required subjects to foveate a central fixation spot (FP; 0.25° diameter) whilecovertly paying attention to 1 of 2 peripheral RDSs. The target surface wascued by the direction of a short bar extending (0.35° × 0.60°) from the centerof the FP. One RDS was positioned inside the classical RF of a neuronmapped during a preceding fixation task, and the other was positioned atan equidistant position found by a 180° rotation around the FP. RDSs werecircular apertures optimized for the size of the RF under study. Dot densityof each surface was 6 dots per square degree of visual angle, and thetranslation velocity was 6°/s. RDS motion always occurred with 80% coherenceof all dots, while the other 20% moved in randomly assigned directions.Eye position of the animals was monitored by an infrared pupil-trackingsystem (ETL-200; ISCAN Inc.). RDSs randomly changed motion direction every
50 to 100 ms (brief motion events) in random multiples of 15° (drawn from aflat probability distribution). RDSs stopped changing their direction for up to500 or 800 ms (PME) in monkey Q and M, respectively, to be followed again byrapidly changing brief motion events. The PME occurred at a random point intime after at least 10 and at most 60 brief motion events independently intarget and distracter RDSs. Monkeys were required to pay attention to thetarget motion sequence to 1) detect the occurrence of the target PME and2) discriminate its motion direction. Monkeys had to report the direction ofthe PME by a saccade to 1 of 8 peripheral STs (0.2° radius annuli with a linethickness of 0.1°) positioned 10° from the fixation spot on the cardinal anddiagonal axes congruent with the motion direction of the PME. A trial wascompleted successfully if the animal initiated a saccade response within500 ms after target PME onset and if the saccade reached the correct ST di-rectly in less than 500 ms afterward. When gaze left the central fixationwindow, the 2 RDSs were switched off immediately. Successful completion ofa trial was rewarded with a drop of water or juice. Blocks of trials of activetask performance (A) were interleaved with blocks of fixation trials (F) duringwhich a fixation spot was presented on an otherwise blank screen, and monkeyswere rewarded for keeping fixation, and blocks of a passive task condition (P)with an overall stimulus configuration as in A, but no target was cued and noPMEs occurred, requiring central fixation. The sequence of blocks was repetitionof the sequence AFPF. Each active and passive task condition block consisted of6 successful trials interleaved by a 10-s block of fixation.Motion discrimination task II. For the microstimulation experiments, the motiondiscrimination task was changed in the following 2 ways: PMEs of target anddistracter RDSs were synchronized, and motion coherences were lowered to50% coherence. The first change served to provide 2 equivalent sources ofmotion information at the same time and thus, to allow for the behavioraldetermination of the RDS from which information had been selected (seebelow). The second change was made to make PME detection more difficultand thus, allow for the evaluation of the behavioral effect of micro-stimulation on detection performance (see below).Motion detection task. In the motion detection task, the brief (behaviorallyirrelevant) motion events of the RDSs were completely incoherent (i.e., all dotsmoved independently into randomly assigned motion directions). The oc-currence of the CME (10 to 25% coherence, chosen tomatch task performancelevel for this task with performance for the motion discrimination task) for upto 500 ms had to be detected and reported by a saccade onto the targetsurface. STswere absent in this paradigm, but all other spatial layout, temporalsequence of events, and all other task requirements were identical to those ofthemotion discrimination task. Themotion detection taskwas presented in aninterleaved fashion together with the motion discrimination task, whichresulted in a sequence of blocks with active motion discrimination (Adiscr),fixation only (F), a passive discrimination task condition (Pdiscr), and an activemotion detection (Adet) condition. Each Adiscr, Adet, and Pdiscr block con-sisted of 6 successfully completed trials, and each fixation block was 10 s long.The sequence of blocks was a repetition of [Adiscr F Adet F Pdiscr F].Color discrimination task. Spatial layout, temporal sequence, and overallstructure of the task were similar to the motion discrimination task, butmotion direction was replaced by hue as the task-relevant dimension. Dotsinside the RDs were presented statically with 0 motion, and dot density was6 dots per square degree of visual angle. The hue of the dots changed every80 ms until the color stopped changing for up to 1,500 ms (prolonged colorevent [PCE]) to be followed by rapid color changes. The color set consisted of24 hues, which had been selected from the CIELUV color space at uniformcolor-angle intervals. Colors were equiluminant (6 cd/m2). The occurrence ofthe PCE on the target surface had to be detected, and its color had to bediscriminated. The monkey had to indicate the color by a saccade to 1 of 4 STswith the matching color. STs were filled colored circles of 0.2° radius posi-tioned on the cardinal axes at 10° eccentricity. Blocks of active color dis-crimination (A) were interleaved with blocks of fixation (F) and blocks ofpassive task condition (P) with an overall stimulus configuration as in A, butno target was cued, and no PCE occurred, requiring central fixation. The se-quence of blocks was a repetition of [AFPF]. Monkey Q was trained on thecolor discrimination task, and recordings were taken from his area PITd.
In addition to the attention tasks, monkeys performed different fixationtasks that served to characterize spatial and shape selectivity of the neuronunder investigation. During performance of all fixation tasks, the monkeywas rewarded for keeping the gaze inside a central fixation window.RF mapping. Position and spatial extent of the RF were quantitatively assessedwith a sparsewhite noise reverse correlation technique (60). Awhite spot of 0.5°diameter was shown at pseudorandom positions for 300 ms without temporalgap. Possible locations for presentation were restricted to an area of 5° × 5° upto 10° × 10° around the position of maximal responses to a manually controlledwhite bar (59). This procedure took ∼5 to 10min of recording time. The borders
Stemmann and Freiwald PNAS | November 19, 2019 | vol. 116 | no. 47 | 23803
NEU
ROSC
IENCE
Dow
nloa
ded
by g
uest
on
Janu
ary
26, 2
020
of the hand-mapped RF were marked on a transparency on the stimulus con-trol monitor and served in the positioning of all subsequent experiments.Shape tuning I. The stimulus set comprised 96 gray-scale images: 16 humanfaces, 16 human hands, 16 human headless bodies, 16 fruits, 16 technicalgadgets, and 16 noise stimuli generated by phase scrambling from the gadgetimages (61). Pictures (size 5° × 5°) were shown at the center of the classicalRF as evaluated by hand mapping before. Each image was shown for 200 mswith an interstimulus gap of 100 ms between 2 successive stimuli up to10 times each. These stimuli have previously been used to describe shapeselectivity in the middle face patches (29), face areas located immediatelyadjacent to the attention-modulated part of PITd studied here (13).Shape tuning II. The stimulus set comprised 45 abstract and diverse stimuli,primarily those used by Hikosaka (17) in the first characterization of shapeselectivity in area PITd of the macaque monkey. Stimuli were a star, a triangle,a square, a shell shape, a hand, a face, a cross, a circle, 5 different checker-board stimuli with different spatial resolution (2, 4, 8, 10, and 12 cycles per 5°),and 32 binarized Gabor patches (inspired by ref. 62) with different spatialfrequencies (2, 3, and 12 cycles per 5°), 12 different orientations, and 2 dif-ferent degrees of curvature (straight and curved), all black and white. Stimuliwere shown at the center of the RF with a fixed size of 5° × 5° for 200 ms, withan interstimulus interval of 100 ms. While overall image sizes were identical,the overall number of black and white pixels differed somewhat betweenstimuli, thus potentially explaining some of the systematic response differ-ences between stimuli.
Electrophysiological Recordings. Electrophysiological recordings were guidedby structural and functional information on the location of attention-modulatedPITds in each animal following the approach described in ref. 29. In brief, sta-tistical parametric maps of the effect of covert spatial attention directed contra-vs. ipsilaterally during the attentive motion discrimination task obtained duringfMRI in each animal were computed and registered to a high-resolutionT1 volume of each animal (13). The recording cylinder was then implanted ata position and with a direction allowing electrodes to be safely advanced,avoiding vessels, into attention-modulated area PITd. Extracellular recordingswere conducted using single Tungsten electrodes (FHC Inc.; impedance ∼20 MΩat 1 kHz, advanced with a Narishige drive MO-95; Narishige Japan). Electricalactivity was amplified and filtered for action potential isolation with a band-pass filter at 300 to 8,000 Hz with a Plexon Multichannel Acquisition Processer(MAP) System. Spike waveforms were extracted using combinations ofamplitude-time window crossings (Plexon). Spike waveforms were reassessedoffline with spike-sorting software Offline-Sorter (Plexon).
Electrical Microstimulation. Electrical microstimulation was performed fol-lowing electrophysiological characterization of a given PITd site with astimulus isolator (A365; World Precision Instruments). Sequences of bipolarpulses (cathodal first), delivered at 200 Hz, were generated with a stimulatorunit (S88; Grass Technologies). Cathodal and anodal pulses (80 μA) lasted 200 μseach and were separated by a 100-μs gap. For these experiments, singleTungsten electrodes (FHC Inc.) with an impedance of ∼100 kΩ at 1 kHz wereused. A train of bipolar pulses was applied starting at 200 to 300 ms beforethe CME onset in monkey Q and 300 to 500 ms before CME onset in monkeyM and lasted 400 to 800 ms with a frequency of 200 Hz. Trials with electricalmicrostimulation were interleaved with trials without electrical micro-stimulation in a random fashion. The fraction of trials with electrical stimulationat a given site ranged from 30 to 40%.
Data Analysis. All analyses were done in MATLAB (Mathworks) and Statistica(Dell). Behavior was logged by the custom presentation software (Visiko) into atext file saved on the computer for offline analysis. The electrophysiologicaldata together with the eye data were recorded by the data acquisition system(Rasputin; Plexon Inc.). The clocks of both systems were aligned by sendingand recording TTL (transistor–transistor logic) pulses from the presentationsystem to the data acquisition system, and the information was merged in afirst step and checked for consistency.RF mapping. For each stimulus position, the mean firing rate across repeatedpresentationwas calculated using a temporal window from50 to 150ms afterstimulus onset. Firing rates were interpolated to a rectangular grid using aradial basis function interpolation and smoothedwith a Gaussian kernel (2° full
width at half maximum). We then fit a 2-dimensional Gaussian to the mapswith 7 free parameters (scale, rotation, width [σx], height [σy], and offsets inx, y, and z directions). Successful fits (81 of 91 maps) were then used to de-termine RF eccentricity, size (π × σx × σy), and center distance in multiples ofSDs from the fixation point. In Fig. 3A, we marked the outline of the Gaussianencompassing 85% of the signal with blue curves at square root 2 times widthand height.Face and shape selectivity. For each stimulus category (faces, hands, fruitsgadgets, scrambled, bodies), themean firing rate acrossmultiple presentationswas calculated using a temporal window from 50 to 150 ms after stimulusonset. For each unit, a nonparametric 1-way ANOVA test was performed toassess significant modulation for stimuli in the stimulus set (P < 0.01). In ad-dition, the mean firing rate for each individual image was calculated overrepeated presentations.
To evaluate how selective neural responses for specific stimuli were, weadopted the pattern preference index (17) that indicates the number ofpatterns that evoked responses with intensities over half of that of themaximum response elicited by the best pattern.Direction and hue tuning. For each neuron recorded in themotion discriminationtask, motion direction-tuning curves were computed during active task per-formance aswell as during the passive task condition for successfully completedtrials only. For calculation of the tuning curve during presentation of the briefmotion events, firing rate in a time window from 50 ms to 200 ms after eachmotion direction onset was examined. For the prolonged motion event (PME)neural activity in a timewindow starting 50ms after PME onset until the end ofthe PME or until the end of fixation was considered. For each unit, a direction-tuning index was computed by subtracting the activity of the nonpreferreddirection from the activity of the preferred direction and a division by the sumof the 2 (pref − nonpref)/(pref + nonpref). Color-tuning curves were calculatedequivalently during performance of the color discrimination task.Attention tasks. For each single-unit activity and each multiunit activity,peristimulus time histograms (PSTHs) were calculated separately for each attentioncondition (i.e., attend in, attend out passive task condition and F with a bin sizeof 50 ms). AIs were calculated by the formula (activity attend IN − activityattend OUT)/(activity attend IN + activity attend OUT) for a time periodstarting 1,500 ms after stimulus onset until 3,500 ms after stimulus onset.Unless stated otherwise, PSTHs are calculated for the period of short motionevents excluding the PME.ROC analysis. In order to illustrate the ability of a binary classifier system topredict the spatial location of attention within individual trials based onthe neural activity in macaque area PITd, we used an ROC analysis. Onlysuccessfully completed trials (hits) were used for this analysis. Fitting of ageneralized linear model using the firing rate as predictor regression wasperformed on the neural responses of each unit using a binomial distri-bution. A time window of 320 ms was used, roughly corresponding to theaverage reaction time for both monkeys in this task. The response to bepredicted was either “attend inside RF” or “attend outside RF” hemifield.The starting time of the analysis window was varied from 1,500 ms beforethe behavioral relevant PME until 600 ms after in steps of 10 ms. Theresulting coefficient estimates were subsequently used to determine thefitted probabilities as scores for each trial individually. The ROC forthe classification of the attention state inside the RF by logistic regressionwas performed, and the AUC was calculated using standard built-in scriptsof Matlab.Behavioral analysis of microstimulation experiment. Analyses and results aredescribed in SI Appendix.
ACKNOWLEDGMENTS. We thank Michael Borisov for stimulus program-ming; Aurel Wannig, Pablo Polosecki, and Ilaria Sani for discussion; CasparSchwiedrzik for statistical advice; Aleksandra Nadolski, Nicole Schweers,Katrin Thoss, and Ramazani Hakizimana for technical support and animalcare; Doris Tsao for logistic support; and Oldenburg University’s Library(BIS) for providing space for manuscript writing. This work was supportedby German Ministry of Science Grant 01GO0506 (Bremen Center for Ad-vanced Imaging, CAI), National Science Foundation Grant BCS-1057006,and the New York Cell Foundation.
1. M. M. Chun, J. M. Wolfe, “Visual attention” in Blackwell Handbook of Perception,B. Goldstein, Ed. (Blackwell Publishers Ltd., Oxford, UK, 2001), pp. 272–310.
2. S. Kastner, L. G. Ungerleider, Mechanisms of visual attention in the human cortex.Annu. Rev. Neurosci. 23, 315–341 (2000).
3. E. Wojciulik, N. Kanwisher, The generality of parietal involvement in visual attention.Neuron 23, 747–764 (1999).
4. T. Moore, K. M. Armstrong, M. Fallah, Visuomotor origins of covert spatial attention.Neuron 40, 671–683 (2003).
5. C. L. Colby, M. E. Goldberg, Space and attention in parietal cortex. Annu. Rev. Neurosci.22, 319–349 (1999).
6. T. Moore, M. Zirnsak, Neural mechanisms of selective visual attention. Annu. Rev.Psychol. 68, 47–72 (2017).
23804 | www.pnas.org/cgi/doi/10.1073/pnas.1821866116 Stemmann and Freiwald
Dow
nloa
ded
by g
uest
on
Janu
ary
26, 2
020
7. M. Ito, C. D. Gilbert, Attention modulates contextual influences in the primary visualcortex of alert monkeys. Neuron 22, 593–604 (1999).
8. C. J. McAdams, J. H. R. Maunsell, Attention to both space and feature modulatesneuronal responses in macaque area V4. J. Neurophysiol. 83, 1751–1755 (2000).
9. J. Moran, R. Desimone, Selective attention gates visual processing in the extrastriatecortex. Science 229, 782–784 (1985).
10. T. Moore, K. M. Armstrong, Selective gating of visual signals by microstimulation offrontal cortex. Nature 421, 370–373 (2003).
11. Y. B. Saalmann, I. N. Pigarev, T. R. Vidyasagar, Neural mechanisms of visual attention:How top-down feedback highlights relevant locations. Science 316, 1612–1615 (2007).
12. G. G. Gregoriou, S. J. Gotts, H. Zhou, R. Desimone, High-frequency, long-range couplingbetween prefrontal and visual cortex during attention. Science 324, 1207–1210 (2009).
13. H. Stemmann, W. A. Freiwald, Attentive motion discrimination recruits an area ininferotemporal cortex. J. Neurosci. 36, 11918–11928 (2016).
14. D. J. Kravitz, K. S. Saleem, C. I. Baker, L. G. Ungerleider, M. Mishkin, The ventral visualpathway: An expanded neural framework for the processing of object quality. TrendsCogn. Sci. 17, 26–49 (2013).
15. L. G. Ungerleider, M. Mishkin, “Two cortical visual systems” in Analysis of VisualBehavior, D. J. Ingle, M. A. Goodale, R. J. W. Mansfield, Eds. (MIT Press, Cambridge,MA, 1982), pp. 549–586.
16. D. J. Felleman, D. C. Van Essen, Distributed hierarchical processing in the primatecerebral cortex. Cereb. Cortex 1, 1–47 (1991).
17. K. Hikosaka, Responsiveness of neurons in the posterior inferotemporal cortex tovisual patterns in the macaque monkey. Behav. Brain Res. 89, 275–283 (1997).
18. K. Hikosaka, Representation of foveal visual fields in the ventral bank of the superiortemporal sulcus in the posterior inferotemporal cortex of the macaque monkey.Behav. Brain Res. 96, 101–113 (1998).
19. S. Treue, J. H. R. Maunsell, Attentional modulation of visual motion processing incortical areas MT and MST. Nature 382, 539–541 (1996).
20. R. Desimone, J. Duncan, Neural mechanisms of selective visual attention. Annu. Rev.Neurosci. 18, 193–222 (1995).
21. J. H. Fecteau, D. P. Munoz, Salience, relevance, and firing: A priority map for targetselection. Trends Cogn. Sci. 10, 382–390 (2006).
22. C. Koch, S. Ullman, Shifts in selective visual attention: Towards the underlying neuralcircuitry. Hum. Neurobiol. 4, 219–227 (1985).
23. E. Niebur, C. Koch, Control of selective visual attention: Modeling the “where”pathway. Adv. Neur. In 8, 802–808 (1996).
24. D. K. Lee, L. Itti, C. Koch, J. Braun, Attention activates winner-take-all competitionamong visual filters. Nat. Neurosci. 2, 375–381 (1999).
25. A. E. Ipata, A. L. Gee, J. W. Bisley, M. E. Goldberg, Neurons in the lateral intraparietalarea create a priority map by the combination of disparate signals. Exp. Brain Res.192, 479–488 (2009).
26. J. W. Bisley, K. Mirpour, The neural instantiation of a priority map. Curr. Opin. Psychol.29, 108–112 (2019).
27. A. M. Treisman, G. Gelade, A feature-integration theory of attention. Cognit. Psychol.12, 97–136 (1980).
28. K. Tanaka, Inferotemporal cortex and object vision. Annu. Rev. Neurosci. 19, 109–139(1996).
29. D. Y. Tsao, W. A. Freiwald, R. B. H. Tootell, M. S. Livingstone, A cortical region con-sisting entirely of face-selective cells. Science 311, 670–674 (2006).
30. D. Y. Tsao, S. Moeller, W. A. Freiwald, Comparing face patch systems in macaques andhumans. Proc. Natl. Acad. Sci. U.S.A. 105, 19514–19519 (2008).
31. E. B. Issa, J. J. DiCarlo, Precedence of the eye region in neural processing of faces.J. Neurosci. 32, 16666–16682 (2012).
32. C. D. Salzman, K. H. Britten, W. T. Newsome, Cortical microstimulation influencesperceptual judgements of motion direction. Nature 346, 174–177 (1990).
33. P. H. Schiller, E. J. Tehovnik, Neural mechanisms underlying target selection withsaccadic eye movements. Prog. Brain Res. 149, 157–171 (2005).
34. D. A. Robinson, A. F. Fuchs, Eye movements evoked by stimulation of frontal eyefields. J. Neurophysiol. 32, 637–648 (1969).
35. P. Mazzoni, R. M. Bracewell, S. Barash, R. A. Andersen, Motor intention activity in themacaque’s lateral intraparietal area. I. Dissociation of motor plan from sensorymemory. J. Neurophysiol. 76, 1439–1456 (1996).
36. B. R. Conway, S. Moeller, D. Y. Tsao, Specialized color modules in macaqueextrastriate cortex. Neuron 56, 560–573 (2007).
37. A. F. Kramer, T. A. Weber, S. E. Watson, Object-based attentional selection–Groupedarrays or spatially invariant representations?: Comment on vecera and Farah (1994).J. Exp. Psychol. Gen. 126, 3–13 (1997).
38. J. Duncan, Selective attention and the organization of visual information. J. Exp.Psychol. Gen. 113, 501–517 (1984).
39. A. Wannig, L. Stanisor, P. R. Roelfsema, Automatic spread of attentional responsemodulation along Gestalt criteria in primary visual cortex. Nat. Neurosci. 14, 1243–1244 (2011).
40. A. R. Bogadhi, A. Bollimunta, D. A. Leopold, R. J. Krauzlis, Brain regions modulatedduring covert visual attention in the macaque. Sci. Rep. 8, 15237 (2018).
41. N. Caspari, T. Janssens, D. Mantini, R. Vandenberghe, W. Vanduffel, Covert shifts ofspatial attention in the macaque monkey. J. Neurosci. 35, 7695–7714 (2015).
42. G. H. Patel et al., Functional evolution of new and expanded attention networks inhumans. Proc. Natl. Acad. Sci. U.S.A. 112, 9454–9459 (2015).
43. M. A. Goodale, A. D. Milner, Separate visual pathways for perception and action.Trends Neurosci. 15, 20–25 (1992).
44. G. Mirabella et al., Neurons in area V4 of the macaque translate attended visualfeatures into behaviorally relevant categories. Neuron 54, 303–318 (2007).
45. I. Sani, B. C. McPherson, H. Stemmann, F. Pestilli, W. A. Freiwald, Functionally definedwhite matter of the macaque monkey brain reveals a dorso-ventral attention net-work. eLife 8, e40520 (2019).
46. S. R. Friedman-Hill, L. C. Robertson, A. Treisman, Parietal contributions to visualfeature binding: Evidence from a patient with bilateral lesions. Science 269, 853–855(1995).
47. L. Robertson, A. Treisman, S. Friedman-Hill, M. Grabowecky, The interaction of spatial andobject pathways: Evidence from Balint’s syndrome. J. Cogn. Neurosci. 9, 295–317 (1997).
48. M. Corbetta, G. Patel, G. L. Shulman, The reorienting system of the human brain:From environment to theory of mind. Neuron 58, 306–324 (2008).
49. H. O. Karnath, S. Ferber, M. Himmelbach, Spatial awareness is a function of thetemporal not the posterior parietal lobe. Nature 411, 950–953 (2001).
50. K. Marciniak, A. Atabaki, P. W. Dicke, P. Thier, Disparate substrates for head gazefollowing and face perception in the monkey superior temporal sulcus. eLife 3,e03222 (2014).
51. A. Roy, S. V. Shepherd, M. L. Platt, Reversible inactivation of pSTS suppresses socialgaze following in the macaque (Macaca mulatta). Soc. Cogn. Affect. Neurosci. 9, 209–217 (2014).
52. S. V. Shepherd, J. T. Klein, R. O. Deaner, M. L. Platt, Mirroring of attention by neuronsin macaque parietal cortex. Proc. Natl. Acad. Sci. U.S.A. 106, 9489–9494 (2009).
53. R. O. Deaner, M. L. Platt, Reflexive social attention in monkeys and humans. Curr. Biol.13, 1609–1613 (2003).
54. N. J. Emery, E. N. Lorincz, D. I. Perrett, M. W. Oram, C. I. Baker, Gaze following and jointattention in rhesus monkeys (Macaca mulatta). J. Comp. Psychol. 111, 286–293 (1997).
55. H. Kolster, R. Peeters, G. A. Orban, The retinotopic organization of the human middletemporal area MT/V5 and its cortical neighbors. J. Neurosci. 30, 9801–9820 (2010).
56. National Research Council, Guide for the Care and Use of Laboratory Animals (Na-tional Academies Press, Washington, DC, ed. 8, 2011).
57. D. Wegener, W. A. Freiwald, A. K. Kreiter, The influence of sustained selective at-tention on stimulus selectivity in macaque visual area MT. J. Neurosci. 24, 6106–6114(2004).
58. C. Fisher, W. A. Freiwald, Contrasting specializations for facial motion within themacaque face-processing system. Curr. Biol. 25, 261–266 (2015).
59. D. H. Hubel, T. N. Wiesel, Receptive fields of single neurones in the cat’s striate cortex.J. Physiol. 148, 574–591 (1959).
60. M. S. Livingstone, C. C. Pack, R. T. Born, Two-dimensional substructure of MT receptivefields. Neuron 30, 781–793 (2001).
61. D. Y. Tsao, W. A. Freiwald, T. A. Knutsen, J. B. Mandeville, R. B. H. Tootell, Faces andobjects in macaque cerebral cortex. Nat. Neurosci. 6, 989–995 (2003).
62. J. L. Gallant, J. Braun, D. C. Van Essen, Selectivity for polar, hyperbolic, and Cartesiangratings in macaque visual cortex. Science 259, 100–103 (1993).
Stemmann and Freiwald PNAS | November 19, 2019 | vol. 116 | no. 47 | 23805
NEU
ROSC
IENCE
Dow
nloa
ded
by g
uest
on
Janu
ary
26, 2
020