Evidence Best Practices & Latest Research Presented by: Dr. Cary Heck University of Wyoming National...
54
Evidence Best Practices & Latest Research Presented by: Dr. Cary Heck University of Wyoming National Association of Drug Court Professionals Developed by: Douglas B. Marlowe, J.D., Ph.D. Shannon M. Carey, Ph.D. © Douglas Marlowe, May 10, 2012 The following presentation may not be copied in whole or in part without the written permission of the author or the National Drug Court Institute. Written permission will generally be given without cost, upon request.
-
Upload
neal-gavin-merritt -
Category
Documents
-
view
215 -
download
2
Transcript of Evidence Best Practices & Latest Research Presented by: Dr. Cary Heck University of Wyoming National...

Evidence Best Practices & Latest Research
Presented by:
Dr. Cary HeckUniversity of Wyoming
National Association of Drug Court Professionals
Developed by: Douglas B. Marlowe, J.D., Ph.D.
Shannon M. Carey, Ph.D.
© Douglas Marlowe, May 10, 2012
The following presentation may not be copied in whole or in part without the written permission of the author or the National Drug Court Institute.
Written permission will generally be given without cost, upon request.

“New” Findings/Issues
Recidivism Revisited
Substance Abuse Outcomes
Cost-Effectiveness Revisited
Service Delivery & Consumer Satisfaction
Best Practices Update
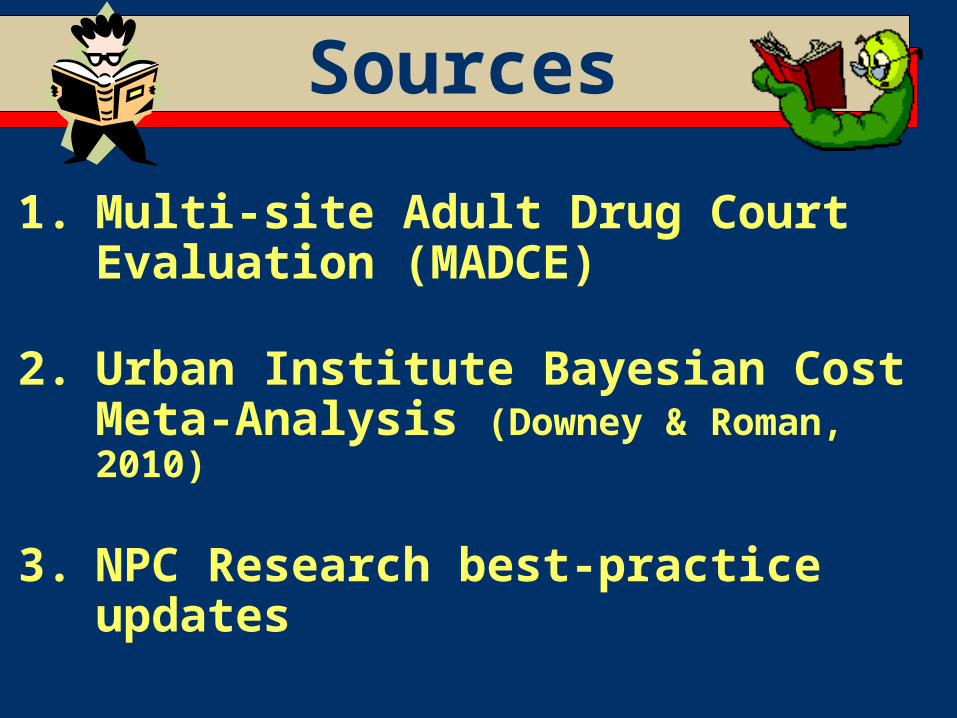
Sources
1. Multi-site Adult Drug Court Evaluation (MADCE)
2. Urban Institute Bayesian Cost Meta-Analysis (Downey & Roman, 2010)
3. NPC Research best-practice updates

Recidivism Revisited

URBAN INSTITUTEJustice Policy Center
Michael RempelCenter for Court Innovation([email protected])
With Shelli Rossman, John Roman, Christine Lindquist, Janine Zweig, Dana Kralstein, Mia Green, Kelli Henry, P. Mitchell Downey, and Jennifer Yahner
Presented to the Adult Drug Court Standards Core Working Group, National Drug Court Institute, Las Vegas, NV, December 11, 2010
Review of NIJ’s Multi-Site Adult Drug Court Evaluation
The views expressed are those of the authors and should not be attributed to The Urban Institute, its trustees, or its funders.

URBAN INSTITUTEJustice Policy Center
MADCE Research Design
Drug Court vs. Comparison Sites Drug Court: 23 sites in 7 regions (n = 1,156) Comparison: 6 sites in 4 regions (n = 625)
Repeated Measures Interviews at baseline, 6 months & 18 months Oral fluids drug test at 18 months Official recidivism records up to 24 months Cost-effectiveness
URBAN INSTITUTEJustice Policy Center
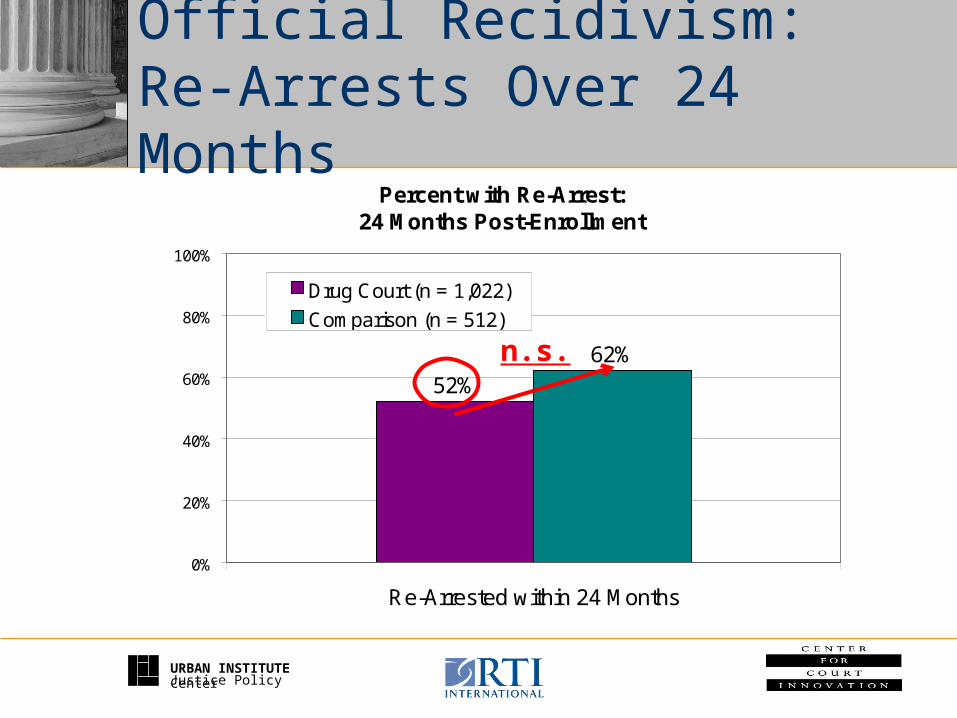
Official Recidivism:Re-Arrests Over 24 Months
Percent with Re-Arrest: 24 Months Post-Enrollment
52%
62%
0%
20%
40%
60%
80%
100%
Re-Arrested within 24 Months
Drug Court (n = 1,022)
Comparison (n = 512)
+ p < .10 * p < .05 ** p < .01 *** p < .001
n.s.

URBAN INSTITUTEJustice Policy Center
Criminal Behavior:Year Prior to 18-Month Interview
Percent with Criminal Activity:One Year Prior to 18-Month Interview
53% 50%
40%*36%**
0%
20%
40%
60%
80%
100%
Criminal Activity Drug-Related Activity
Drug Court (n = 951)Comparison (n = 523)
+ p < .10 * p < .05 ** p < .01 *** p < .001
URBAN INSTITUTEJustice Policy Center
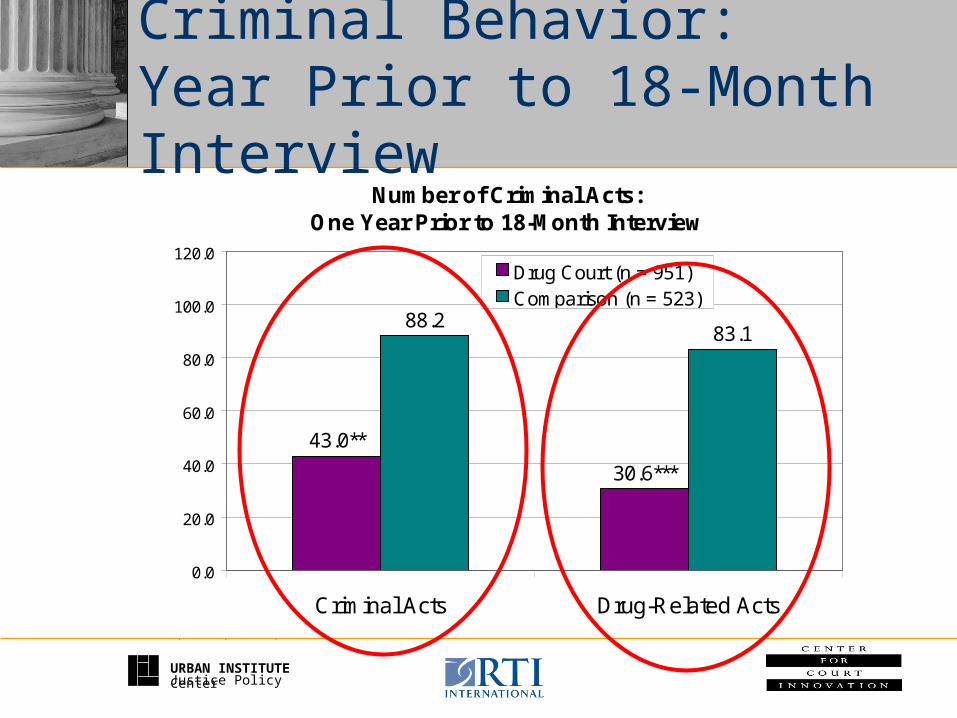
Criminal Behavior:Year Prior to 18-Month Interview
Number of Criminal Acts:One Year Prior to 18-Month Interview
88.283.1
30.6***
43.0**
0.0
20.0
40.0
60.0
80.0
100.0
120.0
Criminal Acts Drug-Related Acts
Drug Court (n = 951)Comparison (n = 523)
+ p < .10 * p < .05 ** p < .01 *** p < .001
URBAN INSTITUTEJustice Policy Center
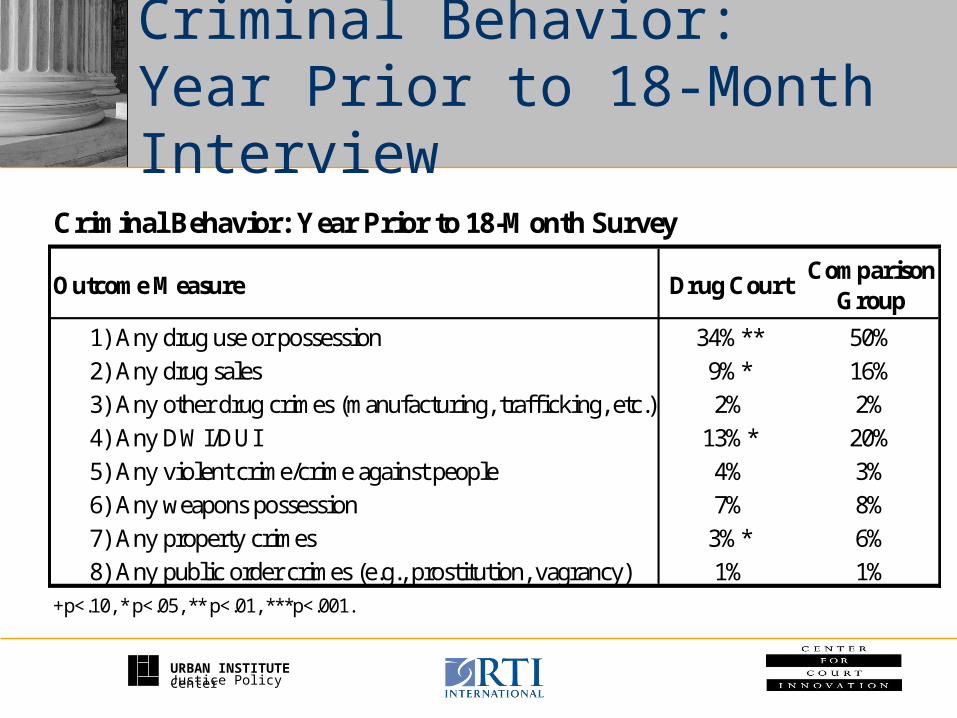
Criminal Behavior:Year Prior to 18-Month Interview
Criminal Behavior: Year Prior to 18-Month Survey
1) Any drug use or possession 34%** 50%
2) Any drug sales 9%* 16%
3) Any other drug crimes (manufacturing, trafficking, etc.) 2% 2%
4) Any DWI/DUI 13%* 20%
5) Any violent crime/crime against people 4% 3%
6) Any weapons possession 7% 8%
7) Any property crimes 3%* 6%
8) Any public order crimes (e.g., prostitution, vagrancy) 1% 1%+p<.10, * p<.05, ** p<.01, ***p<.001.
Drug CourtComparison
GroupOutcome Measure
URBAN INSTITUTEJustice Policy Center
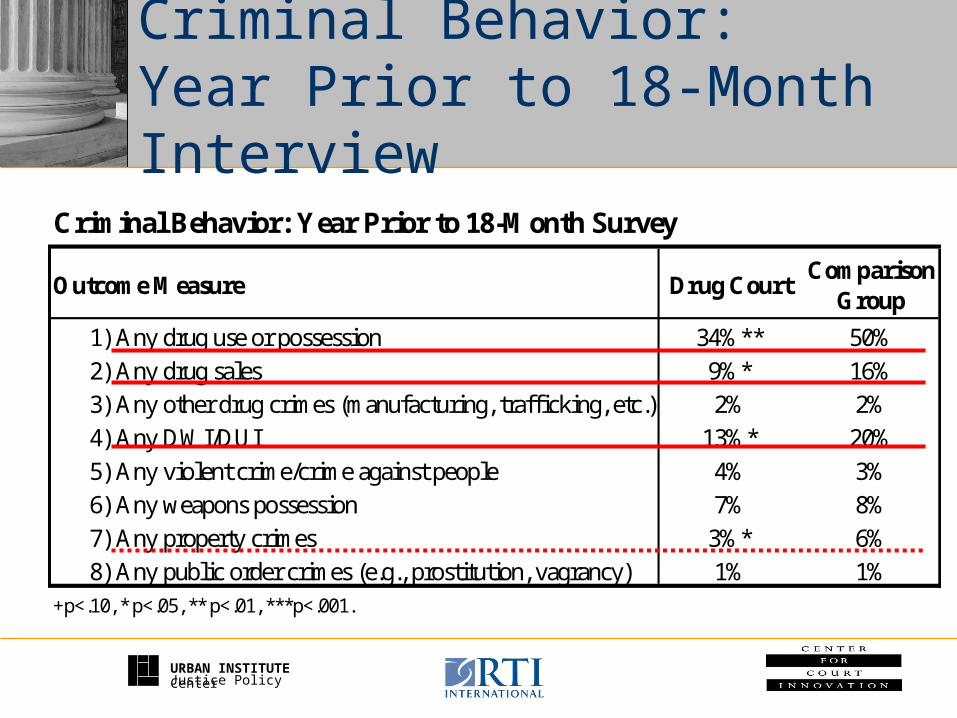
Criminal Behavior:Year Prior to 18-Month Interview
Criminal Behavior: Year Prior to 18-Month Survey
1) Any drug use or possession 34%** 50%
2) Any drug sales 9%* 16%
3) Any other drug crimes (manufacturing, trafficking, etc.) 2% 2%
4) Any DWI/DUI 13%* 20%
5) Any violent crime/crime against people 4% 3%
6) Any weapons possession 7% 8%
7) Any property crimes 3%* 6%
8) Any public order crimes (e.g., prostitution, vagrancy) 1% 1%+p<.10, * p<.05, ** p<.01, ***p<.001.
Drug CourtComparison
GroupOutcome Measure

URBAN INSTITUTEJustice Policy Center
Saliva Test Results at 18 Months
Any Drug Any Serious Drug
Marijuana Cocaine Opiates Amphet-amines
PCP0%
10%
20%
30%
40%
50%
29%**
20%
12%+15%
6%
1% 0%**
46%
27%
21% 21%
7%
2% 2%
Drug Court (N = 764)Comparison Group (N = 383)
+ p < .10, * p < .05, ** p < .01, *** p < .001.

Cost-Effectiveness Revisited

URBAN INSTITUTEJustice Policy Center
MADCE Cost Outcomes
Hierarchical Results (over the full follow-up)
Drug Court Control Net Benefits
Social Productivity $20,355 $18,361 $1,994
Criminal Justice - $4,869 - $5,863 $994
Crime/Victimization - $6,665 - $18,231 $11,566**
Service Use - $15,326 - $7,191 - $8,135**
Financial Support - $4,579 - $3,744 - $835
Total - $11,206 - $16,886 $5,680 n.s.
URBAN INSTITUTEJustice Policy Center
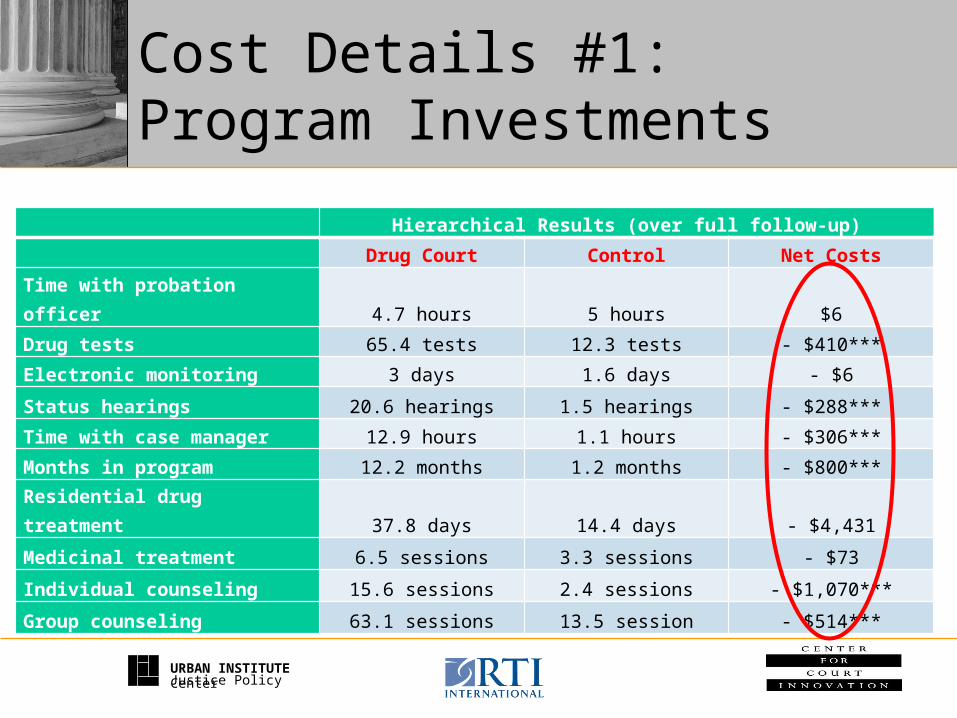
Cost Details #1:Program Investments
Hierarchical Results (over full follow-up)
Drug Court Control Net Costs
Time with probation officer 4.7 hours 5 hours $6
Drug tests 65.4 tests 12.3 tests - $410***
Electronic monitoring 3 days 1.6 days - $6
Status hearings 20.6 hearings 1.5 hearings - $288***
Time with case manager 12.9 hours 1.1 hours - $306***
Months in program 12.2 months 1.2 months - $800***
Residential drug treatment 37.8 days 14.4 days - $4,431
Medicinal treatment 6.5 sessions 3.3 sessions - $73
Individual counseling 15.6 sessions 2.4 sessions - $1,070***
Group counseling 63.1 sessions 13.5 session - $514***

Bayesian Meta-Analysis Data from Shaffer (2006) doctoral dissertation
> 80% of Drug Courts reduced crime
Avg. reduction in crime = 8% to 14%
85% of Drug Courts were cost-effective (i.e., had positive cost outcomes)
Only 14% of Drug Courts were cost-beneficial (i.e., cost outcomes exceeded expenditures)
60% of avoided crimes were “insignificant in nature” (i.e., drug, theft, trespassing and traffic offenses)
Best Drug Courts netted $23,000 per participant
(Downey & Roman, 2010)

Service Delivery & Participant Satisfaction

URBAN INSTITUTEJustice Policy Center
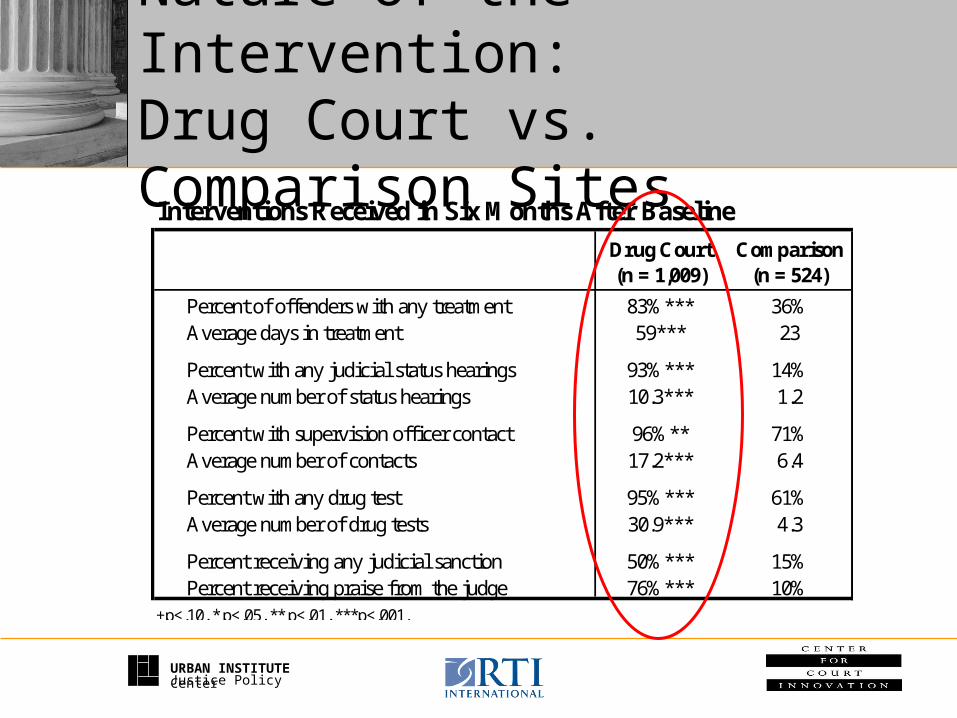
Nature of the Intervention:Drug Court vs. Comparison Sites
Interventions Received in Six Months After Baseline
Percent of offenders with any treatment 83%*** 36% Average days in treatment 59*** 23
Percent with any judicial status hearings 93%*** 14% Average number of status hearings 10.3*** 1.2
Percent with supervision officer contact 96%** 71% Average number of contacts 17.2*** 6.4
Percent with any drug test 95%*** 61% Average number of drug tests 30.9*** 4.3
Percent receiving any judicial sanction 50%*** 15% Percent receiving praise from the judge 76%*** 10%+p<.10, * p<.05, ** p<.01, ***p<.001.
Drug Court (n = 1,009)
Comparison (n = 524)
URBAN INSTITUTEJustice Policy Center
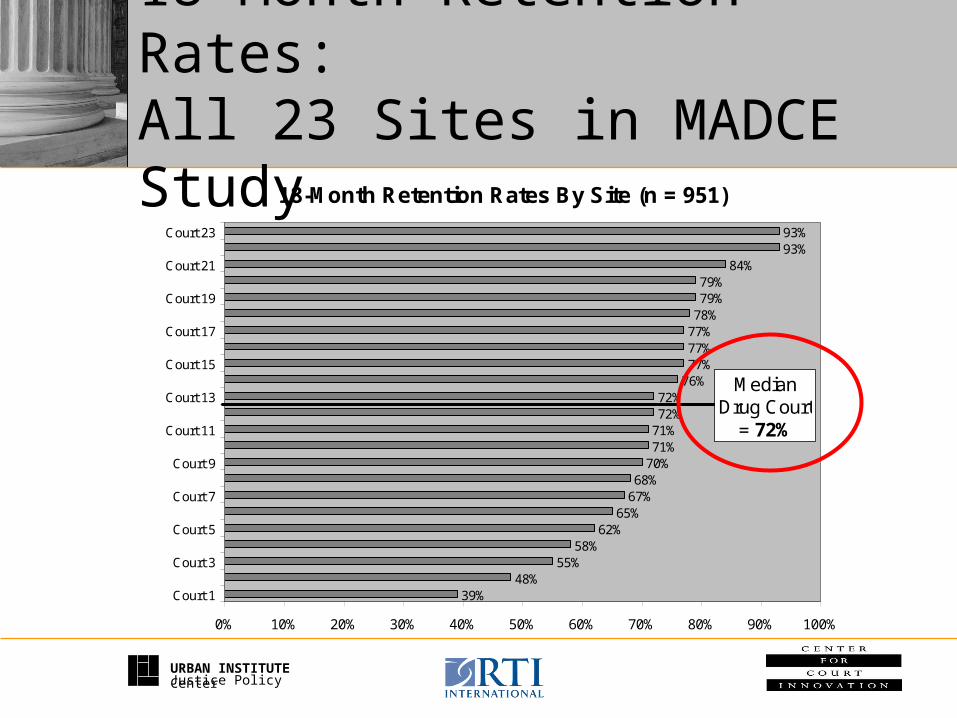
18-Month Retention Rates:All 23 Sites in MADCE Study
18-Month Retention Rates By Site (n = 951)
39%48%
55%58%
62%65%
67%68%
70%71%71%72%72%
76%77%77%77%78%79%79%
84%93%93%
0% 10% 20% 30% 40% 50% 60% 70% 80% 90% 100%
Court 1
Court 3
Court 5
Court 7
Court 9
Court 11
Court 13
Court 15
Court 17
Court 19
Court 21
Court 23
Median Drug Court
= 72%
URBAN INSTITUTEJustice Policy Center
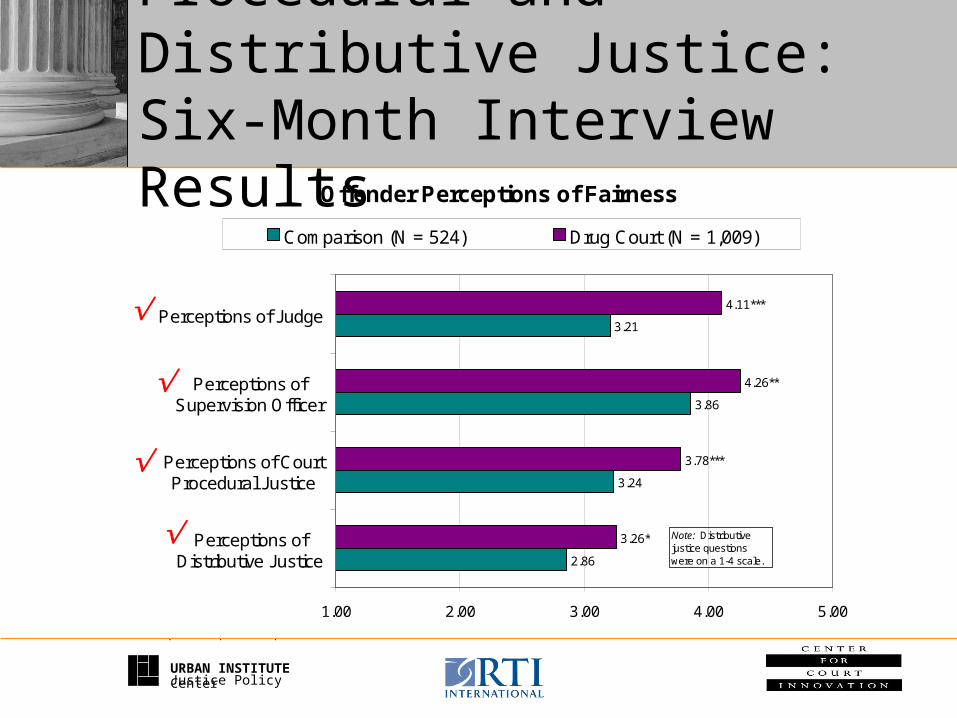
Procedural and Distributive Justice:Six-Month Interview Results
Offender Perceptions of Fairness
2.86
3.24
3.86
3.21
3.26*
3.78***
4.26**
4.11***
1.00 2.00 3.00 4.00 5.00
Perceptions ofDistributive Justice
Perceptions of CourtProcedural Justice
Perceptions ofSupervision Officer
Perceptions of Judge
Comparison (N = 524) Drug Court (N = 1,009)
* p < .05 ** p < .01 *** p < .001
Note: Distributive justice questions were on a 1-4 scale.
URBAN INSTITUTEJustice Policy Center
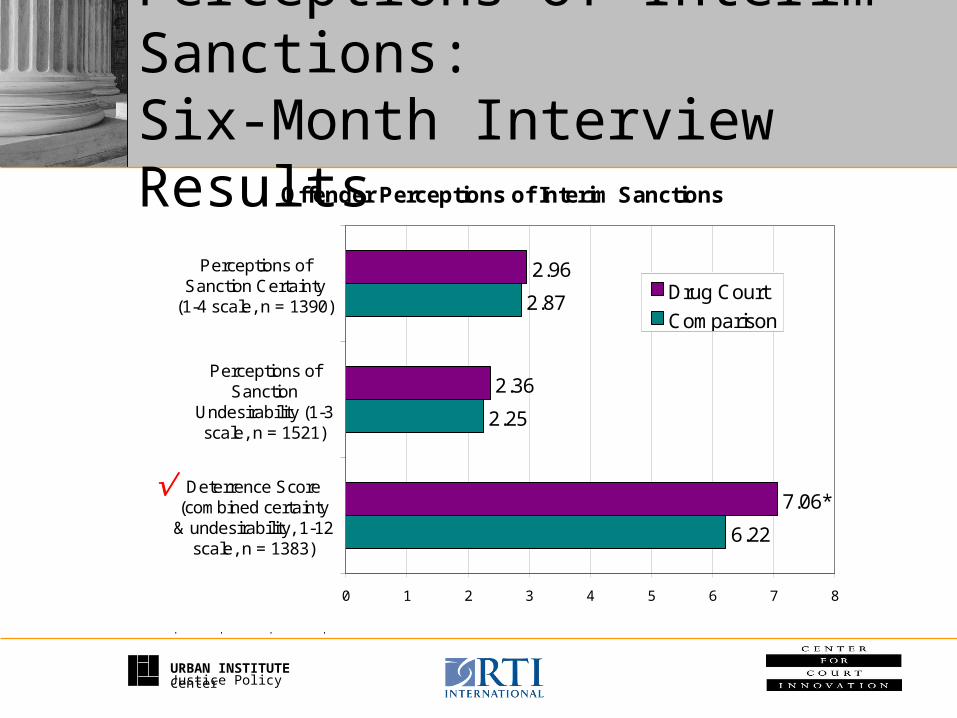
Perceptions of Interim Sanctions:Six-Month Interview Results
Offender Perceptions of Interim Sanctions
6.22
2.25
2.87
2.36
2.96
7.06*
0 1 2 3 4 5 6 7 8
Deterrence Score(combined certainty
& undesirability, 1-12scale, n = 1383)
Perceptions ofSanction
Undesirability (1-3scale, n = 1521)
Perceptions ofSanction Certainty
(1-4 scale, n = 1390)Drug Court
Comparison
+ p < .10 * p < .05 ** p < .01 *** p < .001
URBAN INSTITUTEJustice Policy Center
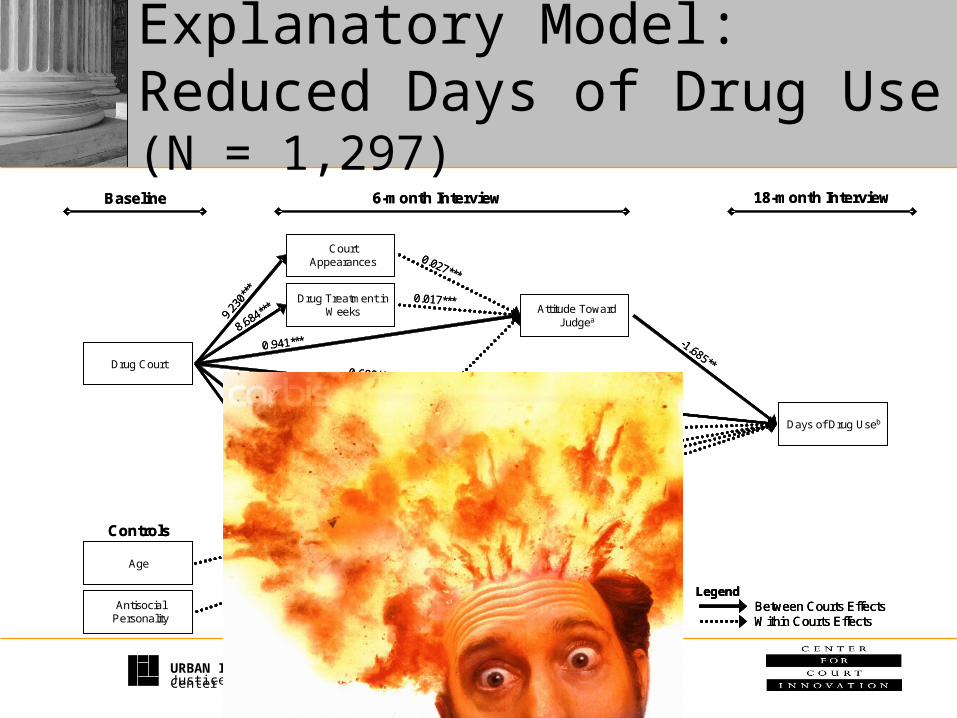
Explanatory Model: Reduced Days of Drug Use (N = 1,297)
LegendBetween Courts EffectsWithin Courts Effects
Days of Drug Useb
Attitude Toward Judgea
Drug Court
Age
Drug Tests
Sanctions
Antisocial Personality
Court Appearances
Drug Treatment in Weeks
18-month InterviewBaseline
Controls
-1.685**-0.608**
0.941***
-0.016*
0.494***
0.027***
-0.018***0.00
4*
0.017***
0.076**
9.23
0***
24.861***
8.684***
1.237***
6-month Interview
LegendBetween Courts EffectsWithin Courts Effects
LegendBetween Courts EffectsWithin Courts Effects
Days of Drug UsebDays of Drug Useb
Attitude Toward Judgea
Attitude Toward Judgea
Drug CourtDrug Court
AgeAge
Drug TestsDrug Tests
SanctionsSanctions
Antisocial PersonalityAntisocial
Personality
Court Appearances
Court Appearances
Drug Treatment in Weeks
Drug Treatment in Weeks
18-month InterviewBaseline
Controls
-1.685**-0.608**
0.941***
-0.016*
0.494***
0.027***
-0.018***0.00
4*
0.017***
0.076**
9.23
0***
24.861***
8.684***
1.237***
6-month Interview
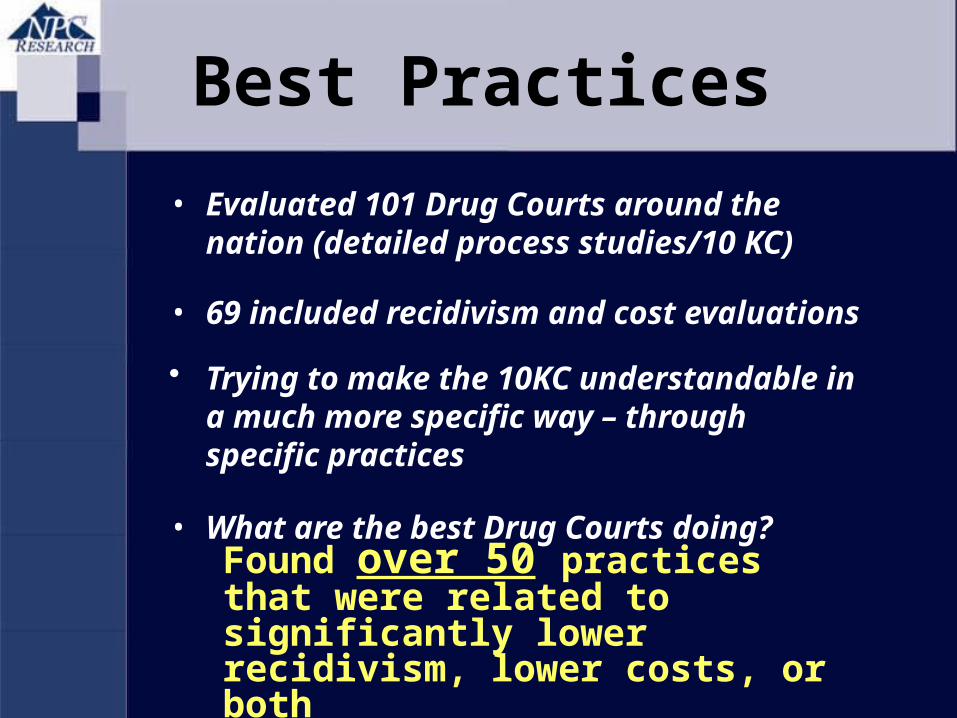
Found over 50 practices that were related to significantly lower recidivism, lower costs, or both
• Evaluated 101 Drug Courts around the nation (detailed process studies/10 KC)
• 69 included recidivism and cost evaluations
• What are the best Drug Courts doing?
Best Practices
• Trying to make the 10KC understandable in a much more specific way – through specific practices
Drug Court Top 10*Recidivism*
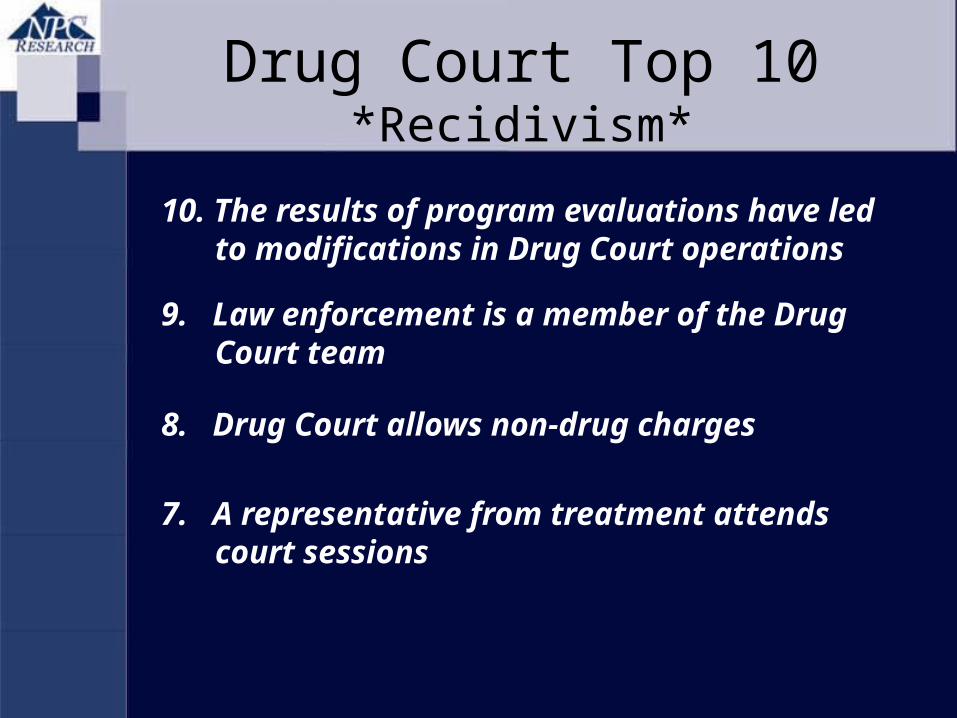
10. The results of program evaluations have led to modifications in Drug Court operations
Drug Court Top 10*Recidivism*
10. The results of program evaluations have led to modifications in Drug Court operations
9. Law enforcement is a member of the Drug Court team

Drug Court Top 10*Recidivism*
10. The results of program evaluations have led to modifications in Drug Court operations
9. Law enforcement is a member of the Drug Court team
8. Drug Court allows non-drug charges
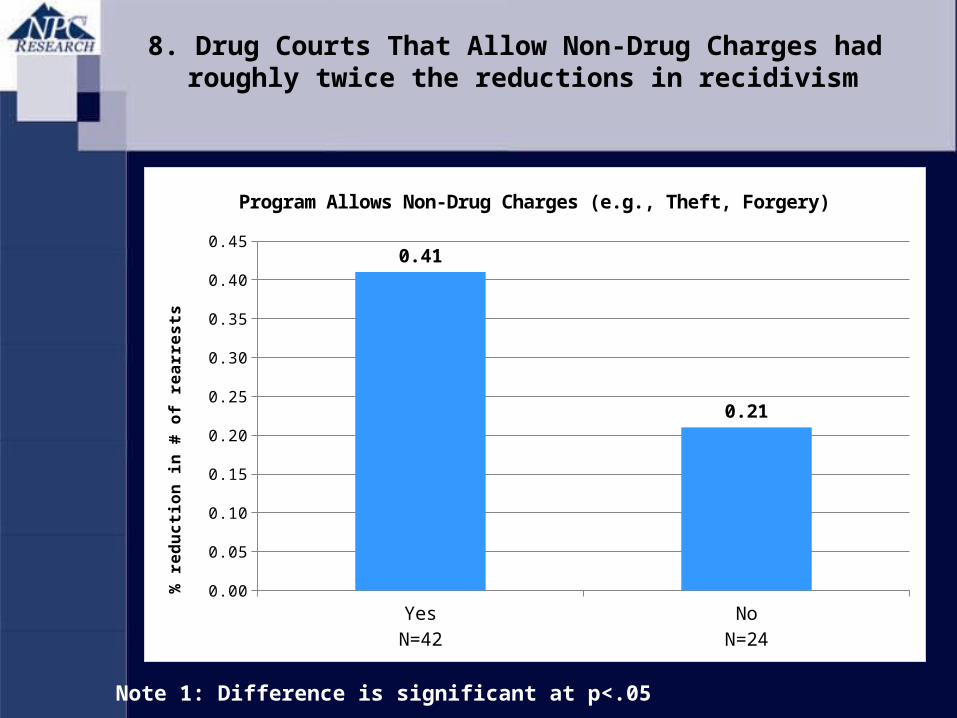
Note 1: Difference is significant at p<.05
8. Drug Courts That Allow Non-Drug Charges had roughly twice the reductions in recidivism
YesN=42
NoN=24
0.00
0.05
0.10
0.15
0.20
0.25
0.30
0.35
0.40
0.450.41
0.21
Program Allows Non-Drug Charges (e.g., Theft, Forgery)
% r
ed
uc
tio
n in
# o
f re
arr
es
ts
Drug Court Top 10*Recidivism*
10. The results of program evaluations have led to modifications in Drug Court operations
9. Law enforcement is a member of the Drug Court team
8. Drug Court allows non-drug charges
7. A representative from treatment attends court sessions

Drug Court Top 10*Recidivism*
10. The results of program evaluations have led to modifications in Drug Court operations
9. Law enforcement is a member of the Drug Court team
8. Drug Court allows non-drug charges
7. A representative from treatment attends court sessions
6. Review of the data/program stats has led to modifications in Drug Court operations
Drug Court Top 10*Recidivism*
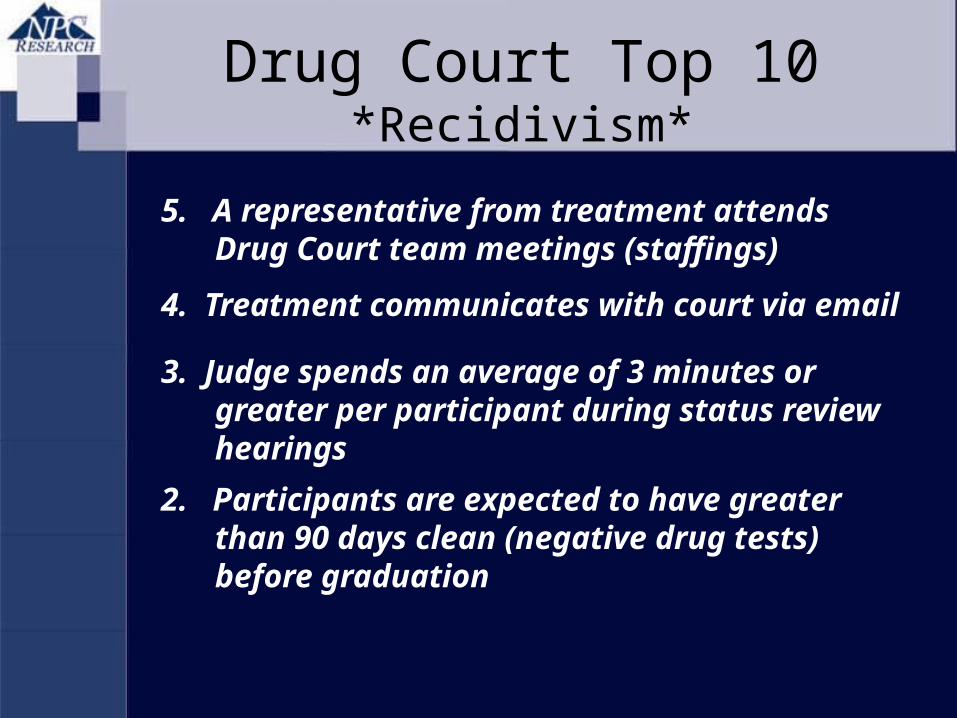
5. A representative from treatment attends Drug Court team meetings (staffings)
Drug Court Top 10*Recidivism*
5. A representative from treatment attends Drug Court team meetings (staffings)
4. Treatment communicates with court via email

Drug Court Top 10*Recidivism*
5. A representative from treatment attends Drug Court team meetings (staffings)
4. Treatment communicates with court via email
3. Judge spends an average of 3 minutes or greater per participant during status review hearings
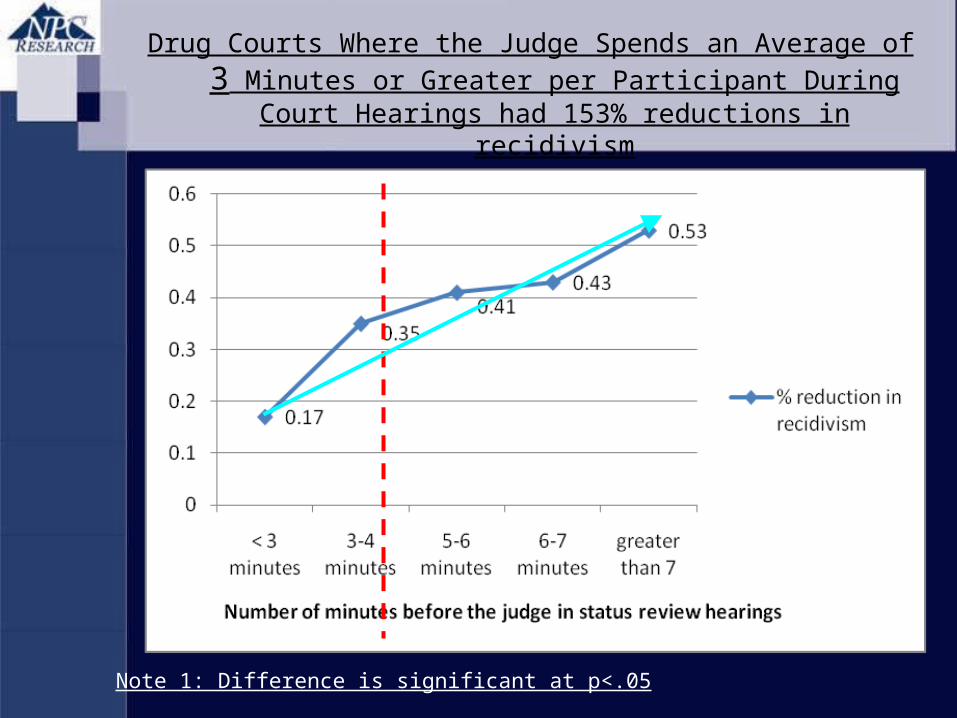
Note 1: Difference is significant at p<.05
Drug Courts Where the Judge Spends an Average of 3 Minutes or Greater per Participant During Court Hearings had 153%
reductions in recidivism
Drug Court Top 10*Recidivism*
5. A representative from treatment attends Drug Court team meetings (staffings)
4. Treatment communicates with court via email
3. Judge spends an average of 3 minutes or greater per participant during status review hearings
2. Participants are expected to have greater than 90 days clean (negative drug tests) before graduation
1. Program caseload (number of active participants) is less than 125

Note 1: Difference is significant at p<.05
1. Drug Courts with a Program Caseload (Number of Active Participants) of less than 125 had
567% reductions in recidivism

Note 1: Difference is significant at p<.05
Drug Courts with a Program Caseload (Number of Active
Participants) of less than 125 had
greater reductions in recidivism
Drug Court Top 10*Cost Savings*
10. In the first phase of Drug Court, drug tests are collected at least two times per week

Drug Court Top 10*Cost Savings*
9. Law enforcement attends court sessions
10. In the first phase of Drug Court, drug tests are collected at least two times per week

Drug Court Top 10*Cost Savings*
9. Law enforcement attends court sessions
8. Drug test results are back in 48 hours or less
10. In the first phase of Drug Court, drug tests are collected at least two times per week

Drug Court Top 10*Cost Savings*
9. Law enforcement attends court sessions
8. Drug test results are back in 48 hours or less
7. Team members are given a copy of the guidelines for sanctions
10. In the first phase of Drug Court, drug tests are collected at least two times per week

Drug Court Top 10*Cost Savings*
9. Law enforcement attends court sessions
8. Drug test results are back in 48 hours or less
7. Team members are given a copy of the guidelines for sanctions
6. A representative from treatment attends court sessions
10. In the first phase of Drug Court, drug tests are collected at least two times per week

Drug Court Top 10*Cost Savings*
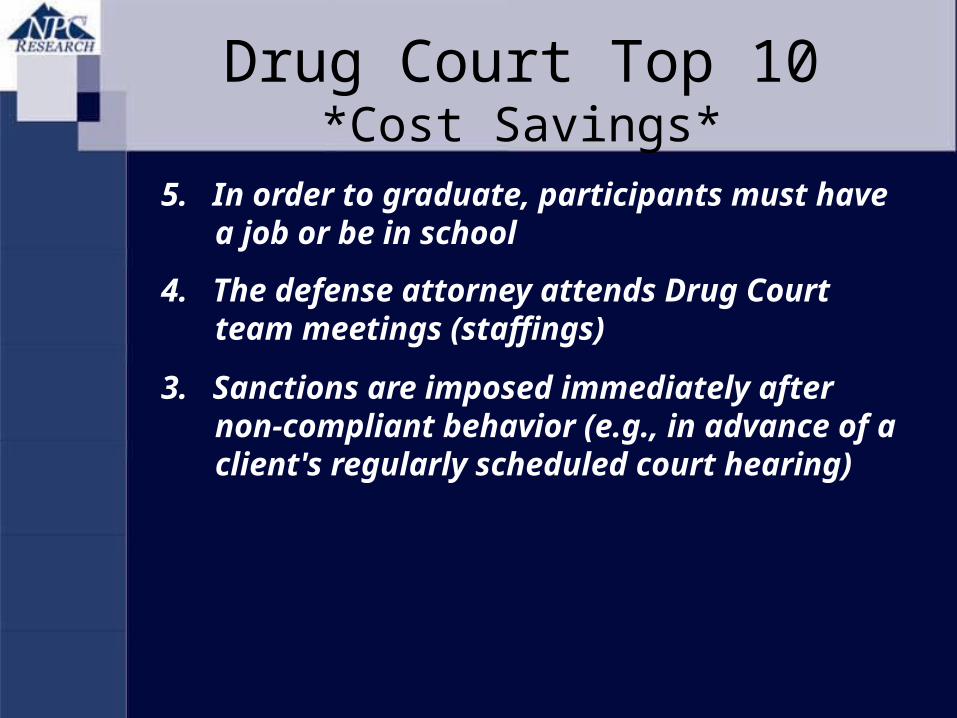
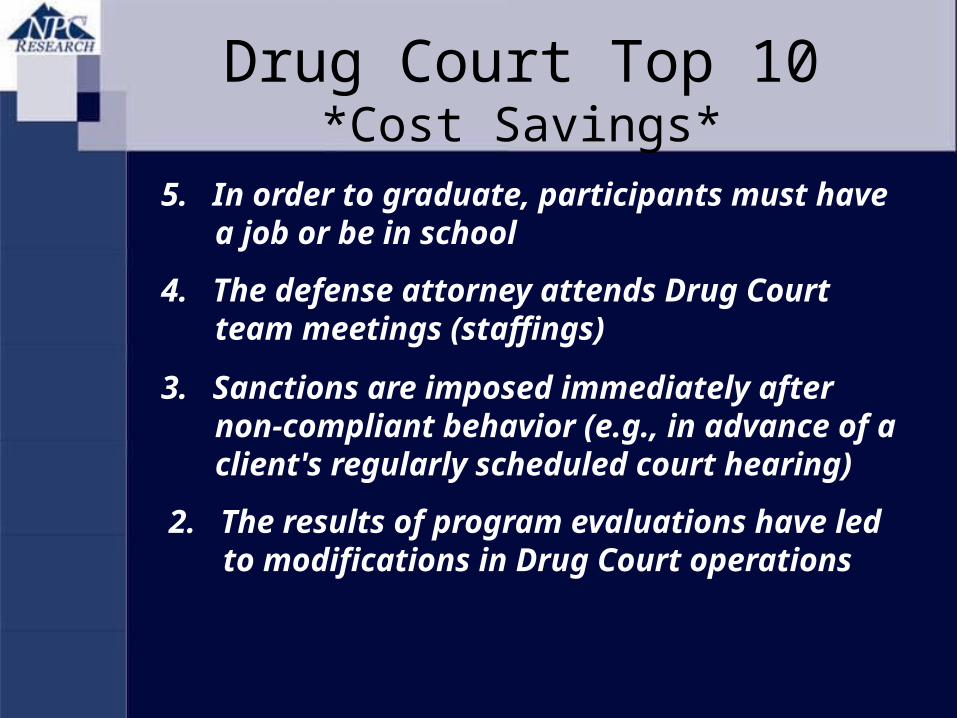
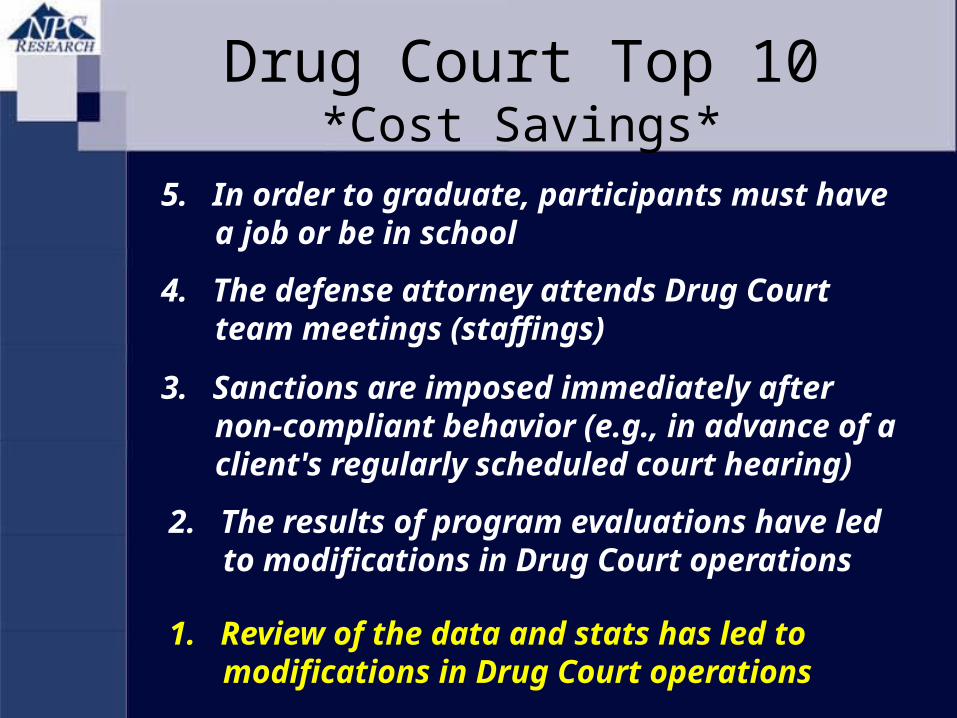
5. In order to graduate, participants must have a job or be in school

Note 1: Difference is significant at p<.05
5. Drug Courts Where in Order to Graduate Participants Must Have a Job or be in School had
a 83% Increase in Cost Savings

Drug Court Top 10*Cost Savings*
4. The defense attorney attends Drug Court team meetings (staffings)
5. In order to graduate, participants must have a job or be in school
Drug Court Top 10*Cost Savings*
4. The defense attorney attends Drug Court team meetings (staffings)
3. Sanctions are imposed immediately after non-compliant behavior (e.g., in advance of a client's regularly scheduled court hearing)
2. The results of program evaluations have led to modifications in Drug Court operations
1. Review of the data and stats has led to modifications in Drug Court operations
5. In order to graduate, participants must have a job or be in school

Drug Court Top 10Significant for both recidivism and cost
• Review of the data and stats has led to modifications in Drug Court operations
• The results of program evaluations have led to modifications in Drug Court operations
• A representative from treatment attends Drug Court appearances
*On both top 10 lists*

*Other practices of particular interest
Courts that typically impose jail longer than 6 days have worse (higher) recidivism

URBAN INSTITUTEJustice Policy Center
Drug Courts That Used One or Two Primary Treatment Agencies Had 76% Reductions in Recidivism
Note: Difference is significant at p<.05
1 2 3 4 4 - 10 > 10 0
0.1
0.2
0.3
0.4
0.5
0.6
0.7
Fewer treatment providers are related to greater reductions in recidivism
% reduction in recidiv...
Number of agencies
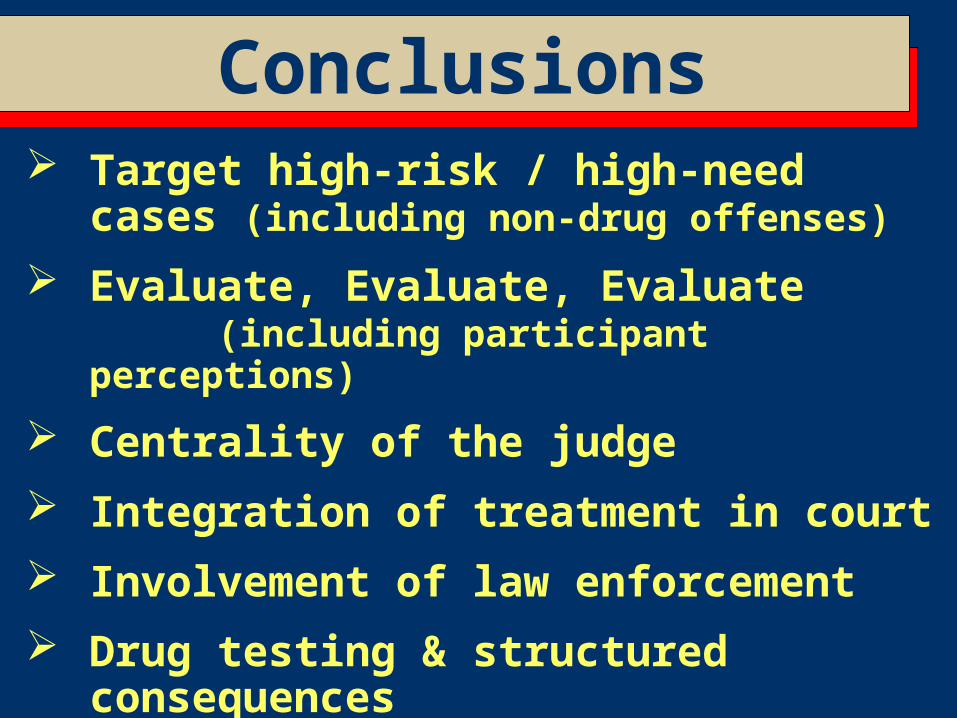
Conclusions Target high-risk / high-need cases
(including non-drug offenses)
Evaluate, Evaluate, Evaluate (including participant perceptions)
Centrality of the judge
Integration of treatment in court
Involvement of law enforcement
Drug testing & structured consequences
Ramp up services as you go to scale
Sponsor’s Note
This project was supported by Grant No. 2012-DC-BX-K004 awarded by the Bureau of Justice Assistance. The Bureau of Justice Assistance is a component of the Office of Justice Programs, which also includes the Bureau of Justice Statistics, the National Institute of Justice, the Office of Juvenile Justice and Delinquency Prevention, the SMART
Office, and the Office for Victims of Crime. Points of view or opinions in this document are those of the author and do not represent
the official position or policies of the United States Department of Justice