![Bascom AVR Programming [Basic]](https://static.fdocuments.in/doc/165x107/544a8b55b1af9f0f568b4d6d/bascom-avr-programming-basic.jpg)
Evidence-Based Glaucoma Therapy Paul Palmberg, MD, PhD Bascom Palmer Eye Institute, University of...
38
Evidence-Based Glaucoma Evidence-Based Glaucoma Therapy Therapy Paul Palmberg, MD, PhD Bascom Palmer Eye Institute, University of Miami What is the Role of Medical Therapy in Reaching Target Pressures? XIV Jornadas Dr. Benjamin Boyd Sociedad Panameña de Oftalmologia Panama, R.P. 2003
-
date post
18-Dec-2015 -
Category
Documents
-
view
212 -
download
0
Transcript of Evidence-Based Glaucoma Therapy Paul Palmberg, MD, PhD Bascom Palmer Eye Institute, University of...
Evidence-Based Glaucoma TherapyEvidence-Based Glaucoma Therapy
Paul Palmberg, MD, PhDBascom Palmer Eye Institute, University of Miami
What is the Role of Medical Therapy in Reaching Target Pressures?
XIV Jornadas Dr. Benjamin BoydSociedad Panameña de Oftalmologia
Panama, R.P. 2003
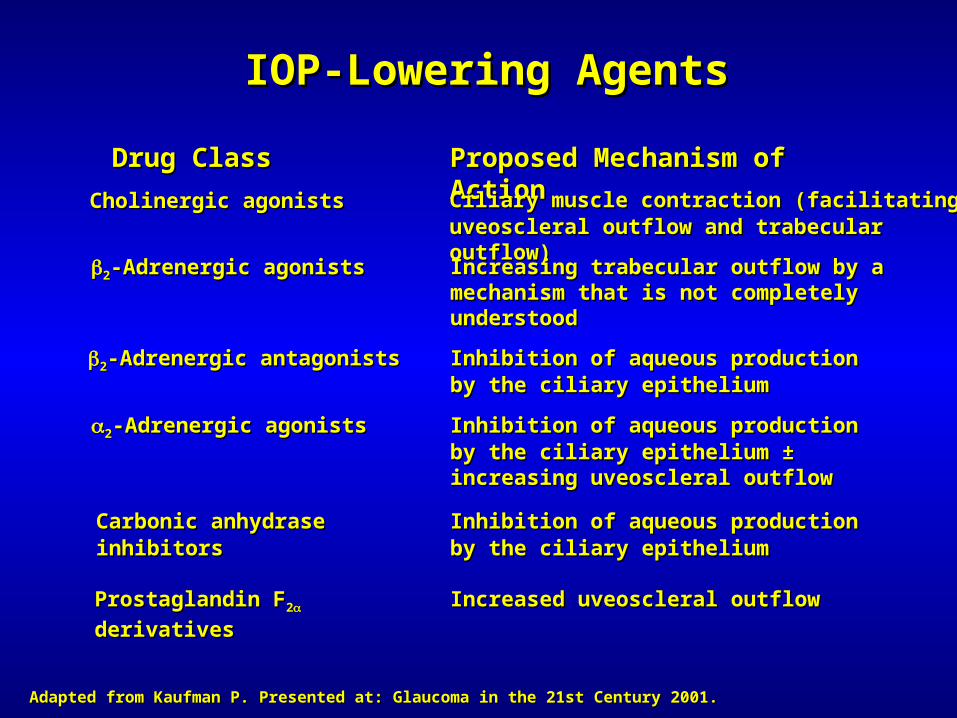
Drug ClassDrug Class Proposed Mechanism of ActionProposed Mechanism of Action
Cholinergic agonistsCholinergic agonists
22-Adrenergic agonists-Adrenergic agonists
22-Adrenergic antagonists-Adrenergic antagonists
22-Adrenergic agonists-Adrenergic agonists
Carbonic anhydrase Carbonic anhydrase inhibitorsinhibitors
Prostaglandin FProstaglandin F22
derivativesderivatives
Ciliary muscle contraction (facilitating Ciliary muscle contraction (facilitating uveoscleral outflow and trabecular outflow)uveoscleral outflow and trabecular outflow)
Inhibition of aqueous production Inhibition of aqueous production by the ciliary epitheliumby the ciliary epithelium
Inhibition of aqueous production Inhibition of aqueous production by the ciliary epithelium ± increasing by the ciliary epithelium ± increasing uveoscleral outflowuveoscleral outflow
Increased uveoscleral outflow Increased uveoscleral outflow
Increasing trabecular outflow by a Increasing trabecular outflow by a mechanism that is not completely mechanism that is not completely understoodunderstood
Inhibition of aqueous production Inhibition of aqueous production by the ciliary epitheliumby the ciliary epithelium
IOP-Lowering AgentsIOP-Lowering Agents
Adapted from Kaufman P. Presented at: Glaucoma in the 21st Century 2001.Adapted from Kaufman P. Presented at: Glaucoma in the 21st Century 2001.

Glaucoma Therapy June 2003Glaucoma Therapy June 2003
Ocular Hypertension Ocular Hypertension ((20% IOP reduction used, but lower better)20% IOP reduction used, but lower better)
Ocular Hypertension Treatment Study (OHTS) 2002Ocular Hypertension Treatment Study (OHTS) 2002
Mild, initial POAGMild, initial POAG (35% IOP reduction in CIGTS worked well)(35% IOP reduction in CIGTS worked well) Comparison of Initial Glaucoma Comparison of Initial Glaucoma Treatments Study (CIGTS) 2001 Early Manifest Treatments Study (CIGTS) 2001 Early Manifest Glaucoma Treatment Study (EMGTS) 2002Glaucoma Treatment Study (EMGTS) 2002
Normal Tension Glaucoma Normal Tension Glaucoma ((30% IOP reduction recommended)30% IOP reduction recommended) Collaborative Collaborative Normal Normal Tension Glaucoma Study (CNTGS) 1999Tension Glaucoma Study (CNTGS) 1999
Advanced POAGAdvanced POAG (35-50% reduction did best) (35-50% reduction did best) Advanced Glaucoma Intervention Study (AGIS) Advanced Glaucoma Intervention Study (AGIS) 2000 Antimetabolites in Filtering Surgery Study (AFSS) 20002000 Antimetabolites in Filtering Surgery Study (AFSS) 2000
Major Clinical Trials Demonstrated Better Outcomes at Lower Intraocular Pressures Than Previously Sought

Meta-Analysis of Multiple Trials (UK, Meta-Analysis of Multiple Trials (UK, Scandinavia and USA)Scandinavia and USA)
Percentage of patients reaching a specific target IOPPercentage of patients reaching a specific target IOP
Diurnal IOP at Latanoprost Timolol
end of treatment (n=398) (n=318) Odds ratio15 mm Hg 27 14
2.2*16 mm Hg 39 26
1.8*17 mm Hg 56 38
2.0*18 mm Hg 70 55
1.9*19 mm Hg 83 72
1.9*20 mm Hg 89 81
1.9**
**PP <0.001 (Pearson chi-square test) latanoprost vs timolol<0.001 (Pearson chi-square test) latanoprost vs timolol****PP <0.002 (Pearson chi-square test) latanoprost vs timolol<0.002 (Pearson chi-square test) latanoprost vs timolol
Pharmacia. Data on file.Pharmacia. Data on file.

Emmerich KH. Graefes Arch Clin Exp Ophthalmol. 2000;238:19-23.
Emmerich KH, et al. AAO, New Orleans, USA, 1998.
Diurnal IOP Reduction at 3 MonthsDiurnal IOP Reduction at 3 Months
Ch
ang
e in
IOP
Fro
m B
asel
ine
(mm
Hg
)(M
ean
± S
EM
)Latanoprost
(n=85)
Timolol +Dorzolamide
(n=90)
P=0.79
0
-1
-2
-3
-4
-5
-6
Least Square Means (ANCOVA)
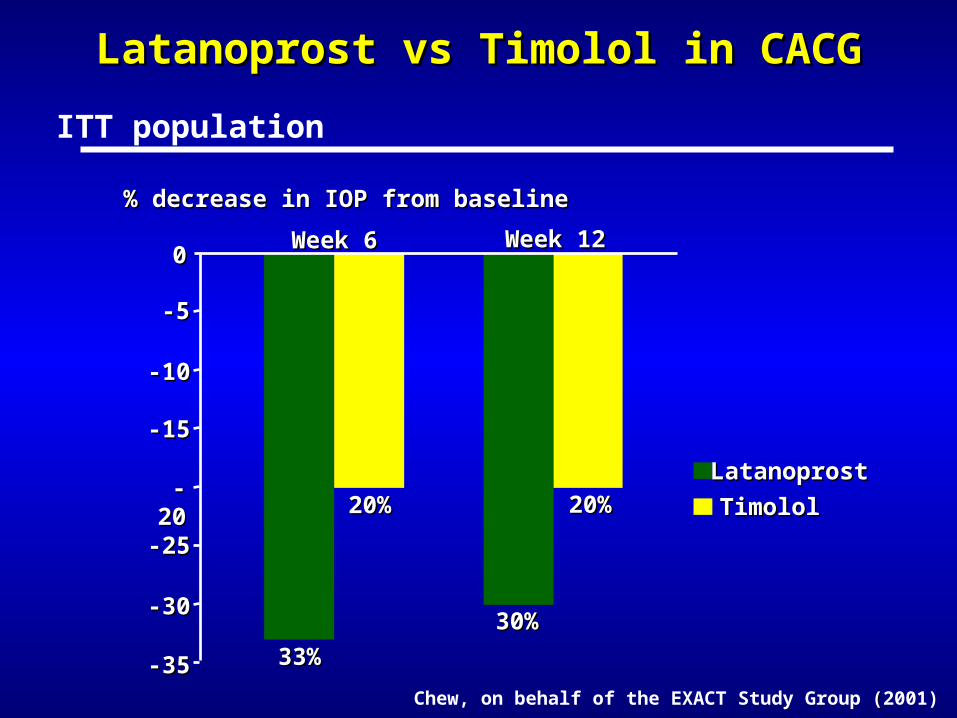
Latanoprost vs Timolol in CACGLatanoprost vs Timolol in CACG
% decrease in IOP from baseline% decrease in IOP from baseline
33%33%
30%30%
20%20% 20%20%
00
-5-5
-10-10
-15-15
-20-20
-25-25
-30-30
-35-35
Week 6Week 6 Week 12Week 12
LatanoprostLatanoprost
TimololTimolol
Chew, on behalf of the EXACT Study Group ((2001)
ITT population
0
10
20
30
40
50
60
70
80
15 16 17 18 19 20 21 >21
Latanoprost
Timolol
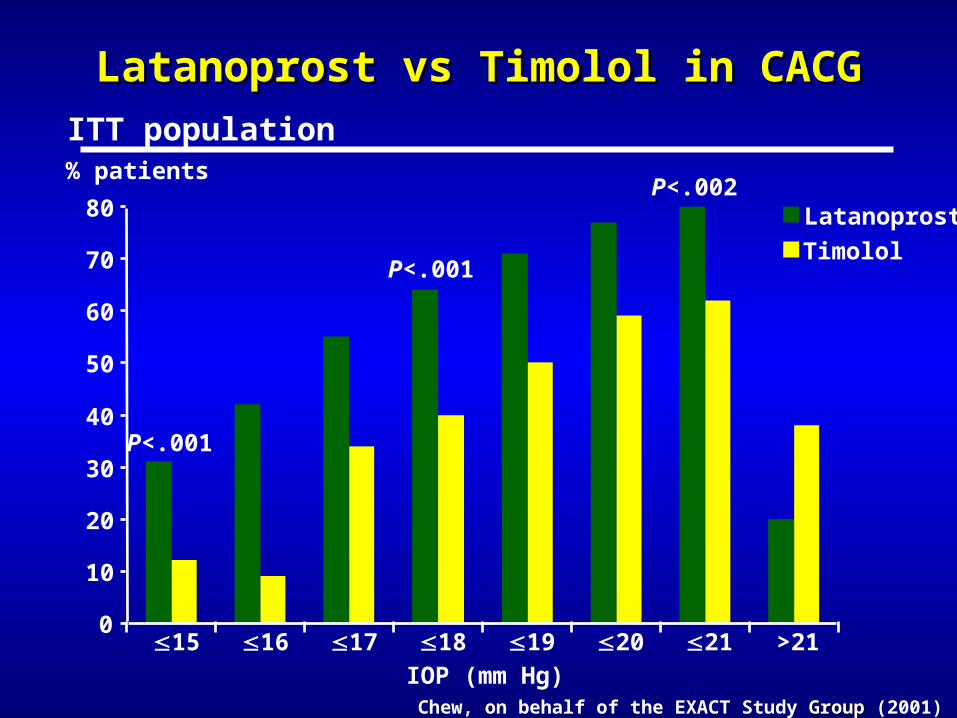
Latanoprost vs Timolol in CACGLatanoprost vs Timolol in CACG
P<.001
P<.001
P<.002
IOP (mm Hg)
% patients
Chew, on behalf of the EXACT Study GroupGroup (2001)
ITT population
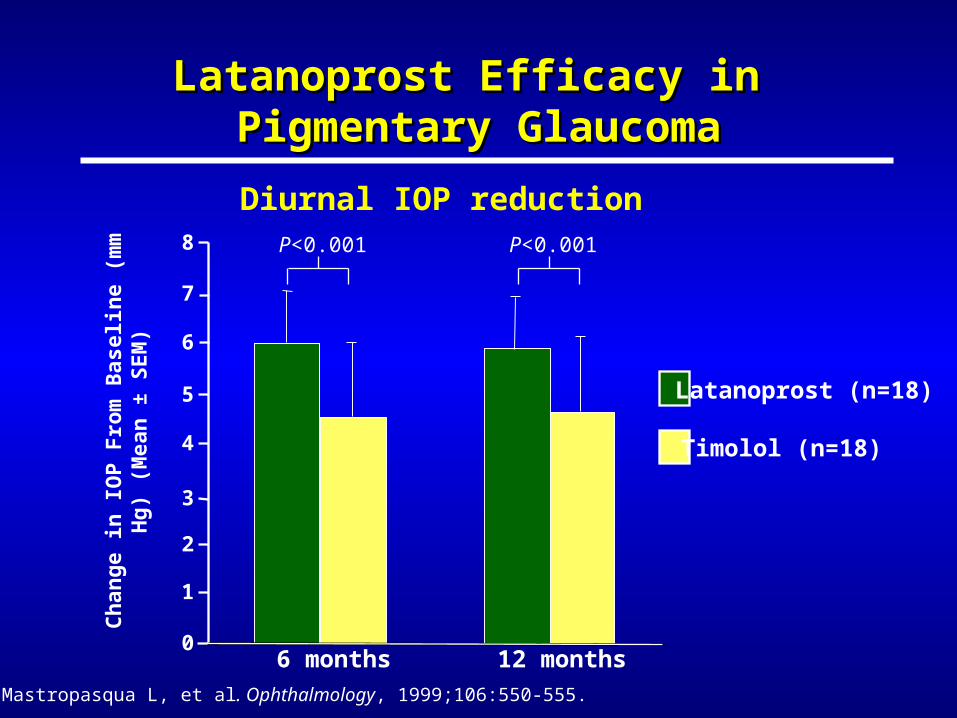
Latanoprost Efficacy in Latanoprost Efficacy in Pigmentary GlaucomaPigmentary Glaucoma
0
1
2
3
4
5
6
7
8
Latanoprost (n=18)
Timolol (n=18)
6 months 12 months
Diurnal IOP reduction
Ch
ang
e in
IOP
Fro
m B
asel
ine
(mm
Hg
) (M
ean
± S
EM
)
Mastropasqua L, et al. Ophthalmology, 1999;106:550-555.
P<0.001 P<0.001

Diurnal IOP Range and Diurnal IOP Range and Disease ProgressionDisease Progression
*The ratio between the incidence of a disease symptom among individuals with a given risk factor to the incidence among those without it.
Relative risk* of disease progression within 5 years
0
1
2
3
4
5
6
1.00
5.76
Diurnal IOP Range3.1 mm Hg
Diurnal IOP Range5.4 mm Hg
Rel
ativ
e R
isk
Asrani S, et al. J Glaucoma. 2000;9:134-142.

Latanoprost qd vs Dorzolamide tid Latanoprost qd vs Dorzolamide tid and Timolol bid Over 24 Hoursand Timolol bid Over 24 Hours
Orzalesi N, et al. Invest Ophthalmol Vis Sci. 2000;41:2566-2573.
Circadian control of IOP
IOP
(m
m H
g)
BaselineDorzolamide
tid
Timolol bid
Latanoprost qd
3 PM 6 PM 9 PM Midnight 3 AM 6 AM 9 AM Noon
Time (Hours)
13
15
17
19
21
23
25
0

Richard Parrish, II, MD, Paul Palmberg, MD, PhD, Wang-Pui Sheu, PhD, and the XLT Investigators
American Journal of Ophthalmology 2003; 135:688-703
Xalatan® (latanoprost ophthalmic solution) Xalatan® (latanoprost ophthalmic solution) Lumigan®† (bimatoprost ophthalmic solution)Lumigan®† (bimatoprost ophthalmic solution)Travatan®† (travoprost ophthalmic solution)Travatan®† (travoprost ophthalmic solution)
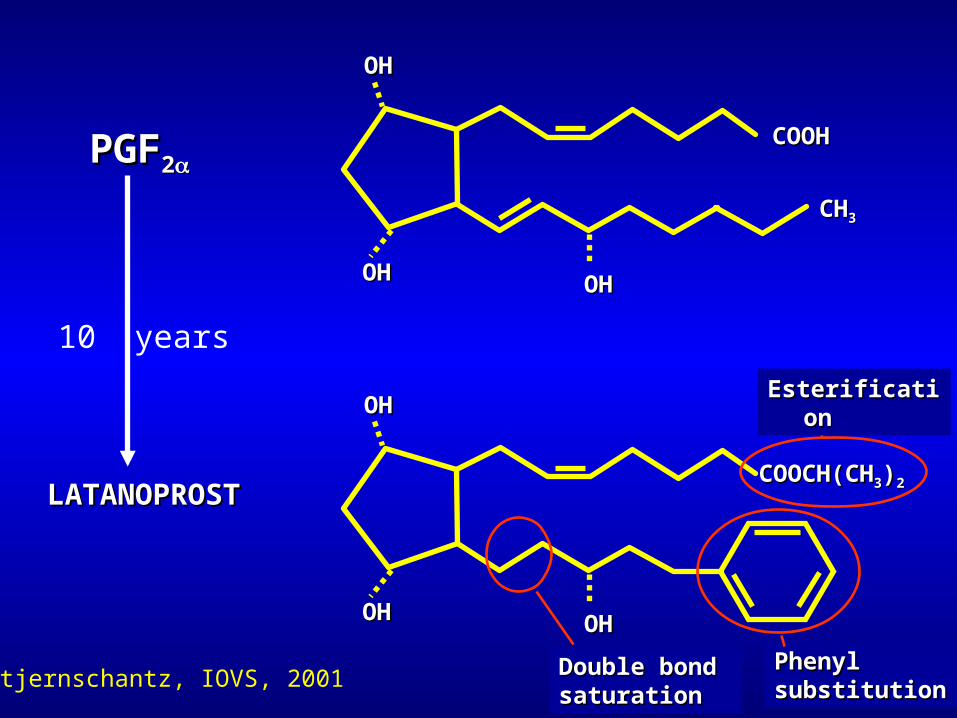
OHOH OHOH
OHOH
COOCH(CHCOOCH(CH33))22
PGFPGF22
OHOH OHOH
OHOH
COOHCOOH
LATANOPROSTLATANOPROST
CHCH33
EsterificationEsterification
Phenyl Phenyl substitutionsubstitution
Double bondDouble bondsaturation saturation
10 years
Stjernschantz, IOVS, 2001

Latanoprost: hypothesized mechanism Latanoprost: hypothesized mechanism of actionof action
LatanoprostLatanoprost acid + ester
Latanoprost acid
CorneaCornea
Aqueous humourAqueous humour
c-fos
Collagen collagen fragments
Uveoscleral flowUveoscleral flow
Ciliary muscleCiliary muscle
FP receptor
MMP
Courtesy of Weinreb
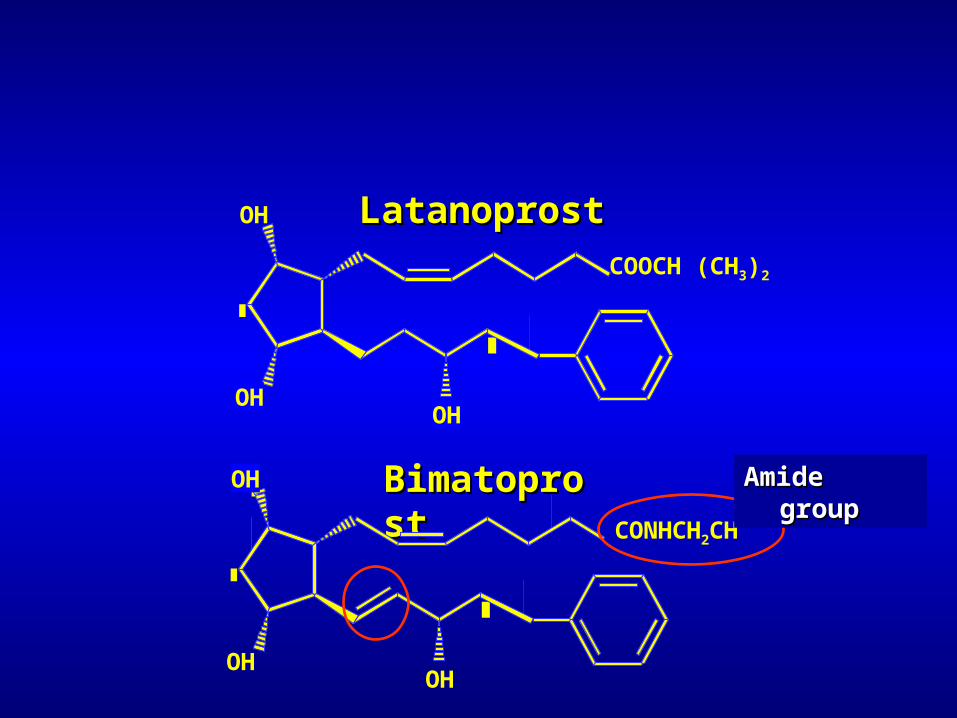
OH
OHOH
COOCH (CH3)2
LatanoprostLatanoprost
BimatoprostBimatoprost
OH
OHOH
CONHCH2CH
Amide groupAmide group
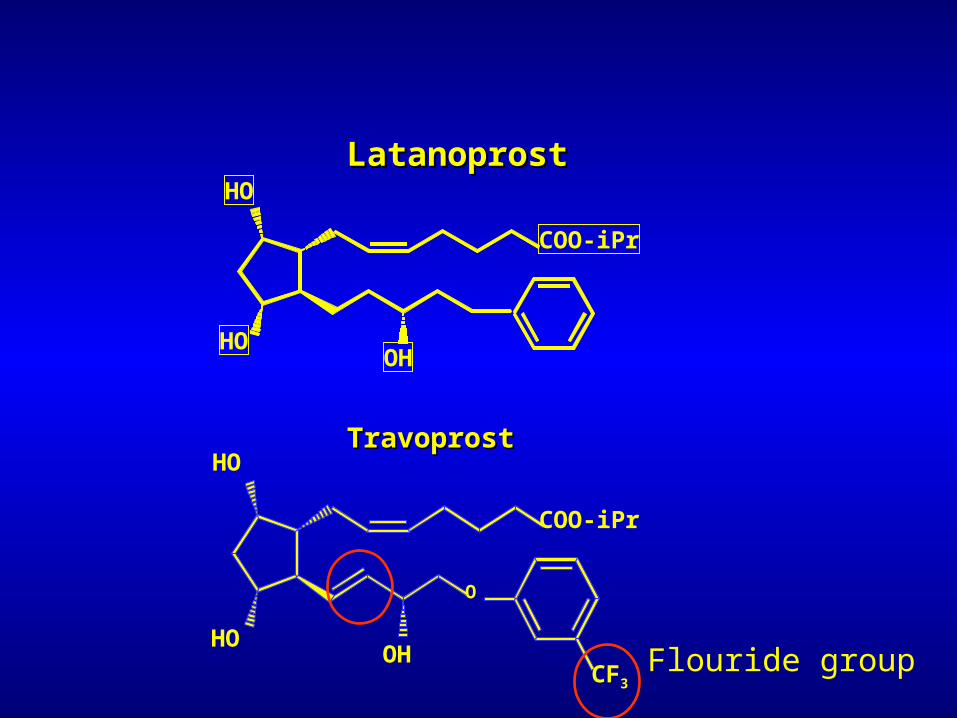
LatanoprostLatanoprost
COO-iPr
HO
HOOH
TravoprostTravoprost
O
HO
OHHO
CF3
COO-iPr
Flouride group
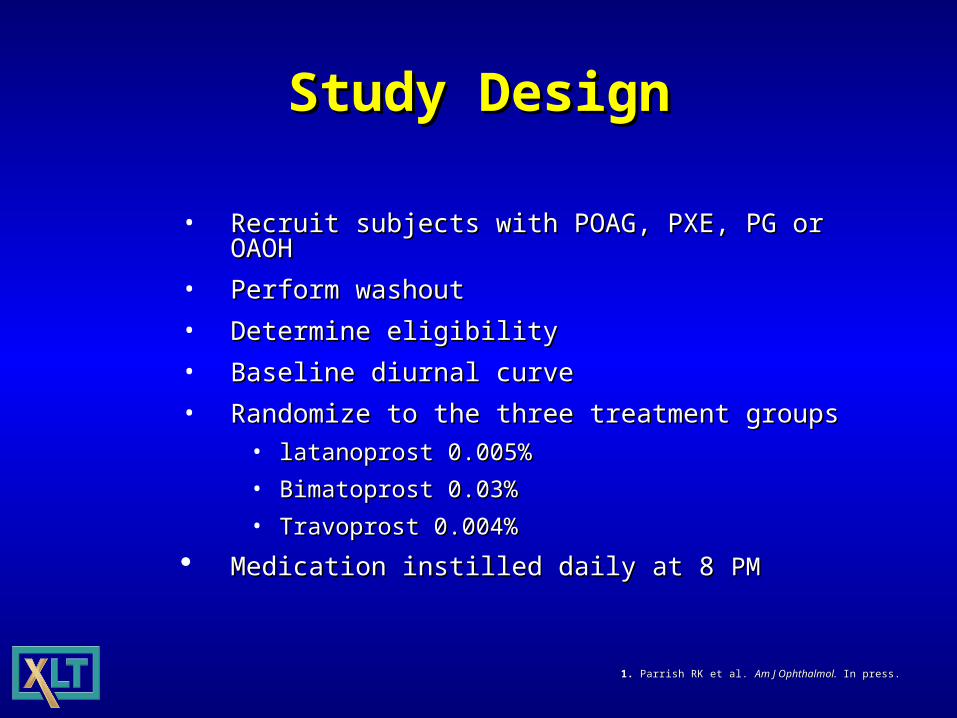
Study DesignStudy Design
• Recruit subjects with POAG, PXE, PG or OAOHRecruit subjects with POAG, PXE, PG or OAOH
• Perform washoutPerform washout
• Determine eligibilityDetermine eligibility
• Baseline diurnal curveBaseline diurnal curve
• Randomize to the three treatment groupsRandomize to the three treatment groups• latanoprost 0.005%latanoprost 0.005%
• Bimatoprost 0.03%Bimatoprost 0.03%
• Travoprost 0.004%Travoprost 0.004%
Medication instilled daily at 8 Medication instilled daily at 8 PMPM
1.1. Parrish RK et al. Parrish RK et al. Am J Ophthalmol.Am J Ophthalmol. In press. In press.
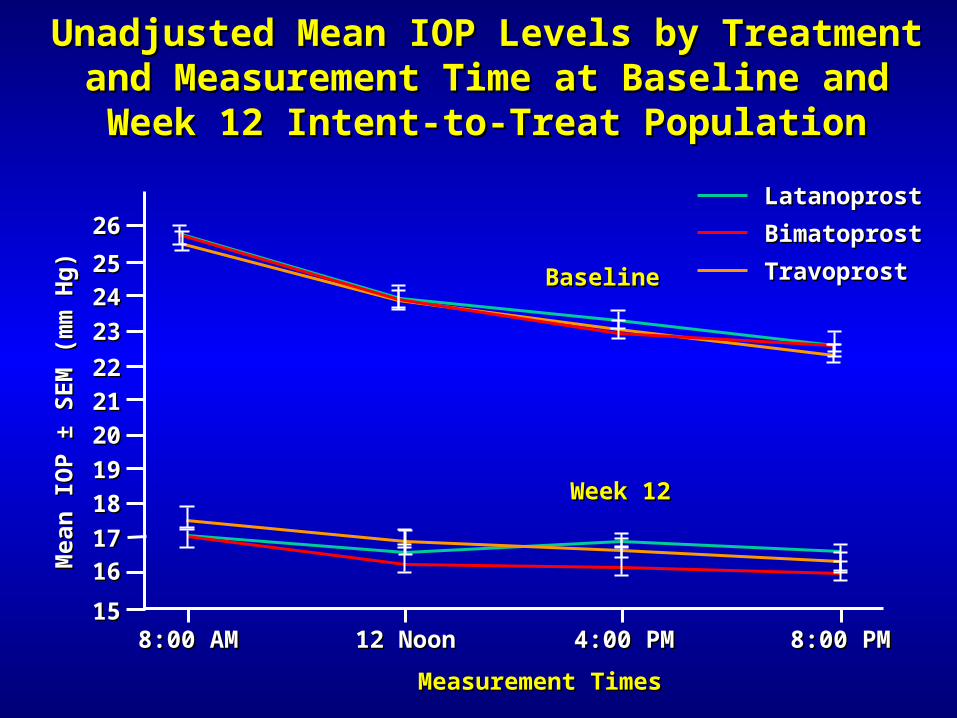
Unadjusted Mean IOP Levels by Treatment and Unadjusted Mean IOP Levels by Treatment and Measurement Time at Baseline and Week 12Measurement Time at Baseline and Week 12
Intent-to-Treat PopulationIntent-to-Treat Population
8:00 AM8:00 AM
Mea
n I
OP
M
ean
IO
P ±
SE
M±
SE
M (
mm
Hg
) (
mm
Hg
)
12 Noon12 Noon 4:00 PM4:00 PM 8:00 PM8:00 PM
Measurement TimesMeasurement Times
LatanoprostLatanoprost
BimatoprostBimatoprost
TravoprostTravoprost
1515
16161717
18181919
202021212222
2323
24242525
2626
Week 12Week 12
BaselineBaseline

IOP & IOP Change (mm Hg)IOP & IOP Change (mm Hg)Unadjusted MeansUnadjusted Means
LatanoprostBimatoprostTravoprost LatanoprostBimatoprostTravoprost
(n=136) (n=136) (n=138) (n=136) (n=136) (n=138)
8 AM 17.09 17.03 17.59 -8.65 -8.70 -7.92
Noon 16.49 16.19 16.84 -7.17 -7.60 -6.78
4 PM 16.72 15.98 16.44 -6.23 -6.84 -6.30
8 PM 16.30 15.80 16.10 -5.91 -6.52 -5.72
Diurnal 16.71 16.35 16.81 -7.00 -7.33 -6.72
Week 12 IOP IOP Change: Baseline to Week 12
Adapted from Parrish RK et al. Adapted from Parrish RK et al. Am J Ophthalmol.Am J Ophthalmol., 2003:135:688-703, 2003:135:688-703
-0.05
-0.33

Distributions of Reductions From Baseline Distributions of Reductions From Baseline to Week 12 in 8 to Week 12 in 8 AMAM andand Diurnal Diurnal Mean IOP Levels by Treatment Mean IOP Levels by Treatment
Intent-to-Treat PopulationIntent-to-Treat Population
LatanoprostLatanoprost BimatoprostBimatoprost TravoprostTravoprost LatanoprostLatanoprost BimatoprostBimatoprost TravoprostTravoprost
8 8 AMAM DiurnalDiurnal
Mea
n I
OP
Ch
ang
e (m
m H
g)
Mea
n I
OP
Ch
ang
e (m
m H
g)
-30-30
-25-25
-20-20
-15-15
-10-10
-5-5
00
55
1010
******
**
**** ****
******** **
**
**
** ****
**
**
**** **
**
******
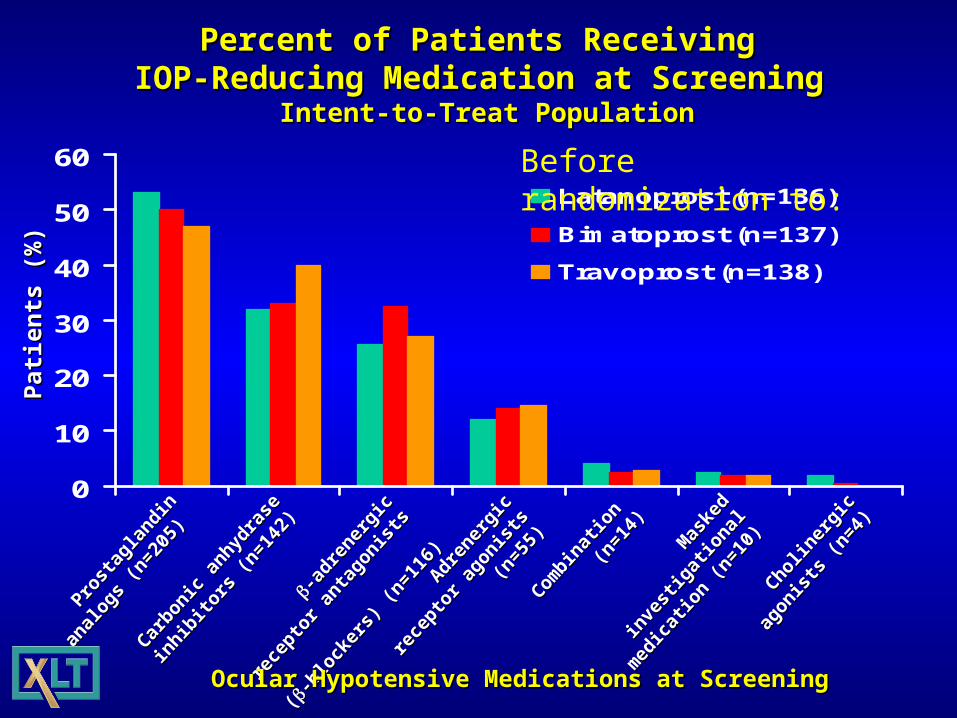
Percent of Patients Receiving Percent of Patients Receiving IOP-Reducing Medication at ScreeningIOP-Reducing Medication at Screening
Intent-to-Treat PopulationIntent-to-Treat Population
0
10
20
30
40
50
60
Latanoprost (n=136)
Bimatoprost (n=137)
Travoprost (n=138)
Pat
ien
ts (
%)
Pat
ien
ts (
%)
Prost
agla
ndin
Prost
agla
ndin
anal
ogs
(n=2
05)
anal
ogs
(n=2
05)
Carbo
nic
anhy
dras
e
Carbo
nic
anhy
dras
e
inhi
bito
rs (n
=142
)
inhi
bito
rs (n
=142
)
-ad
rene
rgic
rece
ptor
-adr
ener
gic
rece
ptor
anta
goni
sts
anta
goni
sts
((-b
lock
ers)
(n=1
16)
-blo
cker
s) (n
=116
)
Adren
ergi
c re
cept
or
Adren
ergi
c re
cept
or
agon
ists
(n=5
5)
agon
ists
(n=5
5)Com
bina
tion
Combi
natio
n (n
=14)
(n=1
4)
Mas
ked
inve
stig
atio
nal
Mas
ked
inve
stig
atio
nal
med
icat
ion
(n=1
0)
med
icat
ion
(n=1
0)Cho
liner
gic
agon
ists
Cholin
ergi
c ag
onis
ts
(n=4
)
(n=4
)
Ocular Hypotensive Medications at ScreeningOcular Hypotensive Medications at Screening
Before randomization to:

Mean IOP at Screening by IOP-Reducing Mean IOP at Screening by IOP-Reducing MedicationMedication
Intent-to-Treat PopulationIntent-to-Treat Population
151617181920212223242526 Latanoprost (n=136)
Bimatoprost (n=137)
Travoprost (n=138)
Mea
n I
OP
(m
m H
g)
Mea
n I
OP
(m
m H
g)
Prost
agla
ndin
Prost
agla
ndin
anal
ogs
(n=2
05)
anal
ogs
(n=2
05)
Carbo
nic
anhy
dras
e
Carbo
nic
anhy
dras
e
inhi
bito
rs (n
=142
)
inhi
bito
rs (n
=142
)
-ad
rene
rgic
rece
ptor
-adr
ener
gic
rece
ptor
anta
goni
sts
anta
goni
sts
((-b
lock
ers)
(n=1
16)
-blo
cker
s) (n
=116
)
Adren
ergi
c re
cept
or
Adren
ergi
c re
cept
or
agon
ists
(n=5
5)
agon
ists
(n=5
5)Com
bina
tion
Combi
natio
n (n
=14)
(n=1
4)
Mas
ked
inve
stig
atio
nal
Mas
ked
inve
stig
atio
nal
med
icat
ion
(n=1
0)
med
icat
ion
(n=1
0)Cho
liner
gic
agon
ists
Cholin
ergi
c ag
onis
ts
(n=4
)
(n=4
)
Ocular Hypotensive Medications at ScreeningOcular Hypotensive Medications at Screening
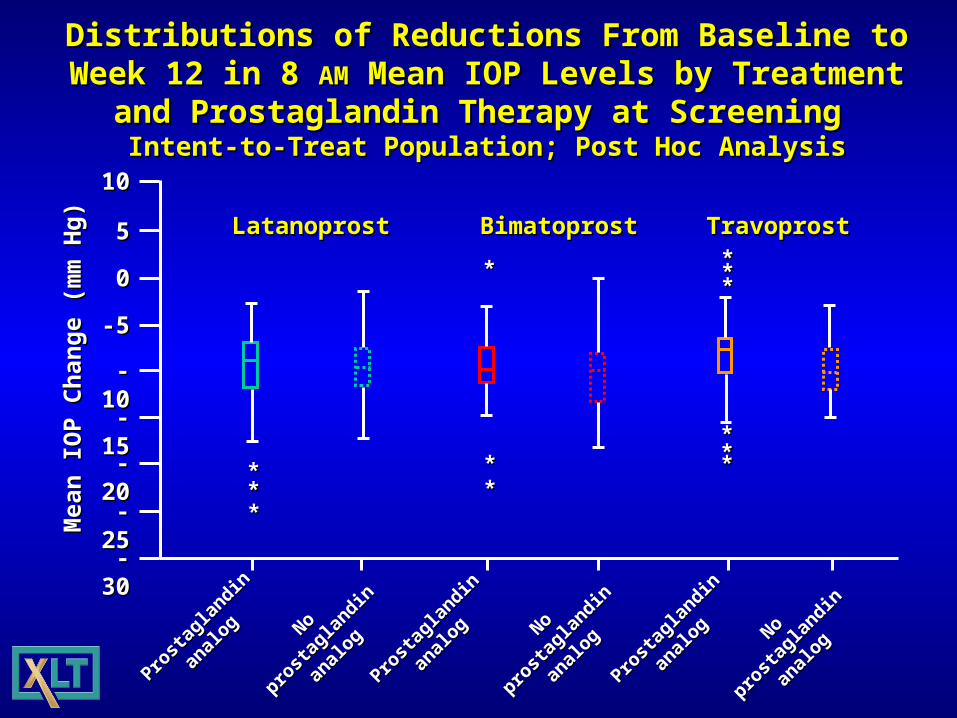
Distributions of Reductions From Baseline to Distributions of Reductions From Baseline to Week 12 in 8 Week 12 in 8 AMAM Mean IOP Levels by Treatment Mean IOP Levels by Treatment
and Prostaglandin Therapy at Screening and Prostaglandin Therapy at Screening Intent-to-Treat Population; Post Hoc AnalysisIntent-to-Treat Population; Post Hoc Analysis
1010
No pro
stag
landin
No pro
stag
landin
anal
og
anal
og
-30-30
-25-25
-20-20
-15-15
-10-10
-5-5
55
Mea
n I
OP
Ch
ang
e (m
m H
g)
Mea
n I
OP
Ch
ang
e (m
m H
g)
00
******
**** ***
***
********
LatanoprostLatanoprost BimatoprostBimatoprost TravoprostTravoprost
Prost
agla
ndin
Prost
agla
ndin
anal
og
anal
og
No pro
stag
landin
No pro
stag
landin
anal
og
anal
og
Prost
agla
ndin
Prost
agla
ndin
anal
og
anal
og
No pro
stag
landin
No pro
stag
landin
anal
og
anal
og
Prost
agla
ndin
Prost
agla
ndin
anal
og
anal
og
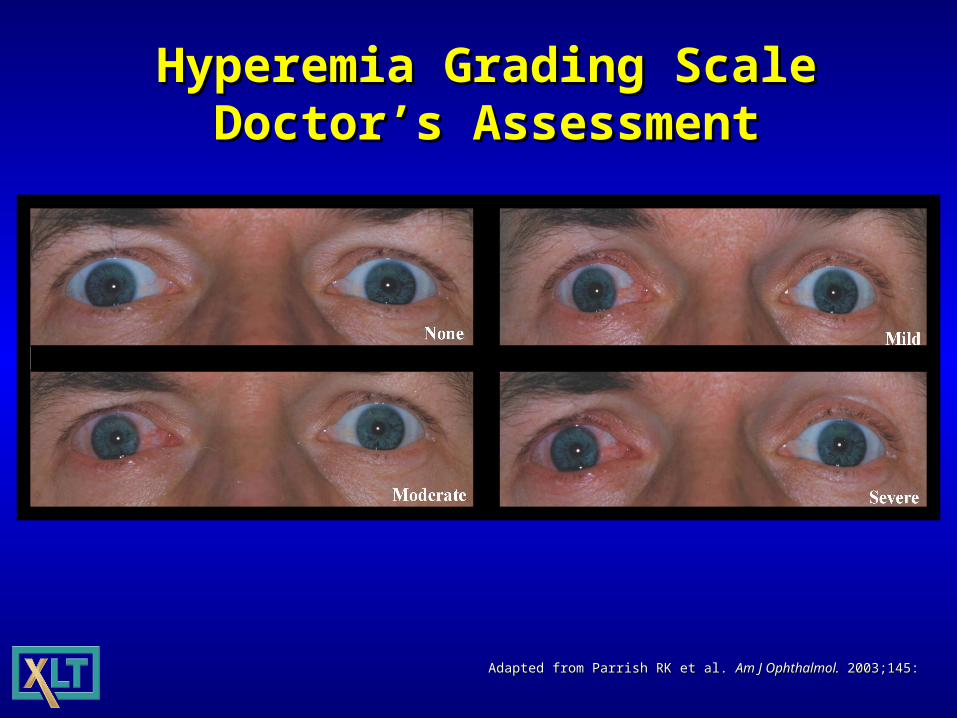
Hyperemia Grading ScaleHyperemia Grading ScaleDoctor’s AssessmentDoctor’s Assessment
Adapted from Parrish RK et al. Adapted from Parrish RK et al. Am J Ophthalmol.Am J Ophthalmol. 2003;145: 2003;145:

Patient’s Assessment of Patient’s Assessment of HyperemiaHyperemia
• ““Have you or anyone else noticed any Have you or anyone else noticed any redness in your eyes since the last visit?”redness in your eyes since the last visit?”
• If yes: If yes:
“ “To what extent does the redness bother To what extent does the redness bother you?”you?”
– not at allnot at all
– small amountsmall amount
– moderate amountmoderate amount
– a great deala great deal

Mean Hyperemia Score by Treatment and Mean Hyperemia Score by Treatment and VisitVisit Investigators’ AssessmentsInvestigators’ Assessments
BaselineBaseline
Mea
n H
yper
emia
Sco
re
Mea
n H
yper
emia
Sco
re ±
SE
M±
SE
M
Week 2Week 2 Week 6Week 6 Week 12Week 12VisitsVisits
00
0.10.1
0.20.2
0.30.3
0.40.4
0.50.5
0.60.6
0.70.7
0.80.8
0.90.9
1.01.0LatanoprostLatanoprost
BimatoprostBimatoprost
TravoprostTravoprost
‡‡
‡‡
‡ ‡ P=P=.001, Latanoprost vs Bimatoprost..001, Latanoprost vs Bimatoprost.

Distributions of Reductions From Baseline Distributions of Reductions From Baseline to Week 12 in 8 to Week 12 in 8 AMAM Mean IOP Levels by Mean IOP Levels by
Treatment and Occurrence of Hyperemia Treatment and Occurrence of Hyperemia Intent-to-Treat Population; Post Hoc AnalysisIntent-to-Treat Population; Post Hoc Analysis
-30-30
-25-25
-20-20
-15-15
-10-10
-5-5
55
1010
Mea
n I
OP
Ch
ang
e (m
m H
g)
Mea
n I
OP
Ch
ang
e (m
m H
g)
00
****
****
****
****
**
**
****
********
**
HyperemiaHyperemia NoNoHyperemiaHyperemia
HyperemiaHyperemia NoNoHyperemiaHyperemia
HyperemiaHyperemia NoNoHyperemiaHyperemia
LatanoprostLatanoprost BimatoprostBimatoprost TravoprostTravoprost

Patients’ Assessments of HyperemiaPatients’ Assessments of HyperemiaAll Randomized PatientsAll Randomized Patients
0
10
20
30
40
50
Baseline Week 2 Week 6 Week 12
LatanoprostLatanoprost
BimatoprostBimatoprost
TravoprostTravoprost
Per
cen
t R
epo
rtin
g
Per
cen
t R
epo
rtin
g
An
y R
edn
ess
in E
ye(s
)A
ny
Red
nes
s in
Eye
(s)
VisitsVisits
§§ PP<<.01, Latanoprost vs Bimatoprost..01, Latanoprost vs Bimatoprost.11
|| || PP<<.03, Latanoprost vs Travoprost..03, Latanoprost vs Travoprost.11
§§
Adapted from Parrish RK et al. Adapted from Parrish RK et al. Am J Ophthalmol.Am J Ophthalmol. 2003;145 2003;145
1. 1. Data on file. Pharmacia & Upjohn Company, Kalamazoo, Data on file. Pharmacia & Upjohn Company, Kalamazoo, MI.MI.
§, §, |||| §, §, ||||
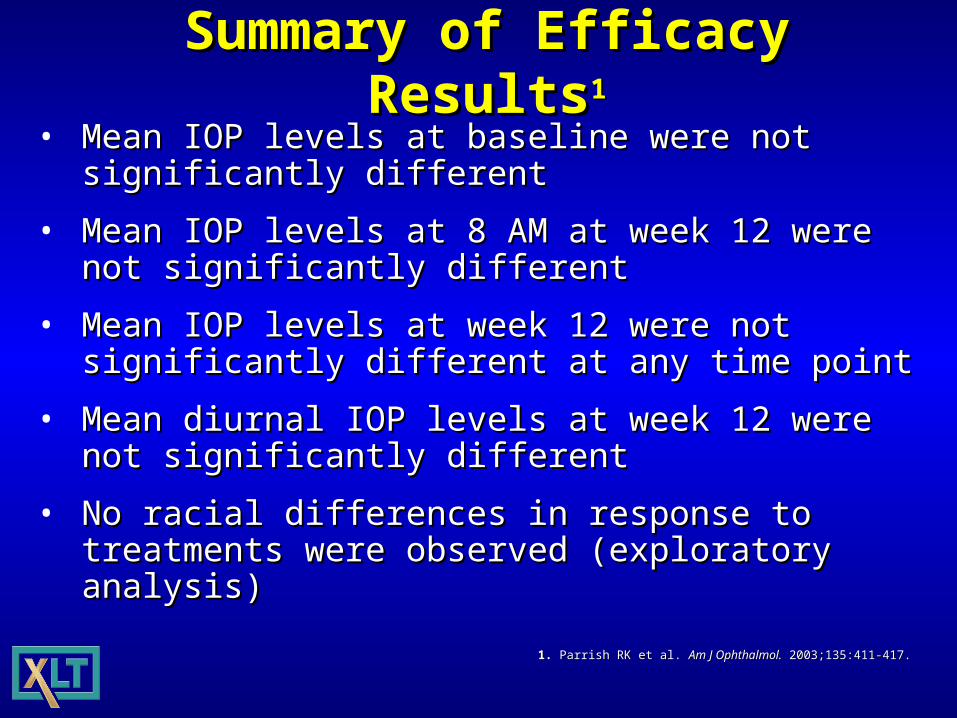
Summary of Efficacy Summary of Efficacy RResultsesults11
• Mean IOP levels at baseline were not Mean IOP levels at baseline were not significantly differentsignificantly different
• Mean IOP levels at 8 AM at week 12 were not Mean IOP levels at 8 AM at week 12 were not significantly different significantly different
• Mean IOP levels at week 12 were not Mean IOP levels at week 12 were not significantly different at any time pointsignificantly different at any time point
• Mean diurnal IOP levels at week 12 were not Mean diurnal IOP levels at week 12 were not significantly differentsignificantly different
• No racial differences in response to No racial differences in response to treatments were observed (exploratory treatments were observed (exploratory analysis)analysis)
1.1. Parrish RK et al. Parrish RK et al. Am J Ophthalmol.Am J Ophthalmol. 2003;135:411-417. 2003;135:411-417.

ConclusionsConclusionsAt week 12 At week 12
• IOP reduction from baseline was not IOP reduction from baseline was not significantly different in patients treated significantly different in patients treated with latanoprost, bimatoprost, or travoprostwith latanoprost, bimatoprost, or travoprost
• All 3 agents were generally well tolerated All 3 agents were generally well tolerated systemicallysystemically
• Significantly fewer patients reported Significantly fewer patients reported symptoms of ocular hyperemia with symptoms of ocular hyperemia with latanoprost treatmentlatanoprost treatment
• Investigators reported ocular hyperemia in Investigators reported ocular hyperemia in significantly fewer patients treated with significantly fewer patients treated with latanoprost than with bimatoprostlatanoprost than with bimatoprost
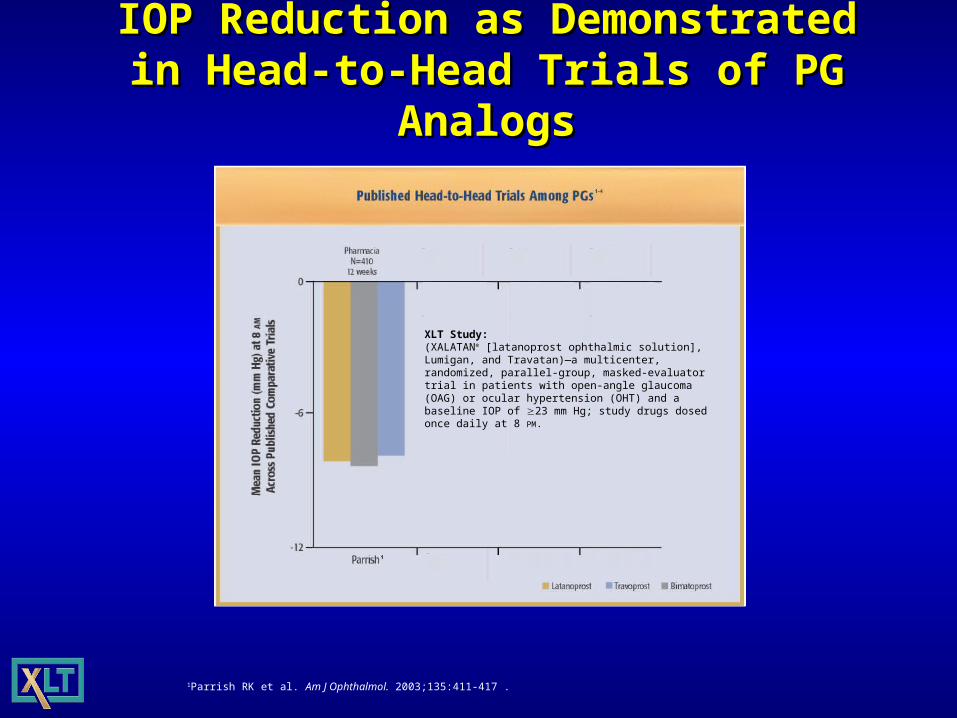
IOP Reduction as DemonstratedIOP Reduction as Demonstratedin Head-to-Head Trials of PG Analogsin Head-to-Head Trials of PG Analogs
1Parrish RK et al. Am J Ophthalmol. 2003;135:411-417 .
XLT Study:(XALATAN® [latanoprost ophthalmic solution], Lumigan, and Travatan)—a multicenter, randomized, parallel-group, masked-evaluator trial in patients with open-angle glaucoma (OAG) or ocular hypertension (OHT) and a baseline IOP of 23 mm Hg; study drugs dosed once daily at 8 PM.

IOP Reduction as DemonstratedIOP Reduction as Demonstratedin Head-to-Head Trials of PG Analogsin Head-to-Head Trials of PG Analogs
1Parrish RK et al. Am J Ophthalmol. In press. 2Netland PA et al. Am J Ophthalmol. 2001;132:472-484.
A phase III, 4-arm, randomized trial in patients with OAG or OHT; travoprost and latanoprost dosed once daily.

IOP Reduction as DemonstratedIOP Reduction as Demonstratedin Head-to-Head Trials of PG Analogsin Head-to-Head Trials of PG Analogs
1Parrish RK et al. Am J Ophthalmol. 2003; 135;411-417. 2Netland PA et al. Am J Ophthalmol. 2001;132:472-484. 3Gandolfi S et al. Advances in Therapy. 2001;18:110-121.
A multicenter, randomized, investigator-masked, parallel-group study in patients with glaucoma or OHT and a mean baseline IOP of 25.7 mm Hg; study drugs dosed once daily in the evening.

IOP Reduction as DemonstratedIOP Reduction as Demonstratedin Head-to-Head Trials of PG Analogsin Head-to-Head Trials of PG Analogs
1Parrish RK et al. Am J Ophthalmol. 2003;135:411-417. . 2Netland PA et al. Am J Ophthalmol. 2001;132:472-484. 3Gandolfi S et al. Advances in Therapy. 2001;18:110-121. 4Noecker RS et al. Am J Ophthalmol. 2003;135:55-63.
A multicenter, randomized, investigator-masked study in patients with OHT or POAG; study drugs dosed once daily.
†P<.001.
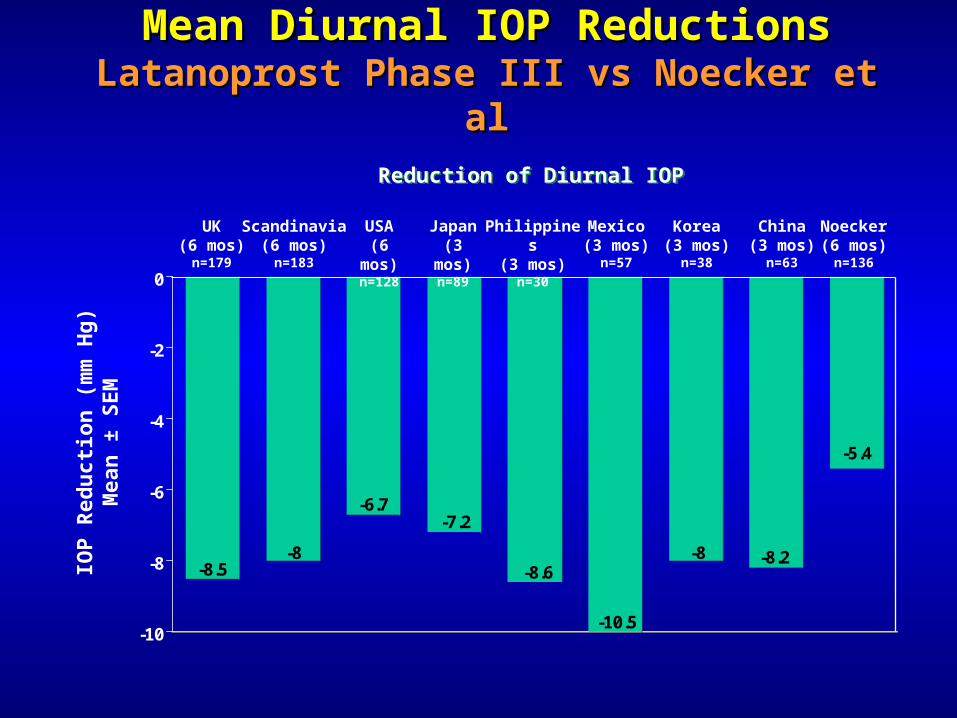
Mean Diurnal IOP ReductionsMean Diurnal IOP ReductionsLatanoprost Phase III vs Noecker et alLatanoprost Phase III vs Noecker et al
-8.5-8
-6.7-7.2
-8.6
-10.5
-8 -8.2
-5.4
-10
-8
-6
-4
-2
0
UK(6 mos)
n=179
Scandinavia(6 mos)
n=183
IOP
Red
uct
ion
(m
m H
g)
Mea
n ±
SE
M
USA(6 mos)
n=128
Reduction of Diurnal IOPReduction of Diurnal IOP
Japan(3 mos)
n=89
Philippines(3 mos)
n=30
Mexico(3 mos)
n=57
Korea(3 mos)
n=38
China(3 mos)
n=63
Noecker(6 mos)
n=136

Responder RatesResponder Rates
Noecker ParrishNoecker Parrish
Xal Lum Xal Tra LumXal Lum Xal Tra Lum
> 15% 72% 89% 91.9% 91.3% 91.9%> 15% 72% 89% 91.9% 91.3% 91.9%
>20% 62% 79% 86.8% 84.8% 87.5%>20% 62% 79% 86.8% 84.8% 87.5%
at 8 AM at end studyat 8 AM at end study

Achieving Target PressuresAchieving Target Pressures
Xalatan Travatan LumiganXalatan Travatan Lumigan
• 13 mm Hg 11% 12% 10% AGIS13 mm Hg 11% 12% 10% AGIS• 14 mm Hg 19% 19% 18%14 mm Hg 19% 19% 18%• 15 mm Hg 27% 26% 29%15 mm Hg 27% 26% 29%• 16 mm Hg 40% 33% 43%16 mm Hg 40% 33% 43%• 17 mm Hg 52% 46% 59% CIGTS• 18 mm Hg 65% 60% 68%18 mm Hg 65% 60% 68%• 19 mm Hg 77% 72% 77%19 mm Hg 77% 72% 77%• 20 mm Hg 84% 80% 82%20 mm Hg 84% 80% 82%• 21 mm Hg 90% 83% 90% 21 mm Hg 90% 83% 90%

More Aggressive Medical TherapyMore Aggressive Medical Therapy
Advanced Glaucoma Intervention Study Advanced Glaucoma Intervention Study (AGIS)(AGIS) supports a supports a 35-50%35-50% IOP reduction IOP reduction
Collaborative Normal-Tension Glaucoma Study Collaborative Normal-Tension Glaucoma Study (CNTGS)(CNTGS) supports a supports a 30%30% IOP reduction IOP reduction
Comparison of Initial Glaucoma Treatment Study Comparison of Initial Glaucoma Treatment Study (CIGTS)(CIGTS) supports a supports a 35%35% IOP reduction and IOP reduction and EMGTEMGT would seem to support would seem to support more aggressive control.more aggressive control.
Ocular Hypertension Treatment Study Ocular Hypertension Treatment Study (OHTS)(OHTS) supports a supports a 20-30%20-30% IOP reductionIOP reduction
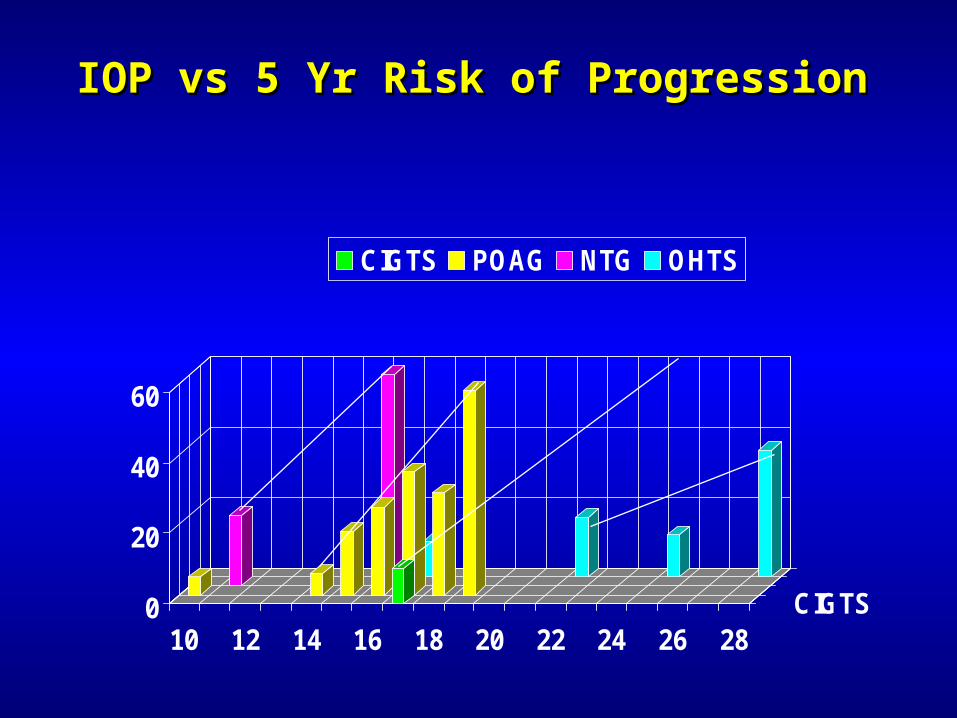
IOP vs 5 Yr Risk of ProgressionIOP vs 5 Yr Risk of Progression
0
20
40
60
10 12 14 16 18 20 22 24 26 28CIGTS
CIGTS POAG NTG OHTS