Evidence Based Fall Prevention Purpose
8
Evidence Based Fall Prevention Anne Shumway-Cook, PT, PhD, FAPTA University of Washington Seattle, WA USA Rehab 503 Spring 2009 Purpose ν To discuss evidence-based fall prevention in elders – Focus on evidence for exercise as a strategy to reduce falls in elders Defining Falls ν An event which results in a person coming to rest inadvertently on the ground or other lower level and other than as a consequence of the following: Sustaining a violent blow, loss of consciousness; sudden onset of paralysis, as in a stroke; or an epileptic seizure (Kellogg International Working Group) Factors Contributing To Falls • Traditionally assumed clinician would find single cause of falls for given older adult (ex: vertigo, sensory neuropathy, postural hypotension) • Now aware that falls in older adults have multiple contributing factors Environment Individual Falls Falls result from an interaction between risk factors in the individual and precipitating factors in the environment. Extrinsic Environmental Factors ν Mechanical disturbances, i.e., wet, slippery surfaces (causing slips) ν Uneven, cluttered surfaces ν Unexpected obstacles (causing trips) ν Stairs and curbs (causing both slips and trips) ν Being bumped in a crowd ν Improper/inadequate lighting, sudden changes in lighting (Birge, 1993)
Transcript of Evidence Based Fall Prevention Purpose

Evidence Based Fall Prevention
Anne Shumway-Cook, PT, PhD, FAPTA
University of Washington
Seattle, WA
USA
Rehab 503
Spring 2009
Purpose
ν To discuss evidence-based fall prevention
in elders
– Focus on evidence for exercise as a strategy to reduce falls in elders
Defining Falls
ν An event which results in a person coming to rest inadvertently on the ground or other lower level and other than as a consequence of the following: Sustaining a violent blow, loss of consciousness; sudden onset of paralysis, as in a stroke; or an epileptic seizure
(Kellogg International Working Group)
Factors Contributing To Falls
• Traditionally assumed clinician would find
single cause of falls for given older adult (ex: vertigo, sensory neuropathy, postural
hypotension)
• Now aware that falls in older adults have
multiple contributing factors
EnvironmentIndividual Falls
Falls result from an interaction between risk factors in the individual and
precipitating factors in the environment. Extrinsic Environmental Factors
ν Mechanical disturbances, i.e., wet, slippery surfaces (causing slips)
ν Uneven, cluttered surfaces
ν Unexpected obstacles (causing trips)
ν Stairs and curbs (causing both slips and trips)
ν Being bumped in a crowd
ν Improper/inadequate lighting, sudden changes in lighting (Birge, 1993)
Risk Factor for Falls(Rubenstein and Josephson, 2006)
1.1 – 2.51.7Age > 80 years
1.0 – 2.31.8Impaired Cognition
1.7 – 2.52.2Depression
1.5 – 3.12.3Impaired ADLs
1.9 – 2.92.4Arthritis
1.6 – 3.52.5Visual Deficit
1.2 – 4.62.6Use of Assistive Device
1.6 – 5.42.9Balance Deficit
1.3 – 5.62.9Gait Deficit
1.7 – 7.03.0History of falls
1.5–10.34.4LE Weakness
RangeMean OR or RR*Risk Factor
* Relative Risk Ratio – Prospective studies, Odds ratio – retrospective studies
The more risk factors you have, the
higher your risk for falls.
Risk of falling
ν 8% in older adults with no risk factors
ν 78% in older adults with 4 or more risk
factors
(Tinetti, 2003)
Consequences of falls
• Injury and hospitalization• In people 65+
• leading cause of hospitalization• Leading cause of head injury
• Loss of independence• Only 22% of people who are
hospitalized for falls are able to return home (WA State DOH)
• Fear and loss of confidence• Restricting activity
• Reduced strength• Reduced balance• Reduced stamina• Increased risk of falling
Fear of fallingRestricted Activity
DecreasedStrength Balance
Gait
Fall
Fall Rates
• Falls “the most serious and common medical problem experienced by the elderly” Hayes et al, 1996
• One third of community dwelling older adults (65+ years of age) fall each year
• One half of persons 85+ years of age will fall each year
• 11% of these falls result in serious injury, 300,000 hip fractures a year in seniors, 90% caused by falls
Does Age = Risk?
90 yr old runner 68 yr old frail older adult
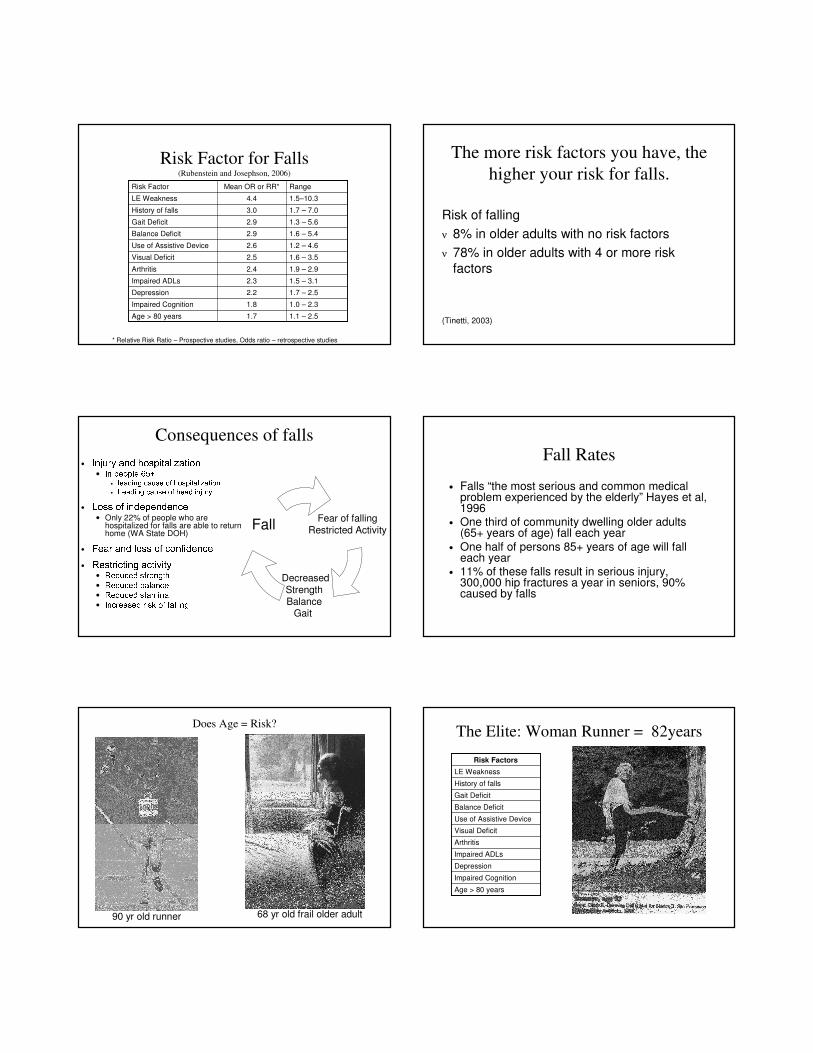
The Elite: Woman Runner = 82years
Age > 80 years
Impaired Cognition
Depression
Impaired ADLs
Arthritis
Visual Deficit
Use of Assistive Device
Balance Deficit
Gait Deficit
History of falls
LE Weakness
Risk Factors

The Healthy Elderly: 70’s and 90’s
Age > 80 years
Impaired Cognition
Depression
Impaired ADLs
Arthritis
Visual Deficit
Use of Assistive Device
Balance Deficit
Gait Deficit
History of falls
LE Weakness
Risk Factors
The Frail Elder = 68 years
Age > 80 years
Impaired Cognition
Depression
Impaired ADLs
Arthritis
Visual Deficit
Use of Assistive Device
Balance Deficit
Gait Deficit
History of falls
LE Weakness
Risk Factors
Continuum of fall prevention
relative to the aging continuum
ν No or low risk – primary prevention to
reduce the probability of development risk factors
ν Increased risk – secondary prevention to reduce frequency of falls and remediate
risk factors, strategies to prevent injury (hip pads)
Evidence Based Fall Prevention
Can we reduce falls in elders
and what strategies work?
ν Fall prevention strategies can reduce the
incidence of falls by 25 – 30%
ν Multifactorial Intervention (Risk factor
identification and targeted management) is
the most effective approach for reducing falls
in older adults at risk
(Rubenstein et al, 2006; Chang et al, 2004; Gillespie et al, 2003)
Risk Factor for Falls(Rubenstein and Josephson, 2006)
1.1 – 2.51.7Age > 80 years
1.0 – 2.31.8Impaired Cognition
1.7 – 2.52.2Depression
1.5 – 3.12.3Impaired ADLs
1.9 – 2.92.4Arthritis
1.6 – 3.52.5Visual Deficit
1.2 – 4.62.6Use of Assistive Device
1.6 – 5.42.9Balance Deficit
1.3 – 5.62.9Gait Deficit
1.7 – 7.03.0History of falls
1.5–10.34.4LE Weakness
RangeMean OR or RR*Risk Factor
* Relative Risk Ratio – Prospective studies, Odds ratio – retrospective studies

Tinetti’s et al, NEJM, 1994
ν 301 men and women living in the community who were at least 70 years of age and who had at least one risk factor for falling.
ν Randomized to targeted intervention vs. control (social visit) groups
ν Six month intervention (3 mos active, 3 mos maintenance) – Blood pressure management;
– Medication management
– Environmental hazards and home safety, transfer training
– PT: exercise, balance and gait training
ν Reported falls monthly
39% reduction in incidence falls
Tinetti et al, Am J Epi, 1996
ν Reduction in falls due to improvements in multiple risk factors
ν Evidence was strongest for interventions targeting– Postural blood pressure change (medication
management)– Balance – Transfer training– Gait
ν Tailor the intervention to the individual
Risk Identification and Referral Not Effective
ν Kenosha Fall Prevention Study (Mahoney et al, 2002)
ν 349 older adults (>65) randomized to control or intervention– 2 falls in the previous year or 1 fall in the previous 2 years with
injury or balance problems.
ν Intervention: – 2 in-home visits by a trained nurse or PT assessed falls
– Recommendations to the subject and their primary physician,ν referrals to physical therapy and other providers,
– 11 monthly telephone calls, and a balance exercise plan.
ν Control subjects received a home safety assessment.ν MEASUREMENTS
– The primary outcome was rate of falls per year in the community.
Kenosha Fall Prevention
ν Results: no difference in rate of falls between the intervention and control groups (rate ratio 0.81, P=.27)
ν Reasons given for lack of effect – poor follow through on recommendations. For example: – 1/3 of participants refused PT when it was recommended.
ν Reasons given: difficulty traveling, cost, disbelief in its efficacy
– Format of PT was suboptimal
ν ½ received one-time balance exercise instruction only
ν Median duration was < 1 month
ν Most received no home program
ν No exercise progression
Shumway-Cook et al, PTJ, 2009
ν “Findings from the Kenosha study suggest
a need in the profession of physical therapy to identify and implement a
consistent approach to management of falls due to physical factors such as
reduced strength and impaired balance
and gait among older adults. “ Page 6

Evidence Based Fall Prevention
ν Single factor intervention is as effective as multifactorial interventions for at risk community populations.
ν Success of single intervention requires that– The targeted risk factor accounts for a large
proportion of the falls risk.
– The intervention is effective in changing the risk factor.
(Campbell and Robertson, 2007)
Evidence Based Fall Prevention
ν Exercise is the most effective “single” strategy
for reducing fall risk in at risk older adults
(Rubenstein et al, 2006; Chang et al, 2004; Gillespie et al, 2003)
How exercise reduces risk for falls
Targets risk factors:• Reduced Strength
• Impaired balance • Impaired walking
DecreaseRate of Falls
Exercise
Exercise is only effective if:
ν Identify and target people whose primary risk factors improve with exercise
ν Impaired balanceν Impaired gaitν Impaired lower extremity strength
– Exercise is less effective when there are other significant risk factors for falls present that are not influenced by exercise
ν Sufficient intensity to modify risk factors
(Campbell and Robertson, 2007; Gardner et al, 2000)
Tests for Identifying Risk Factors
Modified by Exercise
ν Impaired Balance/Gait
– Timed Up and Go Test
– Berg Balance Test
– Functional Reach Test
– Walk and Talk Test
– Performance Oriented Mobility Assessment
ν Impaired Lower Extremity Strength
– Repeated Chair Stand Test
ν Rikli and Jones or Guralnik: SPPB
(Shumway-Cook et al, 2000)
(Fallers)

TUG as a Predictor of Falls
ν Predicted fall risk in older adults (14s) (Shumway-Cook,
2000; LaJoie et al, 2007)
ν Predicted falls following stroke (Andersson et al, 2006)
ν Did not predict falls following stroke (Harris et al, 2005)
Berg and Fall Risk in Older Adults
93%82.5%46LaJoie et al, 2004
96%53%46Thorbahn & Newton 1996
86%77%49Shumway-Cook et al, 1997
Specificity¶Sensitivity*Cut Point
* Correctly identifying people who fall¶ Correctly identifying people who don’t fallBerg and Fall Risk
(Shumway-Cook et al, 1997) Berg as a predictor of fall risk
ν Berg
– Predicted fall risk in older adults (Newton, Shumway-Cook,
LaJoie)
– Predicted falls following stroke (Teasell et al, 2002; Andersson et al,
2006; Belgen et al, 2006)
– Did not predict falls following stroke (Harris et al,
2005)
Why the conflicting results?
ν Differences in methods
– Cut points used to determine risk
ν Berg: 47, 48, 52,
– Predicting single fall vs. recurrent falls
– Retrospective vs. prospective reporting
ν Population under study (geriatric vs.
neurologic)
Ask about fallsNear falls
Fear of fallingRestricted Activities
Evaluate Fall Risk Factors
Evaluate mobility: TUG
Identify major risk factorsFor targeted intervention
�14s or unstable:Balance and gait
training< 10s and stable
American Geriatrics Society: Fall Prevention Guidelines

Exercise is only effective if:
– Identifies and targets people who have risk factors that improve with exercise
ν Impaired balance
ν Impaired gait
ν Impaired lower extremity strength
– Sufficient intensity to modify risk factors
(Campbell and Robertson, 2007)
What is the optimal dose of exercise?
ν Types of exercise– Balance training is KEY– Endurance exercise– Strength training (when combined with balance)– Tai Chi
ν Moderate intensity, professionally supervised, progressive (maintain the challenge)
ν How many minutes? 30 - 60 mins
ν How often? 3x/week ν For how long? 6 – 12 months ν Total dose (frequency and duration): >50 hours
(Gardner et al, 2000; Sherrington et al, 2008; Rubenstein and Josephsons, 2006; Chang et al, 2004; Shumway-Cook et al, 2008),
Shumway-Cook et al,
J Geron: Medical Sciences, 2007
ν RCT, 453 sedentary adults (mean age 75.6)
ν Multifactorial Intervention:
– individual risk factor assessment by public health nurse with referral to primary care MD (was not effective)
– 3x week, 60 minutes, group exercise: aerobic, strength, balance
and flexibility for 12 mos
– 6 educational sessions: managing fall risk, exercise, home safety, medications, footwear, maintaining exercise
ν Control group: two CDC handouts on falls
Results
ν Falls – 25% fewer falls in intervention group
– 41% fewer falls in participants who attended on average 2.3 classes a week for six months
ν Risk Factors
– Significant improvements in
ν Berg Balance Test (balance)
ν Repeated Chair Stand Test (LE strength)
ν TUG (mobility)
Fall Prevention Education
ν 30% of adults over 65 fall each year, less than half talk to a health care provider about falls, and of those who do, less than ½ receive any information about how to decrease future risk (Shumway-Cook et al, 2009)
ν 50% of people with Multiple Sclerosis fall, but less than half talk to a health care provider about falls (Matsuda, Shumway-Cook et al, 2009)
ν 45% of people with stroke fall, but less than ¼ talk to a health care provider about falls (Mackintosh et al, 2005).
Fall Prevention Education
ν Education
– Falls are not a normal part of aging; falls are predictable and often preventable
– Acting now can reduce the chances of having a fall both now and in the future
– Know your risk factors & how to change them
ν Exercise is the single best thing you can do to
improve your health and reduce your risk for falls
– Multidimensional exercise program
ν Balance, strength, endurance
ν 3x/ week, 30 – 60 mins
ν 6 mos to forever

ν Small Group Work
– Work with your ADS partner
– Determine your clients risk for falls
ν List modifiable and non-modifiable risk factors
– Define your fall prevention strategy
ν Exercise: mode, intensity, frequency, duration, progression
ν Education: