Everyday Unfair Treatment and Multisystem Biological ... · PDF fileEVERYDAY UNFAIR TREATMENT...
32
EVERYDAY UNFAIR TREATMENT 1 Everyday Unfair Treatment and Multisystem Biological Dysregulation in African-American Adults In press, Cultural Diversity and Ethnic Minority Psychology Special Section: Culture and Biology Interplay Anthony D. Ong 1,2* , David R. Williams 3,4 , Ujuonu Nwizu 5 , & Tara Gruenewald 6 1 Department of Human Development, Cornell University 2 Division of Geriatrics and Palliative Medicine, Weill Cornell Medical College 3 Harvard T. H. Chan School of Public Health 4 Department of Social and Behavioral Sciences, Harvard University 5 Africana Studies and Research Center, Cornell University 6 Davis School of Gerontology, University of Southern California Author Note This research was supported, in part, by Grant P01-AG020166 from the National Institute on Aging to conduct a longitudinal follow-up of the MIDUS (Midlife in the United States) investigation. The original study was supported by the John D. and Catherine T. MacArthur Foundation Research Network on Successful Midlife Development. *Corresponding Author Anthony D. Ong Department of Human Development G77 Martha Van Rensselaer Hall Cornell University Ithaca, NY 14853-4401 607-255-9993 [email protected] ACCEPTED FOR PUBLICATION
Transcript of Everyday Unfair Treatment and Multisystem Biological ... · PDF fileEVERYDAY UNFAIR TREATMENT...
EVERYDAY UNFAIR TREATMENT 1
Everyday Unfair Treatment and Multisystem
Biological Dysregulation in African-American Adults
In press, Cultural Diversity and Ethnic Minority Psychology
Special Section: Culture and Biology Interplay
Anthony D. Ong1,2*, David R. Williams3,4, Ujuonu Nwizu5, & Tara Gruenewald6
1Department of Human Development, Cornell University
2Division of Geriatrics and Palliative Medicine, Weill Cornell Medical College
3Harvard T. H. Chan School of Public Health
4Department of Social and Behavioral Sciences, Harvard University
5Africana Studies and Research Center, Cornell University
6Davis School of Gerontology, University of Southern California
Author Note
This research was supported, in part, by Grant P01-AG020166 from the National Institute on
Aging to conduct a longitudinal follow-up of the MIDUS (Midlife in the United States)
investigation. The original study was supported by the John D. and Catherine T. MacArthur
Foundation Research Network on Successful Midlife Development.
*Corresponding Author
Anthony D. Ong
Department of Human Development
G77 Martha Van Rensselaer Hall
Cornell University
Ithaca, NY 14853-4401
607-255-9993
AC
CE
PT
ED
FO
R P
UB
LIC
AT
ION
EVERYDAY UNFAIR TREATMENT 2
Abstract
Objective: Increasing evidence suggests that chronic exposure to unfair treatment or day-to-day
discrimination increases risk for poor health, but data on biological stress mechanisms are
limited. This study examined chronic experiences of unfair treatment in relation to allostatic load
(AL), a multisystem index of biological dysregulation. Methods: Data are from a sample of 233
African-American adults (37-85 years; 64% women). Perceptions of everyday unfair treatment
were measured by questionnaire. An AL index was computed as the sum of seven separate
physiological system risk indices (cardiovascular regulation, lipid, glucose, inflammation,
sympathetic nervous system, parasympathetic nervous system, hypothalamic pituitary adrenal
axis). Results: Adjusting for socio-demographics, medication use, smoking status, alcohol
consumption, depressive symptoms, lifetime discrimination, and global perceived stress,
everyday mistreatment was associated with higher AL. Conclusions: The results add to a
growing literature on the effects of chronic bias and discrimination by demonstrating how such
experiences are instantiated in downstream physiological systems.
Keywords: allostatic load; biological processes; chronic discrimination; dysregulation;
morbidity; unfair treatment

EVERYDAY UNFAIR TREATMENT 3
Everyday Unfair Treatment and Multisystem
Biological Dysregulation in African- American Adults
A substantial body of evidence implicates self-reported discrimination or unfair treatment
as important determinants of mental and physical health. Summative reviews of the literature
provide consistent evidence that repeated exposure to unfair treatment disrupts goal pursuit,
undermines psychological well-being, and contributes to broad-based morbidity and mortality
(Krieger, 1999; Lewis, Cogburn, & Williams, 2015; Schmitt, Branscombe, Postmes, & Garcia,
2014; Williams & Mohammed, 2009). Whereas lifetime unfair treatment refers to acute, major
experiences of discrimination across a variety of life domains such as being unfairly denied a
promotion or being unfairly prevented from moving into a neighborhood, everyday unfair
treatment captures the range of chronic, day-to-day experiences of discrimination such as being
followed around in stores or being treated with less courtesy or respect than others (Pascoe &
Smart Richman, 2009; Williams & Mohammed, 2009).
Relative to White Americans, African Americans consistently report more experiences of
unfair treatment and discrimination at every level of age, gender, and socio-economic status
(Barnes, De Leon, Wilson et al., 2004; Forman, Williams, & Jackson, 1997; Kessler, Mickelson,
& Williams, 1999; Lewis, Yang, Jacobs, & Fitchett, 2012). Moreover, growing evidence
suggests that coping with chronic, everyday mistreatment triggers a cascade of physiological
responses that over time may place demands on the body’s ability to effectively respond to
challenges (Lewis, et al., 2015; Mays, Cochran, & Barnes, 2007). The concept of allostatic load
(AL), introduced by McEwen and Steller (1993), reflects the cumulative “wear and tear” of
chronic stress on the body. According to the allostatic framework (McEwen & Seeman, 1999),
chronic stressors can cause dysregulation of interrelated physiological systems, which if
EVERYDAY UNFAIR TREATMENT 4
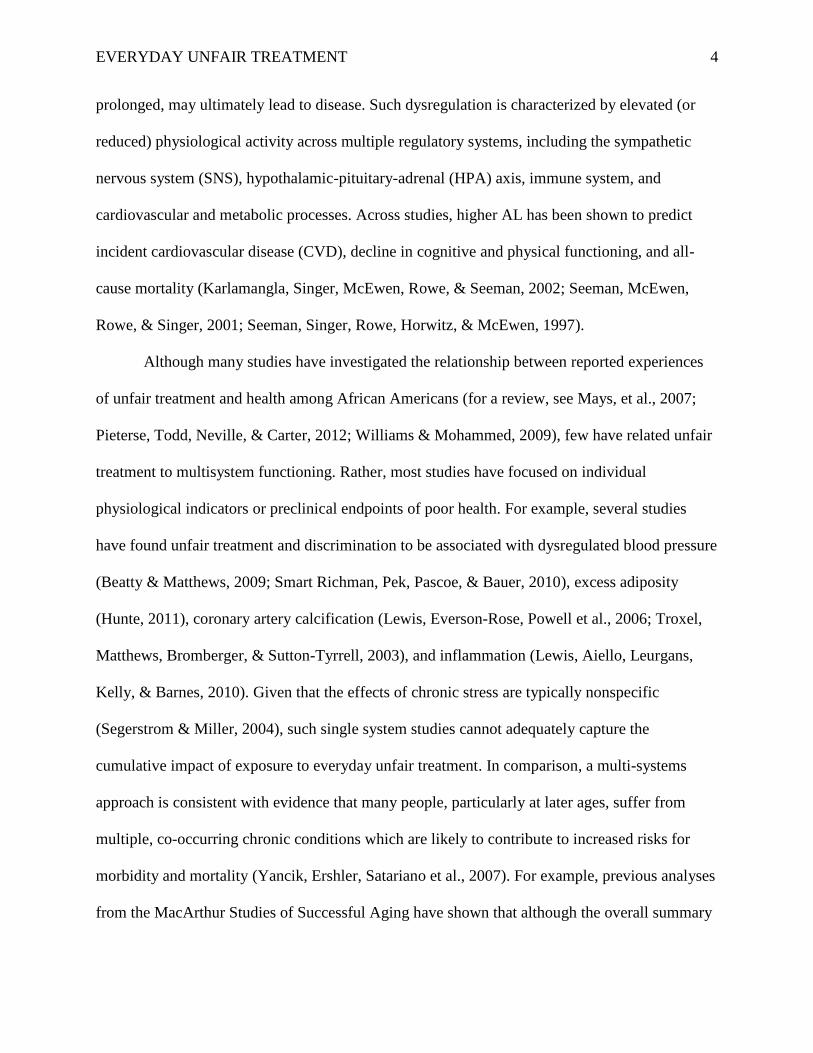
prolonged, may ultimately lead to disease. Such dysregulation is characterized by elevated (or
reduced) physiological activity across multiple regulatory systems, including the sympathetic
nervous system (SNS), hypothalamic-pituitary-adrenal (HPA) axis, immune system, and
cardiovascular and metabolic processes. Across studies, higher AL has been shown to predict
incident cardiovascular disease (CVD), decline in cognitive and physical functioning, and all-
cause mortality (Karlamangla, Singer, McEwen, Rowe, & Seeman, 2002; Seeman, McEwen,
Rowe, & Singer, 2001; Seeman, Singer, Rowe, Horwitz, & McEwen, 1997).
Although many studies have investigated the relationship between reported experiences
of unfair treatment and health among African Americans (for a review, see Mays, et al., 2007;
Pieterse, Todd, Neville, & Carter, 2012; Williams & Mohammed, 2009), few have related unfair
treatment to multisystem functioning. Rather, most studies have focused on individual
physiological indicators or preclinical endpoints of poor health. For example, several studies
have found unfair treatment and discrimination to be associated with dysregulated blood pressure
(Beatty & Matthews, 2009; Smart Richman, Pek, Pascoe, & Bauer, 2010), excess adiposity
(Hunte, 2011), coronary artery calcification (Lewis, Everson-Rose, Powell et al., 2006; Troxel,
Matthews, Bromberger, & Sutton-Tyrrell, 2003), and inflammation (Lewis, Aiello, Leurgans,
Kelly, & Barnes, 2010). Given that the effects of chronic stress are typically nonspecific
(Segerstrom & Miller, 2004), such single system studies cannot adequately capture the
cumulative impact of exposure to everyday unfair treatment. In comparison, a multi-systems
approach is consistent with evidence that many people, particularly at later ages, suffer from
multiple, co-occurring chronic conditions which are likely to contribute to increased risks for
morbidity and mortality (Yancik, Ershler, Satariano et al., 2007). For example, previous analyses
from the MacArthur Studies of Successful Aging have shown that although the overall summary

EVERYDAY UNFAIR TREATMENT 5
measure of AL significantly predicts risk for major health outcomes, none of the individual
components is a significant independent risk factor (Seeman, Crimmins, Huang et al., 2004;
Seeman, Singer, Ryff, Dienberg Love, & Levy-Storms, 2002). This accumulative process is also
captured in life-course risk models (Lynch & Smith, 2005) and theories of weathering
(Geronimus, Hicken, Keene, & Bound, 2006), which posit that greater exposure to chronic stress
accumulates to increase vulnerability to disease-related outcomes in later life. To our knowledge,
only two studies have examined the effects of unfair treatment on AL among African Americans.
In a longitudinal study involving 331 rural African American adolescents, Brody and colleagues
(2014) observed a prospective effect of discriminatory treatment on higher AL levels. Using a
community-based sample of middle-aged African-American women, Upchurch et al. (2015)
found that chronic exposure to everyday discrimination was predictive of higher AL levels.
Thus, with rare exception, studies examining links between unfair treatment and multisystem
biological dysregulation (e.g., AL) in African Americans is critically lacking.
The current study adds to our understanding of the health disparities that adversely affect
African Americans in at least three important ways. First, this study builds on prior work on
allostatic load (Gruenewald, Karlamangla, Hu et al., 2012; Seeman, Epel, Gruenewald,
Karlamangla, & McEwen, 2010) by examining the relationship between chronic exposure to
everyday mistreatment and AL in a sample of middle-aged African Americans. Midlife may be
an important point in the life span for examining these processes, because it ushers in a period of
markedly rising risk for acute and chronic illness (House, Lantz, & Herd, 2005; Karlamangla,
Singer, & Seeman, 2006). As such, there is a strong need to explore biological stress
mechanisms among middle-aged African Americans, a population particularly at risk for a
broad-spectrum of stress-related disorders, including diabetes, cardiovascular disease,
EVERYDAY UNFAIR TREATMENT 6
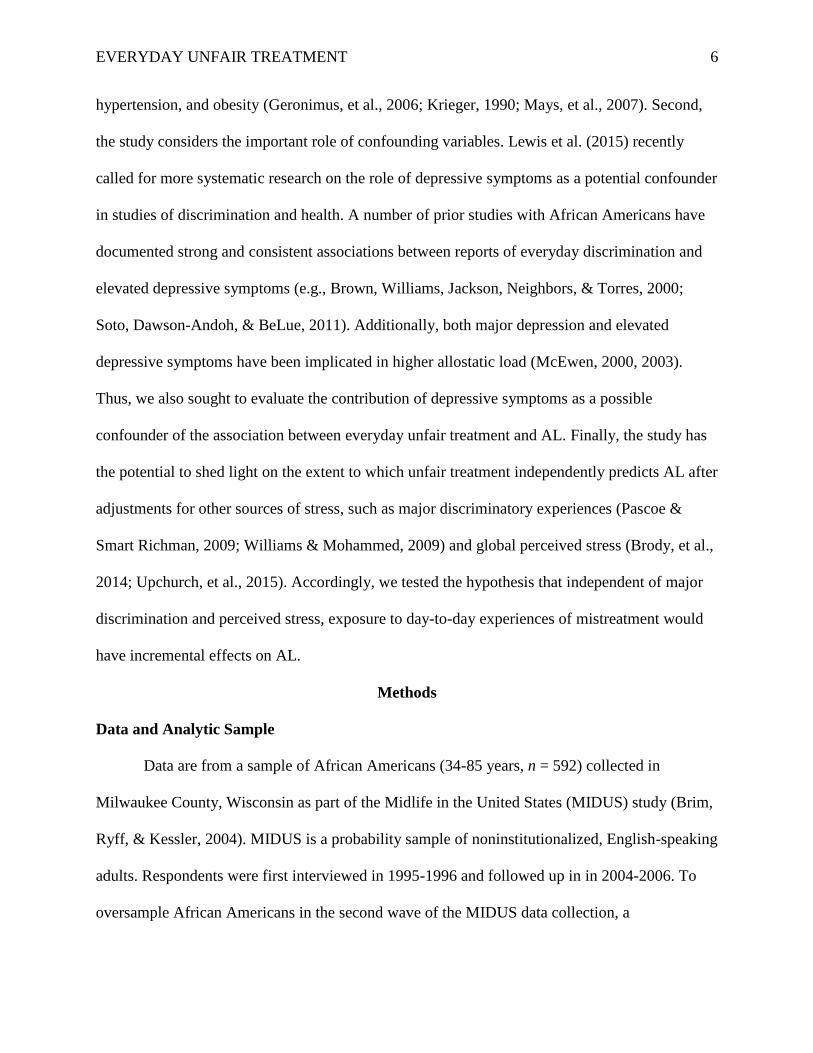
hypertension, and obesity (Geronimus, et al., 2006; Krieger, 1990; Mays, et al., 2007). Second,
the study considers the important role of confounding variables. Lewis et al. (2015) recently
called for more systematic research on the role of depressive symptoms as a potential confounder
in studies of discrimination and health. A number of prior studies with African Americans have
documented strong and consistent associations between reports of everyday discrimination and
elevated depressive symptoms (e.g., Brown, Williams, Jackson, Neighbors, & Torres, 2000;
Soto, Dawson-Andoh, & BeLue, 2011). Additionally, both major depression and elevated
depressive symptoms have been implicated in higher allostatic load (McEwen, 2000, 2003).
Thus, we also sought to evaluate the contribution of depressive symptoms as a possible
confounder of the association between everyday unfair treatment and AL. Finally, the study has
the potential to shed light on the extent to which unfair treatment independently predicts AL after
adjustments for other sources of stress, such as major discriminatory experiences (Pascoe &
Smart Richman, 2009; Williams & Mohammed, 2009) and global perceived stress (Brody, et al.,
2014; Upchurch, et al., 2015). Accordingly, we tested the hypothesis that independent of major
discrimination and perceived stress, exposure to day-to-day experiences of mistreatment would
have incremental effects on AL.
Methods
Data and Analytic Sample
Data are from a sample of African Americans (34-85 years, n = 592) collected in
Milwaukee County, Wisconsin as part of the Midlife in the United States (MIDUS) study (Brim,
Ryff, & Kessler, 2004). MIDUS is a probability sample of noninstitutionalized, English-speaking
adults. Respondents were first interviewed in 1995-1996 and followed up in in 2004-2006. To
oversample African Americans in the second wave of the MIDUS data collection, a
EVERYDAY UNFAIR TREATMENT 7
supplemental sample of African Americans was drawn in the Milwaukee area. Using a stratified
sampling frame, the Milwaukee data consisted of U.S. census tracts in which at least 40% of
residents were African American. Inclusionary criteria required that respondents self-identified
as Black/African-American, lived in a non-institutionalized setting, were able to speak English
with sufficient literacy to complete a self-administered questionnaire, and were healthy enough
to complete a 40-min interview. Data were collected via a computer-assisted personal interview
(CAPI) protocol and with subsequent, mailed self-administered questionnaires. Response rate for
the Milwaukee sample was 70.7% for the in-person interview and 70.3% for the mail-back
questionnaire. Additional details about the sampling procedure are described elsewhere (Ryff,
Almeida, Ayanian et al., 2008a, 2008b).
The analytic sample for the current study consisted of 233 African-American adults (64%
women) aged 37-85 years at MIDUS II who participated in a biomarker sub-study (Love,
Seeman, Weinstein, & Ryff, 2010). Biomarker data were collected during an overnight visit at a
regional medical center in Madison, WI between 2004 and 2009. Study participants provided a
complete medical history, underwent a physical examination, and provided blood, urine, and
saliva samples, along with cardiovascular and heart rate variability measurements. Fasting blood
was collected at 07:00 h (before caffeine or nicotine consumption). Urine was collected during a
12-hr (19:00 h to 07:00 h) overnight stay (for details, see Love, et al., 2010). Data collection for
the MIDUS, Milwaukee, and biomarker studies were approved by Institutional Review Boards at
each participating site, and all participants provided informed consent.
Measures
Biomarker measurement
A comprehensive range of biological and anthropometric measurements representing
seven physiological systems were collected during the study visit. Measures of (1)
EVERYDAY UNFAIR TREATMENT 8
cardiovascular functioning included resting systolic and diastolic blood pressure (SBP, DBP)
and resting pulse. Indicators of (2) lipid metabolism included high density lipoprotein (HDL)
cholesterol, low density lipoprotein (LDL) cholesterol, triglycerides, body mass index (BMI),
and waist-hip ratio (WHR). Levels of (3) glycosylated hemoglobin, fasting glucose, and the
homeostasis model of insulin resistance (HOMA-IR), served as measures of glucose metabolism.
Measures of (4) chronic inflammation included plasma C-reactive protein (CRP), fibrinogen, and
serum measures of interleukin-6 (IL-6) and the soluble adhesion molecules e-Selectin and
intracelleular adhesion molecule-1 (ICAM-1). Changes in peripheral autonomic nervous system
activity were assessed with measures of sympathetic and parasympathetic activation. Indicators
of (5) sympathetic nervous system (SNS) activity included overnight urinary measures of
epinephrine and norepinephrine. Measures of (6) parasympathetic nervous system (PNS) activity
included the following heart rate variability parameters: low and high frequency spectral power,
the standard deviation of R-R (heartbeat to heartbeat) intervals (SDRR), and the root mean
square of successive differences (RMSSD). Indicators of (7) hypothalamic pituitary adrenal axis
(HPA) activity included an overnight urinary measure of the hormone cortisol and a serum
measure of the hormone dehydroepiandrosterone sulfate (DHEA-S). Additional details about
laboratory assays and HRV measurement are available elsewhere (Crowley, McKinley, Burg et
al., 2011; Love, et al., 2010).
Allostatic load
An allostatic load (AL) score, designed to summarize dysregulation across multiple
physiological systems, was computed as the sum of seven system-level (cardiovascular, lipid,
glucose metabolism, inflammation, SNS, PNS, HPA) risk scores. Following previous work,
system risk scores were computed as the proportion of individual biomarker indicators for each

EVERYDAY UNFAIR TREATMENT 9
system for which participant values fell into high-risk quartile ranges (Gruenewald, et al., 2012).
High risk was defined as the upper or lower quartile depending on whether high or low values of
the biomarker typically confer greater risk for poor health. System risk scores could range from 0
to 1 (indicating 0-100% of system biomarkers in high-risk range) and were computed for
individuals with values on at least half of the system biomarkers. An AL score (possible range:
0-7) was computed for participants with information on at least six of the seven systems.
Everyday unfair treatment
Everyday unfair treatment was assessed with the 9-item Detroit Area Study Everyday
Discrimination Scale (Williams, Yu, Jackson, & Anderson, 1997). Respondents reported on the
frequency of various forms of interpersonal unfair treatment in their daily lives. Items included:
Being treated with less courtesy or respect than others; receiving poorer service than others at
restaurants or stores; being called names, insulted, threatened, or harassed; having people act
afraid of the respondent; having people act as if the respondent was dishonest, not smart, or not
as good as they were. The frequency of each type of mistreatment was assessed using a 4-point
scale (1 = never; 2 = rarely; 3 = sometimes; 4 = often). Responses were averaged to form an
Everyday Unfair Treatment Index (Cronbach α’s for the 9-item index was .91). Participants who
responded either “sometimes” or “often” to at least one of the 9 items on the Unfair Treatment
scale were asked to respond to an additional item inquiring about the reason(s) for their
experience(s). Response categories included race, ethnicity, gender, age, income level, language,
physical appearance, sexual orientation, and other. In accord with prior MIDUS II study findings
(e.g., Fuller-Rowell, Doan, & Eccles, 2012; Kessler, et al., 1999), the majority (81.1%) of
African-American respondents in the current study reported race as a reason for at least one of
the unfair treatment events they experienced.
EVERYDAY UNFAIR TREATMENT 10
Lifetime unfair treatment
Reports of lifetime occurrences of unfair treatment were assessed across 11 settings that
included academics (discouraged from continuing education, denied scholarship), employment
(not hired or promoted, fired), financial services (denied a ban loan, prevented from renting or
buying a home, given inferior service), and experiences of social hostility (forced out of a
neighborhood, hassled by the police) (Kessler, et al., 1999). Respondents indicated how many
times they experienced each event “because of such things as your race, ethnicity, gender, age,
religion, physical appearance, sexual orientation, or other characteristics.” Due to high skewness
in the data, we calculated a summary index of lifetime mistreatment by recoding responses into 3
categories (none, 1-2 instances, 3 or more instances), similar to previous MIDUS studies of
discrimination (Friedman, Williams, Singer, & Ryff, 2009; Mays & Cochran, 2001).
Covariates
Socio-demographic, medical, health behavior, and psychosocial covariates were selected
based on their potential for either confounding or mediating the associations between unfair
treatment and AL. Socio-demographic covariates included age (in years), gender, and
educational attainment (continuous, using categories: 1 = no school/some grade school (1–6) to
12 = PhD, EdD, MD, DDS, LLD, JD, or other professional degree). Medical covariates included
use of antihypertensive, cholesterol lowering, steroid, and antidepressant medications to lower
clinical risk. Health behavior covariates included smoking status (coded as non-smoker, ex-
smoker, or current smoker) and the presence of alcohol problems, as assessed by a five-item
modified version of the Michigan Alcohol Screening Test (MAST; Selzer, 1971). Responses on
the MAST were summed (α = .60) and then dichotomized (0 = no alcohol problems,
1 = otherwise).

EVERYDAY UNFAIR TREATMENT 11
Psychosocial covariates included depression symptomatology and global perceived
stress. Depressive symptoms were assessed via the General Distress Depressive Symptoms
(GDD: 12 items) subscale from the Mood and Anxiety Questionnaire (MAS-Q; Clark & Watson,
1991). The items assess distress symptoms commonly associated with depression (e.g., “Felt
discouraged”; “Felt pessimistic about the future”). Responses are based on a 5-point Likert-like
scale (1 = not at all and 5 = extremely). Cronbach’s α for the 12-item GDD was .90. Perceived
stress was measured with the 10-item Perceived Stress Scale (PSS). The items assess stress in the
past month (e.g., “Felt unable to control important things in your life”; “Felt difficulties were
piling up so high that I couldn’t overcome them”). Responses are based on a 5-point Likert-like
scale (1 = never and 5 = very often). Cronbach’s α for the 10-item PSS was .69 in the current
data.
Statistical Analyses
Regression analyses were used to examine the association between everyday unfair
treatment and AL, adjusting for the effects of covariates described above. Multiple imputation
procedures were used to impute missing values on covariates (Graham, 2009; Royston, 2005).
The relationship between everyday unfair treatment and AL was examined using a series of
multivariate-adjusted models. Five models were fitted in all. In Model 1, AL scores were
regressed on unfair treatment, omitting any covariates. This model provides a comparison of
results obtained using multiple predictors to those obtained from simpler, univariate analyses in
which the outcome is regressed separately on each predictor variable (Cohen, West, & Aiken,
2003, p. 425). Model 2 included adjustments for socio-demographic factors (age, gender,
education). Model 3 added medical covariates (antihypertensive, cholesterol lowering, steroid,
and antidepressant medications). Health behaviors (smoking, alcohol problems) were added in
EVERYDAY UNFAIR TREATMENT 12
Model 4, and psychosocial factors (depression, life mistreatment, and perceived stress) were
included in Model 5. Finally, interactions of unfair treatment with age, gender, and education
were tested. All results are presented as unstandardized regression coefficients (B) with 95%
confidence intervals (CIs) based on pooled estimates from five imputed data sets. Values of R2
are based on the application of Rubin’s rules (1987) after Fisher’s Z transformation following
Harel (2009).
Results
Descriptive statistics
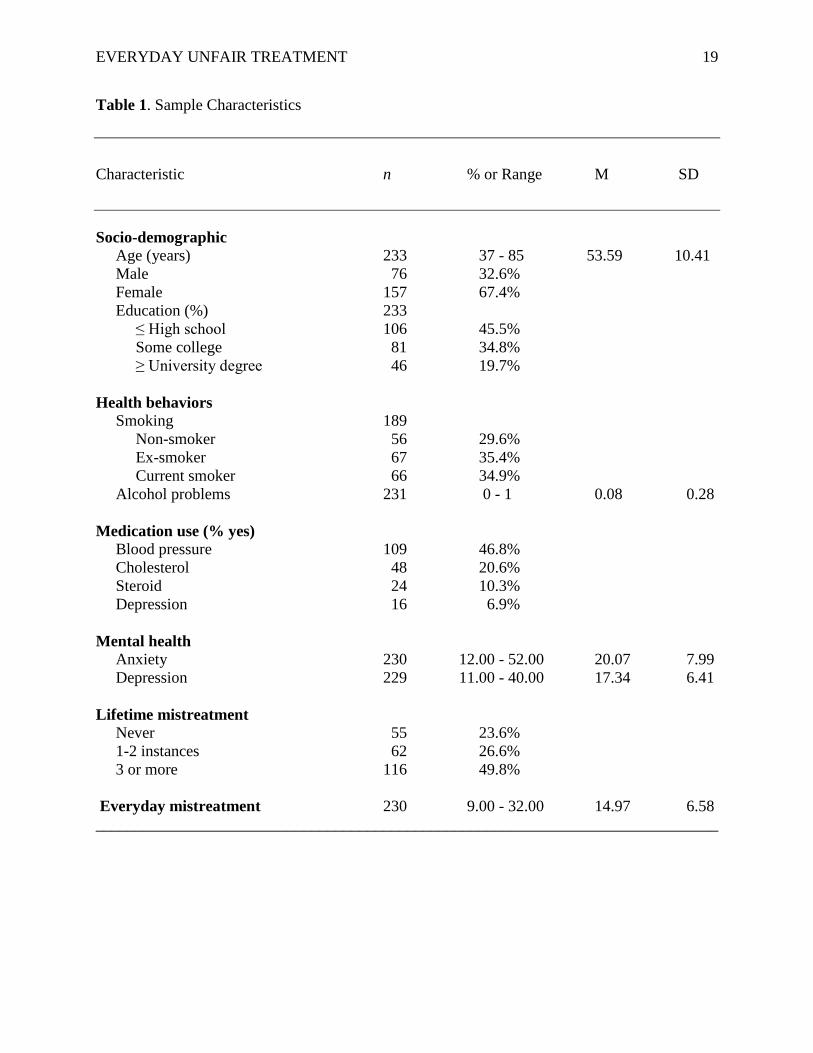
Descriptive data are presented in Tables 1 and 2. Respondents were on average 53.6 years
(SD = 10.4) of age and 67% female at the second MIDUS wave. The majority of respondents
(54.5%) had some college education or at least a bachelor’s degree. Approximately half of the
sample used blood pressure medications. On average, level of AL was moderate in the sample
(M = 1.91, SD = 1.01; observed range 0 – 4.90; possible range of 0 - 7). Moreover, the seven
system-level scores that contribute to AL had means between 0.17 (SD = 0.31) and 0.43
(SD = 0.38), and were not highly correlated with each other; pairwise correlation coefficients
ranged from -0.10 to 0.37 (Mdn = 0.10). Pairwise correlations between the seven system-level
risk scores and overall AL index ranged from 0.29 to 0.56. Finally, in the current data, the
correlation between the two measures of unfair treatment (i.e., everyday and lifetime) was
moderate (r =.44).
Everyday unfair treatment and allostatic load
Associations between unfair treatment and AL were highly consistent across all five
models. Results of regression analyses are summarized in Table 3. The unadjusted model (Model
1) indicated that unfair treatment was associated with higher levels of AL (B = .022, 95% CI

EVERYDAY UNFAIR TREATMENT 13
0.003, 0.04). The adjusted base model (Model 2) indicated that net of socio-demographic factors,
unfair treatment predicted significantly higher levels of AL (B = .028, 95% CI 0.01, 0.05). This
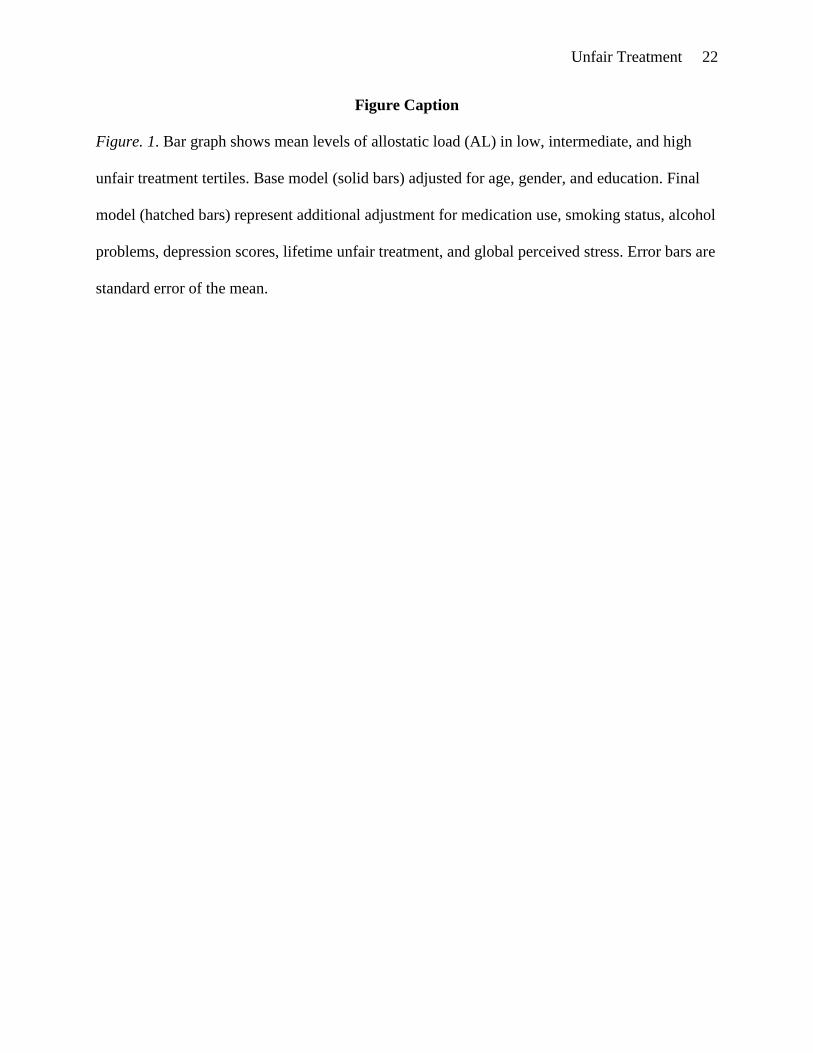
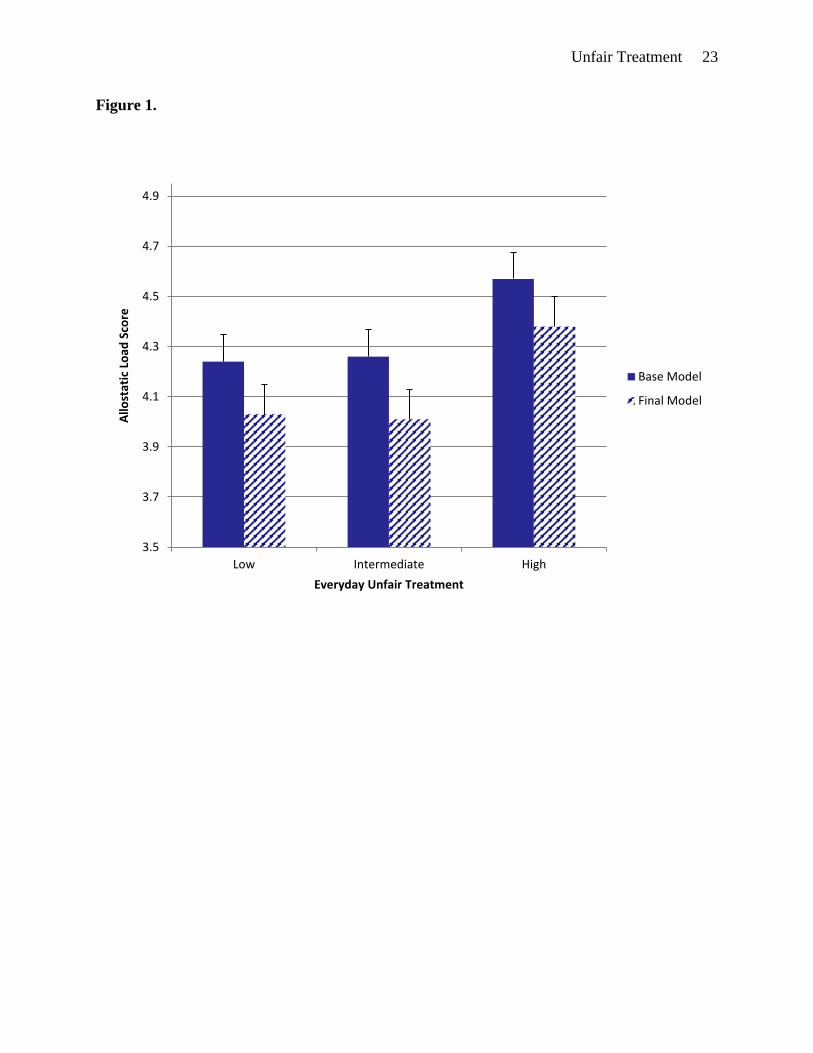
is illustrated in the solid bars in Fig. 1. Adjusted for age, gender, race, and education, AL scores
were on average 8% greater in the highest compared with the lowest tertile of exposure to
everyday mistreatment. Adding medical covariates (Model 3), health behaviors (Model 4), and
psychosocial factors (Model 5) to the base model did not alter these results. The association
between unfair treatment and AL was attenuated (reduced by 14 - 32%), but remained significant
across all models (see Table 3). The final model accounted for approximately 26% of the
variance in AL scores.
Supplemental analyses
Parallel analyses tested for possible interactions between everyday unfair treatment and
major socio-demographic factors. There was no evidence that the adjusted association between
mistreatment scores and AL varied as a function of age (B = 0.001, 95% CI -0.001, 0.002),
gender (B = 0.001, 95% CI -0.037, 0.035), or education (B = -0.002, 95% CI -0.009, 0.005).
Examination of unfair treatment by individual system risk scores indicated that greater everyday
unfair treatment was associated with higher scores on each of the AL subsystem risk scores, with
the exception of SNS and glucose metabolism. Moreover, and further supporting the robustness
of our results, a sensitivity analysis with an alternatively scored AL measure that used fewer
biomarker indicators (original 10-item formulation used in Seeman, et al., 1997) yielded similar
results. The adjusted association between unfair treatment and AL scores remained significant
(B = 0.04, 95% CI 0.007, 0.070). Finally, attributions to racial/ethnic discrimination for
experiences of unfair treatment were not associated with AL scores (B = 0.003, 95% CI -0.280,

EVERYDAY UNFAIR TREATMENT 14
0.286). Thus, in the current study, everyday unfair treatment overall, regardless of the attributed
cause, was associated with higher AL among African American adults.
Discussion
Extensive evidence suggests that chronic exposure to unfair treatment increases risk for
premature morbidity and mortality (Lewis, et al., 2015; Mays, et al., 2007; Williams &
Mohammed, 2009). Findings from the current study provide support for the hypothesis that
among African Americans the experience of everyday mistreatment contributes to greater overall
physiological dysregulation. Whereas previous work has focused on individual physiological risk
measures (e.g., Beatty & Matthews, 2009; Troxel, et al., 2003), this study extends prior work by
examining the association between everyday unfair treatment and a multisystem index of
cumulative, biological “wear and tear” or allostatic load (AL).
Our findings also provide additional empirical footing for the distinction between major
and day-to-day forms of mistreatment and their unique effects on AL. Although there was some
shared variance between the two types of constructs, there was independent covariation to justify
the inclusion of both types of measures in the current study (Kessler, et al., 1999; Pascoe &
Smart Richman, 2009; Williams & Mohammed, 2009). The larger literature on stress assessment
points to important distinctions between major life events and daily stressors. Studies in this area
have typically found that ambient strains or “daily hassles” account for a greater portion of the
variance in symptomatology than is explained by the occurrence of major life events (DeLongis,
Coyne, Dakof, Folkman, & Lazarus, 1982; Kanner, Coyne, Schaefer, & Lazarus, 1981). There
has been little effort, however, to develop psychological hypotheses that could capture the
relative impact of major versus everyday forms of mistreatment on physical health outcomes
within African-American samples (Mays, et al., 2007; Ong, Fuller-Rowell, & Burrow, 2009;

EVERYDAY UNFAIR TREATMENT 15
Williams, et al., 1997). Taken together, these findings build upon existing literature by pointing
to the significance of chronic everyday discrimination in the lives of Africans Americans and by
illustrating how social conditions external to the individual “get under the skin” to affect later
health and disease outcomes.
An additional aim was to examine the role of depressive symptoms, major discrimination,
and global perceived stress as potential confounders of the association between unfair treatment
and AL. Previous reviews have pointed to the importance of controlling for the effects of
depressive symptoms (Lewis, et al., 2015; Pascoe & Smart Richman, 2009) and global perceived
stress (Brody, et al., 2014; Upchurch, et al., 2015) in studies of discrimination and physical
health. Notably, we found the effect of unfair treatment on AL remained significant after
including depressive symptoms, lifetime mistreatment, and perceived stress in the model,
indicating that although statistical adjustment for these confounding factors attenuated the
association between everyday mistreatment and AL, they do not completely explain the effect in
the current data. Thus, it is likely that other behavioral or physiological pathways are at play.
Given research demonstrating that unfair treatment is associated with lower levels of health care
seeking (for a review, see Williams & Mohammed, 2009) and access to health care explains a
significant amount of variance in ethnic/racial disparities in health (Blendon, Aiken, Freeman, &
Corey, 1989; Williams & Rucker, 2000), future studies should examine the role of medical care
and health-care seeking behaviors (e.g., interactions with healthcare providers, adherence to
treatment advice) as potential pathways linking everyday unfair treatment and AL among
African Americans.
Finally, although the majority African Americans in the current study attributed
experiences of unfair treatment to race, attributions of mistreatment due to race were not

EVERYDAY UNFAIR TREATMENT 16
associated with AL scores. These findings are consistent with studies showing that irrespective
of attribution, experiences of unfair treatment may lead to negative health outcomes (De Vogli,
Ferrie, Chandola, Kivimaki, & Marmot, 2007; Troxel, et al., 2003). For example, Lewis and
colleagues (2006) found that everyday mistreatment in general, rather than racial/ethnic
discrimination, was positively associated with coronary artery calcification among African
American women. Similarly, in a study of African-American women, Roberts and colleagues
(2008) observed nonracial attributions of mistreatment were more strongly associated with
hypertensive status than were racial attributions. Because African-Americans consistently report
higher levels of overall discrimination compared with Whites (Schulz, Israel, Williams et al.,
2000; Williams, et al., 1997), it is possible that their vulnerability to the health consequences of
mistreatment may be a function of the frequency of exposure rather than the attribution of the
type of discrimination experienced (Beatty & Matthews, 2009). Research on “intersectionalities”
(Lewis, et al., 2015) suggests that occupying multiple disadvantaged statuses (e.g., African
American and female) may shape both the experiences and consequences of everyday unfair
treatment. It is noteworthy that this work has largely focused on subjective, self-reported health.
Thus, studies examining the impact of multiple group identities on objective physical health
outcomes represent an important priority for future research.
By contrast, Brody et al.(2014) found that high and stable levels of discrimination due to
race was associated with higher AL across adolescence. The discrepancy in findings may be
partly explained by differences in the measure of unfair treatment and age cohort sampled.
Specifically, the approach to measuring discrimination used in the Brody et al. (2014) study was
to ask explicitly about experiences with racial/ethnic discrimination. In contrast, the Everyday
Discrimination Scale (Williams et al., 1997) used in the current research inquires about

EVERYDAY UNFAIR TREATMENT 17
discriminatory experiences as a form of unfair treatment more broadly and then follows-up with
a question regarding attribution after a general response has been endorsed. As reviewed in
Lewis et al. (2015), these two approaches make different assumptions about how best to query
respondents and, thus, have unique limitations and strengths. For example, although it is not
possible to ascertain how many of the participants reported mistreatment due exclusively to
racial/ethnic discrimination using the Everyday Discrimination Scale, a strength of the scale is
that it does not require respondents to engage in the challenging cognitive task of attributing
cause at the same time as they recall and report experiences of discrimination (Williams &
Mohammed, 2009). Future research should contrast approaches that ask about recent everyday
unfair treatment with those that ask about recent everyday racial and ethnic discrimination
(Lewis, et al., 2015) and assess their effects on physical health among African Americans.
Our conclusions are necessarily limited by some features of our methods and analyses.
First, although we conceptualized unfair treatment as a risk marker for increased allostatic load,
in the absence of longitudinal data, it is possible that a reverse association exists whereby high
levels of AL contribute to increase reports of everyday unfair treatment. Thus, prospective
studies with multiple-wave assessments of unfair treatment and AL are needed to understand the
directionality and time-course of these relationships. Longitudinal designs may reveal, for
example, whether repeated exposure to everyday mistreatment piles up over time to
prospectively influence subsequent AL, in addition to the mechanisms underlying these effects.
Second, our measures of unfair treatment were based on self-report and did not include
comprehensive assessments of structural or institutional discrimination (e.g., residential
segregation, socio-economic mobility). Third, our study was limited to a relatively small sample
EVERYDAY UNFAIR TREATMENT 18
of fairly educated African American middle-aged adults, and the findings cannot be assumed to
generalize beyond this socio-demographic group. Additional research in this area is warranted.
Despite the study limitations, the findings shed light on the biological underpinnings of
chronic exposure to unfair treatment. To our knowledge, the present analysis is among the first to
consider the cumulative effects of unfair treatment across a comprehensive 22 biomarker
measure of multisystem biological dysregulation (i.e., AL) within a large community based
sample of middle-aged African-American adults. Additionally, the study adjusts for potential
confounding factors (depressive symptoms, major discrimination, global perceived stress) in the
association between unfair treatment and AL. Finally, the findings add to increasing evidence
suggesting that the exclusive focus on racial and ethnic discrimination should be broadened to
include experiences of unfair treatment that are at the intersection of multiple group identities,
such as race/ethnicity, religion, gender, income, physical appearance, and age (Lewis, et al.,
2006; Lewis, Troxel, Kravitz et al., 2013; Roberts, et al., 2008; Troxel, et al., 2003). Although
the mechanisms underlying the observed association have yet to be determined, these findings
add to the growing literature linking everyday unfair treatment to key regulatory physiological
systems.
EVERYDAY UNFAIR TREATMENT 19
Table 1. Sample Characteristics
Characteristic n % or Range M SD
Socio-demographic
Age (years) 233 37 - 85 53.59 10.41
Male 76 32.6%
Female 157 67.4%
Education (%) 233
≤ High school 106 45.5%
Some college 81 34.8%
≥ University degree 46 19.7%
Health behaviors
Smoking 189
Non-smoker 56 29.6%
Ex-smoker 67 35.4%
Current smoker 66 34.9%
Alcohol problems 231 0 - 1 0.08 0.28
Medication use (% yes)
Blood pressure 109 46.8%
Cholesterol 48 20.6%
Steroid 24 10.3%
Depression 16 6.9%
Mental health
Anxiety 230 12.00 - 52.00 20.07 7.99
Depression 229 11.00 - 40.00 17.34 6.41
Lifetime mistreatment
Never 55 23.6%
1-2 instances 62 26.6%
3 or more 116 49.8%
Everyday mistreatment 230 9.00 - 32.00 14.97 6.58
______________________________________________________________________________

EVERYDAY UNFAIR TREATMENT 20
Table 2. Descriptive statistics, cut points, and correlations between system-level and allostatic load scores
Biomarkers by System M SD Cut Points r
Cardiovascular regulation 0.40**
Resting SBP (mm Hg) 133.86 20.47 ≥ 145.00
Resting DBP (mm Hg) 79.11 11.75 ≥ 86.00
Resting heart rate (beats per min) 73.53 10.87 ≥ 80.30
Lipid metabolism 0.47**
BMI (kg/m2) 32.47 7.84 ≥ 37.38
Waist to hip circumference ratio 0.89 0.09 ≥ 0.96
Serum triglycerides (mg/dL) 111.04 66.77 ≥ 132.00
HDL cholesterol (mg/dL) 59.16 19.23 ≤ 45.00
LDL cholesterol (mg/dL) 101.20 35.54 ≥ 121.36
Glucose metabolism 0.56**
Blood glycated hemoglobin (HbA1c) 6.14 0.64 ≥ 6.49
Fasting blood glucose (mg/dL) 101.27 15.43 ≥ 107.00
Homeostasis model insulin resistance 3.73 2.68 ≥ 5.24
Inflammation 0.54**
Serum C-reactive protein (mg/L) 2.89 2.48 ≥ 4.12
Serum IL6 (ng/mL) 3.41 1.99 ≥ 4.70
Fibrinogen (mg/dL) 384.09 87.78 ≥ 439.00
E-selectin (ng/mL) 50.45 25.93 ≥ 63.72
ICAM-1 (ng/mL) 266.58 138.09 ≥ 356.14
Sympathetic nervous system 0.41**
Urine epinephrine (mg/g of creatine) 1.59 1.08 ≥ 1.86
Urine norepinephrine (mg/g of creatine) 24.64 11.90 ≥ 29.83
Parasympathetic nervous system 0.48**
R-R interval standard deviation (ms) 38.15 17.61 ≤ 24.95
Root mean square successive differences (ms) 27.39 16.01 ≤ 16.32
Low frequency spectral power (ms2) 353.59 291.89 ≤ 116.25
High frequency spectral power (ms2) 291.07 248.17 ≤ 99.80
Hypothalamic pituitary adrenal axis 0.29**
Urine cortisol (mg/g of creatine) 10.31 8.18 ≥ 14.00
Blood DHEA-S (μg/dL) 99.66 68.47 ≥ 137.00
Allostatic load 1.91 1.01
_____________________________________________________________________________________
Note. r = pairwise correlations between the system-level risk scores and AL summary index and are
based on pooled estimates from multiple imputation. **p < .01
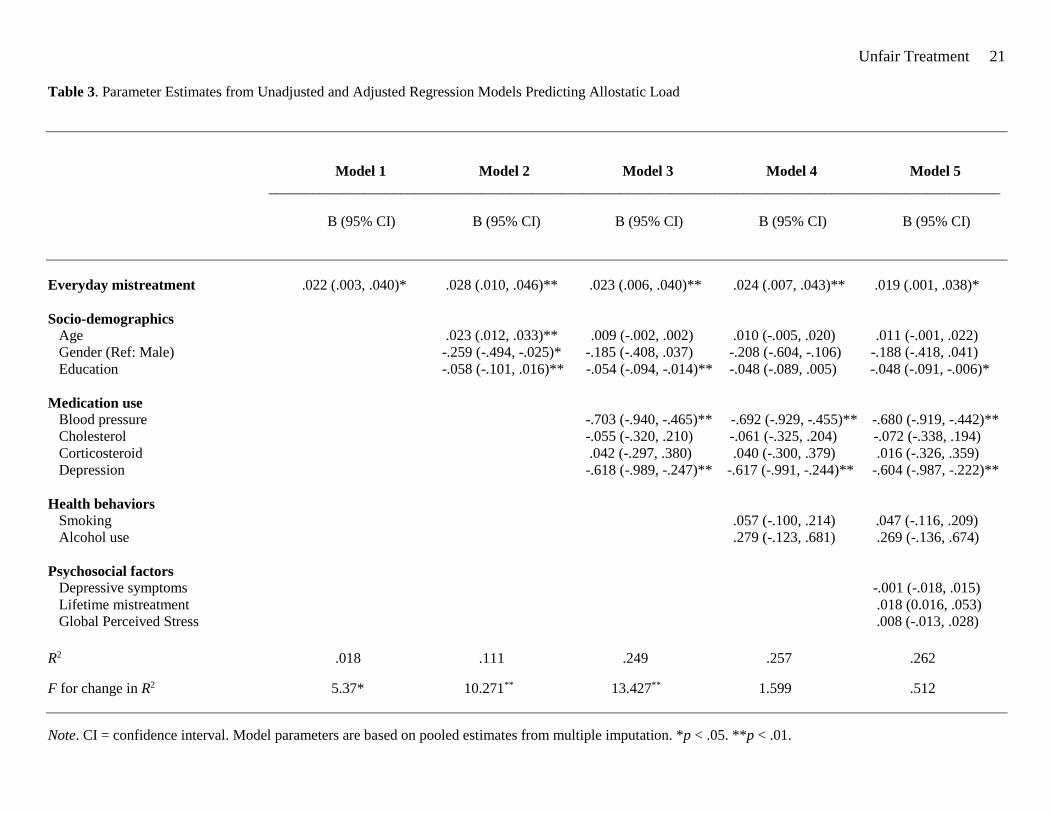
Unfair Treatment 21 Table 3. Parameter Estimates from Unadjusted and Adjusted Regression Models Predicting Allostatic Load
Model 1 Model 2 Model 3 Model 4 Model 5 ____________________________________________________________________________________________________
B (95% CI) B (95% CI) B (95% CI) B (95% CI) B (95% CI)
Everyday mistreatment .022 (.003, .040)* .028 (.010, .046)** .023 (.006, .040)** .024 (.007, .043)** .019 (.001, .038)*
Socio-demographics
Age .023 (.012, .033)** .009 (-.002, .002) .010 (-.005, .020) .011 (-.001, .022)
Gender (Ref: Male) -.259 (-.494, -.025)* -.185 (-.408, .037) -.208 (-.604, -.106) -.188 (-.418, .041)
Education -.058 (-.101, .016)** -.054 (-.094, -.014)** -.048 (-.089, .005) -.048 (-.091, -.006)*
Medication use
Blood pressure -.703 (-.940, -.465)** -.692 (-.929, -.455)** -.680 (-.919, -.442)**
Cholesterol -.055 (-.320, .210) -.061 (-.325, .204) -.072 (-.338, .194)
Corticosteroid .042 (-.297, .380) .040 (-.300, .379) .016 (-.326, .359)
Depression -.618 (-.989, -.247)** -.617 (-.991, -.244)** -.604 (-.987, -.222)**
Health behaviors
Smoking .057 (-.100, .214) .047 (-.116, .209)
Alcohol use .279 (-.123, .681) .269 (-.136, .674)
Psychosocial factors
Depressive symptoms -.001 (-.018, .015)
Lifetime mistreatment .018 (0.016, .053)
Global Perceived Stress .008 (-.013, .028)
R2 .018 .111 .249 .257 .262
F for change in R2 5.37* 10.271** 13.427** 1.599 .512
Note. CI = confidence interval. Model parameters are based on pooled estimates from multiple imputation. *p < .05. **p < .01.
Unfair Treatment 22
Figure Caption
Figure. 1. Bar graph shows mean levels of allostatic load (AL) in low, intermediate, and high
unfair treatment tertiles. Base model (solid bars) adjusted for age, gender, and education. Final
model (hatched bars) represent additional adjustment for medication use, smoking status, alcohol
problems, depression scores, lifetime unfair treatment, and global perceived stress. Error bars are
standard error of the mean.
Unfair Treatment 23
Figure 1.
3.5
3.7
3.9
4.1
4.3
4.5
4.7
4.9
Low Intermediate High
Allo
stat
ic L
oad
Sco
re
Everyday Unfair Treatment
Base Model
Final Model

Unfair Treatment 24
References
Barnes, L. L., De Leon, C. F. M., Wilson, R. S., Bienias, J. L., Bennett, D. A., & Evans, D. A.
(2004). Racial differences in perceived discrimination in a community population of
older blacks and whites. Journal of Aging and Health, 16, 315-337.
Beatty, D. L., & Matthews, K. A. (2009). Unfair treatment and trait anger in relation to nighttime
ambulatory blood pressure in African American and white adolescents. Psychosomatic
Medicine, 71, 813–820.
Blendon, R. J., Aiken, L. H., Freeman, H. E., & Corey, C. R. (1989). Access to medical care for
black and white Americans: A matter of continuing concern. Journal of the American
Medical Association, 81, 261-278.
Brim, O. G., Ryff, C. D., & Kessler, R. C. (Eds.). (2004). How healthy are we?: A national study
of well-being at midlife: Chicago, IL, US: University of Chicago Press.
Brody, G. H., Lei, M. K., Chae, D. H., Yu, T., Kogan, S. M., & Beach, S. R. H. (2014).
Perceived discrimination among African American adolescents and allostatic load: A
longitudinal analysis with buffering effects. Child Development, 85, 989-1002.
Brown, T. N., Williams, D. R., Jackson, J. S., Neighbors, H. W., & Torres, M. M. (2000). "Being
black and feeling blue”: The mental health consequences of racial discrimination. Race
and Society, 2, 117–131.
Clark, L. A., & Watson, D. (1991). Tripartite model of anxiety and depression: Evidence and
taxonomic implications. Journal of Abnormal of Psychology, 100, 316-336.
Cohen, J., West, S. G., & Aiken, L. S. (2003). Applied multiple regression/correlation analysis
for the behavioral sciences (3rd ed.): Mahwah, NJ, US: Lawrence Erlbaum Associates,
Publishers.
Unfair Treatment 25
Crowley, O. V., McKinley, P. S., Burg, M. M., Schwartz, J. E., Ryff, C. D., Weinstein, M., . . .
Sloan, R. P. (2011). The interactive effect of change in perceived stress and trait anxiety
on vagal recovery from cognitive challenge. International Journal of Psychophysiology,
82, 225-232.
De Vogli, R., Ferrie, J., Chandola, T., Kivimaki, M., & Marmot, M. (2007). Unfairness and
health: Evidence from the Whitehall II Study. Journal of Epidemiology and Community
Health, 61, 513–518.
DeLongis, A., Coyne, J. C., Dakof, G., Folkman, S., & Lazarus, R. S. (1982). Relationship of
daily hassles, uplifts, and major life events to health status. Health Psychology, 1, 119-
136.
Forman, T. A., Williams, D. R., & Jackson, J. S. (1997). Race, place, and discrimination.
Perspectives on Social Problems, 9, 231–261.
Friedman, E. M., Williams, D. R., Singer, B. H., & Ryff, C. D. (2009). Chronic discrimination
predicts higher circulating levels of E-selectin in a national sample: The MIDUS study.
Brain, Behavior, and Immunity, 23, 684-692.
Fuller-Rowell, T. E., Doan, S. N., & Eccles, J. S. (2012). Differential effects of perceived
discrimination on the diurnal cortisol rhythm of African Americans and Whites.
Psychoneuroendocrinology, 37, 107-118.
Geronimus, A. T., Hicken, M., Keene, D., & Bound, J. (2006). 'Weathering' and age patterns of
allostatic load scores among Blacks and Whites in the United States. American Journal of
Public Health, 96, 826-833.
Graham, J. W. (2009). Missing data analysis: Making it work in the real world. Annual Review of
Psychology, 60, 549–576.

Unfair Treatment 26
Gruenewald, T. L., Karlamangla, A. S., Hu, P., Stein-Merkin, S., Crandall, C., Koretz, B., &
Seeman, T. E. (2012). History of socioeconomic disadvantage and allostatic load in later
life. Social Science & Medicine, 74, 75-83.
Harel, O. (2009). The estimation of R2 and adjusted R2 in incomplete data sets using multiple
imputation. Journal of Applied Statistics, 36, 1109–1118.
House, J., Lantz, P., & Herd, P. (2005). Continuity and change in the social stratification of
aging and health over the life course: Evidence from a nationally representative
longitudinal study from 1986 to 2001/2002 (Americans' Changing Lives Study). Journal
of Gerontology: Psychological Sciences, 60, S15–S26.
Hunte, H. E. (2011). Association between perceived interpersonal everyday discrimination and
waist circumference over a 9-year period in the midlife development in the United States
Cohort Study. American Journal of Epidemiology and Community Health, 173, 1232–
1239.
Kanner, A. D., Coyne, J. C., Schaefer, C., & Lazarus, R. S. (1981). Comparison of two modes of
stress measurement: Daily hassles and uplifts versus major life events. Journal of
Behavioral Medicine, 4, 1-39.
Karlamangla, A. S., Singer, B. H., McEwen, B. S., Rowe, J. W., & Seeman, T. E. (2002).
Allostatic load as a predictor of functional decline: MacArthur studies of successful
aging. Journal of Clinical Epidemiology, 55, 696-710.
doi:http://dx.doi.org/10.1016/S0895-4356(02)00399-2
Karlamangla, A. S., Singer, B. H., & Seeman, T. E. (2006). Reduction in allostatic load in older
Adults is associated with lower all-cause mortality risk: MacArthur studies of successful
aging. Psychosomatic Medicine, 68, 500-507.

Unfair Treatment 27
Kessler, R. C., Mickelson, K. D., & Williams, D. R. (1999). The prevalence, distribution, and
mental health correlates of percieved discrimination in the United States. Journal of
Health and Social Behavior, 40, 208-230.
Krieger, N. (1990). Racial and gender discrimination: Risk factors for high blood pressure?
Social Science & Medicine, 30, 1273-1281.
Krieger, N. (1999). Embodying inequality: A review of concepts, measures, and methods for
studying health consequences of discrimination. International Journal of Health Services,
29, 295-352.
Lewis, T. T., Aiello, A. E., Leurgans, S., Kelly, J., & Barnes, L. L. (2010). Self-reported
experiences of everyday discrimination are associated with elevated C-reactive protein
levels in older African-American adults. Brain, Behavior, and Immunity, 24, 438–443.
Lewis, T. T., Cogburn, C. D., & Williams, D. R. (2015). Self-reported experiences of
discrimination and health: Scientific advances, ongoing controversies, and emerging
issues. Annual Review of Clinical Psychology, 11, 407-440.
Lewis, T. T., Everson-Rose, S. A., Powell, L. H., Matthews, K. A., Brown, C., Karavolos, K., &
Wesley, D. (2006). Chronic exposure to everyday discrimination and coronary artery
calcification in African-American women: The SWAN Heart Study. Psychosomatic
Medicine, 68, 362–368.
Lewis, T. T., Troxel, W. M., Kravitz, H. M., Bromberger, J. T., Matthews, K. A., & Hall, M. H.
(2013). Chronic exposure to everyday discrimination and sleep in a multiethnic sample of
middle-aged women. Health Psychology, 32, 810.

Unfair Treatment 28
Lewis, T. T., Yang, F. M., Jacobs, E. A., & Fitchett, G. (2012). Racial/ethnic differences in
responses to the Everyday Discrimination Scale: A differential item functioning analysis.
American Journal of Epidemiology, 175, 391-401.
Love, G. D., Seeman, T. E., Weinstein, M., & Ryff, C. D. (2010). Bioindicators in the MIDUS
National Study: Protocol, measures, sample, and comparative context. Journal of Aging
and Health, 22, 1059-1080.
Lynch, J., & Smith, G. D. (2005). A life course approach to chronic disease epidemiology.
Annual Review of Public Health, 26, 1-35.
Mays, V. M., & Cochran, S. D. (2001). Mental health correlates of perceived discrimination
among lesbian, gay, and bisexual adults in the United States. American Journal of Public
Health, 91, 1869-1876.
Mays, V. M., Cochran, S. D., & Barnes, N. W. (2007). Race, race-based discrimination, and
health outcomes among African Americans. Annual Review of Psychology, 58, 201-225.
McEwen, B. S. (2000). Allostasis and allostatic load: Implications for
neuropsychopharmacology. Neuropsychopharmacology, 22, 108-124.
McEwen, B. S. (2003). Mood disorders and allostatic load. Biological Psychiatry, 54, 200-207.
doi:http://dx.doi.org/10.1016/S0006-3223(03)00177-X
McEwen, B. S., & Seeman, T. E. (1999). Protective and damaging effects of mediators of stress:
Elaborating and testing the concepts of allostasis and allostatic load. Annals of the New
York Academy of Sciences, 896, 30-47. doi:10.1111/j.1749-6632.1999.tb08103.x
McEwen, B. S., & Stellar, E. (1993). Stress and the individual: Mechanisms leading to disease.
Archives of Internal Medicine, 153, 2093–2101.

Unfair Treatment 29
Ong, A. D., Fuller-Rowell, T., & Burrow, A. L. (2009). Racial discrimination and the stress
process. Journal of Personality and Social Psychology, 96, 1259-1271.
doi:10.1037/a0015335
Pascoe, E. A., & Smart Richman, L. (2009). Perceived discrimination and health: A meta-
analytic review. Psychological Bulletin, 135, 531-554. doi:10.1037/a0016059
Pieterse, A. L., Todd, N. R., Neville, H. A., & Carter, R. T. (2012). Perceived racism and mental
health among Black American adults: A meta-analytic review. Journal of Counseling
Psychology, 59, 1-9.
Roberts, C. B., Vines, A. I., Kaufman, J. S., & James, S. A. (2008). Cross-sectional association
between perceived discrimination and hypertension in African-American men and
women: The Pitt County Study. American Journal of Epidemiology, 167, 624–632.
Royston, P. (2005). Multiple imputation of missing values: Update. The Stata Journal, 5, 188–
201.
Rubin, D. B. (1987). Multiple imputation for nonresponse in surveys. New York: John Wiley &
Sons.
Ryff, C. D., Almeida, D. M., Ayanian, J. S., Carr, D. S., Cleary, P. D., Coe, C., . . . Williams, D.
R. (2008a). Field Report--Midlife Development in the United States (MIDUS II):
Milwaukee African American sample, 2005-2006. Ann Arbor, MI: Inter-university
Consortium for Political and Social Research.
Ryff, C. D., Almeida, D. M., Ayanian, J. S., Carr, D. S., Cleary, P. D., Coe, C., . . . Williams, D.
R. (2008b). National Survey of Midlife Development in the United States (MIDUS II),
2004-2006. ICPSR04652-v6. Ann Arbor, MI: Inter-university Consortium for Political
and Social Research.
Unfair Treatment 30
Schmitt, M. T., Branscombe, N. R., Postmes, T., & Garcia, A. (2014). The consequences of
perceived discrimination for psychological well-being: A meta-analytic review.
Psychological Bulletin, 140, 921-948.
Schulz, A., Israel, B., Williams, D., Parker, E., Becker, A., & James, S. (2000). Social
inequalities, stressors and self reported health status among African American and white
women in the Detroit metropolitan area. Social Science & Medicine, 51, 1639-1653.
Seeman, T. E., Crimmins, E., Huang, M., Singer, B., Bucur, A., Gruenewald, T., . . . Reuben, D.
B. (2004). Cumulative biological risk and socio-economic differences in mortality:
MacArthur Studies of Successful Aging. Social Science & Medicine, 58, 1985-1997.
Seeman, T. E., Epel, E., Gruenewald, T., Karlamangla, A., & McEwen, B. S. (2010). Socio-
economic differentials in peripheral biology: Cumulative allostatic load. Annals of the
New York Academy of Sciences, 1186, 223-239. doi:10.1111/j.1749-6632.2009.05341.x
Seeman, T. E., McEwen, B. S., Rowe, J. W., & Singer, B. H. (2001). Allostatic load as a marker
of cumulative biological risk: MacArthur studies of successful aging. Proceedings of the
National Academy of Sciences of the United States of America, 98, 4770-4775.
Seeman, T. E., Singer, B. H., Rowe, J. W., Horwitz, R. I., & McEwen, B. S. (1997). Price of
adaptation—allostatic load and its health consequences: Macarthur studies of successful
aging. Archives of Internal Medicine, 157, 2259-2268.
doi:10.1001/archinte.1997.00440400111013
Seeman, T. E., Singer, B. H., Ryff, C. D., Dienberg Love, G., & Levy-Storms, L. (2002). Social
relationships, gender, and allostatic load across two age cohorts. Psychosomatic
Medicine, 64, 395-406.

Unfair Treatment 31
Segerstrom, S. C., & Miller, G. E. (2004). Psychological stress and the human immune system:
A meta-analytic study of 30 years of inquiry. Psychological Bulletin, 130, 601-630.
Selzer, M. L. (1971). The Michigan Alcohol Screening Test: The quest for a new diagnostic
instrument. American Journal of Psychiatry, 127, 89–94.
Smart Richman, L., Pek, J., Pascoe, E., & Bauer, D. J. (2010). The effects of perceived
discrimination on ambulatory blood pressure and affective responses to interpersonal
stress modeled over 24 hours. Health Psychology, 29, 403-411.
Soto, J. A., Dawson-Andoh, N. A., & BeLue, R. (2011). The relationship between perceived
discrimination and generalized anxiety disorder among African Americans, Afro
Caribbeans, and non-Hispanic whites. Journal of Anxiety Disorders, 25, 258–265.
Troxel, W. M., Matthews, K. A., Bromberger, J. T., & Sutton-Tyrrell, K. (2003). Chronic stress
burden, discrimination, and subclinical carotid artery disease in African American and
Caucasian women. Health Psychology, 22, 300–309.
Upchurch, D. M., Stein, J., Greendale, G. A., Chyu, L., Tseng, C.-H., Huang, M.-H., . . .
Seeman, T. E. (2015). A longitudinal investigation of race, socioeconomic status, and
psychological mediators of allostatic load in midlife women: Findings from the study of
women's health across the nation. Psychosomatic Medicine, 77, 402-412.
Williams, D. R., & Mohammed, S. A. (2009). Discrimination and racial disparities in health:
Evidence and needed research. Journal of Behavioral Medicine, 32, 20–47.
Williams, D. R., & Rucker, T. D. (2000). Understanding and addressing racial disparities in
health care. Health Care Financing Reviews, 21, 75-90.

Unfair Treatment 32
Williams, D. R., Yu, Y., Jackson, J. J., & Anderson, N. B. (1997). Racial differences in physical
and mental health: Socioeconomic status, stress, and discrimination. Journal of Health
Psychology, 2, 335–351.
Yancik, R., Ershler, W. B., Satariano, W., Hazzard, W., Cohen, H. J., & Ferrucci, L. (2007).
Report of the national aging task force on comorbidity. Journal of Gerontology: Medical
Sciences, 62, 275-280.