Events of Corrosion Phenomena on Carbon Steel Pipes in ...
14
EKSAKTA Vol. 20 Issue 1/30 April 2019 E-ISSN : 2549-7464, P-ISSN : 1411-3724 86 | EKSAKTA : Berkala Ilmiah Bidang MIPA DOI : 10.24036/eksakta/vol20-iss01/178 http://www.eksakta.ppj.unp.ac.id Events of Corrosion Phenomena on Carbon Steel Pipes in Environment of Sea Water and Ammonia Solutions due to the Presence of Sweet Gas N S Syafei N S 1* , D Hidayat 2 , Emlliano 3 , L K Men 4 1-3 Electrical Engineering Study Program, FMIPA, Universitas Padjadjaran, Indonesia 4 Physics study Program, FMIPA, Universitas Padjadjaran, Indonesia. Email : [email protected] Abstract. Based on the results of the study that the test sample material using carbon steel pipe plate API 5L-X65 is in chamber. With the research using the three point loading method is the environment of CO 2 gas and saturated H 2 S gas in a solution of 7900 ml of sea water and 100 ml ammonia, the corrosion phenomenon occurs. And the corrosion event that occurs, is stress corrosion cracking transgranular and intergranular based the results of microstructure test results and based the results of polarized microscopy test. The corrosion rate that occurs will increase with the deflection given to the larger test samples for the same exposure time, the corrosion rate that occurs will increase with the stress σ given to the test sample getting larger for the same exposure time and inside crack will get deeper with the deflection given to the test sample getting larger for the same exposure time. Keywords: stress corrosion cracking , sweet gas, specimen three-point loading. 1. Introduction Research corrosion rate on carbon steel pipe API 5L-Grade B in the environment of H 2 S gas CO 2 saturated condition in NaCl solution{1], the rate of corrosion in the carbon steel pipe 5L-Grade B in the H 2 S gas atmosphere and the saturated CO 2 conditions in NaCl solution and acetic acid solution[2], study of crack corrosion cracking due to sweet gas (H 2 S and CO 2 ) on carbon steel pipe API 5L-X65 to corrosion rate in acetic acid solution. [6] Characteristics of the Carbon steel Pipe 5L-X65 API with the Three Point Point H2S Gas Temperature Conditions Saturated CO 2 in Acetic Acid Solution[8], Hardness Testing and Tensile Test To Determine Hardening Coefficient n An API Material 5L-X65[7]. Analysis of corrosion phenomenon of carbon steel pipe plate API 5L-X65 in a solution of 250 ml of acetic acid and 4750 aquades under conditions of CO 2 and H 2 S gas saturated at room temperature[15]. In the oil and gas industry in the event of stress corrosion cracking will result in fatal, ie pipe rupture that will result in oil and gas production will be stopped. The corrosion rate on the 5L-X65 API carbon steel pipe with the three point loading method on acetic acid solution filled with CO 2 gas and H 2 S in saturated state[13]. Analysis stress Corrosion Cracking on carbon steel pipe API 5L-X65 in Solution 7900
Transcript of Events of Corrosion Phenomena on Carbon Steel Pipes in ...

EKSAKTA Vol. 20 Issue 1/30 April 2019 E-ISSN : 2549-7464, P-ISSN : 1411-3724
86 | E K S A K T A : B e r k a l a I l m i a h B i d a n g M I P A
DOI : 10.24036/eksakta/vol20-iss01/178
http://www.eksakta.ppj.unp.ac.id
Events of Corrosion Phenomena on Carbon Steel Pipes in
Environment of Sea Water and Ammonia Solutions due to
the Presence of Sweet Gas
N S Syafei N S 1*, D Hidayat 2, Emlliano3, L K Men4
1-3 Electrical Engineering Study Program, FMIPA, Universitas Padjadjaran,
Indonesia 4 Physics study Program, FMIPA, Universitas Padjadjaran, Indonesia.
Email : [email protected]
Abstract. Based on the results of the study that the test sample material using
carbon steel pipe plate API 5L-X65 is in chamber. With the research using the
three point loading method is the environment of CO2 gas and saturated H2S gas
in a solution of 7900 ml of sea water and 100 ml ammonia, the corrosion
phenomenon occurs. And the corrosion event that occurs, is stress corrosion
cracking transgranular and intergranular based the results of microstructure test
results and based the results of polarized microscopy test. The corrosion rate that
occurs will increase with the deflection given to the larger test samples for the
same exposure time, the corrosion rate that occurs will increase with the stress σ
given to the test sample getting larger for the same exposure time and inside crack
will get deeper with the deflection given to the test sample getting larger for the
same exposure time.
Keywords: stress corrosion cracking , sweet gas, specimen three-point loading.
1. Introduction
Research corrosion rate on carbon steel pipe API 5L-Grade B in the environment
of H2S gas CO2 saturated condition in NaCl solution{1], the rate of corrosion in the
carbon steel pipe 5L-Grade B in the H2S gas atmosphere and the saturated CO2 conditions
in NaCl solution and acetic acid solution[2], study of crack corrosion cracking due to
sweet gas (H2S and CO2) on carbon steel pipe API 5L-X65 to corrosion rate in acetic acid
solution. [6] Characteristics of the Carbon steel Pipe 5L-X65 API with the Three Point
Point H2S Gas Temperature Conditions Saturated CO2 in Acetic Acid Solution[8],
Hardness Testing and Tensile Test To Determine Hardening Coefficient n An API
Material 5L-X65[7]. Analysis of corrosion phenomenon of carbon steel pipe plate API
5L-X65 in a solution of 250 ml of acetic acid and 4750 aquades under conditions of CO2
and H2S gas saturated at room temperature[15]. In the oil and gas industry in the event of
stress corrosion cracking will result in fatal, ie pipe rupture that will result in oil and gas
production will be stopped.
The corrosion rate on the 5L-X65 API carbon steel pipe with the three point
loading method on acetic acid solution filled with CO2 gas and H2S in saturated state[13].
Analysis stress Corrosion Cracking on carbon steel pipe API 5L-X65 in Solution 7900

EKSAKTA Vol. 20 Issue 1/30 April 2019 E-ISSN : 2549-7464, P-ISSN : 1411-3724
87 | E K S A K T A : B e r k a l a I l m i a h B i d a n g M I P A
DOI : 10.24036/eksakta/vol20-iss01/178
http://www.eksakta.ppj.unp.ac.id
ml of Sea Water and 100 ml of Ammonia filled with CO2 and H2S Gases in Saturated
Condition[14].
From the results of research on carbon steel pipe API 5L-X60 that is 17H1S will be
susceptible to stresscorrosion cracking. And the mechanical properties of the degraded
carbon steel pipe API 5L-X60 show higher resistance to corrosion cracking than in carbon steel pipes. Based on observations with fractographic that carbon steel pipe due to the
hydrogen embrittlement process will occur stress corrosion cracking, that is caused by
hydrogen atoms penetrating into the carbon steel pipe[11] .
High corrosion resistance in stainless steel carbon pipe (super martensite) is
commonly used in the oil and gas industry, especially in acid environments. However
there are some susceptible to the presence of hydrogen and the corrosion process
mechanism will occur in the presence of H2S and depending on pH H2S diffuses seeping
along the metal structure it will form sulfide metal pores as it reacts on the metal surface,
thereby freeing the hydrogen bonded with sulfur which can absorbed and the hydrogen
present in the H2S solution indirectly causes failure[12].
This results in the loss of early mechanical properties especially resistance to
brittle fracture, which is based on engineering calculations at the pipe design stage. At
the same time of stress corrosion cracking has been identified as one of the dominant
failures in carbon steel pipes in humid environments, which would lead to the breakup of
high-pressure gas transmission pipes as well as serious economic losses and disasters.[11]
Commercial steel SS-430 undergoes a continuous corrosion process in the NaCl
environment. The corrosion reaction that occurs, is dominated by an anodic reaction. The
measured corrosion rate is very small with the tendency to decrease as the concentration
of NaCl solution increases. So it can be concluded that SS-430 has outstanding corrosion
resistance in NaCl environment. The corrosion products occurring on the SS-430 steel
surface in the NaCl environment are predominantly chrome oxide and iron oxide. [4]
Based on the research that has been done, it can be seen that the effect of
temperature on the protective properties of poly (TMSPMA) material on the surface of
carbon steel by Electrochemical Impedance Spectroscopy (EIS) method in some
temperature variations, 25ºC, 45ºC, 60ºC, and 75ºC. From the results of fittings made to
the EIS measurement results obtained information that there is a decrease in the
impedance value is often the temperature rise which shows that the resistance of corrosion
protection material in critical condition to protect the carbon steel decreases. [5]
The corrosion occurs is the stress corrosion cracking transgranular and the stress
corrosion crackin intergranular due to the sweet gas (CO2 and H2S gas) based on figure
7 and ammonia solution which is an element of ammonia anhydrous condensate. Crack
deepness deeper with equal exposure time and variation stress σ based on figure 8. [15]
Based on the experimental results it is shown that the dominant corrosion product formed
is FeS and the corrosion resistance of tense crack increases with increasing workload,
dissolved H2S concentration, and time of combustion.
2. Experimental Section
Tools and Materials
Tools and materials used in this research is a SEM-EDS, Optical Microscope , polarized
microscope. The materials used in this research is the chamber, API 5L-X65 carbon steel
plate, acetic acid (CH3COOH), ammonia solution, aquadest, H2S gas and CO2 ga .

EKSAKTA Vol. 20 Issue 1/30 April 2019 E-ISSN : 2549-7464, P-ISSN : 1411-3724
88 | E K S A K T A : B e r k a l a I l m i a h B i d a n g M I P A
DOI : 10.24036/eksakta/vol20-iss01/178
http://www.eksakta.ppj.unp.ac.id
Procedure
To make a house a corrosion test sample is required a sheet of steel in the form of a plate
or flat extruded section with a rectangular cross section. In addition it can also be used
cast iron or iron in the form of a beam as shown in Figure 1. The material to be tested is
thinly sliced and then bent at both ends to obtain a voltage, and the magnitude of the voltage can be adjusted by providing a deflection through a screw-driven thread as shown
in FIG. 1b. And this research uses 5L-X65 API carbon steel plate with length 12.5 cm,
width 2 cm and thickness 2 mm stored in holder specimen three dot loading as shown
(1.a) inserted into chamber room of corrosion test as much as 3 sample test corrosion with
deflection variation as shown in figure (1.c) and image (1.d) is a 5L-X65 API test plate[3].
d. Samples of 5L-X6 API test specimens.
Figure 1. Holder shape and mounting of test specimen.
Research carried out that the carbon steel plate of API 5L-X65 is stored in the holder and then
inserted into chamber chamber containing 4900 ml sea water and 100 ml ammonia as shown in
Figure 2. The population of the corrosion test samples each time variation consists of three carbon
API 5L API -X65 with three deflection variations, whereas the weight before and after the
corrosion test was weighed.
Figure 2. Chamber corrosion test.

EKSAKTA Vol. 20 Issue 1/30 April 2019 E-ISSN : 2549-7464, P-ISSN : 1411-3724
89 | E K S A K T A : B e r k a l a I l m i a h B i d a n g M I P A
DOI : 10.24036/eksakta/vol20-iss01/178
http://www.eksakta.ppj.unp.ac.id
The tensile test is a mechanical stress-strain test that aims to determine the strength of the
material to the tensile force as shown in figure 3. In the test that the test material is pulled
to break and usually the focus is the maximum capability of the material in withstanding
the tensile load, and the ability / strength This maximum pull is generally called "Ultimate
Tensile Strength (UTS)". The long change in the curve is called the technical strain (εeng), which is defined as the change in length occurring due to a static change (ΔL) to
the initial bar length (L0). The stress generated in this process is called the engineering
voltage (σeng), which is defined as the loading value that occurs (F) on an initial cross-
section (A0). The normal stresses due to static press charges can be determined based on
the following equation:
σ = F/Ao (1)
with:
σ = Normal stress due to static tensile load (N / mm2).
F = Tensile load (N).
Ao = Area of initial specimen cross section (mm2) as shown in Figure 3.
Figure 3. Basic principles of stress / stress (Callister, D. William 2007).
The strain due to the static tensile load can be determined by the following equation:
ε = ΔL/L (2)
with:
ΔL = L-L0, ε = Strain due to static tensile load.
L = Change of length of specimen due to tensile load (mm).
Lo = The length of the initial specimen (mm).
Flat-shaped specimens have dimensions of width, length, and thickness of specimens
usually determined by the product of the material used. The specimen holder in both ends
of the specimen is bent / pressed with the screw (fitted with the ball), the support is in the
middle of the plane. The dimensions of the specimens used can be modified according to

EKSAKTA Vol. 20 Issue 1/30 April 2019 E-ISSN : 2549-7464, P-ISSN : 1411-3724
90 | E K S A K T A : B e r k a l a I l m i a h B i d a n g M I P A
DOI : 10.24036/eksakta/vol20-iss01/178
http://www.eksakta.ppj.unp.ac.id
the specific needs (materials used), but their proportions are estimated proportionately.
Calculation of elastic stress as in the following equation:
σ = 6 E t y/H2 (3)
with:
σ = maximum tensile stress (N / m2).
E = modulus of elasticity (N / m2).
t = specimen thickness (mm).
y = maximum deflection (mm).
H = distance between external buffer (mm) and small deflection (y / H less than 0.1) as
shown in Figure 3. Flat chip specimens with 25-51 mm (1-2 inches), 127-254 mm length
(5 - 10 inches) and the thickness of the specimen is usually determined the product of the
material used as shown in figure 1.
3. Results and Discussion
The data obtained based on the weight before and after the corrosion test was obtained to
calculate the corrosion rate, and the test samples were then tested using microstructures
and polarized microscope will be seen that the carbon steel plate image occurred
corrosion and crack length. This research needs to be developed by using ultrasonic
method to find out crack length that is based on reflection of wave that concerning surface
of carbon steel plate. And the 5L-X65 API carbon steel plate in the chamber corrosion
test chamber is loaded with saturated CO2 gas, and filled H2S gas for 10 minutes every
two days as shown in table data 1.
Table 1. Corrosion Rate of Strained and Time Variations in Seeds 4700 ml, 100 ml Ammonia with H2S
and CO2 Saturated At Room Temperature.
No. Minitial
(gr) Mfinal(gr)
PH
initial
PH
final
Length
(cm)
Width
(cm)
Thichness
(cm)
Deflection
(y) cm
Inside
Crack
initial
(cm)
Time
Exposure
(hours)
Corrosion rate
(mmpy)
A-1 52.99 52.96 14 10 13.1 2.42 2.4 0.5 0.02 336 0.031388956
A-2 53.73 53.53 14 10 13.1 2.42 2.4 1 0.02 336 0.209259709
A-3 53.18 52.69 14 10 13.1 2.42 2.4 1.5 0.02 336 0.512686287
B-1 53.21 52.76 14 9 13.1 2.42 2.4 0.5 0.02 672 0.235417172
B-2 53.29 52.65 14 9 13.1 2.42 2.4 1 0.02 672 0.334815534
B-3 53.96 52.76 14 9 13.1 2.42 2.4 1.5 0.02 672 0.627779127
C-1 53.33 52.95 14 9 13.1 2.42 2.4 0.5 0.02 1008 0.132531149
C-2 53.13 52.7 14 9 13.1 2.42 2.4 1 0.02 1008 0.149969458
C-3 53.26 52.63 14 9 13.1 2.42 2.4 1.5 0.02 1008 0.219722694

EKSAKTA Vol. 20 Issue 1/30 April 2019 E-ISSN : 2549-7464, P-ISSN : 1411-3724
91 | E K S A K T A : B e r k a l a I l m i a h B i d a n g M I P A
DOI : 10.24036/eksakta/vol20-iss01/178
http://www.eksakta.ppj.unp.ac.id
D-1 53.35 53.21 14 9 13.1 2.42 2.4 1.5 0.02 1344 0.036620449
D-2 53.07 52.5 14 9 13.1 2.42 2.4 1 0.02 1344 0.149097543
D-3 53.84 52.66 14 9 13.1 2.42 2.4 0.5 0.02 1344 0.308658071
The data in table 2 that the magnitude of the strain of each carbon steel sample test sample
(figure 1.c with different deflection) is inserted in the chamber as shown in figure 2, and the
results of the study based on the variation of time and deflection variation are obtained as in table
1. Based on the data in table 1 that the corrosion rate to the variation of exposure time of the test
sample with the same deflection, then obtained the corrosion rate as shown in figure 3 is like a
parabola. And the corrosion rate to the variation of stress σ at the same exposure time is obtained
as in figure 4, ie the greater the stress σ given the greater the corrosion rate for the same time
exposure.
Table 2. Table of calculation stress based on equation 3.
No E (N/m²) t (m) y (m) H (m) H ² (m²) σ (N/m²)
1 2.05E+11 0.0022 0.005 0.0946 0.008949 1.51E+09
2 2.05E+11 0.0022 0.01 0.0946 0.008949 3.02E+09
3 2.05E+11 0.0022 0.015 0.0946 0.008949 4.54E+09
Table 3. Table of calculation stress and Corrosion Rate (mmpy).
No.
Stress
(N/m^2)
Corrosion rate
(mmpy)
1 1511873740 0.031388956
2 3023747480 0.209259709
3 4535621220 0.512686287
1 1511873740 0.235417172
2 3023747480 0.334815534
3 4535621220 0.627779127
1 1511873740 0.132531149
2 3023747480 0.149969458
3 4535621220 0.219722694
1 1511873740 0.036620449
2 3023747480 0.149097543
3 4535621220 0.308658071
Table 4. Data on exposure time and depth of crack.
No. Time exposure
(jam) Depth Crack
(µm)

EKSAKTA Vol. 20 Issue 1/30 April 2019 E-ISSN : 2549-7464, P-ISSN : 1411-3724
92 | E K S A K T A : B e r k a l a I l m i a h B i d a n g M I P A
DOI : 10.24036/eksakta/vol20-iss01/178
http://www.eksakta.ppj.unp.ac.id
1 336 62.36
2 672 65.32
3 1008 66.98
4 1344 67.75
1 336 69.93
2 672 76.76
3 1008 78.94
4 1344 79.89
1 336 85.06
2 672 89.86
3 1008 90.79
4 1344 116.99
Based on table 1 and figure 3, the corrosion rate at the same exposure time will increase
as the deflection is given to the test sample, ie the corrosion rate is y = 0.2511x2 – 0.0209x
– 0.0209 for exposure time 336 hours , y = 0.3871x2 - 0.3819x + 0.3296 for exposure time
672 hours, y = 0.1046x2 - 0.1221x + 0.1674 for exposure time 1008 hours and y = 0.0942x2 +
0.0837x – 0.0288 for exposure time 1344 hours.
Figure 3. Graph of corrosion rate against deflection variation at the same time
exposure.
EKSAKTA Vol. 20 Issue 1/30 April 2019 E-ISSN : 2549-7464, P-ISSN : 1411-3724
93 | E K S A K T A : B e r k a l a I l m i a h B i d a n g M I P A
DOI : 10.24036/eksakta/vol20-iss01/178
http://www.eksakta.ppj.unp.ac.id
Figure 4. Graph of Corrosion Rate on the variation of stress σ with the same time
exposure.
Based on table 4 that the depth crack will increase in time as the exposure time
is given to the test sample as shown in figure 5, and based on result microstructure shown
as in figure 8 with the depth crack y = -5E-06x2 + 0.0135x + 58.407 for 0.5 cm deflection, y
= -1E-05x2 + 0.0314 + 61.015 for deflection 1.0 cm and y = 5E-0.5x2 – 0.0508x +
98.245 for deflection 1.5 cm.
Figure 5. Depth Crack to exposure time with the same deflection.
EKSAKTA Vol. 20 Issue 1/30 April 2019 E-ISSN : 2549-7464, P-ISSN : 1411-3724
94 | E K S A K T A : B e r k a l a I l m i a h B i d a n g M I P A
DOI : 10.24036/eksakta/vol20-iss01/178
http://www.eksakta.ppj.unp.ac.id
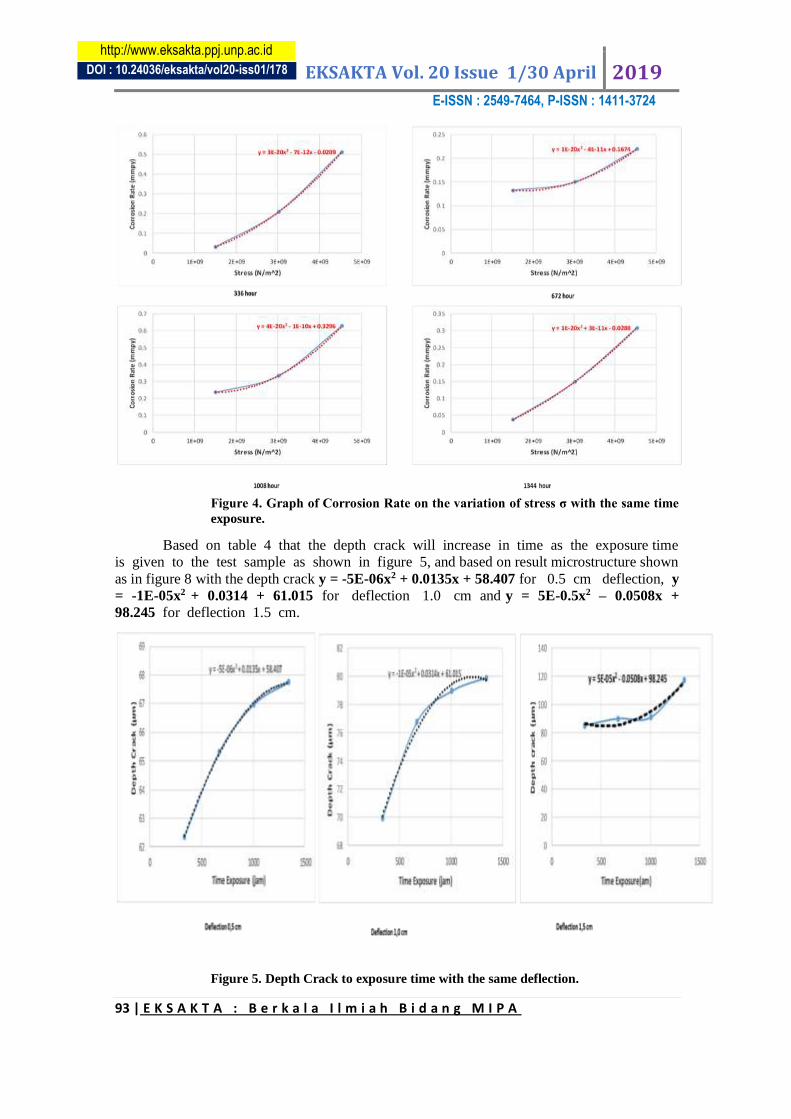
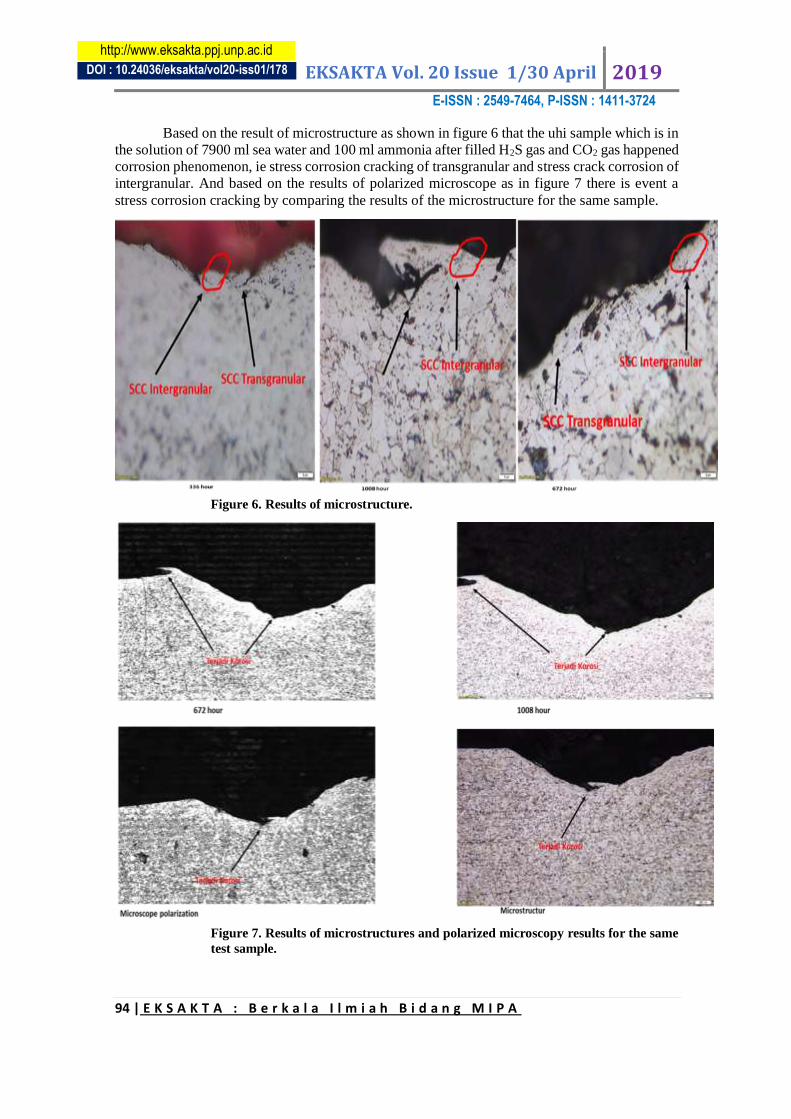
Based on the result of microstructure as shown in figure 6 that the uhi sample which is in
the solution of 7900 ml sea water and 100 ml ammonia after filled H2S gas and CO2 gas happened
corrosion phenomenon, ie stress corrosion cracking of transgranular and stress crack corrosion of
intergranular. And based on the results of polarized microscope as in figure 7 there is event a
stress corrosion cracking by comparing the results of the microstructure for the same sample.
Figure 6. Results of microstructure.
Figure 7. Results of microstructures and polarized microscopy results for the same
test sample.

EKSAKTA Vol. 20 Issue 1/30 April 2019 E-ISSN : 2549-7464, P-ISSN : 1411-3724
95 | E K S A K T A : B e r k a l a I l m i a h B i d a n g M I P A
DOI : 10.24036/eksakta/vol20-iss01/178
http://www.eksakta.ppj.unp.ac.id
Figure 8. Depth crack based on microstructure results.
Figure 9. Result SEM-EDS for test sample b2 and c3 test sample.

EKSAKTA Vol. 20 Issue 1/30 April 2019 E-ISSN : 2549-7464, P-ISSN : 1411-3724
96 | E K S A K T A : B e r k a l a I l m i a h B i d a n g M I P A
DOI : 10.24036/eksakta/vol20-iss01/178
http://www.eksakta.ppj.unp.ac.id
Figure 10. Result SEM-EDS for b2 and c3 samples.
Table 4. percentage weight and percentage atoms for element C and element Fe
No.
Weig
ht C
(%)
Atomi
c C
(%)
Weight
Fe (%)
Atomi
c Fe
(%)
1 4.21 16.97 95.79 83.03
2 4.23 17.05 95.77 83.95
3 3.86 15.73 96.14 84.27
4 4.71 18.67 95.29 81.33
averag
e
4.252
5 17.105 95.7475 83.145
The result of the SEM-EDS test as shown in Figure 9 for the B2 test sample that
the C element has a weight of 4.21% and the atomic composition is 16.97%, while Fe
element has a weight of 95.79% and the atom composition is 83.03%. And SEM-EDS
test result for C3 sample that element C has 4.23% weight and atom composition 17,05%,
while element Fe has 95,77% weight and atom composition 83,95%. Based on Figure
10 for the test sample B2 that element C has a weight of 3.86% and the atomic
composition is 15.73%, while Fe element has a weight of 96.14% and the atomic
composition is 84.27%. And the SEM-EDS test results for C3 test assays that element C
has a weight of 4.71% and its atomic composition is 18.67%, while Fe element has a

EKSAKTA Vol. 20 Issue 1/30 April 2019 E-ISSN : 2549-7464, P-ISSN : 1411-3724
97 | E K S A K T A : B e r k a l a I l m i a h B i d a n g M I P A
DOI : 10.24036/eksakta/vol20-iss01/178
http://www.eksakta.ppj.unp.ac.id
weight of 95.29% and its atomic composition is 81.33%. So the average composition for
element C is that it weighs 4.2525%, the atom is 17.105% and for element Fe is that a
weighs 95.77475%, the atom is 83.145%.
Based on the data as in Table 1 and based on the graph as shown in FIG. 3 that
the corrosion rate increases with the amount of deflection given to the test sample, and the table 3 of figure 4 corrosion rate increases with the magnitude of the strain σ given to
the test sample. And the test samples which are in the solution of 7900 ml of sea water
and 100 ml of ammonia with loaded CO2 gas in saturated state and H2S gas every two
days for 10 minutes then there is corrosion crack voltage (SCC) because CO2 gas, H2S
gas and ammonia are source corrosive.
The corrosion events occur are the stress corrosion cracking transgranular and
intergranular as shown in figure 6, and based on the results of polarized microscopes as
in figure 7 also occurred corrosion events. And percentage component of the chemical
element that is dominant based on the results of the SEM-EDS test for sample b2 and
sample c3 as shown in the table 4, which is either the percentage of the weight or
percentage of the atom.
4. Conclusion
Synthesis of copper oxide on copper thin plate (thickness of 200-250 μm) was
successfully performed at temperature 380oC for 1 hour. The characterization results of
DTA, SEM and XRD have provided information that during thermal oxidation formed
92.6% Cu2O and 6.4% CuO with 25 μm thickness and maximum oxygen attack at 129
μm depth. Oxides formed on the oxidation process can be applied to visible light
photovoltaic panels with continued research of physical properties and optical materials
to obtain materials with appropriate photovoltaic functions.
Acknowledgement
1). I thank you for your help and enter to my fellow lecturers and technicians in the
Department and Electrical Engineering, Department Faculty of Mathematics and
Natural Sciences, University of Padjadjaran.
2). Acknowledgments that this research is funded from an Unpad Internal Grant ((HIU)
with contract number 872 / UN6.3.1 / LT / 2017 and contract number
2385/UN6.D/KS/2018. .
References
[1] Nendi Suhendi-Sri Suryaningsih-Otong Nurhilal. (November 2014), "Study
Stress Corrosion Cracking due to sweet gas (H2S and CO2) on Carbon Pipe",
FMIPA Universitas Padjadjaran.
[2] Nendi Suhendi Syafei, Sri Suyaningsih, Otong Nurhilal, Febi Luthfiani. (Ed. Nov
2015), "Stress Analysis on API 5L GradeB Carbon Steel Pipes Against Corrosion
Rate in NaCl and Acetic Acid Solutions". Indonesian Physics Journal No. 56 Vol.
XIX ISSN 1410-2994.
[3] Nendi Suhendi Syafei-Zaida-Liu Kin Men (December 2016). "Voltage Crack
Corrosion Study due to sweet gas (H2S and CO2) in the API 5L-X65 carbon fiber
to the Corrosion Rate in Acetic Acid Solution and Analyzed by Ultrasonic
Method", Electrical Engineering Study Program FMIPA Padjadjaran University.

EKSAKTA Vol. 20 Issue 1/30 April 2019 E-ISSN : 2549-7464, P-ISSN : 1411-3724
98 | E K S A K T A : B e r k a l a I l m i a h B i d a n g M I P A
DOI : 10.24036/eksakta/vol20-iss01/178
http://www.eksakta.ppj.unp.ac.id
[4] Desy Nur Rochmah, Faried Latief, Tuti Susilawati, Norman Syakir, Fitrilawati;
The Effect of Temperature on the Characteristics of Poly Corrosion Protection
(TMSPMA) on the Surface of Carbon Steel, Proceedings of the National Seminar
on Physics and its Application, 19 November 2016.
[5] Heri Jodi, Characterization of Corrosion of Steel SS-430 in the NaCl environment, Center for Nuclear Industrial Material Technology - BATAN,
Puspiptek Serpong-Tangerang Selatan Region,
(http://widyariset.pusbindiklat.lipi.go.id/index.php/ widyariset / article / ..., 28
February 2018).
[6] Nendi Suhendi Syafei - Darmawan Hidayat - Bernard Y Tumbelaka - Zaida - Liu
Kin Men. (February 4, 2017), "Analysis of Corrosion Rate in API 5L-X65 Carbon
Steel Pipe with Three-Point Loading Method on H2S Gas Environment CO2
Saturated Condition in Acetic Acid Solution", Proceedings of the National
Seminar on Innovation and Application of Technology in Industry, ITN Malang,
p. . D12.1-D12.5, ISSN 2085-4218.
[7] Nendi Suhendi Syafei, Darmawan Hidayat, Dessy Novita, Bernard Y Tumbelaka,
Hardness Testing and Tensile Test to Determine the Hardening Coefficient n An
API Material 5L-X65, Proceedings of the Central Java & DIY XXXI HFI
Scientific Meeting, Yogyakarta March 18 2017 ISSN: 0853 -0823.
[8] Nendi Suhendi Syafei-Darmawan Hidayat-Bernard Y Tumbelaka-Muhammad
taufik. (May 9, 2017), "Characteristics of API 5L-X65 Carbon Steel Pipe with
Three-Point Imposition Method on H2S Gas Environment CO2 Saturated
Condition in Acetic Acid Solution", Proceedings of the National Seminar on
Energy and Technology (Synergy) Unisma Bekasi, p.33-39 , ISSN: 2527-3108.
[9] Nendi Suhendi Syafei-Darmawan Hidayat-Bernard Y Tumbelaka-Liu Kin Men,
Analysis of the corrosion phenomenon of API 5L-X65 carbon steel pipe plates in
a solution of 250 ml of acetic acid and 4750 aquades under conditions of CO2 and
H2S gas saturated at room temperature, exact Vol. 18 N [10] Nendi Suhendi
Syafei, -Liu Kin Men, Comparison of Voltage Crack Corrosion Studies from
Sweet Gas (H2S and CO2) in API 5L-X65 Carbon Steel Pipes Against Corrosion
Rate in Acetic-Ammonia Acid Solutions with Seawater and Analyzed Using
Methods Ultrasonic, Unpad Research Research Grant (RFU-HIU 2107,
Padjadjaran University).
[11] O. I. Zvirko, S. F. Savula, V. M. Tsependa, G. Gabetta, H. M. Nykyforchyn.
(2016), "Steels' stress corrosion cracking of gas pipelines of different strength",
21st European Conference on Fracture, ECF21, 20-24 June 2016, Catania, Italy.
Procedia Structural Integrity 2 509–516.
[12] Martin Monnota, Ricardo P. Nogueira, Virginie Roche, Grégory Berthomé, Eric
Chauveau, Rafael Estevez, Marc Mantel (2017). "Sulfide stress corrosion study
of a super martensitic stainless steel in H2 Sour environments: Metallic sulfides
formation and hydrogen embrittlement", Applied Surface Science 394 132–141.
[13] Nendi Suhendi Syafei, Darmawan Hidayat, Bernard Y Tumbeleka, Liu Kin Men,
Corrosion rate on API 5L-X65 carbon steel pipe with a three-point method of
loading on acetic acid solution filled with CO2 and H2S gas in saturated state,
RAPI XVI National Symposium - 2017 FT UMS Surakarta December 13, 2017,
ISSN 1412-9612, p. 202-207.0.2, October 2017, pages 113-120, E-ISSN: 2549-
7464, P-ISSN: 1411-3724.

EKSAKTA Vol. 20 Issue 1/30 April 2019 E-ISSN : 2549-7464, P-ISSN : 1411-3724
99 | E K S A K T A : B e r k a l a I l m i a h B i d a n g M I P A
DOI : 10.24036/eksakta/vol20-iss01/178
http://www.eksakta.ppj.unp.ac.id
[14] Nendi Suhendi Syafei, Darmawan Hidayat, Bernard Y Tumbelaka, Liu Kin Men,
Analysis of Strain Strain Corrosion Analysis on Fire Carbon Steel Pipes 5L-X65
in a Solution of 7900 ml of Sea Water and 100 ml of Ammonia with CO2 and
H2S Gas in Saturated State , National Seminar on Innovation and Application of
Technology in Industry 2018, ISSN 2085-4218 ITN Malang, February 3, 2018, p. 38-46).
[15] Nendi Suhendi Syafei-Darmawan Hidayat-Emilliano-Liu Kin Men, “Analysis
Cracking Corrosion on Carbon Steel Pipes API 5LX65 in Solution 7700 ml
Aquades, 250 ml Acetic Acid and 50 ml Ammonia with Gas CO2 and H2S in
Saturation Condition”, Eksakta vol 19 No.2 (2018), page 21-31;E-ISSN : 2549-
7464, P-ISSN : 1411-3724, 30 oktober 2018