Even Start
116
POLICY AND PROGRAM STUDIES SERVICE STATE ADMINISTRATION OF THE EVEN START FAMILY LITERACY PROGRAM: STRUCTURE, PROCESS AND PRACTICES 2003 U.S. DEPARTMENT OF EDUCATION OFFICE OF THE UNDER SECRETARY DOC #2003-14
-
Upload
renebavard -
Category
Documents
-
view
224 -
download
0
Transcript of Even Start

POLICY AND PROGRAM STUDIES SERVICE
STATE ADMINISTRATION OF THE EVEN START FAMILY LITERACY PROGRAM:
STRUCTURE, PROCESS AND PRACTICES
2003
U.S. DEPARTMENT OF EDUCATION OFFICE OF THE UNDER SECRETARY
DOC #2003-14

STATE ADMINISTRATION OF THE EVEN START FAMILY LITERACY PROGRAM:
STRUCTURE, PROCESS AND PRACTICES
PREPARED BY:
Fumiyo Tao Anne Ricciuti
Robert St.Pierre Abt Associates
Kathleen Mackin
Consultant RMC Research Corp.
PREPARED FOR:
U.S. Department of Education Office of the Under Secretary
2003

U.S. Department of Education Rod Paige Secretary Office of the Under Secretary Eugene W. Hickok Under Secretary Policy and Program Studies Service Alan L. Ginsburg Director Program and Analytic Studies Division David Goodwin Director July 2003 This report is in the public domain. Authorization to reproduce it in whole or in part is granted. While permission to reprint this publication is not necessary, the citation should be: U.S. Department of Education, Office of the Under Secretary, State Administration of the Even Start Family Literacy Program: Structure, Process and Practices, Washington, D.C., 2003. This report is also available on the Department’s Web site at:
http://www.ed.gov/offices/OUS/PPSS/evaluation.html.

Acknowledgments We would like to acknowledge the many individuals who have contributed to this study and this report. First and foremost, we thank Even Start state coordinators for taking the time to provide us with information about their administration of the Even Start program. We greatly appreciate the time and effort required by the state coordinators to respond to the state survey. In addition to responding to the survey, 12 state coordinators agreed to take part in the case study portion of the study, which involved either extensive phone interviews or a site visit by study staff. We extend special thanks to Even Start staff of the following states: Connecticut, Kansas, Michigan, Mississippi, Missouri, Montana, New Mexico, New York, Oregon, Pennsylvania, South Dakota, and Tennessee. An Expert Work Group provided technical advice and guidance to the study. Members of the group were: Arlene Dale, Massachusetts State Department of Education; Bonnie Griffiths, Minnesota State Department of Education; Don Paquette, Pennsylvania State Department of Education; Debra Williams-Appleton, Washington State Department of Education; and Sallie Wilson, California Department of Education. The U.S. Department of Education provided support, guidance, and advice for the study. We extend thanks to Tracy Rimdzius, project officer for the first two years of the study; Elois Scott and Stephanie Stullich, project officers during the final nine months of the study; Patricia McKee and Laura Lazo of the Office of Elementary and Secondary Education; and Miriam Whitney, the Even Start program attorney. The primary contractor staff responsible for this project were Fumiyo Tao and Anne Ricciuti of Abt Associates Inc. and Kathleen Mackin, consultant to RMC Research Corporation. In addition, the following Abt Associates staff provided support in various phases of the study: Bob St.Pierre, Judith Alamprese, Claire Finn, Satyendra Patrabansh, Denise Young, and Margie Washington.


Executive Summary v
Executive Summary
Purpose of the Study
The Even Start Family Literacy Program addresses the basic educational needs of parents and children from birth through age seven from low-income families. The program provides unified, multi-component services consisting of (1) interactive literacy activities between parents and their children; (2) training for parents to be the primary teachers for their children and full partners in their children’s education; (3) parent literacy training that leads to economic self-sufficiency; and (4) an age-appropriate education to prepare children for success in school and life. Even Start, which began as a federally administered program in 1989-90, became a state-administered program in 1992 when the national funding exceeded $50 million. Since that time, the responsibilities of state Even Start offices have evolved substantially. Initially, each state had relatively few local projects to administer, the state grants were much smaller, and the statutory requirements were fewer and less rigorously defined. However, since the mid-1990s, the federal priority began to shift from a focus on implementation of quality services to the need to demonstrate program accountability and effectiveness based on educational outcomes of program participants. As the number of local projects grew steadily, now numbering more than 1,000 nationwide, the programmatic guidance and leadership provided by Even Start state coordinators to local projects have become increasingly critical in promoting effective programs at the local level. Since the inception of the Even Start program in 1989, the U.S. Department of Education has conducted three cycles of national Even Start evaluations and collected considerable information about Even Start’s implementation, participants, and impact at the local project level. However, there has been no systematic study of the administrative activities that take place at the state level. Because the states play a key role in Even Start as a link between the budgets, policies, and continuous program improvement efforts adopted by the federal government and the delivery of services by local projects, the lack of systematic information about how states administer Even Start is a major gap in efforts to further refine the program. This Study of State Administration of the Even Start Family Literacy Program was designed to systematically describe all major areas of Even Start administration at the state level and factors that facilitate or impede program improvement activities conducted by Even Start state coordinators. This information is intended to: 1) assist the federal Even Start staff to better target their guidance and technical assistance to states, and 2) provide state coordinators with descriptions of program administration practices in other states as a self-assessment guide.

vi Executive Summary
Study Design
This study involved two components: (1) a survey of all state Even Start offices (state survey) and (2) case studies based on interviews with selected state coordinators through telephone calls or site visits. The state survey was sent to Even Start state coordinators in all 50 states, the District of Columbia, and Puerto Rico. Completed survey forms were received from 51 state coordinators. The survey, conducted from November 2001 to February 2002, collected information regarding:
State Even Start administrative infrastructure.
Process of recruiting and selecting subgrantees.
Process of providing technical assistance to subgrantees.
Process of monitoring subgrantee performance.
Development and implementation of performance indicators.
Program evaluation and improvement activities.
Areas targeted by states for improvement at state and local levels.
Even Start program administrative challenges and accomplishments.
Twelve states were selected for the case study, designed to collect in-depth information on states’ administrative practices. They included: large, medium, and small states; states that received Statewide Family Literacy Initiative (SFLI) grants and those that did not; states in which Even Start is located under adult education and states where the affiliation is with early childhood or K-12 programs; and states in different geographic areas. Under SFLI, discretionary federal grants were awarded to 38 states to support building state-level partnerships that would strengthen family literacy services in the state. The case study interviews were conducted between March and May of 2002, through telephone interviews with six states and site visits to another six states. When the state survey and the case study interviews were conducted, states were in the process of adjusting to two major changes: 1) the implementation of states’ performance indicator systems, and 2) a substantial increase in the Even Start budget (from $150 million in 2000-01 to $250 million in 2001-02). Information presented in this report describes state Even Start operation in the early stages of adjustment to these changes, and may not reflect the current status of related operations (e.g., implementation of performance indicator systems).

Executive Summary vii
Key Study Findings
State Even Start Administrative Infrastructure
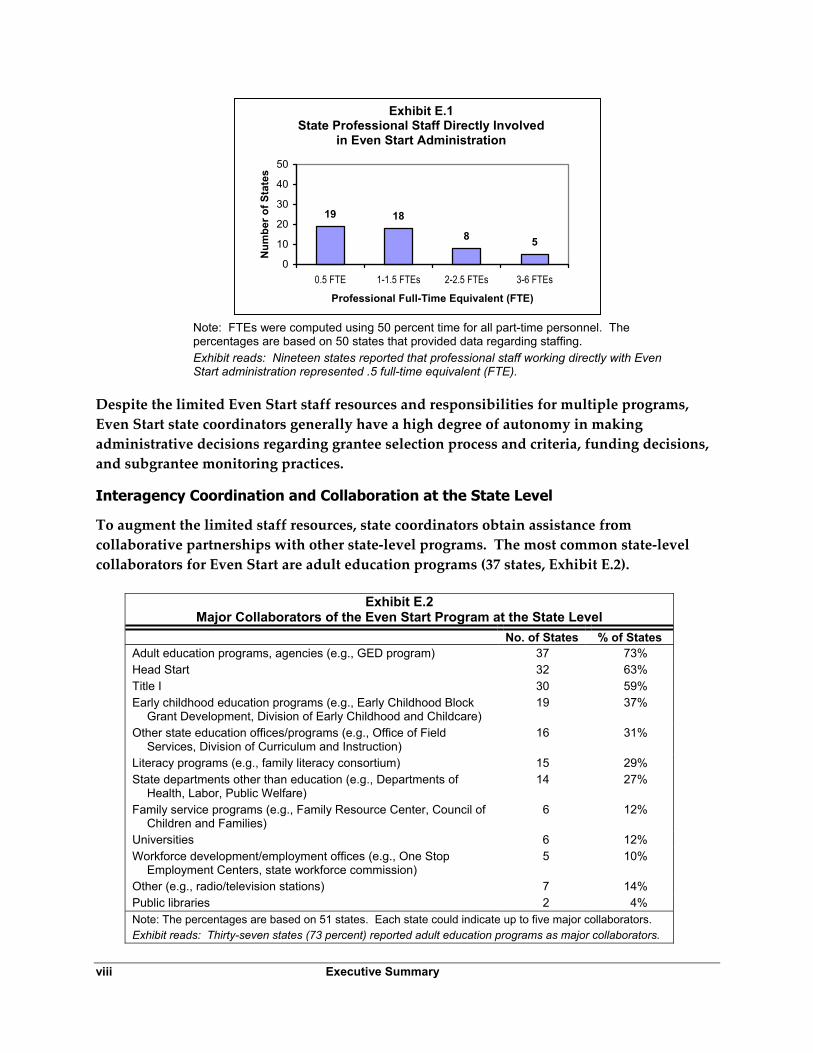
The location of Even Start within the state government and the stability of the Even Start state coordinator are factors that affect how the program is administered at the state level. The state Even Start administrative infrastructure is largely determined by state officials and offices above the Even Start state coordinator. Before 2001, federal Even Start grants were awarded to state offices—usually state education agencies (SEAs). The No Child Left Behind Act amended the law in 2001 to require Even Start grants to be awarded only to SEAs. Once the grant is received by a state, it is up to the state to assign the administration of Even Start to a specific program, division, or unit. Even Start is located under adult education (or programs related to education of adults such as vocational education and community colleges) in 13 states; under early childhood education (ECE) or K-12 programs in 24 states, and 14 states operate Even Start under programs other than adult education, ECE, or K-12 programs. States may move Even Start from one unit to another. Twenty-four states have moved Even Start since 1992, generally only once. However, eight state Even Start offices reported having experienced two or more moves since 1992. Even Start staffing in some states has been very stable, while some states have experienced frequent changes in state coordinators. More than half of the states have had only one or two state coordinators since 1992, and a quarter of the current coordinators are very experienced with nine or more years of Even Start experience. However, 17 states have had three or four state coordinators since 1992, and about a quarter of the current state coordinators have had one year experience or less in this position. Frequent turnover may interfere with the accumulation of program and administrative knowledge as well as progress in program improvement efforts. The state survey data corroborate informal accounts by state coordinators indicating that staff resources for Even Start at the state level are very limited. In 19 states, Even Start is administered with .5 professional full-time-equivalent (FTE) and no more than 1.5 clerical FTEs (Exhibit E.1). The states that have a larger than average staff tend to be states with more than the average number of local projects. States were divided into three categories: 1) “small” states which had nine or fewer projects, 2) “medium” states which had between 10 and 24 projects, and 3) “large” states with 25 or more projects. The average total number of FTEs (including professional and clerical staff) was three FTEs for large states, while medium states had 1.7 FTEs, and small states had 1.6 FTEs. Furthermore, most state coordinators have multiple responsibilities other than administering Even Start; they spend, on average, 49 percent of their time on Even Start duties, and the remaining time on other responsibilities.
viii Executive Summary
19 18
8 5
0
10
20
30
40
50
0.5 FTE 1-1.5 FTEs 2-2.5 FTEs 3-6 FTEs
Professional Full-Time Equivalent (FTE)
Num
ber o
f Sta
tes
Despite the limited Even Start staff resources and responsibilities for multiple programs, Even Start state coordinators generally have a high degree of autonomy in making administrative decisions regarding grantee selection process and criteria, funding decisions, and subgrantee monitoring practices.
Interagency Coordination and Collaboration at the State Level
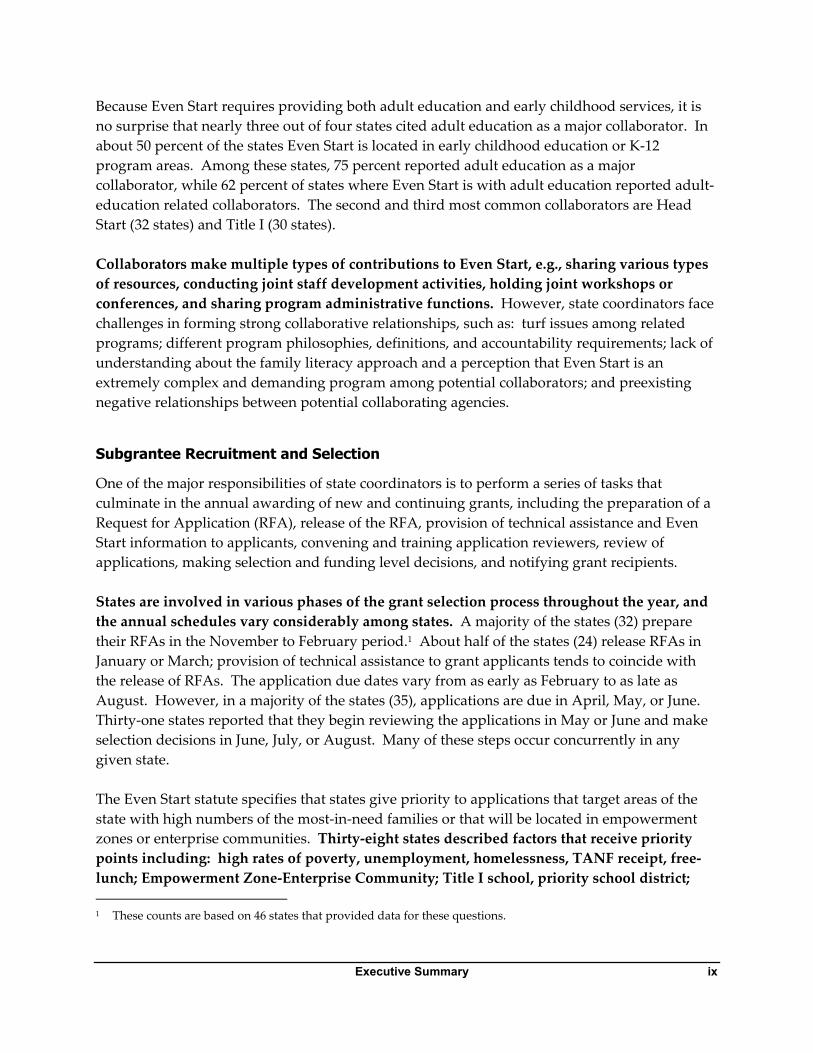
To augment the limited staff resources, state coordinators obtain assistance from collaborative partnerships with other state-level programs. The most common state-level collaborators for Even Start are adult education programs (37 states, Exhibit E.2).
Exhibit E.2 Major Collaborators of the Even Start Program at the State Level
No. of States % of States Adult education programs, agencies (e.g., GED program) 37 73% Head Start 32 63% Title I 30 59% Early childhood education programs (e.g., Early Childhood Block
Grant Development, Division of Early Childhood and Childcare) 19 37%
Other state education offices/programs (e.g., Office of Field Services, Division of Curriculum and Instruction)
16 31%
Literacy programs (e.g., family literacy consortium) 15 29% State departments other than education (e.g., Departments of
Health, Labor, Public Welfare) 14 27%
Family service programs (e.g., Family Resource Center, Council of Children and Families)
6 12%
Universities 6 12% Workforce development/employment offices (e.g., One Stop
Employment Centers, state workforce commission) 5 10%
Other (e.g., radio/television stations) 7 14% Public libraries 2 4% Note: The percentages are based on 51 states. Each state could indicate up to five major collaborators. Exhibit reads: Thirty-seven states (73 percent) reported adult education programs as major collaborators.
Exhibit E.1 State Professional Staff Directly Involved
in Even Start Administration
Note: FTEs were computed using 50 percent time for all part-time personnel. The percentages are based on 50 states that provided data regarding staffing. Exhibit reads: Nineteen states reported that professional staff working directly with Even Start administration represented .5 full-time equivalent (FTE).
Executive Summary ix
Because Even Start requires providing both adult education and early childhood services, it is no surprise that nearly three out of four states cited adult education as a major collaborator. In about 50 percent of the states Even Start is located in early childhood education or K-12 program areas. Among these states, 75 percent reported adult education as a major collaborator, while 62 percent of states where Even Start is with adult education reported adult-education related collaborators. The second and third most common collaborators are Head Start (32 states) and Title I (30 states). Collaborators make multiple types of contributions to Even Start, e.g., sharing various types of resources, conducting joint staff development activities, holding joint workshops or conferences, and sharing program administrative functions. However, state coordinators face challenges in forming strong collaborative relationships, such as: turf issues among related programs; different program philosophies, definitions, and accountability requirements; lack of understanding about the family literacy approach and a perception that Even Start is an extremely complex and demanding program among potential collaborators; and preexisting negative relationships between potential collaborating agencies.
Subgrantee Recruitment and Selection
One of the major responsibilities of state coordinators is to perform a series of tasks that culminate in the annual awarding of new and continuing grants, including the preparation of a Request for Application (RFA), release of the RFA, provision of technical assistance and Even Start information to applicants, convening and training application reviewers, review of applications, making selection and funding level decisions, and notifying grant recipients. States are involved in various phases of the grant selection process throughout the year, and the annual schedules vary considerably among states. A majority of the states (32) prepare their RFAs in the November to February period.1 About half of the states (24) release RFAs in January or March; provision of technical assistance to grant applicants tends to coincide with the release of RFAs. The application due dates vary from as early as February to as late as August. However, in a majority of the states (35), applications are due in April, May, or June. Thirty-one states reported that they begin reviewing the applications in May or June and make selection decisions in June, July, or August. Many of these steps occur concurrently in any given state. The Even Start statute specifies that states give priority to applications that target areas of the state with high numbers of the most-in-need families or that will be located in empowerment zones or enterprise communities. Thirty-eight states described factors that receive priority points including: high rates of poverty, unemployment, homelessness, TANF receipt, free-lunch; Empowerment Zone-Enterprise Community; Title I school, priority school district; 1 These counts are based on 46 states that provided data for these questions.
x Executive Summary
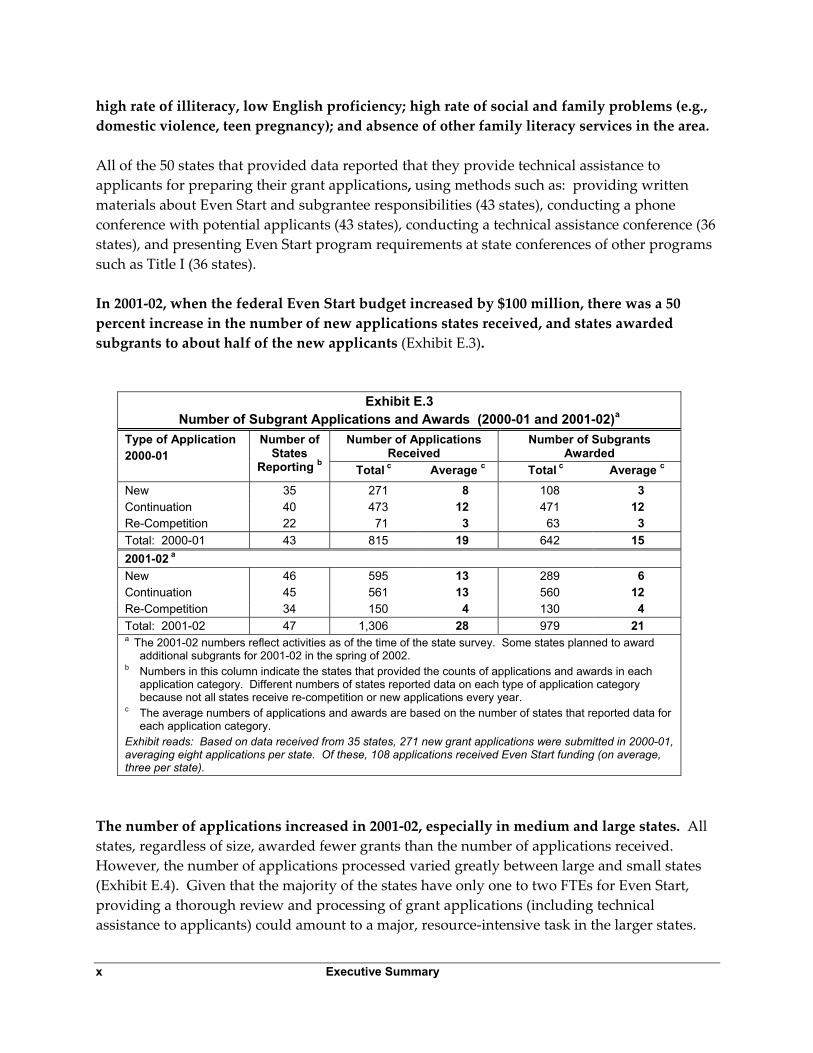
high rate of illiteracy, low English proficiency; high rate of social and family problems (e.g., domestic violence, teen pregnancy); and absence of other family literacy services in the area. All of the 50 states that provided data reported that they provide technical assistance to applicants for preparing their grant applications, using methods such as: providing written materials about Even Start and subgrantee responsibilities (43 states), conducting a phone conference with potential applicants (43 states), conducting a technical assistance conference (36 states), and presenting Even Start program requirements at state conferences of other programs such as Title I (36 states). In 2001-02, when the federal Even Start budget increased by $100 million, there was a 50 percent increase in the number of new applications states received, and states awarded subgrants to about half of the new applicants (Exhibit E.3).
Exhibit E.3 Number of Subgrant Applications and Awards (2000-01 and 2001-02)a
Number of Applications Received
Number of Subgrants Awarded
Type of Application 2000-01
Number of States
Reporting b Total c Average c Total c Average c New 35 271 8 108 3 Continuation 40 473 12 471 12 Re-Competition 22 71 3 63 3 Total: 2000-01 43 815 19 642 15 2001-02 a New 46 595 13 289 6 Continuation 45 561 13 560 12 Re-Competition 34 150 4 130 4 Total: 2001-02 47 1,306 28 979 21 a The 2001-02 numbers reflect activities as of the time of the state survey. Some states planned to award
additional subgrants for 2001-02 in the spring of 2002. b Numbers in this column indicate the states that provided the counts of applications and awards in each
application category. Different numbers of states reported data on each type of application category because not all states receive re-competition or new applications every year.
c The average numbers of applications and awards are based on the number of states that reported data for each application category.
Exhibit reads: Based on data received from 35 states, 271 new grant applications were submitted in 2000-01, averaging eight applications per state. Of these, 108 applications received Even Start funding (on average, three per state).
The number of applications increased in 2001-02, especially in medium and large states. All states, regardless of size, awarded fewer grants than the number of applications received. However, the number of applications processed varied greatly between large and small states (Exhibit E.4). Given that the majority of the states have only one to two FTEs for Even Start, providing a thorough review and processing of grant applications (including technical assistance to applicants) could amount to a major, resource-intensive task in the larger states.

Executive Summary xi
816
41
9
22
61
712
7
16
45
33
0
10
20
30
40
50
60
70
SmallStatesn=14
MediumStatesn=21
LargeStatesn=12
SmallStatesn=14
MediumStatesn=21
LargeStatesn=12
Ave
rage
Num
ber o
f App
licat
ions
and
Aw
ards
Pe
r Sta
te
Received Awarded
Twenty states reported that they had denied continuation funding to at least one project since the beginning of Even Start because of insufficient progress. The primary reasons for denying funding were insufficient program management and implementation progress (17 states), low recruitment and enrollment rates (14 states), and low quality and intensity of educational services (11 states). Only a few states denied continuation funding on the basis of participant outcome data. As part of the performance indicator requirement, all states must now use outcome data as the basis of continuation funding decisions, which will be a new challenge for many states and projects.
Provision of Programmatic Guidance and Technical Assistance
In the early years of Even Start, as the awarding agency, the federal Even Start office and its technical assistance contractors were the main providers of guidance to local projects on basic program design and approach. As the number of projects increased and the program became administered by the states, state coordinators began to assume greater responsibility for providing technical assistance to local projects. Now, this is one of the key leadership and management functions of the state Even Start office.
Exhibit E.4 Average Number of Applications Received and
Grants Awarded per State: 2000-01 and 2001-02 by Size of State’s Program
(Fall 2001)
2000-01 2001-02
Note: The numbers include new, continuation, and re-competition applications and grants. Exhibit reads: In 2000-01, small states with four to nine projects received an average of eight grant applications and awarded an average of seven grants. On average, large states (with 25 or more projects) received 41 applications and awarded 33 grants.
xii Executive Summary
Almost all states provide technical assistance to applicants in the preparation of grant applications and provide technical assistance meetings or training sessions for local projects once they are funded. More than half of the states (28) have produced and disseminated printed materials for technical assistance that contain guidance and instructions on Even Start program implementation and service delivery. States also conduct technical assistance meetings and workshops. Frequent topics include: information regarding grant applications, new grantee orientation, performance indicators, assessment tools and standards, state and local evaluations, data collection and use, software, Web, and database use, and program administration in general. The technical assistance workshops and meetings are conducted by a wide range of practitioners and professionals, including: local and state Even Start staff (36 states); staff from state and local non-Even Start agencies such as collaborators (32 states); and contracted technical assistance consultants (37 states). Some states use formal means to identify local projects’ technical assistance needs such as a needs assessment survey, focus groups of local project staff, or a systematic review of local evaluation reports. Other states use less formal ways to identify needs, such as personal communications with local project staff through listservs, e-mail, and telephone calls, or through meetings and on-site visits.
Subgrantee Performance Monitoring
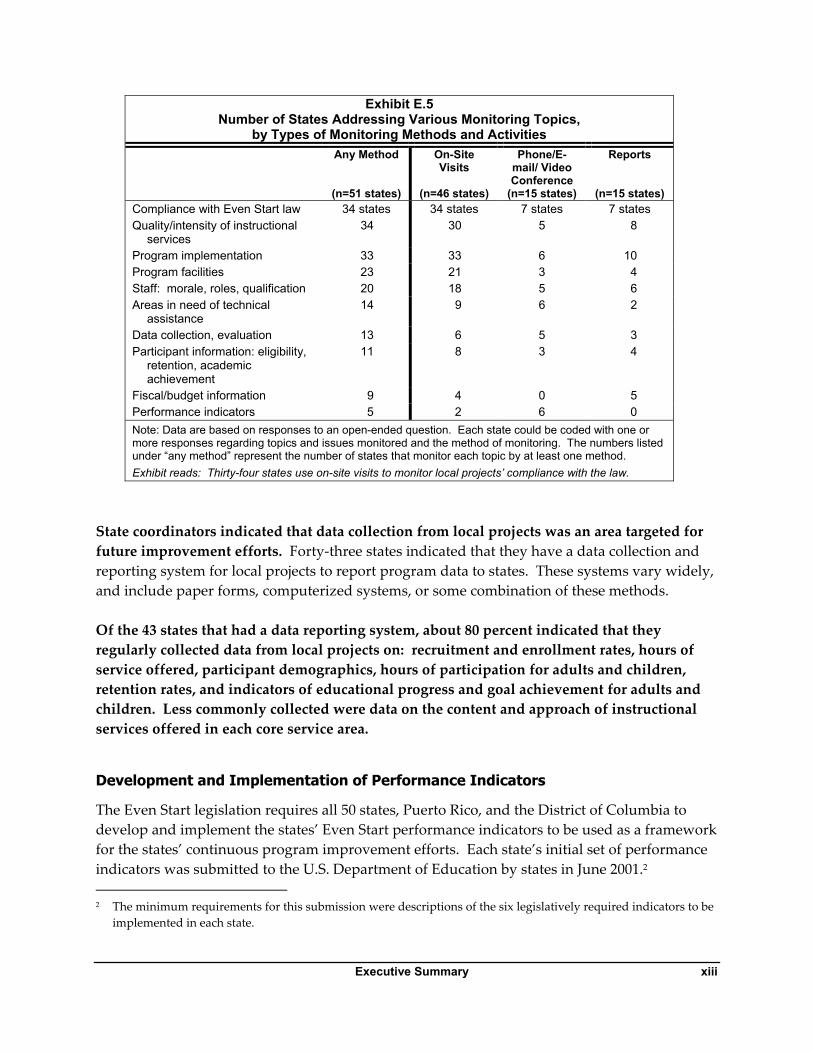
Provision of technical assistance and monitoring of local projects’ program implementation and participant outcomes are ongoing responsibilities of state coordinators. On-site visits, the most commonly used method of monitoring local projects’ program operations (46 states), are generally conducted by the state coordinator or other state Even Start staff. However, staff from other state agencies or programs and external consultants also conduct site visits to local projects. Of the 46 states that conduct on-site visits to monitor local projects, six states reported that local project directors (e.g., veteran directors, regional coordinators, mentoring teams) are involved in these visits. Most of the states conduct on-site visits to each project once a year or less often, while 10 states schedule several visits per year to each project. During on-site visits, a majority of the states focus on compliance and a project’s progress in implementing family literacy services (Exhibit E.5). Thirty states indicated that they monitor the quality and intensity of instructional services during site visits. The next most common issues addressed during site visits are the adequacy of the program facilities, staff morale, and staff qualifications. Only eight state coordinators indicated that they examine anything concerning participants (e.g., eligibility, retention rates, academic achievement, and participation records) during the monitoring site visits, and a few states reported that they monitor how well the local projects deal with data collection, reporting, evaluation activities, and fiscal management.
Executive Summary xiii
Exhibit E.5 Number of States Addressing Various Monitoring Topics,
by Types of Monitoring Methods and Activities Any Method
(n=51 states)
On-Site Visits
(n=46 states)
Phone/E-mail/ Video Conference
(n=15 states)
Reports
(n=15 states) Compliance with Even Start law 34 states 34 states 7 states 7 states Quality/intensity of instructional
services 34 30 5 8
Program implementation 33 33 6 10 Program facilities 23 21 3 4 Staff: morale, roles, qualification 20 18 5 6 Areas in need of technical
assistance 14 9 6 2
Data collection, evaluation 13 6 5 3 Participant information: eligibility,
retention, academic achievement
11 8 3 4
Fiscal/budget information 9 4 0 5 Performance indicators 5 2 6 0 Note: Data are based on responses to an open-ended question. Each state could be coded with one or more responses regarding topics and issues monitored and the method of monitoring. The numbers listed under “any method” represent the number of states that monitor each topic by at least one method. Exhibit reads: Thirty-four states use on-site visits to monitor local projects’ compliance with the law.
State coordinators indicated that data collection from local projects was an area targeted for future improvement efforts. Forty-three states indicated that they have a data collection and reporting system for local projects to report program data to states. These systems vary widely, and include paper forms, computerized systems, or some combination of these methods. Of the 43 states that had a data reporting system, about 80 percent indicated that they regularly collected data from local projects on: recruitment and enrollment rates, hours of service offered, participant demographics, hours of participation for adults and children, retention rates, and indicators of educational progress and goal achievement for adults and children. Less commonly collected were data on the content and approach of instructional services offered in each core service area.
Development and Implementation of Performance Indicators
The Even Start legislation requires all 50 states, Puerto Rico, and the District of Columbia to develop and implement the states’ Even Start performance indicators to be used as a framework for the states’ continuous program improvement efforts. Each state’s initial set of performance indicators was submitted to the U.S. Department of Education by states in June 2001.2 2 The minimum requirements for this submission were descriptions of the six legislatively required indicators to be
implemented in each state.

xiv Executive Summary
States differed greatly in every aspect of Even Start performance indicators that were submitted in June 2001, including the measures used, performance standards set, and subgroups to whom the measurements and standards were to be applied. A review of the June 2001 performance indicator documents by Abt Associates Inc. identified four areas that called for further development to enable successful implementation of the system.
• Further development and clarification of the content and specification of performance indicators (e.g., participant subgroup definitions, assessment measures, and performance standards).
• Specific guidance for the implementation process such as: how and where to obtain data collection instruments; data collection, data entry and storage, data reporting processes; and data collection and reporting schedules.
• Strategies for staff training to ensure that staff are properly trained to conduct (1) the data collection, especially the administration of standardized assessment instruments; (2) computation of outcome measures; and (3) reporting of each indicator correctly.
• Guidelines for the use of indicator data to avoid gaps in data collection and unnecessary demands on local and state staff time, and targeted professional development to facilitate integration of participant outcome with continuous program improvement and curriculum development.
Most states planned to collect the first round of performance indicator data in 2002. Fourteen states had already begun to collect data in 2001 or earlier. About half of the states plan to collect performance indicator data annually; 15 states, twice a year.
Program Evaluation and Improvement
In the early years of Even Start, the development and implementation of the family literacy program was the highest priority. However, since the mid-1990s, the policy focus for Even Start has gradually shifted from program implementation to data-based program improvement and the need to demonstrate Even Start’s program impact on participants’ educational achievements. In this process, state-level evaluation activities have increased, as has the attention paid by states to the use of evaluation data for the purpose of program management and improvement. Half of the states reported that they conduct a state-level Even Start evaluation, although the definitions of “state evaluation” may vary among states. More than half of the 24 states that conduct a state evaluation indicated that they used data collected by local projects for the national evaluation as part of the state evaluation. States also assist the local projects with local evaluations by providing technical guidance and training. Twenty-eight states require local projects to collect specific types of data in

Executive Summary xv
their local evaluation; most of these states require projects to collect data on families’ progress toward educational and economic goals, family demographic data, and hours of participation by enrolled adults and children. About one-third of the states provide training for local Even Start evaluators; 15 states directly coordinate the local evaluation activities for all subgrantees. Although 42 states said that they collect and review local evaluation reports, 31 states indicated that they use local evaluation data or reports for continuous program improvement, and 17 states said they do not. The latter group of states may collect the reports mainly as a way of ensuring that local projects are complying with their evaluation requirement. For the 31 states that use the local evaluations, the results are used for a number of purposes, including:
Developing guidelines for the following year’s program improvement efforts and identifying topics for further technical assistance to local projects (16 states).
Providing project-specific feedback to local projects and examining program outcomes among all projects in a state (12 states).
Providing a needs assessment for statewide professional development activities (six states).
Preparing state-required reports (four states).
Receiving input in making continuation funding decisions (three states).
Training local projects on data-based decision-making (two states).
Relationships between Infrastructure Characteristics and Leadership and Management Practices
The state survey data provided an opportunity to examine possible relationships between state Even Start administrative infrastructure, on one hand, and some of the leadership and management practices that states use to administer Even Start, on the other. States that had one or more of the following conditions provided more technical assistance on performance indicators to local projects: 1) had a relatively high number of local projects, 2) had a higher number of professional staff, 3) had a state coordinator who spent relatively more time on Even Start tasks, and 4) received a SFLI grant. These results suggest that it may be necessary for larger states to provide more technical assistance to ensure that all of their projects are on board with this new requirement. In addition, more time devoted by state coordinators and other professional staff to Even Start tasks may facilitate the implementation of performance indicators. States that received a SFLI grant provided more technical assistance to grant applicants. States that made greater use of advisory and consultant input also reported more assistance to grant applicants relative to other states. The availability of additional resources from SFLI

xvi Executive Summary
funds and additional expertise provided by collaborators, advisors, and consultants may enable states to provide more technical assistance to applicants and thereby raising the quality of applications.
Areas Targeted by States for Improvement at State and Local Levels
In recent years, in response to the legislative emphasis on demonstrating Even Start’s effectiveness as measured by participant educational outcomes, many states have implemented strategies to strengthen state-level program operations which in turn would facilitate local projects’ achieving their program improvement goals. In these efforts, state coordinators identified the following areas they plan to target for program improvement.
Strengthen staff resources at the state level and improve staff qualifications at the local level (18 states).
Implement additional strategies to increase the effectiveness of local project activities, including improvement in technical assistance and monitoring of local projects, use of local project peer review teams, and emphasizing the importance of continuous program improvement and data-based decision making to local projects (16 states). Many states are in the process of implementing an electronic data collection system and data reporting procedures in conjunction with the full implementation of the performance indicator system.
Increase involvement of state Even Start staff in evaluation activities, by coordinating state and local evaluations, coordinating technical assistance and evaluation activities, and monitoring the quality and training of local evaluators (13 states).
Improve interagency collaboration and integrate family literacy in a wider array of educational programs at the state level (13 states).
Accomplishments and Challenges in State Even Start Administration
By far the accomplishment most commonly reported by state coordinators for 2000-01 was the development and implementation of states’ Even Start performance indicator systems (34 states). The major challenge most often reported was limited time to perform the multiple tasks required of coordinators, such as making site visits to closely monitor projects, juggling Even Start work and other responsibilities, balancing state-level work and working directly with local projects, and accommodating to a rapid increase in the number of local projects. Other major challenges echo the same areas that are targeted as priorities for program improvement: limited state staff resources, limited time and expertise to guide and help local projects to address project-specific challenges, and promoting quality evaluation and implementation of the performance indicator system.

Executive Summary xvii
Useful Strategies and Feedback from State Coordinator Interviews
While limited staff resources and time to devote to Even Start responsibilities appear to be ubiquitous, some state coordinators described approaches and practices that mitigate their negative impact. Effective use of experienced local project coordinators in functions officially slated for state coordinators can help to augment the state staff resources and technical expertise. Some states have established formal procedures to assign veteran project coordinators as regional coordinators or peer mentors. Many state coordinators employ the services of external consultants (e.g., technical assistance contractors, university-based content specialists) to increase the administrative and technical capacity of state Even Start administrative functions. Further, in order for the consultants’ input to be useful, state coordinators need to exercise strong oversight and control in working with the consultants or work within a collaborative team structure with consultants. The products of consultants’ activities must be incorporated into state policy decisions and leadership, which can come only from the state coordinator and state officials above the state coordinator. The experienced state coordinators interviewed stressed the importance of the following strategies for improving the quality of local project services:
Ensuring that all Even Start grant applicants and new grantees know clearly all federal and state requirements for Even Start projects as well as the consequences of a failure to meet the requirements.
Active involvement by local projects in the design and development of the performance indicator system. When local projects take ownership of the performance indicator system as their tool to help them operate a high-quality Even Start project, the intended goal of the indicator system is more likely to be realized.
Establishing clearly stated, systematic procedures to correct poorly performing projects. This will become increasingly important in the wake of uniform implementation of performance standards.
Need for Continued Federal Input and Assistance
Most state coordinators interviewed who had received the SFLI grant felt that the effective period of the SFLI grant was too short to allow strong partnerships to develop. They also reported that interagency collaboration played a critical role in their ability to administer Even Start and, without continued support similar to the SFLI grant, the role played by interagency collaboration might be weakened. State coordinators, both new and experienced, rely heavily on guidance and communication from the federal Even Start program office to learn about legislative changes and how these
xviii Executive Summary
changes affect state and local responsibilities. State coordinators expressed their appreciation for programmatic guidance they receive from the federal Even Start office, particularly the quick responses they get through the Even Start state coordinator listserv on questions concerning statutory requirements, the personal attention they receive when they telephone the federal program office, and the special meetings of state coordinators at the national Even Start conferences. During the first 10 years of state-administered Even Start, the role of the state coordinators has evolved along with considerable expansion and changes in the program. This study found a wide variation in states’ administrative practices, as well as creative strategies that some states have devised to bolster their capacity to lead the states’ program improvement efforts. As the Even Start program continues to evolve, another major change on the horizon may be in the collaborative partnership between federal and state Even Start staff. Based on statements made by state coordinators and the areas of administrative challenges identified in this study, the following types of federal support for the states, in addition to assistance already being provided, would further strengthen the complementary leadership roles played by the federal and state Even Start programs:
Sponsoring a comprehensive clearinghouse of information and materials related to topics such as: Even Start legislative and program guidance; family literacy curricula; research-based instructional approaches for early childhood education, adult education, and parenting education; child and adult assessments; family literacy staff development; and local evaluation approaches.
Providing more opportunities for state and local Even Start staff, including their evaluators and technical consultants, to attend high-quality, educational and technical assistance workshops led by national experts.
Providing more opportunities for state coordinators to work together in which state coordinators would take the lead in setting the agenda, presenting effective practices or lessons learned, and conducting collaborative problem solving sessions.
Providing federal leadership to promote collection of common program and participant data that are comparable across states. Such data would not only serve the federal need for national Even Start data, but also provide the states with a national benchmark to assess their progress. Federal leadership could play a critical role in developing a process by which key outcome data being collected through the states’ performance indicator systems are compiled to monitor the overall program improvement nationwide.

Contents xix
Contents
Acknowledgments .................................................................................................................................... 1
Executive Summary ..................................................................................................................................v
Exhibits ................................................................................................................................................. xxiii
Chapter 1. Even Start History and Previous Research ...................................................................... 1 Even Start Program History........................................................................................................... 1 Even Start Legislation ..................................................................................................................... 1 Previous Studies of the Even Start Program................................................................................ 3 Scarcity of Information on State Administration of Even Start ................................................ 4
Chapter 2. Purpose and Approach of the Study................................................................................. 5 Functional Model of State Even Start Administration ............................................................... 5
Input: State Even Start Program Infrastructure ............................................................... 5 Process: State Even Start Management and Leadership Functions .............................. 7 Output: Program Operations and Outcomes at the Local Level ................................... 7
Study Questions............................................................................................................................... 9 Study Method................................................................................................................................. 10
Survey of Even Start State Coordinators (State Survey)................................................ 11 Case Study Interviews in Sampled States........................................................................ 11 Review of States’ Performance Indicators ....................................................................... 12
Chapter 3. Study Findings.................................................................................................................... 13 State Even Start Administrative Infrastructure......................................................................... 13 Summary of Key Findings................................................................................................................ 13
Organizational Location within the State Government................................................. 14 State Coordinator Turnover and Tenure ......................................................................... 15 Staffing Pattern and Capacity............................................................................................ 15 State Coordinators’ Other Responsibilities and Percent of Time Spent on
Even Start ........................................................................................................................ 16 Program Budget .................................................................................................................. 17 Use of Advisory Groups and Technical Consultants..................................................... 19 Extent of State Coordinator’s Authority and Autonomy .............................................. 21
Interagency Coordination and Collaboration at the State Level............................................. 21 Summary of Key Findings................................................................................................................ 21
Types of Collaborators ....................................................................................................... 21 Nature of Collaboration ..................................................................................................... 23 Extent of Collaboration....................................................................................................... 24 Barriers to Collaboration .................................................................................................... 24 State-Funded Family Literacy Programs ......................................................................... 24

xx Contents
Subgrantee Recruitment and Selection....................................................................................... 26 Summary of Key Findings................................................................................................................ 26
Annual Grantee Selection Activities................................................................................. 27 Grantee Selection Criteria .................................................................................................. 30 Applications for Continuation Funding .......................................................................... 32 Grantee Selection and Funding Decisions in Response to the 2001-02 Funding
Increase ............................................................................................................................ 32 Grant Applications in 2000-01 and 2001-02..................................................................... 34 Funding Levels .................................................................................................................... 35 Length of Subgrants............................................................................................................ 35 Meeting the Matching Fund Requirements..................................................................... 36 Denial of Continuation Funding Due to Insufficient Progress..................................... 37 Voluntary Termination of Even Start Subgrant by Local Projects ............................... 37 Appeal Process .................................................................................................................... 38
Provision of Programmatic Guidance and Technical Assistance ........................................... 39 Summary of Key Findings................................................................................................................ 39
Technical Assistance Method, Frequency, and Target Audience ................................ 40 Content of Technical Assistance Activities...................................................................... 42
Subgrantee Performance Monitoring ......................................................................................... 44 Summary of Key Findings................................................................................................................ 44
Methods of Performance Monitoring............................................................................... 44 Collection of Data from Local Projects............................................................................. 47 Instructional Staff Qualifications ...................................................................................... 48
Development and Implementation of Performance Indicators (PI) ....................................... 50 Summary of Key Findings................................................................................................................ 50
Review of the States’ June 2001 Performance Indicator Documents: A Summary... 51 Performance Indicator System Implementation: Status as of December 2001 .......... 53
Program Evaluation and Improvement ..................................................................................... 56 Summary of Key Findings................................................................................................................ 56
State Evaluation................................................................................................................... 56 Guidance and Assistance in Local Evaluations .............................................................. 57 Use of Local Evaluation Data and Reports...................................................................... 59 Input from Local Projects ................................................................................................... 60
Relationships between Infrastructure Characteristics and Leadership and Management Practices ..................................................................................................................................... 60
Areas Targeted by States for Improvement at State and Local Levels .................................. 62 Accomplishments and Challenges in State Even Start Administration................................. 64
Chapter 4. Useful Strategies and Feedback from State Coordinator Interviews ....................... 67 Strategies to Increase Administrative Staff Resources and Capacity..................................... 67
Using Experienced Project Coordinators as Regional Coordinators and Peer Mentors............................................................................................................................ 67

Contents xxi
Oversight and Coordination of Work Performed by External Technical Consultants ..................................................................................................................... 68
Using Technology for Communication............................................................................ 69 Strategies to Improve the Quality of Services at the Local Level ........................................... 69
Educating New Grantees ................................................................................................... 69 Ensuring Grantee Buy-in of the Performance Indicators .............................................. 69 Developing and Enforcing Systematic Procedures to Correct Poor Performance..... 70
Need for Continued Resources to Support Collaboration Efforts .......................................... 70 Need for Continued Federal Input and Assistance .................................................................. 71
Chapter 5. Summary and Implications of the Study....................................................................... 73
References................................................................................................................................................. 77 Appendix
Appendix A: Evaluation Questions, Data Collection and Analysis Methods.....................A-1 Appendix B: Case Study Sample Design and Selection ......................................................... B-1

Exhibits xxiii
Exhibits
Exhibit 2.1: Functional Model of State Even Start Administration .................................................... 6
Exhibit 3.1: State Coordinators’ Turnover and Tenure....................................................................... 15
Exhibit 3.2: State Personnel Directly Involved in Federal Even Start Administration: Number of Professional and Clerical Full-time Equivalents (FTEs)........................... 16
Exhibit 3.3: Allocation of Federal Even Start Grant by Budget Categories (For Program Year 2000-01)................................................................................................................................ 18
Exhibit 3.4: Non-Even Start Funding Sources Contributing to State Even Start Staff Salaries ..... 19
Exhibit 3.5: Advisory and Consultant Groups Other Than the Committee of Practitioners ........ 20
Exhibit 3.6: Issues Reviewed by the Committee of Practitioners or Other Advisory Groups ..... 20
Exhibit 3.7: Major Collaborators of the Even Start Program at the State Level............................... 22
Exhibit 3.8: Number of States Receiving Various Types of Contribution Provided by Major Collaborators of Even Start .............................................................................................. 23
Exhibit 3.9: Coordination between Even Start and State-Funded Family Literacy Programs ...... 25
Exhibit 3.10: Months in Which States Conduct Grantee Selection Activities (Number of States)................................................................................................................................. 27
Exhibit 3.11: Types of Technical Assistance Provided to Applicants ............................................... 28
Exhibit 3.12: Reviewers of New Even Start Applications................................................................... 29
Exhibit 3.13: Priority Points Used in Subgrant Review and Screening ............................................ 31
Exhibit 3.14: Decisions on Number of Subgrants Given the Increased Funding in 2001-02 ......... 33
Exhibit 3.15: Average Number of Subgrant Applications and Awards per State: 2000-01 and 2001-02 ............................................................................................................................... 34
Exhibit 3.16: Average Number of Applications Received and Grants Awarded: 2000-01 and 2001-02 by Size of State (Fall 2001) ............................................................................... 35
Exhibit 3.17: Types of Cash and In-kind Contributions Used for Local Cost Share....................... 36
Exhibit 3.18: Reasons for Denial of Continuation Funding Due to Insufficient Progress.............. 37
Exhibit 3.19: Format and Content of Technical Assistance Meetings Conducted by States.......... 41
Exhibit 3.20: Topics and Issues Included in Technical Assistance Documents Printed by States............................................................................................................................. 43
Exhibit 3.21: Types of Monitoring Activities States Conduct ............................................................ 44
Exhibit 3.22: Number of States Addressing Various Monitoring Topics, by Types of Monitoring Methods and Activities .............................................................................. 45

xxiv Exhibits
Exhibit 3.23: Types of Data Regularly Collected from Local Projects .............................................. 47
Exhibit 3.24: Availability of Certification Program in State by Type and Status of Certification or Accreditation Program ........................................................................ 49
Exhibit 3.25: States’ Professional Credential Requirements for Adult and Child Educators........ 50
Exhibit 3.26: Year in Which States First Notified Local Projects about Even Start Performance Indicators (PI) ............................................................................................ 54
Exhibit 3.27: Participant Groups to Be Assessed for Educational Gain and to Be Included in the Calculation of Performance Outcomes................................................................... 55
Exhibit 3.28: State Leadership in Evaluation Activities ...................................................................... 58
Exhibit 3.29: Measures of State Even Start Infrastructure and Leadership and Management Practices ............................................................................................................................. 60
Exhibit 3.30: State Even Start Infrastructure Characteristics Related to Leadership and Management Practices..................................................................................................... 61
Exhibit 3.31: Areas Targeted for Strengthening State Operations..................................................... 63
Exhibit 3.32: Areas Targeted for Strengthening Local Project Operations....................................... 64
Exhibit 3.33: Major Accomplishments in School Year 2000-01 .......................................................... 65
Exhibit 3.34: Challenges in Administering Even Start........................................................................ 66

Chapter 1 1
Chapter 1. Even Start History and Previous Research
Even Start Program History
Even Start began as a federally administered program in 1989-90 with grants totaling $14.8 million awarded to 76 projects. According to the Even Start statute, when funding reached $50 million, the administration of the program was to be transferred to state agencies. This level was exceeded in 1992, and since then, most Even Start projects have been administered by the 50 states, the District of Columbia, and Puerto Rico. The only exceptions to state-administered grants are: family literacy programs specifically for migrant families, Indian tribes and tribal organizations, and outlying areas that are supported through special set-aside funds (6 percent of the total Even Start appropriations) and remain under federal administration; discretionary grants for Statewide Family Literacy Initiatives (SFLI) to support building state-level partnerships among agencies and organizations that would contribute to strengthening family literacy services in the state; and a family literacy project in a prison that houses women and their preschool-aged children, that is administered by the U.S. Department of Education (the Department). The program has grown steadily since 1992 when the states began to administer approximately 250 Even Start projects in operation across the United States. In 2001-02, the total Even Start appropriation increased by $100 million from the previous year to $250 million, and the number of projects exceeded 1,100 nationwide.
Even Start Legislation
Even Start addresses the basic educational needs of parents and children from birth through age seven from low-income families. The program provides unified, multi-component family literacy services, which are defined in the No Child Left Behind Act of 2001 as services that are provided to participants on a voluntary basis that are of sufficient intensity in terms of hours and of sufficient duration to make sustainable changes in a family and that integrate all of the following:
Interactive literacy activities between parents and their children.
Training for parents regarding how to be the primary teachers for their children and full partners in their children’s education.
Parent literacy training that leads to economic self-sufficiency.
An age-appropriate education to prepare children for success in school and life.
The Even Start Family Literacy Program was first authorized in 1989 as Part B of Chapter 1 of Title I of the Elementary and Secondary Education Act of 1965 (ESEA). Competitive subgrants were awarded to local education agencies (LEAs) in collaboration, when appropriate, with other
2 Chapter 1
nonprofit entities. Even Start has been reauthorized three times—in 1994, in 2000 by the LIFT Act, and in 2001 by the No Child Left Behind Act. Major legislative amendments to Even Start include the following:
In 1991, the National Literacy Act amended Even Start by (1) requiring grantees to be LEAs in collaboration with community-based organizations or vice versa; (2) adding set-asides for Indian tribes and tribal organizations and for outlying areas; (3) requiring instructional programs to be of high quality and setting a minimum subgrant size of $75,000; (4) allowing families to participate until all family members become ineligible; (5) adding developmental and support services to the screening tools that projects may use to prepare parents for full participation; (6) allowing states to waive the match requirement in whole or part; (7) targeting services to high-need areas of each state; and (8) lowering the minimum age of children served from age one to birth.
In the 1994 reauthorization, (1) services were targeted to areas with high numbers of families most in need and extended to teen parents; (2) projects were required to serve at least a three-year age range of children and provide enrichment or instructional services during the summer months; (3) projects were allowed to involve ineligible family members in family literacy activities; (4) stronger partnerships and collaboration were required in the application and implementation process; and (5) funding for local projects was limited to eight years.
In 1996, Congress sought to strengthen Even Start further by passing an amendment requiring instructional services to be intensive.3
In 1998, the Reading Excellence Act amended Even Start by (1) providing a definition of the term “family literacy services” to match the definition in other legislation with family literacy components, including Head Start, the Adult Education and Family Literacy Act, and the Reading Excellence Act program, and (2) requiring states to develop results-based indicators of program quality and to use these indicators to monitor, evaluate, and improve Even Start programs.4
In 1999, the Omnibus Appropriations Act for Fiscal Year 2000 allowed local grantees to continue to participate in Even Start beyond eight years and reduced the federal share for the ninth and succeeding years to 35 percent.5
3 Omnibus Consolidated Rescissions and Appropriations Act, 1996, Section 2755, P.L. No. 104-134 (1996). 4 Title VIII of the United States Department of Labor, Health and Human Services, and Education Appropriations
Act, enacted by the Omnibus Consolidated and Emergency Supplemental Appropriations Act, 1999, Section 101(f), P.L. No. 105-277 (1998).
5 Section 306(a) and (b)(2) of H.R. 3424, as incorporated by the Omnibus Consolidated Appropriations Act, 2000, Section 1000(a)(4), P.L. No. 106-113 (1999).

Chapter 1 3
In 2000, reauthorization (LIFT Act) almost doubled Even Start’s authorization level to $250 million, and required projects to build on existing services of high quality, to promote the academic achievement of children and parents, and to use instructional programs grounded in scientifically-based reading research including research on the prevention of reading difficulties. The law strengthened staff qualifications. The law also required instructional services during the summer months, encouragement of regular attendance and continuity in the program, and use of local evaluations for program improvement.
These amendments were continued in the program’s reauthorization by the No Child Left Behind (NCLB) Act of 2001. In addition, the NCLB Act made several changes that specifically affect the state administration of Even Start. The law specifies that grants for state-administered programs are made exclusively to state education agencies (SEAs), rather than any other state office, and allows states to reserve 6 percent of the funds for state administration and technical assistance to improve low-performing programs.
As this overview of Even Start’s legislative history illustrates, the program has not only grown in size, but has also evolved by expanding its coverage, refining its program requirements and educational services, and adding greater emphasis on accountability and program quality.
Previous Studies of the Even Start Program
Since 1989, the Even Start legislation has included a requirement for national evaluation of the program, and the U.S. Department of Education has conducted three cycles of four-year national studies. The national evaluation’s basic purposes have been to describe Even Start projects and participants, examine the program’s performance and effectiveness, and identify effective Even Start projects for use in improving the program and providing technical assistance. There has been substantial continuity among the three national evaluations, but each had a special focus as well. First National Evaluation. The first national evaluation (St.Pierre, Swartz, Gamse, Murray, Deck, and Nickel, 1995) was broad in scope, addressing questions such as: What are the characteristics of Even Start participants? How are Even Start projects implemented and what services do they provide? What Even Start services are received by participating families? And what are the effects of Even Start on participating families? In addition to data collected from all projects operating during the study period, this evaluation also included a sample-based In-Depth Study to assess the effectiveness of the Even Start program in its early years. Second National Evaluation. In the second national evaluation (Tao, Gamse, and Tarr, 1998), program and participation information continued to be collected from all local Even Start projects, and another sample-based study was conducted to assess the extent of change in educational achievement by children and adults.

4 Chapter 1
Third National Evaluation. The third national evaluation (St.Pierre, Ricciuti, Tao, Creps, Swartz, Lee, Parsad, and Rimdzius, 2003) also consisted of two complementary data collection activities: (1) continuation of annual data collection from all local projects to document the program’s implementation nationwide and (2) the Experimental Design Study (EDS) to assess the impact of Even Start services on educational outcomes of children and their parents. In addition to the congressionally mandated national evaluations, the U.S. Department of Education has conducted smaller studies and analyses that focused on specific issues, such as a synthesis of Even Start state and local evaluations (St.Pierre, Ricciuti, and Creps, 1999).
Scarcity of Information on State Administration of Even Start
Although the three national evaluations collected considerable information about Even Start’s implementation, participants, and impact at the local project level, there has been no systematic study of the administrative activities that take place at the state level. The states, nonetheless, have played a key role in Even Start as a link between the budgets and policies adopted by the federal government and the delivery of services by local projects, now operating through more than 1,000 subgrants nationwide. The responsibilities and practices of state Even Start offices, moreover, have likely evolved substantially since 1992, when the program first became state-administered. Initially, each state had only a few local projects to administer, the grants were much smaller, and the statutory requirements were fewer and less rigorously defined. However, as the program’s requirements became more complex, as the appropriations increased, and as federal policies began to place more emphasis on the effectiveness of the program and on educational gains by participants, the programmatic guidance and leadership provided by state coordinators to local projects became a critical factor in Even Start’s implementation at the local level. In this context, the lack of systematic information about how states administer Even Start is a major gap in efforts to further refine the program.
Chapter 2 5
Chapter 2. Purpose and Approach of the Study The Study of State Administration of Even Start Program was designed to systematically describe the structure and processes associated with all major areas of Even Start administration at the state level. The goal of the study was to provide comprehensive descriptions of state program operations nationwide, the nature and extent of program improvement efforts being implemented by states, and further understanding of factors that facilitate or impede program improvement activities conducted by Even Start state coordinators. This information is intended to: 1) assist the federal Even Start staff to better target their guidance and technical assistance to states, and 2) provide state coordinators with descriptions of program administration practices across all states as a self-assessment guide.
Functional Model of State Even Start Administration
A functional process model representing the state Even Start administration is shown in Exhibit 2.1. The model places the entire Even Start program in a framework of input, process, and output factors, with the central focus of the model being the “state Even Start office.” The model is intended as a guide to analyzing how states carry out their responsibilities to administer Even Start. The factors that are likely to affect how states administer Even Start are designated as input factors, and the ultimate “outputs” of Even Start are the implementation and delivery of Even Start services and participant educational gains at the local level.
Input: State Even Start Program Infrastructure
The model presents the “state Even Start office” in two components: its infrastructure (input) and its leadership and management functions (process). The infrastructure includes factors such as: where Even Start is located within the state government; state staff resources assigned to Even Start; continuity and tenure of state coordinators; use of advisory groups and expert consultants that assist state coordinators with administrative functions; and the number of local projects in the state. Many of these factors, such as the organizational structure, are outside of the state coordinator’s control, and yet they influence the efficiency and level of effort that can be devoted to the process of administering Even Start. A general practice is for each state to designate an Even Start state coordinator to direct and coordinate Even Start program administration duties. There is great variation among states regarding which office of the state government administers Even Start,6 whether the state coordinator is part of an agency or unit of state government that administers other related programs (e.g., the Adult Education Program), and the extent of coordination of services and fiscal resources between Even Start and other programs that target similar populations. Thus, the transfer of program administration from the federal government to the states resulted in 6 Beginning in FY 2002, the No Child Left Behind Act has required Even Start to be administered by the SEA,
although the SEA may collaborate with other state offices in that administration.

6 Chapter 2
great variation in how the Even Start program is administered and may have increased the variation in program implementation at the local level.
Exhibit 2.1 Functional Model of State Even Start Administration
Process Output Input
U.S. Department of Education
Provide: Even Start grants Statutory guidelines
Technical assistance
Local Even Start Projects
Design and implement comprehensive family literacy services Increase children’s
academic achievement Increase adults’ learning
outcomes Implement continuous
improvement strategies o Staff development o Data-based decision
making and curriculum design
o Local evaluation
State Even Start Office Infrastructure
Programmatic location within state government Even Start staff resources Continuity and tenure of state coordinator Experience and expertise of state Even Start staff Use of advisory and expert groups Number of projects administered
State Even Start Office Leadership and
Management Functions Develop state Even Start
program and funding policies and procedures Screen and select grantees Award subgrants through
peer review process Monitor local projects’
compliance with program requirements and state guidelines Provide technical
assistance to projects Implement state
performance indicators to support continuous improvement strategies and to use in monitoring and evaluating projects Conduct state Even Start
evaluation (if any)
State Agencies and Programs and External Organizations Collaborate with state Even Start
Direct input
Indirect input
Chapter 2 7
Differences in the placement and organization of the state Even Start office have implications for program operations. In some states, the state Even Start office consists solely of one person. This person may have little involvement in other programs and substantial autonomy in administering Even Start. In other states, the Even Start state coordinator has major responsibilities for several other federal and state programs. In some states, the state Even Start office is included in a consolidated program administration, involving a cadre of personnel working on several programs such as Title I. Many different combinations of staffing patterns and inter-program arrangements are possible and may influence program administration. As shown in Exhibit 2.1, external input factors that affect the state Even Start infrastructure are: 1) the federal Even Start program, which provides Even Start funding and guidance directly to the states and indirectly to local projects; and 2) collaborating agencies, organizations and consultants, internal or external to the state education department, that provide administrative and technical resources to the state Even Start office.
Process: State Even Start Management and Leadership Functions
With differing organizational structures and resources as inputs, states perform leadership and management functions that include: developing and disseminating state Even Start guidelines; implementing statutory subgrantee selection criteria and priorities; establishing state-specific criteria, requirements, or priorities that are consistent with the federal statute for subgrantee selection; convening a peer review committee to evaluate subgrant applications; screening and selecting local Even Start projects; determining the size and duration of each subgrant; providing technical assistance and programmatic guidance to local projects; conducting compliance reviews and evaluating local project implementation and operations; and devising and implementing Even Start program improvement strategies for the state as a whole. Thus, the states’ roles extend far beyond the fiscal management of Even Start grants into activities that promote improvement in the quality of Even Start services and instructional outcomes at the local level. In addition, the federal program office as well as advisory groups and consultants contribute to state leadership and management activities such as staff development and technical assistance.
Output: Program Operations and Outcomes at the Local Level
Effective administration of Even Start at the state level is hypothesized to result in the ultimate goal of the Even Start program, which is to achieve effective implementation of family literacy services and to produce measurable gains in participating children’s academic achievement and parents’ learning outcomes (see Exhibit 2.1). Toward this goal, the statute requires each local project to: target services to areas with high numbers of most-in-need families in order to
8 Chapter 2
recruit and serve low-income families most in need of Even Start educational services7; screen and prepare families for full participation; accommodate participants’ work schedules and provide support services; provide high-quality, intensive instructional services based on scientifically based reading research (adult education, parenting education, early childhood education and parent-child joint interactive activities); ensure that instructional, paraprofessional, and administrative staff have appropriate qualifications; provide training for staff who work with parents and children; provide home-based instructional services; provide some instructional and enrichment services on a year-round basis; coordinate services with other local programs; conduct a local evaluation; provide services to at least a three-year age range of children; encourage regular attendance and retention in the program; include reading readiness activities for preschool age children, if applicable; promote continuity of family literacy to ensure retention of educational outcomes; and provide for an independent local evaluation to be used for program improvement. Even Start is intended to benefit families in several ways. Potential outcomes for parents are improved literacy, parenting skills, and educational and employment skills that lead to economic self-sufficiency. Goals for parents also may include growth in personal and family management skills and community involvement. The potential effects of Even Start on children include improved school readiness, reading and reading readiness, and, for school-age children, academic achievement at grade level. Decisions about how to implement all program requirements are largely left to individual projects within the guidance provided by the states. For example, the legislation requires high-quality instructional programs of sufficient duration and intensity; services for parents and children together; and instructional services in the home. But projects can decide on the frequency and duration of program activities,8 whether activities are primarily center-based or home-based, and whether to design educational curricula from scratch or use a hybrid of existing approaches, as long as the selected approach is research-based. Given the complexity of coordinating a multi-component family literacy program, local projects, especially new projects, need assistance and guidance in developing and improving Even Start services. The functional model posits that increased efficiency and effectiveness in the leadership and management functions at the state level will improve outcomes at the local level. This could occur through the kinds of information, technical assistance, and guidance provided by the state, as well as the level of overall leadership and clarity of purpose exhibited by the state coordinator. 7 To be eligible for Even Start, a family needs (a) a parent who is eligible for adult education services under the
Adult Education and Family Literacy Act or who is within the state’s compulsory school attendance age range or attending secondary school and (b) a child under 8 years of age. The definition of “most-in-need” is based on locally established criteria that must include, at least, family income and parent’s literacy level.
8 The recently added definition of family literacy services (Section 1202(e)(3)) provides that services must be of sufficient intensity in terms of hours, and of sufficient duration, to make sustainable changes in a family.

Chapter 2 9
Study Questions
The U.S. Department of Education developed a series of research questions, which were reviewed and modified by a panel of experienced state coordinators that constituted the Expert Work Group for this study. The questions addressed the organizational structure of Even Start and all major leadership and management functions assigned to state Even Start offices, with an emphasis on how states select grantees, make funding decisions, provide technical assistance to local projects, monitor and evaluate program performance, and implement strategies to improve participant outcomes and the quality of local services. The key study questions are listed below, organized by major administrative domains (Appendix A presents a detailed list of study questions): State Even Start Infrastructure
Where is the administration of the Even Start program located within states?
How many staff at the state level work on Even Start?
Does the state coordinator have duties other than Even Start?
What percent of the federal Even Start funds is used for technical assistance and professional development for local grantees? How are the budget decisions made?
Interagency Coordination and Collaboration To what extent do state coordinators work with other offices and agencies to administer
the program?
Are state-funded family literacy programs available in the state and how does Even Start coordinate with these programs?
Subgrantee Selection How many applications do states receive each year? How many projects are funded
each year?
How do states make decisions on the number of grants to award each year?
Do states spread the funding among many projects or restrict funding to a smaller number of projects over a longer period of time? Why?
What criteria do states use to make continuation and re-competition awards?9
How has the increase in Even Start funding for Program Year 2001-02 affected the number of subgrants states award, the amount of funds allocated to each subgrant, and the types of local projects selected?
9 Local projects that are awarded multi-year grants receive continuation funding for each year after their first year
of awards for up to three additional years. Projects that have completed all years of one Even Start grant may apply, or re-compete, to receive another, new subgrant.

10 Chapter 2
Technical Assistance What guidance do states provide local projects on issues such as providing high-quality,
intensive, research-based instruction; serving families most in need; retaining families, and coordination with other programs?
How do states decide what issues to address in their technical assistance to local projects? How have the states used national or state evaluation data in making decisions about technical assistance needs?
Monitoring, Evaluation, Accountability Do states have reporting systems in place?
What is the status of the development and implementation of the states’ Even Start performance indicator systems?
Do states collect and review local project evaluations? Do states require local projects to collect specific types of data in their local evaluations?
How, if at all, have the legislatively required performance indicators changed the monitoring and evaluation process?
How will the performance indicator data be used at the local and state levels?
What guidance have states provided to local projects regarding the implementation of new legislative requirements?
Continuous Improvement, Learning from Local Projects What program areas are targeted for further improvements at the state and local levels?
What actions do states take when projects are not implementing sound program improvement strategies?
What methods do states use to receive feedback from local projects?
In what ways has the feedback from local projects helped to improve the states’ administrative procedures?
The detailed list of study questions included in Appendix A was used as the basis for constructing the data collection instruments for this study.
Study Method
This study involved two components: (1) a mail survey of state Even Start offices (state survey) and (2) case studies based on interviews with a diverse sample of state coordinators through telephone calls or site visits. The state survey was sent to state coordinators in all 50 states, the District of Columbia, and Puerto Rico. All but one state returned a completed survey. For the case study, 12 states were selected to include variation in terms of the number of grants a state administers (large, medium, and small states); states that received the Statewide Family Literacy Initiative grants and those that did not; states in which Even Start is located under adult education and states where the affiliation is with early childhood or K-12 programs; and
Chapter 2 11
states in different geographic areas. The method used to sample the 12 states that participated in the case study interviews is described in Appendix B. The data collection activities were conducted in three phases:
Survey of Even Start State Coordinators: November 2001-February 2002.
Case Study Telephone Interview: March-May 2002.
Case Study Site Visits: March-May 2002.
Survey of Even Start State Coordinators (State Survey)
As shown in Appendix A, a large majority of evaluation questions were addressed in the state survey in order to develop a comprehensive, program-wide description of state Even Start administration. Most state coordinators completed a paper data collection form, but an electronic version of the form was provided to four coordinators upon request.
Case Study Interviews in Sampled States
The case study component of the study was designed to provide a deeper understanding of information gathered through the state survey. A sample of 12 state coordinators was selected to discuss topics such as major challenges in program implementation, challenges and accomplishments in implementing the performance indicator system, and strategies for ensuring accountability of local projects. The interview questions focused on issues that (1) were qualitative in nature, (2) required detailed narrative responses, (3) required follow-up, probing questions, (4) did not lend themselves to program-wide distributional analysis, and (5) extended the information gathered from the state survey. Site visits were conducted in six states where Even Start operations are heavily intertwined with activities supporting other programs (e.g., Adult Education and Title I) and where there were multiple individuals who needed to be interviewed for the study. In six other states with less complex Even Start administrative structures, state coordinators were interviewed by telephone. Two versions of the interview protocol were used: a lengthy, comprehensive set of qualitative questions for the site-visits, and a shorter list for the telephone interviews. When the state survey and the case study interviews were conducted, states were in the process of adjusting to two major changes: 1) the implementation of states’ performance indicator systems, and 2) a substantial increase in the Even Start budget (from $150 million in 2000-01 to $250 million in 2001-02). Information presented in this report describes state Even Start operation in the early stages of adjustment to these changes, and may not reflect the current status of related operations (e.g., implementation of performance indicator systems).

12 Chapter 2
Review of States’ Performance Indicators
In addition to the state survey and the case study interviews, Abt Associates was contracted to review the documentation of Even Start performance indicators submitted to the U.S. Department of Education by all states in June 2001. A synopsis of the conclusions from this review is presented in Chapter 3 of this report, in conjunction with findings concerning performance indicators from the state survey and case study interviews.

Chapter 3 13
Chapter 3. Study Findings
State Even Start Administrative Infrastructure
Summary of Key Findings
The state Even Start administrative infrastructure is largely determined by the state officials and offices above the Even Start state coordinator, who has responsibilities for the operations of state Even Start. Even Start staff resources are limited in many states, and state coordinators often have responsibilities for other programs, as evidenced by the following findings:
o In 24 states, Even Start is located under early childhood education or K-12 programs, and in 13 states, it is located under adult education. In the remainder of states, Even Start is under programs other than adult education, early childhood education (ECE), or K-12 programs.
o About a quarter of the current state coordinators have one year experience or less in this position, while another quarter of the coordinators are very experienced with nine or more years of experience.
o In almost 40 percent of the states, Even Start is administered with .5 professional full-time equivalent (FTE) staff and no more than 1.5 clerical FTEs.
o In addition to having a relatively small staff, most state coordinators have multiple responsibilities other than administering Even Start; they spend, on average, 49 percent of their time on Even Start duties, and the remaining time on other responsibilities.
o States typically spend 95 percent of their federal grants on subgrants to local projects.10 Only about 2.5 percent of the federal grant goes to state Even Start staff salaries.
o The majority of states listed at least one non-Even Start funding source that pays for state Even Start salaries.
o Despite the limited Even Start staff resources and responsibilities for multiple programs, Even Start state coordinators generally have a high degree of autonomy in making Even Start administrative decisions.
10 Before the 2000 LIFT Act amendments, states were required to use at least 95 percent of their grants to fund local
project subgrants, and could reserve up to 5 percent for state-level activities. Beginning in 2001, states could reserve up to 6 percent of their grants for state-level activities, leaving at least 94 percent of those grants for subgrants at the local level. States may spend up to one-half of the amount of the state-level reservation for state administration, with the remainder being made available for providing technical assistance to subgrantees. The state survey asked for states’ Even Start budget for Program Year 2000-01—before these changes took effect.
14 Chapter 3
Organizational Location within the State Government
Before 2001, federal Even Start grants were awarded to state offices—usually state education agencies (SEAs). The No Child Left Behind Act amended the law in 2001 to require Even Start grants to be awarded only to SEAs. Once the grant is received by a state, it is up to the state to assign the administration of Even Start to a specific program, division, or unit. For example, although Even Start is legislated as Subpart C of Part B of Title I, at the state level, it may not be placed under Title I. In fact, Even Start is located under adult education (or programs related to education of adults such as vocational education and community colleges) in 13 states. Even Start is under ECE or K-12 in 24 states.11 Fourteen states indicated that Even Start is under programs other than adult education, ECE, or K-12 programs. Examples of such programs are Federal Programs, Discretionary Grants, Policy and Programs Coordination Unit, Special Programs Management Section, Educational Opportunity and Equity, and Learning and Teaching Support. Even Start’s organizational affiliation is largely outside the state coordinator’s control. Generally, Even Start is located with other program(s) that share similar target populations, programmatic requirements, or service delivery approaches as Even Start. Organizational affiliation has implications for the state administration of Even Start. Depending on where Even Start is located, the state coordinator may have more or less access to additional funding, staff, and other resources that are available in different program areas (e.g., adult education, Title I). States not only have different options for placing Even Start organizationally, but they may also move Even Start from one unit to another. The organizational location may be shifted based on expansion or reduction of funding in the affiliated programs or general reorganization and restructuring of state agencies, for example, to increase regional capacity for program administration. The affiliation changes may be motivated by federal legislative changes that affect the alignment of state agencies based on similarity of program content. An example of such legislative change occurred when adult education and family literacy became important components of the Workforce Investment Act of 1998. Twenty-four states have moved Even Start since 1992, generally only once. However, eight state Even Start offices reported having experienced two or more moves since 1992. Among the 24 states, the moves involved a variety of programs or units. The only recurring pattern that the survey revealed (in 11 states) was moving Even Start from Title I to other programs (e.g., adult education or ECE). 11 In some of these 24 states, the organizational affiliation is with Title I. However, the states’ responses to the
organizational affiliation question were not clear enough to determine how many states operate Even Start within the early childhood education unit and how many place Even Start under or with Title I.

Chapter 3 15
State Coordinator Turnover and Tenure
The administration of Even Start programs may also be affected by changes in state coordinators. Frequent turnover may interfere with the accumulation of knowledge and experience within a state’s Even Start office and deter progress in its program improvement plans. More than half of the states have had only one or two state coordinators since 1992, although another 17 states had three or four state coordinators and four states had five or more coordinators during the 10-year period (Exhibit 3.1). This suggests fairly stable staffing in which coordinator turnover appears to be relatively infrequent in many states.
Exhibit 3.1 State Coordinators’ Turnover and Tenure
Number of Coordinators Since 1992 No. of States % of States 1-2 people 28 55% 3-4 people 17 33% 5-7 people 4 8%
Number of Years as State Coordinator 1 year or less 12 24%
2-4 years 14 27% 5-8 years 9 18%
9-12 years 14 27% Note: The percentages are based on 51 states that responded to the survey, including two states that had missing data for this question.
The tenure of current state coordinators provides another indication of the stability of Even Start administrative infrastructure. On one hand, about a quarter of the current state coordinators are new, with one year experience or less in this position. On the other hand, 27 percent of the coordinators are experienced, with nine or more years of experience in this position (Exhibit 3.1). In terms of federal technical assistance to the states, the new coordinators represent a sizable group that may need substantial assistance. There is also a sizable group of highly experienced coordinators who may be an excellent source of mentoring and technical assistance to the new coordinators.
Staffing Pattern and Capacity
The effectiveness of state administration may also be affected by the number of state personnel who are assigned to work directly on Even Start-related tasks.12 The state survey data corroborate informal accounts by state coordinators indicating that staff resources for Even Start at the state level are very limited. In 19 states (38 percent), Even Start is administered with only .5 professional FTE and no more than 1.5 clerical FTEs (Exhibit 3.2). In another 18 states, the Even Start staff consists of no more than 1.5 professional FTEs and 1.5 clerical FTEs. 12 State coordinators were asked to indicate the number of full-time and part-time professional staff and full-time
and part-time clerical or support staff assigned to Even Start. Based on these data, full-time equivalents (FTEs) were calculated using 50 percent time for all part-time personnel.
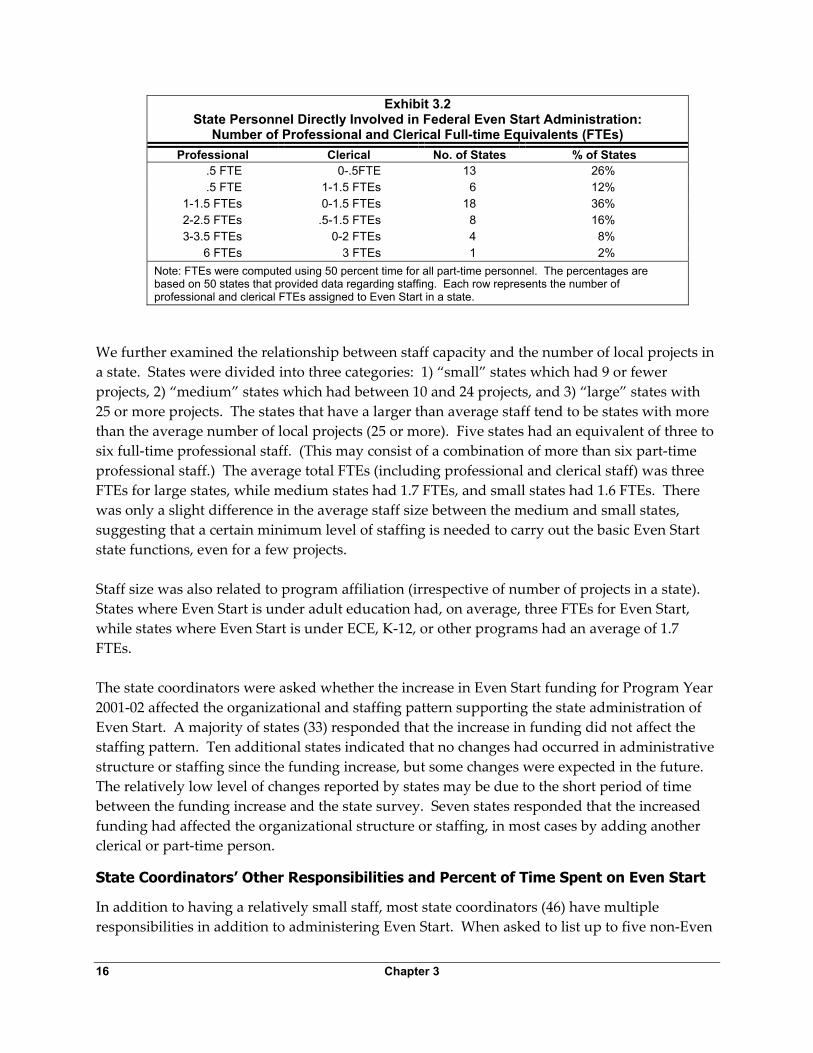
16 Chapter 3
Exhibit 3.2 State Personnel Directly Involved in Federal Even Start Administration:
Number of Professional and Clerical Full-time Equivalents (FTEs) Professional Clerical No. of States % of States
.5 FTE 0-.5FTE 13 26%
.5 FTE 1-1.5 FTEs 6 12% 1-1.5 FTEs 0-1.5 FTEs 18 36% 2-2.5 FTEs .5-1.5 FTEs 8 16% 3-3.5 FTEs 0-2 FTEs 4 8%
6 FTEs 3 FTEs 1 2% Note: FTEs were computed using 50 percent time for all part-time personnel. The percentages are based on 50 states that provided data regarding staffing. Each row represents the number of professional and clerical FTEs assigned to Even Start in a state.
We further examined the relationship between staff capacity and the number of local projects in a state. States were divided into three categories: 1) “small” states which had 9 or fewer projects, 2) “medium” states which had between 10 and 24 projects, and 3) “large” states with 25 or more projects. The states that have a larger than average staff tend to be states with more than the average number of local projects (25 or more). Five states had an equivalent of three to six full-time professional staff. (This may consist of a combination of more than six part-time professional staff.) The average total FTEs (including professional and clerical staff) was three FTEs for large states, while medium states had 1.7 FTEs, and small states had 1.6 FTEs. There was only a slight difference in the average staff size between the medium and small states, suggesting that a certain minimum level of staffing is needed to carry out the basic Even Start state functions, even for a few projects. Staff size was also related to program affiliation (irrespective of number of projects in a state). States where Even Start is under adult education had, on average, three FTEs for Even Start, while states where Even Start is under ECE, K-12, or other programs had an average of 1.7 FTEs. The state coordinators were asked whether the increase in Even Start funding for Program Year 2001-02 affected the organizational and staffing pattern supporting the state administration of Even Start. A majority of states (33) responded that the increase in funding did not affect the staffing pattern. Ten additional states indicated that no changes had occurred in administrative structure or staffing since the funding increase, but some changes were expected in the future. The relatively low level of changes reported by states may be due to the short period of time between the funding increase and the state survey. Seven states responded that the increased funding had affected the organizational structure or staffing, in most cases by adding another clerical or part-time person.
State Coordinators’ Other Responsibilities and Percent of Time Spent on Even Start
In addition to having a relatively small staff, most state coordinators (46) have multiple responsibilities in addition to administering Even Start. When asked to list up to five non-Even
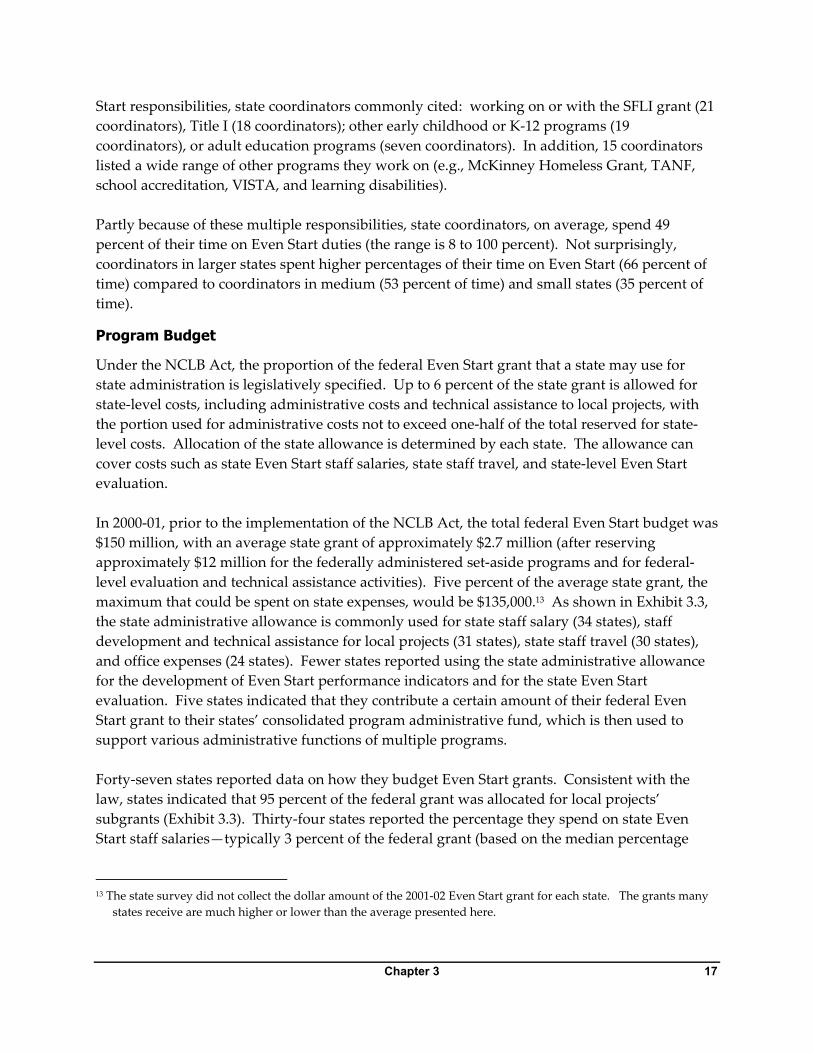
Chapter 3 17
Start responsibilities, state coordinators commonly cited: working on or with the SFLI grant (21 coordinators), Title I (18 coordinators); other early childhood or K-12 programs (19 coordinators), or adult education programs (seven coordinators). In addition, 15 coordinators listed a wide range of other programs they work on (e.g., McKinney Homeless Grant, TANF, school accreditation, VISTA, and learning disabilities). Partly because of these multiple responsibilities, state coordinators, on average, spend 49 percent of their time on Even Start duties (the range is 8 to 100 percent). Not surprisingly, coordinators in larger states spent higher percentages of their time on Even Start (66 percent of time) compared to coordinators in medium (53 percent of time) and small states (35 percent of time).
Program Budget
Under the NCLB Act, the proportion of the federal Even Start grant that a state may use for state administration is legislatively specified. Up to 6 percent of the state grant is allowed for state-level costs, including administrative costs and technical assistance to local projects, with the portion used for administrative costs not to exceed one-half of the total reserved for state-level costs. Allocation of the state allowance is determined by each state. The allowance can cover costs such as state Even Start staff salaries, state staff travel, and state-level Even Start evaluation. In 2000-01, prior to the implementation of the NCLB Act, the total federal Even Start budget was $150 million, with an average state grant of approximately $2.7 million (after reserving approximately $12 million for the federally administered set-aside programs and for federal-level evaluation and technical assistance activities). Five percent of the average state grant, the maximum that could be spent on state expenses, would be $135,000.13 As shown in Exhibit 3.3, the state administrative allowance is commonly used for state staff salary (34 states), staff development and technical assistance for local projects (31 states), state staff travel (30 states), and office expenses (24 states). Fewer states reported using the state administrative allowance for the development of Even Start performance indicators and for the state Even Start evaluation. Five states indicated that they contribute a certain amount of their federal Even Start grant to their states’ consolidated program administrative fund, which is then used to support various administrative functions of multiple programs. Forty-seven states reported data on how they budget Even Start grants. Consistent with the law, states indicated that 95 percent of the federal grant was allocated for local projects’ subgrants (Exhibit 3.3). Thirty-four states reported the percentage they spend on state Even Start staff salaries—typically 3 percent of the federal grant (based on the median percentage 13 The state survey did not collect the dollar amount of the 2001-02 Even Start grant for each state. The grants many
states receive are much higher or lower than the average presented here.

18 Chapter 3
point).14 About a third of the states allocate a portion of their federal grant for staff development and technical assistance—typically 1 percent of their Even Start grants. Also, 30 states reserve portions of their state funds for state staff travel (typically .5 percent). Fourteen states indicated that they allocated about 1 percent of the federal grant for the design and implementation of Even Start performance indicators. Of these states, nine had received the SFLI grants which provided technical assistance in the development of performance indicators, while five of these states did not have the additional SFLI resources. Thus, the nine states seem to have used both the SFLI and a portion of their federal Even Start funds on the development of the performance indicators.
Exhibit 3.3 Allocation of Federal Even Start Grant by Budget Categories
(For Program Year 2000-01) Number of States That
Reported Allocating Funds for Each Budget Category
Median Allocation Percentage
Subgrants to local projects 47 95.0 % of total grant State Even Start staff salaries (including
state coordinator) 34 3.0% of total grant
Staff development and technical assistance for local projects
31 1.0% of total grant
Travel for state Even Start staff 30 0.5% of total grant General office support, equipment, and
expenses for state office 24 1.0% of total grant
State Even Start evaluation 16 1.0% of total grant Design/implementation of performance
indicators 14 1.0% of total grant
Consolidated state administrative funds 5 5.0% of total grant Other (e.g., fee for application reviewers) 8 5.0% of total grant Note: The state survey asked for the budget allocation data for the 2000-01 program year―prior to the LIFT Act amendments that limited the state administration funds to 3 percent of the state grants. The medians were calculated on the basis of data provided by the number of states responding to each item. Because the medians are based on different numbers of states, the median percentages do not total to 100 percent across budget categories.
Data in Exhibit 3.3 also suggest that many states do not use their Even Start state administrative allowance to pay for staff salary, travel, or office expenses. It is likely that in these states, some of these administrative expenses are covered through other federal or state funding sources. Forty-six states listed at least one non-Even Start funding source that pays for state Even Start salaries; four states listed three non-Even Start funding sources that support Even Start staff salaries (Exhibit 3.4).15 Commonly cited sources of salary funds were general state or federal 14 Median is the middle number in a range of numbers. This is the number where one-half of the numbers are below
that point, and the other one-half are above that point. It is one of the statistics that is used to indicate “the typical” number in a range of numbers.
15 The survey question was intended to ask whether states use non-Even Start funds to support portions of Even Start staff salaries to perform Even Start functions. However, it is possible that some coordinators may have indicated availability of non-Even Start funds that support part-time Even Start staff to perform duties not related to Even Start.
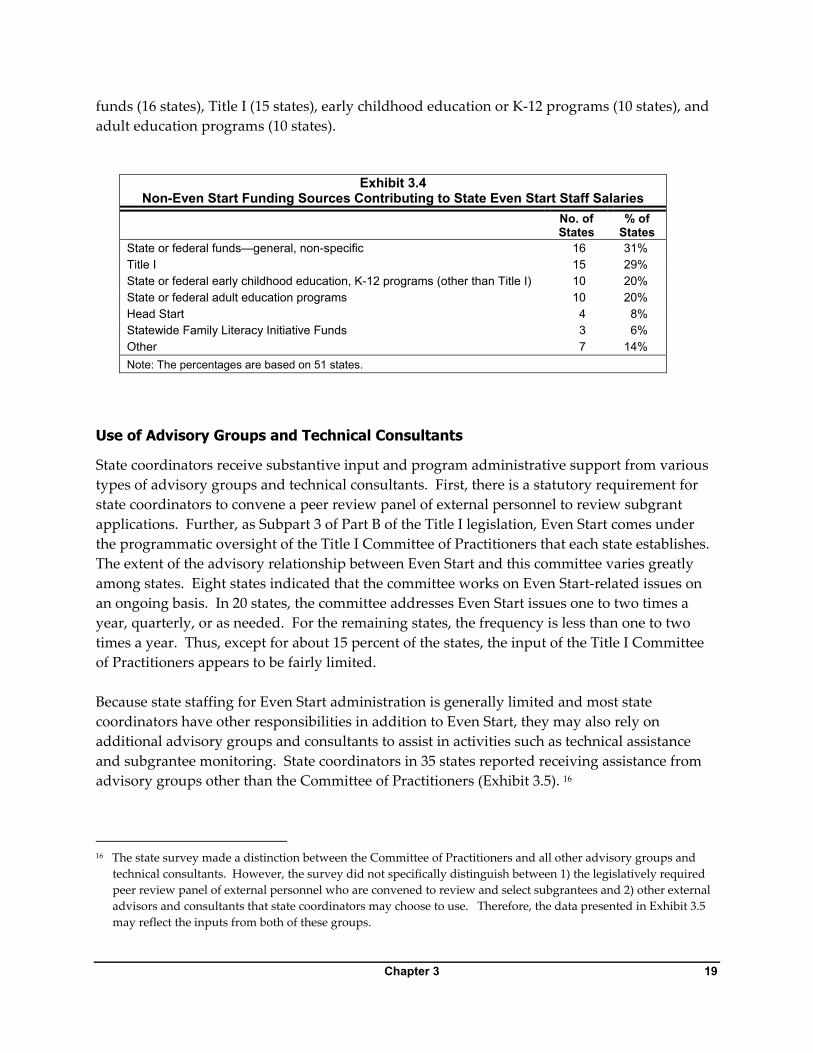
Chapter 3 19
funds (16 states), Title I (15 states), early childhood education or K-12 programs (10 states), and adult education programs (10 states).
Exhibit 3.4 Non-Even Start Funding Sources Contributing to State Even Start Staff Salaries
No. of States
% of States
State or federal funds—general, non-specific 16 31% Title I 15 29% State or federal early childhood education, K-12 programs (other than Title I) 10 20% State or federal adult education programs 10 20% Head Start 4 8% Statewide Family Literacy Initiative Funds 3 6% Other 7 14% Note: The percentages are based on 51 states.
Use of Advisory Groups and Technical Consultants
State coordinators receive substantive input and program administrative support from various types of advisory groups and technical consultants. First, there is a statutory requirement for state coordinators to convene a peer review panel of external personnel to review subgrant applications. Further, as Subpart 3 of Part B of the Title I legislation, Even Start comes under the programmatic oversight of the Title I Committee of Practitioners that each state establishes. The extent of the advisory relationship between Even Start and this committee varies greatly among states. Eight states indicated that the committee works on Even Start-related issues on an ongoing basis. In 20 states, the committee addresses Even Start issues one to two times a year, quarterly, or as needed. For the remaining states, the frequency is less than one to two times a year. Thus, except for about 15 percent of the states, the input of the Title I Committee of Practitioners appears to be fairly limited. Because state staffing for Even Start administration is generally limited and most state coordinators have other responsibilities in addition to Even Start, they may also rely on additional advisory groups and consultants to assist in activities such as technical assistance and subgrantee monitoring. State coordinators in 35 states reported receiving assistance from advisory groups other than the Committee of Practitioners (Exhibit 3.5). 16 16 The state survey made a distinction between the Committee of Practitioners and all other advisory groups and
technical consultants. However, the survey did not specifically distinguish between 1) the legislatively required peer review panel of external personnel who are convened to review and select subgrantees and 2) other external advisors and consultants that state coordinators may choose to use. Therefore, the data presented in Exhibit 3.5 may reflect the inputs from both of these groups.

20 Chapter 3
The Statewide Family Literacy Initiative (SFLI) represented an important source of advisory input for Even Start state administration. Twenty-seven state coordinators indicated that they received input from the SFLI partners, while no other source of assistance was mentioned by more than six states (Exhibit 3.5). In 17 states, the Even Start state coordinator was also the SFLI coordinator, and in an additional 15 states, the Even Start coordinator was a member of the SFLI leadership team.
Exhibit 3.5 Advisory and Consultant Groups Other Than the Committee of Practitioners
No. of States % of States Statewide Family Literacy Initiative (SFLI) 27 53% Other family literacy programs (e.g., state family literacy
programs) 6 12%
Reading Excellence Act 6 12% Early childhood education programs 6 12% Title I (other than the Committee of Practitioners) 5 10% Head Start 4 8% Adult education groups 4 8% Private consultants, technical assistance provider organizations 3 6% Other state offices/programs 8 16% Other groups (e.g., parents, public libraries) 5 10% No other advisory/consultant groups 14 27% Note: The percentages are based on 51 states. Thirty-five states listed at least one advisory or consultant group other than the Committee of Practitioners.
The single most common issue about which the state coordinators received input was the development of the Even Start performance indicators (Exhibit 3.6). During 2001-02, implementation of performance indicators was a major programmatic challenge for most states and was also the focus of the SFLI activities.
Exhibit 3.6 Issues Reviewed by the Committee of Practitioners or Other Advisory Groups
No. of States % of States State Even Start quality/performance indicators 43 86% Request for Application (RFA) for subgrant applications 26 52% State Even Start guidelines for local projects 24 48% New subgrant applications from local projects 21 42% State and local Even Start program development/improvement plans 19 38% State Even Start technical assistance materials and procedures 17 34% Continuation funding applications from local projects 14 28% State Even Start fiscal/funding plans 11 22% Other issues/materials 10 20% Note: Fifty states indicated one or more of the above responses.

Chapter 3 21
Aside from the performance indicators, the issues addressed by the advisory groups tended to center around new subgrantee recruitment and selection.17 The advisory groups are less likely to address strategies for Even Start program improvement, technical assistance, review of continuation applications, or fiscal management. Moreover, 14 states indicated that they did not use any advisory groups other than the Committee of Practitioners. Expanding the use of advisory groups that have been constituted for other state-level programs may, therefore, be a strategic avenue for enhancing the Even Start administrative resources.
Extent of State Coordinator’s Authority and Autonomy
Despite limited staff resources and numerous other responsibilities, Even Start state coordinators appear to have a high degree of autonomy in making administrative decisions. Five states use a consolidated Request for Application (RFA) package that solicits Even Start applications as well as applications for other federal or state programs. However, even in these states, Even Start state coordinators maintain control of the grantee selection process. All state coordinators who were interviewed in the case study portion of this study reported that most administrative and budget decisions related to Even Start are under their control.
Interagency Coordination and Collaboration at the State Level
Summary of Key Findings
In addition to obtaining assistance from advisory groups and consultants, close collaborative ties with other state-level programs is likely to augment the state coordinator’s administrative capacity.
o About three-quarters of the states cited the adult education program as a major collaborator; the second most common collaborators are the Head Start and Title I programs.
o Many collaborators make multiple types of contributions to Even Start, e.g., sharing various types of resources, conducting joint staff development activities, holding joint workshops or conferences, and sharing program administrative functions.
o Sixteen states reported having a state-funded family literacy program. These programs tend to use similar program design, policies, and standards as Even Start.
Types of Collaborators
Given the multi-component nature of Even Start, many state coordinators consider it imperative that they collaborate with adult education and ECE or K-12 programs. As shown in Exhibit 3.7, 17 Because the state survey did not distinguish the legislatively required peer review panel and other advisory
groups, this result may reflect, at least in part, the input of the peer review panel whose function is to review subgrantee applications.
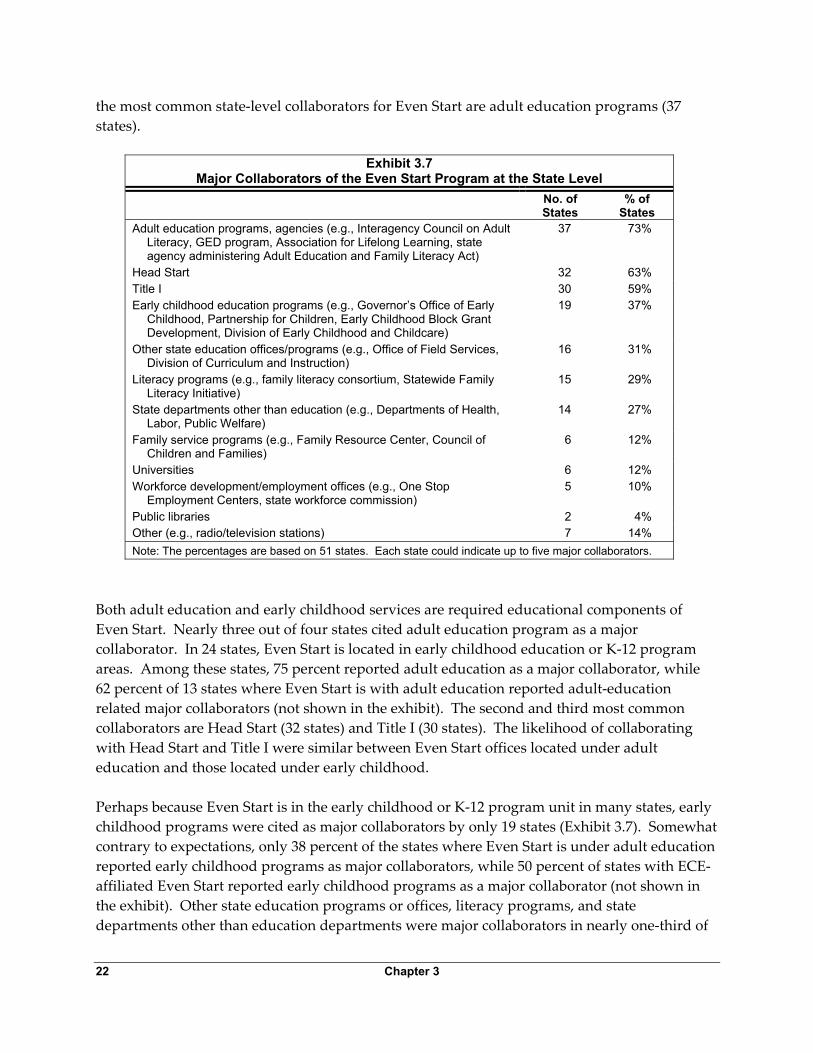
22 Chapter 3
the most common state-level collaborators for Even Start are adult education programs (37 states).
Exhibit 3.7 Major Collaborators of the Even Start Program at the State Level
No. of States
% of States
Adult education programs, agencies (e.g., Interagency Council on Adult Literacy, GED program, Association for Lifelong Learning, state agency administering Adult Education and Family Literacy Act)
37 73%
Head Start 32 63% Title I 30 59% Early childhood education programs (e.g., Governor’s Office of Early
Childhood, Partnership for Children, Early Childhood Block Grant Development, Division of Early Childhood and Childcare)
19 37%
Other state education offices/programs (e.g., Office of Field Services, Division of Curriculum and Instruction)
16 31%
Literacy programs (e.g., family literacy consortium, Statewide Family Literacy Initiative)
15 29%
State departments other than education (e.g., Departments of Health, Labor, Public Welfare)
14 27%
Family service programs (e.g., Family Resource Center, Council of Children and Families)
6 12%
Universities 6 12% Workforce development/employment offices (e.g., One Stop
Employment Centers, state workforce commission) 5 10%
Public libraries 2 4% Other (e.g., radio/television stations) 7 14% Note: The percentages are based on 51 states. Each state could indicate up to five major collaborators.
Both adult education and early childhood services are required educational components of Even Start. Nearly three out of four states cited adult education program as a major collaborator. In 24 states, Even Start is located in early childhood education or K-12 program areas. Among these states, 75 percent reported adult education as a major collaborator, while 62 percent of 13 states where Even Start is with adult education reported adult-education related major collaborators (not shown in the exhibit). The second and third most common collaborators are Head Start (32 states) and Title I (30 states). The likelihood of collaborating with Head Start and Title I were similar between Even Start offices located under adult education and those located under early childhood. Perhaps because Even Start is in the early childhood or K-12 program unit in many states, early childhood programs were cited as major collaborators by only 19 states (Exhibit 3.7). Somewhat contrary to expectations, only 38 percent of the states where Even Start is under adult education reported early childhood programs as major collaborators, while 50 percent of states with ECE-affiliated Even Start reported early childhood programs as a major collaborator (not shown in the exhibit). Other state education programs or offices, literacy programs, and state departments other than education departments were major collaborators in nearly one-third of

Chapter 3 23
the states. Less commonly cited collaborators included family service programs, universities, employment offices, and public libraries.
Nature of Collaboration
The state coordinators were asked to describe the type of contribution made to Even Start by each of their major collaborators. Their open-ended responses were grouped into the following categories for analysis:
Resource sharing: sharing staff time, salaries; office supplies, services, materials; office space; contractors, consultants; travel budget; program funding.
Joint staff development.
Joint meetings or conferences: advisory board or committee; staff or interagency meetings, formal or informal discussions; conferences; serving as presenters at workshops and conferences.
Administrative activities: review of subgrant applications; program and fiscal monitoring; management of SFLI grant activities; administrative guidance or support; project site visits; policy planning, budget development; serving on Committee of Practitioners or Consolidated Review team; standardizing subgrant process; providing listserv; program data collection and database management; coordinating among various literacy programs; developing Even Start performance indicators; providing technical assistance to projects; shared annual review, reporting, or planning.
Many collaborators make multiple types of contributions. For example, about half of the 37 states that collaborate with adult education programs share various types of resources, conduct joint staff development activities, and hold joint workshops or conferences with adult education programs (Exhibit 3.8). Although Even Start and Head Start are generally in two different state departments, state agencies or staff associated with Head Start contribute program administrative support to Even Start in 14 of the 32 states that collaborate with Head Start.
Exhibit 3.8 Number of States Receiving Various Types of Contribution Provided by Major
Collaborators of Even Start
n
Resource sharing
Joint staff
development
Joint workshops, conferences
Administrative
activities Adult education programs 37 15 15 18 12 Head Start 32 4 12 13 14 Title I 30 9 8 14 11 Early childhood education programs 19 5 5 7 6 Other state education offices, programs 16 3 4 7 6 Literacy programs 15 5 4 8 5 State departments other than education 14 3 4 5 6 Note: Each state could indicate up to five major collaborators, and for each collaborator, up to five types of contributions.
24 Chapter 3
Joint workshops and conferences, followed by shared program administrative activities, are the most common collaborative activities with Title I. In states where other agencies in the education department or other literacy programs (including SFLI) collaborate with Even Start, joint workshops and conferences were the most common modes of collaboration.
Extent of Collaboration
The data suggest that many of the major collaborators provide multiple kinds of input to Even Start on a regular basis. However, only 21 states listed five primary collaborators; the remaining states reported fewer than five collaborators. Twenty-five states reported working with interagency collaborators outside the government unit in which the Even Start program is situated, and 19 states reported at least one non-state government organization as a collaborator.
Barriers to Collaboration
In the case study interviews, many experienced state coordinators described multiple challenges to forming strong collaborative relationships. Common barriers were turf issues among related programs; different program philosophies, definitions, and accountability requirements; lack of understanding about family literacy approach; a perception that Even Start is an extremely complex and demanding program among potential collaborators; and preexisting negative relationships between potential collaborating agencies. Coordinators explained that often, formation of a viable collaborative relationship is affected by the physical proximity of offices, preexisting personal working relationships, and personalities involved. Important collaborative relationships could be weakened by such nonprogrammatic events as physical relocation of the Even Start office or state coordinator turnover.
State-Funded Family Literacy Programs
In addition to administering the federal Even Start grant, 16 states also have a state-funded family literacy program. The state survey included a set of questions to provide a basic description of these state-funded family literacy (state-FL) programs. The state-FL programs are administered by different state agencies in the 16 states: by the state department of education or board of education in six states, by adult education or the department of community colleges in seven states, early childhood education (one state), department of human services (one state), and the state library program (one state). The types of organizations that are eligible to apply for state-FL funds are similar to those eligible for Even Start, including institutions of higher education and other providers of adult education (13 states), community-based organizations (10 states), and local education agencies (nine states).18 Less commonly cited as eligible organizations were state education agencies, Head Start programs, Even Start projects, migrant education programs, and public libraries (each mentioned by one or two states). 18 Each state with a state-FL program could indicate up to five types of eligible organizations.

Chapter 3 25
State-FL programs also target the same type of families as Even Start: parents with limited basic or literacy skills (13 states) and low-income families (12 states). Eleven states target families with a specific age range of children: ages 3-4 years (two states); 0-7 or 0-8 years (five states); 0-12 years (one state); and 0-18 years (one state). Additional family characteristics that are also targeted for this program included teen parents, pregnant mothers, migrant families, English- language-learner (ELL) families, Temporary Aid to Needy Families (TANF) recipients, and families with substance abuse problems. In general, the state-FL programs follow the same program approach as Even Start; in fact, 13 of the 16 states require state-funded family literacy programs to provide comprehensive family literacy services as defined in the Even Start legislation. Even Start and state-FL programs closely coordinate various program functions, such as applying the same program standards, coordinating program planning, setting similar program goals, sharing personnel, and sharing fiscal resources (Exhibit 3.9). Ten of the 16 states require the state-FL programs to assess their program performance using the Even Start performance indicators. Thus, state-funded family literacy programs, where they exist, appear to form a mutually beneficial relationship that provides opportunities for Even Start to obtain additional resources (e.g., joint staff training), while providing the state-FL program with a program framework, processes, and monitoring tools.
Exhibit 3.9 Coordination between Even Start and State-Funded Family Literacy Programs
No. of States % of States
Apply the same program standards 14 88% Coordinate program planning 13 81% Specify the same program goals 13 81% Share personnel 10 63% Share fiscal resources 10 63% Jointly monitor local project activities and performance 8 50% Conduct joint state evaluation 7 44% Other coordinated activity 7 44% The federal Even Start funds and state family literacy funds are
usually awarded to the same local projects 5 31%
Note: Percent of states is based on16 states that indicated that they had state-funded family literacy program(s).
While most of the state-FL programs share a similar program design and approach with Even Start, there are great differences among the states in terms of state-FL funding. Among ten states that provided information on state-FL funding, the 2000-01 funding was $5-$8.5 million in three states; $1-$4.9 million in five states; and $100,000-$304,000 in two states. States also differ in the number of state-FL grants they award: six states funded four to nine grants; four states

26 Chapter 3
funded 13-26 grants; and four states funded 50-86 grants in 2000-01. The average annual grant (among nine states providing fiscal data) was $99,900; the range was $38,000 to $192,300.19 The maximum annual funding level established by these states ranged from approximately $2,000 to $430,000 per grantee. Thus, in some states, the state-FL grants are relatively small compared to the typical Even Start subgrants (national average of $175,400 in year 2000-01) (St. Pierre et al., 2003), but in some states, the state-FL grants are substantial. Seven states use multi-year grant cycles (mostly four-year grants) for state-FL grants, similar to 90 percent of Even Start subgrants (Tao, Gamse, and Tarr, 1998). However, in nine states, all state-FL grants are for one year.
Subgrantee Recruitment and Selection
Summary of Key Findings
States perform a sequence of tasks that culminate in the annual awarding of new and continuing grants. The major tasks include: preparation of an RFA, release of the RFA, provision of technical assistance and Even Start information to applicants, convening and training application reviewers, review of applications, making selection and funding level decisions, and notifying grant recipients.
o Typically, states prepare Even Start grant RFAs in the November to February period and release RFAs in January or March. In most states, applications are due in April, May, or June; they are reviewed in May or June; and selection decisions are made in June, July, or August.
o All states require applicants to describe how they will implement the legislatively required program elements. Most states also assign competitive weight or priority points to applicants’ specific program characteristics or plans. Both poverty and need for literacy education are commonly addressed in these priority points.20
o In 2001-02, when the federal Even Start budget increased by $100 million, there was a 50 percent increase in the number of new applications states received, and states awarded subgrants to slightly more than half of the new applicants.
o States show considerable similarity in the length of Even Start subgrants. Most of the new subgrants in 2001-02 were four-year grants; 25 percent were one-year grants.
19 The survey did not collect information on the proportion of total program cost for a local project that is supported
by a state-FL grant. It is possible that a relatively small state grant may be intended to supplement a larger grant provided from another funding source.
20 The Even Start statute (Section 1238(a)(2)) requires states to give priority in the selection process to certain applications.
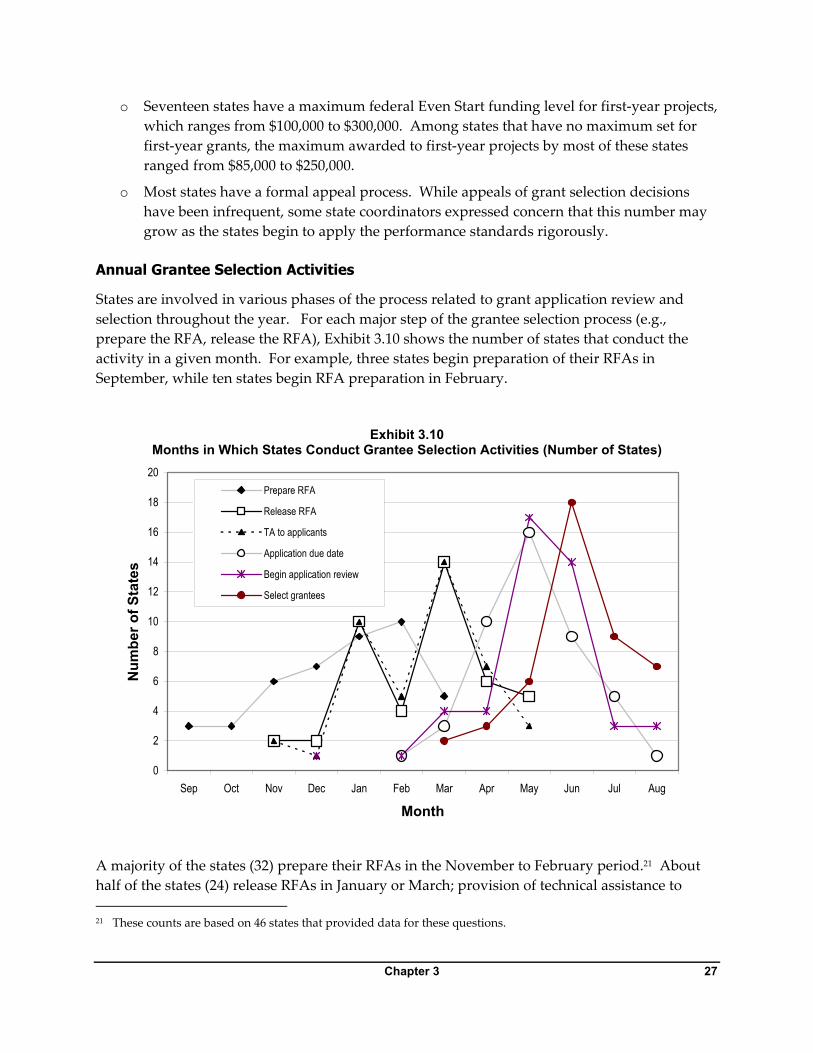
Chapter 3 27
o Seventeen states have a maximum federal Even Start funding level for first-year projects, which ranges from $100,000 to $300,000. Among states that have no maximum set for first-year grants, the maximum awarded to first-year projects by most of these states ranged from $85,000 to $250,000.
o Most states have a formal appeal process. While appeals of grant selection decisions have been infrequent, some state coordinators expressed concern that this number may grow as the states begin to apply the performance standards rigorously.
Annual Grantee Selection Activities
States are involved in various phases of the process related to grant application review and selection throughout the year. For each major step of the grantee selection process (e.g., prepare the RFA, release the RFA), Exhibit 3.10 shows the number of states that conduct the activity in a given month. For example, three states begin preparation of their RFAs in September, while ten states begin RFA preparation in February.
Exhibit 3.10 Months in Which States Conduct Grantee Selection Activities (Number of States)
0
2
4
6
8
10
12
14
16
18
20
Sep Oct Nov Dec Jan Feb Mar Apr May Jun Jul Aug
Month
Num
ber o
f Sta
tes
Prepare RFA
Release RFA
TA to applicants
Application due date
Begin application review
Select grantees
A majority of the states (32) prepare their RFAs in the November to February period.21 About half of the states (24) release RFAs in January or March; provision of technical assistance to 21 These counts are based on 46 states that provided data for these questions.
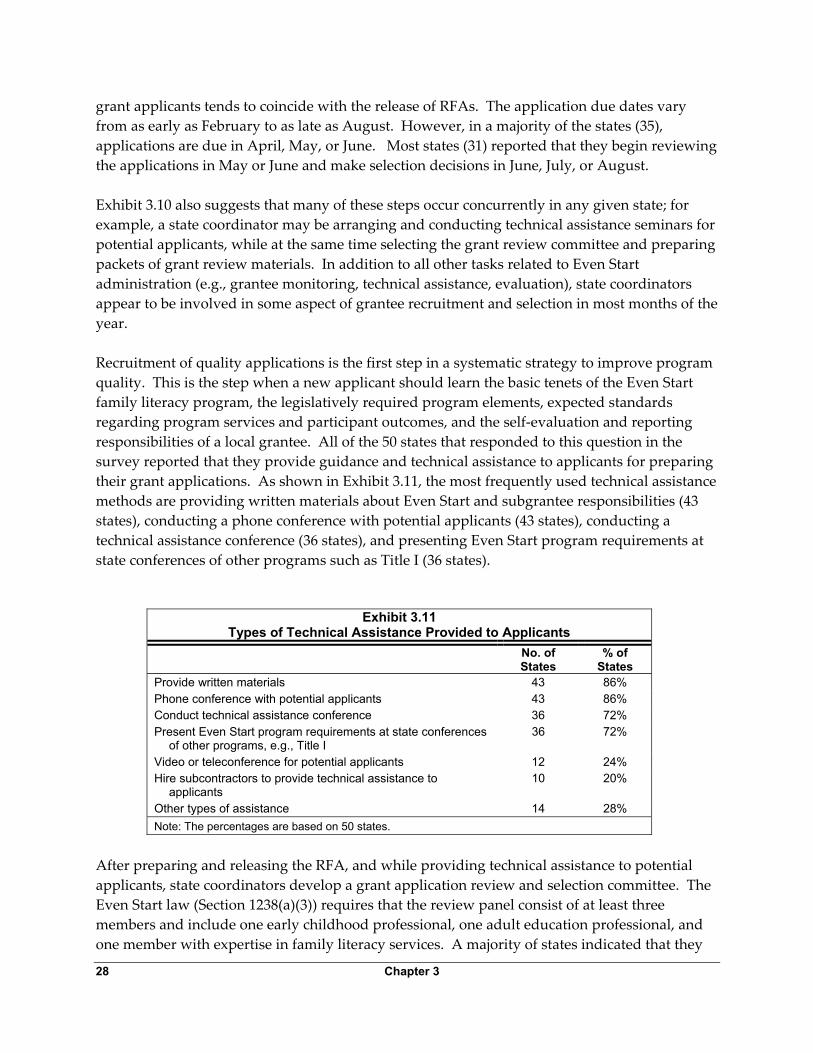
28 Chapter 3
grant applicants tends to coincide with the release of RFAs. The application due dates vary from as early as February to as late as August. However, in a majority of the states (35), applications are due in April, May, or June. Most states (31) reported that they begin reviewing the applications in May or June and make selection decisions in June, July, or August. Exhibit 3.10 also suggests that many of these steps occur concurrently in any given state; for example, a state coordinator may be arranging and conducting technical assistance seminars for potential applicants, while at the same time selecting the grant review committee and preparing packets of grant review materials. In addition to all other tasks related to Even Start administration (e.g., grantee monitoring, technical assistance, evaluation), state coordinators appear to be involved in some aspect of grantee recruitment and selection in most months of the year. Recruitment of quality applications is the first step in a systematic strategy to improve program quality. This is the step when a new applicant should learn the basic tenets of the Even Start family literacy program, the legislatively required program elements, expected standards regarding program services and participant outcomes, and the self-evaluation and reporting responsibilities of a local grantee. All of the 50 states that responded to this question in the survey reported that they provide guidance and technical assistance to applicants for preparing their grant applications. As shown in Exhibit 3.11, the most frequently used technical assistance methods are providing written materials about Even Start and subgrantee responsibilities (43 states), conducting a phone conference with potential applicants (43 states), conducting a technical assistance conference (36 states), and presenting Even Start program requirements at state conferences of other programs such as Title I (36 states).
Exhibit 3.11 Types of Technical Assistance Provided to Applicants
No. of States
% of States
Provide written materials 43 86% Phone conference with potential applicants 43 86% Conduct technical assistance conference 36 72% Present Even Start program requirements at state conferences
of other programs, e.g., Title I 36 72%
Video or teleconference for potential applicants 12 24% Hire subcontractors to provide technical assistance to
applicants 10 20%
Other types of assistance 14 28% Note: The percentages are based on 50 states.
After preparing and releasing the RFA, and while providing technical assistance to potential applicants, state coordinators develop a grant application review and selection committee. The Even Start law (Section 1238(a)(3)) requires that the review panel consist of at least three members and include one early childhood professional, one adult education professional, and one member with expertise in family literacy services. A majority of states indicated that they

Chapter 3 29
have representatives from adult education and early childhood education programs on the review committee (Exhibit 3.12). Not all reporting states specifically indicated these types of committee members. However, consultants, Even Start representatives, and representatives from community organizations or higher education institutions may provide the required types of expertise. Twenty-two states have representatives from state agencies and programs other than adult education, early childhood education, or Title I. Reviewers from these other programs include: grant and budget specialists, staff development specialists; staff from migrant education, family support services, special populations, youth service programs, and the department of human services. Twenty-one states include reviewers from Even Start, e.g., state coordinators from other states and experienced local project directors.
Exhibit 3.12 Reviewers of New Even Start Applications
No. of States
% of States
Adult education/literacy program representative 36 71% Early childhood education program representative 30 59% Representatives of state agencies and programs, other than those listed
separately in this table 22 43%
Even Start representative (e.g., Even Start directors from other states, current subgrantees)
21 41%
Consultants: Literacy or family literacy trainers, organizations 17 33% Title I representative 16 31% Community organizations, higher education institutions 16 31% Head Start representative 13 25% Statewide Family Literacy Initiative representative 10 20% Note: The percentages are based on 51 states that participated in the survey. Each state could indicate up to six responses.
Family literacy consultants and trainers, Title I representatives, and representatives from community organizations and colleges or universities also participate in the grant review committee in 16 to 17 states. Beyond these types of grant reviewers, states tap into many different sources of expertise for the application review committee, depending on the state-specific priorities. Early childhood or adult education consultants, bilingual education consultants, local education agency representatives, educational program development specialists, family and community partnership specialists, and evaluation consultants were each mentioned by fewer than ten states.

30 Chapter 3
A Strategy for Grant Application Quality Improvement
Even with clear, well-organized, and comprehensive RFAs, and timely technical assistance to applicants, ensuring high quality grant applications is a challenge mentioned by a number of state coordinators. One state has implemented a process that provides applicants with ample opportunities to receive a grant, without pinpointing or discouraging weak applicants and without lowering the quality of applications that are funded. In the RFA, the state describes the following grantee selection procedure: First, the state reviews all applications and provides detailed feedback to the applicants. All interested applicants are given three weeks to resubmit a revised application. This step provides all applicants a “second chance” to improve the proposed program plans. Award selections are made based on the second submissions that meet the selection standards. However, if there are unallocated funds remaining, unsuccessful applicants will be given yet another chance to revise the application, based on further comments and suggestions from the review committee. They may then resubmit the application a third time. In this iterative process of feedback-correction-resubmission, some of the originally weaker applications are improved enough to be funded.
Grantee Selection Criteria
Based on the statutory requirements, states develop a set of criteria to use in reviewing applications. Consistent with the Even Start statute, all states require that applicants describe how they will implement all legislatively required program elements. Further, the Even Start statute specifies that states give priority to applications that target areas of the state with high numbers of most-in-need families or that will be located in empowerment zones or enterprise communities. Based on survey responses22 from 51 states, 38 states assign competitive weight or priority points to applicants’ specific program characteristics or plans.23 These states listed indices of high need for a family literacy program in the applicant’s community that receive priority points, such as: high rates of poverty, unemployment, homelessness, TANF receipt, free-lunch; Empowerment Zone-Enterprise Community; Title I school, priority school district; high rate of illiteracy, and low English proficiency (Exhibit 3.13). Consistent with the Even Start statute, both poverty and need for literacy education are addressed in these priority points. However, more states prioritize poverty indicators than high rates of illiteracy or low English proficiency. 22 Information reported in this section is based on responses to two survey questions: 1) Does your state assign
competitive weight or priority points to subgrant applications based on certain selection criteria? (Response = Yes or No.) 2) Describe up to five factors that place competitive weight or priority points to a grant application in the order of importance. (Response = open-ended, brief written answers.)
23 The survey data cannot clarify whether 13 states that indicated not using priority points interpreted the survey question to be asking for priority factors beyond those specified in the law.

Chapter 3 31
Some states also assign priority points to specific program characteristics. The most common among these are: a proposed program design’s likelihood of success and strategies for meeting service goals; plans for interagency coordination and collaboration; program budget, fiscal plans; staffing plan, staff qualifications; and plans for complying with program requirements (Exhibit 3.13). Fewer states listed priority points for the quality and intensity of instructional services to be offered to participating families (six states), and for plans for recruiting and retaining families (five states). One state indicated that priority points are given to grant applications that propose a research-based program design.
Exhibit 3.13 Priority Points Used in Subgrant Review and Screening
No. of States
% of States
Need indicators Indicators of high need for a family literacy program 19 37% High rates of poverty, unemployment, homelessness, TANF receipt, free-lunch 11 22% Empowerment Zone/Enterprise Community 11 22% Located in Title I school, priority school district, high high-school dropout rate 7 14% High rate of illiteracy, low English proficiency 4 8% High rate of social and family problems (e.g., domestic violence, teen
pregnancy) 3 6%
Unavailability of other family literacy services in the area 3 6% Program characteristics Promise as a model, likelihood of success, strategies for meeting service
goals 15 29%
Plans for interagency coordination and collaboration 12 24% Program budget, fiscal plans 9 18% Staffing plan, staff qualifications 7 14% Plans for complying with program requirements; implementation plans 7 14% Quality/intensity of instructional services to be offered 6 12% For continuation grants: high recruitment/retention rates, participant
outcomes, good performance indicators, positive evaluation results 5 10%
Plans for recruiting and retaining families 2 4% Research findings incorporated in the proposal and program plans 1 2% Note: The percentages are based on 51 states. Each state could indicate up to five responses.
State coordinators were asked whether the states target federal Even Start funds to projects that implement certain family literacy models or approaches or to projects that serve a certain population. None of the states responded that a specific program model is targeted for funding. Eleven states replied that they direct funds to projects serving a particular target population. In most of these cases, the populations targeted are those specified by Even Start legislation (e.g., low-income families and adults with limited basic or literacy skills). Migrant families, tribal families, and English-language-learner families are targeted by one state each. One state coordinator reported targeting areas of the state currently not served by state or federal family literacy programs and also targeting schools in school improvement status.

32 Chapter 3
Applications for Continuation Funding
States were asked whether “the process or schedule of application review differ for new vs. continuing applications.” Nearly half of the states (23) use the same schedule and procedure for reviewing new and continuation applications. Of the other 27 states that provided data, the only difference reported by 10 states between the review of new and continuation applications was the schedule of review and funding activities. Eight states reported that continuing grantees are required to include data, recent local evaluation reports, or other evidence of achieving performance standards and program improvement. This does not necessarily mean that more than 40 states do not review data-based evidence of program improvement, because the survey question did not specifically ask this question. It is also possible that more states began to review continuing grantees’ evidence for program improvement since the implementation of the performance indicator systems. In one state the application review includes results of a monitoring site visit by the state coordinator. Six states use different reviewers: new applications receive review and approval by a formal, external application review committee or board, while continuation applications are reviewed by the state coordinator and other state program staff. Two states explained that continuation application review is not as formal, detailed, and lengthy as the new application review.
Grantee Selection and Funding Decisions in Response to the 2001-02 Funding Increase
Because of the $100 million increase in the federal Even Start allocation, the states’ Even Start grants also increased in 2001-02. In the state survey, which was conducted about six months after states received substantially larger grants, we asked how the states decided on the number of subgrants to award and the funding levels for these subgrants in the context of the large federal funding increase. Most of the responses to these questions suggested that the increased funding did not cause major changes in how awards were made. Most states reported that they did not alter their procedures for awarding subgrants, even though they may have made more awards or increased the amount of some subgrants. Twenty-five states determined the number of grants to award based on “availability of funds,” accounting for factors such as the minimum required funding level, availability of funds after all continuation applications were funded, and availability of funds after raising the amounts given to previously under-funded projects (Exhibit 3.14).
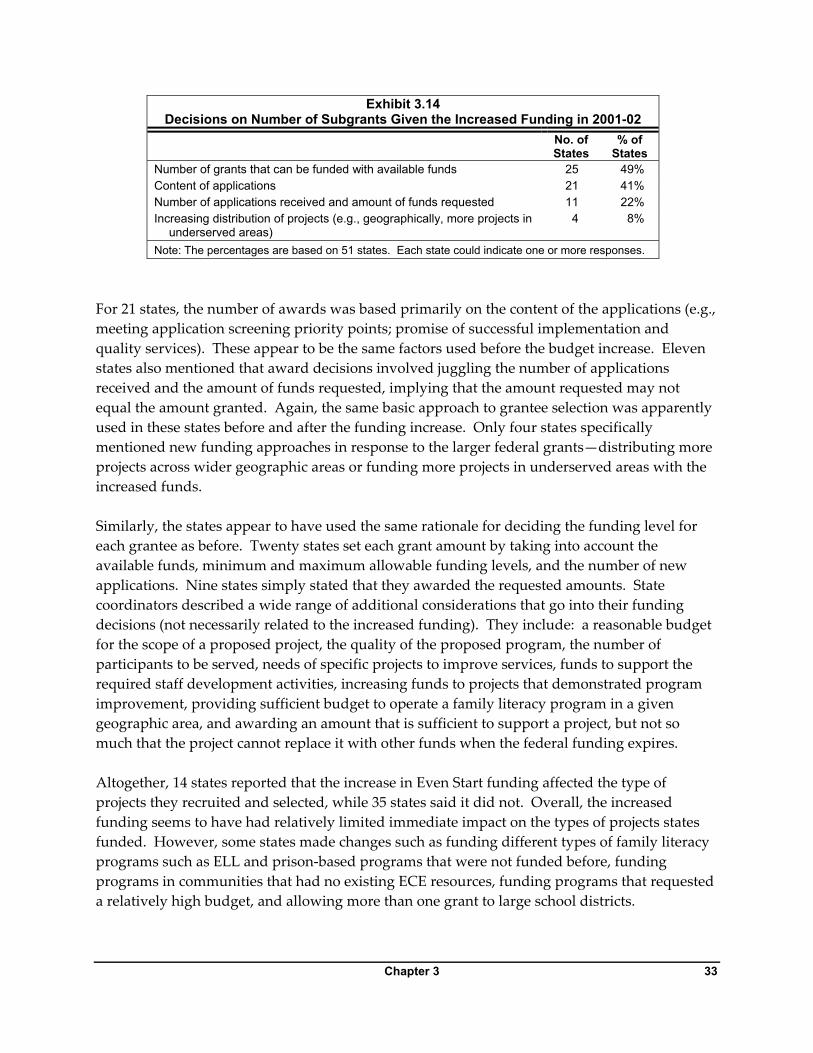
Chapter 3 33
Exhibit 3.14 Decisions on Number of Subgrants Given the Increased Funding in 2001-02
No. of States
% of States
Number of grants that can be funded with available funds 25 49% Content of applications 21 41% Number of applications received and amount of funds requested 11 22% Increasing distribution of projects (e.g., geographically, more projects in
underserved areas) 4 8%
Note: The percentages are based on 51 states. Each state could indicate one or more responses.
For 21 states, the number of awards was based primarily on the content of the applications (e.g., meeting application screening priority points; promise of successful implementation and quality services). These appear to be the same factors used before the budget increase. Eleven states also mentioned that award decisions involved juggling the number of applications received and the amount of funds requested, implying that the amount requested may not equal the amount granted. Again, the same basic approach to grantee selection was apparently used in these states before and after the funding increase. Only four states specifically mentioned new funding approaches in response to the larger federal grants—distributing more projects across wider geographic areas or funding more projects in underserved areas with the increased funds. Similarly, the states appear to have used the same rationale for deciding the funding level for each grantee as before. Twenty states set each grant amount by taking into account the available funds, minimum and maximum allowable funding levels, and the number of new applications. Nine states simply stated that they awarded the requested amounts. State coordinators described a wide range of additional considerations that go into their funding decisions (not necessarily related to the increased funding). They include: a reasonable budget for the scope of a proposed project, the quality of the proposed program, the number of participants to be served, needs of specific projects to improve services, funds to support the required staff development activities, increasing funds to projects that demonstrated program improvement, providing sufficient budget to operate a family literacy program in a given geographic area, and awarding an amount that is sufficient to support a project, but not so much that the project cannot replace it with other funds when the federal funding expires. Altogether, 14 states reported that the increase in Even Start funding affected the type of projects they recruited and selected, while 35 states said it did not. Overall, the increased funding seems to have had relatively limited immediate impact on the types of projects states funded. However, some states made changes such as funding different types of family literacy programs such as ELL and prison-based programs that were not funded before, funding programs in communities that had no existing ECE resources, funding programs that requested a relatively high budget, and allowing more than one grant to large school districts.
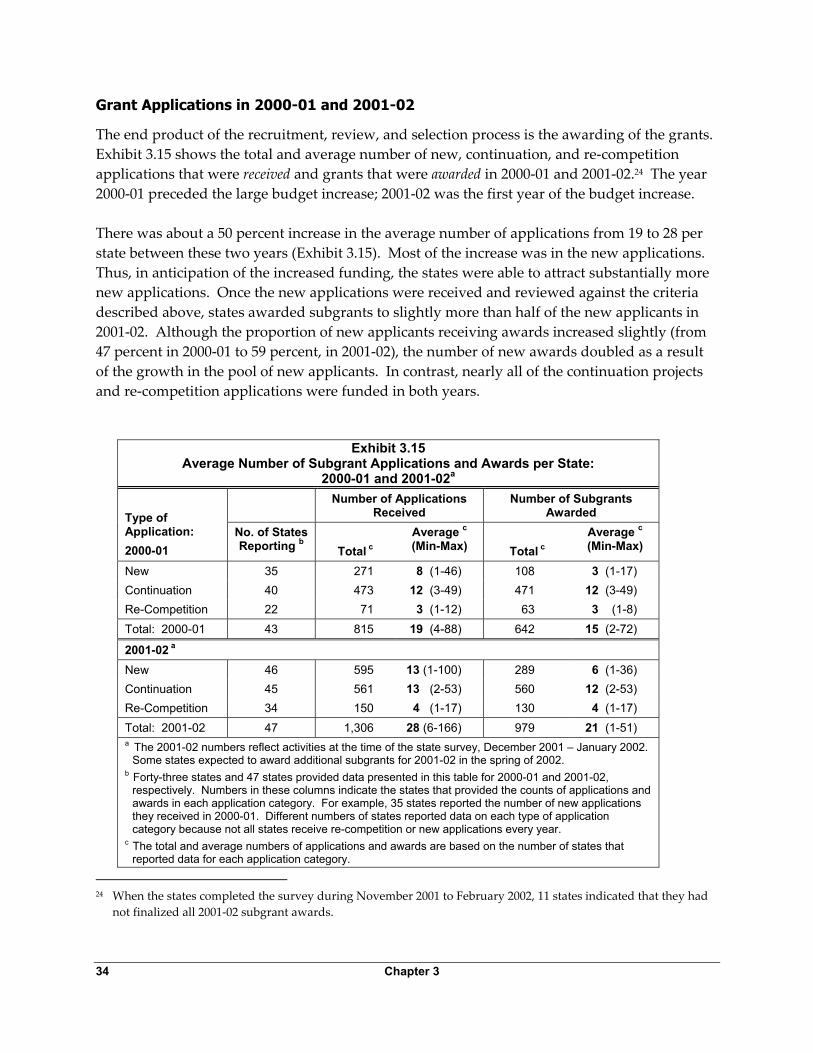
34 Chapter 3
Grant Applications in 2000-01 and 2001-02
The end product of the recruitment, review, and selection process is the awarding of the grants. Exhibit 3.15 shows the total and average number of new, continuation, and re-competition applications that were received and grants that were awarded in 2000-01 and 2001-02.24 The year 2000-01 preceded the large budget increase; 2001-02 was the first year of the budget increase. There was about a 50 percent increase in the average number of applications from 19 to 28 per state between these two years (Exhibit 3.15). Most of the increase was in the new applications. Thus, in anticipation of the increased funding, the states were able to attract substantially more new applications. Once the new applications were received and reviewed against the criteria described above, states awarded subgrants to slightly more than half of the new applicants in 2001-02. Although the proportion of new applicants receiving awards increased slightly (from 47 percent in 2000-01 to 59 percent, in 2001-02), the number of new awards doubled as a result of the growth in the pool of new applicants. In contrast, nearly all of the continuation projects and re-competition applications were funded in both years.
Exhibit 3.15 Average Number of Subgrant Applications and Awards per State:
2000-01 and 2001-02a Number of Applications
Received Number of Subgrants
Awarded Type of Application: 2000-01
No. of States Reporting b
Total c
Average c (Min-Max)
Total c
Average c (Min-Max)
New 35 271 8 (1-46) 108 3 (1-17) Continuation 40 473 12 (3-49) 471 12 (3-49) Re-Competition 22 71 3 (1-12) 63 3 (1-8) Total: 2000-01 43 815 19 (4-88) 642 15 (2-72)
2001-02 a New 46 595 13 (1-100) 289 6 (1-36) Continuation 45 561 13 (2-53) 560 12 (2-53) Re-Competition 34 150 4 (1-17) 130 4 (1-17) Total: 2001-02 47 1,306 28 (6-166) 979 21 (1-51) a The 2001-02 numbers reflect activities at the time of the state survey, December 2001 – January 2002.
Some states expected to award additional subgrants for 2001-02 in the spring of 2002. b Forty-three states and 47 states provided data presented in this table for 2000-01 and 2001-02,
respectively. Numbers in these columns indicate the states that provided the counts of applications and awards in each application category. For example, 35 states reported the number of new applications they received in 2000-01. Different numbers of states reported data on each type of application category because not all states receive re-competition or new applications every year.
c The total and average numbers of applications and awards are based on the number of states that reported data for each application category.
24 When the states completed the survey during November 2001 to February 2002, 11 states indicated that they had
not finalized all 2001-02 subgrant awards.

Chapter 3 35
The minimum and maximum numbers (in parentheses in Exhibit 3.15) show a very wide range in the number of applications received and awarded by the states, reflecting the large differences in the number of projects administered by states. Exhibit 3.16 presents a breakdown of awards by small, medium, and large states (nine or fewer, 10-24, and 25 or more projects, respectively), combining new, continuing, and re-competing projects. The number of applications increased in 2001-02, especially in medium and large states. All states, regardless of size, awarded fewer grants than the number of applications received. However, a large difference is evident between large and small states in the number of applications processed. The majority of the states generally have only one to two FTEs (Exhibit 3.1), thus, providing a thorough review and processing of grant applications (including technical assistance to applicants) could amount to a major, resource-intensive task in the larger states.
Exhibit 3.16 Average Number of Applications Received and Grants Awarded:
2000-01 and 2001-02 by Size of State (Fall 2001) 2000-01 2001-02 n Received Awarded Received Awarded
Small states (4-9 projects) 14 8 7 9 7 Medium states (10-24 projects) 21 16 12 22 16 Large states (25-102 projects) 12 41 33 61 45 Note: The numbers include new, continuation, and re-competition applications and grants.
Funding Levels
State coordinators were asked to describe the guidelines they use in deciding the amount of each grant. Seventeen states have a maximum federal Even Start funding level for first-year projects, which ranges from $100,000 to $300,000, averaging $191,177. Thirty-three states have no maximum level for first-year grants. For most of these states, the grants start at $75,000 or higher; the maximum awarded to first-year projects by most (89 percent) of these states ranged widely, from $85,000 to $250,000.25 Only six states have a maximum total funding limit for funds provided across all continuation years to a project. And, the total funding limits covering all years of multiyear grants also vary greatly, ranging from $115,000 to $1 million per project among these six states.
Length of Subgrants
In contrast to the variations in funding and other procedures, the states show considerable similarity in the length of Even Start subgrants. Forty-six states reported that they had awarded a total of 289 new grants in 2001-02.26 Almost 70 percent of these grants were four-year grants; 25 percent were one-year grants. A few exceptions were reported: three-year grants in two states and two-year grants in two states. Thirty-two states had projects operating beyond eight 25 The general statutory minimum (Section 1233(b)(2)) for a subgrant is $75,000. 26 When the survey was conducted in November 2001 to February 2002, some states indicated that they will award
additional subgrants for 2001-02 in the spring of 2002.
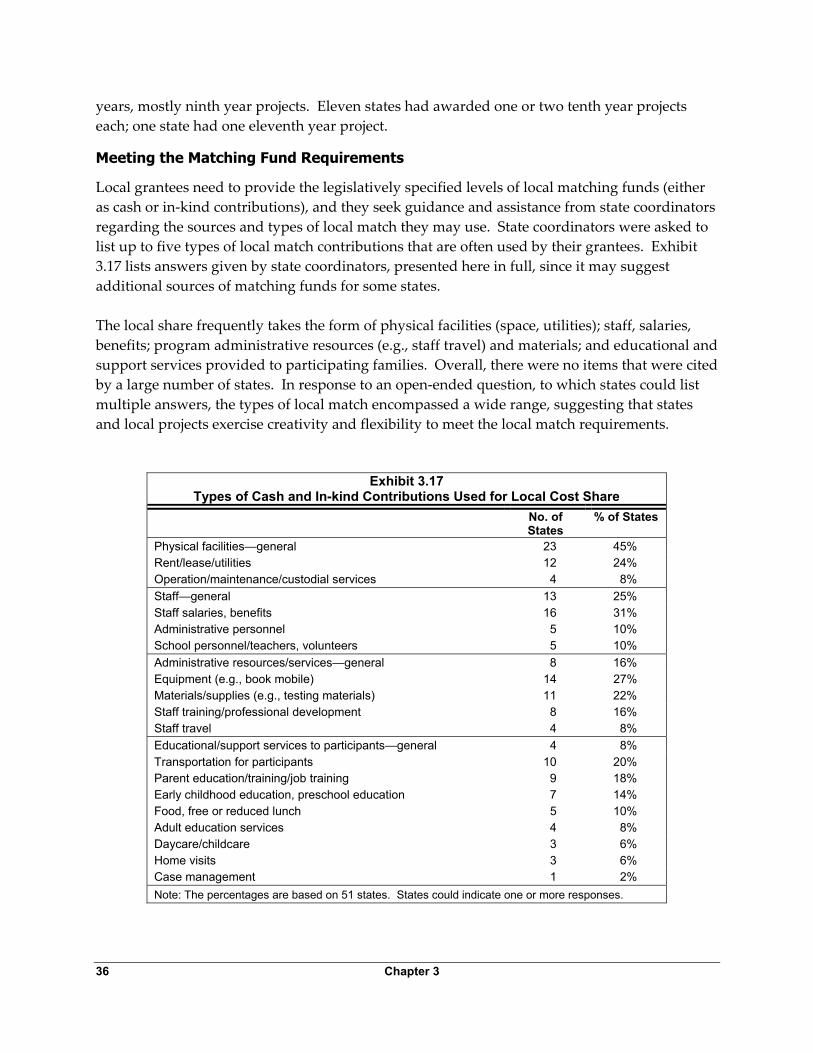
36 Chapter 3
years, mostly ninth year projects. Eleven states had awarded one or two tenth year projects each; one state had one eleventh year project.
Meeting the Matching Fund Requirements
Local grantees need to provide the legislatively specified levels of local matching funds (either as cash or in-kind contributions), and they seek guidance and assistance from state coordinators regarding the sources and types of local match they may use. State coordinators were asked to list up to five types of local match contributions that are often used by their grantees. Exhibit 3.17 lists answers given by state coordinators, presented here in full, since it may suggest additional sources of matching funds for some states. The local share frequently takes the form of physical facilities (space, utilities); staff, salaries, benefits; program administrative resources (e.g., staff travel) and materials; and educational and support services provided to participating families. Overall, there were no items that were cited by a large number of states. In response to an open-ended question, to which states could list multiple answers, the types of local match encompassed a wide range, suggesting that states and local projects exercise creativity and flexibility to meet the local match requirements.
Exhibit 3.17 Types of Cash and In-kind Contributions Used for Local Cost Share
No. of States
% of States
Physical facilities—general 23 45% Rent/lease/utilities 12 24% Operation/maintenance/custodial services 4 8% Staff—general 13 25% Staff salaries, benefits 16 31% Administrative personnel 5 10% School personnel/teachers, volunteers 5 10% Administrative resources/services—general 8 16% Equipment (e.g., book mobile) 14 27% Materials/supplies (e.g., testing materials) 11 22% Staff training/professional development 8 16% Staff travel 4 8% Educational/support services to participants—general 4 8% Transportation for participants 10 20% Parent education/training/job training 9 18% Early childhood education, preschool education 7 14% Food, free or reduced lunch 5 10% Adult education services 4 8% Daycare/childcare 3 6% Home visits 3 6% Case management 1 2% Note: The percentages are based on 51 states. States could indicate one or more responses.

Chapter 3 37
Requests for a waiver or adjustment of the matching requirements by local projects are fairly rare. Only four states received such requests in 2001-02. One state received four requests; two states received one request each; and the fourth state did not indicate how many waiver requests it received. All requests were granted.
Denial of Continuation Funding Due to Insufficient Progress
The key element in reviewing continuation applications is assessing how much progress has been made by projects in program implementation and participant outcomes. In the two years from 2000 to 2002, most continuation applications were funded. However, 20 states reported that they had ever denied continuation funding to projects because of insufficient progress since the beginning of Even Start. The primary reasons for denying funding were insufficient program management and implementation progress (17 states), low recruitment and enrollment rates (14 states), and low quality and intensity of educational services (11 states) (Exhibit 3.18). In a few cases, continuation funds were denied because of high dropout rates, weak data on educational and economic outcomes of participants, and high program cost per family. Other reasons that four state coordinators described were fiscal concerns, providing only early childhood services, lack of progress after receiving one year of intensive technical assistance and recommendations, and poor fiscal and administrative management due to frequent coordinator turnover. It should be noted that only a few states denied continuation funding on the basis of participant outcome data. As part of the performance indicator requirement, all states must now use outcome data as the basis of continuation funding decisions, which will be a new challenge for many states and projects.
Exhibit 3.18 Reasons for Denial of Continuation Funding Due to Insufficient Progress
No. of States
% of States
Insufficient program management and implementation progress 17 85% Low recruitment/enrollment rates 14 70% Low quality/intensity of educational services 11 55% High dropout rate 6 30% Weak data on educational and economic outcomes of participants
(e.g., legislatively required performance indicators) 6 30%
High program cost per family 5 25% Other reasons for non-renewal of federal funding 4 20% Note: The percentages are based on 20 states that indicated that they have denied funding to a local project because of insufficient progress.
Voluntary Termination of Even Start Subgrant by Local Projects
Voluntary termination occurs only rarely, but 13 states had experienced at least one instance in which a project voluntarily declined continuation funding. In most of these states (10 out of 13),
38 Chapter 3
there had been only one such case. The largest number of cases reported was three in one state during the last seven years. The specific reasons for voluntary termination tended to be unique in each case, but many appear to stem from the inability or unwillingness of grantees to meet some aspects of the Even Start program requirement. Examples of reasons reported by state coordinators are: the Even Start coordinator retired; the Even Start local partnership dissolved or the partners were incompatible; weak collaboration led to turf issues and undermined the work of Even Start staff; inadequate program management led to low enrollment and poor program quality; a project was unable to meet its local match requirement; a project was unwilling to satisfy required program elements and be monitored; the challenges of implementing the integrated four-component model (staffing, planning time, paperwork, etc.); and a lack of support from superintendent or school board.
Appeal Process
Even Start appeal rights are established and governed by federal statute (Section 432 of the General Education Provisions Act (GEPA), and Section 1238(b)(4) of the Even Start law) and regulation (Sections 76.783 and 76.401(d)(3) of EDGAR). Grant applicants that are not funded, including applicants denied continuation funds, may appeal the denial decision if they allege a violation of state or federal law, rules, regulations, or guidelines governing the Even Start program. States may follow their own formal or informal appeal procedures, so long as those procedures are not inconsistent with the federal requirements. If an SEA disapproves an applicant’s Even Start application (either new or continuation), the SEA must provide applicants who wish to appeal that SEA decision an opportunity for a hearing either before or after the SEA’s disapproval of the application. Applicants that wish to appeal the SEA’s decision, and the SEA, must follow the deadlines and other requirements established by federal regulation (34 CFR §76.401(d)(2)) concerning the appeal, including providing an “on the record” hearing.27 In addition, if an SEA decides not to award continuation subgrant funds to a project based on the SEA’s determination under the state’s indicators of program quality that the project’s performance has failed to improve sufficiently, the SEA must provide technical assistance and notice and opportunity for a hearing before terminating the subgrant. 27 Applicants must request a state hearing within 30 days of the state education agency’s action disapproving their
application. Within 30 days after a state receives a request, the SEA must hold a hearing “on the record” to review its action. Within 10 days after the hearing, the agency must issue its written ruling, including findings of fact, and reasons for the ruling. If the SEA determines that its action was contrary to state or federal statutes or regulations that govern the applicable program, the SEA must rescind its action. If the SEA does not rescind its final action following its review, the applicant may appeal to the secretary of the U.S. Department of Education, following strict regulatory deadlines. The secretary may issue interim orders to the SEA that are necessary and appropriate pending that federal-level appeal or review, and may issue an order either upholding the SEA’s determination, or requiring the SEA to take appropriate action if the secretary determines that the action of the SEA was contrary to federal statute or regulations that govern the Even Start program. (34 CFR §76.401(d)(2) – (8)).

Chapter 3 39
In the state survey, 33 states reported having a formal appeal process. Generally, the appeal processes described in the survey involve the applicant’s asking the state to re-review the grant application and, in most cases, receiving a re-review or a hearing by appropriate state officials, who make the state’s final decision. In general, state coordinators indicated that appeals from unfunded Even Start applicants have not been a major problem. Since the program year 1998-1999, eight states have received appeals of grant decisions. Four states had one or two appeals in four years; one state (with a large number of projects) had 14 appeals in the four years. 28 While appeals have been infrequent, some state coordinators expressed concern that this number may grow as the states begin to apply the performance standards rigorously and uniformly for continuation funding. With the performance indicators, more projects may be identified as poor performers, leading to more terminations of continuing projects, if the projects fail to improve after receiving intensive technical assistance from the state office. Continuing to provide clear guidelines regarding the appeal process, therefore, appears likely to be important, especially in states that have no prior experience with this process.
Provision of Programmatic Guidance and Technical Assistance
Summary of Key Findings
In the early years of Even Start, the federal Even Start office and its technical assistance (TA) contractors were the main providers of guidance to local projects on basic program design and approach, such as the required elements of the Even Start program and how to implement the program through interagency collaboration and service component integration. As the number of projects increased and the states gained more experience in directing the programmatic content of Even Start services, state coordinators began to assume greater responsibility for providing technical assistance to local projects. Now, this is one of the key leadership and management functions of the state Even Start office.
o Almost all states provide technical assistance to applicants in the preparation of grant applications and provide workshops or training sessions for local projects. Many states have produced and disseminated printed materials that contain guidance and instructions on Even Start program implementation and service delivery.
o Frequent topics for technical assistance meetings and workshops are: information regarding grant application, new grantee orientation, performance indicators, assessment tools and standards, state and local evaluations, data collection and use, software, Web, and database use, and program administration in general.
28 Three states did not indicate the number of appeals they had received.
40 Chapter 3
o Some states use formal means to identify local projects’ technical assistance needs such as a needs assessment survey, focus groups of local project staff, and a systematic review of local evaluation reports. Other states use less formal ways to identify the needs, such as personal communications with local project staff through listservs, e-mail, telephone calls, meetings, and on-site visits.
Technical Assistance Method, Frequency, and Target Audience
Virtually all states said that they provide technical assistance meetings or training sessions for local projects.29 More than half of the states (28) have disseminated printed materials produced by the states and containing guidance and instructions on Even Start program implementation and service delivery. As discussed earlier, all states provide technical assistance to grant applicants in the preparation of grant applications. State coordinators who were interviewed also mentioned wide use of materials produced and disseminated by the federal Even Start office (e.g., the Guide to Quality: Even Start Family Literacy Program: Implementation and Continuous Improvement (Dwyer, 2001)). Thus, across the board, the states have established some processes for assisting local projects with program development and improvement. In response to an open-ended question regarding the format of technical assistance, 33 states used the generic term “training workshops” (Exhibit 3.19). These may be stand-alone workshops arranged only for the purpose of training on specific topics (e.g., data entry training, training on administering assessment tests) or they may be one of the sessions at statewide institutes or regional conferences. Twenty-three coordinators mentioned formats such as institutes, conferences, seminars, and retreats; 22 coordinators reported project director meetings; 12 coordinators specified regional or statewide meetings. Technical assistance is also provided during on-site visits to local projects by state staff and through telephone and video conferences. As expected, the intended audience for the states’ technical assistance is the local project staff. But in addition to the local project directors, other groups that receive technical assistance include: co-applicants of new and continuing grant applications (33 states), data entry personnel (23 states), and program participants or parents (11 states). The frequency of technical assistance meetings and workshops vary with the meeting format. However, most commonly, meetings were held annually or three to four times a year. It was rare for technical assistance meetings to be provided more often. These meetings and workshops are conducted by a wide range of people. Thirty-six states listed different types of Even Start staff including state Even Start personnel and model or mentor project staff. Thirty-two states also mentioned staff from state and local non-Even Start agencies such as collaborating partners, SFLI staff, and other programs in the state department of education. In 29 One state that had just hired a new coordinator indicated that such meetings will be started in the near future.
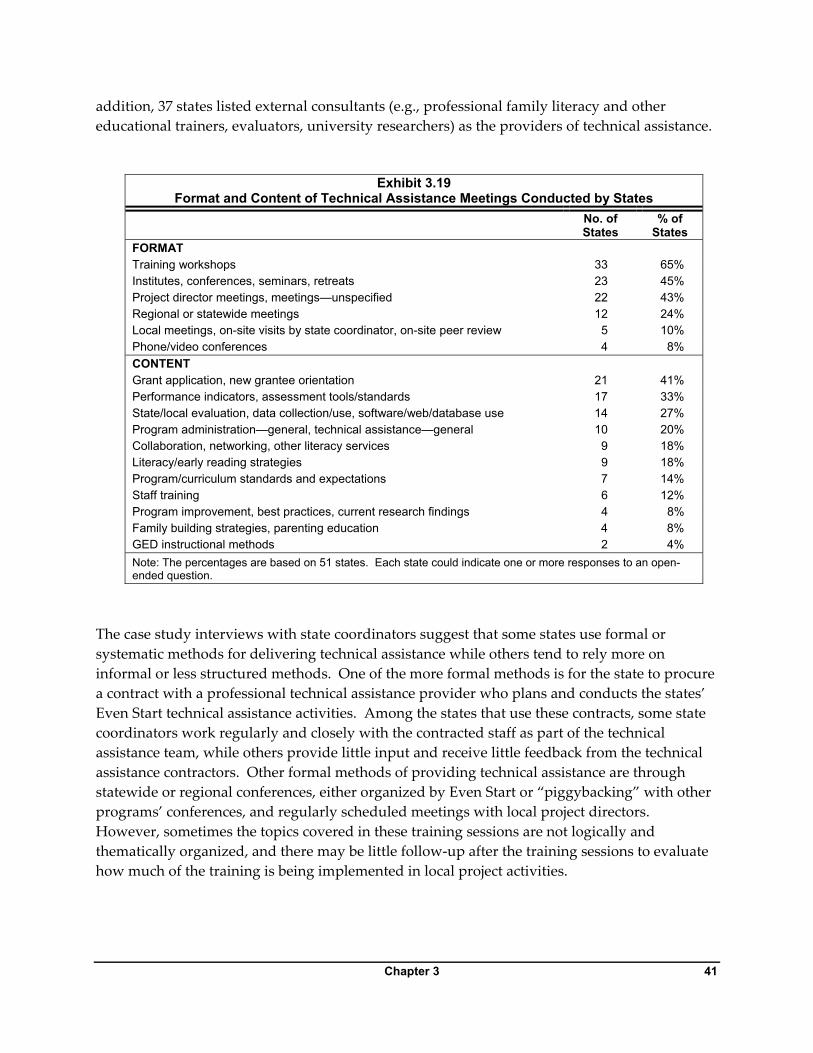
Chapter 3 41
addition, 37 states listed external consultants (e.g., professional family literacy and other educational trainers, evaluators, university researchers) as the providers of technical assistance.
Exhibit 3.19 Format and Content of Technical Assistance Meetings Conducted by States
No. of States
% of States
FORMAT Training workshops 33 65% Institutes, conferences, seminars, retreats 23 45% Project director meetings, meetings—unspecified 22 43% Regional or statewide meetings 12 24% Local meetings, on-site visits by state coordinator, on-site peer review 5 10% Phone/video conferences 4 8% CONTENT Grant application, new grantee orientation 21 41% Performance indicators, assessment tools/standards 17 33% State/local evaluation, data collection/use, software/web/database use 14 27% Program administration—general, technical assistance—general 10 20% Collaboration, networking, other literacy services 9 18% Literacy/early reading strategies 9 18% Program/curriculum standards and expectations 7 14% Staff training 6 12% Program improvement, best practices, current research findings 4 8% Family building strategies, parenting education 4 8% GED instructional methods 2 4% Note: The percentages are based on 51 states. Each state could indicate one or more responses to an open-ended question.
The case study interviews with state coordinators suggest that some states use formal or systematic methods for delivering technical assistance while others tend to rely more on informal or less structured methods. One of the more formal methods is for the state to procure a contract with a professional technical assistance provider who plans and conducts the states’ Even Start technical assistance activities. Among the states that use these contracts, some state coordinators work regularly and closely with the contracted staff as part of the technical assistance team, while others provide little input and receive little feedback from the technical assistance contractors. Other formal methods of providing technical assistance are through statewide or regional conferences, either organized by Even Start or “piggybacking” with other programs’ conferences, and regularly scheduled meetings with local project directors. However, sometimes the topics covered in these training sessions are not logically and thematically organized, and there may be little follow-up after the training sessions to evaluate how much of the training is being implemented in local project activities.

42 Chapter 3
A Strategy for Systematic Staff Development In an effort to provide a systematic approach to Even Start staff development that would have a substantive impact on program quality and improved participant outcomes, one state developed an extensive technical assistance system that focused specifically on evaluation and accountability. In 2001, the state’s Even Start coordinator contracted with a university-level team of technical assistance professionals with expertise in the fields of early childhood education, adult education, parenting, and evaluation to launch a three-year statewide program improvement effort. The TA providers met regularly with local Even Start staff in first developing the indicators of program quality, assuring that all staff had a voice in setting standards and a sense of ownership in implementing and evaluating the standards. Following each of these sessions, the TA providers conducted follow-up visits to local projects and provided additional customized training as needed. This intensive, interactive, and inclusive approach was used at all stages of the project as the staff developed data collection procedures, developed the state’s computerized management information (MIS) system, and used the data and findings to redesign and enhance local Even Start projects. In addition to this seamless approach to providing technical assistance, the TA providers also conducted focus groups with all the Even Start and state-funded family literacy project staff and collaborators, such as Head Start. During these sessions, staff shared best practice pieces and identified instructional training that could be provided during the yearly family literacy conference, sponsored by the state’s technical assistance team. As part of this contract, the TA providers also manage two listservs, one for family literacy program staff and the other for trainers, evaluators, and other providers of technical assistance. This online strategy has proven to be an excellent tool for sharing and communicating best practices, providing feedback, and gathering information on program and staff needs. This system of comprehensive technical assistance has resulted in a shared understanding among the state and local staff of the expected participant and program outcomes and methods to reach success in family literacy programs across the state.
Content of Technical Assistance Activities
As shown in Exhibit 3.19, common topics for technical assistance meetings and workshops were: information regarding grant application, new grantee orientation (21 states); performance indicators, assessment tools or standards (17 states); state and local evaluation, data collection and use, software, Web, and database use (14 states); program administration in general (10 states); collaboration, networking, and information on other existing literacy services (9 states); and program or curriculum standards and expectations (7 states). Several state coordinators described providing workshops focused on instructional content and methods, such as literacy instruction and early reading strategies (9 states), family building strategies and parenting education (4 states), and GED instructional methods (2 states). It should be noted that these counts are based on answers that state coordinators wrote in response to an open-ended question. Thus, the fact that only 21 coordinators specifically mentioned assistance to grant applicants does not mean that the rest of the states do not provide

Chapter 3 43
this type of assistance. This caveat notwithstanding, only a few states cited staff development and program improvement strategies as specific topics of technical assistance meetings. The 28 states that have produced printed technical assistance materials described the content of these materials. Frequently, these materials provide a general description and guidance on Even Start program design and approach, information on instructional materials, how to develop collaborative partnerships, improve recruitment and retention, and improve staff qualifications (Exhibit 3.20). The printed materials also refer to state performance indicators, state and local evaluations, and state compliance review. Some states provide printed materials dealing with management of Even Start budget and fiscal issues.
Exhibit 3.20 Topics and Issues Included in Technical Assistance Documents Printed by States
No. of States
% of States
Program design/development/improvement—general 7 14% Even Start and family literacy approach, family literacy program
implementation guide, U.S. Dept. of Education program guides 12 24%
Instructional materials and methods 9 18% Developing collaborative partnerships 5 10% Improving recruitment and retention 4 8% Professional development: workshops, materials, credentialing information 4 8% Integrating service components 3 6% Program evaluation/monitoring information—general 8 16% State performance indicator information 10 20% State evaluation information 7 14% Local evaluation guidelines, materials 4 8% State monitoring, compliance review information 4 8% Family literacy research/data 3 6% Financial and program management information 6 12% Even Start law, regulations, program responsibilities, matching requirements,
participant eligibility 6 12%
Budgeting, fiscal management 5 10% Sources of useful information (state, local, Internet, etc.) 4 8% Record keeping, management information systems, family intake forms 3 6% Marketing information 2 4% Note: The percentages are based on 51 states. Each state could indicate one or more responses to an open-ended question.
When specifically asked whether the states provide technical assistance to local projects on how to meet their matching fund requirement, 48 states answered affirmatively. Assistance regarding matching funds is provided mostly through telephone calls and e-mails to individual projects (22 states) or in training workshops and meetings (20 states). The types of contribution projects count as local match were described in the earlier section of this report (Exhibit 3.17).

44 Chapter 3
Subgrantee Performance Monitoring
Summary of Key Findings
Once subgrants are awarded, provision of technical assistance and monitoring of local projects’ program implementation and participant outcomes becomes an ongoing responsibility of state coordinators.
o On-site visits are the most commonly used method of monitoring local projects’ program operations. Most of the states conduct on-site visits to each project once a year or less often, while 10 states schedule several visits per year to each project.
o One of the challenges for some states and local projects is meeting the staff qualification requirements being phased in under the reauthorized law.
o Forty states have established professional credential requirements for Even Start adult education teachers, although adult education certification program exists in only 15 states. For early childhood education teachers, 26 states had established credential requirements.
Methods of Performance Monitoring
The most prevalent method of monitoring is on-site visits (46 states); followed by phone calls, e-mails, video conferences (15 states); and review of reports such as local evaluation reports, self-assessment checklists completed by local projects, and performance indicator reports (15 states) (Exhibit 3.21).30
Exhibit 3.21 Types of Monitoring Activities States Conduct
No. of States
% of States
On-site visits 46 90% Phone calls, video conference, emails 15 29% Reports, data collection systems, self-monitoring checklists, performance
indicator reports, local evaluation reports 15 29%
Information obtained from other programs/agencies (e.g., Title I site visits) 2 4% Statewide conferences, regional meetings 2 4% Note: The percentages are based on 51 states. Data are based on responses to an open-ended question. Each state could be coded with one or more responses.
30 The state survey was conducted in November 2001 to February 2002, before most states began to collect the
performance indicator reports.

Chapter 3 45
Most of the site visits (39 states) are conducted by the state coordinator or his or her representative from the state Even Start office, although staff from other state agencies or programs (e.g., SFLI and Title I) or external consultants also conduct site visits to local projects (13 states indicated each of these answers). Of the 46 states that conduct on-site visits to monitor local projects, six states reported that local project directors (e.g., veteran directors, regional coordinators, mentoring teams) are involved in these visits. State coordinators or other state Even Start staff do most of the monitoring that is conducted by telephone, e-mail, video conference, and reports submitted by local projects. However, in five states, external consultants assist the state coordinators with the review of local project reports. The frequency of monitoring activities depends on the type of activity. Of the 46 states that reported conducting on-site visits, 36 states schedule a visit to each project once a year or less often, while 10 states schedule several visits per year to each project. Most of the 15 states that monitor project performance by reviewing their reports collect these reports annually. For each type of monitoring activity, state coordinators listed the types of issues they examine or address. During on-site visits, 34 and 33 states, respectively, focus on compliance and program implementation (Exhibit 3.22). Thirty states indicated that they monitor the quality and intensity of instructional services during site visits, while these topics are also addressed by phone or e-mail (5 states) and through review of project reports (8 states). The next most common topics addressed during site visits are the adequacy of the program facilities (21 states) and staff issues such as morale and qualifications (18 states).
Exhibit 3.22 Number of States Addressing Various Monitoring Topics,
by Types of Monitoring Methods and Activities Any Method
(n=51 states)
On-Site Visits
(n=46 states)
Phone/E-mail/ Video Conference
(n=15 states)
Reports
(n=15 states) Compliance with Even Start law 34 states 34 states 7 states 7 states Quality and intensity of
instructional services 34 30 5 8
Program implementation 33 33 6 10 Program facilities 23 21 3 4 Staff: morale, roles, qualification 20 18 5 6 Areas in need of technical
assistance 14 9 6 2
Data collection, evaluation 13 6 5 3 Participant information: eligibility,
retention, academic achievement
11 8 3 4
Fiscal and budget information 9 4 0 5 Performance indicators 5 2 6 0 Note: Data are based on responses to an open-ended question. Each state could be coded with one or more responses regarding topics/issues monitored and the method of monitoring. The numbers listed under “any method” represent the number of states that monitor each topic by at least one method.

46 Chapter 3
Only eight state coordinators indicated that they examine anything concerning participants (e.g., eligibility, retention rates, academic achievement, participation records) during the monitoring site visits. Even fewer states review participation rates and educational outcomes by other methods of monitoring. Only a few states reported that they monitor how well the local projects deal with data collection, reporting, evaluation activities, and fiscal management. Only a few states focused on performance indicators in their monitoring activities. A review of the interview data suggests that, with the implementation of the performance indicator process and the emphasis on accountability, Even Start state coordinators have recognized the need to formalize the monitoring process and to collect information beyond the data necessary to respond to compliance questions. Some are asking programs to more carefully track participant progress and program implementation so that they can accurately answer questions regarding outcomes. Some state coordinators who collect more robust information during site visits use that information to foster strategic planning, to examine technical assistance and staff training needs, to plan for the development and dissemination of support documents, and to develop strategies to support program improvement.
A Strategy for Subgrantee Performance Monitoring With the implementation of the Even Start performance indicators and the increasing emphasis on accountability, one of the states included in the case study formalized the performance monitoring process to collect information beyond the data necessary for compliance verification. The state coordinator who has a background in adult education teams with the state’s early childhood specialist to conduct a yearly monitoring site-visit to each Even Start project. Before visiting a project, the two-person team reviews a briefing packet on the project, consisting of the latest local evaluation, state-level data on the project (for comparison with other projects), and the local project’s self-assessment protocol based on the state’s Even Start program monitoring guide. While on site, the team examines the project’s compliance with the law, participant satisfaction, quality of instruction and instructional staff; reviews documents; and conducts meetings with the Even Start director and staff to determine program implementation progress. Following a site visit, the local project receives written feedback from the state coordinator, encouraging them to use this information for their own strategic planning, staff development initiatives, and program improvement activities. Results from these visits include data on participation rates and progress on performance indicators, information on populations with special needs, insights into site management, staff and participant satisfaction, and program operational costs. The coordinator uses this information to determine the needs for technical assistance and staff training, to plan for the development and dissemination of support documents, and to develop strategies for statewide program improvement. In recent years, since streamlining the site-visit monitoring process, the state coordinator has used the site visit findings by applying them to issues such as alignment of the school readiness policies between Even Start and other early childhood programs.

Chapter 3 47
Collection of Data from Local Projects
Forty-three states indicated that they have a data collection and reporting system in operation for local projects to report program data to states. The nature of these “systems” may vary widely because the survey question allowed coordinators to include any type of data collection and reporting system (e.g., paper forms, computerized systems, etc.). Based on state coordinators’ responses about areas targeted for future improvement efforts (see Exhibits 3.31 and 3.32), the process of collecting data from local projects and the quality of these data may be problematic in some states. Five states indicated that they did not have a data reporting system (three states did not respond). Thirty-two states indicated when their systems were developed. A system was in existence prior to 1995 in 10 states; another 10 states developed their system in 1996-2000. Twelve states developed a statewide Even Start data reporting system for the first time in 2001.31 A large majority of states (at least 79 percent of states that had a data reporting system) indicated that they regularly collect data from local projects on: recruitment and enrollment rates, hours of service offered, participant demographics, hours of participation for adults and children, retention rates, and indicators of educational progress and goal achievement for adults and children. Less commonly collected were data on the content and approach of instructional services offered in each core service area (Exhibit 3.23).
Exhibit 3.23 Types of Data Regularly Collected from Local Projects
No. of States
% of States
Recruitment/enrollment rates 43 100% Hours of service offered 41 95% Participant demographics 38 88% Hours of participation for each participating adult and child 37 86% Indicators of academic and basic skills progress for adults 37 86% Retention rates 34 79% Indicators of developmental progress for children 34 79% Indicators of goal achievement for adults and children 34 79% Content and approach of instructional services offered in each core
service area 18 42%
Other types of data 12 28% Note: The percentages are based on 43 states that had a data collection or reporting system in operation at the time of the state survey.
Among the states, different data reporting schedules are used. Of the 40 states that provided this information, 18 states collect data annually; 14 states collect data twice per year or 31 Eleven states indicated that they had a data reporting system, but they did not indicate when it was implemented.

48 Chapter 3
quarterly; two states have a monthly data collection schedule; five states follow different schedules for different types of data (e.g., adult education vs. early childhood data); and one state indicated that a schedule is being developed. A review of the interview data from the case studies found the states arrayed along a continuum in terms of the development of a data reporting system. At one end of the spectrum, several states had employed a team approach with experienced technical assistance providers working collaboratively with state and local program staff in designing data collection and reporting procedures and developing customized technology-based management information systems (MIS). State teams that designed vigorous approaches to data management and reporting recognized the critical role that statewide discussions, technical assistance, and training played in the implementation process. The TA process allowed local projects to set their own standards for program quality, thus ensuring that these standards would be understood and upheld. Through this kind of process, the local staff internalized the need to ground their program improvement plans on criteria that are specific and measurable, such as specific changes in adult and child literacy learning. At the other end of the continuum, some states were still exploring different options for the system development, such as hiring an experienced evaluator to assist in the process or reviewing various commercially developed systems that may be employed for data collection and reporting.
Instructional Staff Qualifications
One of the issues that has received increasing scrutiny as the Even Start program has matured is ensuring and improving professional qualifications of instructional staff. The LIFT Act of 2000 amended the Even Start law to specify the levels of educational credentials for Even Start instructional staff (teachers) and for staff providing instructional support (teaching assistants) whose salaries are paid in whole or part with federal Even Start funds. The standards for new instructional staff had to be achieved immediately; for existing instructional staff, the new standards are to be achieved by projects incrementally over the next several years. In the mid-1990s, the national Even Start evaluation collected data on the level of education of Even Start instructors. These data showed that a large majority (86 percent) of instructors had an associate’s degree or higher, and 94 percent of instructional aides had a high school diploma or GED or higher (Tao et al., 1998). These percentages are well within the requirements set by the LIFT Act. However, in the current study, many coordinators explained that meeting the LIFT requirements will be a major challenge in some areas and projects. According to state coordinators, one of the difficulties in setting guidelines for instructional staff qualification is a lack of teacher certification programs in many states, especially for certain educational levels (e.g., preschool and adult education). In addition to the highest educational credentials completed, teaching certificates provide another basis for assessing or validating teachers’ knowledge and skills. Of the states that provided data regarding teacher certification,

Chapter 3 49
22 states have a certification program for pre-kindergarten teachers, and 29 states have an elementary and secondary certification program (Exhibit 3.24).
Exhibit 3.24 Availability of Certification Program in State by Type and Status of Certification or
Accreditation Program
Developed Not
Developed In Process of Development
No. of states
responding to this question
No. (%) of States
No. (%) of States
No. (%) of States
Adult Education 42 15 (36%) 19 (45%) 8 (19%) Pre-Kindergarten 44 22 (50%) 18 (41%) 4 (9%) K-12 Education 43 29 (67%) 14 (33%) - Parenting/ Family Literacy 42 3 (7%) 30 (71%) 9 (22%) Accreditation for family
literacy programs 46 3 (6%) 39 (85%) 4 (9%)
Note: The percentages are based on the number of states that provided data for each type of certification or accreditation.
Fewer states (15) have an adult education certification program. Certification programs for parenting or family literacy teachers as well as accreditation programs for family literacy programs were each reported by three states. In some states, some of these programs are being developed. But many states do not have teacher certification programs that would be useful for gauging and improving the quality of Even Start instructors. Certification programs may become more accessible through distance learning in some areas to reduce the barrier described by state coordinators. In addition to the degree requirements in the federal law, the law requires instructional staff to meet state qualifications. Forty states reported that they have credential requirements for Even Start adult education teachers (Exhibit 3.25). However, only 23 states described specific information about the required credentials. Based on these limited data, the state requirements include completion of any teacher certification program and a bachelor’s degree in education. Five states required adult education certification for Even Start adult education teachers, even though 15 states reported the existence of adult education certification programs in their states. In addition to the general scarcity of adult basic education (ABE) certification and professional credentialing systems, coordinators indicated that the cost of hiring more educated and experienced instructors was a barrier to meeting the staff qualification requirement.

50 Chapter 3
Exhibit 3.25 States’ Professional Credential Requirements for Adult and Child Educators
Credentials Required to Teach Adult Education
No. of States
% of States
States that have credential requirements for adult education educators 40 78% State certification/license in adult education 5 a/
Certification in elementary/secondary education or unspecified area 7 a/
BA/BS in education or with endorsement in teaching 7 a/
BA/BS—general 4 a/
Enrollment in adult education coursework 2 a/
Masters degree in education-related field 1 a/
Adult education teaching experience 1 a/
Credentials Required to Teach Early Childhood Education
States that have credential requirements for early childhood educators 26 51% State certification/license in elementary, secondary, or early childhood
education 15 29% b/
BA/BS with early childhood endorsement 10 20% b/ BA/BS—general 8 16% b/ Associate degree in early childhood or college courses in early childhood
education 8 16% b/
Child Development Associate (CDA) in early childhood education; Child Care Administration (CCA) credentialing program; or Additional Licensure Plan (ALP)
6 12% b/
Appropriate teaching experience 2 4% b/ a/ Only 23 of the 40 states that have credential requirements for adult education instructors provided description of the requirement. Due to this high rate of missing data, we did not compute the percentages of states by the type of adult education credential requirement. b/ The percentages are based on 51 states. Each state that has ECE credential requirements could indicate one or more types of requirements.
Development and Implementation of Performance Indicators (PI)
Summary of Key Findings
This section begins by summarizing the review of the states’ performance indicators that were submitted to the U.S. Department of Education (ED) in June 2001. The remainder of the section presents the updated information collected in the state survey, which was conducted six months after the review of the June 2001 performance indicator documents.
o States differed greatly in every aspect of Even Start performance indicators that were submitted to ED in June 2001, including the measures and performance standards used and subgroups to whom the measurements and standards are to be applied.
o As of December 2001, about a third of the states had provided technical assistance on performance indicators by conducting training workshops, conferences, and meetings of local project staff.

Chapter 3 51
o Most states planned to collect the first round of performance indicator data in 2002. Fourteen states had already begun to collect performance indicator data in 2001 or earlier.
o About half of the states plan to collect performance indicator data annually; 15 states will collect data twice a year.
o More than half of the states plan to collect assessment data from all adults and children who enroll in the program.
o In calculating the extent to which each project meets the performance standards, a large majority of states will include only the adults and children who participate in Even Start at least for a specified amount of time. Because the minimum participation threshold and participant inclusion rules differ widely among states, it will be difficult to aggregate the results of performance indicators for all states.
Review of the States’ June 2001 Performance Indicator Documents: A Summary
The Even Start legislation requires all 50 states, Puerto Rico, and the District of Columbia to develop and implement the states’ Even Start performance indicators, specifically to include the following six required indicators of program quality as well as any “other indicators as the State may develop” (Section 1210, ESEA):
With respect to eligible adult participants: 1. achievement in the areas of reading, writing, English language acquisition,
problem solving, and numeracy; 2. receipt of a high school diploma or a general equivalency diploma; and 3. entry into a postsecondary school, job retraining program, or employment or
career advancement, including the military. With respect to eligible child participants:
4. improvement in ability to read on grade level or reading readiness; 5. school attendance; and 6. grade retention and promotion.
The states’ initial set of performance indicators was submitted to the U.S. Department of Education by June 30, 2001.32 The minimum requirements for this submission were descriptions of the six required indicators to be implemented in each state. Inclusion of any additional 32 Section 1210 of the Elementary and Secondary Education Act (ESEA) of 1965 requires each state receiving federal
Even Start funds to “… develop, based on the best available research and evaluation data, indicators of program quality for programs assisted under this part. Such indicators shall be used to monitor, evaluate, and improve such programs within the State.” Section 1604(n) of the Literacy Involves Families Together (LIFT) Act of 2000 requires that each state receiving federal Even Start funds “… to be eligible to receive fiscal year 2001 funds under part B, … shall submit to the Secretary, not later than June 30, 2001, its indicators of program quality as described in Section 1210 of the Elementary and Secondary Education Act of 1965.”
52 Chapter 3
information, such as descriptions of assessment instruments to be used to collect the indicator data, specific performance targets, and indicators of program implementation, was optional. All documents submitted by June 30, 2001, were reviewed by the Department and approved as meeting the minimum legislative requirement. The states were expected to further develop, pilot test, and refine the indicators of program quality as they proceeded into the implementation phase beyond June 2001. The Department contracted with Abt Associates Inc. to review and summarize key information contained in the documents submitted by the states by the June 2001 due date. The review resulted in the following conclusions:
1. States differed greatly in every aspect of Even Start performance indicators that were submitted to the Department in June 2001. Very little consistency was found among states in the measures used, performance standards used, and subgroups to which the measurements and standards are to be applied.
2. While several states had developed well organized and comprehensive framework and
strategies for program accountability and improvement, little systematic information was contained in many states’ indicator documents regarding states’ plans for implementation.
3. Information and guidance regarding the use of performance indicator data for program
improvement were nonexistent in most states’ June 2001 submission. The review of the June 2001 performance indicator documents identified the following areas that called for further development to enable successful implementation of the system in the upcoming program year.
Content and specification of performance indicators. As of June 2001, some states had developed a highly complex (in some cases excessively complicated) system of performance indicators involving specifications of many participant subgroups, assessment measures, and performance standards. Other states described their indicators in general terms with little specific information to guide local projects to implement their performance assessment activities. Many states’ indicator systems appeared to need further development in the content of their performance indicators (e.g., participant subgroup definitions, specification of assessment measures, specification of performance standards, and their computation). Some states may need to simplify the excessively complicated specifications so that local projects can consistently follow the same measurement and computation procedures. Some states may need to further define some of the indicators so that local projects can make specific plans to implement the data collection process.
Guidance for implementation process. Absent from many states’ performance indicator documents was specific guidance for local projects on how and where to obtain data collection instruments; on data collection, data entry and storage, data reporting processes; and on data collection and reporting schedules. When all these

Chapter 3 53
plans are developed, a state would need to prepare a well-organized guidance document that contains all detailed information on system implementation and distribute it to all local projects. As of June 2001, such documents did not seem to exist in most states.
Staff training. Some states’ plans for training both the state and local project staff were minimal. To use the performance indicator data at the state level, consistent application of the system across all local projects is essential. States may consider phased training and implementation of required and optional indicators to ensure that staff are properly trained to conduct (1) the data collection, especially the administration of standardized assessment instruments; (2) computation of outcome measures; and (3) reporting of each indicator correctly.
Plans for the use of performance indicator data. Progress on the refinement of indicators, the development of implementation plans, and staff training were areas needing the most immediate attention. At the same time, focusing on how the data will be used will minimize gaps in data collection and unnecessary demands on local and state staff time. Local projects will need to coordinate the collection and use of their performance indicator data with their local evaluation that is designed to address project-specific evaluation issues. States, in turn, will need to develop clear guidance and targeted professional development opportunities to help local projects to make the most efficient use of these evaluation activities for the purpose of continuous program improvement.
There is no doubt that much progress has been made in all of these areas since June 2001. The above summary conclusions from the performance indicator review are presented here as a background for reporting the findings of the state survey which was conducted six months after the performance indicators were submitted to ED.
Performance Indicator System Implementation: Status as of December 2001
As evidenced in the review of states’ performance indicators, there were great variations in the status of performance indicator development. As shown in Exhibit 3.26, 36 states provided basic information about their indicators to their projects in 2001; about half of the states provided specific information about assessment instruments in 2001, and about half of the states notified local projects in 2001 about technical assistance related to performance indicators. Some states had completed these steps before 2001. Data suggest that about half of the states were ready to begin the initial phase of the performance indicator data collection at the local level in the fall of the 2001-02 school year. On the other hand, 20-30 percent of states either planned to provide specific information about assessment instruments and about technical assistance on performance indicators in 2002 or not at all. These states may need to devote additional effort and resources to the implementation of their performance indicators.
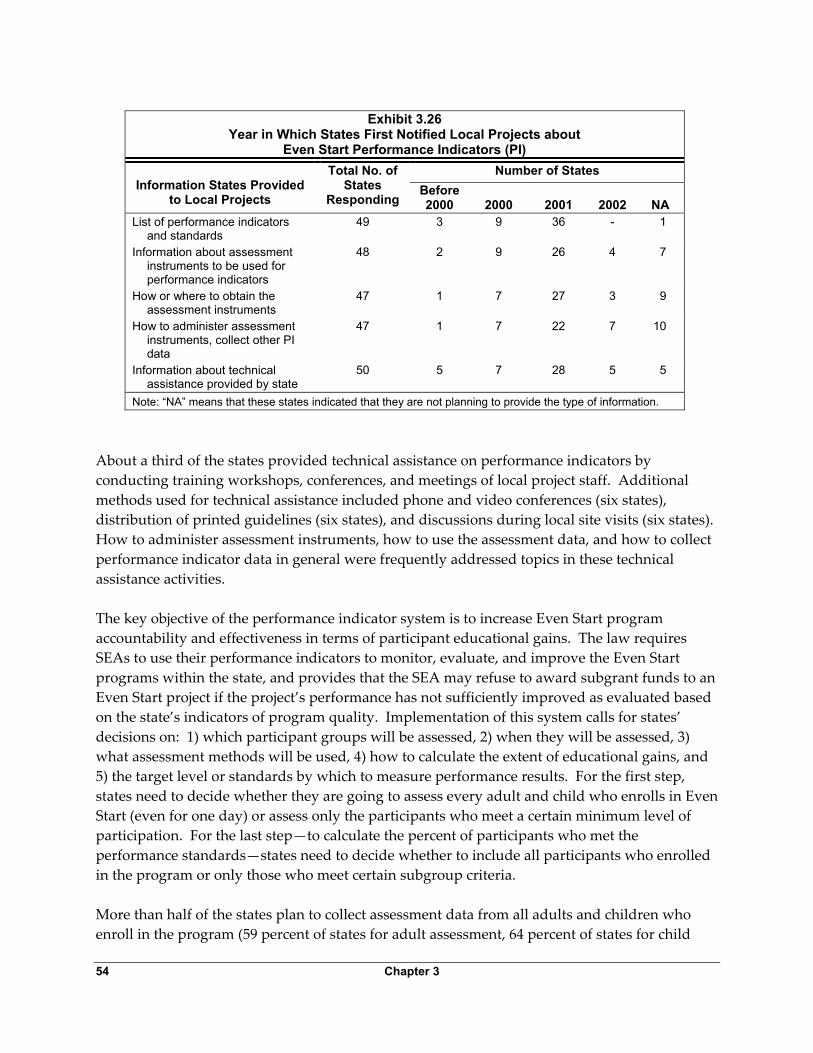
54 Chapter 3
Exhibit 3.26
Year in Which States First Notified Local Projects about Even Start Performance Indicators (PI)
Number of States Information States Provided
to Local Projects
Total No. of States
Responding Before 2000
2000
2001
2002
NA
List of performance indicators and standards
49 3 9 36 - 1
Information about assessment instruments to be used for performance indicators
48 2 9 26 4 7
How or where to obtain the assessment instruments
47 1 7 27 3 9
How to administer assessment instruments, collect other PI data
47 1 7 22 7 10
Information about technical assistance provided by state
50 5 7 28 5 5
Note: “NA” means that these states indicated that they are not planning to provide the type of information.
About a third of the states provided technical assistance on performance indicators by conducting training workshops, conferences, and meetings of local project staff. Additional methods used for technical assistance included phone and video conferences (six states), distribution of printed guidelines (six states), and discussions during local site visits (six states). How to administer assessment instruments, how to use the assessment data, and how to collect performance indicator data in general were frequently addressed topics in these technical assistance activities. The key objective of the performance indicator system is to increase Even Start program accountability and effectiveness in terms of participant educational gains. The law requires SEAs to use their performance indicators to monitor, evaluate, and improve the Even Start programs within the state, and provides that the SEA may refuse to award subgrant funds to an Even Start project if the project’s performance has not sufficiently improved as evaluated based on the state’s indicators of program quality. Implementation of this system calls for states’ decisions on: 1) which participant groups will be assessed, 2) when they will be assessed, 3) what assessment methods will be used, 4) how to calculate the extent of educational gains, and 5) the target level or standards by which to measure performance results. For the first step, states need to decide whether they are going to assess every adult and child who enrolls in Even Start (even for one day) or assess only the participants who meet a certain minimum level of participation. For the last step—to calculate the percent of participants who met the performance standards—states need to decide whether to include all participants who enrolled in the program or only those who meet certain subgroup criteria. More than half of the states plan to collect assessment data from all adults and children who enroll in the program (59 percent of states for adult assessment, 64 percent of states for child

Chapter 3 55
assessment) (Exhibit 3.27). Less than half of the states plan to assess only the participants who meet certain participation criteria. Based on the June 2001 performance indicator documents, the “participation criteria or threshold” varies greatly among states.
Exhibit 3.27 Participant Groups to Be Assessed for Educational Gain and to Be Included in the Calculation of Performance Outcomes
To be assessed
To be included in outcome level
calculation
No. of States (%) No. of States (%)
All adults who enroll in Even Start 29 (59%) 9 (20%) Only adults who participate at least a defined
number of hours or months in Even Start 20 (41%) 36 (80%)
All children who enroll in Even Start 28 (64%) 11 (24%) Only children who participate at least a defined
number of hours or months in Even Start 21 (47%) 34 (76%)
Note: The percentages are based on the number of states that responded to this set of questions (between 45-49 states). Three states indicated that they had not established rules for assessment or calculations of performance outcomes.
In calculating the extent to which each project meets the performance standards, a large majority of states will include only the adults and children who participate in Even Start at least for a specified amount of time. Somewhat less than a quarter of the states plan to include all families that enroll in Even Start in the calculation of educational gain rates. Since the minimum participation threshold and participant inclusion rules differ widely among states, it would be difficult to aggregate the results of performance indicators from all states. In addition to specifying the instruments or measures to collect data for all required indicators, states needed to develop methods for data collection. Thirty-one states planned to use paper-based forms for local projects to report individual participant data; 25 states planned to use an electronic data entry system, and 25 states planned to use a summary report describing the results of performance indicator data analysis at the local level (states could indicate one or more of these methods). Most states (31) planned to collect the first round of performance indicator data in 2002 (mostly by the end of July 2002, except for seven states whose data collection was scheduled between August to November 2002). Fourteen states had already begun to collect performance indicator data in 2001 or earlier. Thus, 45 states planned to collect data in 2002; one state planned to pilot the system in 2002 and collect the first complete data in June 2003.33 In terms of data collection schedule, about half of the states (26) plan to collect performance indicator data annually; 15 states, twice a year. Seven states described other plans, including: schedule not yet determined; 33 Data for this question were missing for the remaining six states.

56 Chapter 3
an ongoing data collection through a Web-based system; monthly data submission; and monthly submissions until the system “glitches” are corrected and less frequently thereafter.
Program Evaluation and Improvement
Summary of Key Findings
In the early years of Even Start, when development of the program was the first priority, concerted effort to directly address the evaluation requirements was rare at the state and local levels. However, since the mid-1990s, the policy focus for Even Start has gradually shifted from program implementation to data-based program improvement and the need to demonstrate Even Start’s program impact on participants’ educational achievements. In this process, local and state-level evaluation activities have increased, as has the attention paid by states to the use of evaluation data for the purpose of program management and improvement. Key findings regarding the states’ role in evaluation and program improvement are the following:
o Half of the states reported that they conduct a state-level Even Start evaluation, although the definitions of “state evaluation” may vary among states.
o More than half of the 24 states that conduct a state evaluation indicated that they used data collected by local projects for the national evaluation as part of the state evaluation.
o Twenty-eight states require local projects to collect specific types of data in their local evaluation; most of these states require projects to collect data on families’ progress toward educational and economic goals, family demographic data, and hours of participation by enrolled adults and children.
o About one-third of the states provide training for local Even Start evaluators; 15 states directly coordinate the local evaluation activities for all subgrantees.
o More than half of the states indicated that they use local evaluation data for program improvement.
State Evaluation
The Even Start legislation requires each local project to conduct a local evaluation by an external evaluator to facilitate its program development and improvement, in addition to participating in a federally sponsored national evaluation of Even Start. While there is no specific statutory requirement for state-level Even Start evaluation, 24 states reported that they conduct a state-level Even Start evaluation. The definitions of “state evaluation” may vary among states, some referring to an organized review of year-end local project reports and others to a longitudinal evaluation conducted by external evaluation researchers or to a sample-based in-depth study to examine specific policy questions such as the relationship between increased parent basic skills and the academic skill level of children. Seventeen of the 24 states that conduct a state evaluation indicated that they used data collected by local projects for the national evaluation as

Chapter 3 57
part of the state evaluation. Further, among all states responding to the state survey, 42 states collect and review local evaluation reports produced by local projects.
A Strategy for a Statewide Evaluation System Motivated by the new Even Start legislation requiring states to develop indicators of program quality (IPQs), one state set in motion a formal process for developing the state’s Even Start IPQs and an extensive system of technical assistance focused specifically on evaluation and accountability. The state coordinator contracted with a team of external evaluators and technical assistance providers and used the state’s system of six regional professional development centers, already established to provide technical assistance to such programs as adult education, early childhood education, and Head Start, to launch this Even Start program improvement effort. The state Even Start staff working as a team with the TA providers convened a series of meetings statewide with local Even Start staff to set the bar for different participant and program performance standards and design an evaluation plan, including a computerized management information system (MIS), aligned with the IPQs, for data collection and reporting. Once the MIS system was in place, these consultants provided technical assistance and training to Even Start staff on data entry and reporting at the six regional centers. In 2002, the state successfully launched the evaluation pilot. Beyond establishing a statewide technology-based Even Start MIS, the state, in concert with the technical assistance providers, developed a common language and a method for the state and local Even Start staff to carry out their program improvement efforts. The state also produced two documents helpful to the field in continuing improvement efforts, a monitoring guide and a practitioner’s field book.
Guidance and Assistance in Local Evaluations
An increasing number of states assist the local projects with local evaluations by providing technical guidance and training. Twenty-eight states require local projects to collect specific types of data in their local evaluation (Exhibit 3.28). An additional 12 states planned to require all local projects in their states to collect a specified set of data in the future. This approach not only helps local projects in structuring their evaluation but also provides consistent core data from all local projects for state-level analysis. Furthermore, this approach need not constrain local projects’ opportunity to design their project-specific local evaluation to examine specific issues facing individual projects. The state-required component and the project-specific component can be combined in a given local evaluation.

58 Chapter 3
Exhibit 3.28 State Leadership in Evaluation Activities
No. of States
% of States
Collect and review local evaluation conducted by local projects 42 84% Require local evaluations to collect specific types of data 28 56% Conduct state-level Even Start evaluation 24 48% Provide training for local Even Start evaluators 19 38% Issue local evaluation guidelines to local Even Start projects 17 34% Coordinate local evaluation across all subgrantees 15 30% Note: The percentages are based on 50 states.
Almost all of the 28 states that require all local projects to collect the same set of core data in local evaluations include data on families’ progress toward educational and economic goals, family demographic data, and hours of participation by enrolled adults and children. Participant retention rates and program improvement plans are required by 20 and 18 states, respectively (out of the 28 states with data requirements). It should be noted that these data requirements pertain specifically to data to be collected in local evaluations. The extent of overlap between this requirement and the now implemented state Even Start performance indicators probably varies among these 28 states. As shown in Exhibit 3.28, 19 states provide training for local Even Start evaluators (annually or biannually) to ensure uniform understanding among local evaluators regarding the Even Start program approach, requirements, goals, common evaluation issues, and available materials and resources relevant to local evaluation. In 12 additional states, local evaluator training plans were being developed. Seventeen states issue local evaluation guidelines to local projects to provide a basic structure and indicate their expectations regarding the purpose and scope of Even Start local evaluations. Another 16 states indicated that local evaluation guidelines were being developed. These activities may be conducted more widely since the full implementation of the performance indicators. Fifteen states were involved in local evaluations by directly coordinating the local evaluation activities among all subgrantees. Such coordination may take various forms such as a state taking any one or more of the following steps:
Hiring a consultant to provide technical assistance to local projects on the design of local evaluations, assessment methods, and data analysis.
Convening all local projects to present information on performance indicators and to have local projects share their local evaluation results.
Hiring a consultant to collect local evaluation results and to compile a state report based on the local reports.
Providing standards for local evaluation design, reports, and evaluator qualifications.
Developing a data collection system to be used by all local projects and local evaluators.

Chapter 3 59
The extent of involvement by state coordinators in local evaluations has increased in recent years. However, there are some coordinators who are philosophically committed to local projects’ designing project-specific evaluations and hiring their own local evaluators, to avoid the risk of imposing a state coordinator’s bias or preferences on local evaluations. The rationale behind this approach is to maximize the usefulness of local evaluation results for the individual projects’ program improvement efforts.
A Strategy for Local Evaluation Quality Improvement An approach described by one state coordinator provides for an efficient way for the state to monitor and ensure the quality of local evaluations and, at the same time, allow each local project sufficient leeway to direct its own evaluation. The state coordinator, in consultation with her technical advisers, selects a pool of local evaluators from various parts of the state based on a systematic review of candidate evaluators’ academic and professional qualifications. The selected evaluators receive comprehensive training by the state Even Start staff on the basic program objectives, legislative requirements, and performance expectations of local Even Start projects. Then, the state distributes information on each of the trained evaluators to all local projects and requires each project to choose its local evaluator from this pool of state-approved and trained evaluators. This method provides the state a degree of consistency across local evaluations in terms of basic types of data collected and the quality of the evaluators, while allowing each project to focus its evaluation on project-specific key issues.
Use of Local Evaluation Data and Reports
Although 42 states said that they collect and review local evaluation reports, 31 states indicated that they use local evaluation data or reports for continuous program improvement, and 17 states said they do not.34 The latter group of states may collect the reports mainly as a way of ensuring that local projects are complying with their evaluation requirement. For the 31 states, the local evaluation results are used for a number of purposes including:
Developing guidelines for the following year’s program improvement and topics to target for technical assistance for local projects (16 states).
Providing project-specific feedback to local projects and examining program outcomes among all projects in a state (12 states).
Providing a needs assessment for statewide professional development activities (six states).
Preparing state-required reports (four states).
34 The Even Start law requires local projects to use their independent local evaluations for program improvement.
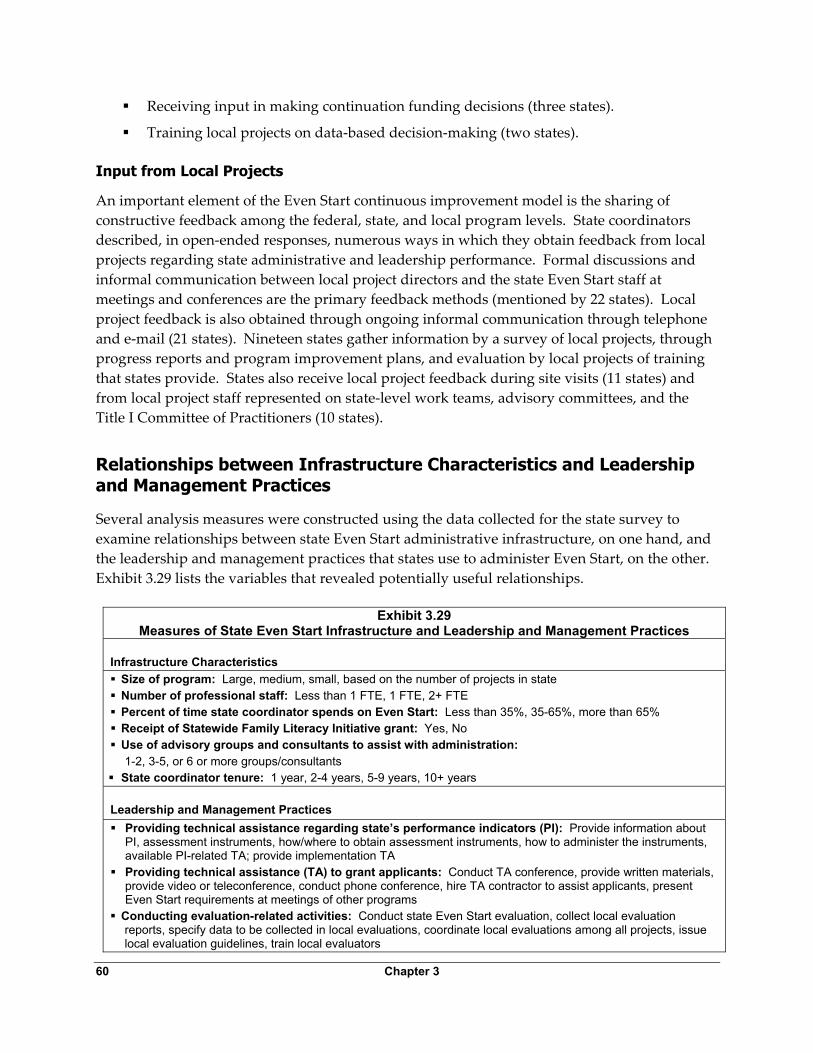
60 Chapter 3
Receiving input in making continuation funding decisions (three states).
Training local projects on data-based decision-making (two states).
Input from Local Projects
An important element of the Even Start continuous improvement model is the sharing of constructive feedback among the federal, state, and local program levels. State coordinators described, in open-ended responses, numerous ways in which they obtain feedback from local projects regarding state administrative and leadership performance. Formal discussions and informal communication between local project directors and the state Even Start staff at meetings and conferences are the primary feedback methods (mentioned by 22 states). Local project feedback is also obtained through ongoing informal communication through telephone and e-mail (21 states). Nineteen states gather information by a survey of local projects, through progress reports and program improvement plans, and evaluation by local projects of training that states provide. States also receive local project feedback during site visits (11 states) and from local project staff represented on state-level work teams, advisory committees, and the Title I Committee of Practitioners (10 states).
Relationships between Infrastructure Characteristics and Leadership and Management Practices
Several analysis measures were constructed using the data collected for the state survey to examine relationships between state Even Start administrative infrastructure, on one hand, and the leadership and management practices that states use to administer Even Start, on the other. Exhibit 3.29 lists the variables that revealed potentially useful relationships.
Exhibit 3.29 Measures of State Even Start Infrastructure and Leadership and Management Practices
Infrastructure Characteristics Size of program: Large, medium, small, based on the number of projects in state Number of professional staff: Less than 1 FTE, 1 FTE, 2+ FTE Percent of time state coordinator spends on Even Start: Less than 35%, 35-65%, more than 65% Receipt of Statewide Family Literacy Initiative grant: Yes, No Use of advisory groups and consultants to assist with administration:
1-2, 3-5, or 6 or more groups/consultants State coordinator tenure: 1 year, 2-4 years, 5-9 years, 10+ years
Leadership and Management Practices Providing technical assistance regarding state’s performance indicators (PI): Provide information about
PI, assessment instruments, how/where to obtain assessment instruments, how to administer the instruments, available PI-related TA; provide implementation TA Providing technical assistance (TA) to grant applicants: Conduct TA conference, provide written materials,
provide video or teleconference, conduct phone conference, hire TA contractor to assist applicants, present Even Start requirements at meetings of other programs Conducting evaluation-related activities: Conduct state Even Start evaluation, collect local evaluation
reports, specify data to be collected in local evaluations, coordinate local evaluations among all projects, issue local evaluation guidelines, train local evaluators
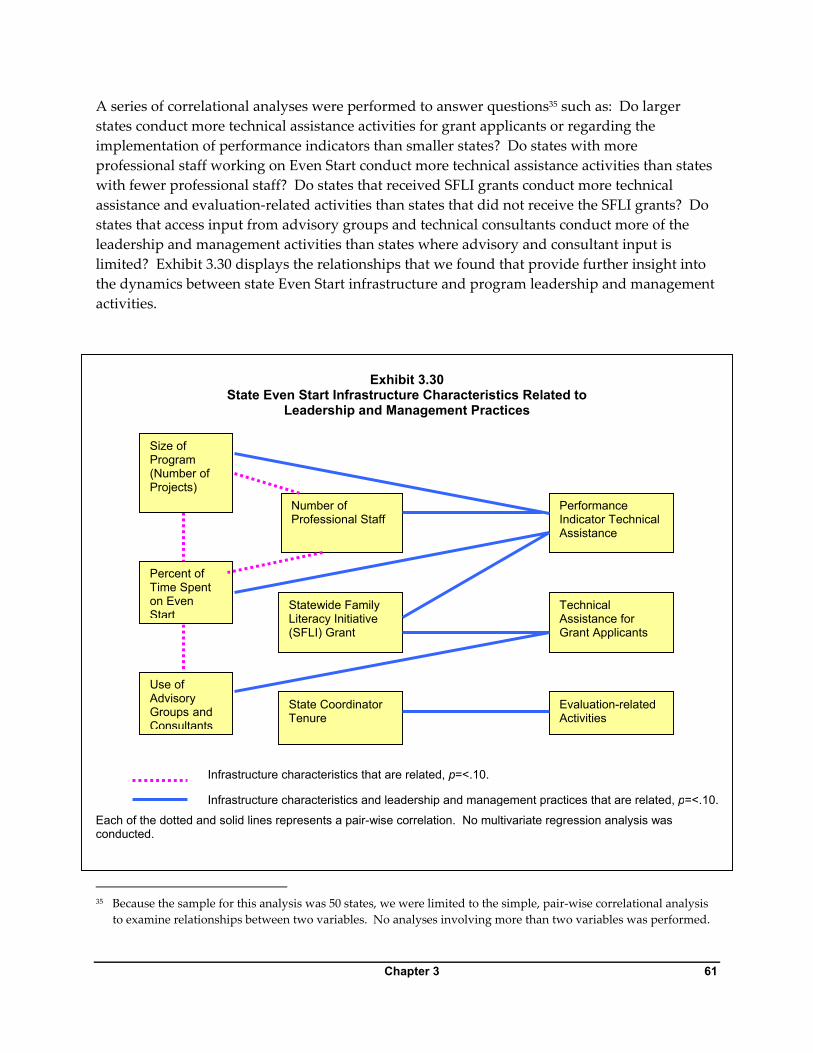
Chapter 3 61
A series of correlational analyses were performed to answer questions35 such as: Do larger states conduct more technical assistance activities for grant applicants or regarding the implementation of performance indicators than smaller states? Do states with more professional staff working on Even Start conduct more technical assistance activities than states with fewer professional staff? Do states that received SFLI grants conduct more technical assistance and evaluation-related activities than states that did not receive the SFLI grants? Do states that access input from advisory groups and technical consultants conduct more of the leadership and management activities than states where advisory and consultant input is limited? Exhibit 3.30 displays the relationships that we found that provide further insight into the dynamics between state Even Start infrastructure and program leadership and management activities.
Exhibit 3.30 State Even Start Infrastructure Characteristics Related to
Leadership and Management Practices Each of the dotted and solid lines represents a pair-wise correlation. No multivariate regression analysis was conducted. 35 Because the sample for this analysis was 50 states, we were limited to the simple, pair-wise correlational analysis
to examine relationships between two variables. No analyses involving more than two variables was performed.
Evaluation-related Activities
Technical Assistance for Grant Applicants
Performance Indicator Technical Assistance
Size of Program (Number of Projects)
Number of Professional Staff
Use of Advisory Groups and Consultants
Statewide Family Literacy Initiative (SFLI) Grant
State CoordinatorTenure
Infrastructure characteristics that are related, p=<.10.
Infrastructure characteristics and leadership and management practices that are related, p=<.10.
Percent of Time Spent on Even Start
62 Chapter 3
Six infrastructure characteristics (e.g., size of program, number of professional staff) are listed on the left side of Exhibit 3.30. The dotted lines indicate that some of these characteristics are significantly related. For example, states with a relatively higher number of projects tend to have a larger professional staff working on Even Start. On the right side of the exhibit are three activities that represent key leadership and management functions of the state Even Start office. The solid lines indicate significant relationships between various infrastructure characteristics on the left and leadership and management functions on the right. Several infrastructure measures were related to providing more technical assistance regarding performance indicators. Larger states, a larger number of professional staff, more time spent by state coordinators on Even Start tasks, and receipt of SFLI were related to provision of more performance indicator technical assistance to local projects (p<.10). It should be noted that the size of a program, number of professional staff, and percent of coordinator time spent on Even Start were intercorrelated. Each of these variables was also directly related to performance indicator technical assistance. These results suggest that the availability of more time by state coordinators and other professional staff to devote to Even Start facilitates the implementation of performance indicators. The results also indicate that larger states may need to provide more technical assistance to ensure that all of their projects are on board with this new requirement. In addition, states that received a SFLI grant and states that made greater use of advisory and consultant input provided more technical assistance to grant applicants. The probable explanation for these findings is, again, the availability of additional resources in terms of additional SFLI funds, resources provided by expanded and strengthened collaborative partners, and technical expertise provided by advisory and consultant groups, enabling states to provide more technical assistance to applicants. Analyses regarding state coordinator experience revealed only one substantive result. More experienced coordinators conduct more evaluation-related activities than do newer coordinators. However, newer coordinators were as likely as experienced coordinators to conduct technical assistance activities related to performance indicators and for grant applicants.
Areas Targeted by States for Improvement at State and Local Levels
In recent years, the legislative emphasis on demonstrating Even Start’s effectiveness as measured by participant educational outcomes has been communicated strongly and clearly to the states and local projects. In response, many states have implemented various strategies to strengthen state level program operations which in turn would facilitate local projects’ achieving their program improvement goals. State-Level Improvements. As shown in Exhibit 3.31, strengthening staff resources at the state level as well as improving staff qualifications at the local level were cited as one of the key priorities by state coordinators (18 states). The pressing nature of these tasks may be

Chapter 3 63
attributable to the generally small size of state Even Start staff and the new legislative requirement regarding the professional qualifications of local instructional staff. The next commonly cited program improvement priority is implementation of additional strategies to increase the effectiveness of local project activities (16 states). The action plans often mentioned by state coordinators included: improvement in technical assistance and monitoring of local projects, use of peer review teams, strategies to promote continuous program improvement, and data-based decision making. Another priority area is the establishment of infrastructure to collect and use data more efficiently for the purpose of program improvement (14 states). Many states are in the process of implementing an electronic data collection system and data reporting procedures in conjunction with the full implementation of the performance indicator system. Again, reflecting the heightened appreciation of evaluation as a key tool for systematic program improvement, state coordinators plan to become more involved in state and local evaluations, by coordinating state and local evaluations, coordinating technical assistance and evaluation activities, and monitoring the quality and training of local evaluators. Some of these issues have become program-wide priorities in recent years. However, successful interagency collaboration—one of the initial requirements of Even Start—is still viewed as a necessary condition for achieving newer goals. Thirteen states indicated that improving collaboration and integrating family literacy in a wider array of educational programs are high priority issues for their program improvement efforts.
Exhibit 3.31 Areas Targeted for Strengthening State Operations
No. of States
% of States
Staff development/credentialing system; state staff resources 18 35% Technical assistance and monitoring of local projects; use of peer
review teams; continuous program improvement strategies; data-based decision making
16 31%
Electronic data collection system, streamlined data collection system, schedule, and reporting
14 27%
Coordination of state and local evaluations; coordination of technical assistance and evaluation activities; monitoring the quality and training of local evaluators
13 25%
Interagency collaboration at the state level; integration of family literacy in state education department
13 25%
Performance indicator system, collection of outcome data, standardized assessment tools
5 10%
General program administration: grant application process; staying abreast of new program information; balancing increasing number of projects with quality of services
3 6%
Curriculum development, identify and disseminate promising practices
2 4%
Note: The percentages are based on 51 states. Each state could indicate one or more responses to an open-ended question.
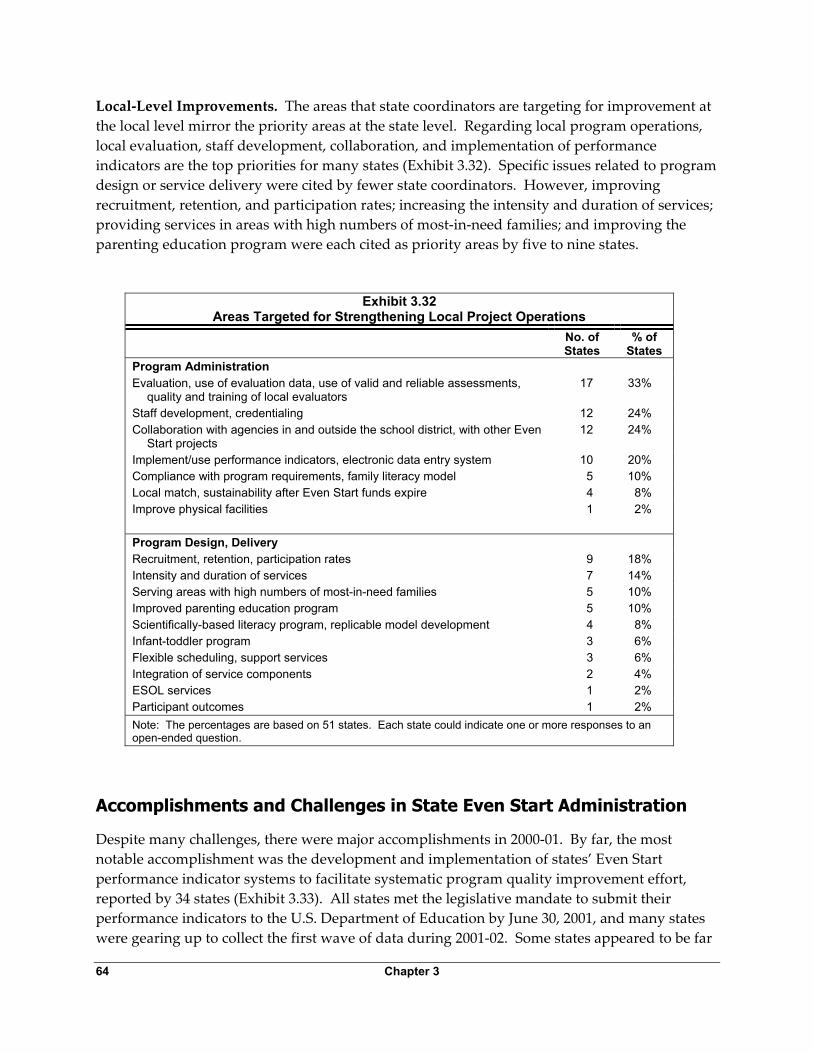
64 Chapter 3
Local-Level Improvements. The areas that state coordinators are targeting for improvement at the local level mirror the priority areas at the state level. Regarding local program operations, local evaluation, staff development, collaboration, and implementation of performance indicators are the top priorities for many states (Exhibit 3.32). Specific issues related to program design or service delivery were cited by fewer state coordinators. However, improving recruitment, retention, and participation rates; increasing the intensity and duration of services; providing services in areas with high numbers of most-in-need families; and improving the parenting education program were each cited as priority areas by five to nine states.
Exhibit 3.32 Areas Targeted for Strengthening Local Project Operations
No. of States
% of States
Program Administration Evaluation, use of evaluation data, use of valid and reliable assessments,
quality and training of local evaluators 17 33%
Staff development, credentialing 12 24% Collaboration with agencies in and outside the school district, with other Even
Start projects 12 24%
Implement/use performance indicators, electronic data entry system 10 20% Compliance with program requirements, family literacy model 5 10% Local match, sustainability after Even Start funds expire 4 8% Improve physical facilities
1 2%
Program Design, Delivery Recruitment, retention, participation rates 9 18% Intensity and duration of services 7 14% Serving areas with high numbers of most-in-need families 5 10% Improved parenting education program 5 10% Scientifically-based literacy program, replicable model development 4 8% Infant-toddler program 3 6% Flexible scheduling, support services 3 6% Integration of service components 2 4% ESOL services 1 2% Participant outcomes 1 2% Note: The percentages are based on 51 states. Each state could indicate one or more responses to an open-ended question.
Accomplishments and Challenges in State Even Start Administration
Despite many challenges, there were major accomplishments in 2000-01. By far, the most notable accomplishment was the development and implementation of states’ Even Start performance indicator systems to facilitate systematic program quality improvement effort, reported by 34 states (Exhibit 3.33). All states met the legislative mandate to submit their performance indicators to the U.S. Department of Education by June 30, 2001, and many states were gearing up to collect the first wave of data during 2001-02. Some states appeared to be far
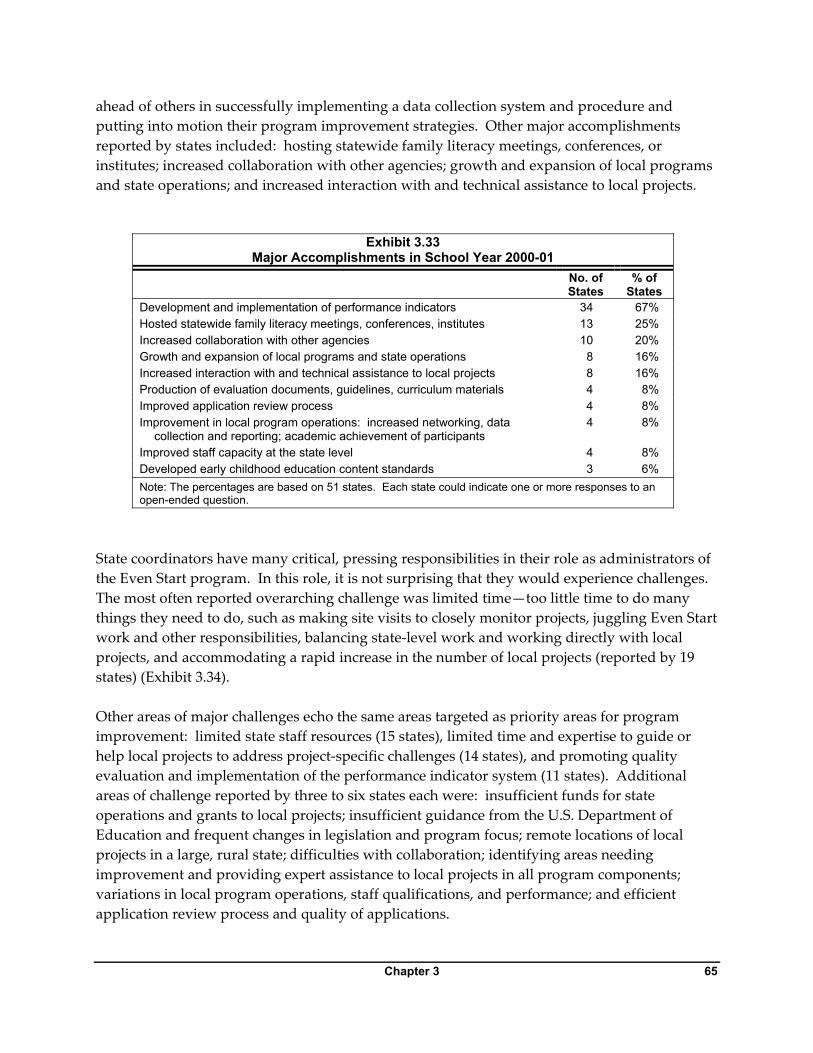
Chapter 3 65
ahead of others in successfully implementing a data collection system and procedure and putting into motion their program improvement strategies. Other major accomplishments reported by states included: hosting statewide family literacy meetings, conferences, or institutes; increased collaboration with other agencies; growth and expansion of local programs and state operations; and increased interaction with and technical assistance to local projects.
Exhibit 3.33 Major Accomplishments in School Year 2000-01
No. of States
% of States
Development and implementation of performance indicators 34 67% Hosted statewide family literacy meetings, conferences, institutes 13 25% Increased collaboration with other agencies 10 20% Growth and expansion of local programs and state operations 8 16% Increased interaction with and technical assistance to local projects 8 16% Production of evaluation documents, guidelines, curriculum materials 4 8% Improved application review process 4 8% Improvement in local program operations: increased networking, data
collection and reporting; academic achievement of participants 4 8%
Improved staff capacity at the state level 4 8% Developed early childhood education content standards 3 6% Note: The percentages are based on 51 states. Each state could indicate one or more responses to an open-ended question.
State coordinators have many critical, pressing responsibilities in their role as administrators of the Even Start program. In this role, it is not surprising that they would experience challenges. The most often reported overarching challenge was limited time—too little time to do many things they need to do, such as making site visits to closely monitor projects, juggling Even Start work and other responsibilities, balancing state-level work and working directly with local projects, and accommodating a rapid increase in the number of local projects (reported by 19 states) (Exhibit 3.34). Other areas of major challenges echo the same areas targeted as priority areas for program improvement: limited state staff resources (15 states), limited time and expertise to guide or help local projects to address project-specific challenges (14 states), and promoting quality evaluation and implementation of the performance indicator system (11 states). Additional areas of challenge reported by three to six states each were: insufficient funds for state operations and grants to local projects; insufficient guidance from the U.S. Department of Education and frequent changes in legislation and program focus; remote locations of local projects in a large, rural state; difficulties with collaboration; identifying areas needing improvement and providing expert assistance to local projects in all program components; variations in local program operations, staff qualifications, and performance; and efficient application review process and quality of applications.
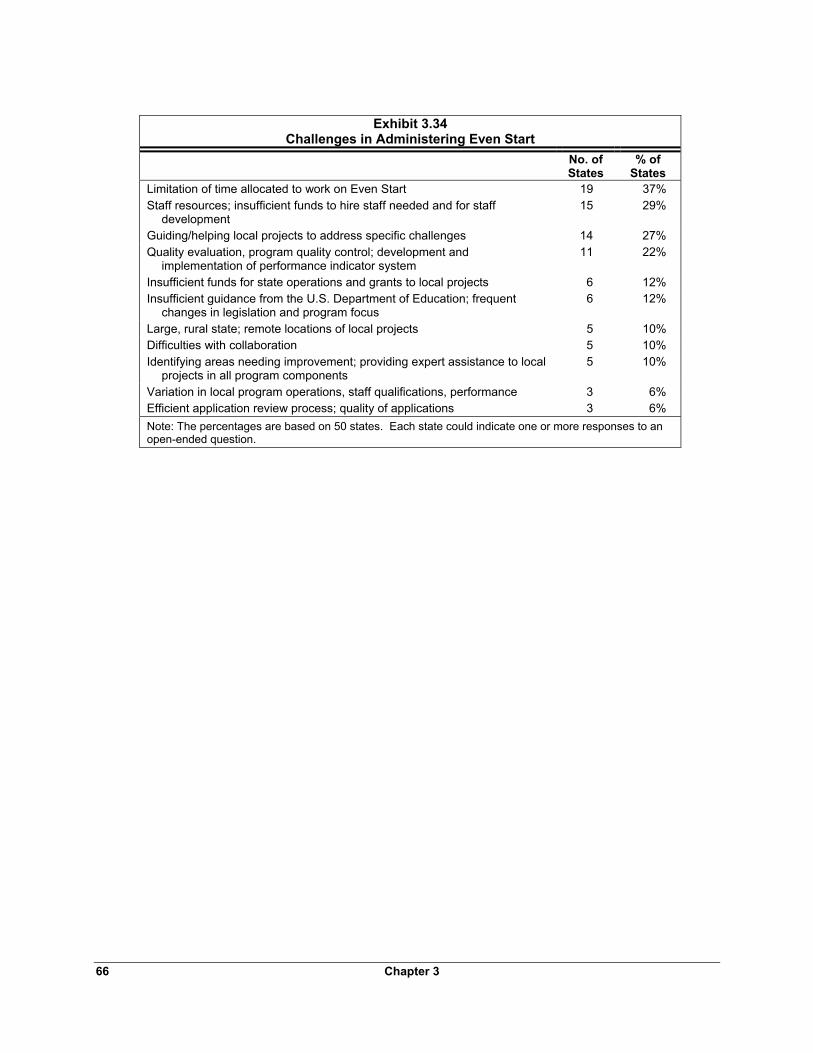
66 Chapter 3
Exhibit 3.34
Challenges in Administering Even Start No. of
States % of
States Limitation of time allocated to work on Even Start 19 37% Staff resources; insufficient funds to hire staff needed and for staff
development 15 29%
Guiding/helping local projects to address specific challenges 14 27% Quality evaluation, program quality control; development and
implementation of performance indicator system 11 22%
Insufficient funds for state operations and grants to local projects 6 12% Insufficient guidance from the U.S. Department of Education; frequent
changes in legislation and program focus 6 12%
Large, rural state; remote locations of local projects 5 10% Difficulties with collaboration 5 10% Identifying areas needing improvement; providing expert assistance to local
projects in all program components 5 10%
Variation in local program operations, staff qualifications, performance 3 6% Efficient application review process; quality of applications 3 6% Note: The percentages are based on 50 states. Each state could indicate one or more responses to an open-ended question.
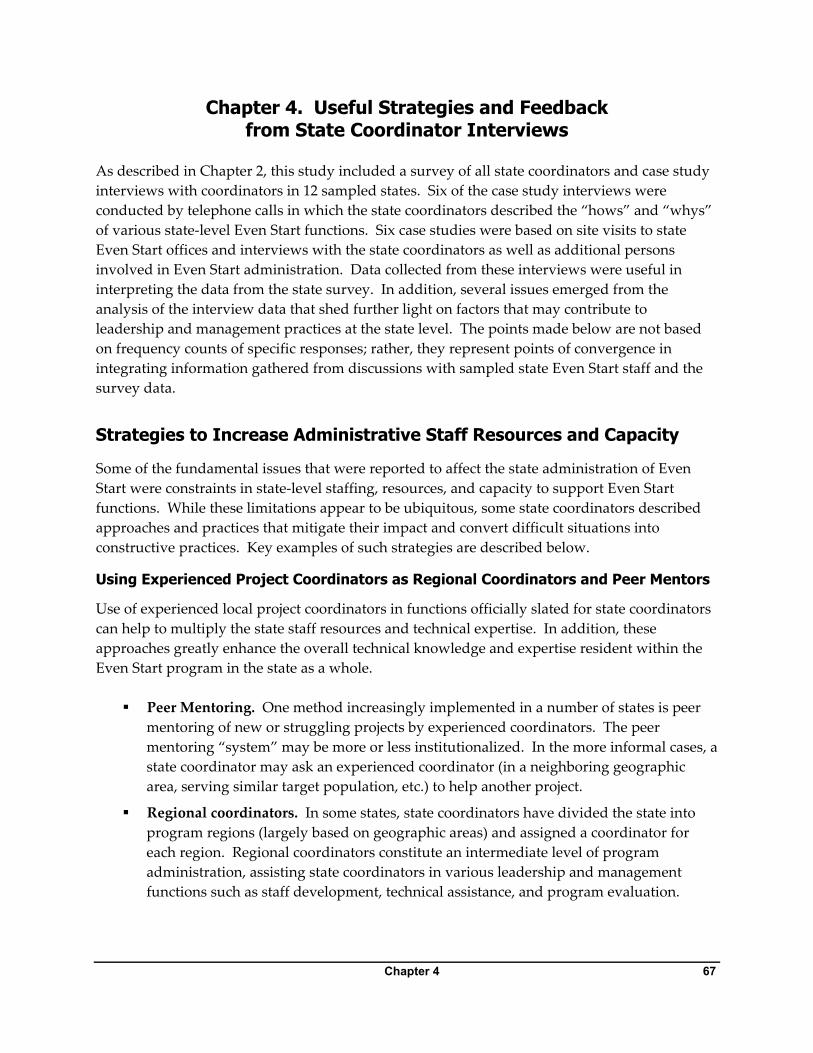
Chapter 4 67
Chapter 4. Useful Strategies and Feedback from State Coordinator Interviews
As described in Chapter 2, this study included a survey of all state coordinators and case study interviews with coordinators in 12 sampled states. Six of the case study interviews were conducted by telephone calls in which the state coordinators described the “hows” and “whys” of various state-level Even Start functions. Six case studies were based on site visits to state Even Start offices and interviews with the state coordinators as well as additional persons involved in Even Start administration. Data collected from these interviews were useful in interpreting the data from the state survey. In addition, several issues emerged from the analysis of the interview data that shed further light on factors that may contribute to leadership and management practices at the state level. The points made below are not based on frequency counts of specific responses; rather, they represent points of convergence in integrating information gathered from discussions with sampled state Even Start staff and the survey data.
Strategies to Increase Administrative Staff Resources and Capacity
Some of the fundamental issues that were reported to affect the state administration of Even Start were constraints in state-level staffing, resources, and capacity to support Even Start functions. While these limitations appear to be ubiquitous, some state coordinators described approaches and practices that mitigate their impact and convert difficult situations into constructive practices. Key examples of such strategies are described below.
Using Experienced Project Coordinators as Regional Coordinators and Peer Mentors
Use of experienced local project coordinators in functions officially slated for state coordinators can help to multiply the state staff resources and technical expertise. In addition, these approaches greatly enhance the overall technical knowledge and expertise resident within the Even Start program in the state as a whole.
Peer Mentoring. One method increasingly implemented in a number of states is peer mentoring of new or struggling projects by experienced coordinators. The peer mentoring “system” may be more or less institutionalized. In the more informal cases, a state coordinator may ask an experienced coordinator (in a neighboring geographic area, serving similar target population, etc.) to help another project.
Regional coordinators. In some states, state coordinators have divided the state into program regions (largely based on geographic areas) and assigned a coordinator for each region. Regional coordinators constitute an intermediate level of program administration, assisting state coordinators in various leadership and management functions such as staff development, technical assistance, and program evaluation.

68 Chapter 4
A Strategy for Using Expertise of Local Project Directors An example of a highly institutionalized peer mentoring practice in one state starts with an RFP released by a state to recruit mentors from a cadre of experienced local coordinators. Mentor selection is based on a careful review of applicants’ past performance as coordinators. New mentors receive two days of training (using a training package developed by veteran peer mentors) and are assigned to work with experienced mentors for one year. Mentors are assigned by the state coordinator to new or struggling projects. In this state, every new project is assigned a mentor; the assignment is officially for one year, but the relationship tends to continue for two years. This state also has a highly institutionalized system of regional coordinators. The regional coordinators are appointed by the state coordinator, based on recommendations by local project directors in the respective regions. (Local directors in this state are familiar with activities and achievements of other projects through participation in numerous regional and state conferences and work groups.) Each regional coordinator serves a two-year term. To ensure the consistency of regional operations over time, each appointee works with the current coordinator before his or her two-year term begins and works with the incoming coordinator for a year after the end of the two-year term. In the spring regional coordinator meeting, each region develops its annual regional plan including the budget for regional activities (about $20,000 per region in the example state). Regional coordinators spend up to 10 percent of their time on regional responsibilities, in addition to directing their own local projects. In the example state, systematically delegating some of the technical leadership responsibilities to regional coordinators allows the state coordinator to devote a large portion of her time to regularly visiting local projects for program monitoring purposes. While this example represents a practice implemented in a geographically large state with a large number of local projects, similar systems of regional program administration that complement state functions are also employed in states with fewer projects.
Oversight and Coordination of Work Performed by External Technical Consultants
Many state coordinators employ the services of external consultants (e.g., technical assistance contractors, university researchers, and educators) to increase the administrative and technical capacity of state Even Start administrative functions. The case study data suggest that the effectiveness of this approach depends greatly on the extent of oversight and control the state coordinator exercises in working with the consultants. In some states, the state coordinator may hire highly capable and experienced consultants to conduct tasks such as technical assistance, staff development, program monitoring, and local evaluation. However, in some cases, there is little interface between the state coordinator and the consultants, weakening the linkage between the grantee selection and funding duties performed by the state coordinator and all other program improvement functions performed by the consultants. Further, in these cases, the state coordinator’s limited knowledge of the grantees constrains his or her ability to make timely, strategic management decisions.

Chapter 4 69
Consultants can be very effective in conducting technical assistance workshops, local and state evaluations, and monitoring local project operations. However, the full impact of these activities for systematic program improvement is not realized until the outcomes of these activities are linked to policy decisions and leadership, which can come only from the state coordinator and state officials above the state coordinator.
Using Technology for Communication
Another strategy by which some states have substantially increased the capacity of state Even Start administration is to maximize the use of technology and advanced electronic modes of communication. Some states are more fortunate than others in securing technical expertise (either within the state education department or through contracting with external organizations and firms) to establish a listserv to facilitate communication among local Even Start projects and state-level Even Start partners. Some states use teleconferencing and video-conferencing technologies to disseminate technical assistance information and program guidance to local projects and grant applicants. While experienced state coordinators agree on the importance of maintaining in-person contact with local projects on a regular basis, a careful use of electronic communication can offset the effects of limited state staff resources to ensure timely program monitoring and guidance activities.
Strategies to Improve the Quality of Services at the Local Level
Educating New Grantees
The experienced state coordinators interviewed stressed the importance of ensuring that all Even Start grant applicants and new grantees know clearly all federal and state requirements for Even Start projects, including the performance indicators and outcome standards. This is the first critical step in their effort to improve program services at the local level. RFAs that delineate clearly all requirements and expectations for local projects are important. Different states employ different ways to provide the initial grantee orientation and guidance, including new grantee training meetings, use of technical assistance consultants, peer mentoring, and technical assistance site visits by state coordinators. In addition to making sure that new grantees understand fully all the program requirements, state coordinators must also advise them of the consequences of a failure to meet the requirements. Some state coordinators interviewed expressed concern about the prospect of having to sanction poorly performing local projects with the implementation of the performance indicators. And some state coordinators stressed the importance of consistently and uniformly applying corrective actions and rules for defunding projects as a way of ensuring high-quality program performance.
Ensuring Grantee Buy-in of the Performance Indicators
Many state coordinators expressed enthusiasm, optimism, and high expectations for the successful implementation of Even Start performance indicators. However, states vary greatly

70 Chapter 4
in the current status of system implementation. They also vary in the extent to which local projects have been actively involved in the design and development of the performance indicator system. Experience of some of the states that are further ahead in system implementation suggests that local projects’ active involvement is essential to achieving a full buy-in and ownership of the system by the local projects. The methods for “active involvement” may involve forming a task force or a work group of local project representatives to review and revise the rules and definitions included in the performance indicator system, such as the target population to be assessed, participation thresholds, selection of assessment tools, the assessment training process, data collection and reporting schedule, and performance standards. Such a task force would also be involved in continual revision and refinement of the performance indicators based on their experiences in using the system. This type of local project task force or work group has been used in a number of the states that participated in the case study interviews. These states encountered minimal reluctance, confusion, and resentment among local projects when the performance indicators were first implemented, as compared to states where local projects had not been involved in every step of the system development. When local projects take ownership of the performance indicator system as their tool to help them operate a high-quality Even Start project, the intended goal of the indicator system is more likely to be realized.
Developing and Enforcing Systematic Procedures to Correct Poor Performance
Further development and refinement of the performance indicator system is expected in many states for several years to come. Along with the further development, states will need to firmly establish clearly stated, systematic procedures to correct poorly performing projects.36 Most states seem to use an iterative corrective process which might include: 1) identification of problems through regular program reports, site visits, and review of local evaluations; 2) provision of intensified technical assistance to strengthen problem areas and increased monitoring by the state staff or consultants; and 3) if these methods fail to improve the level of program performance, defunding the project. While some states appear to be fairly informal in the application of corrective steps, clearly defined rules and consistent application will become increasingly important in the wake of full implementation of performance standards.
Need for Continued Resources to Support Collaboration Efforts
State coordinators emphasized the importance of effective interagency collaboration and the special discretionary federal funds (e.g., the SFLI) to strengthen the state-level partnerships. In 36 The Even Start law requires states to evaluate local programs on their improvement under the state’s indicators of
program quality and allows states to discontinue projects that are failing to show sufficient improvement but only after the states provide technical assistance, a notice, and an opportunity for a hearing.
Chapter 4 71
the early years of Even Start, the priorities for the program were successful implementation of all required program elements. Although the federal priority has shifted toward the educational gains of participants, states and local projects continue to experience challenges in collaboration efforts, a problem coordinators feel undermines their efforts to improve the quality of instructional services. Under the special discretionary SFLI grants, 38 states have received funding to build state-level partnerships to strengthen family literacy services in the state. The SFLI recipient states have used the special funding in many different ways, such as sponsoring a statewide conference to highlight the family literacy approach and promote the development of partnerships, organizing regular meetings of representatives of family literacy-related organizations, promoting joint staff development and technical assistance activities among family literacy-related organizations, funding coordinated state evaluation of family literacy-related programs, and commissioning policy analysis research on how to improve family literacy services in the state. Some state coordinators indicated that the SFLI funding was instrumental in developing an important alliance among related programs, which did not exist before but promises to continue in support of family literacy. Other states have experienced more challenges with few tangible results to date. But most state coordinators interviewed who had received the SFLI grant felt strongly that the effective period of the grant was too short to allow a strong partnership to develop. Coordinators reported that without continued support similar to the SFLI grant, the critical role played by interagency collaboration might gradually weaken, thereby threatening the states’ ability to support continuous program improvement for Even Start. Some state coordinators who chose not to apply for an SFLI grant provided the following reasons for this decision. On one hand, many state coordinators have multiple assignments and play major roles in the administration of various educational programs. These multiple assignments provide a natural foundation for the Even Start coordinator to serve as the coordinating force linking many of these programs into a collaborating team. On the other hand, the additional paperwork, requirements, and need for matching funds involved in obtaining the SFLI grant were disincentives to seeking the SFLI resources.
Need for Continued Federal Input and Assistance
State coordinators, both new and experienced, rely heavily on guidance and communication from the federal Even Start program office to learn about legislative changes and how these changes affect state and local responsibilities. With every new requirement, the legislative language needs to be translated into specific instructions on what is allowed and what is not, in terms of state and local program management practices.

72 Chapter 4
State coordinators stressed the importance, and their appreciation, of programmatic guidance they receive from the federal Even Start office. In particular, state coordinators value the quick responses they get through the Even Start state coordinator listserv on questions concerning statutory requirements. Coordinators greatly value the personal attention they receive when they telephone the federal program office. In addition, state coordinators view the special meetings of state coordinators at the national Even Start conferences as very helpful opportunities to learn from other coordinators, technical consultants, and the federal program staff. The coordinators stressed the importance of continuing the coordinator listserv and further enhancing the content, time allocation, and format of the state coordinator meetings.

Chapter 5 73
Chapter 5. Summary and Implications of the Study The purpose of the Study of State Administration of Even Start was to collect, for the first time, systematic data on states’ practices in administering Even Start at the state level. The time was right for this study, since it came at the juncture of several significant changes in the Even Start program. During the first 10 years of state-administered Even Start, the role of the state coordinators has evolved. Initially, their responsibilities were primarily focused on grant and fiscal management, subgrantee selection, and monitoring program implementation. As the program matured, since the mid-1990s, expectations for their involvement in program evaluation and effectiveness increased. Responding to these new challenges, some state coordinators have adopted systematic program improvement strategies; however, many state coordinators have experienced great frustrations in meeting the new challenges. More recently, after a decade of efforts to develop and refine the Even Start program’s design and services, the federal priority began to shift and to focus more on the educational outcomes of program participants. The shift was accompanied by legislative enforcement (in 2001) of a requirement for the states and local projects to demonstrate program accountability and effectiveness through the implementation of Even Start performance indicators. The increased emphasis on program performance also coincided with a nearly 70 percent increase in the federal Even Start budget (in 2001-02). The budget increase was both a welcome boost and a source of new management challenges to state Even Start administrators, many of whom were suddenly faced with a large number of brand new local grantees. Another notable change was the end of the annual data collection from all local projects that had been conducted since 1990 for the Even Start national evaluation. The national evaluation had provided states with a basis to evaluate state and local program operations against a national benchmark. Because of the tremendous growth in the number of local projects over the years, the national universe data collection was ended after the 2000-01 program year, and responsibility for accountability was shifted to the states via the performance indicator requirement. The implementation of the performance indicator system presented new leadership challenges for many state coordinators. In the context of these changes, which coincided during a two-year period, it is reasonable to expect a gradual transformation of the dynamics holding the federal, state, and local Even Start programs together. Likewise, in this context, systematic information on the state administration of Even Start was needed to assist the federal Even Start office to refine the technical assistance and programmatic guidance it provides to the states. The information was also intended to be useful for state coordinators, many of whom are facing major challenges in administering Even Start in the context of recent program changes.

74 Chapter 5
Through a survey of all state coordinators and in-depth interviews with sampled state Even Start staff, this study examined states’ practices in all major administrative functions. In many areas examined, the study found wide variations in states’ practices. At the same time, the study findings provide a composite picture of the current status of state Even Start administration that can be characterized as follows:
State Even Start infrastructure is typically based on small staff resources.
Input of advisory groups and technical consultants is used to boost staff resources and provide technical expertise.
States have responded to the budget increase by increasing the number of new grantees (as well as giving larger grants to high-quality, existing projects), while making sure to apply rigorous selection criteria to maintain the quality of new grantees.
In making grant award decisions, states focus on local projects’ ability to serve families most in need and to successfully implement the program.
States provide technical assistance to local projects on numerous issues including information regarding grant applications, new grantee orientation; performance indicators, assessment tools and standards; state and local evaluation, data collection and use, software, Web, and database use; program administration in general; collaboration, networking, and other existing literacy services; and program and curriculum standards and expectations.
On-site visits are used as the primary method of monitoring local project operations; these visits recently have begun to include monitoring of participant outcomes as well as program implementation and compliance.
All states planned to collect performance indicator data by the end of 2002 (some states having collected their first performance indicator data before 2002), but many states still face challenges regarding implementation of the performance indicator system.
Many state coordinators are taking an increasingly active, direct role in guiding local evaluation and planning systematic state-level evaluation strategies.
Even the states that appear to have established organized, useful practices and procedures for administering Even Start experience new and continuing challenges. However, this study found creative strategies that some states have devised to bolster their effectiveness in leading the states’ program improvement efforts (e.g., in improving the quality of subgrant applications, provision of technical assistance, monitoring of local project activities, and expanding the state Even Start administrative capacity). As the Even Start program continues to evolve, another major change may be seen in the collaborative partnership between the federal and state Even Start programs, whereby the provision of federal programmatic support for the local projects will increasingly come through the states, based on this partnership. Based on statements made by state coordinators and the

Chapter 5 75
areas of administrative challenges identified in this study, the following types of federal support for the states, in addition to assistance already being provided, would further strengthen the complementary leadership roles played by the federal and state Even Start programs:
Sponsoring a comprehensive clearinghouse of information and materials related to topics such as: Even Start legislative and program guidance documents; family literacy curriculum materials; research-based instructional approaches for early childhood education, adult education, and parenting education; resource materials on child and adult assessments; family literacy staff development resources; and local evaluation approaches. Some national organizations related to family literacy may already provide some of these materials, but a central source from which to link systematically to various sources of information would be a valuable tool for the states and local Even Start projects.
Providing more opportunities for state and local Even Start staff, including their evaluators and technical consultants, to attend high-quality, educational and technical assistance workshops led by national experts. Some states have arranged such workshops on their own or in collaboration with neighboring states. Federal sponsorship of such workshops, perhaps in different regions to minimize staff travel burden and cost, would increase exposure to high-quality training for all states. This type of workshop is offered at national Even Start conferences, but frequently, participants must choose between these and other sessions and activities that are also important for their work.
Expanding the provision of opportunities for state coordinators to work together (as in the State Coordinator Business Meeting in Summer 2002). In these meetings, the federal staff role would be that of sponsor, moderator, and source of statutory guidance and information. State coordinators would take the lead in setting the agenda, presenting effective practices or lessons learned, and conducting collaborative problem solving sessions. The State Coordinator Strand that has been offered at Even Start national conferences fills this need, but it has to compete with other association conference sessions and special activities.
Providing leadership to promote collection of common program and participant data that are comparable across states. Currently, no mechanism exists that allows for valid and reliable cross-state aggregate analyses of program implementation and participant outcomes. It is not practical or necessary to return to federally conducted data collection from all local projects. However, it may be possible to guide and coordinate the performance indicator data collection among states to obtain a certain degree of uniformity in the basic program operations and family participation data collected by states. Ability to conduct systematic reviews of performance indicator implementation and outcomes would not only serve the federal need for national Even Start data but also provide the states with a national benchmark to assess their progress. Further, federal leadership could play a critical role in developing a process by which key

76 Chapter 5
outcome data being collected through the states’ performance indicator systems are compiled to monitor the overall program improvement nationwide.
Clearly, many challenges lie ahead in the efforts to further refine and strengthen Even Start. The current environment of major policy changes sets the stage for significantly enhancing federal-state Even Start teamwork.

References 77
References Bernstein, L., L. Geitz, and B. Gamse (1998). Exploratory study of the effects of early childbearing for Even Start participants. Cambridge, Mass.: Abt Associates Inc. Prepared for the U.S. Department of Education, Planning and Evaluation Service. Dwyer, C. (2001). Guide to quality: Even Start Family Literacy Program: Implementation and continuous improvement, Vol. 1, Revised. Portsmouth, N.H.: RMC Research Corporation. St.Pierre, R. G., A. E. Ricciuti, and C. Creps (1999). Synthesis of state and local Even Start evaluations. Cambridge, Mass.: Abt Associates Inc. Prepared for the U.S. Department of Education, Planning and Evaluation Service. St.Pierre, R. G., A. Ricciuti, F. Tao, C. Creps, J. Swartz, W. Lee, A. Parsad, and T. Rimdzius (2003). Third national Even Start evaluation: Report on program outcomes. Washington, D.C.: U.S. Department of Education, Planning and Evaluation Service. St.Pierre, R. G., J. P. Swartz, B. Gamse, S. Murray, D. Deck, and P. Nickel (1995). National evaluation of the Even Start Family Literacy Program: Final report. Cambridge, Mass.: Abt Associates. Prepared for the U.S. Department of Education, Planning and Evaluation Service. Tao, F., B. Gamse, and H. Tarr (1998). Second national evaluation of the Even Start Family Literacy Program: Final report. Washington, D.C.: U.S. Department of Education, Planning and Evaluation Service.


Appendix


Appendix A: Evaluation Questions, Data Collection and Analysis Methods A-1
Appendix A Evaluation Questions, Data Collection and Analysis Methods
Key: Srv = Survey of Even Start State Coordinators Ph = Telephone Interviews SV = Site Visit Interviews
Data Collection
Methods Analysis Plan Evaluation Questions
Srv Ph SV STATE EVEN START STRUCTURE AND ADMINISTRATION
Administration of the Even Start Program 1. Where is the administration of the Even Start program located within
states? What office receives the Even Start funds?
✔
Number and percent of states by departments/state offices/agencies
2. Has Even Start moved from one state office or agency to another? What were the reasons for the move?
✔ ✔ Number and percent of states in which Even Start office has moved; examples or prevalent patterns of offices involved in transfers
3. How long do state coordinators stay in their position? ✔ Average, median, range of state coordinator tenure 4. How many staff at the state level work on Even Start? ✔ Average number of full time and part time staff per state, by
professional and support staff categories 5. Do state coordinators have duties other than Even Start? If so, what
other duties? What are the benefits and drawbacks of multiple program assignment?
✔ ✔ ✔ Number and percent of state coordinators that have duties other than Even Start; average number of additional responsibilities across states; types of additional responsibilities reported
6. How has the increase in Even Start funding for Program Year 2001-2002 affected the organizational and staffing structures? If so, how?
✔ Description of changes in organizational structures at the state level, prevalent types of changes
7. What percent of the federal Even Start funds is used for state administration of Even Start? Are any of the federal Even Start monies allocated to a consolidated administrative fund?
✔
Average, median, range of percent of federal grant allocated for state use. Average, median, range of percent of federal grant allocated to consolidated administrative fund.
8. What percent of the federal Even Start funds is spent on technical assistance and professional development for local grantees? How are the budget decisions made? How did states decide how to budget/use the Program Year 2001-2002 increased funding?
✔
✔
✔
Average, median, range of percent of federal grant allocated for technical assistance and professional development for local grantees Description of how the budget decisions are made, categorized into prevalent methods, if appropriate
9. What percent of the federal Even Start funds is spent on evaluation? Monitoring?
✔ Average, median, range of percent of federal grant allocated for state evaluation, monitoring of local projects, and each of other uses included in the survey
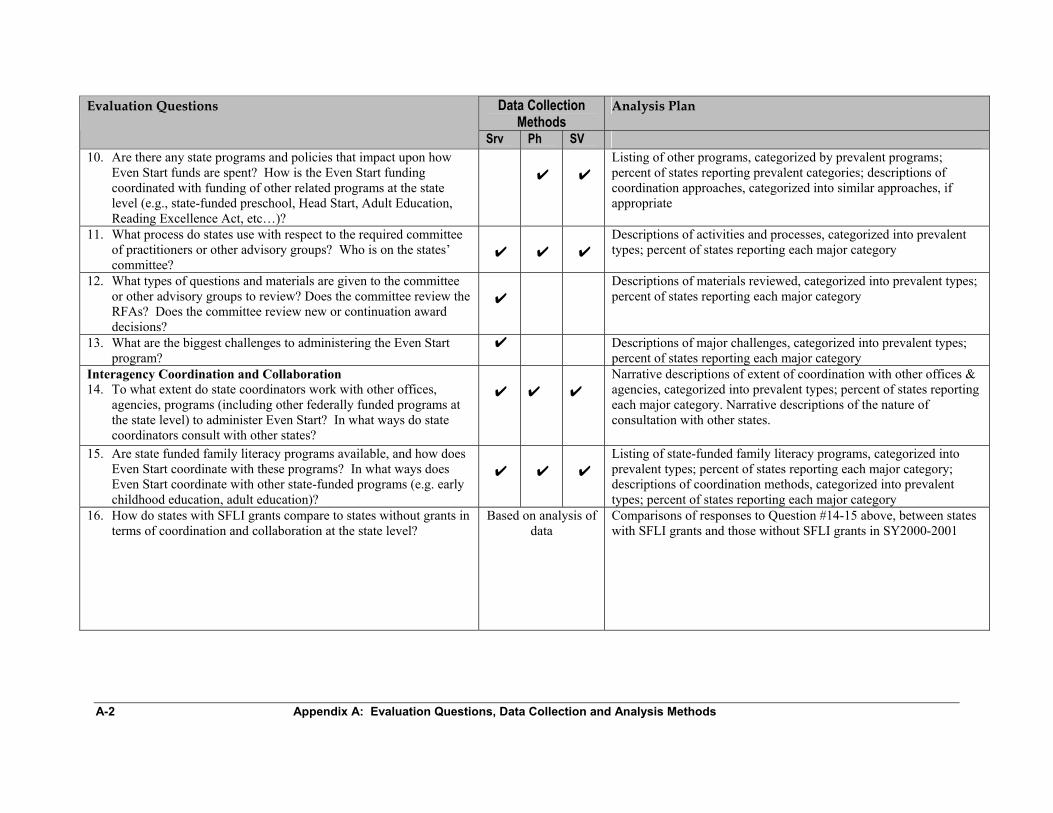
A-2 Appendix A: Evaluation Questions, Data Collection and Analysis Methods
Data Collection Methods
Analysis Plan Evaluation Questions
Srv Ph SV 10. Are there any state programs and policies that impact upon how
Even Start funds are spent? How is the Even Start funding coordinated with funding of other related programs at the state level (e.g., state-funded preschool, Head Start, Adult Education, Reading Excellence Act, etc…)?
✔
✔
Listing of other programs, categorized by prevalent programs; percent of states reporting prevalent categories; descriptions of coordination approaches, categorized into similar approaches, if appropriate
11. What process do states use with respect to the required committee of practitioners or other advisory groups? Who is on the states’ committee?
✔
✔
✔
Descriptions of activities and processes, categorized into prevalent types; percent of states reporting each major category
12. What types of questions and materials are given to the committee or other advisory groups to review? Does the committee review the RFAs? Does the committee review new or continuation award decisions?
✔
Descriptions of materials reviewed, categorized into prevalent types; percent of states reporting each major category
13. What are the biggest challenges to administering the Even Start program?
✔ Descriptions of major challenges, categorized into prevalent types; percent of states reporting each major category
Interagency Coordination and Collaboration 14. To what extent do state coordinators work with other offices,
agencies, programs (including other federally funded programs at the state level) to administer Even Start? In what ways do state coordinators consult with other states?
✔
✔
✔
Narrative descriptions of extent of coordination with other offices & agencies, categorized into prevalent types; percent of states reporting each major category. Narrative descriptions of the nature of consultation with other states.
15. Are state funded family literacy programs available, and how does Even Start coordinate with these programs? In what ways does Even Start coordinate with other state-funded programs (e.g. early childhood education, adult education)?
✔
✔
✔
Listing of state-funded family literacy programs, categorized into prevalent types; percent of states reporting each major category; descriptions of coordination methods, categorized into prevalent types; percent of states reporting each major category
16. How do states with SFLI grants compare to states without grants in terms of coordination and collaboration at the state level?
Based on analysis of data
Comparisons of responses to Question #14-15 above, between states with SFLI grants and those without SFLI grants in SY2000-2001

Appendix A: Evaluation Questions, Data Collection and Analysis Methods A-3
Data Collection Methods
Analysis Plan Evaluation Questions
Srv Ph SV SUBGRANTEE SELECTION State Policies Regarding Even Start Subgrants 1. How many Even Start projects are funded each year? How many
applications (new, continuation, re-competition) do states receive each year? How do states decide on the number of grants to award each year?
✔
✔
✔
Average, median, range of number of projects that applied and were funded in each state in SY1999-2000 and SY 2000-2001 Description of how decisions regarding the number of grant awards are made, categorized into prevalent methods, if appropriate
2. What is the length of the project period? ✔ Average, median, range of typical length of subgrants 3. How many subgrants is the state funding that are beyond 8 years? ✔ Average, median, range of subgrants in SY2001-2002 4. Do states provide technical assistance to local projects with respect
to the matching requirement? Why? Have states granted any waivers of the matching requirement? If so, what process did the states use to grant the waiver(s)? What was the nature of waivers?
✔
✔
✔
Percent of states that provide assistance; description of types of assistance provided, categorized into similar types, if appropriate Descriptions of waivers granted, the process used, and the nature of waivers
5. To what extent do states spread the funding across many projects versus funding a smaller number of projects over a longer period of time? Why?
✔
✔
Descriptions of funding philosophies, categorized into similar approaches, if appropriate
6. How do states ensure a representative distribution of subgrants between urban and rural areas of the state?
✔
Percent of states that use various methods of distributing funds; descriptions of how they accomplish each distribution approach
7. Do the states try to ensure distribution of Even Start funds to various areas within the state? How do states accomplish that?
✔
Percent of states that use various methods of distributing funds; descriptions of how they accomplish each distribution approach
8. How do the states apply the statutory priority regarding empowerment zones and enterprise communities? Do the states add competitive or absolute priorities in their RFAs in addition to the statutory priorities? If so, what?
✔
✔
Percent of states that use various methods of distributing funds; descriptions of how they accomplish each distribution approach; descriptions of priorities specified in RFAs, categorized if appropriate
9. Do states target funding projects to demonstrate certain models or approaches? If so, what approaches are targeted, and why?
✔
✔
Percent of states that fund projects to demonstrate certain models; description of models states fund, categorized if appropriate; percent of states funding prevalent models if appropriate; reasons for targeting certain models
10. Who reviews the applications? What is the review process? ✔
Listing/categorization of reviewers; percent of projects using prevalent categories
11. What is the schedule of annual application review and grant notification process?
✔ Description of common review schedules
12. Do states provide any guidance or technical assistance for applicants? How?
✔ Percent of states that provide guidance; percent of states by types of technical assistance provided
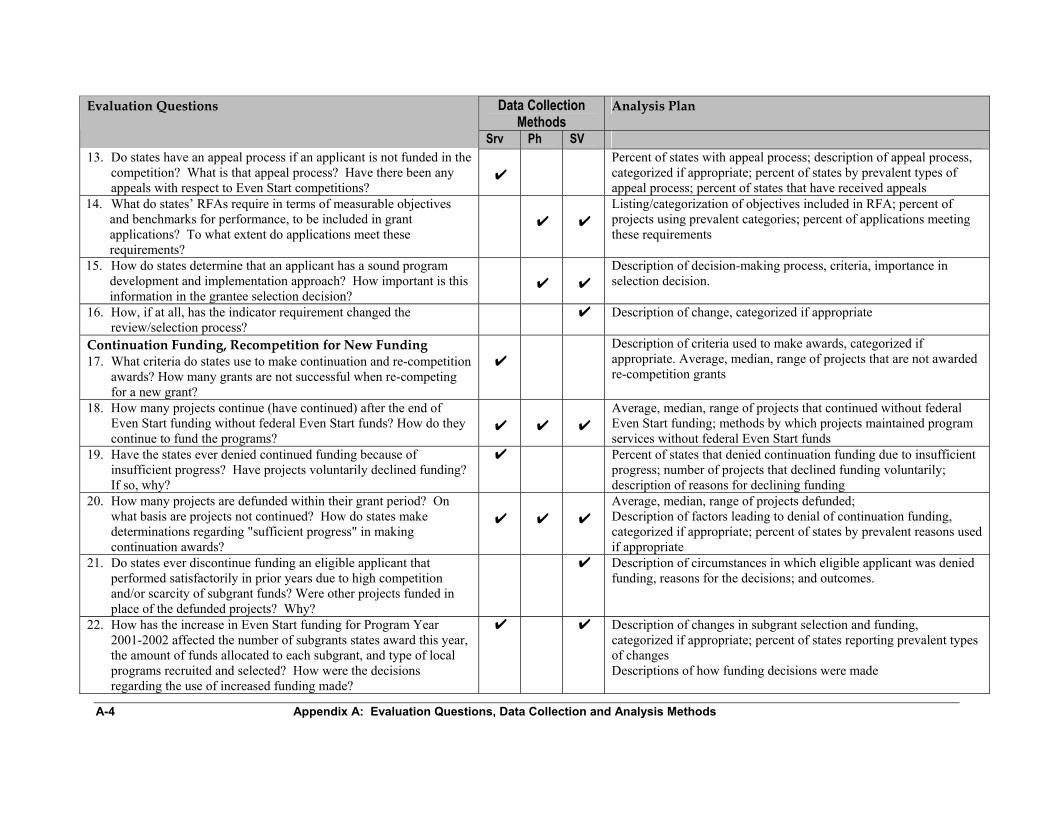
A-4 Appendix A: Evaluation Questions, Data Collection and Analysis Methods
Data Collection Methods
Analysis Plan Evaluation Questions
Srv Ph SV 13. Do states have an appeal process if an applicant is not funded in the
competition? What is that appeal process? Have there been any appeals with respect to Even Start competitions?
✔
Percent of states with appeal process; description of appeal process, categorized if appropriate; percent of states by prevalent types of appeal process; percent of states that have received appeals
14. What do states’ RFAs require in terms of measurable objectives and benchmarks for performance, to be included in grant applications? To what extent do applications meet these requirements?
✔
✔
Listing/categorization of objectives included in RFA; percent of projects using prevalent categories; percent of applications meeting these requirements
15. How do states determine that an applicant has a sound program development and implementation approach? How important is this information in the grantee selection decision?
✔
✔
Description of decision-making process, criteria, importance in selection decision.
16. How, if at all, has the indicator requirement changed the review/selection process?
✔ Description of change, categorized if appropriate
Continuation Funding, Recompetition for New Funding 17. What criteria do states use to make continuation and re-competition
awards? How many grants are not successful when re-competing for a new grant?
✔
Description of criteria used to make awards, categorized if appropriate. Average, median, range of projects that are not awarded re-competition grants
18. How many projects continue (have continued) after the end of Even Start funding without federal Even Start funds? How do they continue to fund the programs?
✔
✔
✔
Average, median, range of projects that continued without federal Even Start funding; methods by which projects maintained program services without federal Even Start funds
19. Have the states ever denied continued funding because of insufficient progress? Have projects voluntarily declined funding? If so, why?
✔ Percent of states that denied continuation funding due to insufficient progress; number of projects that declined funding voluntarily; description of reasons for declining funding
20. How many projects are defunded within their grant period? On what basis are projects not continued? How do states make determinations regarding "sufficient progress" in making continuation awards?
✔
✔
✔
Average, median, range of projects defunded; Description of factors leading to denial of continuation funding, categorized if appropriate; percent of states by prevalent reasons used if appropriate
21. Do states ever discontinue funding an eligible applicant that performed satisfactorily in prior years due to high competition and/or scarcity of subgrant funds? Were other projects funded in place of the defunded projects? Why?
✔ Description of circumstances in which eligible applicant was denied funding, reasons for the decisions; and outcomes.
22. How has the increase in Even Start funding for Program Year 2001-2002 affected the number of subgrants states award this year, the amount of funds allocated to each subgrant, and type of local programs recruited and selected? How were the decisions regarding the use of increased funding made?
✔ ✔ Description of changes in subgrant selection and funding, categorized if appropriate; percent of states reporting prevalent types of changes Descriptions of how funding decisions were made
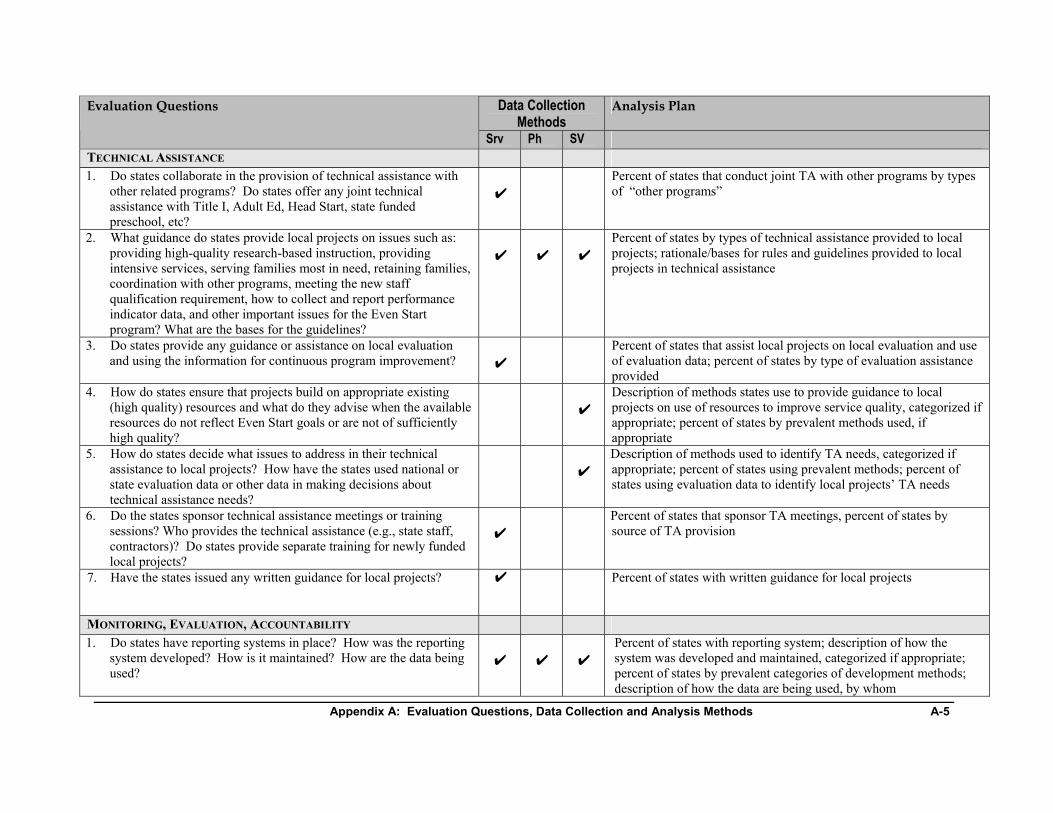
Appendix A: Evaluation Questions, Data Collection and Analysis Methods A-5
Data Collection Methods
Analysis Plan Evaluation Questions
Srv Ph SV TECHNICAL ASSISTANCE 1. Do states collaborate in the provision of technical assistance with
other related programs? Do states offer any joint technical assistance with Title I, Adult Ed, Head Start, state funded preschool, etc?
✔
Percent of states that conduct joint TA with other programs by types of “other programs”
2. What guidance do states provide local projects on issues such as: providing high-quality research-based instruction, providing intensive services, serving families most in need, retaining families, coordination with other programs, meeting the new staff qualification requirement, how to collect and report performance indicator data, and other important issues for the Even Start program? What are the bases for the guidelines?
✔
✔
✔
Percent of states by types of technical assistance provided to local projects; rationale/bases for rules and guidelines provided to local projects in technical assistance
3. Do states provide any guidance or assistance on local evaluation and using the information for continuous program improvement?
✔
Percent of states that assist local projects on local evaluation and use of evaluation data; percent of states by type of evaluation assistance provided
4. How do states ensure that projects build on appropriate existing (high quality) resources and what do they advise when the available resources do not reflect Even Start goals or are not of sufficiently high quality?
✔
Description of methods states use to provide guidance to local projects on use of resources to improve service quality, categorized if appropriate; percent of states by prevalent methods used, if appropriate
5. How do states decide what issues to address in their technical assistance to local projects? How have the states used national or state evaluation data or other data in making decisions about technical assistance needs?
✔
Description of methods used to identify TA needs, categorized if appropriate; percent of states using prevalent methods; percent of states using evaluation data to identify local projects’ TA needs
6. Do the states sponsor technical assistance meetings or training sessions? Who provides the technical assistance (e.g., state staff, contractors)? Do states provide separate training for newly funded local projects?
✔
Percent of states that sponsor TA meetings, percent of states by source of TA provision
7. Have the states issued any written guidance for local projects?
✔ Percent of states with written guidance for local projects
MONITORING, EVALUATION, ACCOUNTABILITY 1. Do states have reporting systems in place? How was the reporting
system developed? How is it maintained? How are the data being used?
✔
✔
✔
Percent of states with reporting system; description of how the system was developed and maintained, categorized if appropriate; percent of states by prevalent categories of development methods; description of how the data are being used, by whom
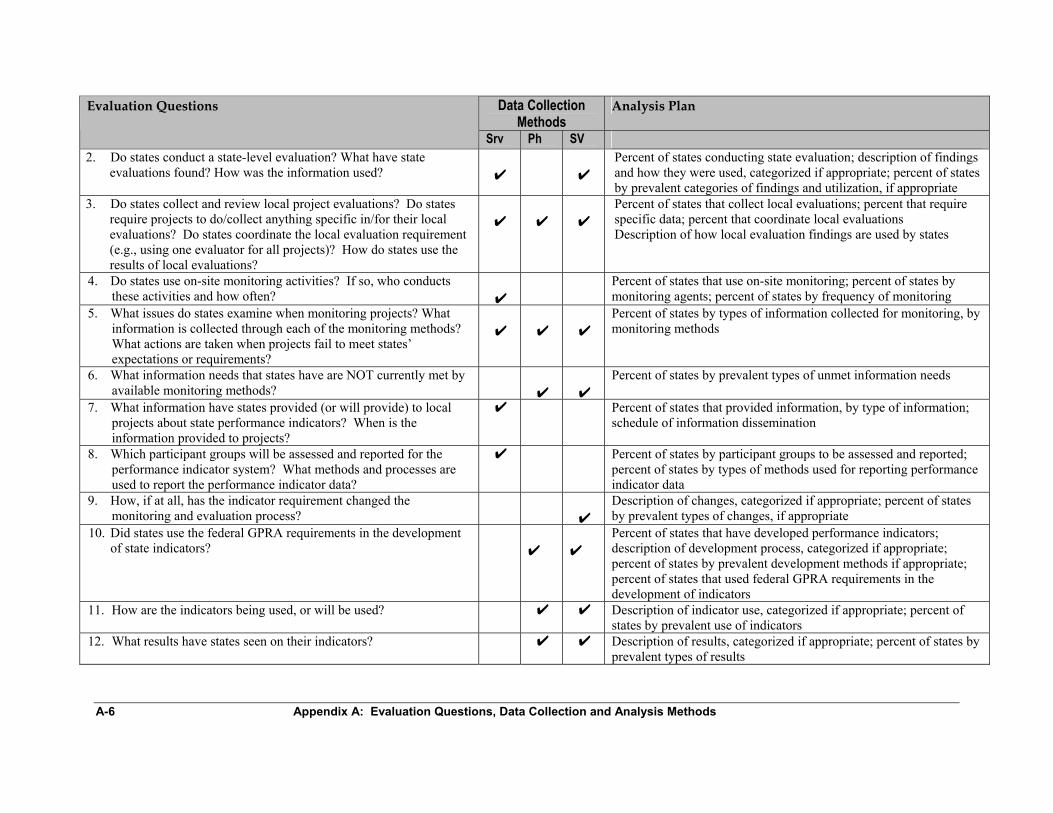
A-6 Appendix A: Evaluation Questions, Data Collection and Analysis Methods
Data Collection Methods
Analysis Plan Evaluation Questions
Srv Ph SV 2. Do states conduct a state-level evaluation? What have state
evaluations found? How was the information used?
✔
✔ Percent of states conducting state evaluation; description of findings and how they were used, categorized if appropriate; percent of states by prevalent categories of findings and utilization, if appropriate
3. Do states collect and review local project evaluations? Do states require projects to do/collect anything specific in/for their local evaluations? Do states coordinate the local evaluation requirement (e.g., using one evaluator for all projects)? How do states use the results of local evaluations?
✔
✔
✔
Percent of states that collect local evaluations; percent that require specific data; percent that coordinate local evaluations Description of how local evaluation findings are used by states
4. Do states use on-site monitoring activities? If so, who conducts these activities and how often?
✔
Percent of states that use on-site monitoring; percent of states by monitoring agents; percent of states by frequency of monitoring
5. What issues do states examine when monitoring projects? What information is collected through each of the monitoring methods? What actions are taken when projects fail to meet states’ expectations or requirements?
✔
✔
✔
Percent of states by types of information collected for monitoring, by monitoring methods
6. What information needs that states have are NOT currently met by available monitoring methods?
✔
✔
Percent of states by prevalent types of unmet information needs
7. What information have states provided (or will provide) to local projects about state performance indicators? When is the information provided to projects?
✔ Percent of states that provided information, by type of information; schedule of information dissemination
8. Which participant groups will be assessed and reported for the performance indicator system? What methods and processes are used to report the performance indicator data?
✔ Percent of states by participant groups to be assessed and reported; percent of states by types of methods used for reporting performance indicator data
9. How, if at all, has the indicator requirement changed the monitoring and evaluation process?
✔
Description of changes, categorized if appropriate; percent of states by prevalent types of changes, if appropriate
10. Did states use the federal GPRA requirements in the development of state indicators?
✔
✔
Percent of states that have developed performance indicators; description of development process, categorized if appropriate; percent of states by prevalent development methods if appropriate; percent of states that used federal GPRA requirements in the development of indicators
11. How are the indicators being used, or will be used? ✔ ✔ Description of indicator use, categorized if appropriate; percent of states by prevalent use of indicators
12. What results have states seen on their indicators? ✔ ✔ Description of results, categorized if appropriate; percent of states by prevalent types of results
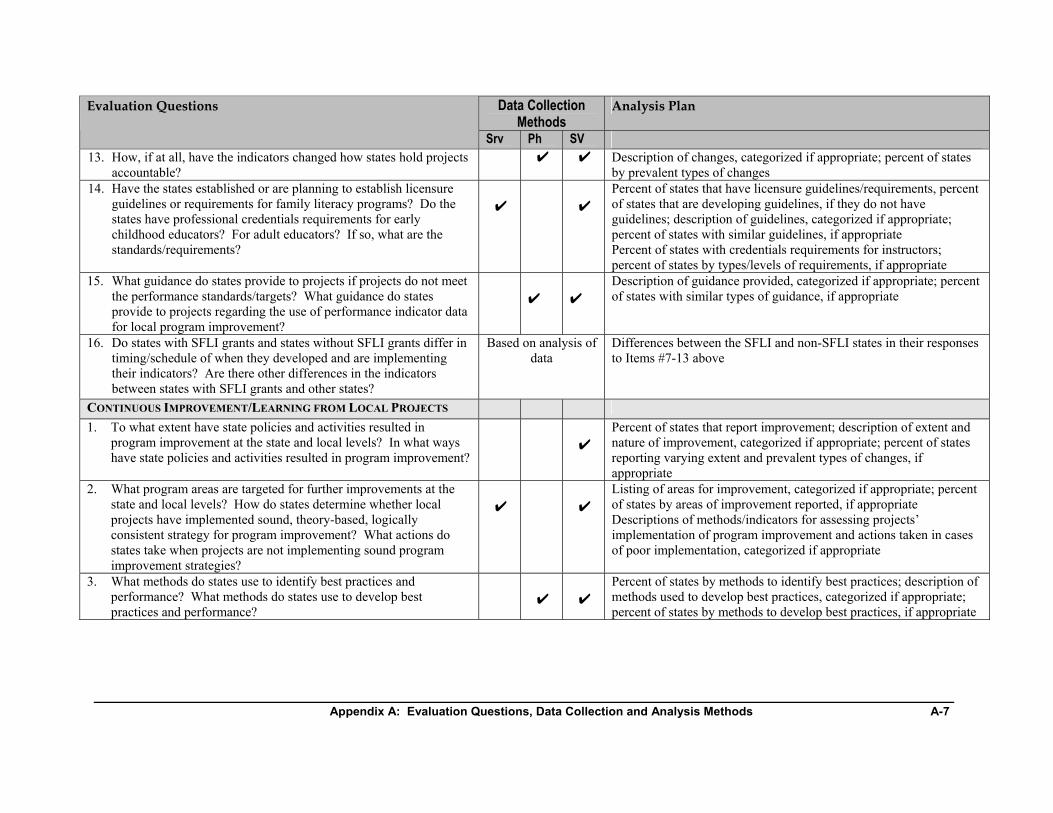
Appendix A: Evaluation Questions, Data Collection and Analysis Methods A-7
Data Collection Methods
Analysis Plan Evaluation Questions
Srv Ph SV 13. How, if at all, have the indicators changed how states hold projects
accountable? ✔ ✔ Description of changes, categorized if appropriate; percent of states
by prevalent types of changes 14. Have the states established or are planning to establish licensure
guidelines or requirements for family literacy programs? Do the states have professional credentials requirements for early childhood educators? For adult educators? If so, what are the standards/requirements?
✔
✔
Percent of states that have licensure guidelines/requirements, percent of states that are developing guidelines, if they do not have guidelines; description of guidelines, categorized if appropriate; percent of states with similar guidelines, if appropriate Percent of states with credentials requirements for instructors; percent of states by types/levels of requirements, if appropriate
15. What guidance do states provide to projects if projects do not meet the performance standards/targets? What guidance do states provide to projects regarding the use of performance indicator data for local program improvement?
✔
✔
Description of guidance provided, categorized if appropriate; percent of states with similar types of guidance, if appropriate
16. Do states with SFLI grants and states without SFLI grants differ in timing/schedule of when they developed and are implementing their indicators? Are there other differences in the indicators between states with SFLI grants and other states?
Based on analysis of data
Differences between the SFLI and non-SFLI states in their responses to Items #7-13 above
CONTINUOUS IMPROVEMENT/LEARNING FROM LOCAL PROJECTS 1. To what extent have state policies and activities resulted in
program improvement at the state and local levels? In what ways have state policies and activities resulted in program improvement?
✔
Percent of states that report improvement; description of extent and nature of improvement, categorized if appropriate; percent of states reporting varying extent and prevalent types of changes, if appropriate
2. What program areas are targeted for further improvements at the state and local levels? How do states determine whether local projects have implemented sound, theory-based, logically consistent strategy for program improvement? What actions do states take when projects are not implementing sound program improvement strategies?
✔
✔
Listing of areas for improvement, categorized if appropriate; percent of states by areas of improvement reported, if appropriate Descriptions of methods/indicators for assessing projects’ implementation of program improvement and actions taken in cases of poor implementation, categorized if appropriate
3. What methods do states use to identify best practices and performance? What methods do states use to develop best practices and performance?
✔
✔
Percent of states by methods to identify best practices; description of methods used to develop best practices, categorized if appropriate; percent of states by methods to develop best practices, if appropriate
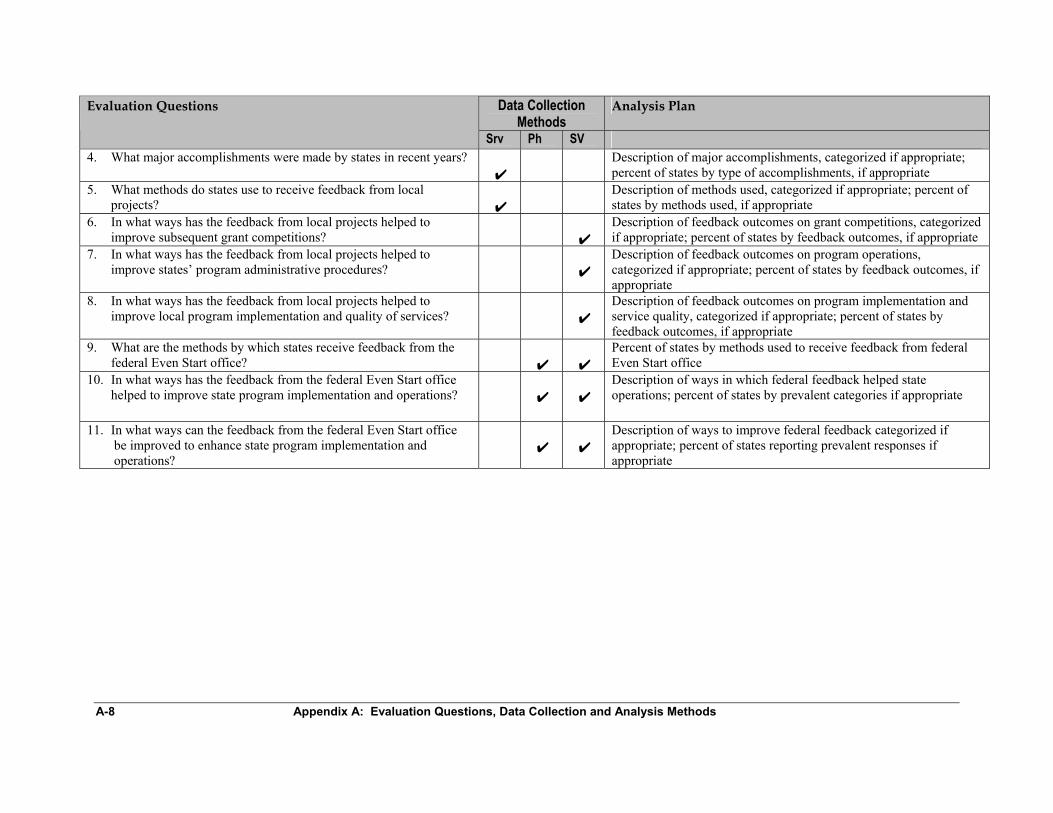
A-8 Appendix A: Evaluation Questions, Data Collection and Analysis Methods
Data Collection Methods
Analysis Plan Evaluation Questions
Srv Ph SV 4. What major accomplishments were made by states in recent years?
✔ Description of major accomplishments, categorized if appropriate;
percent of states by type of accomplishments, if appropriate 5. What methods do states use to receive feedback from local
projects?
✔ Description of methods used, categorized if appropriate; percent of
states by methods used, if appropriate 6. In what ways has the feedback from local projects helped to
improve subsequent grant competitions?
✔ Description of feedback outcomes on grant competitions, categorized if appropriate; percent of states by feedback outcomes, if appropriate
7. In what ways has the feedback from local projects helped to improve states’ program administrative procedures?
✔
Description of feedback outcomes on program operations, categorized if appropriate; percent of states by feedback outcomes, if appropriate
8. In what ways has the feedback from local projects helped to improve local program implementation and quality of services?
✔
Description of feedback outcomes on program implementation and service quality, categorized if appropriate; percent of states by feedback outcomes, if appropriate
9. What are the methods by which states receive feedback from the federal Even Start office?
✔
✔
Percent of states by methods used to receive feedback from federal Even Start office
10. In what ways has the feedback from the federal Even Start office helped to improve state program implementation and operations?
✔
✔
Description of ways in which federal feedback helped state operations; percent of states by prevalent categories if appropriate
11. In what ways can the feedback from the federal Even Start office be improved to enhance state program implementation and operations?
✔
✔
Description of ways to improve federal feedback categorized if appropriate; percent of states reporting prevalent responses if appropriate

Appendix B: Case Study Sample Design and Selection B-1
Appendix B Case Study Sample Design and Selection
The case study interviews were conducted through: (1) telephone interviews with a sample of six state coordinators and (2) site visits to an additional six states. The states to be included in the case study interviews were selected purposively with an effort to include a cross section of states in terms of program characteristics that were: (1) expected to influence how Even Start is administered at the state level, and (2) related to the special focus of this study (e.g., the implementation of performance indicators). To select a total of 12 states (six for telephone interviews and six for site visits), we first applied the following three selection criteria:
1. “Size” of the state program in terms of the number of local projects awarded in Program Year 2001-02. We reviewed the distribution of the number of local projects that states awarded in summer or fall 2001 based on the data collected by Abt Associates for the Even Start national evaluation. Twenty-five percent of all states had four to seven projects each, and they were designated as “small.” Fifty percent of states had 8 to 22 projects each, and they were designated as “medium.” The remaining 25 percent” of states had 24 to 101 projects each, and they were designated as “large.” Within the top 25 percent, three largest states (California, Texas, and New York) had 101, 86, and 70 projects. All other states within this group had no more than 51 projects.
We selected four “large,” six “medium,” and two “small” states. Four states were selected from the “top 25 percent or large” states that were likely to have more complex administrative structures and procedures. With the substantial increase in the 2001-02 Even Start funding, the number of projects within each state was expected to rise. Information from the states that had already operated a relatively large number of projects would be useful in anticipating the experiences of other states that may award more projects in the coming years. One of the four “large” states was from the three largest states to learn how they manage a very large number of projects. There may be special issues and challenges in program management when the number of subgrantees exceeds a certain level. The “very large” states may have developed ways to address these problems. These are the issues we planned to include in interviewing these states.
Given the prevalence of states with 8 to 22 projects, we selected 50 percent of the interview sample (six states) from this group. Finally, the two “small” states were to provide information on the advantages and disadvantages at the state level of administering a program that affects relatively few school districts and local agencies.
2. Receipt of Statewide Family Literacy Initiative (SFLI) grants from 1997-01. As of 2001,
36 states (69 percent) had received an SFLI grant. This grant provides discretionary federal funds to assist state education agencies to form inter- and intra-agency partnerships that collaborate on building and improving family literacy services in the states. We selected nine SFLI states and three non-SFLI states. We were interested in how SFLI recipients have developed family literacy partnerships and how this has affected the state administration of Even Start. While non-SFLI states constitute a

B-2 Appendix B: Case Study Sample Design and Selection
minority of the states, we were also interested in how they address the issues of inter-agency coordination and collaboration, compared to the SFLI states.
3. Administrative structure and affiliation. Within each “sample cell” defined above, to the extent possible, we tried to distribute the sample states according to whether Even Start is “attached to” or “administered within” the states’ Adult Education (AE) unit, the Early Childhood (ECE), or K-12 unit. Information about the AE, ECE, or K-12 affiliation came from the Survey of Even Start State Coordinators and ED’s Even Start state coordinator directory.
Beyond these three sampling factors, we also considered whether or not a state has developed an evaluation or program management database system that is used to collect data from local projects. From states with such a database, we hoped to obtain information on how the system was developed, is maintained, and is used. This information would be useful for states that are currently in the process of designing program management information systems. Information about the existence of a database came from the Survey of Even Start State Coordinators. Last, in cases where there were more than one equally “eligible” states from which to choose, we took into account the region of the country. While regional distribution of the 12 selected states was not a critical issue for this study, to the extent possible, we selected some states from all areas of the country. Based on these selection steps, the following states were selected and agreed to participate in the Case Study interviews: Telephone interviews:
Kansas (Medium, non-SFLI, ECE, Central) Mississippi (Medium, SFLI, ECE, South) Montana (Small, SFLI, ECE, Central/West) New Mexico (Medium size, non-SFLI, ECE, West) Oregon (Medium, SFLI, Adult Ed, West) South Dakota (Small, non-SFLI, ECE, West)
Site visits: Connecticut (Medium, SFLI, Adult Ed, East) Michigan (Large, SFLI, ECE, Central) Missouri (Medium, SFLI, ECE, Central) New York (Very Large, SFLI, Adult Ed, East) Pennsylvania (Large, SFLI, Adult Ed, East) Tennessee (Large, SFLI, ECE, South)