Evapotranspiration of irrigated and rainfed maize–soybean cropping systems
11
University of Nebraska - Lincoln DigitalCommons@University of Nebraska - Lincoln Papers in Natural Resources Natural Resources, School of 3-2009 Evapotranspiration of irrigated and rainfed maize–soybean cropping systems Andrew E. Suyker University of Nebraska - Lincoln, [email protected] Shashi Verma University of Nebraska - Lincoln, [email protected] Follow this and additional works at: hp://digitalcommons.unl.edu/natrespapers Part of the Natural Resources and Conservation Commons is Article is brought to you for free and open access by the Natural Resources, School of at DigitalCommons@University of Nebraska - Lincoln. It has been accepted for inclusion in Papers in Natural Resources by an authorized administrator of DigitalCommons@University of Nebraska - Lincoln. Suyker, Andrew E. and Verma, Shashi, "Evapotranspiration of irrigated and rainfed maize–soybean cropping systems" (2009). Papers in Natural Resources. 197. hp://digitalcommons.unl.edu/natrespapers/197
Transcript of Evapotranspiration of irrigated and rainfed maize–soybean cropping systems

University of Nebraska - LincolnDigitalCommons@University of Nebraska - Lincoln
Papers in Natural Resources Natural Resources, School of
3-2009
Evapotranspiration of irrigated and rainfedmaize–soybean cropping systemsAndrew E. SuykerUniversity of Nebraska - Lincoln, [email protected]
Shashi VermaUniversity of Nebraska - Lincoln, [email protected]
Follow this and additional works at: http://digitalcommons.unl.edu/natrespapers
Part of the Natural Resources and Conservation Commons
This Article is brought to you for free and open access by the Natural Resources, School of at DigitalCommons@University of Nebraska - Lincoln. Ithas been accepted for inclusion in Papers in Natural Resources by an authorized administrator of DigitalCommons@University of Nebraska - Lincoln.
Suyker, Andrew E. and Verma, Shashi, "Evapotranspiration of irrigated and rainfed maize–soybean cropping systems" (2009). Papers inNatural Resources. 197.http://digitalcommons.unl.edu/natrespapers/197
1. Introduction
Water and its movement through the soil–plant–atmo-sphere continuum is one of the most important factors affect-ing crop productivity (e.g., Boyer, 1982). For maize–soybean systems, extensive research has been conducted on the im-pact of water-related stress on crop development and yield (e.g., Denmead and Shaw, 1960; Musick and Dusek, 1980). The importance of evapotranspiration (ET) as a major com-
ponent of the agricultural water budget increases as water resources become limiting due to factors such as (a) potential climate change, (b) population growth, (c) competition from other water users, (d) drought, and (e) water quality degra-dation (e.g., Farahani et al., 2007). Furthermore, large evapo-transpiration rates in agricultural regions can be an impor-tant factor which influences the regional climate (e.g., Shukla and Mintz, 1982). Future climatic conditions are likely to lead to an increase in evapotranspiration causing regional soil
Published in Agricultural and Forest Meteorology 149:3-4 (March 11, 2009), pp. 443–452; doi: 10.1016/j.agrformet.2008.09.010 Published by Elsevier Ltd. Used by permission. http://www.elsevier.com/locate/agrformet
Submitted December 16, 2007; revised July 6, 2008; accepted September 22, 2008; published online November 5, 2008.
Evapotranspiration of irrigated and rainfed maize–soybean cropping systems
Andrew E. Suyker and Shashi B. Verma
School of Natural Resources, University of Nebraska–Lincoln, Lincoln, NE 68583-0978, USA
Corresponding author — A. E. Suyker, School of Natural Resources, 806 Hardin Hall, University of Nebraska, Lincoln, NE 68583-0968, USA; tel 402 472-2168, fax 402 472-2946, email [email protected]
AbstractWe have been making year-round measurements of mass and energy exchange in three cropping systems: (a) ir-rigated continuous maize, (b) irrigated maize–soybean rotation, and (c) rainfed maize–soybean rotation in east-ern Nebraska since 2001. In this paper, we present results on evapotranspiration (ET) of these crops for the first 5 years of our study. Growing season ET in the irrigated and rainfed maize averaged 548 and 482 mm, respec-tively. In irrigated and rainfed soybean, the average growing season ET was 452 and 431 mm, respectively. On average, the maize ET was higher than the soybean ET by 18% for irrigated crops and by 11% for rainfed crops. The mid-season crop coefficient Kc (=ET/ET0 and ET0 is the reference ET) for irrigated maize was 1.03 ± 0.07. For rainfed maize, significant dry-down conditions prevailed and mid-season Kc was 0.84 ± 0.20. For irrigated soy-bean, the mid-season Kc was 0.98 ± 0.02. The mid-season dry down in rainfed soybean years was not severe and the Kc (0.90 ± 0.13) was only slightly lower than the values for the irrigated fields. Non-growing season evapora-tion ranged from 100 to 172 mm and contributed about 16–28% of the annual ET in irrigated/rainfed maize and 24–26% in irrigated/rainfed soybean. The amount of surface mulch biomass explained 71% of the variability in non-growing season evaporation totals. Water use efficiency (or biomass transpiration efficiency), defined as the ratio of total plant biomass (YDM) to growing season transpiration (T) was 5.20 ± 0.34 and 5.22 ± 0.36 g kg−1, respectively for irrigated and rainfed maize crops. Similarly, the biomass transpiration efficiency for irrigated and rainfed soybean crops was 3.21 ± 0.35 and 2.96 ± 0.30 g kg−1. Thus, the respective biomass transpiration effi-ciency of these crops was nearly constant regardless of rainfall and irrigation.
Keywords: evapotranspiration, crop coefficient, water use efficiency, maize, corn, soybean, irrigation, rainfed
443

444 Suy k e r an d Ver ma i n Ag r i c ul tu r A l A nd For e s t Me teo r ol og y 149 (2009)
moisture deficits in the Midwest (e.g., Easterling and Karl, 2001), thus affecting crop production in the region [ http://www.gcrio.org/CONSEQUENCES/summer95/agriculture.html ].
In recent years, widespread droughts have been reported in the Great Plains [ http://lwf.ncdc.noaa.gov/oa/reports/billionz.html#chron ]. During the past 7 years, Nebraska has been experiencing local and regional drought conditions [ http://www.hprcc.unl.edu/nebraska/nebraska--JAN1999-AUG2006 drought.html ]. In 2006, a severe spring/summer drought centered over the Great Plains region caused an es-timated 6 billion dollars in damages. Such drought con-ditions put a great deal of stress on water resources in ag-ricultural areas of the Midwest, especially irrigated regions through decreased water supply and greater pumping costs (e.g., Bowman and Collins, 1987).
In view of potential future shortages of water needed for agricultural production, more attention needs to be given to quantifying and improving water use efficiency (WUE). The WUE is generally defined (e.g., Steduto, 1996) as the ratio of biomass (or yield or photosynthesis) to water con-sumed in transpiration (or evapotranspiration). Because of the multiple ways WUE has been used in the literature, cau-tion should be exercised in comparing results from different studies. Different soil/crop management practices are being assessed to improve water use efficiency in crop production (e.g., Hatfield et al., 2001). No-till management practices and better crop residue management can potentially reduce wa-ter lost through soil evaporation (e.g., Wilhelm et al., 2004; Ji and Unger, 2001; Sauer et al., 1998).
Recent studies have pointed out the important roles of the non-growing season or fallow periods in relation to the flow of energy, carbon and water in agricultural ecosystems (Kucharik and Twine, 2007). Such analyses are crucial in view of the globally expanding biofuel industry. For exam-ple, the USDA ARS has initiated studies [ http://www.ars.usda.gov/research/projects/projects.htm?ACCN_NO=410653&showpars=true&fy=2006 ] with key objectives of deter-mining sustainable removal of residues that would otherwise be left in the field so as not to (a) degrade the productivity of the land, (b) decrease soil organic matter, (c) diminish water quality, or (d) result in net carbon emissions (Graham et al., 2007). Long-term, continuous field measurements of mass and energy exchange are needed in agricultural crops with contrasting management practices to enhance our knowl-edge of evapotranspiration to help address these issues of significant scientific and economic importance.
Here we discuss year-round eddy covariance flux mea-surements of water vapor in three cropping systems (irri-gated continuous maize, irrigated maize–soybean rotation, and rainfed maize–soybean rotation) in eastern Nebraska over a 5-year period. The primary objective of this study is to quantify evapotranspiration in these key agroecosystems and evaluate the contributions of growing season and non-growing season periods to the annual ET totals. Growing season distributions of the crop coefficient (Kc) are quan-tified. The role of surface mulch biomass is considered in examining the interannual variability of non-growing sea-son evaporation. Also, water use efficiency of these crops is quantified.
2. Materials and methods
2.1. Study sites
The three study sites are located within 1.6 km of each other at the University of Nebraska Agricultural Research and Development Center near Mead, NE. These sites are large production fields, each 49–65 ha, that provide sufficient up-wind fetch of uniform cover required for adequately mea-suring mass and energy fluxes using tower eddy covariance systems. One site (ICM: 41°09′54.2″N, 96°28′35.9″W, 361 m) is equipped with center pivot irrigation and is planted in contin-uous maize. The second site (IMS: 41°09′53.5″N, 96°28′12.3″W, 362 m), also equipped with center pivot irrigation is planted in maize–soybean rotation. The third site (RMS: 41°10′46.8″N, 96°26′22.7″W, 362 m) relies on rainfall and is planted in maize–soybean rotation. Prior to initiation of the study, the irrigated sites (ICM and IMS) had a 10-year history of maize–soybean rotation under no-till. The rainfed site (RMS) had a variable cropping history of primarily wheat, soybean, oats, and maize grown in 2–4 ha plots with tillage. All three sites were uni-formly tilled by disking prior to the beginning of the study to homogenize the top 0.1 m of soil and incorporate P and K fertilizers, as well as previously accumulated surface resi-dues. The soils are deep silty clay loams, typical of eastern Nebraska, consisting of four soil series at all three sites: Yu-tan (fine-silty, mixed, superactive, mesic Mollic Hapludalfs), Tomek (fine, smectitic, mesic Pachic Argialbolls), Filbert (fine, smectitic, mesic Vertic Argialbolls), and Filmore (fine, smec-titic, mesic Vertic Argialbolls).
Since initiation in 2001, all fields have been under no-till (except ICM in 2005). Crop management practices (i.e., plant populations, herbicide and pesticide applications, irrigation) have been employed in accordance with standard best man-agement practices (BMPs) prescribed for production-scale maize–soybean systems. Results from the first 4 years doc-umented declining yields with continuous irrigated maize (ICM) because of difficulties in achieving uniform and ade-quate plant populations due to the heavy litter layer that im-peded the sowing operation, greater immobilization of fer-tilizer N reducing fertilizer N use efficiency, and increasing incidence and severity of insect and disease damage. The lat-ter is a common problem in continuous maize that is wors-ened when large amounts of crop residue litter remains on the soil surface (e.g., Bockus and Shroyer, 1998; Steffey et al., 1999). To address these constraints in our continuous irri-gated maize system (ICM), starting in the autumn of 2005, we began to utilize a conservation-plow that does not com-pletely invert the topsoil layer as happens with conventional plowing. The conservation-plow minimizes soil distur-bance by vertically distributing about 2/3 of the crop residue within the surface 0.2–0.25 m depth, while 1/3 remains on the soil surface. A small dose of N fertilizer is applied to the maize residue before the post harvest conservation-plowing operation. Table 1 summarizes major crop management in-formation (including the dates of planting and harvest, culti-vars planted, mulch biomass, and crop yields) for the study period. Following best management practices, to account for differences in water-limited attainable yield, lower planting densities were used in rainfed crops (RMS) as compared to

eV ap o tr a n S p i r ati o n o f i r r i g ated an d r ai n f e d mai z e–S o y b ea n c r o p p i n g S y S tem S 445
the irrigated crops (ICM and IMS). Nitrogen (N) was applied in the irrigated maize in three applications and a single N fertilizer application was made to maize in the rainfed sys-tem. No additional N was applied in the soybean years in 2002 and 2004.
2.2. Eddy covariance flux measurements
Our measurements began just after planting time in 2001. Eddy covariance measurements (e.g., Baldocchi et al., 1988) of fluxes of latent heat (LE), sensible heat (H), and momen-tum were made using the following sensors at each site: an omnidirectional 3D sonic anemometer (Model R3: Gill In-struments Ltd., Lymington, UK), and an open-path infrared CO2/H2O gas analyzing system (Model LI7500: Li-Cor Inc., Lincoln, NE). To have sufficient fetch (in all directions) rep-resentative of the cropping systems being studied, the eddy covariance sensors were mounted 3.0 m above the ground when the canopy was shorter than 1 m, and later moved to a height of 6.0 m until harvest (maize only). Fluxes were cor-rected for inadequate sensor frequency response (Moore, 1986; Massman, 1991; Suyker and Verma, 1993]; in conjunc-tion with cospectra calculated from this study). Fluxes were adjusted for the variation in air density due to the transfer of water vapor and sensible heat (e.g., Webb et al., 1980). More details of the measurements and calculations are given in a previous paper (Suyker et al., 2003). Air temperature and hu-midity (3.0 and 6.0 m; Humitter50Y, Vaisala, Helsinki, FIN), net radiation at 5.5 m (CNR1, Kipp and Zonen Ltd., Delft, NLD), and soil heat flux (0.06 m depth; Radiation & Energy Balance Systems Inc., Seattle, WA) were also measured.
To fill in missing data due to sensor malfunction, power outages, unfavorable weather, etc. (approximately 15–20% per year), we adopted an approach that combined measure-ment, interpolation, and empirical data synthesis (e.g., Kim et al., 1992; Wofsy et al., 1993; Baldocchi et al., 1997; Suyker et al., 2003). When hourly values were missing (day or night),
the LE was estimated as a function of available energy. Lin-ear regressions between LE and available energy were deter-mined (separately for dry and wet conditions) for sliding 3-day intervals, and used to fill in missing flux values.
It is customary to compare the sum of latent and sensible heat fluxes (LE + H) measured by eddy covariance against the sum of Rn (net radiation) + storage terms, measured by other methods. As Meyers and Hollinger (2004) point out, the combination of soil and canopy heat storage and the en-ergy used in photosynthesis of maize and soybean need to be considered for an accurate estimation of the energy balance closure. We calculated linear regressions between the hourly values of H + LE and Rn + G at our study sites (excluding winter months and periods with rain and irrigation). Here G = Gs (soil heat storage) + Gc (canopy heat storage) + Gm (heat stored in the mulch) + Gp (energy used in photosynthe-sis). These terms were roughly estimated using procedures similar to those outlined in Meyers and Hollinger (2004). The regression slopes at the three sites averaged 0.89 ± 0.08, implying a fairly good closure of the energy balance at our study sites.
2.3. Leaf area and mulch biomass
Leaf area was measured destructively at six different lo-cations for 1 m linear row sections approximately on a bi-monthly basis. The cubic spline method was used to inter-polate daily values. To estimate the surface mulch biomass, we used information developed in a concurrent study (A. Kochsiek, University of Nebraska, personal communication; Verma et al., 2005) in which biomass, left as stover follow-ing harvest, was measured each year and exponential de-cay rates for all components (stalks, stems, husks, seed pods, etc.) were estimated. Following the 2005 post-harvest conser-vation plowing, we assumed 30% of the accumulated har-vested biomass was still present on the surface [ http://www.ncsu.edu/sustainable/tillage/tillage.html ].
Table 1. Crop management details, mulch biomass, and grain yield for the three sites during 2001–2005 (M – maize; S – soybean). Grain yield was adjusted to 0% moisture content.
Site/year Crop/cultivar Plant population Planting Harvest Mulch biomass Grain yield (plants ha−1) date date (Mg ha−1) (Mg ha−1)
Irrigated maize-soybean rotation (IMS) 2001 M/Pioneer 33P67 82,000 May 10 October 18 0.91 11.41 2002 M/Pioneer 33P67 82,000 May 9 November 4 1.35 10.96 2003 M/Pioneer 33B51 77,000 May 15 October 27 1.60 10.24 2004 M/Pioneer 33B51 79,800 May 3 October 15 1.61 10.34 2005 M/Dekalb 63-75 CRW 70,800 May 4 October 13 0.52 10.16
Irrigated maize-soybean rotation (IMS) 2001 M/Pioneer 33P67 80,900 May 11 October 22 0.86 11.33 2002 S/Asgrow 2703 333,100 May 20 October 7 0.95 3.47 2003 M/Pioneer 33B51 78,000 May 14 October 23 1.34 11.83 2004 S/Pioneer 93B09 296,100 June 2 October 18 1.02 3.23 2005 M/Pioneer 33B51 81,000 May 2 October 17 1.32 11.19
Rainfed maize-soybean rotation (RMS) 2001 M/Pioneer 33B51 52,600 May 14 October 29 0.69 7.37 2002 S/Asgrow 2703 304,500 May 20 October 9 0.61 2.89 2003 M/Pioneer 33B51 57,600 May 13 October 13 0.80 6.53 2004 S/Pioneer 93B09 264,700 June 2 October 11 0.60 2.97 2005 M/Pioneer 33G68 56,300 April 26 October 17 0.99 7.69

446 Suy k e r an d Ver ma i n Ag r i c ul tu r A l A nd For e s t Me teo r ol og y 149 (2009)
3. Results and discussion
3.1. Weather conditions and leaf area
During the growing season (May–September), mean monthly air temperatures (Figure 1A) were generally within 1 °C of the 30-year climate normal (measured at a nearby weather station near Mead, NE; 1971–2000 Climate Normals; HPRCC, 2006), but typically tended to be warmer. The win-ter months were generally warmer (1–5 °C) than normal.
Precipitation (290–350 mm) received at the three sites dur-ing the growing seasons of 2002, 2003, and 2005 (Table 2; Fig-ure 1B) was significantly below the 450 mm normal (1971–2000 Climate Normals; HPRCC, 2006). In 2001 and 2004, the precipitation amounts (about 400–426 mm) were only slightly below normal. Irrigation totals ranged from 230 to 350 mm in maize years and from 185 to 210 mm in soybean years.
Seasonal distributions of green leaf area index (LAI) are presented in Figure 2. The peak LAI of irrigated maize (ICM and IMS) ranged from 4.9 to 6.4 m2 m−2. The peak LAI for rainfed was about 4.3 m2 m−2. For irrigated soybean, the peak LAI was between 4.4 and 5.7 m2 m−2. Rainfed soybean had peak LAI between 3.1 and 4.4 m2 m−2.
3.2. Growing season evapotranspiration
3.2.1. ET totalsMeasured evapotranspiration, integrated over the grow-
ing season during the 5 years of our study, is given in Figure 3A. For irrigated maize (ICM and IMS), the average grow-ing season ET total was 548 mm (range: 502–586 mm). For rainfed maize, the average growing season ET was 482 mm (range: 449–505 mm). For irrigated and rainfed soybean (2 years of data in each case), the average ET values were 452 mm (range: 430–474 mm) and 431 mm (range: 420–441
mm), respectively. On average, the maize ET was higher than the soybean ET by 96 mm (18%) for irrigated crops and by 52 mm (11%) for rainfed crops (Figure 3B). The ET from irrigated maize was higher than that of the rainfed maize by 66 mm (12%). The ET for irrigated soybean was higher by 21 mm (5%) as compared to the rainfed soybean. Variabil-ity in growing season ET totals is influenced by several at-mospheric and biological factors. For example, Rn explained
Figure 1. (A) Mean monthly air temperatures (measured at the irrigated continuous maize site, ICM) and 30-year climate nor-mals (1971–2000 Climate Normals; HPRCC, 2006), (B) growing season precipitation and irrigation at the three sites. ICM = irri-gated continuous maize; IMS = irrigated maize–soybean rotation; RMS = rainfed maize–soybean rotation.
Table 2. Growing season (GS: planting to harvest) and annual (Ann: planting to planting) totals of net radiation (Rn), evapotranspiration (ET), and combined precipitation and irrigation (Precip + Irrig) for all sites and years. Also included are the values of annual ET as a percentage of Precip + Irrig, annual ET as a percentage of net radiation, and growing season potential evapotranspiration (ET0). In 2001, values of Rn, ET, and precipitation were estimated during the period between planting and the initiation of measurements using data from a nearby weather station.
Year Site, crop Rn ET Precip + Irrig ET ET as % of ET0 (M – maize; as % Precip + S – soybean) GS Ann GS Ann Ann GS Ann of Rn Irrig GS (MJ) (MJ) (mm) (mm) (MJ) (mm) (mm) Ann (%) Ann (%) (mm)
2001–2002 ICM, M 2005 2738 586 714 1714 525 684 63 104 6812002–2003 ICM, M 2078 2828 565 679 1661 644 840 59 81 7772003–2004 ICM, M 1948 2532 540 640 1567 558 733 62 87 6762004–2005 ICM, M 1923 2645 502 618 1514 523 682 57 91 6522005–2006 ICM, M 1994 2776 526 687 1682 593 813 61 85 791
2001–2002 IMS, M 1996 2899 535 691 1663 597 798 57 87 6852002–2003 IMS, S 1802 2732 474 638 1561 576 795 57 80 6872003–2004 IMS, M 2008 3042 578 746 1825 636 934 60 80 6752004–2005 IMS, S 1548 2287 430 566 1388 443 707 61 80 5272005–2006 IMS, M 2077 2869 550 690 1689 629 912 59 76 785
2001–2002 RMS, M 1894 2768 505 656 1582 318 512 57 128 6862002–2003 RMS, S 1725 2576 441 599 1466 373 601 57 100 6922003–2004 RMS, M 1845 2894 449 621 1520 290 622 53 100 6542004–2005 RMS, S 1461 2105 420 553 1357 311 575 64 96 5112005–2006 RMS, M 2014 2741 493 616 1506 364 653 55 94 777

eV ap o tr a n S p i r ati o n o f i r r i g ated an d r ai n f e d mai z e–S o y b ea n c r o p p i n g S y S tem S 447
75% of the variability in ET totals of both crops and all years studied. Similarly, leaf area plays an important role (e.g., Suyker and Verma, 2008). About 66% of the variability in the growing season ET total was explained by the number of days when the LAI was greater than 2.5 m2 m−2 (Figure 3C).
These growing season ET totals are generally comparable to results from other studies in the region. For example, from their 2 years of study in central Kansas, Hattendorf et al. (1988) reported the average ET of irrigated and rainfed maize of 568 and 561 mm, respectively. Schneekloth et al. (1991) re-ported a 3-year average maize ET of 640, 557, and 389 mm
for full, limited, and rainfed conditions in west central Ne-braska. For soybean, average growing season ET in the three irrigation regimes was 520, 520, and 426 mm. In northwest Kansas, Lamm et al. (1995) measured a 3-year average maize ET of 586, 542, and 459 mm under full, half and no irriga-tion. In southwest Kansas, Norwood (1999) measured ET from 395 to 601 mm for rainfed maize in no-till management and 385–505 mm in conventional tillage over four growing seasons. For rainfed soybean, he reported ET ranging from 450 to 470 and from 408 to 476 mm, respectively for the two management practices.
3.2.2. Seasonal distributions of ET/ET0Seasonal distributions of daily ET, normalized by the ref-
erence evapotranspiration (ET0, calculated using the FAO Penman–Monteith equation: Allen et al., 1998), are given in Figure 5 and Figure 6. Normalizing ET by ET0 is intended to account for the day-to-day variability in atmospheric con-ditions (also, the seasonal totals of ET0 are given in Table 2).
Figure 2. Green leaf area (LAI) at the three sites for (A) maize can-opies in 2001 and 2002, (B) maize canopies in 2003 and 2004, (C) maize canopies in 2005, and (D) soybean canopies in 2002 and 2004. ICM = irrigated continuous maize; IMS = irrigated maize–soybean rotation; RMS = rainfed maize–soybean rotation.
Figure 3. Growing season evapotranspiration (ET): (A) for each year and site, (B) average and range for each crop (irrigated and rainfed), and (C) growing season ET vs. the number of days with LAI > 2.5 m2 m−2. ICM = irrigated continuous maize; IMS = irri-gated maize–soybean rotation; RMS = rainfed maize–soybean ro-tation. In (A), M = maize and S = soybean.

448 Suy k e r an d Ver ma i n Ag r i c ul tu r A l A nd For e s t Me teo r ol og y 149 (2009)
The ET/ET0 ratio is also commonly referred to as the crop coefficient (Kc; e.g., Allen et al., 1998). For irrigated maize in both ICM and IMS fields, prior to emergence (LAI < 0.5), Kc was 0.27 ± 0.17 (95% confidence interval; Figure 4A and B; Table 3). During this period, evaporation from soil/resi-due is important and the variability in the magnitude of Kc is primarily affected by surface conditions (e.g., mulch cover, rain, heavy dew). With increasing LAI, Kc increased reach-ing a mid-season average of 1.03 ± 0.07 (Table 3). By the end of the growing season (DAP = 135–140), Kc was 0.33 ± 0.17. The seasonal distribution of Kc in the irrigated maize fields appears to be quite consistent among the years. Also, our Kc values are generally within the range of the values recom-mended in the Food and Agricultural Organization of the United Nations (FAO) report (Table 3; Allen et al., 1998) for our region: 0.3 (initial part of the season), 1.16 ± 0.04 (mid-season, adjusted for climatic conditions at our sites based on their recommendations), and 0.35 (end of season).
The seasonal distribution of Kc in the irrigated soybean was also quite consistent between the two growing seasons
(Figure 4C) even though the 2004 crop was a different hy-brid, was planted later, and had lower LAI (Table 1; Figure 2). Before significant leaf emergence, Kc values were about the same as those in irrigated maize (0.27 ± 0.17). Then, in 2 weeks (DAP = 41–55), Kc increased somewhat rapidly from about 0.3 to 0.9. Further increase in Kc was gradual, reaching a mid-season value of 0.98 ± 0.02. In comparison to maize, the duration of mid-season plateau in Kc is shorter by about 30 days. With senescence, there was a rapid decrease in Kc over a period of about 3 weeks. At the end of the growing season, Kc was 0.32 ± 0.12. These results are also generally within range of the values recommended in the FAO report for our region (Allen et al., 1998): 0.4 (initial part of the sea-son), 1.14 ± 0.03 (mid-season, adjusted for climatic conditions at our sites), and 0.5 (end of season).
As expected, there was significantly larger year-to-year variability in the seasonal distributions ofKc for the rain-fed crops (Figure 5). In Figure 6, these results are examined against the corresponding values for the irrigated crops in conjunction with the precipitation distributions. Dry-down periods (periods with extended gaps without any signifi-cant precipitation: >5 mm/event) occurred during different parts of the season in 2001, 2003, and 2005. Towards the end of dry-down periods (e.g., 70–93 DAP in 2001, 67–97 DAP in 2003, and 54–83 DAP in 2005), Kc tended to decrease be-low the corresponding value for the irrigated crop. Rise in Kc was observed following a significant rain (>20 mm/event). Average mid-season Kc of rainfed maize was 0.84 ± 0.20 over the 3 years of our measurements (Table 3). In soybean years, there seemed to be sufficient rainfall events throughout the growing season in 2004 and during mid- to late season in 2002. Dry-down early in the 2002 season helped temporarily
Figure 4. Seasonal distributions of crop coefficient Kc = ET/ET0 at the irrigated sites: (A) irrigated maize over 5 years at ICM, (B) irrigated maize for 3 years at IMS, and (C) irrigated soybean over 2 years at IMS. Days with precipitation have been removed. ICM = irrigated continuous maize; IMS = irrigated maize–soybean rotation; RMS = rainfed maize–soybean rotation.
Figure 5. Seasonal distributions of crop coefficient Kc = ET/ET0 in rainfed sites: (A) maize over 3 years at RMS, and (B) soybean for 2 years at RMS. Days with precipitation have been removed. RMS = rainfed maize–soybean rotation.
eV ap o tr a n S p i r ati o n o f i r r i g ated an d r ai n f e d mai z e–S o y b ea n c r o p p i n g S y S tem S 449
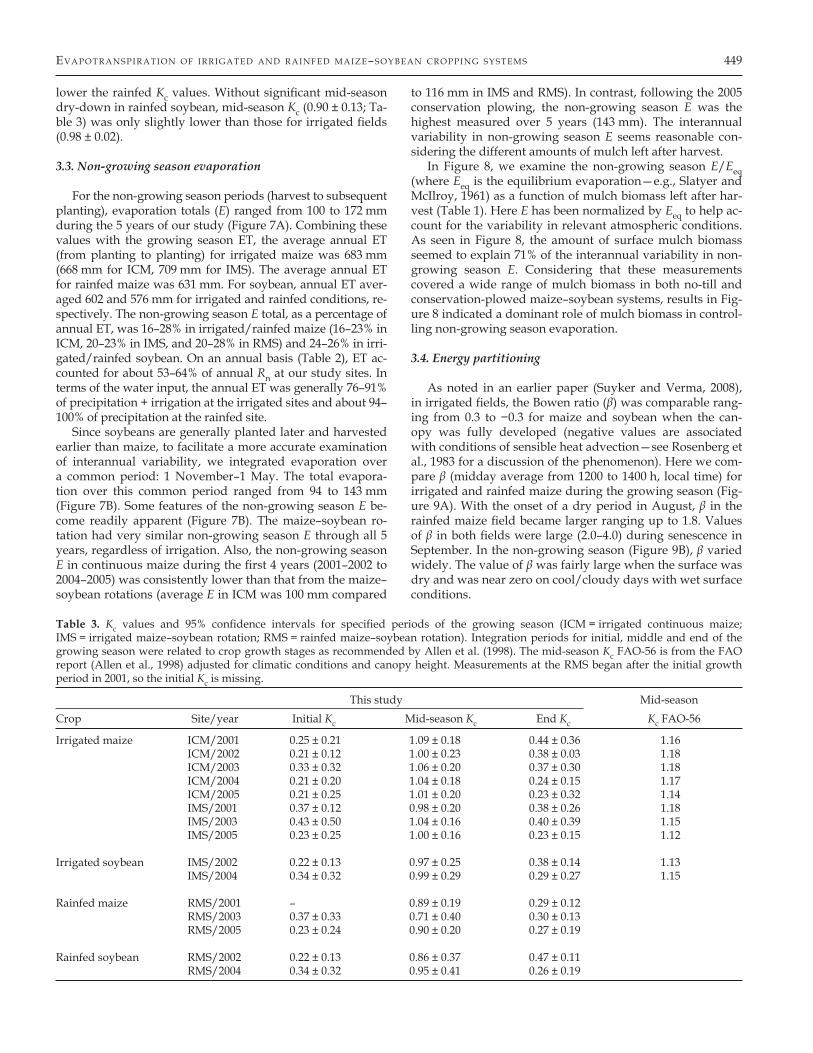
lower the rainfed Kc values. Without significant mid-season dry-down in rainfed soybean, mid-season Kc (0.90 ± 0.13; Ta-ble 3) was only slightly lower than those for irrigated fields (0.98 ± 0.02).
3.3. Non-growing season evaporation
For the non-growing season periods (harvest to subsequent planting), evaporation totals (E) ranged from 100 to 172 mm during the 5 years of our study (Figure 7A). Combining these values with the growing season ET, the average annual ET (from planting to planting) for irrigated maize was 683 mm (668 mm for ICM, 709 mm for IMS). The average annual ET for rainfed maize was 631 mm. For soybean, annual ET aver-aged 602 and 576 mm for irrigated and rainfed conditions, re-spectively. The non-growing season E total, as a percentage of annual ET, was 16–28% in irrigated/rainfed maize (16–23% in ICM, 20–23% in IMS, and 20–28% in RMS) and 24–26% in irri-gated/rainfed soybean. On an annual basis (Table 2), ET ac-counted for about 53–64% of annual Rn at our study sites. In terms of the water input, the annual ET was generally 76–91% of precipitation + irrigation at the irrigated sites and about 94–100% of precipitation at the rainfed site.
Since soybeans are generally planted later and harvested earlier than maize, to facilitate a more accurate examination of interannual variability, we integrated evaporation over a common period: 1 November–1 May. The total evapora-tion over this common period ranged from 94 to 143 mm (Figure 7B). Some features of the non-growing season E be-come readily apparent (Figure 7B). The maize–soybean ro-tation had very similar non-growing season E through all 5 years, regardless of irrigation. Also, the non-growing season E in continuous maize during the first 4 years (2001–2002 to 2004–2005) was consistently lower than that from the maize–soybean rotations (average E in ICM was 100 mm compared
to 116 mm in IMS and RMS). In contrast, following the 2005 conservation plowing, the non-growing season E was the highest measured over 5 years (143 mm). The interannual variability in non-growing season E seems reasonable con-sidering the different amounts of mulch left after harvest.
In Figure 8, we examine the non-growing season E/Eeq (where Eeq is the equilibrium evaporation—e.g., Slatyer and McIlroy, 1961) as a function of mulch biomass left after har-vest (Table 1). Here E has been normalized by Eeq to help ac-count for the variability in relevant atmospheric conditions. As seen in Figure 8, the amount of surface mulch biomass seemed to explain 71% of the interannual variability in non-growing season E. Considering that these measurements covered a wide range of mulch biomass in both no-till and conservation-plowed maize–soybean systems, results in Fig-ure 8 indicated a dominant role of mulch biomass in control-ling non-growing season evaporation.
3.4. Energy partitioning
As noted in an earlier paper (Suyker and Verma, 2008), in irrigated fields, the Bowen ratio (β) was comparable rang-ing from 0.3 to −0.3 for maize and soybean when the can-opy was fully developed (negative values are associated with conditions of sensible heat advection—see Rosenberg et al., 1983 for a discussion of the phenomenon). Here we com-pare β (midday average from 1200 to 1400 h, local time) for irrigated and rainfed maize during the growing season (Fig-ure 9A). With the onset of a dry period in August, β in the rainfed maize field became larger ranging up to 1.8. Values of β in both fields were large (2.0–4.0) during senescence in September. In the non-growing season (Figure 9B), β varied widely. The value of β was fairly large when the surface was dry and was near zero on cool/cloudy days with wet surface conditions.
Table 3. Kc values and 95% confidence intervals for specified periods of the growing season (ICM = irrigated continuous maize; IMS = irrigated maize–soybean rotation; RMS = rainfed maize–soybean rotation). Integration periods for initial, middle and end of the growing season were related to crop growth stages as recommended by Allen et al. (1998). The mid-season Kc FAO-56 is from the FAO report (Allen et al., 1998) adjusted for climatic conditions and canopy height. Measurements at the RMS began after the initial growth period in 2001, so the initial Kc is missing.
This study Mid-season Crop Site/year Initial Kc Mid-season Kc End Kc Kc FAO-56
Irrigated maize ICM/2001 0.25 ± 0.21 1.09 ± 0.18 0.44 ± 0.36 1.16 ICM/2002 0.21 ± 0.12 1.00 ± 0.23 0.38 ± 0.03 1.18 ICM/2003 0.33 ± 0.32 1.06 ± 0.20 0.37 ± 0.30 1.18 ICM/2004 0.21 ± 0.20 1.04 ± 0.18 0.24 ± 0.15 1.17 ICM/2005 0.21 ± 0.25 1.01 ± 0.20 0.23 ± 0.32 1.14 IMS/2001 0.37 ± 0.12 0.98 ± 0.20 0.38 ± 0.26 1.18 IMS/2003 0.43 ± 0.50 1.04 ± 0.16 0.40 ± 0.39 1.15 IMS/2005 0.23 ± 0.25 1.00 ± 0.16 0.23 ± 0.15 1.12
Irrigated soybean IMS/2002 0.22 ± 0.13 0.97 ± 0.25 0.38 ± 0.14 1.13 IMS/2004 0.34 ± 0.32 0.99 ± 0.29 0.29 ± 0.27 1.15
Rainfed maize RMS/2001 – 0.89 ± 0.19 0.29 ± 0.12 RMS/2003 0.37 ± 0.33 0.71 ± 0.40 0.30 ± 0.13 RMS/2005 0.23 ± 0.24 0.90 ± 0.20 0.27 ± 0.19
Rainfed soybean RMS/2002 0.22 ± 0.13 0.86 ± 0.37 0.47 ± 0.11 RMS/2004 0.34 ± 0.32 0.95 ± 0.41 0.26 ± 0.19

450 Suy k e r an d Ver ma i n Ag r i c ul tu r A l A nd For e s t Me teo r ol og y 149 (2009)
3.5. Water use efficiency (WUE)
Here we present our results using two commonly used definitions of water use efficiency (WUE). First, WUEET or ET efficiency, defined as the ratio of grain yield (Y) to grow-ing season evapotranspiration (ET), is plotted for all three sites in Figure 10A. For irrigated maize, the average value was 2.00 ± 0.15 g kg−1 (95% confidence interval) with little interannual variation. In the rainfed maize, average values were about 25% smaller (1.49 ± 0.12 g kg−1), but as steady as the irrigated maize. Our results on WUEET are brack-eted by the range of values observed in several studies on maize (generally 1.6 g kg−1 in arid regions and 2.7 g kg−1 in humid regions: Tanner and Sinclair, 1983). For soybean, our data indicated no significant difference between irrigated and rainfed WUEET with average values of 0.71 ± 0.03 and 0.68 ± 0.07 g kg−1, respectively.
Water use efficiency, WUEDM or biomass transpiration ef-ficiency, is defined as the ratio of total plant biomass (YDM: above plus below ground) to growing season transpiration (T). Following Amos and Walters (2006), we assumed an 11% root to shoot ratio for maize and 20% for soybean at phys-iological maturity. We estimated soil evaporation (E) from measured atmospheric and biophysical variables follow-ing Ritchie (1972) and Tanner and Jury (1976). The WUEDM values (Figure 10B) show virtually the same average for ir-rigated and rainfed maize with small interannual variabil-ity, 5.20 ± 0.34 and 5.22 ± 0.36 g kg−1, respectively. For soy-bean, WUEDM for irrigated and rainfed sites is 3.21 ± 0.35 and 2.96 ± 0.30 g kg−1, respectively. For these two crops, there was no significant difference between the WUEDM in ir-rigated and rainfed systems.
Figure 6. Seasonal distributions of crop coefficient Kc = ET/ET0 and precipitation at the rainfed site (RMS) in (A) 2001, (B) 2003, (C) 2005, (D) 2002, and (E) 2004. The Kc for the corresponding irri-gated crop (IMS) is also included for comparison. IMS = irrigated maize–soybean rotation; RMS = rainfed maize–soybean rotation.
Figure 7. Integrated evaporation (E) during the non-growing sea-son periods for each of the 5 years at all three sites during (A) har-vest to planting and (B) the common integration period from 1 November to 1 May. ICM = irrigated continuous maize; IMS = ir-rigated maize–soybean rotation; RMS = rainfed maize–soybean rotation.
Figure 8. Non-growing season evaporation (E: integrated from 1 November to 1 May) normalized by equilibrium evaporation (Eeq) as a function of seasonal average surface mulch biomass.

eV ap o tr a n S p i r ati o n o f i r r i g ated an d r ai n f e d mai z e–S o y b ea n c r o p p i n g S y S tem S 451
4. Summary and conclusions
Evapotranspiration (ET) was measured in three fields of irrigated continuous maize, irrigated maize–soybean ro-tation, and a rainfed maize–soybean rotation at Mead, NE during 2001–2005. For irrigated and rainfed maize, grow-ing season ET ranged from 502 to 586 and 449 to 505 mm, respectively. For irrigated and rainfed soybean, ET ranged from 430 to 474 and 420 to 441 mm, respectively. The ET for
irrigated maize was higher than rainfed maize by 12% and the ET for irrigated soybean was higher than rainfed soy-bean by 5%. During the growing season, the crop coefficient (Kc) for irrigated maize was approximately 0.27 ± 0.17 early in the season, 1.03 ± 0.07 during mid-season, and 0.33 ± 0.17 at the end of the season. Similarly, the corresponding Kc for irrigated soybean was 0.27 ± 0.17, 0.98 ± 0.02, and 0.32 ± 0.12, respectively. Annual ET (planting to planting) averaged 683 and 631 mm for irrigated and rainfed maize, respectively. For soybean, average annual ET was 602 and 576 mm for irrigated and rainfed conditions, respectively. Non-grow-ing season evaporation contributed 16–28% of annual ET to-tals in irrigated and rainfed maize and 24–26% in irrigated and rainfed soybean. Water use efficiency (evapotranspira-tion efficiency), based on the ratio of yield to growing season ET, was 2.00 g kg−1 in irrigated maize and about 25% lower in rainfed maize. The WUE in irrigated and rainfed soybean was comparable (0.71 and 0.68 g kg−1, respectively).
Acknowledgments
The research discussed here was supported by the Office of Science (BER), U.S. Department of Energy Grant no. DE-FG02-03ER63639 and the University of Nebraska-Lincoln Program of Excellence. We gratefully acknowledge the technical assistance of Ed Cunningham, Todd Schimelfenig, Jim Hines, and Mark Schroeder. We thank Dr. Tim Arkebauer and Dave Scoby for providing data on leaf area. We thank Dr. Derrel Martin, Dr. Suat Irmak and Mr. Luis Octavio Lagos for their valuable as-sistance calculating reference ET.
References
Allen et al., 1998 ► R. G. Allen, L. S. Pereira, D. Raes, and M. Smith, 1998. Crop evapotranspiration. Guidelines for Computing Crop Water Requirements. FAO Irrig. and Drain. Paper 56. FAO, Rome.
Amos and Walters, 2006 ► B. Amos and D. T. Walters, Maize root biomass and net rhizodeposited carbon: an analysis of the literature, Soil Sci. Soc. Am. J. 70 (2006), pp. 1489–1503.
Baldocchi et al., 1988 ► D. D. Baldocchi, B. B. Hicks, and T. P. Meyers, Measuring biosphere–atmosphere exchanges of bi-ologically related gases with micrometeorological methods, Ecology 69 (5) (1988), pp. 1331–1340.
Baldocchi et al., 1997 ► D. D. Baldocchi, C. Vogel and B. Hall, Seasonal variation of carbon dioxide exchange rates above and below a boreal Jack pine forest, Agric. For. Meteorol. 83 (1997), pp. 147–170.
Bockus and Shroyer, 1998 ► W. W. Bockus and J. P. Shroyer, 1998. The impact of reduced tillage on soilborne plant patho-gens. Annu. Rev. Phytopathol. 36, 485–500, doi:10. 1146/an-nurev. phyto. 36. 1. 485.
Bowman and Collins, 1987 ► J. A. Bowman and M. A. Collins, 1987. Impacts of Irrigation and Drought on Illinois Ground-Water Resources. Report of Investigation, Illinois State Water Survey, Champaign.
Boyer, 1982 ► J. S. Boyer, Plant productivity and environment, Science 218 (4571) (1982), pp. 443–448.
Denmead and Shaw, 1960 ► O. T. Denmead and R. H. Shaw, The effects of soil moisture stress at different stages of growth on the development and yield of corn, Agron. J. 52 (1960), pp. 272–274.
Figure 9. Midday averaged (1200–1400 h, local time) Bowen ratio for irrigated continuous maize (ICM) and rainfed maize soybean (RMS) during (A) the 2003 growing season (maize in both fields) and (B) the 2002 growing season (maize in ICM and soybean in RMS) and the subsequent non-growing season period. Data dur-ing precipitation were not included.
Figure 10. Water use efficiency calculated for each site/year de-fined as (A) the ratio of grain yield to growing season evapotrans-piration (WUEET), and (B) the ratio of total plant biomass to grow-ing season transpiration (WUEDM). ICM = irrigated continuous maize; IMS = irrigated maize–soybean rotation; RMS = rainfed maize–soybean rotation. In (A), M = maize and S = soybean.

452 Suy k e r an d Ver ma i n Ag r i c ul tu r A l A nd For e s t Me teo r ol og y 149 (2009)
Easterling and Karl, 2001 ► D. R. Easterling and T. R. Karl, Po-tential consequences of climate variability and change for the Midwestern United States, Climate Change Impacts on the United States: The Potential Consequences of Climate Variability and Change, National Assessment Synthesis Team, Report for the US Global Change Research Program, Cambridge University Press, Cambridge, UK (2001) pp. 167–188.
Farahani et al., 2007 ► H. J. Farahani, T. A. Howell, W. J. Shut-tleworth and W. C. Bausch, Evapotranspiration: progress in measurement and modeling in agriculture, Trans. ASABE 50 (5) (2007), pp. 1627–1638.
Graham et al., 2007 ► R. L. Graham, R. Nelson, J. Sheehan, R. D. Perlack, and L. L. Wright, 2007. Current and Potential U. S. Corn Stover Supplies. Agron. J. 99, 1–11, doi:10. 2134/agronj2005. 0222.
Hatfield et al., 2001 ► J. L. Hatfield, T. J. Sauer, and J. H. Prueger, Managing soils to achieve greater water use efficiency: a re-view, Agron. J. 93 (2001), pp. 271–280.
Hattendorf et al., 1988 ► M. J. Hattendorf, M. S. Dedelfs, B. Amos, L. R. Stone, and R. E. Given Jr., Comparative water use characteristics of six row crops, Agron. J. 80 (1988), pp. 80–85.
HPRCC, 2006 ► High Plains Regional Climate Center, 2006. Mead, NE. 1971–2000 Climate Normals. Retrieved December 2000, from ACIS database.
Ji and Unger, 2001 ► S. Ji and P. W. Unger, Soil water accumula-tion under different precipitation, potential evaporation, and straw mulch conditions, Agron. J. 65 (2001), pp. 442–448.
Kim et al., 1992 ► J. Kim, S. B. Verma, and R. J. Clement, Carbon dioxide budget in a temperate grassland ecosystem, J. Geophys. Res. 97(D5) (1992), pp. 6057–6063.
Kucharik and Twine, 2007 ► C. J. Kucharik and T. E. Twine, Res-idue, respiration, and residuals: evaluation of a dynamic agro-ecosystem model using eddy flux measurements and biomet-ric data, Agric. For. Meteorol. 146 (2007), pp. 134–158.
Kochsiek et al., in submission ► A. E. Kochsiek, J. M. H. Knops, D. T. Walters, and T. J. Arkebauer. Impacts of management on decomposition and the litter carbon balance in irrigated and rainfed no-till agricultural systems. In submission to Agric. For. Meteorol.
Lamm et al., 1995 ► F. R. Lamm, H. L. Manges, L. R. Stone, A. H. Khan, and D. H. Rogers, Water requirement of subsurface drip-irrigated corn in northwest Kansas, Trans. ASAE 38 (2) (1995), pp. 441–448.
Massman, 1991 ► W. J. Massman, The attenuation of concentra-tion fluctuations in turbulent flow in a tube, J. Geophys. Res. 96 (1991), pp. 15269–15273.
Moore, 1986 ► C. J. Moore, Frequency response correction for eddy correlation systems, Boundary-Layer Meteorol. 37 (1986), pp. 17–35.
Musick and Dusek, 1980 ► J. T. Musick and D. A. Dusek, Irri-gated corn yield response to water, Trans. ASAE 23 (1980), pp. 92–98.
Meyers and Hollinger, 2004 ► T. P. Meyers and S. E. Hollinger, An assessment of storage terms in the surface energy bal-ance of maize and soybean, Agric. For. Meteorol. 125 (2004), pp. 105–116.
Norwood, 1999 ► C. A. Norwood, Water use and yield of dry-land row crops as affected by tillage, Agron. J. 91 (1999), pp. 108–115.
Ritchie, 1972 ► J. T. Ritchie, Model for predicting evaporation from a row crop during incomplete cover, Water Resour. Res. 8 (1972), pp. 1204–1213.
Rosenberg et al., 1983 ► N. J. Rosenberg, B. L. Blad, and S. B. Verma, Microclimate: The Biological Environment (2nd ed.), John Wiley and Sons, New York, NY (1983) 495 pp. .
Sauer et al., 1998 ► T. J. Sauer, J. L. Hatfield, J. H. Prueger, and J. M. Norman, Surface energy balance of a corn residue-covered field, Agric. For. Meteorol. 89 (1998), pp. 155–168.
Schneekloth et al., 1991 ► J. P. Schneekloth, N. L. Klocke, G. W. Hergert, D. L. Martin, and R. T. Clark, Crop rotations with full and limited irrigation and dryland management, Trans. ASAE 34 (1991), pp. 2372–2380.
Shukla and Mintz, 1982 ► J. Shukla and Y. Mintz, Influence of land–surface evapotranspiration on the earth’s climate, Science 215 (4539) (1982), pp. 1498–1501.
Slatyer and McIlroy, 1961 ► R. O. Slatyer and I. C. McIlroy, Prac-tical Microclimatology, CSIRO, Melbourne, Australia (1961).
Steduto, 1996 ► P. Steduto, Water use efficiency. In: L. S. Pereira, R. A. Feddes, J. R. Gilley, and B. Lesaffre, eds., Sustainability of Irrigated Agriculture, NATO ASI Series E: Applied Sciences, Kluwer Academic Publishers, Dordrecht, NLDS (1996), pp. 193–209.
Steffey et al., 1999 ► K. L. Steffey, M. E. Rice and M. E. Gray, Identification of insects and diagnosis of injury, in Handbook of Corn Insects, Entomological Society of America, Lanham, Maryland (1999) pp. 22–43.
Suyker and Verma, 1993 ► A. E. Suyker and S. B. Verma, Eddy correlation measurements of CO2 flux using a closed-path sen-sor: theory and field tests against an open-path sensor, Bound-ary-Layer Meteorol. 64 (1993), pp. 391–407.
Suyker et al., 2003 ► A. E. Suyker, S. B. Verma, and G. G. Burba, Interannual variability in net CO2 exchange of a native tall-grass prairie, Global Change Biol. 9 (2003), pp. 1–11.
Suyker and Verma, 2008 ► A. E. Suyker and S. B. Verma, In-terannual water vapor and energy exchange in an irrigated maize-based agroecosystem, Agric. For. Meteorol. 148 (2008), pp. 417–427.
Tanner and Jury, 1976 ► C. B. Tanner and W. A. Jury, Estimating evaporation and transpiration from a row crop during incom-plete cover, Agron. J. 68 (1976), pp. 239–243.
Tanner and Sinclair, 1983 ► C. B. Tanner and T. R. Sinclair, Effi-cient water use in crop production: research or re-search?. In: H. M. Taylor et al., Editors, Limitations to Efficient Water Use in Crop Production, ASA, Madison, WI (1983), pp. 1–27.
Verma et al., 2005 ► S. B. Verma, A. Dobermann, K. G. Cassman, D. T. Walters, J. M. Knops, T. J. Arkebauer, A. E. Suyker, G. G. Burba, B. Amos, H. Yang, D. Ginting, K. G. Hubbard, A. Gitel-son, and E. A. Water-Shea, Annual carbon dioxide exchange in irrigated and rainfed maize-based agroecosystems, Agric. For. Meteorol. 131 (2005), pp. 77–96.
Webb et al., 1980 ► E. K. Webb, G. I. Pearman, and R. Leuning, Correction of flux measurements for density effects due to heat and water vapor transfer, Quart. J. R. Meteorol. Soc. 106 (1980), pp. 85–100.
Wilhelm et al., 2004 ► W. W. Wilhelm, J. M. F. Johnson, J. L. Hat-field, W. B. Voorhees, and D. R. Linden, Crop and soil produc-tivity response to corn residue removal: a literature review, Agron. J. 96 (2004), pp. 1–17.
Wofsy et al., 1993 ► S. C. Wofsy, M. L. Goulden, J. W. Munger, S. M. Fan, P. S. Bakwin, B. C. Daube, S. L. Bassow, and F. A. Ba-zzaz, Net exchange of CO2 in a midlatitude forest, Science 260 (1993), pp. 1314–1317.