Evaluations and Improvement of Ride Comfort Performance of ...
9
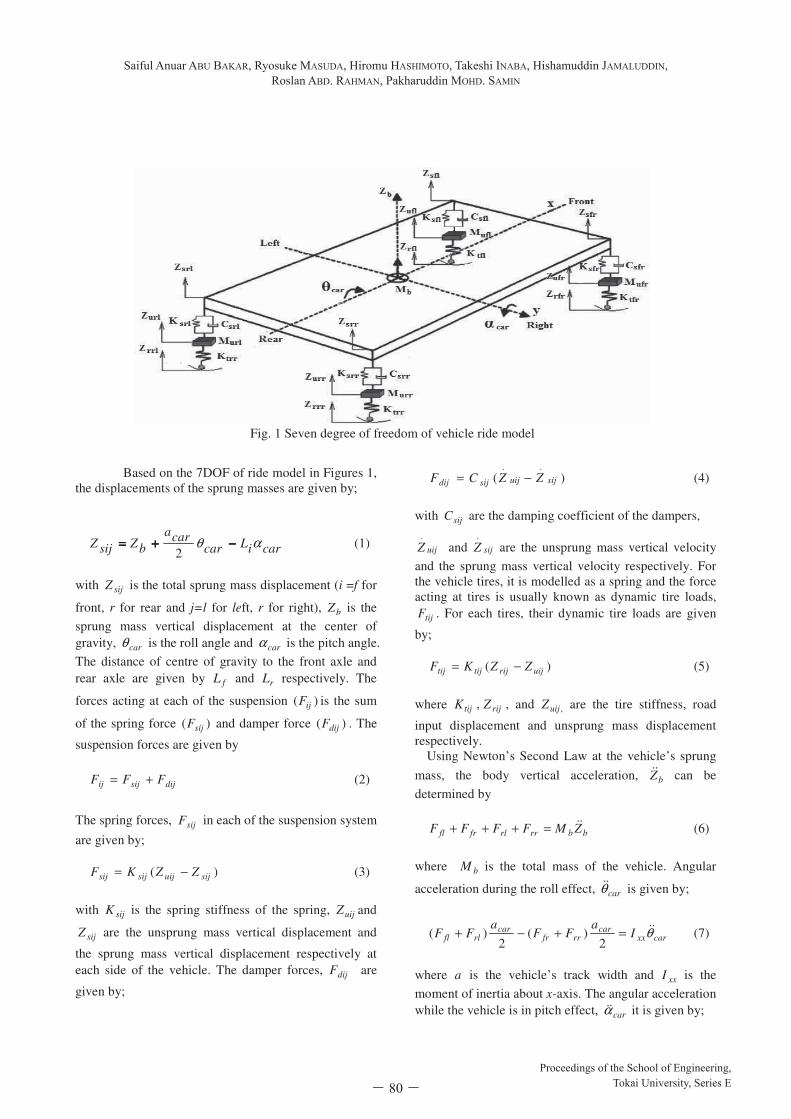
Evaluations and Improvement of Ride Comfort Performance of Electric Vehicle Conversion Saiful Anuar ABU BAKAR* 1 , Ryosuke MASUDA* 2 , Hiromu HASHIMOTO* 3 , Takeshi INABA* 4 , Hishamuddin JAMALUDDIN* 5 , Roslan ABD. RAHMAN* 5 , Pakharuddin MOHD. SAMIN* 6 . (Received on Aug. 4 and accepted on Sept. 20, 2011) Abstract This paper present a study on ride comfort performance of passenger vehicle converted into an electric vehicle. The studies involved evaluations on the vehicle’s ride comfort performance before and after the conversion, as well as possible ride comfort performance improvements by the magnetorheological semi active suspension system. The studies used 7 degrees of freedom of vehicle’s ride model which were validated experimentally. The data of Malaysian made passenger vehicle were used in this study assuming that the vehicle is going to be converted into an electric vehicle. Ride test known as pitch mode tests were conducted to validate the reliability of the developed simulation model. The validated simulation model was used to evaluate the vehicle ride comfort performance when converted into an electric vehicle. The validated simulation model was also integrated with the semi active suspension system in order to improve the EV conversion ride comfort performance. It was found that the EV conversion’s ride comfort was not significantly affected from the modifications and the application of semi active suspension system can be an alternative in further improving the EV conversion’s ride comfort performance. Keywords: electric vehicle conversion, ride comfort, semi active suspension system, magnetorheological Introduction The development of electric vehicle (EV) from the commercially available vehicle model is becoming a trend nowadays due to the global concerns in reducing the green house effect which one of its contributing factors came from the pollution of vehicle. An electric vehicle that is being converted from a normal production vehicle model usually known as a electric vehicle conversion or EV conversion. Electric vehicle is driven by electric motor. It is either uses only two or four electric motors to move the vehicle. Other common component that can be seen in an electric conversion vehicle are batteries, AC/DC or DC/DC converters, battery management system, pedal relays and others auxiliary components such as electric power steering. Many research works were found to focus on the electric vehicle’s electric and electronic systems but not many were found to focus in improving EV conversion’s stability while manoeuvrings. The researches on EV conversion’s stability are mainly related to the yaw stability control and traction system. In yaw stability control on electric vehicle [1~4] it focuses in controlling yaw motion of the electric vehicle by controlling the operation of the drive motor. The drive motor, either two or four are basically controlled in terms of its torque generation. While in traction control system [5~7] the generation of electric motor torque is controlled to ensure the wheel does not skid while accelerating ensuring full control over the vehicle. This is done by controlling the slip ratio of the wheel. It is not clear how the modifications towards an EV conversion affect the vehicle’s ride comfort performance; the level of isolations of passenger compartment from being affected by harsh road profile. Typically, any conversion of internal combustion engine vehicle to electric vehicle involves some weight addition (or weight reduction). This is due to the installations of the electric vehicle systems i.e. battery system and converters. Any weight addition or weight reduction on the chassis will cause the vehicle’s weight distribution to change and this compromised the vehicle’s ride comfort performance, as current suspension system tuning was not being designed specifically for the new weight and load distribution at front and rear axles. This paper will investigate the affects of weight distribution changes on EV conversion’s ride comfort performance and possible improvement of EV conversion’s ride comfort performance using magnetorheological semi active suspension system. 2. Mathematical Modelling of Ride Comfort Model A vehicle’s ride model is derived based on the work done in [8]. The ride model consists of seven degrees of freedom namely roll, pitch, bounce and vertical motion of each four wheels. Figure 1 show the vehicle’ ride model. *1 Graduate Student, Course of Science and Tehcnology, Graduate School of Science and Technology *2 Professor, Department of Applied Computer Engineering *3 Professor, Department of Mechanical Engineering *4 Associate Professor, Department of Applied Computer Engineering *5 Professor, Department of Applied Engineering, UTM *6 Associate Professor, Department of Automotive Engineering, UTM Vol. ⅩⅩⅩⅥ, 2011 - 79 - Proc. Schl. Eng. Tokai Univ., Ser. E 36 (2011) 79-87
Transcript of Evaluations and Improvement of Ride Comfort Performance of ...

1
Evaluations and Improvement of Ride Comfort Performance of Electric Vehicle Conversion
Saiful Anuar ABU BAKAR*1, Ryosuke MASUDA* 2 , Hiromu HASHIMOTO* 3 ,
Takeshi INABA* 4 , Hishamuddin JAMALUDDIN* 5 , Roslan ABD. RAHMAN* 5 ,
Pakharuddin MOHD. SAMIN* 6 .
(Received on Aug. 4 and accepted on Sept. 20, 2011)
Abstract This paper present a study on ride comfort performance of passenger vehicle converted into an electric vehicle. The
studies involved evaluations on the vehicle’s ride comfort performance before and after the conversion, as well as
possible ride comfort performance improvements by the magnetorheological semi active suspension system. The studies
used 7 degrees of freedom of vehicle’s ride model which were validated experimentally. The data of Malaysian made
passenger vehicle were used in this study assuming that the vehicle is going to be converted into an electric vehicle.
Ride test known as pitch mode tests were conducted to validate the reliability of the developed simulation model. The
validated simulation model was used to evaluate the vehicle ride comfort performance when converted into an electric
vehicle. The validated simulation model was also integrated with the semi active suspension system in order to improve
the EV conversion ride comfort performance. It was found that the EV conversion’s ride comfort was not significantly
affected from the modifications and the application of semi active suspension system can be an alternative in further
improving the EV conversion’s ride comfort performance.
Keywords: electric vehicle conversion, ride comfort, semi active suspension system, magnetorheological
Introduction
The development of electric vehicle (EV) from the
commercially available vehicle model is becoming a
trend nowadays due to the global concerns in reducing
the green house effect which one of its contributing
factors came from the pollution of vehicle. An electric
vehicle that is being converted from a normal
production vehicle model usually known as a electric
vehicle conversion or EV conversion.
Electric vehicle is driven by electric motor. It is either
uses only two or four electric motors to move the
vehicle. Other common component that can be seen in
an electric conversion vehicle are batteries, AC/DC or
DC/DC converters, battery management system, pedal
relays and others auxiliary components such as electric
power steering. Many research works were found to
focus on the electric vehicle’s electric and electronic
systems but not many were found to focus in improving
EV conversion’s stability while manoeuvrings. The
researches on EV conversion’s stability are mainly
related to the yaw stability control and traction system.
In yaw stability control on electric vehicle [1~4] it
focuses in controlling yaw motion of the electric vehicle
by controlling the operation of the drive motor.
The drive motor, either two or four are basically
controlled in terms of its torque generation. While in
traction control system [5~7] the generation of electric
motor torque is controlled to ensure the wheel does not
skid while accelerating ensuring full control over the
vehicle. This is done by controlling the slip ratio of the
wheel.
It is not clear how the modifications towards an EV
conversion affect the vehicle’s ride comfort
performance; the level of isolations of passenger
compartment from being affected by harsh road profile.
Typically, any conversion of internal combustion engine
vehicle to electric vehicle involves some weight
addition (or weight reduction). This is due to the
installations of the electric vehicle systems i.e. battery
system and converters. Any weight addition or weight
reduction on the chassis will cause the vehicle’s weight
distribution to change and this compromised the
vehicle’s ride comfort performance, as current
suspension system tuning was not being designed
specifically for the new weight and load distribution at
front and rear axles. This paper will investigate the
affects of weight distribution changes on EV
conversion’s ride comfort performance and possible
improvement of EV conversion’s ride comfort
performance using magnetorheological semi active
suspension system.
2. Mathematical Modelling of Ride Comfort
Model
A vehicle’s ride model is derived based on the work
done in [8]. The ride model consists of seven degrees of
freedom namely roll, pitch, bounce and vertical motion
of each four wheels. Figure 1 show the vehicle’ ride
model.
*1 Graduate Student, Course of Science and
Tehcnology, Graduate School of
Science and Technology
*2 Professor, Department of Applied Computer
Engineering
*3 Professor, Department of Mechanical
Engineering
*4 Associate Professor, Department of Applied
Computer Engineering
*5 Professor, Department of Applied Engineering,
UTM
*6 Associate Professor, Department of Automotive
Engineering, UTM
Vol. ⅩⅩⅩⅥ, 2011 - 79-
Proc. Schl. Eng. Tokai Univ., Ser. E36 (2011) 79-87
2
Based on the 7DOF of ride model in Figures 1,
the displacements of the sprung masses are given by;
cariLcarcara
bZsijZ αθ −−−−++++====2
(1)
with sijZ is the total sprung mass displacement (i =f for
front, r for rear and j=l for left, r for right), bZ is the
sprung mass vertical displacement at the center of
gravity, carθ is the roll angle and carα is the pitch angle.
The distance of centre of gravity to the front axle and
rear axle are given by fL and rL respectively. The
forces acting at each of the suspension )( ijF is the sum
of the spring force )( sijF and damper force )( dijF . The
suspension forces are given by
dijsijij FFF += (2)
The spring forces, sijF in each of the suspension system
are given by;
)( sijuijsijsij ZZKF −= (3)
with sijK is the spring stiffness of the spring, uijZ and
sijZ are the unsprung mass vertical displacement and
the sprung mass vertical displacement respectively at
each side of the vehicle. The damper forces, dijF are
given by;
)(..
sijuijsijdij ZZCF −= (4)
with sijC are the damping coefficient of the dampers,
uijZ.
and sijZ.
are the unsprung mass vertical velocity
and the sprung mass vertical velocity respectively. For
the vehicle tires, it is modelled as a spring and the force
acting at tires is usually known as dynamic tire loads,
tijF . For each tires, their dynamic tire loads are given
by;
)( uijrijtijtij ZZKF −= (5)
where tijK , rijZ , and ,uijZ are the tire stiffness, road
input displacement and unsprung mass displacement
respectively.
Using Newton’s Second Law at the vehicle’s sprung
mass, the body vertical acceleration, bZ can be
determined by
bbrrrlfrfl ZMFFFF =+++ (6)
where bM is the total mass of the vehicle. Angular
acceleration during the roll effect, carθ is given by;
carxxcar
rrfrcar
rlfl Ia
FFa
FF θ=+−+2
)(2
)( (7)
where a is the vehicle’s track width and xxI is the
moment of inertia about x-axis. The angular acceleration
while the vehicle is in pitch effect, carα it is given by;
Fig. 1 Seven degree of freedom of vehicle ride model
Proceedings of the School of Engineering,Tokai University, Series E- 80-
Saiful Anuar ABU BAKAR, Ryosuke MASUDA, Hiromu HASHIMOTO, Takeshi INABA, Hishamuddin JAMALUDDIN, Roslan ABD. RAHMAN, Pakharuddin MOHD. SAMIN

3
caryyffrflrrrrl ILFFLFF α=+−+ )()( (8)
with yyI are the vehicle’s wheelbase and moment about
y-axis respectively. Acceleration of each wheel can be
calculated using
uijuijdijsijtij ZMFFF =−− (9)
with uijM are the unsprung masses at each corner of the
vehicle. The vehicle ride comfort model was developed
using equations (1) to (9) using Matlab/Simulink.
3. VALIDATION OF VEHICLE RIDE
MODEL
The developed vehicle ride model was validated with
an experimental vehicle in order to determine the
model’s reliability in representing an actual vehicle’s
ride behaviours. A Malaysian made vehicle was used in
validating the developed simulation model.
In vehicle’s instrumentation preparations, several
types of transducers were used and there are three-axis
sensor that measure vertical, longitudinal and lateral
acceleration as well as the rotational motions (roll, pitch
and yaw). The three-axis sensor was located
approximately at the centre of gravity of the vehicle. An
amount of 8 units of single axis accelerometer were
installed at each corner of the vehicle, at the sprung and
unsprung masses. The accelerometers were used to
measure vertical acceleration of vehicle’s sprung and
unsprung masses when the vehicle hit the bump. A
multi-channel Dewetron data acquisition system was
used for the data collection. Figure 2 shows the
instrumentation setup in the vehicle.
Fig. 2 Instrument setup in experimental vehicle
A pitch test was performed during the experiment. In
pitch test, a bump with the dimensions of 2.4m in length,
0.4m in width and 0.075m in height, was used and
arranged perpendicularly to the vehicle’s driving
direction. A speed of 20km/h was used during this test.
In this pitch test, the front wheels will hit the bump
followed by the rear wheels.
Table 1 shows the vehicle parameters used for the
simulation model and Figure 3 shows the validation
results between the experimental and simulation data. It
can be seen that there is a good correlations between the
simulation and experimental data; in terms of responses’
trends.
4. RIDE COMFORT EVALUATIONS ON EV
CONVERSION
The validated ride model was later used to study the
effect of modifications on the passenger vehicle into an
electric vehicle. It is assumed that the experimental
vehicle is about to be converted into an electric vehicle.
The effects of weight distribution in electric vehicle
conversion (EVC) which is biased to the rear of the
vehicle, due to the battery system are investigated. The
evaluations were done by considering two weight
distribution ratios; 60:40 and 40:60 weight distribution
ratios. The 60:40 weight distribution ratio is the
assumption of weight distribution before modifications
while 40:60 weight distribution ratio is the assumption
ratio, after modifications is done. The weight
distribution used, determined the position of centre of
gravity from front and rear axles, fL and rL
respectively. Below are the relation between weight
distribution and the distance of CG to front and rear
axles:
rt
f LL
WW = (10)
ft
r LL
WW = (11)
where fW , rW and tW are weight at the front axle,
weight at the rear axle and vehicle total weight
respectively. Vehicle parameter data in Table 1 were
used in evaluating the ride comfort of the vehicle,
before and after the conversions.
5. EV CONVERSION WITH SEMI ACTIVE
SUSPENSION SYSTEM
Semi active suspension system is considered in
improving EV conversion’s ride comfort performance.
Semi active suspension system is a suspension consists
of conventional spring and a variable damping damper,
controlled electronically. The variable damping damper
can be either a variable orifice damper or a damper
which uses smart material such as Magnetorheological
(MR) damper.
Vol. ⅩⅩⅩⅥ, 2011 - 81-
Evaluations and Improvement of Ride Comfort Performance of Electric Vehicle Conversion

4
Mb 1250 kg Ksfl 17900 N/m
Mufl 50 kg Ksfr 17900 N/m
Mufr 50 kg Ksrl 17900 N/m
Murl 50kg Ksrr 17900 N/m
Murr 50 kg Csfl 3100 Ns/m
a 1.5 Csfr 3100 Ns/m
L 2.6 Csrl 3100 Ns/m
Ixx 289 kgm^2 Csrr 3100 Ns/m
Iyy 3300 kgm^2 Lf (60:40) 1.56 m
Izz 13350 Lr (60:40) 1.04 m
Iw 0.87 kgm^2 Lf (40:60) 1.04 m
Re 0.287 m Lr (40 :60) 1.56 m
c 0.469 m
Ktfl 23000 N/m
Ktfr 23000 N/m
Ktrl 23000 N/m
Ktrr 23000 N/m
Fig. 3 Validations between simulation and experimental data during pitch test
Jerk
-1000
-800
-600
-400
-200
0
200
400
600
800
1000
0 0.5 1 1.5 2 2.5 3 3.5
Time
Jerk
(m
/s3)
Simulation Experiment
Vertical Acceleration
-20
-15
-10
-5
0
5
10
15
0 0.5 1 1.5 2 2.5 3 3.5
Time
Accele
ration (m
/s3)
Simulation Experiment
Vertical Displacement
-0.01
0
0.01
0.02
0.03
0.04
0 0.5 1 1.5 2 2.5 3 3.5
Time
Accele
ration (m
/s3)
Simulation Experiment
Pitch Rate
-0.25
-0.2
-0.15
-0.1
-0.05
0
0.05
0.1
0.15
0.2
0.25
0.3
0.35
0 0.5 1 1.5 2 2.5 3 3.5
Time
Pitch R
ate
(ra
d/s
)
Simulation Experiment
Pitch Angle
-0.025
-0.015
-0.005
0.005
0.015
0.025
0 0.5 1 1.5 2 2.5 3 3.5
Time
Pitch A
ngle
(ra
d)
Simulation Experiment
Table 1 Vehicle Parameters
Proceedings of the School of Engineering,Tokai University, Series E- 82-
Saiful Anuar ABU BAKAR, Ryosuke MASUDA, Hiromu HASHIMOTO, Takeshi INABA, Hishamuddin JAMALUDDIN, Roslan ABD. RAHMAN, Pakharuddin MOHD. SAMIN

5
5.1 Modelling of Magnetorheological and Current
Generator Model
The Magnetorheological (MR) damper was used as a
damping element in EV conversion’s semi active
suspension system. Figure 4 shows the characteristic a
Delphi Magneride Magnetorheological damper used in
this study.
The characteristics of the MR damper was modelled
using the non-parametric data mapping approach [10].
Based on Figure 4, the data mapping involves the
mapping of damping force data from 0 to 5 Ampere
with the velocities range is ±1 m/s. A linear
interpolation and extrapolation on a force-velocity curve
will be made when the input velocity value to the MR
damper is outside or located between the velocity data
using linear interpolation-extrapolation equations.
-6000
-4000
-2000
0
2000
4000
6000
-1.2 -1 -0.8 -0.6 -0.4 -0.2 0 0.2 0.4 0.6 0.8 1 1.2
Velocity(m/s)
Fo
rce(N
)
0A 0.5A 1A 1.5A2A 2.5A 3A 3.5A4A 4.5A 5A
Fig. 4 Delphi MR damper characteristic [9]
The current generator model [10] was developed
based on the inverse characteristic of the Delphi MR
damper’s characteristic. The current generator model is
used to generate specific amount of current based on the
relative
5.2 Skyhook Control Algorithm
Skyhook control system [1] is the most basic and
most common algorithm used in semi-active suspension
system for disturbance rejection control. In skyhook
control system (Figure 5), an imaginary damper is
inserted between the sprung mass and the stationary sky
as shown in Figure 5, as an effort to reduce or eliminate
the motions of sprung mass when the vehicle is
subjected to road inputs such as road harshness or
bumps.
In essence, the skyhook configuration adds more
damping to the sprung mass and takes away damping
from the unsprung mass. The skyhook configuration is
ideal if the primary goal is to isolate the sprung mass
from base excitations, even at the expense of excessive
unsprung mass motion.
The control policy of skyhook system can be
summarized as follows: if the product of the sprung
Fig. 5 Skyhook system
mass velocity, 1X and relative velocity between the
sprung mass and unsprung masses, 12X is positive, the
semi-active force is proportional to the velocity of
sprung mass. Else, the semi-active damping force is set
to zero. The equation governing skyhook control is
given by:
If 0)(...
≥≥≥≥−−−− sus ZZZ then )(..
suhighd ZZCF −−−−====
If 0)(...
<<<<−−−− sus ZZZ then )(..
sulowd ZZCF −−−−====
(12)
where, highC and lowC is the damping coefficient
constants while uZ.
and sZ.
is the unsprung mass
velocity and sprung mass velocity respectively. In the
original skyhook algorithm, lowC is chosen to be 0
because ideally the suspension need to provide
maximum force absorption without any damping
resistance. However this is impossible because the
damper will always have a minimum damping force due
to the fluid friction.
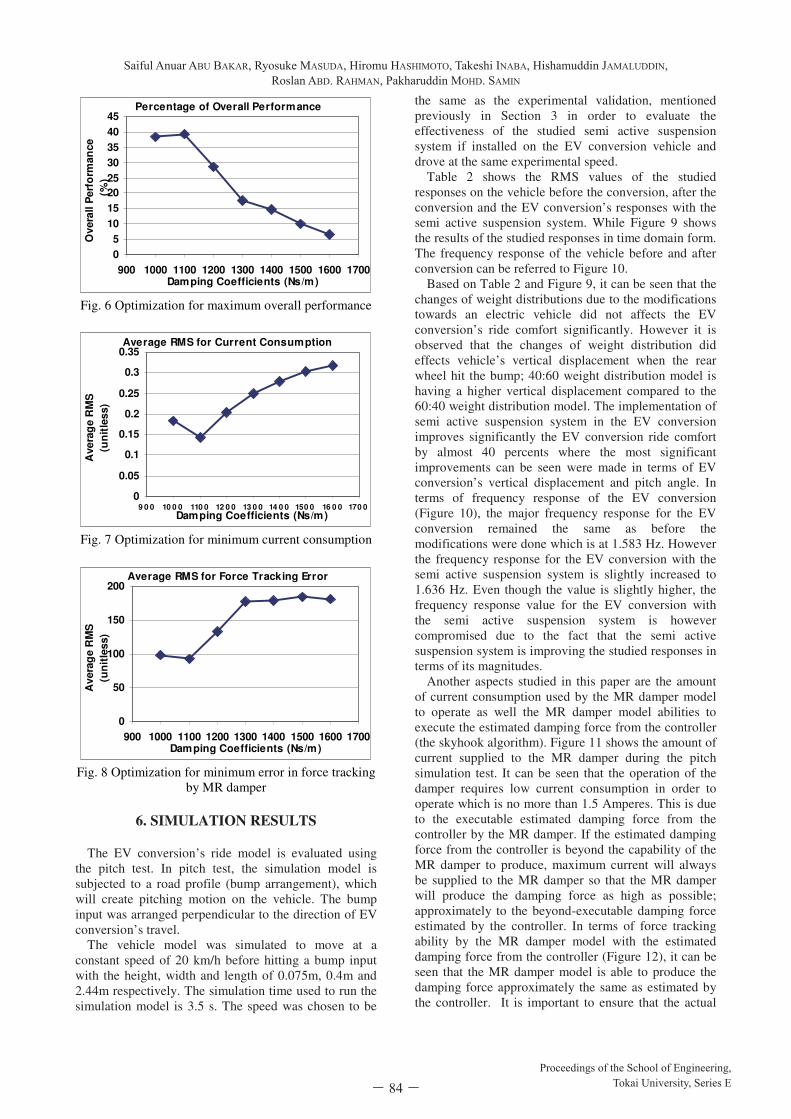
In this simulation the value of lowC was chosen to be
at 1000 Ns/m while the value for highC was tuned
towards an optimal ride comfort performance. The value
for lowC was chosen based on a random selections
within the range of 500 to 1000 Ns/m. It was found that
the value of 1100 Ns/m for highC gave an optimum
overall improvement (Figure 6) and at the same time is
causing minimum current consumption required by the
MR damper to operate (Figure 7). It also gave
minimum error in terms of force tracking between the
estimated damping force from the controller and the
actual damping force produced by the
Magnetoheological damper (Figure 8).
5
5.1 Modelling of Magnetorheological and Current
Generator Model
The Magnetorheological (MR) damper was used as a
damping element in EV conversion’s semi active
suspension system. Figure 4 shows the characteristic a
Delphi Magneride Magnetorheological damper used in
this study.
The characteristics of the MR damper was modelled
using the non-parametric data mapping approach [10].
Based on Figure 4, the data mapping involves the
mapping of damping force data from 0 to 5 Ampere
with the velocities range is ±1 m/s. A linear
interpolation and extrapolation on a force-velocity curve
will be made when the input velocity value to the MR
damper is outside or located between the velocity data
using linear interpolation-extrapolation equations.
-6000
-4000
-2000
0
2000
4000
6000
-1.2 -1 -0.8 -0.6 -0.4 -0.2 0 0.2 0.4 0.6 0.8 1 1.2
Velocity(m/s)
Fo
rce(N
)
0A 0.5A 1A 1.5A2A 2.5A 3A 3.5A4A 4.5A 5A
Fig. 4 Delphi MR damper characteristic [9]
The current generator model [10] was developed
based on the inverse characteristic of the Delphi MR
damper’s characteristic. The current generator model is
used to generate specific amount of current based on the
relative
5.2 Skyhook Control Algorithm
Skyhook control system [1] is the most basic and
most common algorithm used in semi-active suspension
system for disturbance rejection control. In skyhook
control system (Figure 5), an imaginary damper is
inserted between the sprung mass and the stationary sky
as shown in Figure 5, as an effort to reduce or eliminate
the motions of sprung mass when the vehicle is
subjected to road inputs such as road harshness or
bumps.
In essence, the skyhook configuration adds more
damping to the sprung mass and takes away damping
from the unsprung mass. The skyhook configuration is
ideal if the primary goal is to isolate the sprung mass
from base excitations, even at the expense of excessive
unsprung mass motion.
The control policy of skyhook system can be
summarized as follows: if the product of the sprung
Fig. 5 Skyhook system
mass velocity, 1X and relative velocity between the
sprung mass and unsprung masses, 12X is positive, the
semi-active force is proportional to the velocity of
sprung mass. Else, the semi-active damping force is set
to zero. The equation governing skyhook control is
given by:
If 0)(...
≥≥≥≥−−−− sus ZZZ then )(..
suhighd ZZCF −−−−====
If 0)(...
<<<<−−−− sus ZZZ then )(..
sulowd ZZCF −−−−====
(12)
where, highC and lowC is the damping coefficient
constants while uZ.
and sZ.
is the unsprung mass
velocity and sprung mass velocity respectively. In the
original skyhook algorithm, lowC is chosen to be 0
because ideally the suspension need to provide
maximum force absorption without any damping
resistance. However this is impossible because the
damper will always have a minimum damping force due
to the fluid friction.
In this simulation the value of lowC was chosen to be
at 1000 Ns/m while the value for highC was tuned
towards an optimal ride comfort performance. The value
for lowC was chosen based on a random selections
within the range of 500 to 1000 Ns/m. It was found that
the value of 1100 Ns/m for highC gave an optimum
overall improvement (Figure 6) and at the same time is
causing minimum current consumption required by the
MR damper to operate (Figure 7). It also gave
minimum error in terms of force tracking between the
estimated damping force from the controller and the
actual damping force produced by the
Magnetoheological damper (Figure 8).
Vol. ⅩⅩⅩⅥ, 2011 - 83-
Evaluations and Improvement of Ride Comfort Performance of Electric Vehicle Conversion
6
Percentage of Overall Performance
0
5
10
15
20
25
30
35
40
45
900 1000 1100 1200 1300 1400 1500 1600 1700Damping Coefficients (Ns/m)
Overa
ll P
erf
orm
an
ce
(%)
Fig. 6 Optimization for maximum overall performance
Average RMS for Current Consumption
0
0.05
0.1
0.15
0.2
0.25
0.3
0.35
9 0 0 10 0 0 110 0 12 0 0 13 0 0 14 0 0 150 0 16 0 0 170 0
Damping Coefficients (Ns/m)
Avera
ge R
MS
(un
itle
ss)
Fig. 7 Optimization for minimum current consumption
Average RMS for Force Tracking Error
0
50
100
150
200
900 1000 1100 1200 1300 1400 1500 1600 1700Damping Coefficients (Ns/m)
Avera
ge R
MS
(un
itle
ss)
Fig. 8 Optimization for minimum error in force tracking
by MR damper
6. SIMULATION RESULTS
The EV conversion’s ride model is evaluated using
the pitch test. In pitch test, the simulation model is
subjected to a road profile (bump arrangement), which
will create pitching motion on the vehicle. The bump
input was arranged perpendicular to the direction of EV
conversion’s travel.
The vehicle model was simulated to move at a
constant speed of 20 km/h before hitting a bump input
with the height, width and length of 0.075m, 0.4m and
2.44m respectively. The simulation time used to run the
simulation model is 3.5 s. The speed was chosen to be
the same as the experimental validation, mentioned
previously in Section 3 in order to evaluate the
effectiveness of the studied semi active suspension
system if installed on the EV conversion vehicle and
drove at the same experimental speed.
Table 2 shows the RMS values of the studied
responses on the vehicle before the conversion, after the
conversion and the EV conversion’s responses with the
semi active suspension system. While Figure 9 shows
the results of the studied responses in time domain form.
The frequency response of the vehicle before and after
conversion can be referred to Figure 10.
Based on Table 2 and Figure 9, it can be seen that the
changes of weight distributions due to the modifications
towards an electric vehicle did not affects the EV
conversion’s ride comfort significantly. However it is
observed that the changes of weight distribution did
effects vehicle’s vertical displacement when the rear
wheel hit the bump; 40:60 weight distribution model is
having a higher vertical displacement compared to the
60:40 weight distribution model. The implementation of
semi active suspension system in the EV conversion
improves significantly the EV conversion ride comfort
by almost 40 percents where the most significant
improvements can be seen were made in terms of EV
conversion’s vertical displacement and pitch angle. In
terms of frequency response of the EV conversion
(Figure 10), the major frequency response for the EV
conversion remained the same as before the
modifications were done which is at 1.583 Hz. However
the frequency response for the EV conversion with the
semi active suspension system is slightly increased to
1.636 Hz. Even though the value is slightly higher, the
frequency response value for the EV conversion with
the semi active suspension system is however
compromised due to the fact that the semi active
suspension system is improving the studied responses in
terms of its magnitudes.
Another aspects studied in this paper are the amount
of current consumption used by the MR damper model
to operate as well the MR damper model abilities to
execute the estimated damping force from the controller
(the skyhook algorithm). Figure 11 shows the amount of
current supplied to the MR damper during the pitch
simulation test. It can be seen that the operation of the
damper requires low current consumption in order to
operate which is no more than 1.5 Amperes. This is due
to the executable estimated damping force from the
controller by the MR damper. If the estimated damping
force from the controller is beyond the capability of the
MR damper to produce, maximum current will always
be supplied to the MR damper so that the MR damper
will produce the damping force as high as possible;
approximately to the beyond-executable damping force
estimated by the controller. In terms of force tracking
ability by the MR damper model with the estimated
damping force from the controller (Figure 12), it can be
seen that the MR damper model is able to produce the
damping force approximately the same as estimated by
the controller. It is important to ensure that the actual
Proceedings of the School of Engineering,Tokai University, Series E- 84-
Saiful Anuar ABU BAKAR, Ryosuke MASUDA, Hiromu HASHIMOTO, Takeshi INABA, Hishamuddin JAMALUDDIN, Roslan ABD. RAHMAN, Pakharuddin MOHD. SAMIN
7
damping force produced by the MR damper is
approximately the same as the estimated damping force
to ensure the semi active suspension system is giving an
optimal ride comfort performance without causing the
semi active suspension system to ‘under-work’ or ‘over-
work’. This is done by optimally tune the controller
used in this type of suspension system.
7. CONCLUSIONS
As for conclusions, the vehicle modifications into an
electric vehicle do not significantly reduce the vehicle
ride comfort performance except the vehicle’s vertical
displacement response. This is possibly being improved
by using the magnetorheological semi active suspension
system. In this study, the semi active suspension system
was found not only to improve the EV conversion’s
vertical displacement response, but other responses as
well i.e. jerk, vertical acceleration, pitch rate and pitch
angle. Low current consumption in operating the
magnetorheological damper in the EV conversion has
also made the semi active suspension system, a good
alternative of suspension system to be incorporated in
real world EV conversion, since it does not add
significant electrical load to the power system of the EV
conversion.
REFERENCES
[1] Shino, M., Miyamoto, N., Wang, Y. Q. and Nagai,
M. (2000). Traction Control of Electric Vehicles
Considering Vehicle Stability. Advanced Motion
Control, 2000. Proceedings. 6th International
Workshop on Advanced Motion Control.
[2] Niasar, A. H., Moghbeli, H. and Kazemi, R. (2003).
Yaw Moment Control Via Emotional Adaptive Neuro-
Fuzzy Controller for Independent Rear Wheel Drives of
an Electric Vehicle. Proceedings of 2003 IEEE
Conference on Control Applications.
[3] Donghyun, K., Sungho, H. and Hyunsoo, K. (2005)
Rear Motor Control for a 4wd Hybrid Electric Vehicle
Stability. IEEE International Conference on Vehicular
Electronics and Safety
[4] Miyazaki, H. and Ohmae, T. (2005). Driving
Stability for Electric Vehicle with Independently Driven
Two Wheels in Case of Inverter Failure. European
Conference on Power Electronics and Application.
[5] Sado, H., Sakai, S. and Hori, Y. (1999). Road
Condition Estimation for Traction Control in Electric
Vehicle. Proceedings of the IEEE International
Symposium on Industrial Electronics.
[6] Pusca, R., Ait-Amirat, Y., Berthon, A. and
Kauffmann, J. M. (2002). Modeling and Simulation of a
Traction Control Algorithm for an Electric Vehicle with
Four Separate Wheel Drives. IEEE 56th Vehicular
Technology Conference.
[7] Wjalili-Kharaajoo, M. and Besharati, F. (2003).
Sliding Mode Traction Control of an Electric Vehicle
with Four Separate Wheel Drives. IEEE Conference on
Emerging Technologies and Factory Automation.
[8] Hudha, K., Jamaluddin, H., Samin, P. M. and
Rahman, R. A. (2003). Vehicle Modelling and
Validations: Experience with Proton Car. International
Association of Vehicle System Dynamics (IAVSD).
August 24-30. Kanagawa, Japan.
[9] Samin, P.M., Jamaluddin H., Rahman, R. A, Anuar,
S. and Hudha, K. (2008). Semi-Active Suspension
System For Handling Quality and Longitudinal Stability
Improvements Using Hybrid Stability Augmentation
System-Force Control Algorithm. 2nd
Regional
Conference on Vehicle Engineering and Technology.
15-16 July. Kuala Lumpur, Malaysia.
[10] Abu Bakar, S. A., Rahman, R. Abd., Jamaluddin,
H., Rahman, Samin, P. M., Hudha, K., (2008) Vehicle
Ride Performance With Semi Active Suspension
System Using Modified Skyhook Control Algorithm
and Current Generator Control. International Journal
Of Vehicle Autonomous System. Vol. 6, No. 3, pp 197-
121.
[11] Karnopp, D., Crosby, M. J. and Farwood R.A.
(1974). Vibration Control Using Semi-active Force
Generators. ASME Journal Of Engineering Industry.
96(2):619-626.
ACKNOWLEDGEMENT
The authors wish to acknowledge the supports given
by the Tokai University, Japan and Universiti Teknologi
Malaysia that has made this research successful.
Vol. ⅩⅩⅩⅥ, 2011 - 85-
Evaluations and Improvement of Ride Comfort Performance of Electric Vehicle Conversion
8
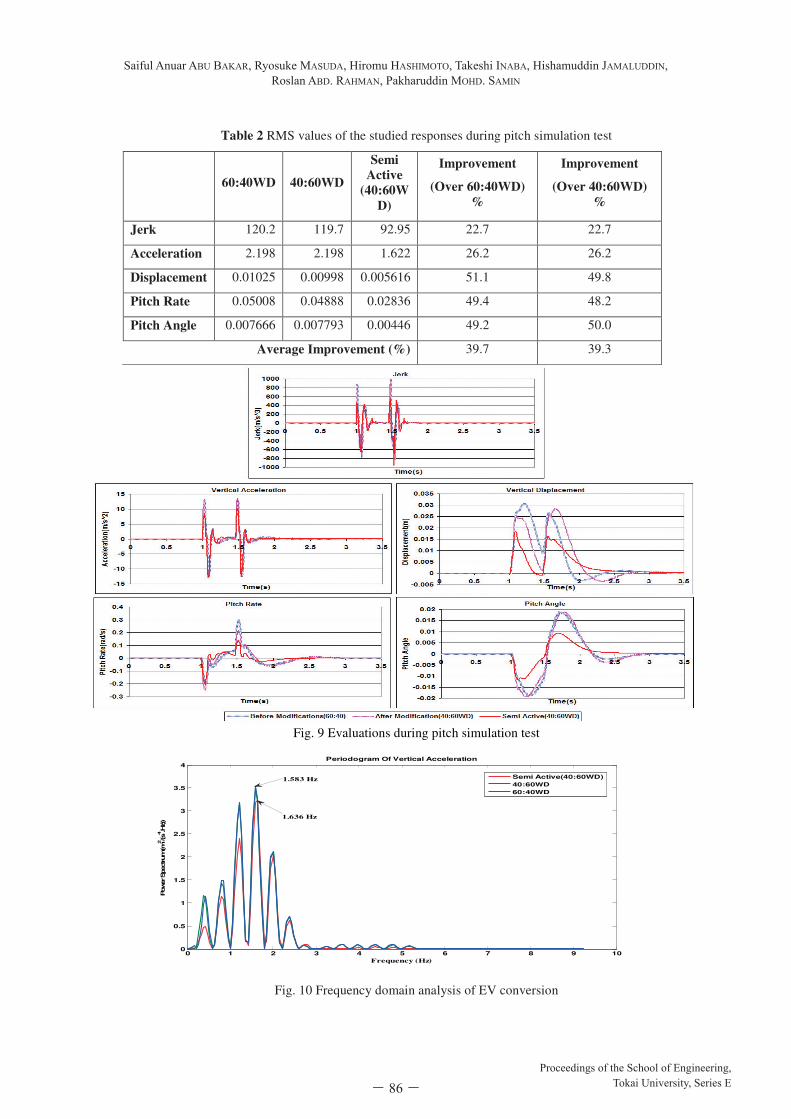
Table 2 RMS values of the studied responses during pitch simulation test
60:40WD 40:60WD
Semi
Active
(40:60W
D)
Improvement
(Over 60:40WD)
%
Improvement
(Over 40:60WD)
%
Jerk 120.2 119.7 92.95 22.7 22.7
Acceleration 2.198 2.198 1.622 26.2 26.2
Displacement 0.01025 0.00998 0.005616 51.1 49.8
Pitch Rate 0.05008 0.04888 0.02836 49.4 48.2
Pitch Angle 0.007666 0.007793 0.00446 49.2 50.0
Average Improvement (%) 39.7 39.3
Fig. 9 Evaluations during pitch simulation test
0 1 2 3 4 5 6 7 8 9 100
0.5
1
1.5
2
2.5
3
3.5
4
Frequency (Hz)
Power Spectrum (m
2/(s4.H
z))
Periodogram Of Vertical Acceleration
Semi Active(40:60WD)
40:60WD
60:40WD
1.636 Hz
1.583 Hz
Fig. 10 Frequency domain analysis of EV conversion
8
Table 2 RMS values of the studied responses during pitch simulation test
60:40WD 40:60WD
Semi
Active
(40:60W
D)
Improvement
(Over 60:40WD)
%
Improvement
(Over 40:60WD)
%
Jerk 120.2 119.7 92.95 22.7 22.7
Acceleration 2.198 2.198 1.622 26.2 26.2
Displacement 0.01025 0.00998 0.005616 51.1 49.8
Pitch Rate 0.05008 0.04888 0.02836 49.4 48.2
Pitch Angle 0.007666 0.007793 0.00446 49.2 50.0
Average Improvement (%) 39.7 39.3
Fig. 9 Evaluations during pitch simulation test
0 1 2 3 4 5 6 7 8 9 100
0.5
1
1.5
2
2.5
3
3.5
4
Frequency (Hz)
Power Spectrum (m
2/(s4.H
z))
Periodogram Of Vertical Acceleration
Semi Active(40:60WD)
40:60WD
60:40WD
1.636 Hz
1.583 Hz
Fig. 10 Frequency domain analysis of EV conversion
Proceedings of the School of Engineering,Tokai University, Series E- 86-
Saiful Anuar ABU BAKAR, Ryosuke MASUDA, Hiromu HASHIMOTO, Takeshi INABA, Hishamuddin JAMALUDDIN, Roslan ABD. RAHMAN, Pakharuddin MOHD. SAMIN

9
Current Consumption by MR Damper
0
0.25
0.5
0.75
1
1.25
1.5
0.5 0.75 1 1.25 1.5 1.75 2
Time(s)
Cu
rre
nt (A
mpe
re)
Front Left MR Damper Front Right MR Damper
Rear Left MR Damper Rear Right MR Damper
Fig. 11 MR damper current consumption
Front Left and Front Right Force Tracking
-5500-5000-4500-4000-3500-3000-2500-2000-1500-1000-500
0500
1000150020002500300035004000
0 0.5 1 1.5 2 2.5 3 3.5
Time(s)
Da
mp
ing
Fo
rce
(N)
Desired Actual
Rear Left and Rear Right Force Tracking
-5500-5000-4500-4000-3500-3000-2500-2000-1500-1000-500
0500
1000150020002500300035004000
0 0.5 1 1.5 2 2.5 3 3.5
Time(s)
Da
mp
ing
Fo
rce
(N)
Desired Actual
Fig. 12 Force tracking in magnetorheological semi active suspension system
Vol. ⅩⅩⅩⅥ, 2011 - 87-
Evaluations and Improvement of Ride Comfort Performance of Electric Vehicle Conversion


![MSSP modeling and validation of off-road vehicle ride ... · enhancement in vehicle ride vibration isolations and driver/passengers comfort and health [5-7]. However, the documented](https://static.fdocuments.in/doc/165x107/5ec7819a4a959e2b4d04a98d/mssp-modeling-and-validation-of-off-road-vehicle-ride-enhancement-in-vehicle.jpg)