Evaluation Study on Functioning of Primary Health Centres...
47
1 Evaluation Study on Functioning of Primary Health Centres(PHCs) Assisted under Social Safety Net Programme (SSNP) Programme Evaluation Organisation Planning Commission Government of India New Delhi August, 2001
Transcript of Evaluation Study on Functioning of Primary Health Centres...

1
Evaluation Study on
Functioning of Primary Health Centres(PHCs)
Assisted under Social Safety Net Programme (SSNP)
Programme Evaluation Organisation Planning Commission Government of India
New Delhi August, 2001

2
Contents
Page No. I. Preface i
II. Executive Summary iii
Chapter
1. Introduction 1
2. The Evaluation Study - Objectives and Methodology 4
3. Health Infrastructure in PHCs - Availability and Adequacy 9
4. Population Coverage and Utilisation of Medical Services 19
5. Utility of PHCs – Beneficiaries’ Views 29
Appendices
I. Appendix Tables 43
2. Project Team 48

i
Preface
Social Safety Net Programme (SSNP) of the World Bank for family welfare initiated in 1992-93 for a period of five years has assisted the Primary Health Centres (PHCs) of the identified districts in creation of a combination of essential complementary facilities by providing a lump sum amount of Rs.10 lakh/PHC/annum, which could help facilitate the institutional deliveries of the pregnant mothers. The Programme ultimately aims at reducing the maternal and child mortality rates in the identified areas.
At the instance of the Planning Commission, the Programme Evaluation Organisation undertook the study to evaluate the functioning of Primary Health Centres (PHCs) assisted under SSNP and their effectiveness in facilitating the institutional deliveries.
The requisite data were generated through a sample survey of 167 patients, 24 PHCs spread over six districts of three states selected for the study.
The main findings of the study are as follows:
(a) Not even a single sample PHC under SSNP is found to be equipped with the requisite combination of complementary facilities including the post of a lady doctor. Consequently, non-utilisation of PHCs for facilitating the institutional deliveries of pregnant mothers due to mis-match between man-power and complementary facilities on the one hand and creation of thin infrastructure on the other has resulted in wasteful expenditure of scarce resources, wherever such infrastructure was created.
(b) The routine cases with common ailments are attended by para-medical and other auxiliary para-medical staff due to absenteeism among doctors. However, the cases with serious complications and which require indoor health care services are not attended by PHCs due to non-availability of diagnostic facilities.
(c) Notwithstanding the existing limitations in the health services delivery system, a large majority of the beneficiaries expressed their preferences for Primary Health Centres for seeking treatment over the other alternative sources of health care facilities.
The findings tend to suggest the PHCs assisted under SSNP have not made any contributions towards realisation of the intended objective of facilitating the institutional deliveries due to inability of the concerned authorities to create the requisite essential complementary infrastructural facilities. Besides, the study has been able to identify a set of key factors that have contributed to the poor performance of PHCs. It is hoped that the findings of the study will be useful to the Planning/Implementing agencies in introducing the necessary corrective steps for improving the service delivery system.
The study received constant support and encouragement from Deputy Chairman, Minister of State for Planning, Statistics and Programme Implementation, Chairman (EAC) and Secretary, Planning Commission. The study was designed and conducted under the direction of Shri Amar Singh, Deputy Adviser (PEO). The present shape to the study was given under the over all supervision and guidance of Dr. S.P.Pal, the then Adviser. The efforts put in by the officers of PEO (Hqrs.) and Regional/Project Evaluation Offices under the guidance of Shri V.K.Bhatia, Joint Adviser (PEO) in completing the study deserve special mention.

ii
The help and cooperation extended by the officers of the Union Ministry of Health and Family Welfare and Health and Family Welfare Division of Planning Commission at different stages of study is gratefully acknowledged.
New Delhi (Arvind Virmani) Adviser(Evaluation)
August, 2001.

iii
Executive Summary The Social Safety Net Programme (SSNP) assisted by World Bank for family welfare was initiated in 1992-93 for a period of five years in 90 poor performing districts which were characterised by high maternal mortality rate and low levels of institutional deliveries. The programme has envisaged to reduce the maternal mortality rate by creating essential health infrastructural facilities including the post of lady doctor in the identified PHCs for facilitating institutional deliveries of pregnant mothers. The essential infrastructural facilities that are required to be created in each PHC under the programme included (a) well equipped operation theatre, (b) labour room, (c) an observation ward, (d) two quarters, one each for auxiliary nurse mid-wife and lady health worker, (e) a generator, (f) provision of supply of safe drinking water (g) an ambulance. In addition, however, the post of a lady doctor is required to be created by the concerned state governments. The amount sanctioned per PHC is Rs.10.00 lakh. Evaluation Study At the instance of the Planning Commission, the Programme Evaluation Organisation undertook the study to evaluate the functioning of Primary Health Centres (PHCs) assisted under Social Safety Net Programme (SSNP) and their effectiveness in facilitating institutional deliveries. Methodology At the time of preparation of design for conducting evaluation study on functioning of CHCs in 1996, it was decided to assess the impact of SSNP simultaneously through a combined design. Accordingly, while carrying out the field survey on CHCs, information on relevant aspects of sample PHCs which were assisted under SSNP were also collected. The methodology in assessing the impact of SSNP on PHCs is, therefore, the same as was adopted in the case of the study on functioning of CHCs.
For testing the hypotheses implicit in the aforesaid objectives, both primary and
secondary data were generated through sample survey. A multi-stage sample design was adopted for the study. The sample units at different stages are :States, Districts, PHCs and patients. The first sample units were the six states initially selected to represent the good and poor health status of the population by using infant mortality rate as a stratifying parameter. However, during the field survey, it was found that the three districts in the states of Madhya Pradesh, Rajasthan and Bihar had not received the funds under the Social Safety Net Programme (SSNP). Consequently, it was decided that the study would remain confined to the selected districts of the remaining three states of Haryana, Orissa and Uttar Pradesh where the programme was implemented.
The study design has adopted with and without approach to yield therapeutic results
and, therefore, two districts - one assisted and the other not assisted under SSNP were selected from each state in the second stage of sampling. In the third stage, four PHCs from each district were selected. Eight patients from each PHC were selected in the fourth stage of sampling.

iv
Following the above sampling design, 167 patients, 24 PHCs spread over six sample districts of three states were selected for the study. In each selected village, the views of the knowledgeable persons were taken for preparation of qualitative notes on functioning of PHCs. Health Infrastructure in PHCs - Availability and Adequacy
During 1995-96 none of the 12 assisted sample PHCs was found to be equipped with
all the eight essential facilities; viz; well equipped operation theatre, labour room, observation ward, two quarters, generator, drinking water, ambulance and lady doctor that were required to be created in each PHC. Of the eight essential complementary facilities including the post of lady doctor, a maximum of six facilities were created in 3 PHCs followed by five facilities in 4 PHCs, four facilities in 1 PHC and two facilities in 4 PHCs (Table 3.3). Such a variation in creation of essential facilities in sample PHCs against an equal allocated amount of Rs.10 lakh/PHC needs a closer look. This follows that the facilities in PHCs have been created thinly and in an isolated manner as against the envisaged plan of creation of a complete package of complementary facilities in PHCs for facilitating institutional deliveries.
Among the requisite facilities, the post of lady doctor for attending on delivery cases
is envisaged to be most essential, but none of the sample PHCs had been posted with a lady doctor. Though, a few facilities like labour rooms, operation theatres and observation wards are available in many of the sample PHCs, such facilities could not be utilised for attending delivery cases without the availability of lady doctors. This mis-match between the manpower and essential facilities is a matter of serious concern. Interestingly, amidst the existing thin facilities, ambulances are made available in seven out of 12 sample PHCs (Tables 3.1 and 3.2). Availability of Man-power
The adequacy of doctors against their sanctioned posts seems to be encouraging, as 75
per cent of doctors are in position in assisted PHCs, while 96 per cent of them are found in position in non-assisted PHCs (Tables 3.4 and 3.4A). In this context, however, the observations of PEO field teams reveal that in practice the absenteeism among the doctors from their work places is very high which is observed to be a binding constraint in utilisation of health care services in sample PHCs. Population Coverage
On an average, the population coverage by a programme assisted PHC is 68386 people and it is 57705 people by a non-assisted PHC against the prescribed norm of 20,000 to 30,000 people per PHC (Tables 4.1 and 4.1A). As far as coverage of sub-centres by a PHC is concerned, it is noticed that at the aggregate level, about 11 sub-centres are served by a programme assisted PHC and the coverage of sub-centres by a non-assisted PHC is about 12 sub-centres against the prescribed norm of 6 sub-centres per PHC.
More coverage of population and sub-centres by a PHC in large majority of the cases
are indicative of the facts that adequate number of PHCs have not been established against their requirement. This not only affects the quality and delivery of health care services adversely, but also accentuates the problem of overcrowding in CHCs and district hospitals.

v
Utilisation of Medical Services
It is noticed that none of the sample PHCs has attended the delivery cases during
1995-96 (Tables 4.2 and 4.2A). This corroborates the earlier finding which has indicated that such PHCs are not found equipped with all essential complementary facilities including the posts of lady doctors for attending on delivery cases. This tends to suggest that Social Safety Net Programme has not been able to achieve the objective of facilitating and popularisation of institutional deliveries. The average utilisation of cases in PHCs with SSNP is 30 cases/day/doctor, while it is 25 in non-assisted PHCs. However, the inter-PHC comparison of utilisation rate reveals a variation across the sample states. The utilisation rate of health care services in PHCs as observed above should not be taken as reflection of true performance and functionality of PHCs. In this context, qualitative information gathered by PEO field teams through their indepth probing and discussions reveals that in the absence of doctors, the cases coming to PHCs are attended by para-medical and auxiliary para-medical staff. It was also observed by the field teams that since the PHCs were not equipped with diagnostic facilities, the patients preferred to visit tertiary/district hospitals for treatment of their ailments. Utility of PHCs - Beneficiaries' Views
The profile of beneficiaries reveals that a maximum of 32.93 per cent of beneficiaries
have sought the treatment for minor ailments, like, cold, cough and fever. This is followed by the cases suffering from water borne diseases (14.63%), vaccine preventable diseases (8.54%), respiratory diseases (8.53%) and gynaecological complications (4.88%) respectively (Table 5.2). Similar results are found for non-assisted PHCs (Table 5.2A).
As many as 51.22 per cent of beneficiaries belonging to programme assisted PHCs
are found to be dissatisfied with the functioning of PHCs (Table 5.3). Further, of the dissatisfied beneficiaries, a majority have complained about medical and para-medical staff of PHCs. The main reasons for their dissatisfaction included non-availability of medical and para-medical staff (42.85%), not examined by doctors (52.38%) and proper attention not given (35.71%). The second important reason for dissatisfaction of beneficiaries was the non-availability of medicines in PHCs. About 66.67 per cent of the beneficiaries expressed this view. Similar results are obtained for non-assisted PHCs also (Table 5.3A).
Despite inadequacies in the delivery of health care services by PHCs, a vast majority
of about 89 per cent of beneficiaries belonging to programme assisted PHCs and about 96 per cent beneficiaries from non-assisted PHCs have still expressed their preferences for PHCs for seeking health care services over other alternative sources of treatment (Tables 5.4 and 5.4A).
It is revealed that 54.88 per cent of beneficiaries belonging to assisted PHCs and
94.12 per cent belonging to non-assisted PHCs have incurred private expenditure on various items while seeking treatment in PHCs. A majority of 73.33 per cent beneficiaries belonging to assisted PHCs and 52.50 per cent belonging to non-assisted PHCs have incurred private expenditure below Rs.100 per illness episode. Besides, major chunk of expenditure made by the sample beneficiaries of all categories is on purchasing medicines (Tables 5.5 and 5.5A).

vi
The income profile of beneficiaries belonging to programme assisted PHCs reveals
that the beneficiaries whose average monthly income was below Rs.500 have formed a small percentage of 3.66, while a majority (63.41%) of the beneficiaries are from the monthly income group of above Rs.1000 (Table 5.6). Similar results are obtained for non-assisted PHCs also.
The low-income group households seem to stay away from the public health care
delivery system primarily because of non-availability of medicine, indirect cost on transport and high opportunity cost in terms of foregone income (due to loss of wage income say). They, therefore, seem to depend on cheaper alternatives, such as traditional Indian medicines or unqualified medical practitioners.
It is interesting to note that a large majority beneficiaries of the public health delivery
system have expressed willingness to pay for the services if the quality of delivery improves. In the PEO sample survey the beneficiaries were asked if they would be willing to pay 25% of the market cost of treatment if the quality of delivery improves. About 62% of the beneficiaries replied in the affirmative. This is not surprising in view of the fact that the beneficiaries do incur both direct (medicine, clinical tests) and indirect (transport, loss of wage income, inconvenience) costs for availing public health care facilities. Suggestions The study brings out the fact that the PHCs have not been able to deliver the intended health care and medical services to the people in the rural areas. The following suggestions are made for improving their performance.
1. To ensure the availability, adequacy and functionality of health infrastructural facilities including the medical and para-medical staff in PHCs, there is an urgent need to emphasise the systemic mechanism of supervision, monitoring and review of the functioning of primary health care institutions. This will not only help improve the quality of health delivery system, but also ensure optimum use of public resources.
2. A holistic approach to primary health care system needs to be adopted which
should strive to integrate the allopathic system of medicine with Indian systems of medicine. The Indian systems of medicine has advantage over the western system of medicine on many counts. For instance, the allopathic treatment and medicines are becoming increasingly unaffordable and the study has clearly brought home the point that non-availability of medicines in PHCs is one of the main constraints being faced by the people in general and the poorest of the poor in particular.
3. If the adequate number of lady doctors are not available for posting in the rural
areas, the para-medical staff especially the Nurses should be provided training on obstetric/gynaecology so as to enable them to popularise and facilitate the institutional deliveries.
4. The existing PHCs should be made equipped with essential infrastructure and
diagnostic facilities which will help increase the utilisation rate. Besides,

vii
medicines should be made available in PHCs especially for those who are living below the poverty line.
5. To overcome the hardships being faced by the people in the rural areas due to non-availability/absenteeism of doctors, it is suggested that the local village level health workers as paramedics should be trained on basic medicine, health care, hygiene and nutrition for posting in PHCs and their functioning should be monitored and supervised by PRI’s.

1
Chapter 1
Introduction
In the rural areas, the primary health care services are delivered through three types of health care institutions comprising a sub-centre (SC) for a population of 3000-5000, a Primary Health Centre (PHC) for 20000 to 30000 population and a Community Health Centre (CHC) as referral centre for every four PHCs.
1.2 Social Safety Net Programme (SSNP) with assistance from the World Bank for family welfare was initiated in 1992-93 for a period of five years in 90 poor performing districts which were identified on the basis of high birth rates, high infant mortality rates and very low levels of institutional deliveries. While majority (83) of these identified districts are located in the four states of Bihar, Madhya Pradesh, Rajasthan and Uttar Pradesh, the remaining seven districts are identified in the five states of Orissa, Haryana, Kerala, West Bengal and Gujarat.
1.3 An amount of Rs. 50 lakh/district/annum was allocated for creation of essential infrastructural facilities in selected PHCs. The concerned state governments were required to select five PHCs in each of the identified districts for upgradation of facilities by releasing Rs. 10 lakh/PHC/annum under SSNP.
1.4 The infrastructural facilities that were required to be created in the identified PHCs for facilitating the institutional deliveries included (a) a well equipped operation theatre, (b) labour room, (c) an observation ward, (d) two quarters (one for lady health worker and one for auxiliary nurse mid-wife), (e) provision of water supply, (f) one generator and (g) one ambulance. Besides, one post of lady doctor was also required to be created by the State Governments in each of the identified PHCs under the revamping activities.
1.5 The programme aims at reducing maternal mortality rates by providing essential health infrastructural facilities in the identified PHCs for facilitating the institutional deliveries of the pregnant mothers.
1.6 The other functions of PHCs include providing regular in-patient and out-patient health care services, implementation of family welfare programme and national health programmes, prevention and control of endemic diseases, basic sanitation, immunisation, etc.
1.7 The staffing pattern envisaged for each PHC includes one medical officer, one pharmacist, one nurse mid-wife (Staff Nurse), one female health worker/ANM, one health educator, one male health assistant, one female health assistant/LHV, one U.D.C, one L.D.C, one lab. technician, one driver (subject to availability of vehicle) and four class-IV.
1.8 However, the Fifth Five Year Plan document admitted the shortfalls of earlier plans in health sector especially related to disparities in availability of facilities for health care, preventive medicines, medical treatment, family planning, etc., between the rural and urban areas and also the slow pace of the establishment of Primary Health Centres (PHCs) and Sub-centres (SCs) in the rural areas.
Need for the Study
1.9 The approach paper to the Ninth Plan noted that many of our development objectives have not been realised owing to inadequacies in implementation. In this context, it needs to be examined whether the objectives of Social Safety Net Programme (SSNP) are actually being realised besides making an assessment of overall functioning of PHCs in the rural areas.

2
1.10 In view of the above, it is imperative to get insight into the overall functioning of the Primary Health Centres (PHCs) assisted under SSNP. Hence, the need to evaluate such PHCs was felt. The study would provide useful inputs to the policy makers and the implementors for taking corrective measures on disparities, bottle necks, etc., if any, in the functioning of PHCs.

3
Chapter 2
The Evaluation Study - Objectives and Methodology
At the instance of the Planning Commission, the Programme Evaluation Organisation undertook the study on functioning of Primary Health Centres (PHCs) which were assisted under Social Safety Net Programme of the World Bank. The primary objective of the study was to ascertain whether the essential infrastructural facilities had been created in the PHCs and assess the extent of utilization of such facilities for institutional deliveries. However, the specific objectives inter-alia included the assessment and examination of :
2.2 Objectives
i. availability and adequacy of medical, para-medical and supporting staff in PHCs;
ii. extent of utilization of health care services available in PHCs; and
iii. quality of health care services delivered by PHCs.
2.3 Methodology
At the time of preparation of design for conducting evaluation study on functioning of CHCs in 1996, it was decided to assess the impact of SSNP simultaneously through a combined design. Accordingly, while carrying out the field survey on CHCs, information on relevant aspects of sample PHCs which were assisted under SSNP was also collected. The methodology in assessing the impact of SSNP on PHCs is, therefore, the same as was adopted for the study on functioning of CHCs.
2.4 For testing the hypotheses implicit in the aforesaid objectives, both primary and secondary data were generated through sample survey. A multi-stage sampling design was adopted for the study. The sample units at different stages are: States, Districts, PHCs and Patients. The first sample units were the six states initially selected to represent the good and poor health status of the population by using infant mortality rate as a stratifying parameter. However, during the field survey, it was found that the three districts in the states of Madhya Pradesh, Rajasthan and Bihar had not received the funds under the Social Safety Net Programme (SSNP). Consequently, it was decided that the study would remain confined to the selected districts of the remaining three states of Haryana, Orissa and Uttar Pradesh where the programme was implemented.
2.5 The study design has adopted with and without approach to yield therapeutic results and, therefore, two districts - one assisted and the other not assisted under SSNP were selected from each state in the second stage of sampling. In the third stage, four PHCs from each district were selected. Eight patients from each PHC were selected in the fourth stage of sampling.
2.6 While secondary data obtained through the PHC level schedules were used to assess the availability and adequacy of man-power, essential infrastructural facilities, appropriateness of population norm for establishment of PHCs and utilisation of PHCs, the primary data collected through field team’s observations and beneficiary schedules formed the basis for assessing the quality of health care delivery system.
4
2.7 Instruments
The following instruments of observation were structured for collection of both quantitative and qualitative data.
1. PHC Level Schedule
2. Patient Schedule
3. Guide points for preparation of qualitative notes by REOs and PEOs.
2.8 PHC Level Schedule
This schedule was structured to collect secondary data at PHC level on availability of infrastructural facilities, medical, para-medical and supporting staff, utilisation of health care services for both indoor and outdoor patients including performance of family welfare programmes.
2.9 Patient Schedule
This schedule was designed with a view to collecting primary information on profile of beneficiaries, type of ailments, quality of health care services and level of their satisfaction.
2.10 Sampling Design
The multi-stage sampling design adopted in the study is as follows:
2.10.1 States
Six states were selected to represent the good and poor health status of the population. The infant mortality was used as a stratifying parameter. Four states, viz, Madhya Pradesh, Uttar Pradesh, Rajasthan and Orissa having IMR higher than the national average and another two states, viz, Bihar and Haryana with IMR less than or equal to national average were chosen for the study. As has already been mentioned that during the field investigation it was found that of the six districts, three selected districts in the states of Madhya Pradesh, Rajasthan and Bihar had not received the funds under the Social Safety Net Programme. Consequently, it was decided that the study would remain confined to the selected districts of the remaining three states of Haryana, Orissa and Uttar Pradesh where the programme was implemented.
2.10.2 Districts
From each state, two districts (one assisted under SSNP and the other non-assisted) were selected randomly.
2.10.3 Primary Health Centres (PHCs)
Four PHCs from each district were selected randomly.
2.10.4 Respondents
Eight patient respondents were selected from each PHC.

5
2.11 Coverage
Thus, the coverage of sample size is as under:
With SSNP Without SSNP Total
1. Districts 3 3 6
2. PHCs 12 12 24
3. Patient Respondents 96(82) 96(85) 192(167)
Figures in parentheses represent actual against the envisaged units.
2.12 Reference Period
The reference period for the study was from 1992-93 to 1996-97.
2.13 Orientation of Field Teams
The combined design prepared for both the studies on functioning of Community Health Centres (CHCs) and functioning of Primary Health Centres (PHCs) assisted under the Social Safety Net Programme were discussed and finalised in a meeting of the Heads of the Regional Evaluation Offices of the PEO held on 23-9-1996 at the PEO Headquarters. The REOs in turn held two orientation programmes for their field teams at Calcutta on 13th and 14th October and at Kanya Kumari on 17th and 18th October, 1996.
2.14 Field Work
The field work was initiated in November, 1996 and completed in February, 1997. The field teams stayed in the selected districts, blocks and villages for canvassing of the schedules at different levels and recording their observations on various aspects based on discussions held with the implementing functionaries and the knowledgeable persons.

6
Chapter 3
Health Infrastructure in PHCs - Availability and Adequacy
Social Safety Net Programme (SSNP) assisted by the World Bank for family welfare has envisaged to reduce maternal mortality rates by facilitating institutional deliveries under aseptic conditions in PHCs where essential infrastructural facilities would be created. The essential infrastructural facilities which were required to be created in an identified PHC for meeting the said objective included (a) one well equipped operation theatre, (b) one labour room, (c) one observation ward, (d) two quarters (one for ANM and one for lady health worker), (e) one generator, (f) running water and (g) one ambulance. Besides, one post of lady doctor was also required to be created in each PHC by the concerned state Governments under revamping activities.
3.2 The data collected on availability of essential infrastructural facilities in 12 sample PHCs assisted under the programme is presented in Tables 3.1 through 3.3.
Table 3.1 : Creation of Infrastructural facilities in Sample PHCs assisted under SSNP during 1995-96
Operation Theatre Labour Room Observation Ward Lady Doctor State District PHC
Already existed before SSNP
Created under SSNP
Already existed before SSNP
Created under SSNP
Already existed before SSNP
Created under SSNP
Avai-lable before SSNP
Avai-lable under SSNP
1 0 0 0 * * 0 0 0
2 0 0 0 * 0 0 0 0
3 * 0 0 * 0 * 0 0
Haryana Bhiwani
4 * 0 0 * * 0 0 0
5 0 * 0 * 0 * 0 0
6 0 * 0 * 0 * 0 0
7 0 * 0 * 0 * 0 0
Orissa Baleshwar
8 0 * 0 * 0 * 0 0
9 0 * 0 * * 0 0 0
10 0 * 0 * * 0 0 0
11 0 * 0 * * 0 0 0
U.P. Hardoi
12 0 * 0 * * 0 0 0
Total 2 8 0 12 6 5 0 0

7
Table 3.2 : Creation of Infrastructural Facilities in Sample PHCs Assisted under SSNP during 1995-96
Quarter Generator Running Water Ambulance State District PHC
Already existed before SSNP
Created under SSNP
Already existed before SSNP
Created under SSNP
Already existed before SSNP
Provi-ded under SSNP
Already existed before SSNP
Provi-ded under SSNP
1 0 * 0 0 0 0 0 0
2 0 * 0 0 0 0 0 0
3 0 0 0 0 0 0 0 0
Haryana Bhiwani
4 0 * 0 0 * 0 0 0
5 0 0 0 * 0 0 0 *
6 0 0 0 * 0 0 0 *
7 0 0 0 * 0 0 0 *
Orissa Baleshwar
8 0 0 0 * 0 0 0 *
9 0 * 0 * 0 * 0 *
10 0 * 0 * 0 * 0 *
11 0 * 0 * 0 0 0 0
U.P. Hardoi
12 0 * 0 * 0 * 0 *
Total 0 7 0 8 1 3 0 7
3.3 It can be seen from Tables 3.1 and 3.2 that none of the assisted sample PHCs has been equipped with a required combination of all the eight essential facilities including the post of lady doctor. Among the requisite facilities, the post of lady doctor for attending on delivery cases is envisaged to be most essential, but none of the sample PHCs has been posted with a lady doctor. Though labour room, operation theatre and observation ward are available in majority of the sample PHCs, yet such facilities could not be utilised for attending delivery cases without the availability of lady doctor. This mis-match between the man power and essential facilities is a matter of serious concern. Interestingly, amidst the existing thin facilities, ambulances are made available in seven out of 12 sample PHCs.
Table 3.3 : No. of Assisted Sample PHCs Equipped with Availability/Creation of Essential Facilities during 1995-96
No. of PHCs equipped with :
PHCs 0 0 3 4 1 0 4 0
Facilities 8 7 6 5 4 3 2 1
3.4 Importantly, of the package of eight essential complementary facilities including the post of lady doctor which were required to be created in each PHC in an integrated manner for facilitating the institutional deliveries, it is noticed from Table 3.3 that a maximum of six facilities are created only in 3 PHCs and a minimum of 2 facilities are available in 4 PHCs, while the remaining 4 PHCs and 1 PHC could create only 5 and 4 facilities respectively. Such a variation in creation of essential facilities in sample PHCs against an equal allocated amount of Rs.10 lakh/PHC needs a closer look. This follows that the available facilities in PHCs have been created thinly and in an isolated manner as against the envisaged plan of

8
creation of integrated complementary facilities in PHCs for facilitating the institutional deliveries.
3.5 This tends to suggest that not only there is an inadequacy of facilities that are essential for PHCs to become functional, but also there is a mis-match between the complementary facilities and man-power. Such an inadequacy of both essential facilities and man-power on the one hand and mis-match of complementary facilities on the other are likely to affect the utilisation rate adversely in PHCs.
3.6 To understand as to whether these facilities were available in other PHCs which were not assisted under SSNP, the data collected on availability of these essential facilities in 12 sample PHCs is presented in Table 3.2A.
Table 3.2A : Availability of Infrastructural Facilities in Sample PHCs without SSNP during 1995-96
State District PHC Opera-tion
Theatre
Labour Room
Obser-vation Ward
Quar-ter
Gene-rator
Run-ning Water
Ambu-lance
Lady Doc-tor
1 0 0 0 0 0 0 0 0 2 0 0 0 0 0 0 0 0 3 0 0 0 0 0 0 0 0
Haryana Ambala
4 0 0 0 0 0 0 0 0 5 0 * 0 * 0 * 0 0 6 * 0 0 * 0 0 0 0 7 * * 0 * 0 0 0 0
Orissa Sambalpur
8 * 0 0 * 0 0 0 0 9 0 0 0 0 0 0 0 0 10 0 0 0 0 0 0 0 0 11 0 0 0 0 0 0 0 0
U.P. Ballia
12 0 0 0 0 0 0 0 0 Total 3 2 0 4 0 1 0 0
3.7 It is noticed that while these facilities were not available in sample PHCs of Haryana and U.P., a few facilities; viz., operation theatre, labour room, quarters and running water are made available in some of the sample PHCs of Orissa.
Man-Power
3.8 While assessing the availability and adequacy of essential complementary facilities created under the programme, it is thought desirable to examine the availability of the existing man-power both in programme assisted and non-assisted sample PHCs, which will help understand the utilisation rates of such PHCs in the subsequent chapter.
Doctors
3.9 The data collected on availability of doctors both in programme assisted and non-assisted sample PHCs are presented in Tables 3.4 and 3.4A.

9
Table 3.4 : Availability of Doctors in Sample PHCs Assisted under SSNP during 1995-96
State District PHC Sanctioned In Position Vacant 1 2 1 1 2 2 0 2 3 2 1 1 4 2 2 0
Haryana Bhiwani
8 4 4 5 1 1 0 6 1 1 0 7 1 1 0 8 1 1 0
Orissa Baleshwar
4 4 0 9 2 1 1 10 2 2 0 11 2 2 0 12 2 2 0
U. P Hardoi
8 7 1 Total 20 15 5
Table 3.4A : Availability of Doctors in Non-assisted Sample PHCs during 1995-96
State District PHC Sanctioned In Position Vacant 1 2 1 1 2 2 2 0 3 2 2 0 4 2 2 0
Haryana Ambala
8 7 1 5 3 3 0 6 2 2 0 7 2 2 0 8 2 2 0
Orissa Sambalpur
9 9 0 9 2 2 0 10 2 2 0 11 2 2 0 12 2 2 0
U. P Ballia
8 8 0 Total 25 24 1
3.10 It can be seen from tables 3.4 and 3.4A that adequacy of doctors against their sanctioned posts seems to be encouraging, while 75 per cent of doctors are in position in assisted PHCs, 96 per cent of them are found in position in non-assisted PHCs. This follows that the position of availability of doctors is better in non-assisted sample PHCs than in assisted PHCs, which can be explained by factors, like, location of such PHCs in better off districts where physical infrastructure including connectivity is better. In this context, however, the observation of PEO field teams reveals that in practice the absenteeism among

10
doctors from their work places is very high which is found to be a binding constraint in utilisation of health care services both in programme assisted and non-assisted PHCs.
3.11 The tables 3.5 and 3.5A present the availability of main para-medical staff both in assisted and non-assisted sample PHCs.
Table 3.5 : Availability of Main Para-Medical Staff in Sample PHCs Assisted under SSNP during 1995-96
Pharmacist Nurse Mid wife Lab-Technician State District PHC S P V S P V S P V
1 1 1 0 1 1 0 1 0 1 2 1 1 0 1 0 1 1 0 1 3 1 1 0 1 1 0 1 1 0 4 1 0 1 1 1 0 1 1 0
Haryana Bhiwani
4 3 1 4 3 1 4 2 2 5 1 0 1 0 0 0 0 0 0 6 1 1 0 0 0 0 0 0 0 7 1 1 0 0 0 0 0 0 0 8 1 1 0 0 0 0 0 0 0
Orissa Baleshwar
4 3 1 0 0 0 0 0 0 9 1 1 0 0 0 0 1 0 1
10 1 1 0 0 0 0 1 1 0 11 1 0 1 0 0 0 1 0 1 12 1 1 0 0 0 0 1 1 0
U.P. Hardoi
4 3 1 0 0 0 4 2 2 Total 12 9 3 4 3 1 8 4 4
Table 3.5A : Availability of Main Para-Medical Staff in Sample PHCs Non-assisted under SSNP during 1995-96
Pharmacist Nurse Mid wife Lab-Technician State District PHC S P V S P V S P V
1 1 1 0 1 1 0 1 1 0 2 1 1 0 1 1 0 1 1 0 3 2 2 0 1 1 0 2 2 0 4 1 1 0 1 1 0 1 1 0
Haryana Ambala
5 5 0 4 4 0 5 5 0 5 2 2 0 0 0 0 1 1 0 6 1 1 0 0 0 0 1 1 0 7 4 3 1 0 0 0 1 1 0 8 1 1 0 0 0 0 2 2 0
Orissa Sambalpur
8 7 1 - - - 5 5 0 9 1 1 0 0 0 0 1 0 1
10 1 1 0 0 0 0 0 0 0 11 1 1 0 0 0 0 1 1 0 12 1 1 0 0 0 0 1 1 0
U.P. Ballia
4 4 0 0 0 0 3 2 1 Total 17 16 1 4 4 0 13 12 1
S, P and V represent sanctioned, in position and vacant posts respectively.

11
3.12 It is revealed that while posts of Nurse Mid-wives were not sanctioned in all assisted and non-assisted sample PHCs of Orissa and Uttar Pradesh, the posts of lab. technicians were not sanctioned only in assisted sample PHCs of Orissa. The overall availability of main para-medical staff in the remaining PHCs is observed to be satisfactory.
3.13 Though no discernible shortfall of availability of main para-medical staff against their sanctioned posts is observed in the remaining PHCs, the overall availability of such staff is found to be better in non-assisted PHCs than in assisted PHCs.
3.14 The Tables 3.6 and 3.6A present the availability of auxiliary para-medical staff in assisted and non-assisted PHCs
Table 3.6 : Availability of Auxiliary Para-Medical Staff in Sample PHCs Assisted under SSNP during 1995-96
Health Assistant Health Worker Health Educator Male Female
State District PHC S P V S P V S P V S P V 1 7 6 1 0 0 0 1 0 1 1 0 1 2 5 5 0 0 0 0 1 1 0 1 1 0 3 11 11 0 0 0 0 2 2 0 2 1 1 4 7 7 0 0 0 0 6 6 0 1 1 0
Haryana Bhiwani
30 29 1 0 0 0 10 9 1 5 3 2 5 1 1 0 0 0 0 1 1 0 1 1 0 6 1 1 0 0 0 0 0 0 0 1 1 0 7 1 1 0 0 0 0 1 1 0 1 1 0 8 1 1 0 0 0 0 0 0 0 0 0 0
Orissa Baleshwar
4 4 0 0 0 0 2 2 0 3 3 0 9 24 24 0 1 1 0 4 4 0 4 2 2
10 25 23 2 1 0 1 4 4 0 4 1 3 11 6 6 0 0 0 0 1 1 0 1 1 0 12 23 23 0 1 1 0 4 4 0 4 4 0
U.P. Hardoi
78 76 2 3 2 1 13 13 0 13 8 5 Total 112 109 3 3 2 1 25 24 1 21 14 7
Table 3.6 A: Availability of Auxiliary Para-Medical Staff in Sample PHCs Non- assisted under SSNP during 1995-96
Health Assistant Health Worker Health Educator Male Female
State District PHC
S P V S P V S P V S P V 1 6 6 0 0 0 0 1 0 1 1 1 0 2 7 7 0 0 0 0 3 3 0 2 2 0 3 7 7 0 0 0 0 1 1 0 1 1 0 4 8 8 0 0 0 0 1 1 0 1 1 0
Haryana Ambala
28 28 0 0 0 0 6 5 1 5 5 0 5 2 2 0 0 0 0 1 1 0 1 1 0 6 2 1 1 0 0 0 0 0 0 1 1 0 7 2 2 0 0 0 0 1 1 0 1 1 0 8 2 1 1 0 0 0 0 0 0 0 0 0
Orissa Sambalpur
8 6 2 0 0 0 2 2 0 3 3 0 9 20 19 1 1 1 0 4 2 2 2 1 1 U.P. Ballia
10 1 0 1 0 0 0 1 1 0 1 0 1

12
11 23 23 0 1 1 0 7 6 1 3 3 0 12 1 1 0 0 0 0 1 1 0 1 1 0
45 43 2 2 2 0 13 10 3 7 5 2 Total 81 77 4 2 2 0 21 17 4 15 13 2
3.15 The tables reveal that while a wide variation is observed in availability of number of posts of health workers and health assistants across sample PHCs of three states, the posts of health educators are not sanctioned in PHCs of Haryana and Orissa. The overall availability of auxiliary staff in all sample PHCs is found to be satisfactory.
3.16 The data on availability of supporting staff in assisted and non-assisted sample PHCs are presented in Tables 3.7 and 3.7A.
Table 3.7 :Availability of Supporting Staff in sample PHCs Assisted under SSNP during 1995-96
UDC LDC Driver Class-IV State District PHC S P V S P V S P V S P V 1 0 0 0 0 0 0 0 0 0 4 2 2 2 0 0 0 0 0 0 0 0 0 1 1 0 3 0 0 0 0 0 0 0 0 0 2 2 0 4 0 0 0 0 0 0 0 0 0 4 4 0
Haryana
Bhiwani
0 0 0 0 0 0 0 0 0 11 9 2 5 0 0 0 0 0 0 0 0 0 2 2 0 6 0 0 0 0 0 0 0 0 0 2 2 0 7 0 0 0 0 0 0 0 0 0 2 2 0 8 0 0 0 0 0 0 0 0 0 3 3 0
Orissa Baleshwar
0 0 0 0 0 0 0 0 0 9 9 0 9 1 0 1 0 0 0 1 1 0 3 3 0
10 1 1 0 0 0 0 1 1 0 5 5 0 11 1 1 0 1 0 1 1 0 1 3 3 0 12 1 1 0 1 1 0 1 1 0 6 6 0
U.P. Hardoi
4 3 1 2 1 1 4 3 1 17 17 0 Total 4 3 1 2 1 1 4 3 1 37 35 2
S, P and V indicate sanctioned, in position and vacant posts respectively in relevant columns.
Table 3.7A : Availability of Supporting Staff in Sample PHCs Non- assisted under SSNP during 1995-96
UDC LDC Driver Class-IV State District PHC S P V S P V S P V S P V
1 0 0 0 0 0 0 0 0 0 2 2 0
2 0 0 0 0 0 0 0 0 0 3 3 0
3 0 0 0 0 0 0 0 0 0 4 4 0
4 0 0 0 0 0 0 0 0 0 2 2 0
Haryana Ambala
0 0 0 0 0 0 0 0 0 11 11 0
5 0 0 0 1 1 0 1 1 0 8 8 0 Orissa Sambalpur
6 0 0 0 2 2 0 1 1 0 9 9 0

13
7 0 0 0 1 1 0 1 1 0 21 21 0
8 0 0 0 1 1 0 1 1 0 8 8 0
0 0 0 5 5 0 4 4 0 46 46 0
9 1 1 0 0 0 0 1 1 0 3 3 0
10 0 0 0 0 0 0 0 0 0 2 1 1
11 1 0 1 0 0 0 1 0 1 3 3 0
12 0 0 0 0 0 0 0 0 0 2 2 0
U.P. Ballia
2 1 1 0 0 0 2 1 1 10 9 1
Total 2 1 1 5 5 0 6 5 1 67 66 1
3.17 The same degree of variation as noticed in the case of para-medical staff is also observed in availability of number of supporting staff across sample PHCs. While a maximum number of posts of class IV staff are sanctioned and available in all sample PHCs of three states, the posts of UDCs, LDCs and Drivers are not sanctioned in any of the PHCs of Haryana. In the remaining sample PHCs, the shortfall in availability of sanctioned posts of supporting staff is observed to be insignificant. However, another instance of mis-match between the complementary facility and man-power is observed in programme assisted PHCs of Orissa, where it is found that though the ambulances were made available to assisted PHCs, the posts of drivers are not sanctioned in all the sample PHCs of Orissa ( Tables 3.2 and 3.7).

14
Chapter 4
Population Coverage and Utilisation of Medical Services
A PHC is established with a population norm of 20,000 people for hill and tribal areas and 30,000 people for plain area. The PHC is also required to serve 6 sub-centres within its jurisdiction. In this context, an attempt has been made to understand as to whether such norms had been followed when the PHCs were established.
4.2 The data collected on coverage of population and sub-centres by programme assisted and non-assisted sample PHCs during 1995-96 is presented in Tables 4.1 and 4.1A .
Table 4.1 : Coverage of Population and Sub-centres by Sample PHCs with SSNP during 1995-96
Coverage of State District PHC Population Sub-centre
Haryana Bhiwani 1 38235 7 2 34199 5 3 59803 11 4 35651 6 Orissa Baleshwar 5 27319 7 6 40000 5 7 72875 8 8 57023 4 U.P. Hardoi 9 138688 22 10 141338 25 11 40000 6 12 135501 21 Total 820632 127
Coverage per PHC 68386 10.58
Table 4.1A : Coverage of Population and Sub-centres by Sample PHCs without SSNP during 1995-96
Coverage of State District PHC Population Sub-centre
Haryana Ambala 1 34642 6 2 40430 7 3 36604 7 4 14874 8 Orissa Sambalpur 5 78012 18 6 48225 12 7 82557 19 8 45382 13 U.P. Ballia 9 109426 20 10 45000 4 11 121000 19 12 36304 6 Total 692456 139
Coverage per PHC 57705 11.58

15
4.3 It can be seen from the Tables that on an average, while the population coverage by a programme assisted PHC is 68386 people, it is 57705 people by a non-assisted PHC. This indicates that adequate number of PHCs against their requirement have not been established in the rural areas, as they are covering the population more than the prescribed norm.
4.4 However, the inter-PHC comparison reveals a wide variation in coverage of population across the states. Of the 12 programme assisted PHCs, only one sample PHC in Orissa has a population coverage of 27319 people which is well within the prescribed norm, while the remaining PHCs are observed to have covered population higher than the prescribed norm with a variation from a minimum of 34,199 people by a PHC in Haryana to a maximum of 1.4 lakh by a PHC in Uttar Pradesh.
4.5 Again the inter-PHC comparison of 12 non-assisted sample PHCs reveals that while only one PHC in Haryana has a population coverage of 14874 people which is less than the prescribed norm, the remaining PHCs have higher coverage of population than the prescribed norm. The variation in coverage is observed to be from a minimum of 34642 by a PHC in Haryana to a maximum of 1.2 lakh people by a PHC in Uttar Pradesh.
4.6 Besides, the inter-state comparison of population coverage by both types of assisted and non-assisted PHCs reveals that average coverage of population by a PHC is the maximum in Uttar Pradesh which is followed by Orissa and Haryana.
4.7 As far as coverage of sub-centres by a PHC is concerned, it is noticed from the Tables 4.1 and 4.1A that at the aggregate level, while about 11 sub-centres are served by a programme assisted PHC, the coverage of sub-centres by a non-assisted PHC is about 12 sub-centres. Thus, in both cases, the average coverage of sub-centres by a PHC is twice high the prescribed norm of 6 sub-centres per PHC.
4.8 The inter-PHC comparison of coverage of sub-centres by a programme assisted PHC reveals a wide variations across PHCs. It is found that while only 5 PHCs have served the sub-centres less than or equal to the prescribed norm, the remaining PHCs which constitute a majority have served more number of sub-centres than the prescribed norm. The variation observed in this case is from a minimum of 7 sub-centres per PHC in Haryana to a maximum of 25 in Uttar Pradesh.
4.9 In the case of sample PHCs which were not assisted under the programme, it is found that while only 3 PHCs have served the sub-centres less than or equal to the prescribed norm, the remaining 9 PHCs have served more number of sub-centres than the prescribed norm with a variation from a minimum of 7 sub-centres by a PHC in Haryana to a maximum of 20 sub-centres per PHC in Uttar Pradesh.
4.10 All this tends to suggest that more coverage of population and sub-centres by a PHC in large majority of the cases is indicative of the fact that adequate number of PHCs have not been established against their requirement. This not only affects the quality and delivery of health care services adversely, but also accentuates the problem of over crowding in CHCs and district hospitals.
Utilisation of Medical Services for Delivery Cases
4.11 Utilisation of health care and medical services for delivery cases in a PHC depends on availability of doctors, para-medical staff and requisite essential complementary facilities. Therefore, the financial assistance under SSNP was given for creation of a combination of essential facilities in a PHC which would help reduce the gap between supply and demand for health care and medical services for delivery cases.

16
4.12 Tables 4.2 and 4.2A present the cases attended (indoor and outdoor patients) by sample PHCs with and without assistance under SSNP respectively during 1995-96.
Table 4.2 : Cases Attended and Referred by Sample PHCs with SSNP during 1995-96
Cases attended by PHC Referred to CHC/ District Hospital
Indoor
State District PHC
Delivery cases
Others
Outdoor
Total Cases attended/ day/ doctor
Indoor Outdoor
Total
1 0 103 2850 2953 10 0 26 26 2 0 0 5362 5362 18* 0 0 0 3 0 10 4463 4473 15 0 41 41 4 0 0 5060 5060 9 0 31 31
Haryana
Bhiwani
0 113 17735 17848 13 0 98 98 5 0 15 10191 10206 34 2 NA 2 6 0 0 19286 19286 64 NA NA NA 7 0 0 6489 6489 22 0 187 187 8 0 0 22582 22582 75 0 2 2
Orissa Baleshwar
0 15 58548 58563 49 2 189 191 9 0 127 21075 21202 71 0 0 0 10 0 4 12162 12166 21 0 0 0 11 0 110 5897 6007 10 0 0 0 12 0 33 18926 18959 32 5 16 21
U.P. Hardoi
0 274 58060 58334 34 5 16 21 Total 0 402 134343 134745 30 7 303 310
* Cases attended by other than doctors.
Table 4.2A : Cases Attended and Referred by Sample PHCs without SSNP during 1995-96
Cases attended by PHC Referred to CHC/ District Hospital
Indoor
State District PHC
Delivery cases
Others Outdoor Total Cases
attended/ day/ doctor
Indoor Outdoor
Total
1 0 5 7636 7641 25 0 0 0 2 0 0 16115 16115 27 0 0 0 3 0 423 36753 37176 53 35 308 343 4 0 20 6395 6415 11 0 51 51
Haryana Bhiwani
0 448 66899 67347 31 35 359 394 5 0 740 11748 12488 14 0 0 0 6 0 631 11760 12391 21 17 0 17 7 0 106 17000 17106 29 4 192 196 8 0 3166 17402 20568 35 17 150 167
Orissa Baleshwar
0 4643 57910 62553 25 38 342 380 9 0 0 11616 11616 20 0 0 0 10 0 0 12675 12675 21 0 0 0 11 0 12 11616 11628 20 0 0 0 12 0 0 12270 12270 21 0 0 0
U.P. Hardoi
0 12 48177 48189 21 0 0 0 Total 0 5103 172986 178089 25 73 701 774
4.13 It can be seen from the tables that none of the sample PHCs either assisted or non-assisted under SSNP has attended the delivery cases during 1995-96. This corroborates the finding of the preceding chapter on availability of health infrastructure where it is noted that particularly those PHCs which were assisted under SSNP are found not

17
equipped with all essential complementary facilities including the post of lady doctor for attending on delivery cases. This tends to suggest that non availability of a package of essential facilities and consequently non-utilisation of delivery cases by programme assisted PHCs have defeated the objective of the programme for facilitating the institutional deliveries.
Overall Utilisation
4.14 Cases attended by PHCs include both indoor and outdoor patients. While the indoor patients which include family planning cases also are observed to have not attended by some PHCs, the outdoor cases are attended by all PHCs during 1995-96.
4.15 While the average utilisation of cases in PHCs with SSNP is 30 cases/day/doctor, it is 25 for non-assisted PHCs. However, the inter-PHC comparison of utilisation rate reveals a variation across the sample PHCs. In the case of PHCs assisted under the programme, the variation in utilisation of cases/day/doctor is from a minimum of 9 for a PHC in Haryana to a maximum of 75 for a PHC in Orissa. However, in the case of PHCs not assisted under the programme, the degree of variation in utilisation of cases/day/doctor for sample PHCs in U.P. is observed to be from 20 to 21 cases/day/doctor which is very low as compared to that of sample PHCs in Haryana, which is from a minimum of 11 to a maximum of 53 cases/day/doctor.
4.16 The utilisation rate of health care services in PHCs as observed above should not be taken as reflection of true performance and functionality of PHCs. In this context, qualitative information gathered by PEO field teams through their indepth probing and discussions reveals that in the absence of doctors, the cases coming to PHCs are attended by para-medical and auxiliary para-medical staff. It was also observed by the field teams that since the PHCs were not equipped with diagnostic facilities, the patients preferred to visit tertiary/district hospitals for treatment of their ailments.
Family Welfare Indices
4.17 Other functions of PHCs include the implementation of Family Welfare Programmes. Therefore, It was also thought desirable to assess the role of PHCs in implementation of family welfare programmes.
4.18 Tables 4.3 and 4.3A present the percentage achievement of family planning methods by sample PHCs with and without SSNP respectively during 1992-93 to1995-96
Table 4.3 : Percentage Achievement of Family Planning Methods by Sample PHCs Assisted under SSNP during 1992-93 to 1995-96
Permanent Temporary State Target %Ach. Target % Ach.
Haryana 2640 80.61 21114 62.03 Orissa 3374 82.93 12551 77.83 U.P. 7750 69.17 55876 108.59 Total 13764 74.74 89541 93.30
18
Table 4.3A : Percentage Achievement of Family Planning Methods by Non-assisted Sample PHCs during 1992-93 to 1995-96.
Permanent Temporary State Target %Ach. Target % Ach.
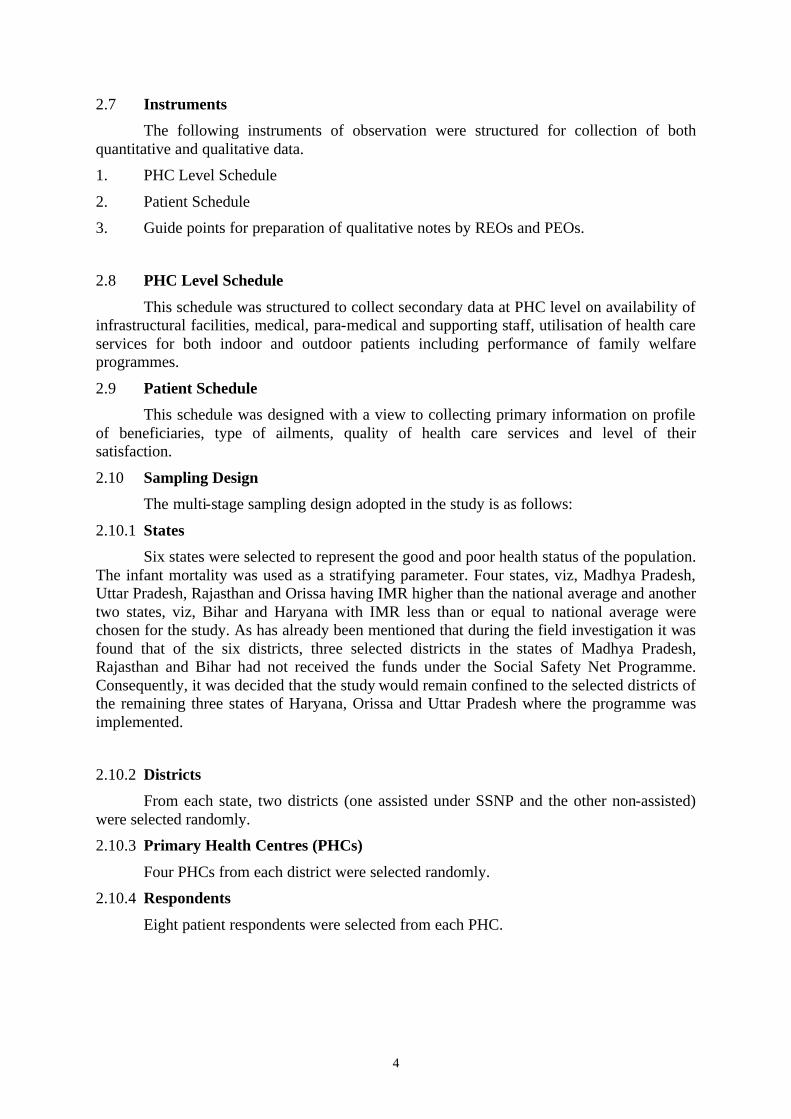
Haryana 3290 68.91 25303 80.67 Orissa 6273 80.26 24449 98.35 U.P. 6029 51.38 46206 88.56 Total 15592 66.70 95958 88.97
4.19 At the aggregate level, while 74.74 per cent of target for permanent methods of family planning was achieved by sample PHCs with SSNP during 1992-93 to 1995-96, the percentage achievement of target for the same by sample PHCs without SSNP was 66.70. Similarly, in the case of performance of temporary methods of family planning, the percentage achievement of target by the sample PHCs with SSNP is 93.30, while it is 88.97 per cent for sample PHCs without SSNP during the corresponding period. This indicates better performance of family planning methods carried out by sample PHCs which were assisted under the programme. However, the inter-state and inter-PHC comparisons of performance of family planning methods carried out by sample PHCs with SSNP and without SSNP reveal variation in percentage achievement of targets.
4.20 Tables 4.4 and 4.4A present the percentage achievement of ante natal check ups for nutritional deficiencies by sample PHCs with SSNP and without SSNP during 1992-93 to 1995-96.
Table 4.4 : Percentage Achievement of Ante natal Check ups/Immunisation for Expectant Mothers by sample PHCs Assisted under SSNP during 1992-93 to 1995-96.
Prophylaxis Blindness due to Vit.`A’ deficiency Tetanus Against Nutritional Anemia Among Total Women
1st Doze 2nd to 5th doze State
Target
%Ach. Target %Ach. Target %Ach. Target %Ach.
Haryana 17294
59.06 12242 69.69 9258 85.88 8441 79.46
Orissa 20741
74.68 18288 70.75 17874 78.20 12305 87.73
U.P. 38035
161.24 66134 83.54 52598 98.17 47312 95.58
Total 96557
90.13 96664 79.36 79730 92.26 68058 92.16

19
Table 4.4A : Percentage Achievement of Ante natal Check-ups/ Immunisation for Expectant Mothers by Non-Assisted Sample PHCs during 1992-93 to 1995-96.
Prophylaxis Blindness due to Vit.'A' deficiency Tetanus Against Nutritional Anemia Among Total Women
1st Doze 2nd to 5th doze State
Target
%Ach. Target %Ach. Target %Ach. Target %Ach.
Haryana 11863
100.23 11989 159.59 10582 105.10 10348 120.70
Orissa 30022
88.06 31672 93.49 26323 103.37 12459 108.61
U.P. 56882
57.45 41983 56.08 45413 66.01 42873 44.83
Total 98767
71.89 85644 84.41 82318 82.98 65681 68.88
4.21 At the aggregate level, while 90.13 per cent of target for tetanus immunisation is achieved by sample PHCs with SSNP during 1992-93 to 1995-96, it is 71.89 per cent for the sample PHCs without SSNP during the corresponding period.
4.22 In the case of nutritional anemia among total women, the aggregate percentage achievement of target by sample PHCs with SSNP is found to be 79.36, while it is 84.41 per cent for the sample PHCs without SSNP during 1992-93 to 1995-96.
4.23 Similarly, the performance of sample PHCs with SSNP in treating cases of blindness due to vitamin A deficiency is observed to be better than that of sample PHCs without SSNP. This follows that except administering the prophylaxis, the performance of PHCs with SSNP in ante natal check ups and immunisation is found to be better than that of PHCs without SSNP.
4.24 Tables 4.5 and 4.5A present the percentage achievement of immunisation against vaccine preventable diseases for children by sample PHCs with SSNP and without SSNP during 1992-93 to 1995-96.
Table 4.5 : Percentage Achievement of Immunisation against Vaccine Preventable Diseases for Children by Sample PHCs Assisted under SSNP during 1992-93 to 1995-96.
D.P.T. Polio BCG Measles State Targe
t %Ach. Target %Ach. Target %Ach. Target %Ach.
Haryana
15934
71.41 15934 71.41 15934 103.60 16043 67.81
Orissa 18414
85.11 18414 85.11 18414 83.25 18414 70.40
U.P. 58581
99.31 58581 99.33 56570 106.41 58670 96.56
Total 92929
91.71 92929 91.72 90918 101.23 93127 86.44

20
Table 4.5A : Percentage Achievement of Immunisation against Vaccine Preventable Diseases for Children by Non-assisted Sample PHCs during 1992-93 to 1995-96.
D.P.T. Polio BCG Measles State Targe
t %Ach. Target %Ach. Target %Ach. Target %Ach.
Haryana
10886
104.07 10826 105.54 10876 106.85 10876 99.31
Orissa 26942
99.62 26942 99.25 26942 105.79 27001 96.37
U.P. 45219
83.45 42779 80.87 45219 84.97 45218 85.03
Total 83047
91.40 80547 90.20 83037 94.59 83095 90.59
4.25 In this case also, at the aggregate level, except for measles the performance of sample PHCs with SSNP in achievement of targets is observed to be higher than that the sample PHCs without SSNP.
4.26 Tables 4.6 and 4.6A present the percentage achievement of T.T. and DT Immunisation by sample PHCs with and without SSNP during 1992-93 to 1995-96.
Table 4.6 : Percentage Achievement of D.T. Immunisation by Sample PHCs Assisted under SSNP during 1992-93 to 1995-96
T.T. for 10 years T.T. for 16 years DT Immunisation for children
State
Target %Ach Target %Ach Target %Ach Haryana 10860 51.10 9465 28.08 13156 68.52 Orissa 13998 86.61 13412 75.98 14903 86.69 U.P. 36530 91.90 34225 85.53 40219 63.56 Total 61388 83.48 57102 73.77 68278 69.56
Table 4.6A : Percentage Achievement of D.T. Immunisation for Children by Non-assisted Sample PHCs during 1992-93 to 1995-96
T.T. for 10 years T.T. for 16 years DT Immunisation for children
State
Target %Ach Target %Ach Target %Ach Haryana 8385 121.34 7696 112.37 8922 150.73 Orissa 21922 102.50 20908 99.79 22975 123.80 U.P. 30237 66.29 31756 59.57 31342 79.50 Total 60544 87.02 60360 80.24 63239 105.69
4.27 At the aggregate level, while the percentage achievements of targets for T.T for 10 years, T.T. for 16 years and D.T. immunisation made by sample PHCs with SSNP were observed to be 83.48, 73.77 and 69.56 respectively during 1992-93 to 1995-96, the

21
corresponding figures for sample PHCs without SSNP during the same period are 87.02 per cent, 80.24 per cent and 105.69 per cent respectively. This indicates that the performance of sample PHCs with SSNP in achieving the targets for T.T and D.T. immunisation has remained less than that of sample PHCs without SSNP.

22
Chapter 5
Utility of PHCs - Beneficiaries' Views
The analysis in the preceding chapters has indicated that non-utilisation of institutional delivery cases and low utilisation of indoor patient services are primarily due to non-availability of complementary facilities including man-power and diagnostic facilities in PHCs. However, a large number of people were still found utilising the outdoor patient services despite inadequacies in the delivery system, which needs further explanation. This would help identify the extent and nature of demand for such services on the one hand and the quality of delivery of health care services on the other.
5.2 It is with this objective that an attempt is made in this chapter to analyse the profile of PHC beneficiaries and views expressed by them about the quality of health care services delivered in PHCs and constraints being faced by them.
5.3 The information gathered on sex profile of sample beneficiaries of both types of programme assisted and non-assisted PHCs is presented in Tables 5.1 and 5.1A.
Table 5.1 : Distribution of Sample Beneficiaries of PHCs with SSNP according to Sex during 1995-96
Sex State District PHC No. of Beneficiaries Male Female
1 8 3 5 2 8 5 3 3 8 5 3
Haryana Bhiwani
4 8 5 3 5 8 4 4 6 8 4 4 7 8 4 4
Orissa Baleshwar
8 8 6 2 9 6 4 2 10 4 0 4 11 4 1 3
U.P Hardoi
12 4 3 1 Total 82 44 38 %age 53.66 46.34
23
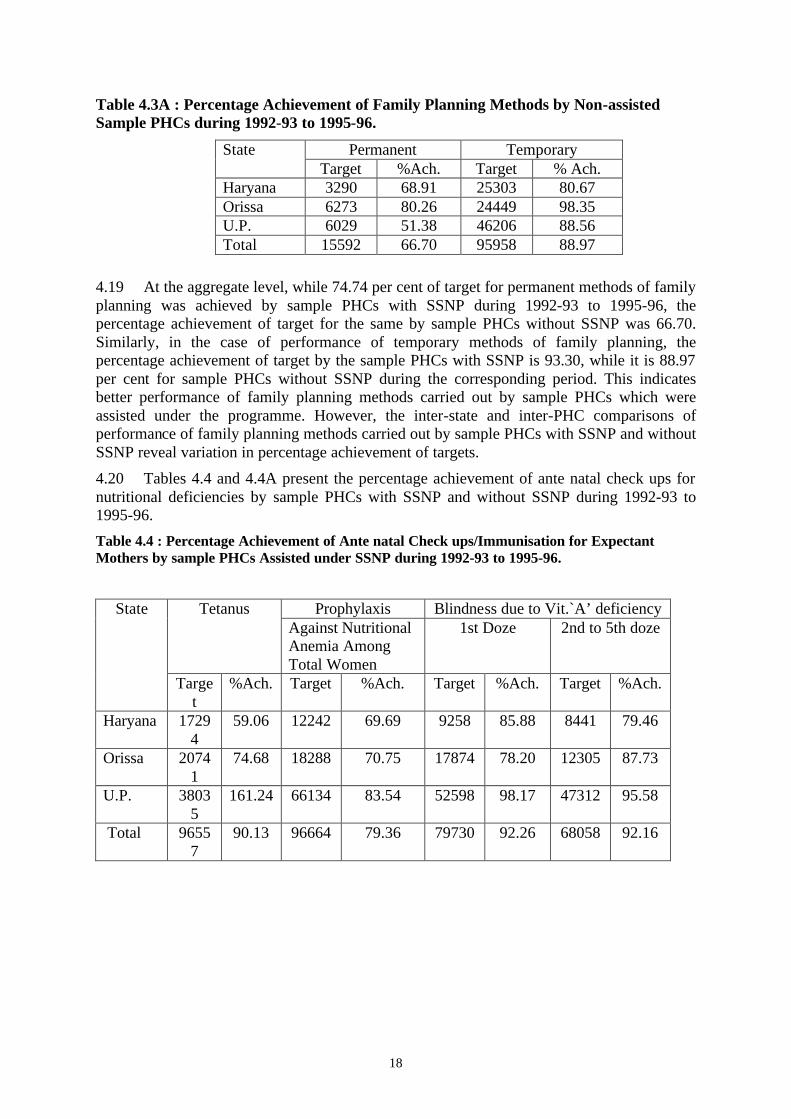
Table 5.1A : Distribution of Sample Beneficiaries of PHCs without SSNP according to Sex during 1995-96
Sex State District PHC No. of Beneficiaries Male Female
1 8 2 6 2 8 2 6 3 8 5 3
Haryana Ambala
4 8 3 5 5 8 7 1 6 8 7 1 7 8 4 4
Orissa Sambalpur
8 8 5 3 9 8 6 2 10 4 1 3 11 5 5 0
U.P Ballia
12 4 2 2 Total 85 49 36 %age 57.65 42.35
5.4 The sex profile of sample beneficiaries reveals that of the total beneficiaries, 53.66 per cent beneficiaries belonging to programme assisted PHCs and 57.65 per cent belonging to non-assisted PHCs have constituted male beneficiaries. This indicates that males are slightly more health conscious than their counterparts.
5.5 The responses of beneficiaries about their ailments for which they visited PHCs are presented in Tables 5.2 and 5.2A.
Table 5.2 : Distribution of Sample Beneficiaries of PHCs with SSNP according to Type of Ailments during 1995-96
Ailment of Respodent State District PHC
No. of Bene-ficia-ries
Deli-very cases
Respira-tory related diseases
Water borne diseases
Vaccine preven-table diseases
Injury
Gynae
Cold, cough & fever
*Others
1 8 0 0 1 2 0 0 5 0 2 8 0 1 0 2 0 0 4 1 3 8 0 1 0 1 0 0 3 3
Haryana Bhiwani
4 8 0 2 0 1 0 1 2 2 5 8 0 0 3 0 0 0 1 4 6 8 0 1 1 1 0 3 2 0 7 8 0 0 4 0 0 0 3 1
Orissa Baleshwar
8 8 0 0 3 0 1 0 0 4 9 6 0 2 0 0 1 0 1 2
10 4 0 0 0 0 0 0 4 0 11 4 0 0 0 0 1 0 1 2
U.P Hardoi
12 4 0 0 0 0 0 0 1 3 Total 82 0 7 12 7 3 4 27 22 %age 8.54 14.63 8.54 3.66 4.88 32.93 26.82

24
Table 5.2A : Distribution of Sample Beneficiaries of PHCs without SSNP according to Type of Ailments during 1995-96
Ailment of Respondents State District PHC
No. of Bene-ficia-ries
Deli-very cases
Respira-tory related diseases
Water borne diseases
Vaccine preven-table diseases
Injury
Gynae
Cold, Cough & fever
*Others
1 8 0 0 0 1 0 0 3 4 2 8 0 0 0 1 0 0 3 4 3 8 0 0 0 0 5 0 2 1
Haryana Ambala
4 8 0 0 0 0 3 1 2 2 5 8 0 0 0 0 1 0 6 1 6 8 0 0 4 0 0 1 2 1 7 8 0 0 2 0 1 0 5 0
Orissa Sambalpur
8 8 0 0 2 0 0 0 4 2 9 8 0 0 2 0 1 0 3 2
10 4 0 0 0 0 0 0 1 2 11 5 0 0 1 0 0 0 1 2
U. P Ballia
12 4 0 1 1 0 0 1 0 3 Total 85 0 1 12 2 11 3 32 24 %age 1.18 14.12 2.35 12.94 3.53 37.65 28.23
* Others : Include cases of influenza, paralysis, meningitis, diabetes, family planning, urinary problem, weakness, high blood pressure, eye, skin, etc.
5.6 It can be seen from Table 5.2 that none of the sample beneficiaries is found to have visited PHCs for availing medical services for institutional delivery. This corroborates the finding of the preceding chapter especially on availability of infrastructural facilities and utilisation of medical services in PHCs assisted under SSNP, where it is noted that the requisite essential complementary facilities including the post of lady doctor for attending the institutional deliveries have not been created. Thus, the non-utilisation of institutional delivery cases in programme assisted PHCs primarily due to mis-match and non-availability of essential complementary facilities tends to suggest that the basic objective of the programme for providing obstetric and gynaecological services to pregnant mothers has been defeated thereby resulting in a wasteful expenditure of scarce resources.
5.7 In other cases, it is found that a maximum of 32.93 per cent of beneficiaries have sought the treatment for minor ailments, like, cold, cough and fever. This is followed by the cases suffering from other diseases (26.82%), water borne diseases (14.63%), vaccine preventable diseases (8.54%), respiratory diseases (8.54%) and gynaecological complications (4.88%) respectively.
5.8 Similarly in the case of non-assisted PHCs also, none of the sample beneficiaries is observed to have come to PHCs for institutional delivery. However, in the rest of other cases, again it is found that of the total sample beneficiaries who have sought medical treatment from non-assisted PHCs, the cases suffering from minor ailments like, cold, cough and fever have constituted a maximum of 37.65 per cent, which is followed by the cases suffering from other diseases (28.23%), water borne diseases (14.12%), minor injuries out of accidents (12.94%), gynaecological complications (3.53%), vaccine preventable diseases (2.35%) and respiratory related diseases (1.18%) respectively.
5.9 The beneficiaries were also asked to express their level of satisfaction and reasons for dissatisfaction, if any about delivery and quality of health care services available in the PHCs. The results are presented in Tables 5.3 and 5.3A.
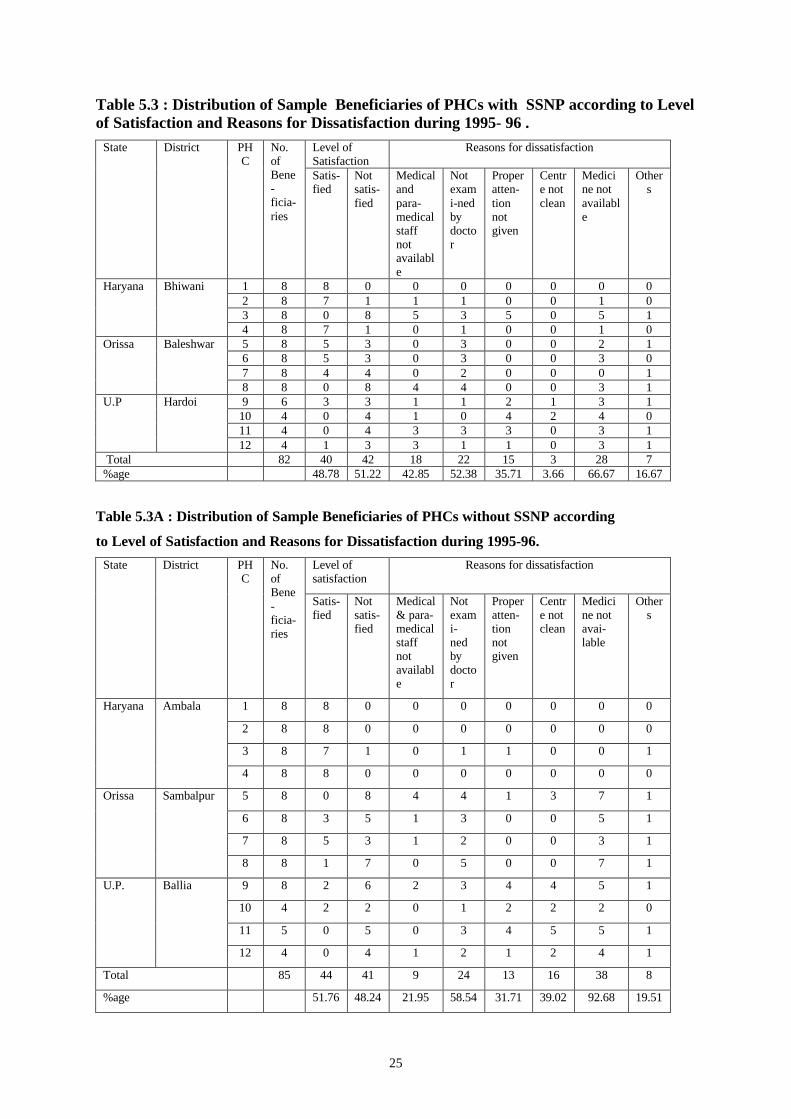
25
Table 5.3 : Distribution of Sample Beneficiaries of PHCs with SSNP according to Level of Satisfaction and Reasons for Dissatisfaction during 1995- 96 .
Level of Satisfaction
Reasons for dissatisfaction State District PHC
No. of Bene-ficia-ries
Satis-fied
Not satis-fied
Medical and para-medical staff not available
Not exami-ned by doctor
Proper atten- tion not given
Centre not clean
Medicine not available
Others
1 8 8 0 0 0 0 0 0 0 2 8 7 1 1 1 0 0 1 0 3 8 0 8 5 3 5 0 5 1
Haryana Bhiwani
4 8 7 1 0 1 0 0 1 0 5 8 5 3 0 3 0 0 2 1 6 8 5 3 0 3 0 0 3 0 7 8 4 4 0 2 0 0 0 1
Orissa Baleshwar
8 8 0 8 4 4 0 0 3 1 9 6 3 3 1 1 2 1 3 1
10 4 0 4 1 0 4 2 4 0 11 4 0 4 3 3 3 0 3 1
U.P Hardoi
12 4 1 3 3 1 1 0 3 1 Total 82 40 42 18 22 15 3 28 7 %age 48.78 51.22 42.85 52.38 35.71 3.66 66.67 16.67
Table 5.3A : Distribution of Sample Beneficiaries of PHCs without SSNP according
to Level of Satisfaction and Reasons for Dissatisfaction during 1995-96.
Level of satisfaction
Reasons for dissatisfaction State District PHC
No. of Bene-ficia-ries
Satis-fied
Not satis-fied
Medical & para-medical staff not available
Not exami- ned by doctor
Proper atten-tion not given
Centre not clean
Medicine not avai-lable
Others
1 8 8 0 0 0 0 0 0 0
2 8 8 0 0 0 0 0 0 0
3 8 7 1 0 1 1 0 0 1
Haryana Ambala
4 8 8 0 0 0 0 0 0 0
5 8 0 8 4 4 1 3 7 1
6 8 3 5 1 3 0 0 5 1
7 8 5 3 1 2 0 0 3 1
Orissa Sambalpur
8 8 1 7 0 5 0 0 7 1
9 8 2 6 2 3 4 4 5 1
10 4 2 2 0 1 2 2 2 0
11 5 0 5 0 3 4 5 5 1
U.P. Ballia
12 4 0 4 1 2 1 2 4 1
Total 85 44 41 9 24 13 16 38 8
%age 51.76 48.24 21.95 58.54 31.71 39.02 92.68 19.51

26
5.10 It can be seen from the Tables that the responses of the beneficiaries not only corroborate the findings of preceding chapters about the weaknesses of delivery system, but also have shed light on other inadequacies in the system. As many as 51.22 per cent of beneficiaries belonging to programme assisted PHCs are found to be dissatisfied with the functioning of PHCs. Further, of the dissatisfied beneficiaries, a majority have complained about medical and para-medical staff of PHCs. The main reasons for their dissatisfaction included non-availability of medical and para-medical staff (42.85%), not examined by doctors (52.38%) and proper attention not given (35.71%). The second important reason for dissatisfaction of beneficiaries was the non-availability of medicines in PHCs. About 66.67 per cent of the beneficiaries expressed this view.
5.11 Similarly, 48.24 per cent of beneficiaries belonging to non-assisted PHCs are found to be dissatisfied with the functioning of PHCs (Table 5.3A). The reasons for their dissatisfaction included non-availability of medical and para-medical staff (21.95%), not examined by doctor (58.54%), centre not clean (39.02%) and proper attention not given (31.71%). Besides, a large majority (92.68%) have expressed the non-availability of medicines as one of the main reasons for their dissatisfaction.
5.12 The beneficiaries were asked to offer their views on preferences for various health care institutions for seeking health care services. Their responses are presented in Tables 5.4 and 5.4A.
Table 5.4 : Distribution of Sample Beneficiaries of PHCs with SSNP according to Preferences of Treatment for Various Health Care Institution during 1995-96
Preferences of beneficiaries for treatment at State District PHC
No. of Bene-ficia-ries
PHC Distt. Hos-pital
Private Doctor
Vaid/ Hakim
Faith Healer/ religious person Tantrik
Others
1 8 8 0 0 0 0 0 2 8 8 0 0 0 0 0 3 8 3 0 5 0 0 0
Haryana
Bhiwani
4 8 8 0 0 0 0 0 5 8 8 0 0 0 0 0 6 8 8 0 0 0 0 0 7 8 8 0 0 0 0 0
Orissa Baleshwar
8 8 8 0 0 0 0 0 9 6 6 0 0 0 0 0 10 4 0 1 2 0 1 0 11 4 4 0 0 0 0 0
U.P Hardoi
12 4 4 0 0 0 0 0 Total 82 73 1 7 0 1 0 %age 89.02 1.22 8.54 0 1.22

27
Table 5.4 A : Distribution of Sample Beneficiaries of PHCs without SSNP according to Preference of Treatment for Various Health Care Institutions during 1995-96
Preferences of beneficiaries for treatment at State District PHC
No. of Bene-ficia-ries
PHC Distt. Hos-pital
Private Doctor
Vaid/ Hakim
Faith Healer/ religious person Tantrik
Others
1 8 8 0 0 0 0 0
2 8 8 0 0 0 0 0
3 8 6 0 2 0 0 0
Haryana
Ambala
4 8 8 0 0 0 0 0
5 8 8 0 0 0 0 0
6 8 8 0 0 0 0 0
7 8 8 0 0 0 0 0
Orissa Sambalpur
8 8 8 0 0 0 0 0
9 8 8 0 0 0 0 0
10 4 4 0 0 0 0 0
11 5 4 0 1 0 0 0
U. P Ballia
12 4 4 0 0 0 0 0
Total 85 82 0 3 0 0 0
%age 96.47 3.53
5.13 Despite inadequacies in the delivery of health care services by PHCs, a vast majority of about 89 per cent of beneficiaries belonging to programme assisted PHCs and about 96 per cent beneficiaries from non-assisted PHCs have still expressed their preferences for PHCs for seeking health care services over other alternative sources of treatment.
5.14 The beneficiaries were asked about the details of expenses incurred on current illness episodes. The results of their responses are presented in Tables 5.5 and 5.5A.
Table 5.5 : Percentage Distribution of Private Expenditure Incurred on Various Items by Beneficiaries of PHCs with SSNP during 1995-96
Item Below Rs.100 Above Rs.100 Fee 2.86% 0 Medicine 93.53% 84.31% Laboratory Test 0 14.51% X-Ray 0 1.18% Others 3.79% 0 Total 100% 100% Beneficiaries incurring expenditure(45)
33 12

28
Table 5.5A : Percentage Distribution of Private Expenditure on Various Items Incurred by Beneficiaries of PHCs without SSNP during 1995-96
Item Below Rs.100 Above Rs.100 Fee 0 6.25% Medicine 87.81% 68.90% Laboratory Test 3.43% 5.00% X-Ray 0 1.25% Others 8.76% 18.60% Total 100% 100% Beneficiaries incurring expenditure(80)
42 38
5.15 It is revealed that 54.88 per cent of beneficiaries belonging to assisted PHCs and 94.12 per cent belonging to non-assisted PHCs have incurred private expenditure on various items while seeking treatment in PHCs. A majority of 73.33 per cent beneficiaries belonging to assisted PHCs and 52.50 per cent belonging to non-assisted PHCs have incurred private expenditure below Rs.100 per illness episode. Besides, major chunk of expenditure made by the sample beneficiaries of all categories is on purchasing medicines.
5.15 The data collected on income profile of beneficiaries who sought medical treatment in sample PHCs is presented in Tables 5.6 and 5.6A.
Table 5.6 : Distribution of Sample Beneficiaries of PHCs with SSNP according to Income Group during 1995-96
Monthly Income (Rs.) State District PHC No. of Benefi-ciaries
Below 500
501-1000
1001-1500
1501-2000
Above
2000 1 8 0 0 0 1 7 2 8 0 0 2 1 5 3 8 0 0 2 2 4
Haryana Bhiwani
4 8 1 0 1 1 5 5 8 0 6 0 0 2 6 8 0 8 0 0 0 7 8 2 3 1 0 2
Orissa Baleshwar
8 8 0 4 0 3 1 9 6 0 3 1 0 2 10 4 0 2 0 1 1 11 4 0 0 3 1 0
U. P Hardoi
12 4 0 1 1 2 0 Total 82 3 27 11 12 29 %age 3.66 32.93 13.41 14.63 35.37

29
Table 5.6A: Distribution of Sample Beneficiaries of PHCs without SSNP according to Income Groups during 1995-96
Monthly Income (Rs.) State District PHC
No. of Benefi-ciaries
Below 500
501-1000
1001-1500
1501-2000
Above 2000
1 8 1 0 3 3 1
2 8 0 2 2 2 2
3 8 0 1 2 2 3
Haryana Ambala
4 8 1 2 3 1 1
5 8 0 4 2 1 1
6 8 0 4 3 1 0
7 8 1 3 4 0 0
Orissa Sambalpur
8 8 0 2 1 1 4
9 8 0 5 2 1 0
10 4 0 1 1 2 0
11 5 0 0 2 0 3
U. P Ballia
12 4 0 2 1 1 0
Total 85 3 26 26 15 15
%age 3.52 30.59 30.59 17.65 17.65
5.17 It can be seen from Table 5.6 that the income profile of beneficiaries belonging to programme assisted PHCs reveals that the beneficiaries whose average monthly income was below Rs.500 have formed a small percentage of 3.66, while a majority (63.41%) of the beneficiaries are from the monthly income group of above Rs.1000.
5.18 Similarly, it can also be seen from Table 5.6A that while a small percentage of beneficiaries (3.52%) belonging to non-assisted PHCs fall in the monthly income group of Rs.500, a majority of beneficiaries (65.89%) have belonged to the monthly income group of above Rs.1000.
5.19 The reason why the people with lowest income group are not seeking health care services in PHCs is given by the PEO field teams. It is explained that non-availability of medicines in PHCs is a constraint being faced by the lowest income group. Secondly, those who are engaged in daily wage earnings cannot afford to spare time for seeking treatment in PHCs owing to their inconvenient locations and timings. Consequently, they remain contented with the traditional methods of treatment for their ailments.

30
5.20 The beneficiaries were asked to express their views on whether they would be willing to bear a part of the cost of treatment provided there was an improvement in health care delivery system. The results are presented in Tables 5.7 and 5.7A.
Table 5.7 : Distribution of Sample Beneficiaries of PHCs with SSNP according to Willingness to Pay Part of Market Rate for Providing Better Services during 1995-96
State District PHC No. of Beneficiaries
Willingness to pay 25% of market rate for better services
1 8 2 2 8 3 3 8 5
Haryana Bhiwani
4 8 6 5 8 3 6 8 1 7 8 3
Orissa Baleshwar
8 8 5 9 6 6 10 4 4 11 4 4
U.P Hardoi
12 4 4 Total 82 46 %age 56.10
Table 5.7A : Distribution of Sample Beneficiaries of PHCs without SSNP according to Willingness to Pay Part of Market Rate for Providing Better Services at Health Centre during 1995-96
State District PHC No. of Beneficiaries
Willingness to pay 25% of market rate for better services
1 8 8 2 8 3 3 8 1
Haryana Ambala
4 8 0 5 8 8 6 8 5 7 8 7
Orissa Sambalpur
8 8 5 9 8 8
10 4 4 11 5 5
U. P. Ballia
12 4 4 Total 85 58 %age 68.24
5.21 It is found that a majority of 56.10 per cent of the beneficiaries from the programme assisted PHCs and 68.24 per cent beneficiaries from non-assisted PHCs are found to be willing to bear 25 per cent of the cost of treatment of market rate, if there is an improvement in health care delivery system in PHCs.

31
5.22 Analysis of beneficiaries' profile as per income group further reveals that a large majority of the households, (about 76 per cent of those below the Poverty Line and 63 per cent above the poverty line) are found willing to pay a part of market cost of treatment for improved health care services in PHCs (Table 5.8). This means that both poor and non-poor alike are willing to bear part of cost of treatment, if the availability and accessibility of improved health care services in PHCs are ensured.
Table 5.8 : % Distribution of Willing Beneficiaries to Pay Part of Market Cost of Treatment according to Income Group (Income at 95-96 Prices)
State Rs.12000-18000 Above Rs. 18000
Haryana 40.00 46.34
Orissa 100.00 75.00
Uttar Pradesh 100.00 100.00
75.68 63.38
5.23 The inter-state comparison reveals a variation in responses of beneficiaries for their willingness to pay part of cost of treatment for improved health care services in PHCs. The reasons as to why a very small proportion of sample beneficiaries from Haryana and a large majority of them from Orissa and Uttar Pradesh are found to be willing to pay extra money for better health care services is explained by the variation in level of satisfaction expressed by them over the quality and accessibility of the existing health care services in sample PHCs of these states.
5.24 It can be seen from Tables 5.3 and 5.3A that a majority of the beneficiaries from Haryana have expressed satisfaction over the health care services delivered by sample PHCs, whereas majority of beneficiaries from Orissa and and Uttar Pradesh are found to be dissatisfied with the availability and accessibility of the existing health care services in sample PHCs. This brings home the point that people are willing to pay extra money for better health care services, if the availability and accessibility of the existing health care services in PHCs are not catering to the needs of the people.
5.25 The findings of the study on health delivery system conducted by NCAER, 1999-2000 also indicated that in the case of the districts in U.P., the utilization rate is low (around 13% of the episodes get treated in public facilities) in spite of the fact that the average cost of treatment per episode in public facilities is only one-half of that in private facilities. This happens, perhaps, because of the inadequacy of the public facilities compared to the prevalence of morbidity in these districts. The inadequacy of public facilities is reflected in the larger coverage of population per PHC/UPHC (27,700 in Mathura and 34,600 in Hardoi) and very low doctor - PHC/UPHC ratio (2.2 in Mathura and 1.3 in Hardoi). It is, therefore, not surprising that the overwhelming majority of the sample respondents from Orissa and Uttar Pradesh are willing to pay a part of the cost of treatment in PHCs for improved quality of health care services.

32
Appendix
Table 4.2 : Cases Attended and Referred by Sample PHCs with SSNP during 1995-96.
Cases attended Referred
Indoor
State District PHC
Delivery cases
Others
Outdoor
Total Indoor
Outdoor
Total
1 0 103 2850 2953 0 26 26
2 0 0 5362 5362 0 0 0 3 0 10 4463 4473 0 41 41 4 0 0 5060 5060 0 31 31
Haryana Bhiwani
0 113 17735 17848 0 98 98 5 0 15 10191 10206 2 NA 2 6 0 0 19286 19286 NA NA NA 7 0 0 6489 6489 0 187 187 8 0 0 22582 22582 0 2 2
Orissa Baleshwar
0 15 58548 58563 2 189 191 9 0 127 21075 21202 0 0 0
10 0 4 12162 12166 0 0 0 11 0 110 5897 6007 0 0 0 12 0 33 18926 18959 5 16 21
U.P. Hardoi
0 274 58060 58334 5 16 21 Total 402 134343 134745 7 303 310
Table 4.2A : Cases Attended and Referred by Sample PHCs without SSNP during 1995-96
Cases attended Referred
Indoor
State District PHC
Delivery cases
Others
Total Indoor Outdoor
Total
1 5 7636 7641 0 0 0
2 0 16115 16115 0 0 0 3 423 36753 37176 35 308 343 4 20 6395 6415 0 51 51
Haryana Ambala
448 66899 67347 35 359 394 5 740 11748 12488 0 0 0 6 631 11760 12391 17 0 17 7 106 17000 17106 4 192 196 8 3166 17402 20568 17 150 167
Orissa Sambalpur
4643 57910 62553 38 342 380 9 0 11616 11616 0 0 0 10 0 12675 12675 0 0 0 11 12 11616 11628 0 0 0 12 0 12270 12270 0 0 0
U.P. Hardoi
12 48177 48189 0 0 0 Total 5103 172986 178089 73 701 774

33
Appendix
Table 4.3 : Percentage Achievement of Family Planning Methods by Sample PHCs with SSNP during 1992-93 to 95-96
Permanent Temporary State District PHC Target %Achievement Target % Achievement
1 0 0.00 0 0.00 2 430 37.67 3016 45.42 3 1380 84.20 11618 62.20 4 830 96.87 6480 69.46
Haryana Bhiwani
2640 80.61 21114 62.03 5 474 86.71 2442 88.86 6 435 56.78 1190 59.66 7 1427 74.91 5426 75.60 8 1038 103.18 3493 79.79
Orissa Baleshwar
3374 82.93 12551 77.83 9 2456 81.23 18735 110.73 10 2513 43.89 16040 101.90 11 593 64.25 4460 114.82 12 2188 86.01 16641 110.96
U.P Hardoi
7750 69.17 55876 108.59 Total 13764 74.74 89541 93.30
Table 4.3A : Percentage Achievement of Family Planning Methods by Sample PHCs without SSNP during 1992-93 to 95-96
Permanent Temporary State District PHC Target %Achievement Target % Achievement
1 805 87.70 6090 95.32 2 660 68.48 5328 69.41 3 1480 51.69 11140 73.12 4 345 99.71 2745 100.66
Haryana Ambala
3290 68.91 25303 80.67 5 2022 103.66 7007 103.08 6 1146 52.44 4623 108.18 7 1984 79.74 8318 88.40 8 1121 67.44 4501 99.29
Orissa Sambalpur
6273 80.26 24449 98.35 9 1985 47.20 14711 85.53 10 394 47.97 2992 91.61 11 2123 50.26 14850 100.47 12 1527 59.27 13653 78.18
U.P Ballia
6029 51.38 46206 88.56 Total 15592 66.70 95958 88.97

34
Appendix
Table 4.4 : Percentage Achievement of Ante natal Check ups/Immunisation for Expectant Mothers by sample PHCs with SSNP during 1992-93 to 95-96.
Prophylaxis Blindness due to Vit.'A' deficiency Tetanus Against Nutritional Anemia Among Total Women
1st Doze 2nd to 5th Doze State District PH
C
Target %Ach Target %Ach Target %Ach Target %Ach 1 1331 95.19 0 0.00 0 0.00 0 0.00 2 4059 39.96 0 0.00 0 0.00 0 0.00 3 7464 48.08 7802 66.42 5098 104.53 4281 95.42 4 4440 84.12 4440 75.43 4160 63.03 4160 63.03
Haryana Bhiwani
17294 59.06 12242 69.69 9258 85.88 8441 79.46 5 2703 92.23 2703 95.26 1514 80.18 2201 100.00 6 1460 74.38 3410 81.41 2130 70.42 0 0.00 7 9207 64.16 7493 62.24 7753 81.80 6006 83.62 8 7371 81.44 4682 62.43 6477 75.98 4098 87.16
Orissa Baleshwar
20741 74.68 18288 70.75 17874 78.20 12305 87.73 9 21448 97.10 22011 86.65 15342 90.17 14529 85.88 10 19678 93.38 19678 75.14 17696 116.55 14664 113.43 11 5324 61.36 5373 70.84 2416 193.29 975 189.23 12 19072 98.87 19072 92.19 17144 72.95 17144 83.22
U.P. Hardoi
65522 93.60 66134 83.54 52598 98.17 47312 95.58 Total 103557 90.13 96664 79.36 79730 92.26 68058 92.16
Table 4.4A : Percentage Achievement of Ante natal Check-ups/ Immunisation for Expectant Mothers by Sample PHCs without SSNP during 1992-93 to 95-96
Prophylaxis Blindness due to Vit.'A' deficiency Tetanus Against Nutritional Anemia Among Total Women
1st Doze 2nd to 5th Doze State District PH
C
Target %Ach Target %Ach Target %Ach Target %Ach 1 2280 111.67 2240 109.24 1800 116.11 1800 118.44 2 2442 114.62 2742 237.49 2366 96.37 2158 144.02 3 5664 92.76 5550 142.36 5087 106.57 4795 116.52 4 1477 87.41 1457 156.01 1329 100.15 1596 104.26
Haryana Ambala
11863 100.23 11989 159.59 10582 105.10 10349 120.70 5 9223 82.10 9853 72.27 7494 92.74 0 0.00 6 5769 98.39 5769 110.16 5061 135.19 0 0.00 7 9264 79.87 10284 75.43 9030 91.42 6462 113.73 8 5766 100.40 5766 145.27 4738 108.97 5997 103.10
Orissa Sambalpur
30022 88.06 31672 93.49 26323 103.37 12459 108.61 9 23965 58.02 15028 73.30 16917 62.36 16917 62.36 10 3194 87.10 2942 74.92 3384 62.35 3384 62.35 11 17092 45.07 10350 40.09 14882 64.17 12342 47.89 12 12631 65.63 13663 45.21 10230 75.95 10230 6.35
U.P. Ballia
56882 57.45 41983 56.08 45413 66.01 42873 44.83 Total 98767 71.89 85644 84.41 82318 82.98 65681 68.88

35
Appendix
Table 4.5 : Percentage Achievement of Immunisation for Children by Sample PHCs with SSNP during 1992-93 to 95-96.
D.P.T. Polio BCG Measles State District PHC Target %Ach Target %Ach Target %Ach Target %Ach
Haryana Bhiwani 1 1199 87.41 1199 87.41 1199 382.57 1199 86.91 2 3684 68.08 3684 68.08 3684 55.32 3793 38.99 3 6891 69.69 6891 69.69 6891 87.24 6891 69.05 4 4160 72.60 4160 72.60 4160 93.05 4160 86.54 15934 71.41 15934 71.41 15934 103.60 16043 67.81
Orissa Baleshwar 5 2344 106.40 2344 106.40 2344 97.10 2344 91.47 6 1840 83.70 1840 83.70 1840 76.47 1840 57.12 7 7753 84.06 7753 84.06 7753 85.22 7753 64.39 8 6477 79.08 6477 79.08 6477 77.80 6477 73.75 18414 85.11 18414 85.11 18414 83.25 18414 70.40
U.P. Hardoi 9 19048 101.36 19048 101.36 17036 114.06 19036 98.04 10 17696 97.96 17696 98.02 17696 98.43 17696 96.61 11 4689 89.55 4689 89.55 4690 112.88 4790 90.67 12 17148 101.08 17148 101.08 17148 105.26 17148 96.51 58581 99.31 58581 99.33 56570 106.41 58670 96.56 Total 92929 91.71 92929 91.72 90918 101.23 93127 86.44
Table 4.5 A: Percentage Achievement of Immunisation for Children by Sample
PHCs without SSNP during 1992-93 to 95-96.
D.P.T. Polio BCG Measles State District PHC Target %Ach Target %Ach Target %Ach Targe
t %Ach
Haryana Ambala 1 2040 119.07 2040 119.07 2040 132.84 2040 111.91 2 2366 102.07 2366 102.07 2366 107.35 2366 100.04 3 5111 100.84 5101 100.86 5111 97.67 5111 94.31 4 1369 97.22 1319 100.76 1359 101.47 1359 97.94 10886 104.07 10826 104.54 10876 106.85 10876 99.31
Orissa Sambalpur
5 7794 104.62 7794 103.34 7794 100.68 7794 98.28
6 5061 106.36 5061 106.36 5061 113.16 5060 104.19 7 9030 93.61 9030 93.61 9030 105.02 9030 93.82 8 5057 95.91 5057 95.91 5057 107.67 5117 90.23 26942 99.62 26942 99.25 26942 105.79 27001 96.37
U.P. Ballia 9 15094 82.40 15094 82.40 15094 82.66 15093 81.33 10 3019 82.58 3762 66.27 3019 82.58 3019 82.58 11 15691 77.47 15691 77.47 15691 86.11 15691 90.22 12 11415 93.30 8232 91.19 11415 87.10 11415 83.44 45219 83.45 42779 80.87 45219 84.97 45218 85.03 Total 83047 91.40 80547 90.20 83037 94.59 83095 90.59

36
Appendix
Table 4.6 : Percentage Achievement of D.T. Immunisation by Sample PHCs with SSNP during 1992-93 to 95-96
T.T. for 10 years T.T. for 16 years DT Immunisation for children
State District PHC
Target %Ach Target %Ach Target %Ach 1 NA NA NA NA 1028 55.25 2 2799 18.94 2388 16.21 3010 35.08 3 5101 46.13 4584 20.86 5918 76.68 4 2960 90.10 2493 52.75 3200 89.16
Haryana Bhiwani
10860 51.10 9465 28.08 13156 68.52 5 1714 96.03 1723 98.20 1848 88.91 6 1445 83.74 1090 57.80 1525 71.80 7 6248 85.10 6190 67.14 6754 86.27 8 4591 86.06 4409 84.21 4776 91.16
Orissa Baleshwar
13998 86.61 13412 75.98 14903 86.69 9 12154 91.21 11294 87.81 13480 86.55 10 12407 89.29 11304 94.37 13341 30.00 11 2111 99.38 2038 49.26 1706 107.56 12 9858 94.44 9589 80.14 11692 68.93
U.P. Hardoi
36530 91.90 34225 85.53 40219 63.56 Total 61388 83.48 57102 73.77 68278 69.56
Table 4.6A : Percentage Achievement of D.T. Immunisation by Sample PHCs without SSNP during 1992-93 to 95-96
T.T. for 10 years T.T. for 16 years DT Immunisation for children
State District PHC
Target %Ach Target %Ach Target %Ach 1 1720 121.45 1400 120.64 1770 137.91 2 2324 81.28 2324 86.88 2366 123.71 3 3315 148.14 3110 125.88 3700 174.62 4 1026 125.24 862 118.91 1086 149.08
Haryana Ambala
8385 121.34 7696 112.37 8922 150.73 5 6882 94.55 6324 99.43 6931 98.04 6 4020 102.64 3845 112.22 4284 156.05 7 7094 100.34 6825 89.70 7552 112.17 8 3926 120.22 3914 105.75 4208 154.30
Orissa Sambalpur
21922 102.50 20908 99.79 22975 123.80 9 9800 85.76 9984 83.26 10704 92.38 10 2445 68.88 1996 83.22 2140 93.41 11 10783 55.63 12893 47.90 9994 81.32 12 7209 54.88 6883 40.22 8504 57.97
U.P. Ballia
30237 66.29 31756 59.57 31342 79.59 Total 60544 87.02 60360 80.24 63239 105.69

37
PROJECT TEAM
1. Project Director Shri Amar Singh,
Deputy Adviser(PEO)
A. Headquarters Team
1. Shri Pyare Lal S.I.Gr-I
2. Shri A.R. Tripathi E.I.Gr-II
Stenographic Assistance
1. Smt. Neelam Parwani PA
2. Smt. Neera Kapoor PA
Coordination Assistance
1. Shri F.U.Khan Senior Research Officer
2. Shri U.K. Verma E.I.Gr-II
3. Mrs. Kanta Kalia U.D.C.
4. Shri K.P. Kalshyan Tabulation Clerk
5. Shri H.S.Bunker S.L. & I.A.(PEO Lib.)
B. Field Teams
1. REO, Bombay 1. Shri B.R.Guwali E.I.Gr-I Shri Mathisekeran
Director 2. Shri D.J.Kushwah E.I.Gr-I 3. Ms. D.N.Mothghare E.I.Gr-I 4. Shri P.G.Kulkarani E.I.Gr-I
2. REO, Calcutta 1. Mrs. C.Bose E.I.Gr-I Shri R.C.Dey Research Officer 2. Shri N.C.Samal E.I.Gr-I
3. Shri S.Routray E.I.Gr-II REO,Chandigarh 1. Shri C.S.Verma E.I.Gr-I
Shri A.K.Gautam Dy.Adviser 2. Shri R.P.Singh E.I.Gr-I Shri Rajesh Thakur, P.E.O. Shri P.K.Aggarwal, R.O.
4. REO, Chennai 1. Shri M.Rathnaswamy E.I.Gr-I Smt. Sarayu Aiyengar Deputy Adviser 2. Shri G.Subramany E.I.Gr-I
Shri P.S.Ragavan E.I.Gr-I 4. Shri P.J.Radhakrishnan E.I.Gr-I
5. REO, Jaipur 1. Smt. S.K. Chaudhari E.I.Gr-I Shri Om Prakash Deputy Adviser 2. Shri Virendra Singh E.I.Gr-I 3. Shri P.C.Yadav E.I.Gr-II 4. Shri S.K.Sutradhar E.I.Gr-I

38
6. REO, Lucknow 1. Shri N.S.Rawat E.I.Gr-I Shri Kamla Pandey, P.E.O. 2. Shri Chander Bhan E.I.Gr-II