Evaluation of Walking for Health Report_… · Evaluation of Walking for Health Final Report to...
191
Evaluation of Walking for Health Final Report to Macmillan and the Ramblers March 2016 Authors: Jonathan France; James Sennett; Prof. Andy Jones; Prof. Richard Fordham; Jenny Williams; Amanda Burke; Anja Meierkord; Rebekah Fong Soe Khioe; and Prof. Marc Suhrcke
Transcript of Evaluation of Walking for Health Report_… · Evaluation of Walking for Health Final Report to...

Evaluation of Walking for Health
Final Report to Macmillan and the Ramblers
March 2016
Authors: Jonathan France; James Sennett; Prof. Andy Jones; Prof. Richard Fordham; Jenny Williams;
Amanda Burke; Anja Meierkord; Rebekah Fong Soe Khioe; and Prof. Marc Suhrcke

Foreword
We know that the combination of outdoor exercise and social interaction offered by Walking
for Health is good for everyone’s wellbeing. Two thirds of adults in England currently don’t
meet the Chief Medical Officer’s guidelines on physical activity, and walking is one of the
easiest things people can do to change this.
In 2012, the national management of Walking for Health passed from Natural England to the
Ramblers and Macmillan Cancer Support. We wanted more people, whether they were
affected by cancer or another health condition or simply wanted to be healthier, to become
more active by being able to walk with their local scheme.
We commissioned this evaluation to help us understand more about the impact of the
programme, and to inform the work we do as a national team to support Walking for Health
schemes locally. We’re delighted to publish the findings of this evaluation report, which
highlight a great number of achievements.
The report shows that schemes are doing particularly well at reaching older people and
helping them to stay active. Also, walkers and volunteers report high levels of satisfaction
with the programme and say that it has not only brought physical benefits, but has also
reduced loneliness and social isolation. It is also encouraging that, through partnerships
with support groups and other means, schemes are increasing the numbers of new walkers
who are affected by cancer and other long term health conditions and are increasingly
focusing on how they can support the most inactive people to be more active.
The report also highlights ways in which we can increase the programme’s impact, such as
improving reach to BME communities and lower socio-economic groups, and retaining less
active and less healthy participants. It shows that the programme has the potential to be
highly cost effective when supporting inactive people into activity. We know that we need to
get better at engaging with these audiences and supporting them to stay more active
through Walking for Health over the long term.
We will use the feedback from this report to inform our work to support schemes to engage
inactive people, and to diversify its reach. This will be a key priority for us over the next two
years, and we are looking forward to working with schemes and local partners to achieve
this.
Benedict Southworth Chief Executive The Ramblers
Lynda Thomas Chief Executive Macmillan Cancer Support
Contents
Executive Summary ............................................................................... i
1.0 Introduction ........................................................................................... 1
1.1 Introduction ................................................................................................................ 1
1.2 Walking for Health programme ................................................................................. 1
1.3 Evaluation aims .......................................................................................................... 1
1.4 Methodology ............................................................................................................... 2
1.4.1 Review of programme documentation .......................................................................... 2
1.4.2 Review of programme data .......................................................................................... 2
1.4.3 Qualitative case studies................................................................................................ 2
1.4.4 Longitudinal surveys of walkers .................................................................................... 3
1.4.5 Pedometer research ................................................................................................... 11
1.4.6 Stakeholder interviews and workshop ........................................................................ 12
1.4.7 Economic analysis ...................................................................................................... 12
1.5 Summary of methodological limitations and lessons ........................................... 12
1.6 Report structure ....................................................................................................... 13
2.0 Understanding Walking for Health ..................................................... 14
2.1 Introduction .............................................................................................................. 14
2.2 Programme evolution............................................................................................... 14
2.2.1 History ........................................................................................................................ 14
2.2.2 Involvement of the Ramblers and Macmillan .............................................................. 14
2.3 Context and rationale ............................................................................................... 15
2.3.1 Impacts of physical activity on health and well being ................................................. 15
2.3.2 The role of walking ..................................................................................................... 16
2.3.3 Recent policy developments ....................................................................................... 18
2.4 Programme aims and objectives, inputs and activities ........................................ 18
2.4.1 Aims and objectives ................................................................................................... 18
2.4.2 Inputs.......................................................................................................................... 19
2.4.3 Activities delivered by the national programme team ................................................. 20
2.5 Expected outputs and outcomes ............................................................................ 21
2.6 Logic model .............................................................................................................. 22
2.7 Summary ................................................................................................................... 24
3.0 Delivering Walking for Health ............................................................. 25
3.1 Introduction .............................................................................................................. 25

3.2 Inputs and funding ................................................................................................... 25
3.2.1 Key funding sources ................................................................................................... 25
3.2.2 Scheme budgets ........................................................................................................ 26
3.2.3 Role of scheme coordinator ........................................................................................ 27
3.3 Walking schemes and walks ................................................................................... 27
3.3.1 Number of schemes ................................................................................................... 27
3.3.2 Number and frequency of walks and size of schemes ............................................... 27
3.3.3 Number of regular walkers ......................................................................................... 29
3.3.4 Duration and location of walks .................................................................................... 29
3.3.5 Targeted walks ........................................................................................................... 31
3.4 Walkers and their characteristics ........................................................................... 32
3.4.1 Number of walkers ..................................................................................................... 32
3.4.2 General profile of walkers ........................................................................................... 32
3.4.3 Deprivation and Education levels ............................................................................... 33
3.4.4 Inactivity, long-term health conditions and cancer ...................................................... 35
3.5 Satisfaction with Walking for Health....................................................................... 37
3.6 Volunteers ................................................................................................................. 39
3.6.1 Number of volunteers ................................................................................................. 39
3.6.2 Profile of volunteers .................................................................................................... 40
3.6.3 Volunteer time ............................................................................................................ 40
3.7 Summary ................................................................................................................... 40
4.0 Outcomes and Impact of Walking for Health ..................................... 43
4.1 Introduction .............................................................................................................. 43
4.2 Physical activity amongst walkers ......................................................................... 43
4.2.1 Changes in moderate physical activity, walking and inactivity .................................... 44
4.2.1.1 Moderate physical activity .......................................................................................... 44
4.2.1.2 Walking....................................................................................................................... 45
4.2.1.3 Inactivity ..................................................................................................................... 48
4.2.2 Meeting national guidelines ........................................................................................ 49
4.2.3 Contribution and impact of Walking for Health ........................................................... 52
4.2.3.1 Maintaining physical activity ....................................................................................... 52
4.2.3.2 Stepping down ............................................................................................................ 53
4.3 Social outcomes ....................................................................................................... 60
4.3.1 Mental wellbeing ......................................................................................................... 60
4.3.2 Life satisfaction ........................................................................................................... 61
4.3.3 Loneliness and social interaction ................................................................................ 61
4.3.4 Contribution and Impact of Walking for Health ........................................................... 65
4.4 General quality of life, health and mental health ................................................... 66

4.4.1 Contribution and impact of Walking for Health ........................................................... 69
4.5 Volunteer outcomes ................................................................................................. 71
4.5.1 Social benefits ............................................................................................................ 71
4.5.2 Physical activity benefits............................................................................................. 72
4.5.3 Active citizenship ........................................................................................................ 72
4.6 Summary ................................................................................................................... 73
5.0 Economic Analysis of Walking for Health ......................................... 75
5.1 Introduction .............................................................................................................. 75
5.2 Output-focused analysis .......................................................................................... 75
5.3 Cost-effectiveness analysis .................................................................................... 76
5.4 Cost-Utility Analysis and Return on Investment (Cost-Benefit Analysis) ........... 79
5.4.1 Modelling approach .................................................................................................... 79
5.4.2 Inputs and assumptions.............................................................................................. 80
5.4.3 One-way Sensitivity Analysis ...................................................................................... 84
5.5 Summary ................................................................................................................... 88
6.0 Process lessons from Walking for Health ......................................... 90
6.1 Introduction .............................................................................................................. 90
6.2 Increasing participation and engagement of target groups ................................. 90
6.2.1 General scheme promotion ........................................................................................ 90
6.2.2 Group targeting .......................................................................................................... 92
6.3 Engaging with health professionals ....................................................................... 97
6.4 The Walking for Health experience ....................................................................... 100
6.5 Sustainability of delivery approaches .................................................................. 103
6.5.1 Access to funding sources for local schemes ........................................................... 104
6.5.2 Ensuring a sufficient pool of volunteers .................................................................... 105
6.6 Role of national programme team ........................................................................ 107
6.6.1 Training .................................................................................................................... 107
6.6.2 Accreditation ............................................................................................................. 108
6.6.3 Volunteer recruitment ............................................................................................... 109
6.6.4 Helping local schemes to access funding ................................................................. 109
6.6.5 Other on-going support and advice .......................................................................... 109
6.6.6 National level advocacy and promotion .................................................................... 110
6.6.7 Marketing and branding ............................................................................................ 110
6.6.8 Supporting scheme engagement with specific target groups ................................... 112
6.7 The partnership ...................................................................................................... 112
6.8 Summary and conclusions .................................................................................... 112

7.0 Evaluation Conclusions .................................................................... 115
7.1 Introduction ............................................................................................................ 115
7.2 Relevance ................................................................................................................ 115
7.3 Participant outcomes ............................................................................................. 115
7.4 Economic analysis ................................................................................................. 117
7.5 Meeting specific programme objectives .............................................................. 118
7.5.1 Widening the programme’s reach to people who are currently inactive ................... 118
7.5.2 Funding and sustainability ........................................................................................ 122
7.5.3 Volunteers ................................................................................................................ 123
7.6 Methodological lessons and recommendations .................................................. 124
Annex One: Research Tools ................................................................. 1
Annex Two: List of stakeholder consultees ...................................... 38
Annex Three: Additional information on methodology .................... 40
Annex Four: Documents reviewed ..................................................... 47

List of figures
Figure 2.1 Logic Model ........................................................................................................................... 23
Figure 3.1 Main funding sources for schemes ....................................................................................... 25
Figure 3.2 Monthly frequency of walkers attending walks at Wave 2 and Wave 3 ................................. 28
Figure 3.3 Distribution of schemes by number of regular walkers ......................................................... 29
Figure 3.4 Distribution of walkers by age ............................................................................................... 33
Figure 3.5 Frequency distribution of Index of Multiple Deprivation scores in the baseline sample ....... 34
Figure 3.6 The percentage of participants split according to highest level of education attained ......... 35
Figure 4.1 Mean number of days doing at least 30 minutes of moderate activity .................................. 44
Figure 4.2 Mean minutes per week walking ............................................................................................ 45
Figure 4.3 Mean number of steps taken at baseline (n=102) and at follow up (n=72) ........................... 46
Figure 4.4 Frequency distribution of change in mean daily pedometer steps between Wave 1 and
follow-up .................................................................................................................................................. 47
Figure 4.5 Percentage doing zero days of at least 30 minutes of moderate activity .............................. 48
Figure 4.6 Percentage doing at least 30 minutes of moderate activity on five days or more ................. 49
Figure 4.7 Percentage aged 65+ doing at least five days of 30 minutes or more moderate activity ...... 50
Figure 4.8 Percentage doing at least 30 minutes of moderate activity on three days or more ............... 51
Figure 4.9 Mean reported minutes per day typically spent sitting .......................................................... 52
Figure 4.10 Expected change in physical activity over the next 12 months at baseline compared to
actual change in moderate physical activity between Wave 1 and Wave 2............................................ 53
Figure 4.11 Expected change in physical activity over the next 12 months at baseline, compared to
actual change in moderate physical activity between Wave 1 and Wave 3............................................ 54
Figure 4.12 Mean number of days doing at least 30 minutes of moderate activity for those
continuing at Wave 2 and those not ........................................................................................................ 55
Figure 4.13 Mean minutes per week walking for those continuing at Wave 2 and those not ................ 55
Figure 4.14 Mean reported minutes per day typically spent sitting for those continuing at Wave 2
and those not ........................................................................................................................................... 56
Figure 4.15 Participation in other physical activity at Wave 2, for those continuing at Wave 2 and
those not .................................................................................................................................................. 58
Figure 4.16 Participation in other physical activity at Wave 3, for those continuing at Wave 2 and
those not .................................................................................................................................................. 58
Figure 4.17 Mean Warwick Edinburgh Mental Wellbeing Scale scores ................................................. 60
Figure 4.18 Mean life satisfaction scores (all in constant sample) .......................................................... 61
Figure 4.19 Mean loneliness scores...................................................................................................... 62
Figure 4.20 Mean social interaction scores ............................................................................................. 63
Figure 4.21 Mean Warwick Edinburgh Mental Wellbeing Scale scores for those continuing at Wave
2 and those not ........................................................................................................................................ 66
Figure 4.22 Mean EQ-5D DS scores; a higher mean score signifies worse health ............................... 67
Figure 4.23 Mean EQ-5D VAS scores (all in constant sample) ............................................................ 68
Figure 4.24 Mean EQ-5D DS scores for those continuing at Wave 2 and those not ............................. 70
Figure 4.25 Mean EQ-5D VAS scores for those continuing at Wave 2 and those not ........................... 70
Figure 6.1 A word cloud highlighting the most common words used in the verbatim quotes
collected in response to open ended question (Wave 3 responses) .................................................... 101
List of tables
Table 1.1 Summary of case study schemes ............................................................................................. 3
Table 1.2 Numbers participating in each wave of the survey................................................................... 6
Table 1.3 Characteristics of Wave 1 sample compared to the Walking for Health Database and
2011 Census ............................................................................................................................................. 6
Table 1.4 Characteristics of those in the constant sample compared to those that were not.................. 7
Table 1.5 Characteristics of those that continued at Wave 2 compared to those that did not ................. 8
Table 1.6 Differences in the reported number of days that a total of 30 minutes or more of physical
activity was undertaken at survey time and prior recall ............................................................................. 9
Table 1.7 The number of times participants in the ‘constant sample’ had taken part in Walking for
Health walks at wave 1 ............................................................................................................................ 10
Table 3.1 Walk duration and walk distance ............................................................................................ 30
Table 3.2 Characteristics of Walking for Health Participants .................................................................. 33
Table 3.3 Continued participation in the programme and time since last walk ...................................... 37
Table 3.4 Measures of general satisfaction with Walking for Health ..................................................... 38
Table 3.5 Measures of general satisfaction with Walking for Health at Wave 1 and for those that left
the programme by Wave 2 and Wave 3 .................................................................................................. 38
Table 3.6 Stated reasons for no-longer attending a Walking for Health Walk ....................................... 39
Table 4.1 Attribution of changes in physical activity to Walking for Health ............................................ 57
Table 4.2 Types of physical activity participated in since joining Walking for Health ............................. 59
Table 4.3 Reported attribution of improvements in life satisfaction to Walking to Health ...................... 66
Table 4.4 Reported attribution of changes in quality of life to Walking to Health ................................... 71
Table 5.1 Estimation of programme costs .............................................................................................. 76
Table 5.2 Derivation of programme unit costs ....................................................................................... 76
Table 5.3 Conversion of active days to METS ........................................................................................ 78
Table 5.4 Input Parameter Values ........................................................................................................... 82
Table 5.5 Cost-Utility Results ................................................................................................................. 83
Table 5.6 The financial return on investment to the NHS ....................................................................... 84
Table 5.7 The return on investment based on willingness to pay for QALYs ......................................... 84
Table 5.8 Additionality of Walking for Health ......................................................................................... 86
Table 5.9 Results of One-way Sensitivity Analysis (Return on Investment) .......................................... 87
Table 5.10 Results of One-way Sensitivity Analysis (cost per QALY) .................................................... 88
Table 6.1: Source of where participants found out about the scheme .................................................... 91
Table 6.2 Aspects of satisfaction at Wave 2 ........................................................................................ 100
Table 6.3 Satisfaction for those leaving the programme at Wave 2 and Wave 3 ................................ 100
i
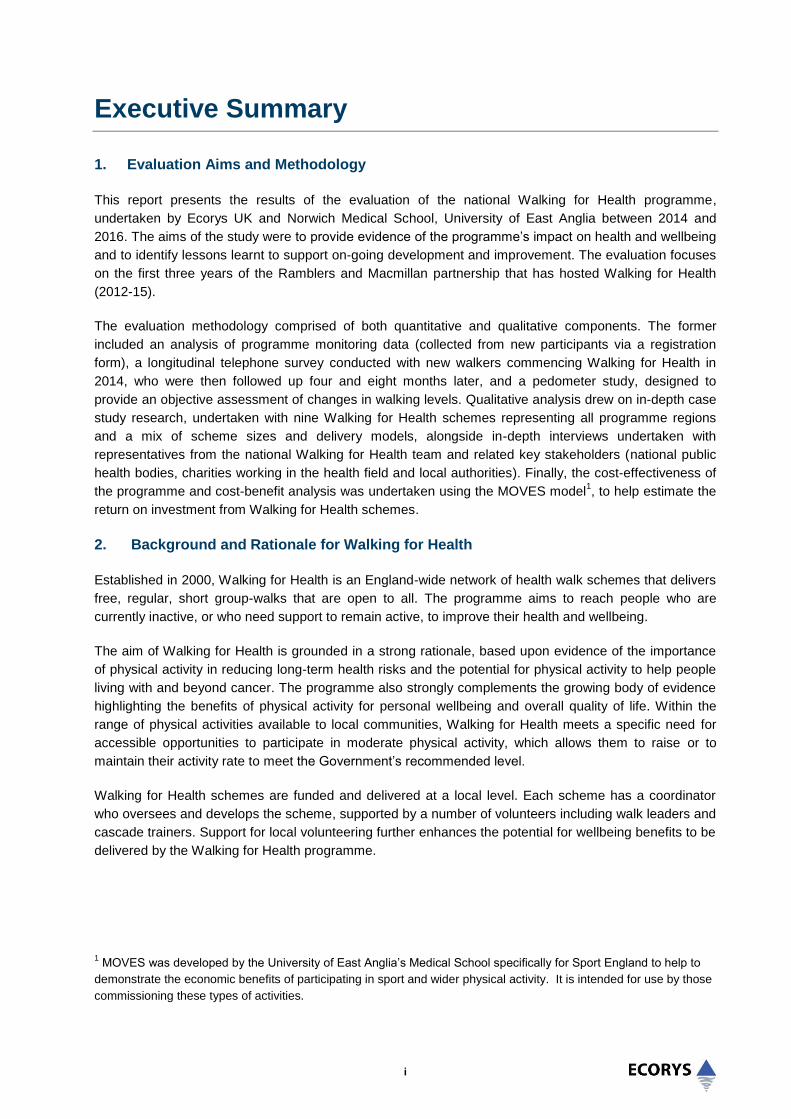
Executive Summary
1. Evaluation Aims and Methodology
This report presents the results of the evaluation of the national Walking for Health programme,
undertaken by Ecorys UK and Norwich Medical School, University of East Anglia between 2014 and
2016. The aims of the study were to provide evidence of the programme’s impact on health and wellbeing
and to identify lessons learnt to support on-going development and improvement. The evaluation focuses
on the first three years of the Ramblers and Macmillan partnership that has hosted Walking for Health
(2012-15).
The evaluation methodology comprised of both quantitative and qualitative components. The former
included an analysis of programme monitoring data (collected from new participants via a registration
form), a longitudinal telephone survey conducted with new walkers commencing Walking for Health in
2014, who were then followed up four and eight months later, and a pedometer study, designed to
provide an objective assessment of changes in walking levels. Qualitative analysis drew on in-depth case
study research, undertaken with nine Walking for Health schemes representing all programme regions
and a mix of scheme sizes and delivery models, alongside in-depth interviews undertaken with
representatives from the national Walking for Health team and related key stakeholders (national public
health bodies, charities working in the health field and local authorities). Finally, the cost-effectiveness of
the programme and cost-benefit analysis was undertaken using the MOVES model1, to help estimate the
return on investment from Walking for Health schemes.
2. Background and Rationale for Walking for Health
Established in 2000, Walking for Health is an England-wide network of health walk schemes that delivers
free, regular, short group-walks that are open to all. The programme aims to reach people who are
currently inactive, or who need support to remain active, to improve their health and wellbeing.
The aim of Walking for Health is grounded in a strong rationale, based upon evidence of the importance
of physical activity in reducing long-term health risks and the potential for physical activity to help people
living with and beyond cancer. The programme also strongly complements the growing body of evidence
highlighting the benefits of physical activity for personal wellbeing and overall quality of life. Within the
range of physical activities available to local communities, Walking for Health meets a specific need for
accessible opportunities to participate in moderate physical activity, which allows them to raise or to
maintain their activity rate to meet the Government’s recommended level.
Walking for Health schemes are funded and delivered at a local level. Each scheme has a coordinator
who oversees and develops the scheme, supported by a number of volunteers including walk leaders and
cascade trainers. Support for local volunteering further enhances the potential for wellbeing benefits to be
delivered by the Walking for Health programme.
1 MOVES was developed by the University of East Anglia’s Medical School specifically for Sport England to help to
demonstrate the economic benefits of participating in sport and wider physical activity. It is intended for use by those
commissioning these types of activities.

ii
3. Delivering Walking for Health
National programme team and accreditation
The national programme team, which has been hosted by the Ramblers in partnership with Macmillan
since 2012 (and subsequently extended to run to at least March 31st 2018) provides infrastructure to
support delivery across the whole of England. Stakeholders consulted for the evaluation were generally
positive about the rationale, operation and effectiveness of the Macmillan and Ramblers partnership.
In order to help meet the overarching programme aim of improving people’s health and wellbeing, the
Ramblers and Macmillan set nine specific objectives for Walking for Health for 2012-15. One key
objective was to raise awareness of the value of Walking for Health among health and social care
professionals (in order for example to facilitate the signposting of target groups and access to funding). In
support of this, the national programme team has played a particularly important role in developing a
common identity and product for Walking for Health, as a health activity that meets specific criteria. This
includes ensuring that the programme and its local level schemes are fit for purpose for engaging people
with long-term health conditions and those who are inactive, in moderate-level physical activity.
A rigorous process of accreditation has therefore been a key focus of the national programme team since
2012. All schemes should now meet the requirement of providing at least one walk between 10-30
minutes per month, walks that last no longer than 90 minutes, and walks set at a moderate pace that
make walkers feel warmer, breathe harder and their heart beat faster (whilst still being able to talk to
others around them). There was a broad consensus amongst stakeholders and local schemes consulted
that this accreditation role has been executed effectively, and that there is now a widespread
understanding and acceptance of the need for schemes to include shorter health walks.
Number and size of local schemes
A further specific objective set by Ramblers and Macmillan was to increase the availability of and
participation in Walking for Health. The effects of accreditation are shown in the decline in the number of
registered schemes between April 2014 and March 2015, from 591 to 400. Some schemes merged with
others as a result of the accreditation process and some chose not to apply for accreditation.
Nonetheless, analysis of scheme data also shows that individual schemes vary significantly in terms of
their number and range of programmed walks, and in terms of how many regular walkers participate in
these walks. The average was 47 regular walkers and the highest number was over 3,000. This suggests
significant potential for individual schemes to expand in order to help increase participation in Walking for
Health, providing that the required resources can be accessed.
The accreditation process has highlighted the benefits of a national coordination role. Moving
forwards, there is the potential for more targeted promotion amongst national-level health
organisations and groups in order to raise the profile of Walking for Health. Other areas which would
benefit from an increased level of national support include the engagement of target groups in local
Walking for Health schemes, the development of local partnerships, and the diversification of scheme
funding.
iii
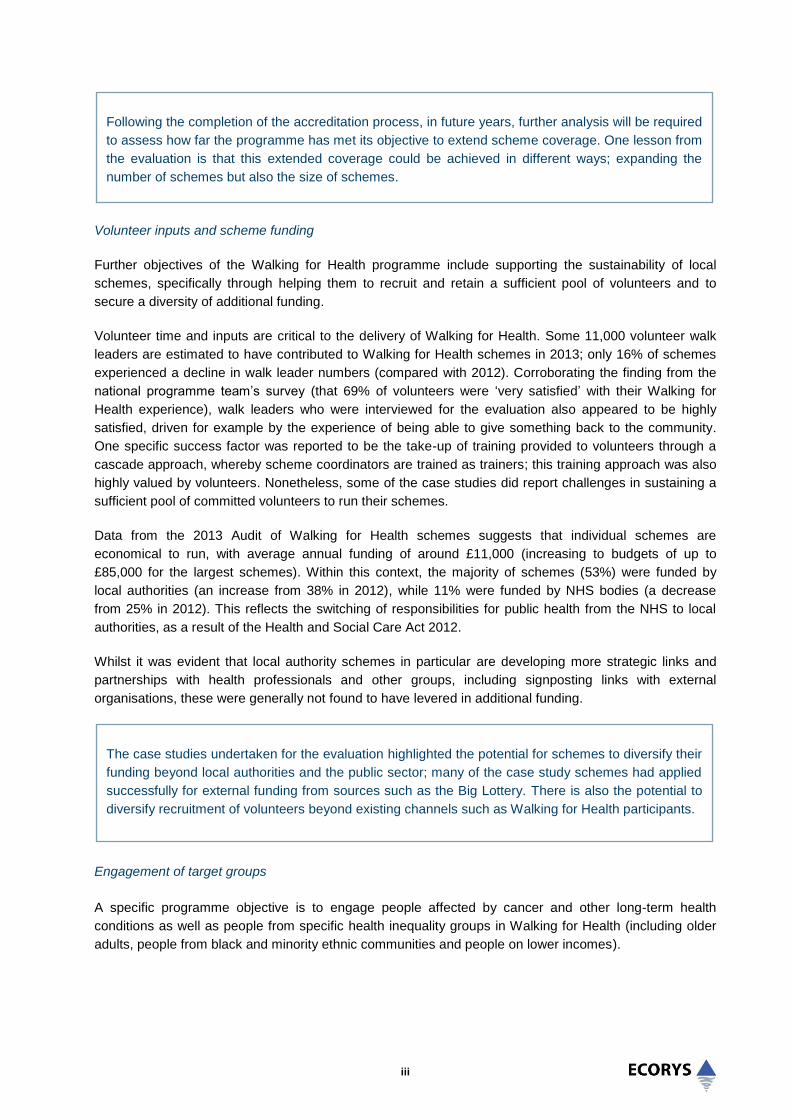
Volunteer inputs and scheme funding
Further objectives of the Walking for Health programme include supporting the sustainability of local
schemes, specifically through helping them to recruit and retain a sufficient pool of volunteers and to
secure a diversity of additional funding.
Volunteer time and inputs are critical to the delivery of Walking for Health. Some 11,000 volunteer walk
leaders are estimated to have contributed to Walking for Health schemes in 2013; only 16% of schemes
experienced a decline in walk leader numbers (compared with 2012). Corroborating the finding from the
national programme team’s survey (that 69% of volunteers were ‘very satisfied’ with their Walking for
Health experience), walk leaders who were interviewed for the evaluation also appeared to be highly
satisfied, driven for example by the experience of being able to give something back to the community.
One specific success factor was reported to be the take-up of training provided to volunteers through a
cascade approach, whereby scheme coordinators are trained as trainers; this training approach was also
highly valued by volunteers. Nonetheless, some of the case studies did report challenges in sustaining a
sufficient pool of committed volunteers to run their schemes.
Data from the 2013 Audit of Walking for Health schemes suggests that individual schemes are
economical to run, with average annual funding of around £11,000 (increasing to budgets of up to
£85,000 for the largest schemes). Within this context, the majority of schemes (53%) were funded by
local authorities (an increase from 38% in 2012), while 11% were funded by NHS bodies (a decrease
from 25% in 2012). This reflects the switching of responsibilities for public health from the NHS to local
authorities, as a result of the Health and Social Care Act 2012.
Whilst it was evident that local authority schemes in particular are developing more strategic links and
partnerships with health professionals and other groups, including signposting links with external
organisations, these were generally not found to have levered in additional funding.
Engagement of target groups
A specific programme objective is to engage people affected by cancer and other long-term health
conditions as well as people from specific health inequality groups in Walking for Health (including older
adults, people from black and minority ethnic communities and people on lower incomes).
Following the completion of the accreditation process, in future years, further analysis will be required
to assess how far the programme has met its objective to extend scheme coverage. One lesson from
the evaluation is that this extended coverage could be achieved in different ways; expanding the
number of schemes but also the size of schemes.
The case studies undertaken for the evaluation highlighted the potential for schemes to diversify their
funding beyond local authorities and the public sector; many of the case study schemes had applied
successfully for external funding from sources such as the Big Lottery. There is also the potential to
diversify recruitment of volunteers beyond existing channels such as Walking for Health participants.

iv
Local schemes use a variety of methods to recruit new walkers, which vary in their level of effectiveness.
The most widely used methods of promotion have been word of mouth and posters in venues such as
leisure centres and church halls. There is a risk that reliance on these approaches limits the schemes’
ability to engage with more diverse groups of walkers, including those affected by specific health issues.
Schemes have increasingly recognised the potential of the Walking for Health association with Macmillan
to facilitate health sector partnerships, and as a result of this, increased their drive to engage with GPs
through targeted promotion at GP surgeries and engagement with health professionals and
commissioners. However there is the potential for lessons from individual schemes’ successful
engagement of health professionals to be shared more widely across the programme.
These process findings are reflected in the data on the demographic profile of Walking for Health
participants. The evidence suggests that Walking for Health is successful at targeting and engaging older
adults, since the vast majority of participants are in the over-55 age group. 4.3% of all walkers and 7.3%
of new walkers in the year to March 2015 had been diagnosed with cancer, an increase on the year to
September 2014; these figures compare to a cancer prevalence rate of 3.2% for the overall population.
Some 33.6% of walkers registered in the year to March 2015 had at least one serious health condition
(excluding cancer).
However, the evaluation found that further actions are needed to meet the programme aim of reaching
those groups that are considered to need most support for accessing Walking for Health:
Overall, based upon self-reported data, participants in Walking for Health tended to be healthier, and
no less active, than people of comparable age within the general population.
Only 3.4% of walkers in the year to March 2015 belonged to ethnic minority groups (compared to
15% of the national population).
In the year to March 2015, 5.3% of walkers lived in the 20% most deprived areas as defined by the
Index of Multiple Deprivation (compared with 10% of the national population).
Despite such challenges, the case study research demonstrated examples of good practice in attracting
people with long-term health conditions, engaging with health professionals, and engaging with ‘harder-
to-reach’ groups who are physically inactive. For example, there were examples of successful signposting
schemes whereby cancer and heart patients are signposted directly on to the programme, and schemes
which use community venues and health talks to reach out to people living in deprived areas.
4. Outcomes and Impact of Walking for Health
An important focus of the evaluation was the extent to which the Walking for Health programme
generates positive outcomes and impacts for participants. Programme achievements were explored with
respect to changes in overall physical activity, walking, sedentary behaviours (sitting), and improvements
in general health and wellbeing.
An important lesson from the experience of reaching and engaging target groups is the need for
more systematic analysis of health inequalities in local areas to support Walking for Health scheme
targeting, as well as the recruitment of walk leader ‘champions’ from target populations.
v
Overall, participants in Walking for Health maintained their levels of weekly physical activity
over the full period of the survey (8 months), even allowing for some drop out. This is a positive
finding given the aims of the programme to sustain moderate-level physical activity, and the older
target group engaged. On average, participants were undertaking around 2.5 days of (at least 30
minutes) moderate physical activity at the baseline and final follow-up stages of the survey.
Furthermore, half of the respondents reported that it was unlikely they would have found a similar
scheme in the absence of Walking for Health. Qualitative evidence pointed to the importance of
Walking for Health in helping older people to maintain their physical activity when stepping down from
more vigorous or other walking activities. Amongst the minority of respondents who increased their
level of activity between Wave 1 and Wave 3 of the survey (including people who self-reported
themselves as inactive at Wave 1 according to standard definitions), positively, a proportion of these
attributed this change to involvement in Walking for Health. However (and aligning with the findings
above on the engagement of target groups), it should be noted participants continuing on the
programme after four months were generally more active and healthier than those who ceased
participating.
Walking for Health leads to a significant short-term overall increase in levels of weekly
physical activity after first joining the programme; however this increase is generally not
sustained. Statistically significant increases in levels of walking (38.2 more minutes per week) and
moderate physical activity (1.17 extra days of at least 30 minutes per week) were detected through
the survey after the four month interval. However, at the eight month mark, physical activity levels had
dropped back to those immediately after the first walk. One possible explanation for this trend is that
the initial enthusiasm of walkers, as well as the opportunity to try out different types of walks offered
by some Walking for Health schemes, drives this initial increase, before walkers settle back into more
manageable levels of activity. A minority of respondents also dropped out of Walking for Health
schemes altogether (including some who were ‘inactive’ at Wave 1).
There was an improvement observed in a number of measures of wellbeing. Statistically
significant improved scores were observed for general mental health (as measured by the Warwick
Edinburgh Mental Wellbeing Scale), loneliness, and social interaction. Overall life satisfaction did not
change. The qualitative responses to the survey and in-depth interviews conducted for the case
studies confirmed that the social aspects of Walking for Health represent an important benefit for
many participants, for example the opportunity for increased social interaction.
Similarly, the key personal benefits experienced by the volunteers involved in Walking for Health were
reported to be increased levels of physical activity, enjoyment but also personal satisfaction derived from
their volunteering duties.
The evaluation evidence identified the following positive factors which have resulted in high
satisfaction levels amongst participants, as well as facilitating physical activity and social benefits.
This provides useful learning for local Walking for Health schemes.
The regularity of walks and in particular the opportunity to attend walks on a weekly basis.
The role of the walk leaders in creating a welcoming atmosphere and encouraging social
interaction.
Walks starting and ending in accessible locations (i.e. in town centres or near to public transport
nodes)
Allowing walking groups to divide into smaller groups, of faster and slower walkers, when
requested by the walkers.
vi
5. Return on Investment
Based upon a combination of Walking for Health programme data and the evaluation survey, the MOVES
model indicates that Walking for Health has the potential to be highly cost-effective, at £3,775 per Quality-
Adjusted Life Year (QALY) gained. This cost per QALY is well below the NICE recommended threshold
cost of £30,000. Furthermore, based on the total value of QALYs gained, the potential Return on
Investment (benefit-cost ratio) is estimated to be £3.36 per £1 invested in Walking for Health. MOVES
also estimates that the programme delivers cost savings to the NHS of £0.58 for every £1 invested.
The MOVES model assumes that the physical activity undertaken for any evaluated programme is
additional to what would have occurred in its absence. Whilst no counterfactual data was available to
thoroughly test this assumption with regards to Walking for Health, this scenario is broadly consistent with
the overall evaluation finding that Walking for Health helps participants to maintain a level of regular,
moderate-intensity physical activity. The analysis is also based conservatively on the specific time spent
undertaking walking through Walking for Health (rather than assuming that Walking for Health impacts on
all physical activity, even if it may do so in practice for some participants). This equates to 75 minutes of
walking per week. MOVES also assumes that the level of physical activity is maintained over the longer-
term (in the base case for 5 years or more); this is necessary for physical activity to generate sufficient
positive health gains (as well as being consistent with the objectives of Walking for Health to help people
to remain active). However, even after adjusting these assumptions through sensitivity testing (shorter
time horizon, lower level of additionality), the cost-effectiveness results remain positive.
6. Key Recommendations
The evaluation identified a number of recommendations to help improve the Walking for Health
programme. These are organised below in relation to the future priorities of engaging with health
professionals and Walking for Health target groups, and support for sustainability.
The lessons for Walking for Health and its local schemes from the economic analysis are that cost-
effectiveness can be maximised, and a positive return on investment is achievable, through
engagement with those target groups who are more likely to be disengaged from and face barriers to
accessing similar physical activities in their local area. Crucially, schemes also need to support such
groups to remain engaged in walking (or other physical activities) over the longer-term.
Offering a variety of walks that cater for differing abilities.
Providing the conditions for social interaction outside of the walking activity, such as starting and
finishing at social meeting places such as cafes.
Being free of charge and open to all.

vii
Engaging with health professionals
The evaluation recommends that Walking for Health schemes consider adopting the following good
practices to promote stronger engagement with health professionals (where relevant):
Close links with local authority public health departments, since this can facilitate working
relationships and opportunities for increased partnership working with the wider health community
(some schemes are managed within local authority public health departments).
Regular attendance of scheme coordinators at Clinical Commissioning Group meetings and Health
and Well Being Boards, to promote Walking for Health schemes and network with specific health
bodies and groups.
Targeted promotion at GP surgeries by sending Walking for Health promotional packs including
leaflets and posters.
Training community champions with existing links to GP surgeries to be walk leaders, and starting
their walks from a surgery.
Engaging with and meeting the criteria for social prescribing and exercise on prescription initiatives.
Establishing signposting schemes with patient recovery programmes to Walking for Health walks.
Including Walking for Health on local exercise referral systems that are used by medical
professionals.
The evaluation recommends that such local initiatives are supported by increased engagement with
national level health bodies from the national programme team, to help ensure that Walking for Health
can be recommended through social prescribing and local exercise referral schemes, and to help
increase the engagement of particular groups with health conditions. For example, it was suggested that
Walking for Health should work with national bodies to help ensure that sufficient incentives are in place
for GP surgeries to refer to the programme – one mechanism highlighted was to ensure that more local
surgeries adhere to the voluntary Quality and Outcomes Framework.
Stakeholders interviewed for Walking for Health suggested a number of specific national bodies and
networks that the programme could engage more intensively with, including:
Mental health charities.
Charities supporting older people.
Other large charities connected with the health and social care sector.
National agencies promoting preventative health (such as Public Health England).
Engaging with target groups
The evaluation recommends that strategies and actions are developed to help retain participants on
Walking for Health schemes who are less active to begin with. This could be achieved through more
intensive support, and/or by tailoring specific walks to their needs.
viii
The evaluation recommends that a greater focus and more resources are invested in engaging effectively
with BME and lower income groups (who may suffer from a higher prevalence of health conditions and
physical inactivity). A number of specific actions emerged from the evaluation:
There is a need to build relationships with ‘community champions’ (i.e. those with close links to
relevant local communities), who can promote the walks and be trained as walk leaders in order to
attract and help retain hard-to-reach groups.
Schemes should be encouraged to promote Walking for Health within a greater diversity of venues
with close links to the community (for example local pharmacies), in order to raise the profile of
walking groups.
There is the potential to link up more effectively with local physical activity strategies and other
programmes, with Walking for Health supporting local actions to engage specific groups in physical
activity.
Key lessons learnt from the pilot programme every step counts (run by the Ramblers and targeting
the most inactive) should be collated and mainstreamed across the general Walking for Health
programme.
The national programme team should play a facilitative role in sharing such good practice approaches
with respect to engaging target groups, alongside approaches to engaging with relevant health
professionals and health bodies (as discussed above).
Support for sustainability
The evaluation recommends that the national programme team supports sustainability by helping to
develop the Walking for Health ‘offer’ for local commissioners, as a key potential funder. This could be
achieved by developing the following:
A clearer specification of what Walking for Health provides as a health preventative and management
measure, including its inputs, outputs, health outcomes and return on investment, drawing on the
cumulative evidence and data from the evaluation work conducted to date.
Identifying the role of Walking for Health within a broader pathway that can help to secure longer-term
involvement in physical activity; this means schemes developing clearer links with progression walks.
Highlighting reassuring evidence that walk leaders are well trained and safety procedures are in place
on the walks.
The evaluation recommends that the national programme team provides further support to local
schemes for volunteer recruitment and retention, in terms of:
Facilitating the sharing of good practice on local volunteer recruitment and management.
Publicising as widely as possible the benefits of volunteering for Walking for Health through existing
forums such as the Macmillan Volunteering village.

ix
7. Methodological Lessons and Recommendations
There are a number of useful lessons from the study that should be taken on board by future evaluations.
The following recommendations should be considered to increase the relevance and quality of future
evaluations of Walking for Health:
Principally, a solution should be found to the challenge of collecting robust baseline data prior to
participants’ involvement in Walking for Health. We recommend that the modified single item question
used in the evaluation be included in walker registration forms; most importantly it will be necessary
to significantly boost the response rate to this question amongst new walkers.
More in-depth questionnaires could be administered with a sub-sample of participants before their
first walk, both to help boost/actively monitor the number of physical activity measurements, and in
order that a wider range of health and wellbeing outcomes have an appropriate baseline in place.
A larger sample of schemes should be included in follow-up survey research in order to help boost
overall survey numbers; this would allow for more detailed sub-group analysis, and for the detection
of smaller changes in outcomes, in line with key programme objectives.
The national programme should consider the potential for testing an experimental (e.g. randomised
control trial) or quasi-experimental design in future evaluations of Walking for Health, to help robustly
estimate the counterfactual position and hence the impact of Walking for Health on outcomes.
The survey instruments and questions employed for measuring physical activity and walking provided
valid and relevant measures of change in one of the principal outcomes of interest to Walking for
Health. The pedometer study proved less effective due to a number of practical issues associated
with the use and return of pedometers. The majority of measures of wellbeing were also fit-for-
purpose; EQ-5D proved less useful due to the length of the questions, and their suitability to be
asked as part of a telephone survey. Overall, using a combination of quantitative and qualitative
methods (including in-depth case studies) improved the quality of the evaluation evidence. Finally,
the MOVES model proved a useful tool for understanding the cost-effectiveness and return on
investment of Walking for Health. The inputs and thus accuracy of the MOVES analysis could be
tweaked in future years through access to improved data on the additionality of Walking for Health
schemes, and the sustainability of participant involvement.

1
1.0 Introduction
1.1 Introduction
In July 2013, Ecorys, with the University of East Anglia (UEA), was commissioned by the Ramblers and
Macmillan Cancer Support to undertake an evaluation of the national Walking for Health programme. This
is the study’s final report.
1.2 Walking for Health programme
Set up in 2000, Walking for Health is an England-wide network of health walk schemes that delivers free,
regular, short group walks that are open to all. The primary objective of the Walking for Health
programme is to increase the availability of and participation in regular, short walks delivered by local
Walking for Health schemes so that people who are currently inactive, or who need support to remain
active, are encouraged to walk to improve their health and wellbeing. Walking for Health particularly aims
to reach those who need the most support to get or stay active, including people affected by cancer and
other long-term health conditions, and those from recognised health inequality groups such as older
adults, people from black and minority ethnic communities and people on lower incomes.2 The
programme was previously funded by Department for Health and run by Natural England, before the
Ramblers became the host of Walking for Health from April 2012, entering an initial three year partnership
with Macmillan Cancer Support which was subsequently extended to run to least March 31 2018.
Walking for Health schemes are funded and delivered at a local level. Each scheme has a scheme
coordinator who oversees and develops the scheme, supported by a number of volunteers including walk
leaders and cascade trainers. The national programme team, which is hosted by the Ramblers in
partnership with Macmillan, supports delivery across the whole of England.
1.3 Evaluation aims
The overall aim of the study is to evaluate the Walking for Health programme for all participants, including
people living with cancer, in order to provide evidence of the programme’s impact and draw out key
lessons for the Ramblers and Macmillan to support on-going development and improvement. The
evaluation focuses on the first three years of the Ramblers and Macmillan’s partnership hosting of
Walking for Health (April 2012 – March 2015). The study has six specific objectives:
To assess the extent to which Walking for Health is effective in achieving the outcomes set out in the
logic model (see section 2.6).
To assess the extent to which Walking for Health has been successful in engaging key target groups,
including people living with or affected by cancer, those with other long-term health conditions, and
those from recognised health inequality groups, which include Black and Minority Ethnic groups, older
people and those on lower incomes.
To identify best practice for raising awareness, engagement of target groups and local delivery and
share this across Walking for Health schemes.
2 Walking for Health: Business Plan 2013

2
To provide on-going formative evaluation, identifying and sharing key learning and recommendations
with Macmillan and the Ramblers, and draw out the strategic lessons that can inform and help shape
the development of the programme. This aspect of the evaluation has drawn in particular on the
specific objectives set for Walking for Health by the Ramblers and Macmillan (see section 2.4), as a
point of reference.
To assess the extent to which the Walking for Health national programme team has been effective at
engaging and supporting existing and new schemes.
To identify the full costs and benefits of Walking for Health, to provide an understanding of the value
generated by Macmillan’s and the Ramblers investment in Walking for Health.
1.4 Methodology
The methodology for the study consisted of a number of elements. These included:
Review of programme documentation;
Review of Walking for Health programme data;
Qualitative case studies;
Longitudinal surveys of walkers;
Pedometer research; and
Stakeholder consultation.
These elements are described in detail below.
1.4.1 Review of programme documentation
A review of existing relevant strategic and programme documentation was completed at the outset of the
study. Throughout the study the evaluation team has also drawn on policy documents, academic
literature and existing research and previous evaluations conducted on Walking for Health. A list of
documents reviewed is included in Annex four.
1.4.2 Review of programme data
Descriptive and contextual information on the characteristics of Walking for Health schemes, volunteers
and walkers is based on analysis of the Walking for Health database and data from the scheme audits of
2012 and 2013.
1.4.3 Qualitative case studies
The qualitative analysis presented in the report draws mainly on in-depth case study research undertaken
on nine Walking for Health schemes3. A purposive sampling approach was adopted in the selection of the
case studies. These included three schemes from each of the Walking for Health regions4 covering a mix
of scheme sizes and types of delivery models. The case studies were also selected on the basis that they
3 The case study research tools are included in Annex One. The case study reports are available as separate
standalone outputs of the evaluation. 4 LASER – London, East of England, South East; CSWE – Central, South West, West Midlands; EMNE – East
Midlands & North England

3
could potentially offer good practice approaches and transferable models and lessons, based on the
national programme team’s knowledge of scheme approaches to engagement and targeting. Table 1.1
sets out the region, size5 and type of scheme chosen. The names of the schemes are kept anonymous
throughout the report.
Table 1.1 Summary of case study schemes
Scheme Lead organisation Size Region
A Local authority Medium LASER
B Local authority Large LASER
C Local authority Large LASER
D Local authority Medium CSWE
E Local authority Medium CSWE
F Volunteer-led Small CSWE
G Volunteer-led Small EMNE
H Local authority Medium EMNE
I Local authority Large EMNE
An initial visit was undertaken to each case study area in spring/summer 2014 and then a follow-up visit
was undertaken around one year later in spring/summer 2015. The follow-up visit provided a mechanism
to explore any changes in the delivery approaches taken by schemes over time, whether there had been
any changes around the outcomes and impacts for participants, and to explore further questions around
their sustainability.
In addition to exploring process issues, semi-structured qualitative interviews provided an opportunity to
explore the outcomes and impacts achieved by the programme in more detail, and key mechanisms of
change. Each case study included the following research tasks:
A review of scheme and walker data;
Interview with the scheme coordinator;
Interviews with a sample of walk leaders (and other volunteers if applicable);
Interviews or focus groups with a sample of partners and stakeholders;
Interviews or focus groups with participants (generally across at least two groups per scheme); and
Observation of walks.
1.4.4 Longitudinal surveys of walkers
A key element of the research was three telephone surveys undertaken with new walkers by Ecorys
Survey, Ecorys’ survey division over the period March 2014 to July 2015. These included one baseline
survey and two follow-up surveys, one at four months and a final eight month follow-up. For clarity, the
5 Size is defined in terms of numbers of registered walkers i.e. small – less than 100; medium 100-300; large 300 or
over.
4
surveys are hereafter referred to as Wave 1, Wave 2 and Wave 3 respectively. The questionnaires used
in the surveys are included in Annex One.
The questionnaire was devised with reference to the logic model identifying the principal anticipated
outcomes for the programme. Outcomes were assessed using the following scales:
Physical activity: Impacts on recreational walking and sitting time were considered using questions
from the International Physical Activity Questionnaire (IPAQ)6. Overall physical activity levels were
measured using a modified version of the single item7 that is used in the Walking for Health ‘Outdoor
Health Questionnaire’ (OHQ)8 (that new walkers routinely complete) and that was used in a previous
evaluation of the programme9. Survey respondents were asked to report on the number of days that
they were physically active in the previous week for a period of 30 minutes or more, and at a level
where their breathing rate was raised.
Health: Quality of life and health outcomes for Walking for Health participants were measured by
Euroqual EQ-5D, which measures quality of life in five dimensions and was developed by the
EuroQol Research foundation and used with their permission for this survey. The EQ-5D-5L version
of the instrument was used for this analysis. This instrument consists of two components: a set of five
questions and a visual analogue scale (VAS). Of the five questions, three are regarding the difficulty
participants have in walking, washing or dressing, and doing usual activities (all scored on a five point
scale from ‘no difficulty’ to ‘unable to do activity’), one covers whether participants feel pain or
discomfort according to severity (on a five point scale from ‘no pain or discomfort to ‘extreme pain or
discomfort’) and one concerns feelings of anxiety or depression (again scored on a five point scale
from ‘not anxious or depressed’ to ‘extremely anxious or depressed’). The EQ-5D VAS enables
participants to score on a scale of 1-100 how good or bad they feel their health was on the day the
survey was completed. A value of 100 equates to ‘The best health you can imagine’ whilst 0
corresponds to ‘The worst health you can imagine’. As the Walking for Health Survey was conducted
on the telephone, a modified version of the VAS was used, which is still recognised as a validated
approach, where the scale was described verbally as opposed to the use of a visual ‘thermometer’ for
scoring (by asking participants to rate their health on a scale of 1-100).
Mental wellbeing: The primary change in mental wellbeing was assessed by looking at trends in
scores computed from the Warwick Edinburgh Mental Wellbeing Scale (WEMWBS)10
. The survey of
walkers used 7 items from WEMWBS each with 5 response categories, summed to provide a single
score ranging from 7-35 (and the scores adjusted as per the WEMWBS protocol). The items are all
worded positively and cover both feeling and functioning aspects of mental wellbeing. Higher scores
on WEMWBS indicate better well-being and thus a positive change in scores indicates improved well-
being.
6 Craig C., Marshall A., Sjostrom M., Bauman A.E., Booth M..L, Ainsworth B.E., Pratt M., Ekelund U., Yngve A., Sallis
JF, Oja P (2003), International physical activity questionnaire: 12-country reliability and validity. Med Sci Sports
Exerc. 2003;35:1381–95. 7 The single item measure used in the OHQ is also intended for use as a screening question and not as an outcome
measure in evaluations. The revised version of the single item question was also informed by the following article:
Milton K., Clemes S., Bull F. (2013) Can a single question provide an accurate measure of physical activity? Br J
Sports Med. 2013;47(1):44–8 8 Now referred to as the Walker Registration Form
9 Philips, R., Knox, A. and Langley, E. (2012), What impact did Walking for Health have on the physical activity levels
of participants? Natural England Commissioned Reports, Number 075. 10
Tennant R., Hiller L., Fishwick R., Platt S., Joseph S., Weich S., Parkinson J., Secker J., Stewart-Brown S.
(2007), The Warwick-Edinburgh Mental Well-being Scale (WEMWBS): development and UK validation. Health Qual
Life Outcomes 2007, 5:63.

5
Social interaction, loneliness, and life satisfaction: Social interaction and life satisfaction were
assessed using two items from the European Social Survey 201211
. The former asks how frequently
the respondent has met with friends, colleague and relatives, with six possible options. Overall life
satisfaction is rated on a ten-point scale. Loneliness is assessed by asking the respondent how often
they felt lonely (where 1 is ‘never lonely’, and 4 is ‘often lonely’) and is adapted from a question in the
English Longitudinal Study of Ageing.
Sample and recruitment
New walkers attending their first walk in a select sample of schemes between March 2014 and November
2014 were invited to participate in the Wave 1 survey. The surveys with walkers took place across a
sample of 43 Walking for Health schemes. An initial sampling framework (of 30 schemes) was developed
that supported a mixed purposeful sampling method, aiming to capture typical schemes and maximum
variation across a number of dimensions including: region; lead partner; annual budget; a mix of urban
and rural walks, numbers of regular walkers. However, initial take-up of the survey was lower than
expected. In order to meet a minimum baseline survey target, a number of larger schemes were included
to boost the survey numbers. Within the timeframe of the study, however, it was not possible to reach the
initial baseline target of 1,000 respondents. The implications of the lower baseline sample and statistical
robustness of the follow-up samples are discussed below.
A list of those that had consented to take part at the registration stage was supplied to Ecorys Survey by
the Ramblers. The aim was to contact participants within one week of completing their first walk so that
the responses they gave in the Wave 1 survey were as close to ‘baseline’ levels of activity as possible.
The maximum time allowed for chasing contacts was ten days. Out of 935 eligible participants (new
walkers participating in the sampled schemes agreeing to take part in the survey within the eight month
period), 520 participants12
participated in the Wave 1 telephone survey, 94 refused to take part in the
survey, 123 had wrong or missing numbers and 198 could not be reached within the ten day limit.
As is often the case in studies such as this, which involve a large number of people voluntarily
participating and with follow up over a substantial period of time, a significant degree of follow-up attrition
occurs. Of those 520 individuals who participated in Wave 1, 361 also completed the Wave 2 survey and
232 completed Wave 3 (where the Wave 2 survey was not completed, the individual was not contacted
again for the final Wave 3 follow up). Thus 45% of the Wave 1 sample completed all three surveys. The
rate of attrition through the waves was similar to a previous evaluation of the programme.13
14
11
For details of the survey see: http://www.europeansocialsurvey.org/ 12
It is estimated that the baseline sample is equivalent to 2.6% of the population (i.e. the total number of new walkers
within an eight month period). 13
Philips, R., Knox, A. and Langley, E. (2012), What impact did Walking for Health have on the physical activity
levels of participants? Natural England Commissioned Reports, Number 075. 14
There is no definitive benchmark on what a good rate of attrition should be as this depends on the length of time
between follow-ups, the type of participant etc.

6
Table 1.2 Numbers participating in each wave of the survey
Dates Numbers % of Wave 1
Eligible participants 930 -
Wave 1 March 2014- October 2014 520 -
Wave 2 July 2014 – February 2015 361 69%
Wave 3 October 2014 – June 2015 232 45%
Source: Evaluation surveys
As participants were self-selecting, in order to assess whether they were representative of Walking for
Health participants generally, the sample was compared to all Walking for Health participants recorded on
the database. Table 1.3 shows the characteristics of all those in the survey at Wave 1, compared with
data collected by the Walking for Health programme through the Outdoor Health Questionnaire and
included on the database over the survey period (1st April 2014 – 27
th March 2015), as well as to data
from the 2011 Census. It should be noted that Census data is for all ages and certain characteristics are
affected by age (for example gender). Where census age data is shown below, it is the proportion of
those over 16 only, rather than the whole population. The Wave 1 survey sample generally matched the
characteristics of registered walkers on the Walking for Health database.
Table 1.3 Characteristics of Wave 1 sample compared to the Walking for Health Database and 2011 Census
Characteristic All in Wave 1
(N=520)
Walking for Health Database (April
2014 – March 2015)
2011 Census (N=63.2m)
Females 75% 70% 51%
Aged 65+ (% of over 16s only) 53% 51% 18%
Educated to degree level or higher 26% (Not collected) 27%
White 98% 96% 86%
Source: Wave 1 survey
Walking for Health OHQ responses for the period 1st April 2014 to 30
th September 2014, the period for the
Wave 1 survey, were also examined in order to ensure that this sample was broadly representative in
terms of ‘baseline’ levels of physical activity. This shows that 25.7% of walkers registered with Walking for
Health (sample size, 25,556) were ‘active’ (i.e. engaged in at least 5x30 minutes of moderately physical
activity per week), as opposed to the 20.3% of Wave 1 respondents. While this is not a statistically
significant difference (meaning that it could be due to chance), it is just on the borderline of statistical
significance (p=0.056). The OHQ, it should be noted, takes place on registration rather than after the first
walk (as per Wave 1 survey in this evaluation) and is undertaken by self-completion, rather than by
interview – while these are small differences, they could also mean that the surveys are not directly
comparable.
The analysis of follow-up responses focusses on the individuals who participated in all three waves (the
‘constant sample’). The primary analysis presented in this report uses data presented from the constant
sample whether or not they claimed to still be participating in Walking for Health walks at each follow-up.
This is known as ‘Intention to Treat’ analysis, and is normal practice in public health evaluation.

7
The table below compares some of the main demographic characteristics (as collected in Wave 1) of
those that went on to complete all three Waves of the survey (the constant sample) and those that did
not. While there are minor variations, it can be seen that the composition of the constant sample is similar
to that of those who did not complete all three surveys. The one exception to this is ‘Age’, with a
statistically significant higher proportion of older people (65+) completing all three Waves of the survey.
Table 1.4 Characteristics of those in the constant sample compared to those that were not
Characteristic Wave 1 – not in constant sample
(n=288)
Wave 1 – in constant sample
(n=232)
% Total number responding to
question
% Total number responding to
question
Females 77% 288 72% 232
Aged 65+ 49% 285 58% 231
Educated to degree level or higher
27% 288 24% 232
Non-disabled or with a long-term health condition
15
89% 235 90% 187
White 98% 236 98% 192
Source: Evaluation surveys
Due to the sample sizes, and the number of outcomes being measured, it was not possible to complete
detailed sub-group analysis by particular demographic characteristics and/or target groups. The main
sub-analyses were therefore based on age (65+) – as this was found to be a factor affecting moderate
physical activity in a previous evaluation of the programme16
– and physical activity levels. A key lesson
for future studies is the need for higher samples of participants for each target group (e.g. BME). This
could be achieved by involving a larger number of schemes in the survey.
A further sub-analysis was undertaken for all the main outcomes, comparing those who reported that they
had left the programme at Wave 2, and those who reported they had not. These two groups are referred
to in this report as ‘ceased’ and ‘continued’.17
The characteristics of those who ‘ceased’ participation at
Wave 2 and those that continued are shown in Table 1.5 below. None of the differences in the profile of
these two groups are statistically significant; however the differences between the percentages ‘active’
and percentages ‘inactive’ are close to being statistically significant.
15
Disabled include those with long-term conditions, including cancer 16
Philips, R., Knox, A. and Langley, E. 2012. What impact did Walking for Health have on the physical activity levels
of participants? Natural England Commissioned Reports, Number 075. 17
Included in the ‘ceased’ group were 12 participants that, while stating that they were still in the programme at Wave
2, had not walked in three months and later stated that they were no longer participating at Wave 3.

8
Table 1.5 Characteristics of those that continued at Wave 2 compared to those that did not
Characteristic Ceased participation at Wave 2 Continued participation at Wave 2
% Total number
responding to
question
% Total number
responding to
question
Females 77%
48
70%
184
Aged 65+ 48% 48 61% 184
Educated to degree
level or higher 23% 48 24% 184
Non-disabled 89% 44 87% 149
White 100% 45 97% 184
Active (5 days or more
moderate activity) 11.6% 52 22.7% 180
Inactive (zero days
moderate activity) 38.5% 52 26.1% 180
Source: Evaluation surveys
Assessing the counterfactual
An important element in the construction of any evaluation methodology is an assessment of the
counterfactual i.e. what would have happened in the absence of the intervention. A quasi-experimental
approach involving the use of a matched comparator group is, in principle, a potential option to determine
the impact of the programme. However, the requirement of developing and matching well-defined
variables including demographic characteristics and pre-existing levels of physical activity would be costly
to implement in practice. The difficulty of controlling for unobserved variables would also remain, including
motivations to take part in physical activity. In light of these challenges, and within the resources available
for this evaluation, it was not considered feasible to include a comparator group in the assessment.
It was agreed, therefore, that the research would focus on a longitudinal design with the Wave 1 results
effectively acting as the counterfactual reference point in this instance. The longitudinal surveys allow for
before-during-after comparisons of outcomes relating to physical activity, mental well-being and social
inclusion. In order to provide an additional layer of analysis on the influence of the Walking for Health
programme on positive outcomes, impact attribution questions for those who maintained or increased
levels of walking and physical activity were included in the follow up surveys. These questions help to
determine how far increases in walking activity would have occurred in the absence of the Walking for
Health programme.
It is important to note that Wave 1 data was collected after the first Walking for Health session, rather
than prior to it. This was necessitated by the nature of programme activity as this usually involves new
participants turning up to a session and registering on the day, rather than pre-booking or registering. An
additional questionnaire was suggested for self-completion by all new Walking for Health participants
immediately prior to their first walk, but it was considered that this would be overly-burdensome for new
walkers. The implication is that any changes in outcomes which may arise as a result of participating in
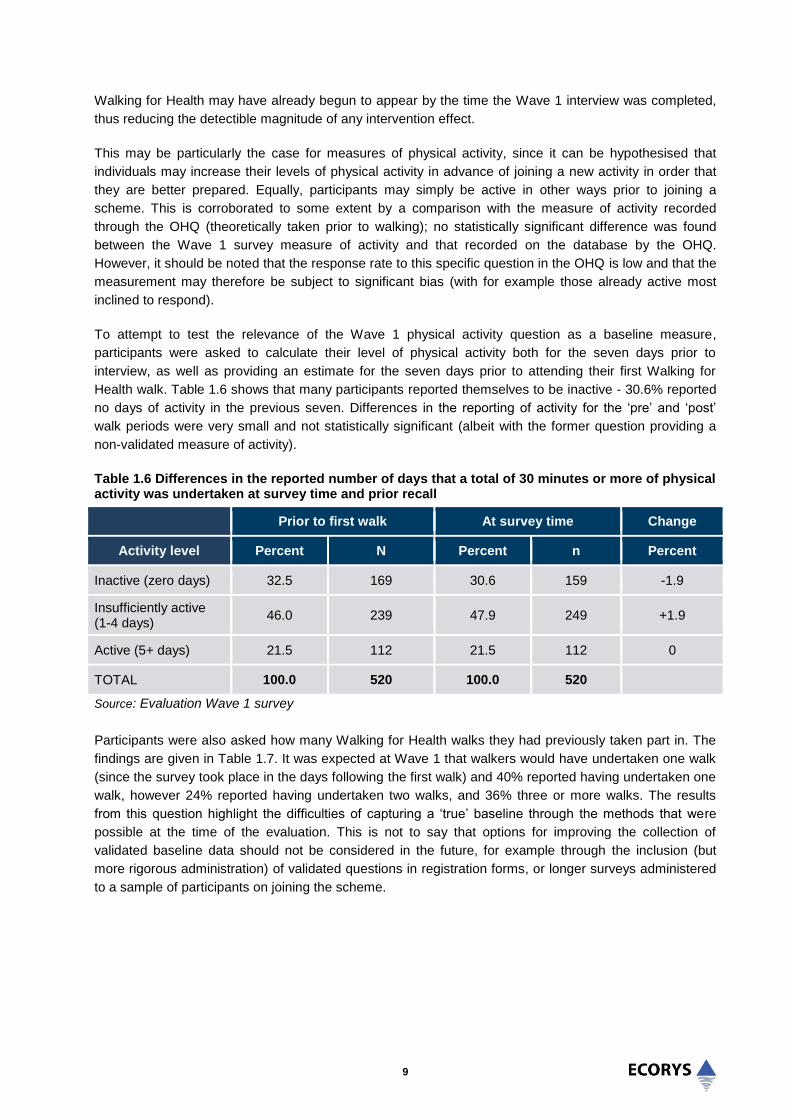
9
Walking for Health may have already begun to appear by the time the Wave 1 interview was completed,
thus reducing the detectible magnitude of any intervention effect.
This may be particularly the case for measures of physical activity, since it can be hypothesised that
individuals may increase their levels of physical activity in advance of joining a new activity in order that
they are better prepared. Equally, participants may simply be active in other ways prior to joining a
scheme. This is corroborated to some extent by a comparison with the measure of activity recorded
through the OHQ (theoretically taken prior to walking); no statistically significant difference was found
between the Wave 1 survey measure of activity and that recorded on the database by the OHQ.
However, it should be noted that the response rate to this specific question in the OHQ is low and that the
measurement may therefore be subject to significant bias (with for example those already active most
inclined to respond).
To attempt to test the relevance of the Wave 1 physical activity question as a baseline measure,
participants were asked to calculate their level of physical activity both for the seven days prior to
interview, as well as providing an estimate for the seven days prior to attending their first Walking for
Health walk. Table 1.6 shows that many participants reported themselves to be inactive - 30.6% reported
no days of activity in the previous seven. Differences in the reporting of activity for the ‘pre’ and ‘post’
walk periods were very small and not statistically significant (albeit with the former question providing a
non-validated measure of activity).
Table 1.6 Differences in the reported number of days that a total of 30 minutes or more of physical activity was undertaken at survey time and prior recall
Prior to first walk At survey time Change
Activity level Percent N Percent n Percent
Inactive (zero days) 32.5 169 30.6 159 -1.9
Insufficiently active (1-4 days)
46.0 239 47.9 249 +1.9
Active (5+ days) 21.5 112 21.5 112 0
TOTAL 100.0 520 100.0 520
Source: Evaluation Wave 1 survey
Participants were also asked how many Walking for Health walks they had previously taken part in. The
findings are given in Table 1.7. It was expected at Wave 1 that walkers would have undertaken one walk
(since the survey took place in the days following the first walk) and 40% reported having undertaken one
walk, however 24% reported having undertaken two walks, and 36% three or more walks. The results
from this question highlight the difficulties of capturing a ‘true’ baseline through the methods that were
possible at the time of the evaluation. This is not to say that options for improving the collection of
validated baseline data should not be considered in the future, for example through the inclusion (but
more rigorous administration) of validated questions in registration forms, or longer surveys administered
to a sample of participants on joining the scheme.
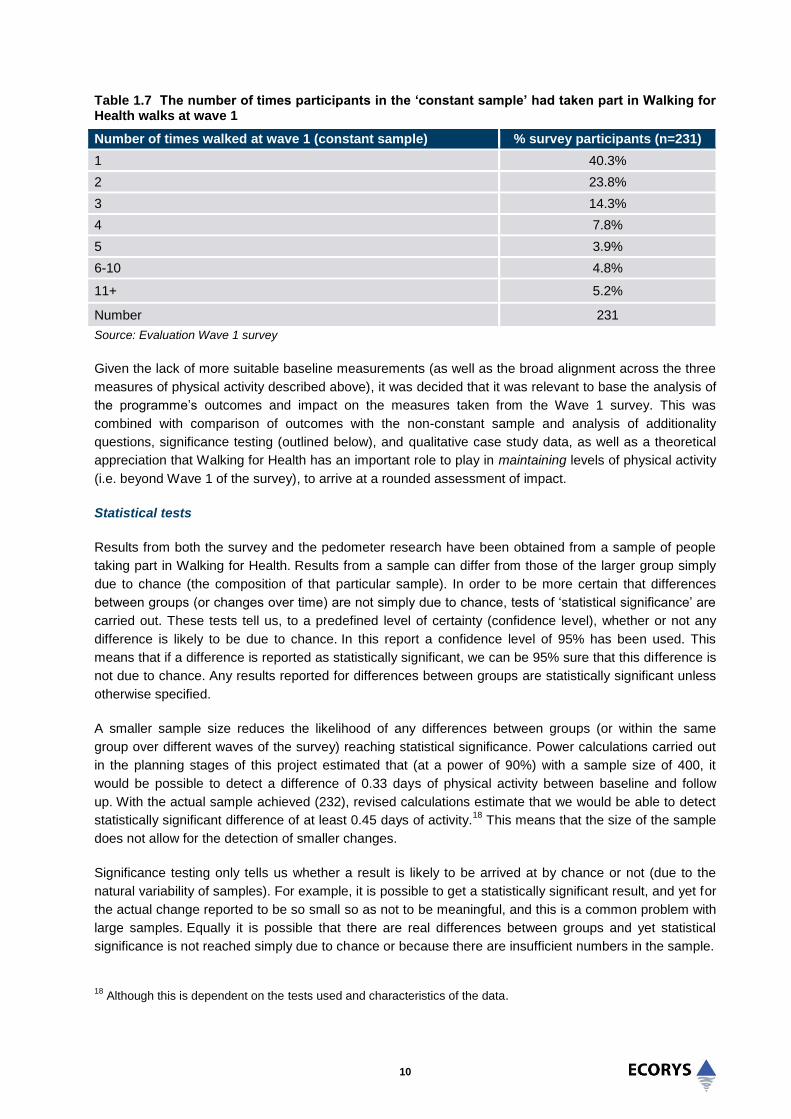
10
Table 1.7 The number of times participants in the ‘constant sample’ had taken part in Walking for Health walks at wave 1
Number of times walked at wave 1 (constant sample) % survey participants (n=231)
1 40.3%
2 23.8%
3 14.3%
4 7.8%
5 3.9%
6-10 4.8%
11+ 5.2%
Number 231
Source: Evaluation Wave 1 survey
Given the lack of more suitable baseline measurements (as well as the broad alignment across the three
measures of physical activity described above), it was decided that it was relevant to base the analysis of
the programme’s outcomes and impact on the measures taken from the Wave 1 survey. This was
combined with comparison of outcomes with the non-constant sample and analysis of additionality
questions, significance testing (outlined below), and qualitative case study data, as well as a theoretical
appreciation that Walking for Health has an important role to play in maintaining levels of physical activity
(i.e. beyond Wave 1 of the survey), to arrive at a rounded assessment of impact.
Statistical tests
Results from both the survey and the pedometer research have been obtained from a sample of people
taking part in Walking for Health. Results from a sample can differ from those of the larger group simply
due to chance (the composition of that particular sample). In order to be more certain that differences
between groups (or changes over time) are not simply due to chance, tests of ‘statistical significance’ are
carried out. These tests tell us, to a predefined level of certainty (confidence level), whether or not any
difference is likely to be due to chance. In this report a confidence level of 95% has been used. This
means that if a difference is reported as statistically significant, we can be 95% sure that this difference is
not due to chance. Any results reported for differences between groups are statistically significant unless
otherwise specified.
A smaller sample size reduces the likelihood of any differences between groups (or within the same
group over different waves of the survey) reaching statistical significance. Power calculations carried out
in the planning stages of this project estimated that (at a power of 90%) with a sample size of 400, it
would be possible to detect a difference of 0.33 days of physical activity between baseline and follow
up. With the actual sample achieved (232), revised calculations estimate that we would be able to detect
statistically significant difference of at least 0.45 days of activity.18
This means that the size of the sample
does not allow for the detection of smaller changes.
Significance testing only tells us whether a result is likely to be arrived at by chance or not (due to the
natural variability of samples). For example, it is possible to get a statistically significant result, and yet for
the actual change reported to be so small so as not to be meaningful, and this is a common problem with
large samples. Equally it is possible that there are real differences between groups and yet statistical
significance is not reached simply due to chance or because there are insufficient numbers in the sample.
18
Although this is dependent on the tests used and characteristics of the data.

11
Where using statistics to describe those in a sample (for example, the percentage of physically inactive
participants), it is helpful to know how accurately the figure describes the larger group. A confidence
interval around a result from a sample gives the range in which the result for the larger group is likely to
lie. This is to a predefined level of confidence: 95% in this report. Many of the column charts in this
document have ‘error bars’, and these show the confidence interval for the result in each column.
1.4.5 Pedometer research
Pedometer research was undertaken in order to provide an objective measure of physical activity
trajectories amongst newly recruited Walking for Health participants. The purpose of the pedometer
survey was not however to ‘re-validate’ the results from IPAQ (i.e. to compare on an individual basis the
steps counted from the pedometer with the self-reports of physical activity from IPAQ) but rather to
provide an alternative measure of change in activity.
In total 186 pedometers were sent out by the team at UEA at baseline. Of these, 34 were sent to two
larger schemes - 17 (9%) were sent to Scheme A and 17 (9%) were sent to Scheme B to distribute to the
participating walkers and 152 (82%) were sent directly to walkers after their participation in the telephone
survey. At baseline, 102 pedometers were returned with useable data; 55% of those sent out. Twelve
(12%) of the 102 pedometers worn at baseline were from Scheme A and the remaining 90 (88%) came
direct from walkers.
Eighty four of the pedometers sent out at baseline were not returned worn (45% of those sent out).
Seventeen of the unworn pedometers came from Scheme B (20%), 5 came from Scheme A (6%) and the
remaining 62 (74%) were those sent direct to walkers. Fifty (60%) of the unworn pedometers at baseline
were returned with a note stating that the walker had decided they did not wish to participate in the study
anymore or with no evidence that the device had been worn. The remaining 34 (40%) were returned over
one week after they were worn, meaning they no-longer contained data for the wear period.
All 102 participants providing baseline data were sent a pedometer to re-wear at 4 months along with a
reminder of the wear instructions. Of these, pedometers were returned having been worn by 73
participants (72% of the baseline sample). Of the 29 baseline participants who did not wear the
pedometer at follow up, 13 (45%) returned the device with no evidence of wear or with a note to say the
no-longer wished to take part in the study, 6 (21%) returned the device too late to use any data originally
recorded, and 10 (34%) retained the device despite being re-contacted and asked to return it.
In terms of the limitations of this methodology, our initial focus for the pedometer study was to provide
new walkers with devices at their initial walk via walk leaders in two schemes. However response rates
were lower than expected. If this method of recruiting participants is considered in future, the importance
of the host organisation in supporting and encouraging walk leaders in engaging with the process should
be recognised (and possibly also addressed in initial training). When we mailed pedometers direct to
walkers, levels of compliance were much better and were comparable to what we would expect, with
most walkers providing good data. We used a standard protocol which incorporated reminders and
provided all wearers with contact details of a researcher if they needed any help or advice. One limitation
of any pedometer study however is that the pedometer can act as an intervention in itself and wearers
increase their physical activity because they know they are wearing a device that measures it.19
In this
19
Clemes, S. A., & Deans, N. K. (2012), Presence and duration of reactivity to pedometers in adults, Medicine and
Science in Sports and Exercise, 44(6), 1097–101. doi:10.1249/MSS.0b013e318242a377

12
case however all pedometers were sealed before being given out and did not provide the user with any
visual feedback. This protocol has been shown in other studies to limit this reactivity.20
Further information on the methodology used for recruiting people for the pedometer research is provided
in Annex Two.
1.4.6 Stakeholder interviews and workshop
The evaluation also draws on responses from 12 stakeholders consulted as part of the evaluation
including four representatives of Macmillan and the Ramblers and eight external stakeholders. The
external stakeholders were drawn from national public health bodies and charities working in the health
field, through to stakeholders working in local authorities including public health teams as commissioners
and developers of health improvement programmes. Key topics addressed in the stakeholder
consultations included the effectiveness of the Ramblers and Macmillan partnership, programme
branding, improving Walking for Health’s profile and sustainability of local schemes.
A workshop was also held with the Walking for Health Management Team in November 2014 focusing on
the effectiveness of the national team’s guidance and support function. Annex one includes the
stakeholder topic guides. Annex two provides a full list of stakeholders consulted for the study.
1.4.7 Economic analysis
In order to evaluate the Walking for Health programme in terms of cost-utility analysis and return on
investment, evaluation data was inputted into the MOVES model21
. The results compare the estimated
costs and outcomes associated with participating in Walking for Health with those of a similar cohort of
the population not participating in the programme. It is important to note that user numbers, frequency
and duration of walks and retention of participants are the main variables inputted into the model. The
impact analysis using the MOVES model therefore represents a conservative estimate based upon the
time spent walking due to the programme (rather than accounting for any Walking for Health impacts on
physical activity outside of the scheme). Conversely, the MOVES model assumes that participation in the
inputted activity is additional to what would have happened in the absence of the programme or project.
Whilst it is impossible to determine the counterfactual with any certainty without a control group (as
outlined above), we include a number of sensitivity tests within our analysis including factoring in
deadweight (based upon the survey data) as well as different time horizons for participation.
1.5 Summary of methodological limitations and lessons
The earlier sections highlighted the challenges associated with the methodology; principally that the
evaluation did not have a control group, and that validated measures of physical activity and of health and
wellbeing were not available from a robust sample of participants from prior to their first walk.
20
Clemes S., Matchett N., Wane S., (2008), Reactivity: An issue for short-term pedometer studies? British Journal of
Sports Medicine 42(1) P. 68-70 21
MOVES was developed by the University of East Anglia’s Medical School specifically for Sport England to help to
demonstrate the economic benefits of participating in sport and wider physical activity. It is intended for use by those
commissioning these types of activities.
13
The former issue was addressed within the methodology by employing the next best available evaluation
design, a longitudinal study based upon follow-up measurements at two points in time22
. We also
undertook a comparison of outcomes with the non-constant sample (those who ceased to participate at
Wave 2), analysis of additionality questions (to examine the perceived influence of the programme on
participation) and significance testing. The survey data is also corroborated by qualitative data gathered
from in-depth case studies, which were partly designed to test the theory of change that Walking for
Health has an important role to play in maintaining levels of physical activity. Using a combination of
approaches to assess the programme’s additionality has helped to ensure a more robust and defensible
evaluation approach, within the confines of the resource available.
The lack of robust pre-intervention baseline data should be considered a limitation of the study (and one
which was not anticipated at the outset). The outcome and impact analysis is therefore focused on an
assessment of changes in physical activity and wellbeing during participation in Walking for Health, with
the working hypothesis that improvements would either accumulate over time, or else be effectively
sustained through ongoing engagement in the programme (i.e. with no dip below Wave 1 outcome levels
amongst the cohort of respondents at Wave 3). This reflects the main aim of Walking for Health to help
sustain people’s engagement in moderate level physical activity. Aside from this response, the evaluation
has also raised the question of whether a true baseline can ever be measured completely accurately in a
before-and-after study of this type of intervention, given that some participants may increase levels of
physical activity in preparation for their first walk.
1.6 Report structure
The report is structured as follows:
Chapter 2 introduces the Walking for Health programme, including its context and rationale and
outlines the main aims and objectives, activities, expected outcomes and impacts.
Chapter 3 provides a contextual analysis of the Walking for Health programme’s activities and
outputs.
Chapter 4 focuses on the outcomes and impacts of Walking for Health from the perspective of
walkers, volunteers and stakeholders.
Chapter 5 reports on the analysis of the cost-effectiveness of the programme.
Chapter 6 provides further consideration and analysis of factors in delivery that contribute to the
specific outcomes and cost-effectiveness reported.
Chapter 7 brings the research findings together to report on the key findings and learning points.
Annexes 1-4 include the research tools, further information on the research methodologies and lists
of consultees and references.
22
This in itself was considered by National Institute for Health and Care Excellence to represent an improvement
over the majority of comparable programme evaluations which have only a single or no follow-up survey point.

14
2.0 Understanding Walking for Health
2.1 Introduction
This chapter provides an introduction to the Walking for Health programme, including its evolution over
time, context and rationale. It then outlines the aims, inputs, activities, and expected outcomes and
impacts of the programme, as well as the set of objectives and principles which guide delivery. Based on
this, a logic model was developed to inform the evaluation, and is presented here. The information in this
chapter is based on a review of existing programme documentation. It also draws on policy documents,
academic literature and existing research and evaluations conducted on Walking for Health.23
The
overview of the role of the national Walking for Health team also draws on the workshop held with the
national team in November 2014.
2.2 Programme evolution
2.2.1 History
Walking for Health originated as an initiative by Dr William Bird, a Berkshire based GP, who started to
lead health walks from his surgery in 1996 at a time when walking was not regarded “serious exercise”24
.
In 2000, Walking for Health was rolled out as a national programme under the management of the
Countryside Commission (later the Countryside Agency) in partnership with the British Heart Foundation
(BHF).The Countryside Agency was merged into Natural England in 2006. Until 2005, the programme
supported 205 schemes in areas with high health need25
. By the time of a 2012 audit, which was
completed for the Walking for Health national team, there were 70,000 regular walkers across 600
schemes.
From the outset, Walking for Health was delivered locally, with inputs from local authorities, primary care
trusts and voluntary agencies as well as groups of volunteers. The Walking for Health National Centre
(now known as the Walking for Health national programme team) provide support, advice, training,
promotion and insurance and is responsible for the monitoring and evaluation of the scheme.
2.2.2 Involvement of the Ramblers and Macmillan
Following a change in central policy in 2010, the Government decided to divest (or dispose of) Walking
for Health to the charitable sector. Following a competitive process the Ramblers became the new host of
Walking for Health from April 2012, entering an initial three year partnership with Macmillan Cancer
Support which was subsequently extended to run to at least March 31st 2018.
In this partnership Macmillan provides the majority of funding (£4.5m 2012-18) and their expertise,
including encouraging greater activity among those affected by cancer. The Ramblers is primarily
responsible for managing the national programme team, building on its experience as Britain’s walking
charity.
23
A full list is provided in Annex four.
24 Villalba Van Dijk, L., Cacace, M., Nolte, E., Sach, T., Fordham, R. & Suhrcke, M. (2012), Costing the Walking for
Health programme, Natural England Commissioned Reports, Number 099: foreword 25
Ibid
15
Since the new partnership was established, the Ramblers and Macmillan established a new vision to
return Walking for Health back to its original aim of encouraging activity by the most inactive people or
people who need support to stay active, including those with long term health conditions. To support this,
a new brand and national website was introduced, accreditation requirements were revised to better
support consistency in the quality of local delivery, cascade and walk leader training updated and a
quality assurance process introduced to ensure a consistent high level of competency among leaders. A
communications marketing strategy was also launched, which included a health and social care
engagement plan. It is important to note that the evaluation was conducted while changes to the
composition of the schemes, through the accreditation process, and new marketing and promotion
initiatives were being implemented. The impacts of some of these changes are shown by the case study
analysis; however, given the timing of the evaluation’s survey, it has not been possible for the survey
analysis to address the impact of these changes on walking activity.
2.3 Context and rationale
2.3.1 Impacts of physical activity on health and well being
The current physical activity guidelines for the UK, as laid out in the Chief Medical Officer’s guidelines,
advocate moderate physical activity for at least 150 minutes per week.26
However, survey evidence has
shown that around one in two women and a third of men in England are damaging their health through a
lack of physical activity, costing the UK an estimated £7.4bn a year.27
Increasing physical activity could
significantly reduce the individual risk of certain health conditions, such as coronary heart disease, type 2
diabetes, different types of cancer and depression28
. More generally participation in physical activity leads
to greater muscle, bone and immune system health.29
What is more, evidence suggests that it is
especially beneficial for people living with cancer and long-term health conditions30
. Physical activity after
treatment for cancer can reduce the impact of some debilitating side effects, such as swelling around the
arm, anxiety, depression, fatigue, impaired mobility and weight changes.31
A systematic review of
evidence on the importance of physical activity for people living with and beyond cancer evidence shows
that achieving sufficient activity levels can reduce the risk of dying from breast, bowel and prostate
cancer, and reduce the recurrence of breast and bowel cancer.32
As a consequence, increased physical
activity levels could also reduce the economic burden associated with poor health outcomes.33
26
Chief Medical Officers (2011), Start active, stay active: a report on physical activity for health from the four home
countries’ 27
Public Health England (2014), Everybody active, every day: an evidence-based approach to physical activity. 28
Department of Health (2011), Start active, stay active: a report on physical activity from the four home countries’
Chief Medical Officers 29
Department of Health (2011), Start active, stay active: a report on physical activity from the four home countries’
Chief Medical Officers 30
Walking for Health (2013), The case for Walking for Health: a briefing for Scheme Coordinators, February 2013 31
Macmillan Cancer Support (2011), The importance of physical activity for people living with and beyond cancer: A
concise evidence review 32
Macmillan Cancer Support (2011), The importance of physical activity for people living with and beyond cancer: A
concise evidence review 33
Public Health England (2014), Everybody active, every day: an evidence-based approach to physical activity.

16
There is also a growing body of evidence, which suggests that increases in physical activity promotes
mental health and wellbeing. It improves self-perception and self-esteem, mood and sleep quality, and it
reduces stress, anxiety and fatigue34
. In older people, staying active can improve cognitive function,
memory, attention and processing speed, and reduce the risk of cognitive decline and dementia.35
The Marmot Review highlighted the importance of physical activity in addressing health inequalities and
deprivation.36
Statistics presented in the Walking Works report37
showed that people on low incomes are
less physically active. Around 45% of adults in the lowest income households are active for less than 30
minutes a week38
. The report also demonstrated that certain ethnic groups are less physically active. In
2004, Indian, Pakistani, Bangladeshi and Chinese people in England reported lower than average levels
of physical activity, with 51% of Bangladeshi men and 68% of Bangladeshi women active for less than
half an hour a week.39
2.3.2 The role of walking
Walking at a pace of 5km/hour expends sufficient energy to be classified as a moderate intensity physical
activity40
. In this context, Walking for Health offers low-barrier access to moderate physical activity. It aims
to be an inclusive scheme with the potential to increase the activity levels of a large number of people
nation-wide, due to the fact that it is free to take part, participants do not need any special equipment and
walking is a manageable activity for people of different capability levels41
. A hypothesis which has been
examined through the evaluation is how far Walking for Health walks are suited to introducing people who
are inactive to start or increase their levels of physical activity – “stepping up” – or to supporting others to
remain active when health problems occur – “stepping down”.42
Three systematic reviews support the
view that walking delivers real health benefits, and that walking groups in particular can increase physical
activity levels. A large-scale study summarising the findings of 19 studies on the effect of walking groups
finds that they are an effective way to increase physical activity levels43
. This is supported by research
that finds that the most successful walking interventions can increase physical activity (walking) by 30-60
minutes per day44
. In addition to increasing physical activity levels, walking has also been found to have
direct mental health effects, such as positive effects on the symptoms of depression for some groups45
.
34
McAuley E., Elavsky S., Motl R.W., Konopack J.F., Hu L., Marquez D.X. (2005), Physical activity, self-efficacy, and
self-esteem: longitudinal relationships in older adults. J Gerontol B Psychol Sci Soc Sci, 60:268–275 35
British Heart Foundation (2013), National Centre Physical Activity and Health. Making the Case for Physical
Activity 36
The Marmot Review (2010), Fair Society Healthy Lives 37
The Ramblers and Macmillan (2013) , Walking Works: Making the case to encourage uptake of walking as a
physical activity and recognise the value and benefits of Walking for Health 38
Townsend N., Bhatnagar P., Wickramasinghe K, Scarborough P, Foster C, Rayner M. (2012), Physical Activity
Statistics 39
Joint Health Surveys Unit (2008), Health Survey for England 2008: Physical Activity and Fitness 40
Department of Health (2011), Start active, stay active: a report on physical activity from the four home countries’
Chief Medical Officers 41
Walking for Health (2013), The case for Walking for Health: a briefing for Scheme Coordinators, February 2013 42
The Ramblers (2013), Walking works Making the case to encourage greater uptake of walking as a physical
activity and recognise the value and benefits of Walking for Health 43
Kassavou, A., Turner, A., French, D.P., (2013), Do interventions to promote walking in groups increase physical
activity? A meta-analysis. International Journal of Behavioural Nutrition & Physical Activity, 10, 18 44
Ogilvie, D., Foster, C., Rothnie, H. (2007), Interventions to promote walking: systematic review, BMJ, 334, 1204 -
1207 45
Robertson, R., Robertson, A., Jepson, R., Maxwell, M. (2012), Walking for depression or depressive symptoms: A
systematic review and meta-analysis. Mental Health and Physical Activity, 5, 66-75
17
A particular focus of Walking for Health is engaging those with long-term health conditions, including
cancer. The rationale that walking is particularly beneficial for this group is supported by evidence that
physical activity can reduce fatigue during and after cancer treatment46
and has a positive impact on
overall quality of life47
.
A further part of the unique potential benefits from the Walking for Health programme arise from the fact
that walks in many areas are in outdoor ‘green’ environments. These places are important because of
their multifaceted potential to influence health.48
In addition to serving as a venue for physical activity, a
substantial body of literature documents wider benefits of experiencing ‘green’ environments. The seminal
research by Kaplan and Talbot49
in the 1980s outlined the psychological benefits of experiencing nature.
More recent research has shown that time spent in natural environments is associated with reduced
negative emotions and better energy levels, attention span and feelings of tranquillity compared with
being in synthetic settings50
, as well as the promotion of social cohesion by providing areas for people to
meet and participate in group activities51
.
External stakeholders interviewed for this evaluation consistently agreed that walking was beneficial for
increasing people’s activity levels and improving wellbeing, and particularly as a first step into exercise
through providing a low level activity to participate in. Overall external stakeholders felt the case for
walking compared to other activities was gradually improving because of the increasing awareness of the
health benefits of walking. External stakeholders commented that walking may be preferable exercise for
some people, as gyms could appear intimidating for older people and people with a range of health
conditions who have lost confidence:
“The confidence of walking in a group with a leader, even if they are a volunteer they will have
gone through some kind of training, I think that would be much more encouraging for some
people than going to an intimidating gym.”
(national health body stakeholder)
A number of stakeholders (both internal and external) commented that health professionals are
increasingly valuing exercise and good nutrition, and starting to prescribe these approaches.
Stakeholders generally agreed that there is potential for Walking for Health to increase the number of
people who are signposted to walking by GPs and other health professionals by the developing the
programme as a defined exercise that meets social prescribing criteria and raising awareness amongst
the community of health professionals.
46
Cramp, F., Byron-Daniel, J. (2012), Exercise for the management of cancer-related fatigue in adults. status and
date: New search for studies and content updated (conclusions changed), published in Cochrane Database of
Systematic Reviews, 11 (131) 47
Mishra, S.I., Scherer, R. W., Snyder, C., Geigle, P. M., Berlanstein, D. R., Topaloglu, O. (2012), Exercise
interventions on health‐related quality of life for people with cancer during active treatment, The Cochrane Library 48
Faculty of Public Health (2010), Great Outdoors: How Our Natural Health Service Uses Green Space To Improve
Wellbeing Briefing Statement: Briefing Statement 49
Kaplan, S., & Talbot, J. F. (1983), Psychological benefits of a wilderness experience. Behavior and the Natural
Environment, 6, 163-203 50
Bowler, D., Buyung-Ali, L., Knight, T., & Pullin, A. (2010), A systematic review of evidence for the added benefits to
health of exposure to natural environments. BMC Public Health, 10(1), 456 51
Maas, J., van Dillen, S. M., Verheij, R. A., & Groenewegen, P. P. (2008), Social contacts as a possible mechanism
behind the relation between green space and health, Health and Place, 5(2):586-9

18
2.3.3 Recent policy developments
The Health and Social Care Act 2012 (“the Act”) received Royal Assent on 27 March 2012. The Act gives
a key new public heath duty to upper tier and unitary local authorities to take appropriate steps to improve
the health of their population. The Act also established health and wellbeing boards as a forum where key
leaders from the health and care system work together to improve the health and wellbeing of their local
population and reduce health inequalities. The boards are tasked with working together with Clinical
Commissioning Groups and councils to develop a shared understanding of the health and wellbeing
needs of the community. Health and wellbeing board members will collaborate to understand their local
community's needs, agree priorities and encourage commissioners to work in a more joined-up way. As a
result, patients and the public should experience more joined-up services from the NHS and local
councils in the future. In the context of these changes this evaluation examines levels of engagement
between Walking for Health schemes and the new local governance structures for public health.
Based on research undertaken by UK Active52
, the National Institute for Health and Care Excellence
(NICE) has called on local government to use its new responsibilities more effectively to boost physical
activity. The research found that on average, local authorities were found to have spent 2.4% of their
health budgets on tackling inactivity in 2013/14, compared with 38% on sexual health services, 12%
alcohol misuse services and 4 % on adult obesity.53
The new responsibilities for local authorities is an
important consideration for this evaluation as local authorities make a key contribution to leading and
funding Walking for Health schemes. The evaluation has therefore investigated how far local authorities
and health and wellbeing boards prioritise Walking for Health as a mechanism for improving levels of
physical activity.
2.4 Programme aims and objectives, inputs and activities
2.4.1 Aims and objectives
The vision for the programme, as outlined in the Walking for Health Business Plan 201354
, is as follows:
“Everyone will have access to a short, free and friendly health walk within easy reach of where
they live to help them become more active and stay active. People will enjoy an experience that
Macmillan and the Ramblers have enabled, and they will be inspired to give something back.”
The Ramblers and Macmillan’s aim55
for Walking for Health is as follows:
“Our aim is to manage the national and regional functions of Walking for Health via the national
programme team based at the Ramblers with support from Macmillan. The national programme
team will work to improve the quality of support provided to schemes, the customer experience,
scheme coverage, sustainability and, ultimately, through the indirect delivery model, enable more
people to walk more often. These services will be provided free of charge to all schemes.”
52
UKActive (2014), Turning the Tide of Inactivity 53
UKActive (2014), Turning the Tide of Inactivity 54
Ramblers, Walking for Health: Business Plan 2013: p. 2 55
Ibid.

19
Furthermore, the Ramblers and Macmillan set nine specific objectives for Walking for Health, which cover
key output, outcome and process aspects of the scheme. Since these underpin the effective delivery of
the programme, they are revisited at various points throughout the evaluation report, as a means of
explaining why the inputs and activities outlined in the logic model (see Figure 2.4) have translated into
outputs and outcomes (or otherwise), and to help further judge the success of the scheme. The nine
objectives are as follows56
:
To increase the availability of and participation in Walking for Health so that people who are currently
inactive, or who need support to remain active, are encouraged to walk to improve their health and
wellbeing. The programme will particularly aim to reach those that need the most support, including
people affected by cancer and other long-term health conditions, and those from recognised health
inequality groups such as older adults, BME communities and people on lower incomes.
To ensure walks are free, short and easy, and open to all.
To support local schemes to recruit and retain a sufficient pool of volunteers and ensure that those
volunteers are well supported through training and resources.
To raise awareness of the value of Walking for Health among health and social care professionals
and encourage them to signpost patients to Walking for Health.
To ensure financial sustainability of Walking for Health schemes, and support existing and new
schemes to secure additional funding.
To develop evidence on the beneficial impact of led walks and the effectiveness of Walking for
Health.
To ensure that Walking for Health is well-managed and local schemes are fully accredited, and
meeting the required quality standards.
2.4.2 Inputs
National inputs
Walking for Health has funding at the national programme level from the Ramblers and Macmillan, which
supports delivery across the whole of England. This includes funding for direct staff costs for the national
programme team and additional costs for support activities such as the website, marketing, merchandise,
training, insurance, and a database for monitoring and evaluation. The overall budget for the Walking for
Health team from April 2012 to March 2015 was £1.89m. On top of this, the Ramblers made in-kind
contributions of office space and ‘back-office’ functions, and Macmillan provided additional budget for the
evaluation and targeted marketing. Both organisations make use of staff resources and expertise beyond
the national programme team. With these additional contributions taken into account, the total costs to
Macmillan and the Ramblers of managing the Walking for Health programme from 2012-15 are estimated
at £2.75m.
Local inputs
Walking for Health schemes are funded and delivered at a local level. Each scheme has a scheme
coordinator who oversees and develops the scheme, supported by a number of volunteers including walk
leaders and cascade trainers.
56
Walking for Health Business Plan 2013

20
Many Walking for Health schemes are funded directly at a local level, with the funding supporting scheme
coordinator posts, volunteer management and equipment. However the schemes vary a great deal in how
they are funded and managed, including schemes that are entirely run by volunteer coordinators, and
include a range of funding sources particularly local authorities such as the NHS and charitable funds.
Funding arrangements and budget amounts at the local level are explored further in section 3.1.
Critically, Walking for Health schemes also benefit significantly from ‘in-kind’ resources; in the most part
this takes the form of volunteer time. The Walking for Health programme is based on a volunteer walk
leader model, with volunteers generally providing the majority of time required to deliver the programme.
Other volunteers include walk assistants and volunteers in administration/data entry roles, promotional
and other roles.
2.4.3 Activities delivered by the national programme team
The programme objectives are supported by a range of activities undertaken by the Walking for Health
national team. These include programme management; branding, communication and marketing; scheme
accreditation; developing pilot projects and working closely with schemes to pioneer and roll out best
practice, training and volunteer development; supporting resources; networking events and workshops;
monitoring and evaluation; advocacy, in particular with health and social care professionals; and
migrating walkers to other Ramblers and Macmillan activities.
The process of accreditation has been a key focus of the national team since 2012, when it was re-
introduced by the Ramblers and Macmillan. The key objective of accreditation is to give walkers and
partners added confidence in their local schemes. It acts as a quality assurance mark, promoting a
common standard, and aims to strengthen the profile of Walking for Health and inspire the support of
funders, partners, volunteers and walkers. The theory underpinning the accreditation process is that a
common approach is crucial in helping Walking for Health to thrive and grow as a health-based activity.
There were eight requirements which schemes must meet to achieve the new accreditation standard, as
outlined in the box below:
Accreditation requirements
1. All walks run by the scheme meet the definition of a Walking for Health walk i.e. at least one walk
between 10-30 minutes per month; no longer than 90 minutes; and walking at a moderate pace that
makes walkers feel warmer, breathe harder and their heart beat faster whilst still being able to talk to
others around them.
2. The walker registration form (currently known as the Outdoor Health Questionnaire) or a version of
the form that has been approved by the Walking for Health team must be used and completed by all
new walkers or walkers who have experienced changes to their health.
3. Schemes must have up to date risk assessments in place.
4. Schemes must use the Walking for Health database or be able to supply the management
information that is needed by the Walking for Health team to demonstrate our impact and progress
on a quarterly basis
5. Schemes must use the Walking for Health brand in accordance with the brand guidelines.
6. Schemes need to keep their pages on the Walking for Health website up to date.
7. Schemes must complete the annual scheme audit.
8. Schemes should adopt a volunteering policy that ensures good standards of volunteer management.

21
A key change within the new accreditation process is that previously schemes were only required to offer
at least one health walk every month that was suitable for beginners (by which is meant a flat walk of
under one hour’s duration with no stiles). The Ramblers and Macmillan also made accreditation
compulsory. For some schemes this meant a significant change in requirements, and it has resulted in a
fall in the number of recognised Walking for Health schemes as a short-term trade-off from the
accreditation process, as discussed in section 3.3.
2.5 Expected outputs and outcomes
The inputs, activities and outputs described above for Walking for Health are then expected to generate a
number of important benefits to participants, volunteers and stakeholders, as follows:
Participants: As the focal point of Walking for Health activity, participants are expected to experience
improved outcomes by attending regular group walks with a Walking for Health scheme. The most
direct outcome of their participation is maintaining, or in some cases increasing (depending on
whether participants ‘step up’ or ‘step down’), physical activity through the health walks, but also
potentially in other activities as well. As the review of evidence outlined earlier indicates, this may
lead to improved physical health and mental-emotional well-being, e.g. improved self-image and
anxiety. The latter is also promoted by the social character of the health walks, which is reported to
lead to improved social networks and decreased social isolation. This is particularly relevant to health
walks where participants tend to be older and/or with some disabilities and may therefore be more
prone to social isolation. One of the target groups of Walking for Health is individuals living with
cancer and long-term health conditions. There is evidence that physical activity not only reduces the
risk of developing cancer but can also improve prognosis for those who have the disease57
.
Volunteers: When volunteers participate in the health walks, they also profit from the health and
social benefits of walking (as outlined above). Additionally, it can be expected that they improve their
leadership, people management and other soft skills through the provided training and ‘on-the-job
experience’. Moreover, volunteers may experience great satisfaction and enjoyment through their
volunteering activity58
.
Stakeholders: Stakeholders, including the Ramblers and Macmillan, plus others such as local
authorities and the NHS can also expect positive outcomes through the walking scheme. Local health
and social care economies are expected to benefit both from improved health outcomes of individuals
and improved partnerships among key stakeholders through a collaborative approach. It is important
to note that the main focus of the evaluation is the impact of the programme on physical activity
although longer-term impacts on health are considered using qualitative responses from the case
studies and modelling approaches. Macmillan and the Ramblers may see positive outcomes with
increased brand awareness and recognition as well as improved links between Walking for Health
and other Ramblers and Macmillan activities.
57
Ogunleye A.A., Holmes, M.D. (2009), Physical activity and breast cancer survival. Brest Cancer Research 2009,
11(5): 106. 58
Walking for Health (2012), Your Training Manual
22
2.6 Logic model
Figure 2.1 includes a logic model summarising the key components of the Walking for Health programme
detailed above. The assumptions underpinning these relationships are reflected in the programme
objectives (see section 2.4) which characterise the programme’s theory of change and provide a
framework for assessing the delivery of Walking for Health.
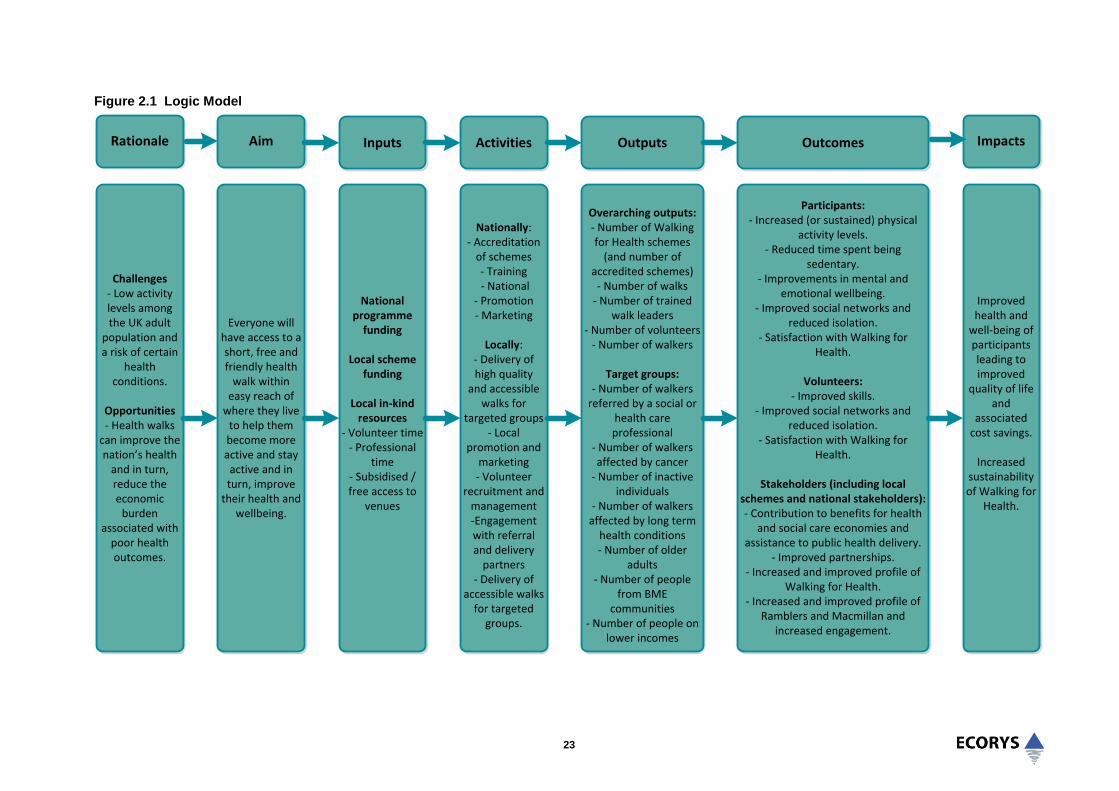
23
Figure 2.1 Logic Model
Rationale Inputs Activities Outputs Outcomes
Challenges- Low activity levels among the UK adult
population and a risk of certain
health conditions.
Opportunities- Health walks
can improve the nation’s health
and in turn, reduce the economic
burden associated with
poor health outcomes.
Aim
Everyone will have access to a short, free and friendly health
walk within easy reach of
where they live to help them become more active and stay active and in turn, improve
their health and wellbeing.
National programme
funding
Local scheme funding
Local in-kind resources
- Volunteer time- Professional
time- Subsidised / free access to
venues
Nationally: - Accreditation
of schemes - Training - National
- Promotion - Marketing
Locally: - Delivery of high quality
and accessible walks for
targeted groups- Local
promotion and marketing- Volunteer
recruitment and management-Engagement with referral and delivery
partners- Delivery of
accessible walks for targeted
groups.
Overarching outputs:- Number of Walking for Health schemes
(and number of accredited schemes)
- Number of walks- Number of trained
walk leaders- Number of volunteers
- Number of walkers
Target groups:- Number of walkers
referred by a social or health care professional
- Number of walkers affected by cancer
- Number of inactive individuals
- Number of walkers affected by long term
health conditions- Number of older
adults- Number of people
from BME communities
- Number of people on lower incomes
Impacts
Participants:- Increased (or sustained) physical
activity levels.- Reduced time spent being
sedentary.- Improvements in mental and
emotional wellbeing.- Improved social networks and
reduced isolation.- Satisfaction with Walking for
Health.
Volunteers:- Improved skills.
- Improved social networks and reduced isolation.
- Satisfaction with Walking for Health.
Stakeholders (including local schemes and national stakeholders):- Contribution to benefits for health
and social care economies and assistance to public health delivery.
- Improved partnerships.- Increased and improved profile of
Walking for Health.- Increased and improved profile of
Ramblers and Macmillan and increased engagement.
Improved health and
well-being of participants leading to improved
quality of life and
associated cost savings.
Increased sustainability of Walking for
Health.
24
2.7 Summary
This chapter has set out the context to the evaluation. The evaluation framework is underpinned by an
understanding of the background and rationale of the Walking for Health programme, the national
programme team’s approach to its management and operation, the objectives adopted by the national
team for the period 2012-15, and the theory of change underpinning the relationships between the
programme’s activities, outputs, outcomes and impacts.
The general context for the programme recognises the importance of maintaining regular physical activity
in reducing long-term health risks and its potential to benefit people living with and beyond cancer. A
growing body of evidence also highlights the positive effects physical activity can have on wellbeing and
quality of life.
The specific rationale for the Walking for Health intervention relates in particular to the need to provide
accessible opportunities for people to participate in moderate intensity physical activity and therefore
raise their activity rates towards the Government’s recommended levels. It also recognises the
effectiveness of walking activity as a way of increasing physical activity amongst those with long-term
health conditions.
Walking for Health schemes are funded and delivered at a local level. Each scheme has a scheme
coordinator who oversees and develops the scheme, supported by a number of volunteers including walk
leaders and cascade trainers. The national programme team, which is hosted by the Ramblers in
partnership with Macmillan, supports delivery across the whole of England.
In order to support engagement with health professionals, the Ramblers and Macmillan have identified
and encouraged a specific requirement for Walking for Health to be promoted as a health activity that
meets specific criteria, in order to encourage signposting from health professionals.
The process of accreditation has been a key focus of the national programme team’s activity since 2012,
when it was re-introduced by the Ramblers and Macmillan. A key requirement of accreditation is that all
walks meet the definition of a Walking for Health walk i.e. at least one walk between 10-30 minutes per
month; no longer than 90 minutes; and walking at a moderate pace that makes walkers feel warmer,
breathe harder and their heart beat faster whilst still being able to talk to others around them.
The evaluation framework builds from a logic model which shows how the key inputs, activities and
outputs are expected to generate a number of important benefits to participants, volunteers and
stakeholders. The assumptions underpinning these relationships (the programme’s theory of change) are
reflected in the programme objectives which provide a framework for assessing the delivery of Walking
for Health.
The logic model identifies key outcomes for participants, volunteers and stakeholders. The most direct
outcome of participation is maintaining, or in some cases increasing (depending on whether participants
‘step up’ or ‘step down’), physical activity through the health walks, but also potentially in other activities
as well. As the review of evidence indicates, this may lead to improved physical health and mental-
emotional well-being.
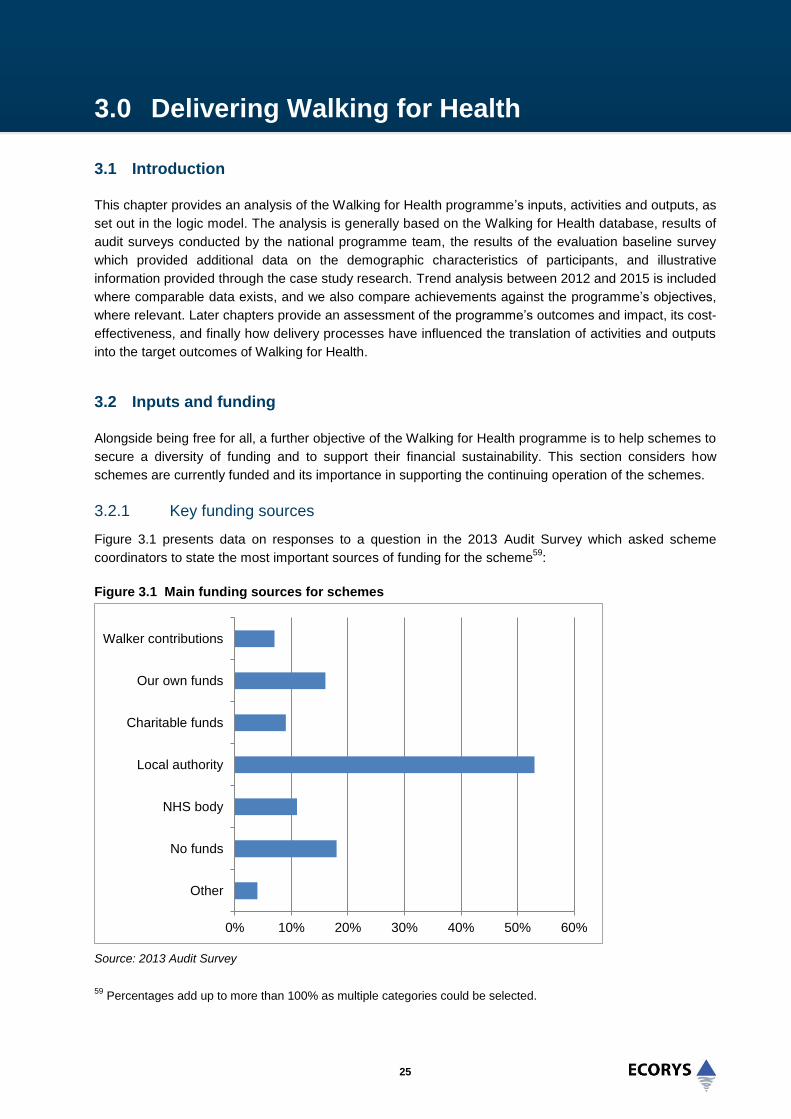
25
3.0 Delivering Walking for Health
3.1 Introduction
This chapter provides an analysis of the Walking for Health programme’s inputs, activities and outputs, as
set out in the logic model. The analysis is generally based on the Walking for Health database, results of
audit surveys conducted by the national programme team, the results of the evaluation baseline survey
which provided additional data on the demographic characteristics of participants, and illustrative
information provided through the case study research. Trend analysis between 2012 and 2015 is included
where comparable data exists, and we also compare achievements against the programme’s objectives,
where relevant. Later chapters provide an assessment of the programme’s outcomes and impact, its cost-
effectiveness, and finally how delivery processes have influenced the translation of activities and outputs
into the target outcomes of Walking for Health.
3.2 Inputs and funding
Alongside being free for all, a further objective of the Walking for Health programme is to help schemes to
secure a diversity of funding and to support their financial sustainability. This section considers how
schemes are currently funded and its importance in supporting the continuing operation of the schemes.
3.2.1 Key funding sources
Figure 3.1 presents data on responses to a question in the 2013 Audit Survey which asked scheme
coordinators to state the most important sources of funding for the scheme59
:
Figure 3.1 Main funding sources for schemes
Source: 2013 Audit Survey
59
Percentages add up to more than 100% as multiple categories could be selected.
0% 10% 20% 30% 40% 50% 60%
Other
No funds
NHS body
Local authority
Charitable funds
Our own funds
Walker contributions

26
The graph shows that local authorities were the most important source of funding for the majority of
schemes (53%); the next most important sources were ‘own funds’ and NHS bodies (the decrease from
25% in 2012 to 11% in 2013 can be attributed in part to responsibilities for public health switching from
the NHS to local authorities as a result of Health and Social Care Act 2012, as highlighted in chapter two).
As noted in the previous chapter, volunteer time and inputs are key to the delivery of Walking for Health,
in addition to any paid posts and other direct costs. For volunteer-led schemes the value of in-kind
contributions is even more crucial since both the scheme coordinator and walk leaders will be volunteers. Even if the schemes are led by local authorities, the free time provided by the volunteers is still regarded
as key to the efficient operation, sustainability and potential expansion of the schemes:
“It couldn’t work without volunteers, no way; it wouldn’t work without volunteers at all. We have 46
volunteers, even if they only do 2 hours a week that’s 92 unpaid hours a week that volunteers are
providing…the amount of money it is saving by having volunteers is immense”
(scheme coordinator)
The sustainability of scheme funding arrangements, and the effectiveness of related programme support,
is considered in chapter 6.
3.2.2 Scheme budgets
The 2013 Audit survey provided data on the annual budget of Walking for Health schemes. A significant
proportion of respondents indicated that their scheme did not have a specific annual budget. This does
not mean that these schemes had no funding however, as many of the same respondents also indicated
in the audit that their scheme received funding from various sources including local authorities. ‘No
annual budget’ was therefore understood to mean ‘no specific amount’ rather than ‘zero funding’. An
average annual budget for these schemes was derived by weighting the ‘no annual budget’ responses on
the basis of their responses to the question on who funds their scheme, and linking this to average annual
budget figures for each of the funding categories (using responses from those who did provide a budget
and source of funding).60
This calculation resulted in a total average scheme cost estimate of nearly
£11,000 per annum across all schemes.61
Of those schemes that provided an annual budget amount in their responses to the 2013 Audit survey,
the amounts ranged from £200 to £85,000. Most of the case study schemes were not able to provide
specific annual budget figures. For one scheme, however, the total amount of annual funding which
covered the funding of two posts was £50,000 which was provided by the local authority’s Sports
Development and Public Health teams. Additional funding was provided for other overheads, such as
branded materials including polo shirts and waterproof jackets for the volunteers.
60
Schemes who said that they used their own funds and did not provide an annual budget were assumed to have a
budget of zero, as no annual budget figures were provided for this group of respondents. 61
This result can be compared to analysis undertaken for Natural England (2012) which concluded that the total
recurring (economic) costs for a local scheme ranged from just under £15,000 to almost £60,000 per annum. An
important limitation of the previous research was the very small sample of schemes that the analysis of costs was
based on (a total of five out of more than 500 active schemes).

27
3.2.3 Role of scheme coordinator
Of the schemes that have a dedicated programme budget, the scheme budget is primarily used to
support the scheme coordinator and assistant roles. The case studies suggested that it was common for
scheme coordinators to be employed by the local authority and to be based within sports development or
public health teams. The Walking for Health scheme coordinator role was generally combined with other
local authority work and the time devoted to the role varied significantly from a few hours a week to a full-
time role. The time inputs generally related to the size of the scheme. The scheme coordinator for one of
the larger schemes, for example, was employed for three days per week. A second post was also funded,
that of the volunteer coordinator, for 26 hours per week. For a smaller scheme, the scheme co-ordinator
employed by the local authority was spending on average two hours per week managing the scheme.
The day to day work of the scheme coordinators varies depending on the resources and time available.
On some of the larger schemes the role can involve more strategic work in developing partnerships and
engagement with health professionals to support the recruitment of people with a wide range of health
conditions. More generally, scheme coordinators liaise with the national and regional Walking for Health
teams, deliver the walk leader training (if trained to do so) and oversee monitoring and data collection to
input to the national Walking for Health database. A number of schemes were also using paid staff as
walk leaders. In some instances this was to increase walk leader capacity where it was difficult to recruit a
sufficient pool of volunteers and in others to provide additional support for people with health issues (such
as those recovering from strokes) to participate in Walking for Health.
3.3 Walking schemes and walks
3.3.1 Number of schemes
The Walking for Health programme has objectives to extend scheme coverage across England to make
health walks accessible to all, including the less active, and therefore reach more walkers (‘enable more
people to walk more often’). The Audit 2012 had recognised 599 schemes as Walking for Health
schemes. However, between April 2014 and March 2015, the number of recognised Walking for Health
schemes fell from 591 to 400, according to records kept by the Walking for Health team.62
This can be
accounted for by the merger of some schemes with others in their area over this period, and others
becoming inactive when they decided not to apply for accreditation, or were no longer running walks due
to staffing and / or funding issues.
3.3.2 Number and frequency of walks and size of schemes
In terms of the programme objective to extend scheme coverage, it is important to note that schemes
vary significantly in the number and frequency of different health walks delivered and in their numbers of
registered walkers. This point is important since it highlights how schemes are able to expand and
contract to meet demand in their local area (without the need for a wholly new scheme for example), and
how therefore there are other ways for the national programme team to meet the objective of reaching
more walkers beyond simply expanding the overall number of schemes.
62
It should be noted that henceforward in the report, analysis based on 2014-15 data from the database involves
extrapolating the number of schemes using the database (306) to the estimated number of schemes overall. This is
estimated to be 496 in the period between April 2014 and March 2015 based upon the number of accredited
schemes reducing from 591 to 400 i.e. for the purposes of grossing up the number is assumed to be 496 (591 + 400
divided by 2).

28
Overall, data from the 2013 Audit suggests that across 526 Walking for Health schemes, 3,438 different
walks were on offer throughout the year on a weekly, fortnightly or monthly basis, with 2,669 being run
per week. Further data collection is required to understand recent changes in the number of walks and to
answer the question of whether recent scheme closures/mergers have had any impact on scheme
coverage. The majority of schemes in fact deliver more than one walk per week, with over one third of
schemes delivering five or more walks per week. The latest detailed data from the 2012 Audit survey63
showed that:
Around a quarter of the schemes (26.9%) delivered one walk per week, with 5.5% delivering walks
less frequently (such as monthly or every two weeks).
31.6% of all schemes delivered more than one, but less than five walks per week.
19.5% delivered five or more, but less than ten walks per week.
13.1% delivered ten or more, but less than 20 walks per week.
At the other end of the spectrum, 28 schemes (4.4%) offered 20 walks or more per week and
amongst them seven schemes were running more than 40 walks per week.
Along with evidence from the evaluation survey, which highlights how for the most part individual walkers
nonetheless tend to take part in (on average) one walk per week; this suggests that schemes are able to
run multiple walks per week for multiple groups of walkers. The figure below (derived from Waves 2 and 3
of the survey) shows that the majority of walkers attended four walks a month, with the next most
common frequency being two walks a month.
Figure 3.2 Monthly frequency of walkers attending walks at Wave 2 and Wave 3
Source: Evaluation of Walking for Health Wave One and Wave Two surveys
63
Question not repeated in the 2013 Audit.

29
3.3.3 Number of regular walkers
Schemes vary significantly in terms of the range and size of their programme of walks, and in terms of
how many regular walkers participate. According to the 2013 Audit data, the number of ‘regular’ walkers64
per scheme ranged from 065
to 3,019, with a mean average of 196 and a median of 47 regular walkers
per scheme66
. However, there was also a significant number of schemes with 250 or more regular
walkers (16.5%), which gives a further indication of the variety within Walking for Health. Figure 3.3
illustrates this fact, giving an overview of the distribution of schemes by number of regular walkers.
Figure 3.3 Distribution of schemes by number of regular walkers
Source: Evaluation team calculations based on Walking for Health Audit 2013 data, n=139
Whilst the evidence suggests that there is the potential for schemes to expand, as illustrated by the
diversity of frequency of delivery and numbers of walkers, the majority of schemes at this time had
between 0 and 49 regular walkers (51.8% of schemes). Information on the total number of walkers per
annum is provided in section 3.3.
3.3.4 Duration and location of walks
Walking for Health walks are expected to be free, easy and short in duration, and accessible from where
people live. The 2013 Audit data highlighted a variety of durations of walks provided by Walking for
Health. The data showed that the majority of walks lasted between 30 and 90 minutes (70%), while 17%
of walks were 30 minutes or less and 14% lasted 90 minutes or more67
. It is important to note that walks
lasting 90 minutes or more are no longer recognised as Walking for Health walks based upon the
accreditation criteria created in 2014. The vast majority of walks however were already meeting the
criteria before the accreditation process was introduced.
64
In the 2013 audit, the definition of regular walker had changed to someone who walks at least once a month or
three times a quarter. In the 2012 audit, a regular walker was someone who walked at least once a quarter. 65
A small minority of schemes reported the number of regular walkers to be zero. 66
Based on 139 schemes reporting on this indicator in the 2013 audit. 67
Total % larger than 100 due to rounding.
0%
10%
20%
30%
40%
50%
60%
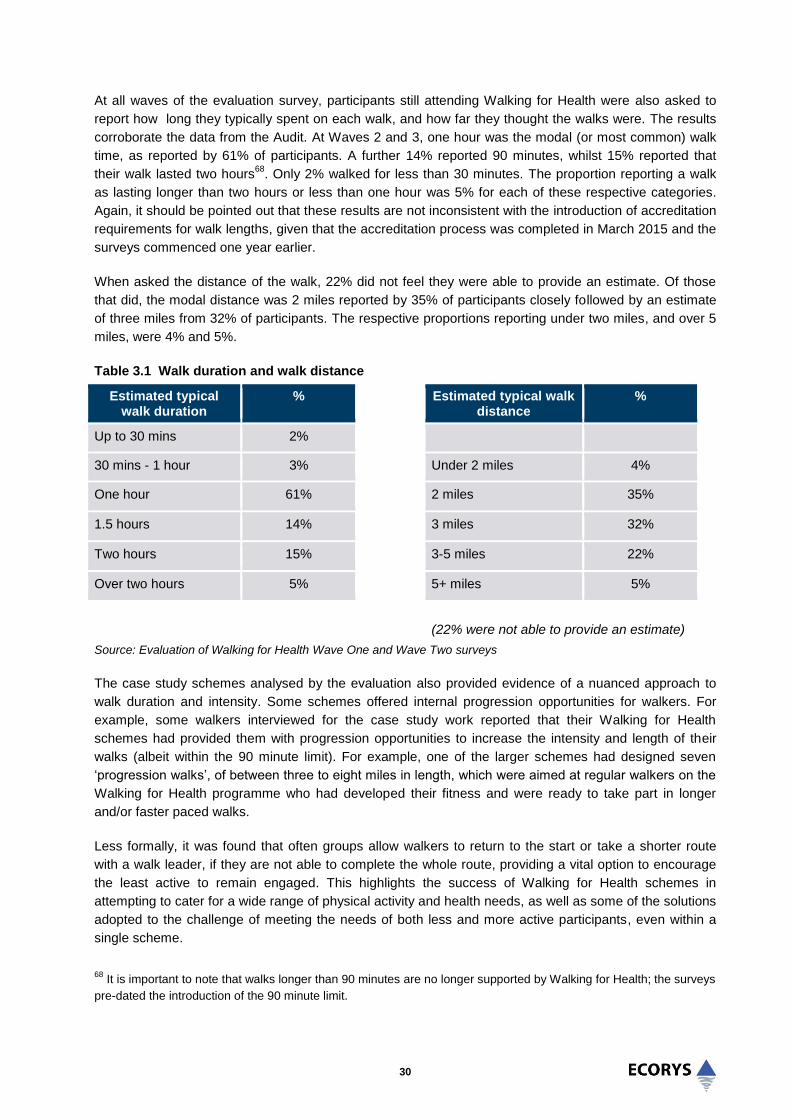
30
At all waves of the evaluation survey, participants still attending Walking for Health were also asked to
report how long they typically spent on each walk, and how far they thought the walks were. The results
corroborate the data from the Audit. At Waves 2 and 3, one hour was the modal (or most common) walk
time, as reported by 61% of participants. A further 14% reported 90 minutes, whilst 15% reported that
their walk lasted two hours68
. Only 2% walked for less than 30 minutes. The proportion reporting a walk
as lasting longer than two hours or less than one hour was 5% for each of these respective categories.
Again, it should be pointed out that these results are not inconsistent with the introduction of accreditation
requirements for walk lengths, given that the accreditation process was completed in March 2015 and the
surveys commenced one year earlier.
When asked the distance of the walk, 22% did not feel they were able to provide an estimate. Of those
that did, the modal distance was 2 miles reported by 35% of participants closely followed by an estimate
of three miles from 32% of participants. The respective proportions reporting under two miles, and over 5
miles, were 4% and 5%.
Table 3.1 Walk duration and walk distance
Estimated typical walk duration
%
Estimated typical walk distance
%
Up to 30 mins 2%
30 mins - 1 hour 3% Under 2 miles 4%
One hour 61% 2 miles 35%
1.5 hours 14% 3 miles 32%
Two hours 15% 3-5 miles 22%
Over two hours 5% 5+ miles 5%
(22% were not able to provide an estimate)
Source: Evaluation of Walking for Health Wave One and Wave Two surveys
The case study schemes analysed by the evaluation also provided evidence of a nuanced approach to
walk duration and intensity. Some schemes offered internal progression opportunities for walkers. For
example, some walkers interviewed for the case study work reported that their Walking for Health
schemes had provided them with progression opportunities to increase the intensity and length of their
walks (albeit within the 90 minute limit). For example, one of the larger schemes had designed seven
‘progression walks’, of between three to eight miles in length, which were aimed at regular walkers on the
Walking for Health programme who had developed their fitness and were ready to take part in longer
and/or faster paced walks.
Less formally, it was found that often groups allow walkers to return to the start or take a shorter route
with a walk leader, if they are not able to complete the whole route, providing a vital option to encourage
the least active to remain engaged. This highlights the success of Walking for Health schemes in
attempting to cater for a wide range of physical activity and health needs, as well as some of the solutions
adopted to the challenge of meeting the needs of both less and more active participants, even within a
single scheme.
68
It is important to note that walks longer than 90 minutes are no longer supported by Walking for Health; the surveys
pre-dated the introduction of the 90 minute limit.

31
Most Walking for Health walks take place in local countryside or open spaces. For example, the case
study schemes serving highly populated urban areas were providing walks in local beauty spots or nature
reserves and were very well attended. Linked to this, a minority of the walks were designed to be of
educational value, such as the wildlife and historical walks that come under the Walking for Health
banner.
Walks commonly took place during the daytime or weekdays; a number of schemes commented that they
had tried to establish evening and weekend walks with limited success. For example one scheme had
established a walk in the early evening to attract office workers but this attracted a much lower number of
walkers than the regular morning walks. The common view was that people who are working in the day
are too busy in the evenings and weekends to attend this type of provision. This will nonetheless limit the
participation of those who are less active and working but who may want to participate in health walks.
3.3.5 Targeted walks
While the vast majority of schemes in the 2013 Audit stated that their walks were open to all (70%), a
significant proportion of schemes offered targeted walks for specific groups. The most frequently named
target groups were people with long term health conditions (15.7% of all schemes), followed by people
with disabilities (13.5% of schemes) and older people (12.4% of schemes). Other schemes offered
specific walks in areas of deprivation (8.6%), or targeted black and minority ethnic groups (6.2%). 5.5% of
schemes targeted people who had been diagnosed with cancer. A further 5.5% targeted walkers of a
specific gender.
For example, one case study scheme included in the evaluation demonstrated how track-walking was
being used to engage younger women (25-55) in moderate physical activity in a safe and secure
environment. It also provides a good example of the flexibility built into health walks more generally to
ensure that Walking for Health is accessible and caters to the needs of different walkers. Further
examples of good practice in relation to Walking for Health’s specific target groups are found in chapter 6.
Case Study Good Practice Evidence – Engaging with younger women
One of the medium-sized schemes led by a local authority provides a short walk every Wednesday
evening between 5.30pm and 7pm at a school’s athletics track. The timing is flexible however and
participants can turn up at any time between 5.30pm and 6.30pm. An advantage of this timing is that
people working normal working hours are able to attend.
The length of the walk is also flexible and beginners might only walk for 10 minutes initially. The
length of time varies between 10 minutes and one hour and on average people spend about half an
hour walking.
Participants cannot be obliged to walk at a certain pace; however the walk leader gives advice to
participants on the importance of walking at a minimum pace in order to raise the heart rate to
improve fitness levels and this has the effect of encouraging people to walk at a moderate pace.
The track walking is targeted at women of all ages (though it is not exclusive to women) to enable
them to exercise in a safe and secure environment. However the majority of those who attend are in
the 40-50 age category which is younger than the overall average for the scheme. The track walking
has also attracted a couple of younger men with learning disabilities.

32
Case Study Good Practice Evidence – Engaging with younger women
The overall numbers are increasing gradually – the average number of participants is approximately
8-10 per session rising from 3-4 in the last year. It is felt that the full potential of the walk could be
realised with more publicity. With more funding the Council would do more to market the walk and
currently the main way that participants hear about the walk is through word of mouth.
The key lessons is that track walking can offer a flexible way of engaging younger women in
moderate physical activity in a safe and secure environment and can provide an opportunity for
women to progress to more vigorous exercise.
3.4 Walkers and their characteristics
3.4.1 Number of walkers
The Ramblers and Macmillan aim to increase participation in Walking for Health. However, in line with the
recent re-introduction of the accreditation process (which has resulted in fewer schemes and walks), it
can be seen that following a trend towards an increase in the number of participants, more recently there
has been a reduction in the number of registered walkers.
Using the data from the 2013 Audit, it can be estimated that Walking for Health walks attracted 103,368
regular walkers in 201369
(this figure is similar to the total number of registered walkers of 108,700
between September 2013 and August 201470
, suggesting a high level of engagement amongst registered
walkers). Looking at more recent data on the overall number of walkers (not only those who attend
regularly), estimations extrapolating data from the database suggest that 82,569 walkers71
(29,569 of
them new) had attended walks between April 2014 and March 2015.
3.4.2 General profile of walkers
Walking for Health schemes must balance being open and accessible to all with the need to engage
people who are currently inactive or who need support to remain active. Walking for Health aims in
particular to reach those most in need of support, including people affected by cancer and other long-term
health conditions, and those from recognised health inequality groups such as older adults, BME
communities and people on lower incomes.
The demographic profile of Walking for Health walkers registered on the national database has remained
consistent over the past three years. Between April 2014 and March 2015:
The majority of walkers were female (70.3%).
The majority of walkers were White (93.6%), with only 3.4% of walkers belonging to ethnic minority
groups (Black 0.7%, Asian 1.8%, mixed 0.4%, other 0.5%). Given that their share in the overall
population is 14.6% (Census 2011 data for England) people from ethnic minority groups remain
under-represented among Walking for Health walkers.
69
This is based on an extrapolation of data provided by 309 schemes in the 2013 Audit. 70
Based on database figures and scaling up using the proportion of schemes on the database 71
Scaling-up based on an assumed number of 496 schemes (as number of schemes reduced from 591 to 400 during
the period in question i.e. 591+400 divided by 2).

33
As shown by the detailed breakdown of age in the graph below, the vast majority of walkers (83%) were
55 years or older. This compares to 28% of the general population, based on 2011 Census data,
suggesting that Walking for Health has been effective at engaging with this target group.
Figure 3.4 Distribution of walkers by age
Source: Walking for Health National Database, April 2014 – March 2015
The table below shows how the profile of Walking for Health participants compares to the general
population.
Table 3.2 Characteristics of Walking for Health Participants
Group Walking for Health Population (Census 2011)
Women 70.3% 51%
BAME 3.4% 14.6%
Over 55 83% 55%
Sources: Walking for Health National Database, April 2014 – March 2015; Census of Population 2011
3.4.3 Deprivation and Education levels
There is a proven correlation between the deprivation level of a local area, education and household
income (as well as levels of physical activity).72
It is therefore useful to analyse the place of residence of
walkers, as a proxy for understanding their income levels. In the year to March 2015, 5.3% of walkers
lived in the 20% most deprived areas using the Index of Multiple Deprivation (IMD) according to the
database. This compares to about 10% of people in England who live in the 20% most deprived areas73
and suggests that this group is also under-represented amongst Walking for Health walkers.
72
Farrell, L., Propper, C., Shields, M., (2013). The Socioeconomic Gradient in Physical Inactivity in England, the
Centre for Market and Public Organisation, Working Paper No. 13/311, July 2013,
http://www.bristol.ac.uk/cmpo/publications/papers/2013/wp311.pdf (accessed 10.01.2014) 73
Department for Communities and Local Government, (2011). English indices of deprivation 2010, Published 24
March 2011, https://www.gov.uk/government/uploads/system/uploads/attachment_data/file/6871/1871208.pdf
(accessed 10.01.2014)
1.3% 2.7% 3.7%
8.0%
32.7%
39.7%
9.4%
0.8% 1.6%
0%
5%
10%
15%
20%
25%
30%
35%
40%
45%

34
This analysis is reflected in the resident location data collected as part of the baseline survey completed
for the evaluation. The frequency distribution of LSOA IMD scores for these participants is shown in
Figure 3.5 (higher IMD scores represent higher levels of deprivation; 87.8 is the most deprived area).
Figure 3.5 Frequency distribution of Index of Multiple Deprivation scores in the baseline sample
Sources: Evaluation of Walking for Health baseline survey; English indices of deprivation 2010
Note: Out of the 520 participants who provided information for the survey, a postcode was available for 421 (81.0%),
which allowed their LSOA of residence and corresponding IMD score to be identified.
The right skew of the distribution in Figure 3.5 indicates that the survey sample came from generally
affluent areas. The mean IMD LSOA score for survey participants was 15.2 compared to a national mean
score of 21.7 for England. 50% of the sample lived in the least deprived areas with an IMD score of below
12, whilst just 34% of English LSOAs have a score below this. Only 4.3% of the sample lived in an area
with an IMD score of above 40, compared to 14% of English LSOAs scoring above this.
Figure 3.6 details the percentage of participants by highest level of educational status. The sample for the
Wave One survey was generally well educated, with just 11% of participants stating that they had none of
the mentioned qualifications. The educational category with the greatest number of participants was the
high school group (school certificate, CSE, GCSE, O Level, O grade or equivalent) with 126 participants
(24.2%). In total 25.8% of participants had either an undergraduate or postgraduate university degree.
Whilst this is lower than the 27% of the English population who had a degree in the UK Census, this

35
reflects the older age of this population, as fewer individuals went to university when many of the survey
participants were young. In the Census, just 17.5% of English residents aged over 65 had a degree or
higher, a much lower figure than in this sample.
Figure 3.6 The percentage of participants split according to highest level of education attained
Source: Evaluation of Walking for Health baseline survey, n =520
3.4.4 Inactivity, long-term health conditions and cancer
A key objective of Walking for Health is to increase the availability of and participation in Walking for
Health for people who are currently inactive. As reported in chapter one, Walking for Health OHQ
responses (April 2014-September 2014) reveal that around one quarter (25.7%) of walkers registered
with Walking for Health can be classified as ‘active’ on joining the scheme, that is they take part in
moderate physical activity for at least 30 minutes on at least five days each week. New physical activity
guidelines superseded the focus on 5 x 30 minutes in 2011 however. A measure which can be used to
compare activity levels more closely with national data is sedentary time. Sedentary time at baseline for
the Walking for Health constant sample is 4.6 hours; the Health Survey for England 201274
reports the
mean number of hours sedentary time as 4.9 hours.
Walking for Health aims to engage people affected by long-term health conditions, including cancer.
According to the national database, 87.8% of all walkers between April 2014 and March 2015 reported
that they had no long-term illness, health problem or disability which limits daily activities/work. Of those
who did (9.8%), they most commonly reported a physical disability (3.2%), ‘other’ disabilities (1.6%) and
mental health issues (1.7%). This is similar to the findings in the year up to September 2014 when 88.6%
of all walkers reported that they had no disability. The proportion reporting that they had a disability in the
74
Craig R, Mindell J (eds) (2013) Health Survey for England 2012, London: The Health and Social Care Information
Centre
9%
24%
9%
21%
14%
12%
11%
Primary or middle school
High school (school certificate,CSE, GCSE, O,Level, O gradeor equivalent)
High school (higher schoolcertificate, A Level, AS Level,or equivalent)
College (vocationalqualification) or apprenticeship
University (Bachelors degree,Masters degree or equivalent)
University (research degree,PhD or equivalent)
None of the above

36
year to March 2015 (9.8%) was relatively low compared with the 18% reporting this within the total
population75
.
Analysis of the Walking for Health database indicated a significant increase nationally in the participation
of people living with and beyond cancer in the 12 months to September 2014 – it was estimated that
3,653 walkers who had been diagnosed with cancer participated in walks compared to 1,929 reported for
the previous 18 months. In the year to March 2015 the database indicates that 3,567 walkers with cancer
participated in the walks, of which 2,131 were new walkers. In percentage terms, 4.3% of all walkers and
7.3% of new walkers in this period were people who had been diagnosed with cancer; these figures
compare to a cancer prevalence rate of 3.2% for the overall population76
. These proportions are slightly
higher than the numbers stated in the analysis of the 12 months up to September 2014, when 3.3% of all
walkers and 5.6% of new walkers who had been diagnosed with cancer.
Some 33.6% of walkers registered in the year to March 2015 had at least one serious health condition
(excluding cancer): 22.6% suffer from high blood pressure; 7.3% from asthma; 5.8% suffer from heart
disease; 5.7% from diabetes; and 1.6% from chronic obstructive pulmonary disease (COPD).77
These
results are very similar to the percentages for the period between September 2013 and August 2014
when 22.2% were suffering from high blood pressure; 7.1% from Asthma; 5.6% suffer from heart disease;
5.4% from Diabetes; and 1.5% from chronic obstructive pulmonary disease (COPD).
Although a significant percentage of the walkers reported health conditions it is important to note that the
prevalence of health conditions would be expected to be high in this population of older adults. It is
noteworthy that the database sample appears, at least based on their self-report, to be healthier than
would be expected of a general population sample of comparable age. For example figures from the 2012
Health Survey for England indicate that approximately 30% of all men and women in England have
hypertension, with this figure rising to 65% in the over 65s. This prevalence is to be compared with just
22% of the database sample reporting they suffer from high blood pressure. Similarly, just 5.7% of the
database sample reported having diabetes compared to an overall prevalence from the Health Survey for
England of 5.8% in all adults in England, rising to a prevalence of 14% in over 65s.
The relatively low prevalence of those reporting that they are affecting by long-term health conditions also
reflects that the relatively small proportion of walkers signposted to Walking for Health by GPs and other
health professionals. According to the database based on walkers’ self-reporting, 3,336 or 6.5% of
walkers active between April 2014 and March 2015 had been signposted to the programme by their GPs
or a health professional. This represents no change from the year to September 2014, when 2,805 or
6.6% of walkers active had been signposted to the programme by their GPs or a health professional. With
regards to new walkers, 7.1% had been signposted by a health professional.
More generally, it can be hypothesised that whilst the open access approach pursued by Walking for
Health schemes does not preclude providing support for the most health needy (as well as engaging
other target groups), it is perhaps not surprising that this approach tends to attract people with
characteristics that suggest they are healthier than the general population. This was evident within the
case study schemes; most were running larger general health walks (with between 20-100 participants),
75
Census of Population, 2011 76
Cancer prevalence figures are from 2008 data based on analysis in Maddams, J., Brewster D. Gavin A., et al.
Cancer Prevalence in the United Kingdom: estimates for 2008. Br J Cancer 2009; 101(3):541–547 77
It should be noted that ‘series health condition’ is distinct from ‘long-term health condition, health problem or
disability’ reported in previous paragraph.
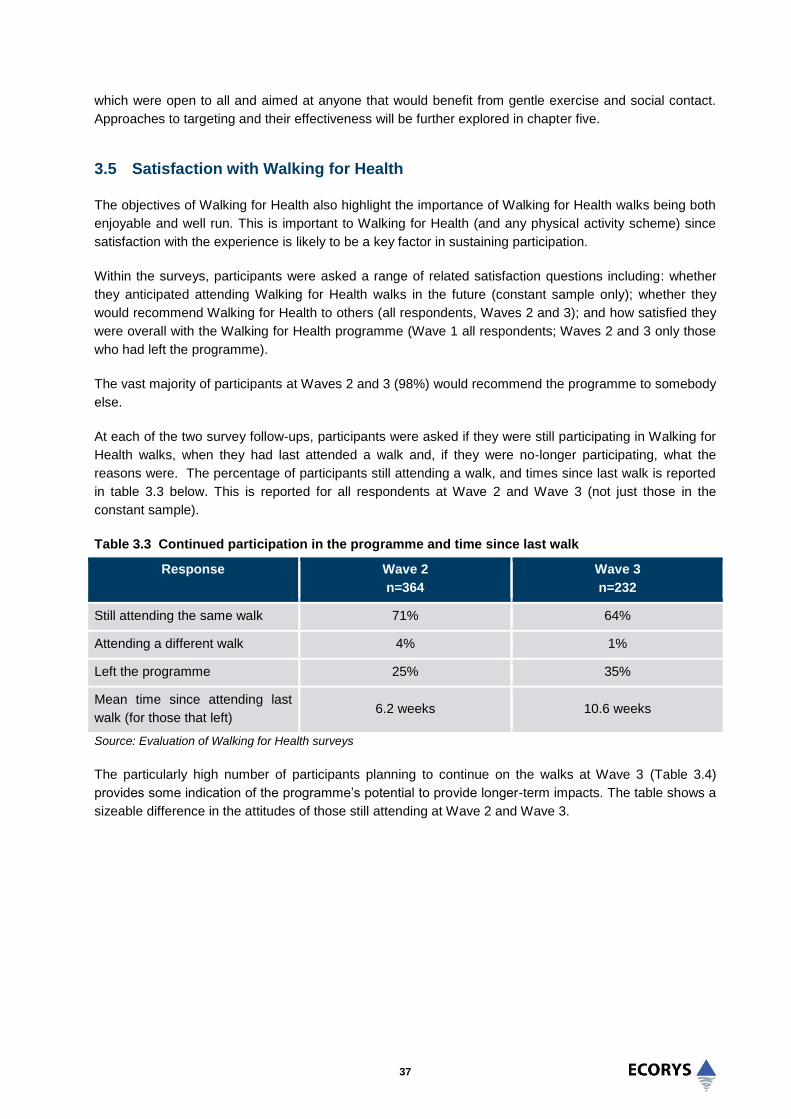
37
which were open to all and aimed at anyone that would benefit from gentle exercise and social contact.
Approaches to targeting and their effectiveness will be further explored in chapter five.
3.5 Satisfaction with Walking for Health
The objectives of Walking for Health also highlight the importance of Walking for Health walks being both
enjoyable and well run. This is important to Walking for Health (and any physical activity scheme) since
satisfaction with the experience is likely to be a key factor in sustaining participation.
Within the surveys, participants were asked a range of related satisfaction questions including: whether
they anticipated attending Walking for Health walks in the future (constant sample only); whether they
would recommend Walking for Health to others (all respondents, Waves 2 and 3); and how satisfied they
were overall with the Walking for Health programme (Wave 1 all respondents; Waves 2 and 3 only those
who had left the programme).
The vast majority of participants at Waves 2 and 3 (98%) would recommend the programme to somebody
else.
At each of the two survey follow-ups, participants were asked if they were still participating in Walking for
Health walks, when they had last attended a walk and, if they were no-longer participating, what the
reasons were. The percentage of participants still attending a walk, and times since last walk is reported
in table 3.3 below. This is reported for all respondents at Wave 2 and Wave 3 (not just those in the
constant sample).
Table 3.3 Continued participation in the programme and time since last walk
Response Wave 2
n=364
Wave 3
n=232
Still attending the same walk 71% 64%
Attending a different walk 4% 1%
Left the programme 25% 35%
Mean time since attending last
walk (for those that left) 6.2 weeks 10.6 weeks
Source: Evaluation of Walking for Health surveys
The particularly high number of participants planning to continue on the walks at Wave 3 (Table 3.4)
provides some indication of the programme’s potential to provide longer-term impacts. The table shows a
sizeable difference in the attitudes of those still attending at Wave 2 and Wave 3.

38
Table 3.4 Measures of general satisfaction with Walking for Health
Do you anticipate attending Walking for
Health walks in the future?
Wave 1
n=520
Wave 2
n=261
Wave 3
n=145
Definitely 86.2% 69.8% 93.3%
Probably 8.1% 12.5% 4%
Possibly 4.6% 9.1% 2%
Definitely/probably not 1.2% 8.9% 0%
Don’t know 0% 0% 0.7%
Source: Evaluation of Walking for Health surveys
The responses for overall satisfaction for all respondents from Wave 1, and those that had left the
programme at Wave 2 and Wave 3 are shown below. While the majority of the respondents were ‘very
satisfied’ with the scheme, there is a statistically significant difference between the percentage that were
very satisfied at Wave 1, and those who had left their schemes and felt very satisfied at Wave 2.
Table 3.5 Measures of general satisfaction with Walking for Health at Wave 1 and for those that left the programme by Wave 2 and Wave 3
Satisfaction Wave 1 n=520
Left programme Wave 2 n=88
Left programme Wave 3 n=50
Very satisfied 86.9% 64.8% 78.0%
Somewhat satisfied 9.4% 23.9% 16.0%
Neither satisfied nor dissatisfied 2.3% 5.7% 0%
Somewhat dissatisfied 1% 5.7% 6.0%
Very dissatisfied 0.2% 0% 0%
Source: Evaluation of Walking for Health surveys
Nonetheless, the reasons provided for drop-out were predominantly non-scheme related. Table 3.5 lists
the percentage prevalence of reasons given for leaving the scheme. The modal response at both waves
was that participants did not have enough time to attend walks. A large number also reported that they
did not feel well enough to walk (further analysis revealed that there were close to statistically-significant
lower levels of physical activity amongst those who no longer attended a scheme, reflecting this
response). A substantial number stated that they now walked alone or with friends.

39
Table 3.6 Stated reasons for no-longer attending a Walking for Health Walk
Response Wave 2 Wave 3
n (%) n (%)
I don’t have time 27 (26%) 31 (35%)
I don’t feel well enough 19 (18%) 21 (24%)
I walk alone or with friends now 25 (24%) 12 (13%)
The walks were too easy 8 (7%) 5 (5%)
The walks were too difficult 7 (6%) 4 (5%)
It was too difficult to get to the walks 4 (4%) 4 (5%)
I joined another walking group 3 (3%) 4 (5%)
I took up another activity 12 (11%) 4 (4%)
I don’t enjoy the walks 1 (1%) 3 (3%)
I prefer to walk when the weather is better 0 (0%) 1 (1%)
TOTAL 106 89
Source: Evaluation of Walking for Health surveys
Note: Participants were able to give more than one response although the majority chose just one. Hence the values
listed correspond to the percentage of responses rather than the percentage of survey participants.
3.6 Volunteers
Given how critical volunteer inputs are to the running of Walking for Health activities, the Ramblers and
Macmillan also have an objective to support schemes to recruit and retain a sufficient pool of volunteers.
The following section presents data on the number of volunteers, the profile of volunteers and hours of
volunteer time contributed.
3.6.1 Number of volunteers
Based on the 2013 audit results, it is estimated that 10,982 volunteer walk leaders assisted across the
Walking for Health schemes in 2013.78
The results indicated that 38% of schemes increased their number
of walk leaders over the previous year, while for 46% of schemes the number of volunteer walk leaders
was reported to have stayed the same and 16% have experienced a decline in walk leader numbers,
which can be regarded as a positive result given the programme objective to maintain a sufficient pool of
volunteers.
Other volunteers according to the 2013 audit were active as walk assistants (2,316), in admin/data entry
roles (608), in promotional (987) and other roles (722).79
The total number of volunteers in other roles was
therefore 4,633.
Data is not available showing trends in the number of volunteers since 2013.
78
This is a linear extrapolation from 416 schemes reporting on this figures in the 2013 Audit 79
All estimates based on linear extrapolation from 441reporting schemes in the 2013 Audit

40
3.6.2 Profile of volunteers
Based on available data from the Walking for Health database extracted in September 2014 and covering
the 18 months prior to this, the majority of trained walk leaders continued to be female (61.6%) and in line
with the walker demographic, the average walk leader was aged between 55 and 74 years old (75%).
There is no updated information on the demographic characteristics of the volunteers.
3.6.3 Volunteer time
The 2013 Audit asked schemes to estimate how many hours of volunteer time are contributed to their
scheme in a typical week. The variance in the numbers reported by schemes was high and answers
ranged from 0 and 2,000 hours80
, with an average of 18.1 hours and a median of 10 hours committed per
scheme.
The main role of volunteers, as highlighted above, is leading the walks. An important part of this role is
planning and undertaking risk assessments of walks and then coordinating the delivery of the walks. It
was evident from the case studies that walk leaders invest time into doing reconnaissance prior to the
walk – it was not uncommon for walk leaders to be checking routes two or three times if necessary prior
to doing a formal risk assessment. If walk leaders are not officially leading walks they assist by engaging
with slower walkers and ensuring that nobody gets into problems on the route. Volunteers also play a role
in introducing people to the ethos of Walking for Health and making people feel welcome.
Volunteer outcomes are reported in section 4.3 while challenges faced by schemes in recruiting a
sufficient pool of volunteers and good practice approaches to overcome these challenges are considered
in section 6.5.
3.7 Summary
This chapter has focused on the key characteristics of schemes and walkers in order to provide a
contextual basis for the analysis of the programme’s outcomes and impacts. The analysis of scheme data
also goes some way to assessing progress in meeting some of the programme’s specific high level aims
and objectives.
An objective of the Walking for Health programme is to help schemes to secure a diversity of additional
funding and support their financial sustainability; the progress in meeting this objective is examined in
chapter six, however data analysis of funding sources provides contextual evidence on the current
situation regarding the funding of local schemes:
Data from the 2013 Audit survey indicates average annual funding of around £11,000 for local
schemes. Of those schemes that provided an annual budget amount in their responses to the 2013
Audit survey, the amounts ranged from £200 to £85,000.
In 2013 53% of schemes were funded by local authorities (an increase from 38% in 2012) while 11%
were funded by NHS bodies (a decrease from 25% in 2012). These trends can be attributed in part to
responsibilities for public health switching from the NHS to local authorities as a result of the Health
and Social Care Act 2012.
80
The 2,000 figure is driven by a small number of schemes with over 100 walk assistants

41
The scheme budget for local authority-led schemes is primarily used to support the scheme coordinator
and assistant roles. This role was generally combined with other local authority work and the time
devoted to the role varied significantly across schemes from a few hours a week to a full-time role.
The restructuring of some schemes through the process of accreditation, which was completed in March
2015, means that the baseline for analysis of scheme data has changed and therefore further analysis
will be required in future years to assess how far the programme is meeting the objective to extend
scheme coverage. The effects of accreditation are shown by recent trends in the number of schemes and
walkers:
Between April 2014 and March 2015 the number of schemes fell from 591 to 400; this decline is
largely attributed to the accreditation process as some schemes merged with others as a result of the
process and some did not apply for accreditation and are therefore no longer recognised as Walking
for Health schemes.
The reduction in schemes appears to have affected overall attendance levels. Estimations
extrapolating data from the database suggest that 82,569 walkers (29,569 of them new) had attended
walks between April 2014 and March 2015. This compares to a total number of registered walkers of
108,700 between September 2013 and August 2014.
Analysis of scheme data shows that schemes vary significantly in terms of the range and size of their
programme of walks, and in terms of how many regular walkers participate. Around a quarter of the
schemes delivered one walk per week, 32% of all schemes delivered more than one, but less than five
walks per week and 20% delivered five or more, but less than ten walks per week.
Walking for Health is clearly successful in targeting older adults, as the vast majority of participants are in
the over 55 age group. The majority of walkers are women (70%) and participants have generally
reached a higher level of education that the population as a whole.
The levels of physical inactivity of participants at baseline appear to be similar to the wider population (as
measured using a comparable measure of sedentary behaviour).
In percentage terms, 4.3% of all walkers and 7.3% of new walkers in the year to March 2015 had been
diagnosed by cancer, an increase on the year ending September 2014; these figures compare to a
cancer prevalence rate of 3.2% for the overall population.
Some 33.6% of walkers registered in the year to March 2015 had at least one serious health condition
(excluding cancer). It is noteworthy however that the database sample appears, at least based on their
self-report, to be healthier than would be expected of a general population sample of comparable age.
The analysis in this chapter has highlighted some challenges faced in reaching particular target groups:
Only 3.4% of walkers in the year to March 2015 belonged to ethnic minority groups (compared to
15% of the national population).
In the year to March 2015, 5.3% of walkers lived in the 20% most deprived areas using the Index of
Multiple Deprivation (IMD) according to the database (compared to 10% of the national population).
The vast majority of participants are satisfied with Walking for Health.

42
Volunteer time and inputs are key to the delivery of Walking for Health, in addition to any paid posts and
other direct costs:
Some 11,000 volunteer walk leaders are estimated to have contributed to the Walking for Health
schemes in 2013; only 16% of schemes experienced a decline in walk leader numbers (compared to
2012), a positive result overall given scheme objectives.
Overall, the analysis of programme data shows that while progress is undoubtedly being made,
further actions need to be developed to meet the programme aim of reaching those that need the
most support, particularly those from recognised health inequality groups such as older adults, BME
communities and people on lower incomes. The issue of targeting is taken up further in chapter six
which looks at challenges facing schemes and good practice examples of successful engagement
approaches. Recommendations are then drawn from this analysis in the final chapter.

43
4.0 Outcomes and Impact of Walking for Health
4.1 Introduction
The previous chapter explored the inputs and outputs of Walking for Health, largely drawing on
programme data to begin to assess whether relevant programme objectives were being met.. The focus
of this chapter is on the outcomes and impact of Walking for Health, as they relate to the programme’s
overarching aim and the logic model developed by the evaluation team.
The key aim of Walking for Health is to get people more active and to help them stay active. Programme
achievements with respect to changes in overall physical activity, and specifically with regards to walking
and sitting, are explored in this section. Walking for Health also aims to increase people’s wellbeing; this
is explored from a variety of perspectives (mental wellbeing, social isolation and life satisfaction).
Ultimately, engaging in regular physical and groups activities through the programme should lead to
improvements in general health; this outcome is assessed using the EQ5D instrument, which measures
quality of life.
The combined analysis draws upon the perspectives of walkers, volunteers and wider national-level
stakeholders, gathered through both the robust longitudinal survey and case study qualitative fieldwork.
After discussion of each set of outcomes, we also provide an assessment of impact as far as is possible;
note that in the absence of a control or comparator group, this is based upon the triangulation of available
data including pre and post measurements of outcomes, as well as the subjective opinion of participants.
Unless otherwise stated, survey findings in this chapter are reported for the ‘constant sample’ – those that
completed all three waves of the survey - at baseline (Wave 1), four months (Wave 2) and eight months
(Wave 3). In addition to this, sub-analysis examines differences for the main outcomes between those
who were no longer part of the Walking for Health programme at Wave 281
(‘ceased’ at Wave 2) and
those who still were (the demographic characteristics of this group can be found in chapter 1).
Methodological explanations and issues are covered in more detail in section 1.4. After reporting results
for each set of outcomes, a summary and discussion of the findings for each of the main outcomes areas
– physical activity, wellbeing and general health – is provided at the end of each sub-section.
4.2 Physical activity amongst walkers
This section explores whether general physical activity and walking levels tend to increase (or are
maintained) amongst new Walking for Health participants, how levels of inactivity change over an eight
month period, and the specific contribution and impact of Walking for Health.
The broad finding is that across all measures of self-reported physical activity, there was an increase or
improvement between Wave 1 and Wave 2 of the survey (four months later), followed by a subsequent
decline between Wave 2 and Wave 3 (eight months later).
Increases between Wave 1 and Wave 2 included a 1.17 day average increase in moderate physical
activity, an 18 percentage point increase (from 20% to 38%) in ‘active’ participants (undertaking at least
30 minutes of moderate physical activity on five or more days a week), a 13 percentage point reduction
81
A small number of participants that said they were continuing with the programme at Wave 2, yet had not done a
walk in the last three months, were classed as ‘ceased at Wave 2’.

44
(from 29% to 16%) in the number of ‘inactive’ participants and a 38.2 minutes per week average increase
in walking. Conversely between Waves 2 and 3 there was a general 0.97 day reduction in moderate
physical activity, a 14.7 percentage point reduction in active participants, a 12.5 percentage point
increase in inactive participants, and a 41.1 minute reduction in walking per week. Participants also
maintained (but did not increase) their physical activity behaviours, as measured by the pedometer study.
Overall, the net outcome was that levels of moderate physical activity and walking were maintained
between Wave 1 and the final follow-up at Wave 3 (itself a very positive finding particularly given the age
group involved). Further evidence suggests that Walking for Health is making a significant contribution to
the maintenance of activity. Illustrative cases point to the importance of Walking for Health for helping
older people who wish to step down to maintain regular moderate exercise.
However, comparison of outcomes between those continuing to participate and those ceasing at Wave 2
suggests that those who are more engaged in physical activity and walking at the start are more likely to
stay on the programme. This points towards the need for greater efforts to retain those participants who
are less active in Walking for Health in order to meet programme objectives and maximise health
outcomes.
4.2.1 Changes in moderate physical activity, walking and inactivity
4.2.1.1 Moderate physical activity
Firstly, participants were asked at each wave of the survey to estimate on how many days in the last
week they had undertaken 30 minutes or more physical activity “which was enough to raise your
breathing rate”. This is the equivalent of physical activity undertaken at a moderate or greater intensity.
Figure 4.1 shows trends in the mean number of days undertaken over the three study waves. The mean
scores were 2.37 days of physical activity at Wave 1 (immediately after joining Walking for Health), 3.54
days at Wave 2 (four months later), and 2.58 days at Wave 3 (eight months later).
Figure 4.1 Mean number of days doing at least 30 minutes of moderate activity
Source: Evaluation of Walking for Health surveys
Base: Constant sample (n = 232)

45
There was a statistically significant increase in the mean number of days between Wave 1 and Wave 2
(p<0.001) and a statistically significant decrease between Wave 2 and Wave 3 (p<0.001). There was no
statistically significant increase between Wave 1 and Wave 3. This is despite 49% of respondents
reporting an increase in moderate physical activity (any amount) between the baseline and four months
later, and 18% reporting an increase between four and eight months later (28% reported an increase in
total: see table 4.1). It is therefore clear that the activity levels of other respondents dropped back in
parallel with those who increased their activity levels (and particularly after Wave 2 of the survey).
4.2.1.2 Walking
The survey detected a similar trend with regards to specific walking activity. All waves of the survey asked
individuals to report on the number of days in the previous seven that they had walked for at least 10
minutes, as well as the time spent walking on a typical day. A measure of total time spent walking each
week was then derived from this data. The means for the three waves were 281.4 minutes, 319.6 minutes
and 278.5 minutes per week (Waves 1, 2 and 3 respectively). Reflecting the findings on levels of physical
activity, there was a statistically significant increase in walking between Waves 1 and 2 (p<0.05), but no
statistically significant difference between Waves 1 and 3.
Figure 4.2 Mean minutes per week walking
Source: Evaluation of Walking for Health surveys
Base: Constant sample (n = 232)
More positively, in general terms this equates to around 5 hours of walking per week across all survey
Waves. This can be compared with a reported 2.7/2.5 hours per week for all adult males/females within
the Health Survey for England82
. It should be noted that there is an obvious discrepancy between the
walking data and levels of moderate physical activity. For example, some respondents that reported
undertaking less than one day of 30 minutes of moderate physical activity per week also reported that
they walked during the same period. The discrepancy can potentially be explained by the fact that
moderate physical activity, as defined by the validated measure used in this evaluation, is activity that
raises one’s breathing rate, and leisurely walking may not always do this.
82
Townsend N, Wickramasinghe K, Williams J, Bhatnagar P, Rayner M (2015). Physical Activity Statistics 2015.
British Heart Foundation: London.

46
As detailed in chapter one, pedometer research was also used to provide a more objective measure of
walking and physical activity amongst newly recruited Walking for Health participants. It should be
acknowledged that results may be subject to a form of ‘social desirability’ bias, with respondents
encouraged to walk for longer periods if wearing a pedometer83
; however it is not possible to report on the
extent to which the comparative results between baseline and follow-up stage (4 months later) might be
influenced in this way.
At baseline the 102 participants wearing pedometers completed on average 7,145 steps per day (median
= 6,608). The greatest number of mean steps per day recorded at baseline was 18,624 whilst the lowest
was 393. The 72 (%) participants at follow-up completed on average 7,232 steps per day (median =
6,531). The greatest number of average steps per day recorded at follow-up was 25,800 whilst the lowest
was 634. It is possible that participants with very low mean numbers of daily steps did not fully adhere to
the wear instructions (i.e. they wore the device for less than 7 full days).
Figure 4.3 shows the mean number of steps taken at baseline and follow-up. The difference between
baseline and follow-up is not statistically significant.
Figure 4.3 Mean number of steps taken at baseline (n=102) and at follow up (n=72)
Source: Evaluation of Walking for Health pedometer research
The results of the pedometer research are therefore broadly consistent with the survey findings on
walking behaviour which showed that participants were at least maintaining their levels of walking. 10,000
steps per day is likely to enable participants to reach the recommended 150 minutes moderate activity
per week84
; 22 participants at baseline (21%) exceeded the 10,000 steps per day average recommended
by Government guidelines. 15 participants (21%) exceeded the 10,000 steps per day average
recommended by Government guidelines at follow-up.
The slightly more positive results from the survey (increase in walking at Wave 2) can be explained by a
number of factors. Firstly, the pedometer baseline was slightly delayed compared with the Wave 1 survey
(by three weeks or more). Secondly those in the pedometer study constituted a smaller subsample.
83
Please see chapter one for a further discussion of this point. 84
Department of Health (2011), Physical activity guidelines for Adults (19–64 years)

47
Pedometer readings (where the respondents are ‘blinded’ to the results, as in this study) may also be less
prone to ‘response bias’ (whereby respondents potentially over-report physical activity when relatively
new to a programme).
For the 73 participants that provided data at both baseline and follow-up (the ‘constant sample’) a change
in the number of recorded steps was calculated. Figure 4.4 shows this distribution of change in steps per
day recorded between baseline and follow-up. A positive value indicates that participants increased their
mean daily steps whilst a negative value corresponds to a decline.
Figure 4.4 Frequency distribution of change in mean daily pedometer steps between Wave 1 and follow-up
Source: Evaluation of Walking for Health pedometer research, n=73
On average, in the ‘constant sample’ participants recorded a decline in 462 steps per day between
baseline and follow-up. This decline was not statistically significantly different from zero. The median
change was a decline in 390 steps per day. Between baseline and follow-up, 28 (38%) participants saw
increases in daily mean steps, whilst the remaining 45 (62%) recorded declines.
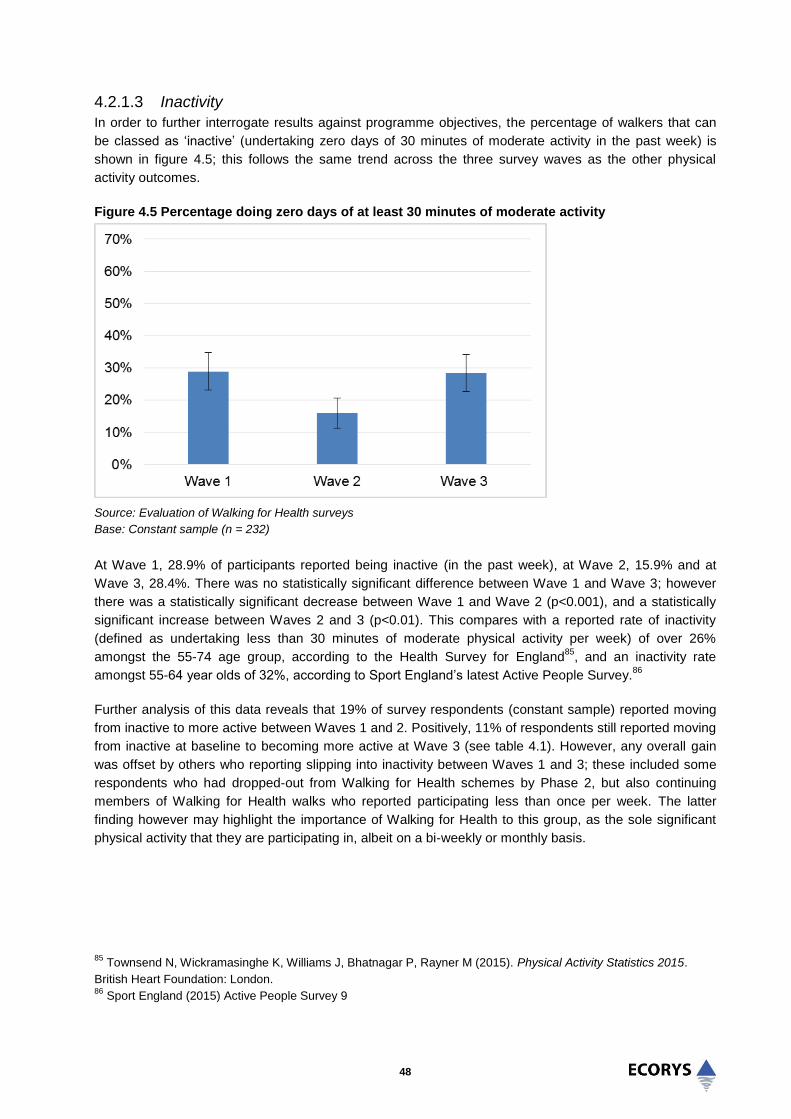
48
4.2.1.3 Inactivity
In order to further interrogate results against programme objectives, the percentage of walkers that can
be classed as ‘inactive’ (undertaking zero days of 30 minutes of moderate activity in the past week) is
shown in figure 4.5; this follows the same trend across the three survey waves as the other physical
activity outcomes.
Figure 4.5 Percentage doing zero days of at least 30 minutes of moderate activity
Source: Evaluation of Walking for Health surveys
Base: Constant sample (n = 232)
At Wave 1, 28.9% of participants reported being inactive (in the past week), at Wave 2, 15.9% and at
Wave 3, 28.4%. There was no statistically significant difference between Wave 1 and Wave 3; however
there was a statistically significant decrease between Wave 1 and Wave 2 (p<0.001), and a statistically
significant increase between Waves 2 and 3 (p<0.01). This compares with a reported rate of inactivity
(defined as undertaking less than 30 minutes of moderate physical activity per week) of over 26%
amongst the 55-74 age group, according to the Health Survey for England85
, and an inactivity rate
amongst 55-64 year olds of 32%, according to Sport England’s latest Active People Survey.86
Further analysis of this data reveals that 19% of survey respondents (constant sample) reported moving
from inactive to more active between Waves 1 and 2. Positively, 11% of respondents still reported moving
from inactive at baseline to becoming more active at Wave 3 (see table 4.1). However, any overall gain
was offset by others who reporting slipping into inactivity between Waves 1 and 3; these included some
respondents who had dropped-out from Walking for Health schemes by Phase 2, but also continuing
members of Walking for Health walks who reported participating less than once per week. The latter
finding however may highlight the importance of Walking for Health to this group, as the sole significant
physical activity that they are participating in, albeit on a bi-weekly or monthly basis.
85
Townsend N, Wickramasinghe K, Williams J, Bhatnagar P, Rayner M (2015). Physical Activity Statistics 2015.
British Heart Foundation: London. 86
Sport England (2015) Active People Survey 9

49
4.2.2 Meeting national guidelines
NHS guidelines recommend that all adults, including those aged 65 and over undertake at least 150
minutes per week of moderate aerobic activity. This is broadly equivalent to undertaking at least 30
minutes or more of moderate intensity physical activity on at least five days a week (which can be more
precisely measured using the survey question). Figure 4.6 details the rates of participants who were
‘active’ against this measure at each wave of the survey.
Figure 4.6 Percentage doing at least 30 minutes of moderate activity on five days or more
Source: Evaluation of Walking for Health surveys
Base: Constant sample (n = 232)
Changes in this outcome mirror the general trend in the physical activity rate. At Wave 1, 20.3% of
participants were meeting the 5x30 min target, at Wave 2, 37.5%, and at Wave 3, 22.8%. There was no
statistically significant difference between Waves 1 and 3; however there was a statistically significant
increase between Waves 1 and 2 (p<0.05), and a statistically significant decrease between Waves 2 and
3 (p<0.05). This suggests that the programme may have an initial continued positive effect on moving
some people who are less active towards meeting the 5x30 minute target, but that the aggregate
percentage of those who are ‘active’ then drops back to the level immediately after first joining Walking for
Health.
Data from the Health Survey for England (from prior to when the revised 150 minute guidelines were
published) indicates that 40% of men and 28% of women undertake at least 5x30 minutes of activity;
however this declines significantly with age87
. A comparison with more recent data from the Welsh Health
Survey, which still reports on the 5x30 minute measure, suggests that levels amongst those aged 55-64
are as low as 34% for men and 23% for women, and for men and women aged 65-74, 27% and 18%
respectively (this compared with 37% of all men and 23% of all women in Wales)88
. Positively, when the
Walking for Health survey results were analysed by those respondents aged 65 years or over, the same
trend and proportions of participants reporting five or more days of moderate activity are observed; there
is no drop off amongst the older age group.
87
Chief Medical Officers (2011), Start active, stay active: a report on physical activity for health from the four home
countries’ 88
Welsh Government (2014) Welsh Health Survey

50
Figure 4.7 Percentage aged 65+ doing at least five days of 30 minutes or more moderate activity
Source: Evaluation of Walking for Health surveys
Base: Constant sample (n = 232)
The percentage of participants undertaking three or more days of moderate intensity activity was also
analysed to allow comparison with a previous evaluation of the programme by Phillips et al (2010)89
,
which reported a decrease in moderate physical activity for walkers on the programme over 9 months.
The survey results for this evaluation (Figure 4.8) show that the proportion of participants doing three
days or more of physical activity was at least maintained rather than decreased, ranging from 40.9% at
Wave 1 to 59.5% at Wave 2 and 45.7% at Wave 3. There was no statistically significant difference
between Wave 1 and Wave 3; however there was a statistically significant increase between Wave 1 and
Wave 2 (p<0.001), and a statistically significant decrease between Waves 2 and 3 (p<0.01). The previous
evaluation of the programme also reported a higher decline in moderate intensity activity for those aged
65 and over.
89
Philips, R., Knox, A. and Langley, E. (2012), What impact did Walking for Health have on the physical activity
levels of participants? Natural England Commissioned Reports, Number 075. Note that while Philips et al used the
same measure for self-reported, moderate physical activity, they used a different approach to data collection and
analysis, with an average of four reports of moderate activity over nine months being compared to activity reported
through the Walking for Health Outdoor Health Questionnaire on joining Walking for Health.

51
Figure 4.8 Percentage doing at least 30 minutes of moderate activity on three days or more
Source: Evaluation of Walking for Health surveys
Base: Constant sample (n = 232)
Finally, the current UK guidelines for physical activity recommend that all adults should minimise the
amount of time spent being sedentary for extended periods. Figure 4.9 shows trends in mean of minutes
per day spent sitting. There was a relatively small, but statistically significant, increase in daily time spent
sitting between Wave 1 and Wave 2 (mean 275 minutes increasing to 306 minutes, p<0.001), and
between Wave 1 and Wave 3 (mean 275 minutes at Wave 1 to 296 minutes at Wave 3, p<0.05).
It is possible for people both to increase their weekly moderate physical activity and the time spent sitting,
since they may also reduce their time spent undertaking less intensive (i.e. lighter) physical activity in
parallel with this. It is not clear from a review of the literature how far any additional time spent sitting may
offset the health gains associated with increased moderate-level activity.
However, 275 minutes is equivalent to around 4.5 hours per day of sitting at Wave 1. Comparable figures
for the national population are that half of 65-74 year olds spend 6 hours or more a day sitting (weekday
or weekend)90
. Only around 20% of those aged 65-74 spend less than 4 hours per day sitting. Despite
evidence of a slight increase in sitting, this further suggests that Walking for Health can help older age
groups in particular to remain more active, in this case through minimising sedentary behaviour relative to
the population overall.
90
Townsend N, Wickramasinghe K, Williams J, Bhatnagar P, Rayner M (2015). Physical Activity Statistics 2015.
British Heart Foundation: London.

52
Figure 4.9 Mean reported minutes per day typically spent sitting
Source: Evaluation of Walking for Health surveys
Base: Constant sample (n = 232)
4.2.3 Contribution and impact of Walking for Health
4.2.3.1 Maintaining physical activity
The survey analysis found that improvements in activity and walking amongst new walkers tended to
occur between Waves 1 and 2 (up to four months after baseline) before falling back at Wave 3 (up to
eight months after baseline). While the findings do not show a continued increase in walking and physical
activity over the period, when participation rates were tested at Wave 3 the level of activity had
nonetheless not dropped below that at the baseline (taken immediately after the participants’ first walk).
Rather, participants maintain a certain level of weekly physical activity whilst taking part in Walking for
Health walks (identified in the previous chapter as occurring on average weekly, and of 60 minutes
duration) over an eight month period (at least), which is a positive finding given the age group engaged.
Further evidence suggests that for some participants it is Walking for Health that is contributing to the
maintenance of activity
It is not possible to provide a definitive explanation for diverging patterns of activity between Waves 1 and
2, and Waves 2 and 3 of the survey, since the phasing of the evaluation activities did not allow for
systematic research into the reasons behind the drop-off in activity. One possible explanation is that the
programme initially drives up walkers’ physical activity due to their initial enthusiasm and interest in trying
out the different walking opportunities on offer; however over time walkers exercise their preferences and
settle into more manageable levels of activity. The precise reasons for the drop off after four months
could provide a useful focus for future research.
0
50
100
150
200
250
300
350
400
Wave 1 Wave 2 Wave 3
Min
ute
s
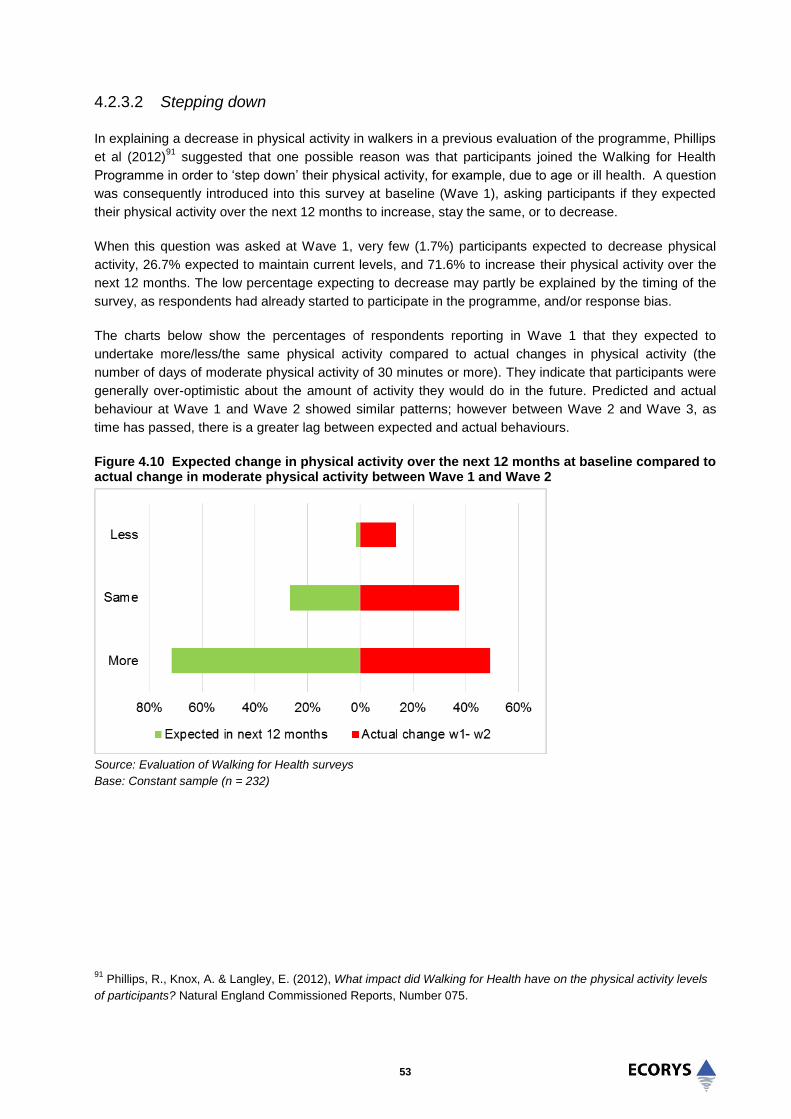
53
4.2.3.2 Stepping down
In explaining a decrease in physical activity in walkers in a previous evaluation of the programme, Phillips
et al (2012)91
suggested that one possible reason was that participants joined the Walking for Health
Programme in order to ‘step down’ their physical activity, for example, due to age or ill health. A question
was consequently introduced into this survey at baseline (Wave 1), asking participants if they expected
their physical activity over the next 12 months to increase, stay the same, or to decrease.
When this question was asked at Wave 1, very few (1.7%) participants expected to decrease physical
activity, 26.7% expected to maintain current levels, and 71.6% to increase their physical activity over the
next 12 months. The low percentage expecting to decrease may partly be explained by the timing of the
survey, as respondents had already started to participate in the programme, and/or response bias.
The charts below show the percentages of respondents reporting in Wave 1 that they expected to
undertake more/less/the same physical activity compared to actual changes in physical activity (the
number of days of moderate physical activity of 30 minutes or more). They indicate that participants were
generally over-optimistic about the amount of activity they would do in the future. Predicted and actual
behaviour at Wave 1 and Wave 2 showed similar patterns; however between Wave 2 and Wave 3, as
time has passed, there is a greater lag between expected and actual behaviours.
Figure 4.10 Expected change in physical activity over the next 12 months at baseline compared to actual change in moderate physical activity between Wave 1 and Wave 2
Source: Evaluation of Walking for Health surveys
Base: Constant sample (n = 232)
91
Phillips, R., Knox, A. & Langley, E. (2012), What impact did Walking for Health have on the physical activity levels
of participants? Natural England Commissioned Reports, Number 075.

54
Figure 4.11 Expected change in physical activity over the next 12 months at baseline, compared to actual change in moderate physical activity between Wave 1 and Wave 3
Source: Evaluation of Walking for Health surveys
Base: Constant sample (n = 232)
In practice, many of the case study interviews with walkers showed how Walking for Health schemes had
provided opportunities for older walkers to step down from more vigorous physical activity. Whilst this
may involve a reduction in some form (frequency, duration and/or intensity of activity), illustrative
examples from the case study work supports the overall analysis that Walking for Health is effective in
allowing people to maintain a certain level of participation in physical activity as their health changes. The
case studies highlighted many examples of walkers who had been active in the past (including walking,
swimming, sailing) but who, due to old age and diminished health, were no longer able to maintain past
levels. The schemes therefore allowed older participants to continue to be physically active and enjoy
outside activities, but at a more appropriate level considering their current capabilities and level of
ambition to take part in physical activity. For example one walker who was in his late 80s said he had
been a keen walker all of his life. He started participating in the Walking for Health programme just under
one year prior to the interview because his health had required him to step down from longer and more
challenging walks. He was finding that the walk is still good for exercise and thinks that the pace of the
walk is “just about right”; however he also enjoys the company.
4.2.3.3 Additionality of Walking for Health outcomes
Outcomes amongst those that continued with the programme at Wave 2 were compared with those that
had ceased participating in Walking for Health, in order to help assess the counterfactual position (i.e.
how far these outcomes would have occurred in the absence of taking part in Walking for Health). This
evidence is less conclusive. Those continuing reported more days of moderate activity at Wave 1 (means
2.59/1.52 days, p<0.005); other differences however were not statistically significant (figure 4.12).
-80% -60% -40% -20% 0% 20% 40% 60% 80%
More
Same
Less
Expected in next 12 months actual 1-3
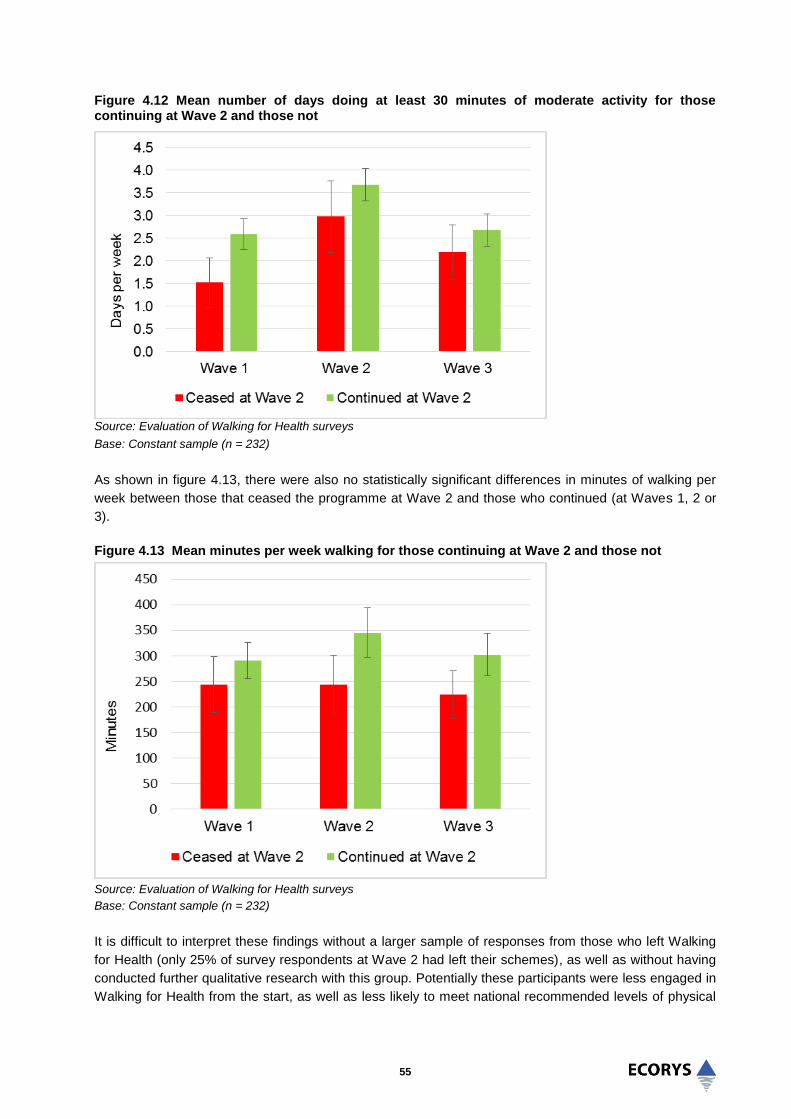
55
Figure 4.12 Mean number of days doing at least 30 minutes of moderate activity for those continuing at Wave 2 and those not
Source: Evaluation of Walking for Health surveys
Base: Constant sample (n = 232)
As shown in figure 4.13, there were also no statistically significant differences in minutes of walking per
week between those that ceased the programme at Wave 2 and those who continued (at Waves 1, 2 or
3).
Figure 4.13 Mean minutes per week walking for those continuing at Wave 2 and those not
Source: Evaluation of Walking for Health surveys
Base: Constant sample (n = 232)
It is difficult to interpret these findings without a larger sample of responses from those who left Walking
for Health (only 25% of survey respondents at Wave 2 had left their schemes), as well as without having
conducted further qualitative research with this group. Potentially these participants were less engaged in
Walking for Health from the start, as well as less likely to meet national recommended levels of physical

56
activity. This is supported by Figure 4.14 below, which highlights how those that ceased participation in
Walking for Health reported more minutes per day spent sitting at every wave, and that this was
statistically significant at Wave 2 (means 354.5 minutes, 293.8 minutes, p<0.05).
Figure 4.14 Mean reported minutes per day typically spent sitting for those continuing at Wave 2 and those not
Source: Evaluation of Walking for Health surveys
Base: Constant sample (n = 232)
Another corroborating theme that emerged from the survey and qualitative analysis was the frequency
with which people ceased walking because of health problems; however this may not always have been
permanently:
“They are excellent; I only stopped because of problems with my foot.”
(Walker: female, 65+, disabled) “I am just getting over an operation, but as soon as I feel fit enough I shall be joining the group
again in the near future.”
(Walker: male, 65+)
Given the increase in physical activity at Wave 2 it is also possible that some scheme leavers took up
another activity in place of Walking for Health. Confirming this, table 3.6 previously indicated that amongst
those who had left Walking for Health, 24% were continuing to walk alone or with friends, 11% had taken
up some other physical activity, and 3% had joined another walking group.
What precisely motivated those who left the scheme to take up another activity is unknown (evidence of
positive displacement is considered below); however these findings broadly reflect the survey responses
to a further question designed specifically to test (albeit somewhat speculatively) the additional
contribution of Walking for Health to changes in physical activity. The specific question asked was
‘Without the Walking for Health scheme, do you think you would have still
increased/decreased/maintained your physical activity by the same amount?’ (the available responses
were ‘Definitely not’, ‘Probably not’, ‘Probably yes’, ‘Definitely yes’ and ‘Don’t know’).
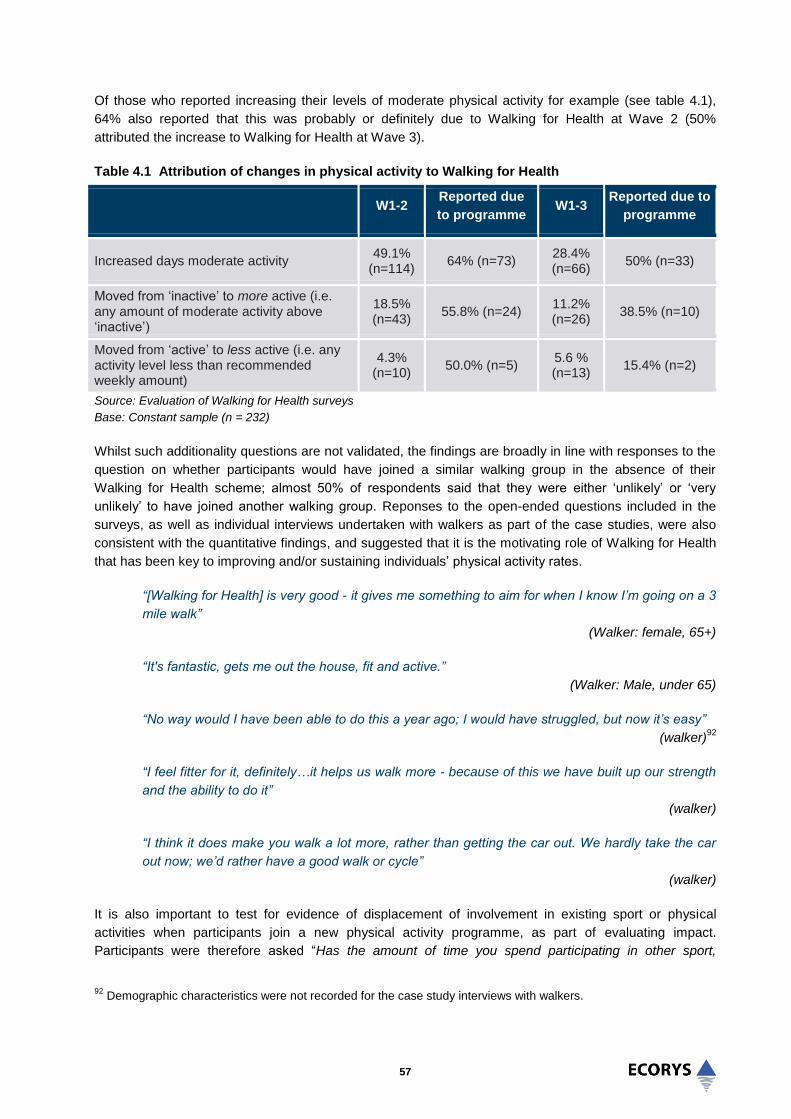
57
Of those who reported increasing their levels of moderate physical activity for example (see table 4.1),
64% also reported that this was probably or definitely due to Walking for Health at Wave 2 (50%
attributed the increase to Walking for Health at Wave 3).
Table 4.1 Attribution of changes in physical activity to Walking for Health
W1-2 Reported due
to programme W1-3
Reported due to
programme
Increased days moderate activity 49.1%
(n=114) 64% (n=73)
28.4% (n=66)
50% (n=33)
Moved from ‘inactive’ to more active (i.e. any amount of moderate activity above ‘inactive’)
18.5% (n=43)
55.8% (n=24) 11.2% (n=26)
38.5% (n=10)
Moved from ‘active’ to less active (i.e. any activity level less than recommended weekly amount)
4.3% (n=10)
50.0% (n=5) 5.6 % (n=13)
15.4% (n=2)
Source: Evaluation of Walking for Health surveys
Base: Constant sample (n = 232)
Whilst such additionality questions are not validated, the findings are broadly in line with responses to the
question on whether participants would have joined a similar walking group in the absence of their
Walking for Health scheme; almost 50% of respondents said that they were either ‘unlikely’ or ‘very
unlikely’ to have joined another walking group. Reponses to the open-ended questions included in the
surveys, as well as individual interviews undertaken with walkers as part of the case studies, were also
consistent with the quantitative findings, and suggested that it is the motivating role of Walking for Health
that has been key to improving and/or sustaining individuals’ physical activity rates.
“[Walking for Health] is very good - it gives me something to aim for when I know I’m going on a 3
mile walk”
(Walker: female, 65+)
“It's fantastic, gets me out the house, fit and active.”
(Walker: Male, under 65)
“No way would I have been able to do this a year ago; I would have struggled, but now it’s easy”
(walker)92
“I feel fitter for it, definitely…it helps us walk more - because of this we have built up our strength
and the ability to do it”
(walker)
“I think it does make you walk a lot more, rather than getting the car out. We hardly take the car
out now; we’d rather have a good walk or cycle”
(walker)
It is also important to test for evidence of displacement of involvement in existing sport or physical
activities when participants join a new physical activity programme, as part of evaluating impact.
Participants were therefore asked “Has the amount of time you spend participating in other sport,
92
Demographic characteristics were not recorded for the case study interviews with walkers.

58
exercise or walking activities increased, decreased or stayed the same?” The responses can be found in
the charts below (4.15-16) for those that continued on the programme, and for those that ceased
participation at Wave 2 (there are no significant differences). There is limited evidence from these
responses of negative displacement.
Figure 4.15 Participation in other physical activity at Wave 2, for those continuing at Wave 2 and those not
Source: Evaluation of Walking for Health surveys
Base: Constant sample (n = 232)
Figure 4.16 Participation in other physical activity at Wave 3, for those continuing at Wave 2 and those not
Source: Evaluation of Walking for Health surveys
Base: Constant sample (n = 232)
Conversely, some participants reported increased time spent on other activities. Participants were asked
which specific sport or exercise activities they had usually participated in since joining Walking for Health.
The open-ended responses at Wave 3 have been summarised into the following main categories (only

59
categories with 5 or more responses are included; some respondents participated in more than one
activity).
Table 4.2 Types of physical activity participated in since joining Walking for Health
Response Wave 3
Walking (including ‘dog-walking’) 41.6%
Gardening 10.5%
Swimming 7.7%
Keep-fit / exercise classes (including 3 ‘aqua-aerobics) 7.7%
Bowling (including indoor bowls) 6.2%
Cycling 4.8%
Yoga 4.3%
Dancing (including 3 ‘line-dancing’) 4.3%
Golf 3.8%
Tai-chi 3.3%
Gym (this could possibly include exercise classes) 3.3%
Tennis 2.4%
Source: Evaluation of Walking for Health surveys
Base: Number respondents = 222; Number of responses in categories with more than 5 responses = 209
As noted above it is unclear from the survey data the extent to which participation in other activities is
causally associated with Walking for Health (i.e. positive displacement). The case studies provided some
examples of schemes giving confidence to walkers to try new physical activities such as curling, bowling,
tennis and community gardening, thereby facilitating participants to step-up to more vigorous activities
and to increase their physical activity levels overall. However, a general finding from the case studies was
that schemes generally do not have formal links with other groups or sport/physical activity providers, to
which people who may wish to increase (or change their type activity) could be signposted. Walks are
generally provided as standalone activities, and not as part of a pathway towards greater physical activity.
This reflects the predominant finding from the displacement analysis, that 70% of respondents maintained
the same level of participation in other physical activities, despite joining Walking for Health – overall
displacement in either direction was minimal.
In the absence of a true counterfactual that would pinpoint the specific impact of Walking for Health on
people’s physical activity rates, it cannot be estimated precisely how far changes (including the
maintenance of physical activity) are attributable to the programme. However, the overall weight of
evidence available to the evaluation suggests that Walking for Health plays a positive role in helping to
increase or maintain physical activity levels for a significant minority if not majority of its participants.
One lesson for future evaluations of Walking for Health is to ask more specific questions at the baseline
stage regarding participants’ pre-existing levels of activity, and in particular the type of activities that they
were taking part in, and to link this to their motivations for taking part.

60
4.3 Social outcomes
This section examines the social outcomes of Walking for Health. The analysis explores the effects of
Walking for Health on specific measures of mental wellbeing and social interaction over the eight month
period of the surveys. Four measures relating to social outcomes are analysed. In three of the four,
statistically significant changes were detected when comparing Wave 1 data to Wave 3 (at eight months).
These show a small positive change in mental wellbeing, a reduction in respondents’ levels of loneliness
and an increase in social interaction. There was no statistically significant change in overall life
satisfaction.
In order to provide further evidence of causality, participants were asked whether or not they felt changes
in life satisfaction were due to the programme. A majority of those showing an improvement in life
satisfaction attributed this to the programme.
Qualitative feedback from the case studies indicates that the social aspects of the walk are very important
for many participants. Positive comments about the social aspects of the walks were also markedly the
most common type of comment in the open-ended survey data. The qualitative feedback also
demonstrates the particular social benefits of Walking for Health to older people, widows and people with
learning disabilities.
4.3.1 Mental wellbeing
The primary change in mental wellbeing was assessed by looking at trends in scores computed from the
Warwick Edinburgh Mental Wellbeing Scale (WEMWBS) Figure 4.17 shows the mean scores for
WEMWBS across the three waves of the survey. The scores for each wave were 25.7 at Wave 1, 25.2 at
Wave 2, and 28.3 at Wave 3. The results show a statistically significant difference between Wave 1 and
Wave 3 (p<0.001), and a positive shift towards the maximum score that any individual can gain on
WEMWBS (35).
Figure 4.17 Mean Warwick Edinburgh Mental Wellbeing Scale scores
Source: Evaluation of Walking for Health surveys
Base: Constant sample (n = 232)
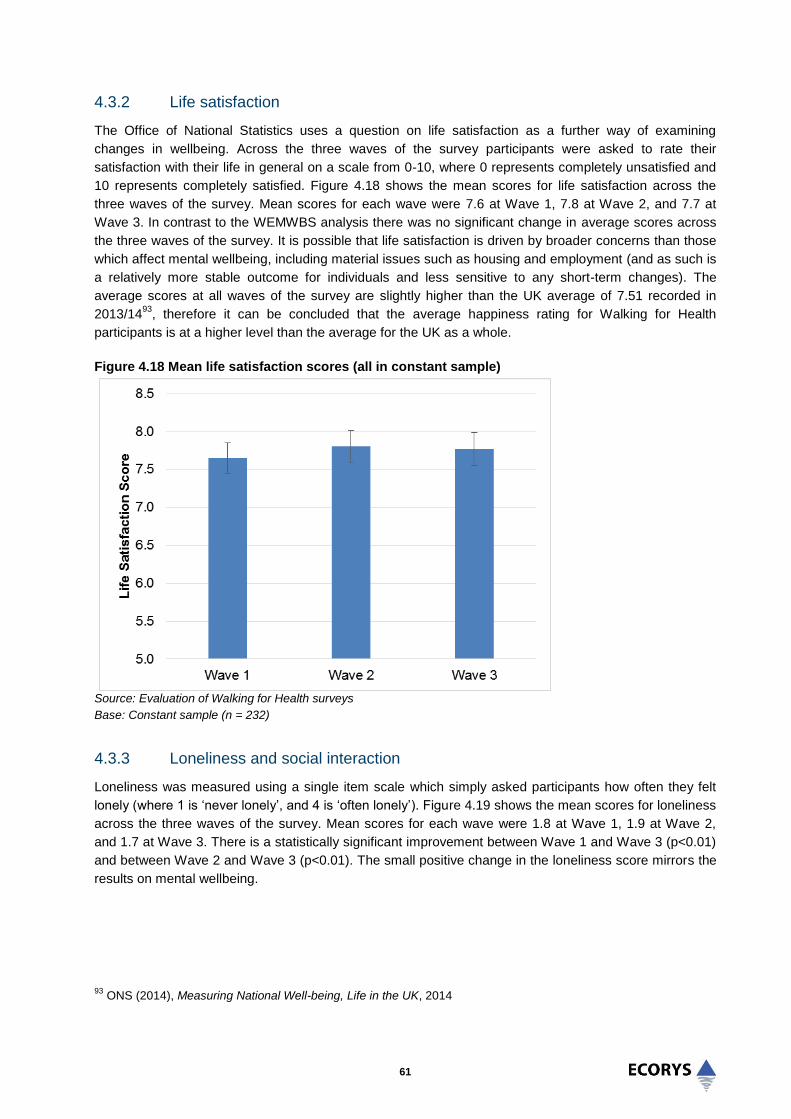
61
4.3.2 Life satisfaction
The Office of National Statistics uses a question on life satisfaction as a further way of examining
changes in wellbeing. Across the three waves of the survey participants were asked to rate their
satisfaction with their life in general on a scale from 0-10, where 0 represents completely unsatisfied and
10 represents completely satisfied. Figure 4.18 shows the mean scores for life satisfaction across the
three waves of the survey. Mean scores for each wave were 7.6 at Wave 1, 7.8 at Wave 2, and 7.7 at
Wave 3. In contrast to the WEMWBS analysis there was no significant change in average scores across
the three waves of the survey. It is possible that life satisfaction is driven by broader concerns than those
which affect mental wellbeing, including material issues such as housing and employment (and as such is
a relatively more stable outcome for individuals and less sensitive to any short-term changes). The
average scores at all waves of the survey are slightly higher than the UK average of 7.51 recorded in
2013/1493
, therefore it can be concluded that the average happiness rating for Walking for Health
participants is at a higher level than the average for the UK as a whole.
Figure 4.18 Mean life satisfaction scores (all in constant sample)
Source: Evaluation of Walking for Health surveys
Base: Constant sample (n = 232)
4.3.3 Loneliness and social interaction
Loneliness was measured using a single item scale which simply asked participants how often they felt
lonely (where 1 is ‘never lonely’, and 4 is ‘often lonely’). Figure 4.19 shows the mean scores for loneliness
across the three waves of the survey. Mean scores for each wave were 1.8 at Wave 1, 1.9 at Wave 2,
and 1.7 at Wave 3. There is a statistically significant improvement between Wave 1 and Wave 3 (p<0.01)
and between Wave 2 and Wave 3 (p<0.01). The small positive change in the loneliness score mirrors the
results on mental wellbeing.
93
ONS (2014), Measuring National Well-being, Life in the UK, 2014
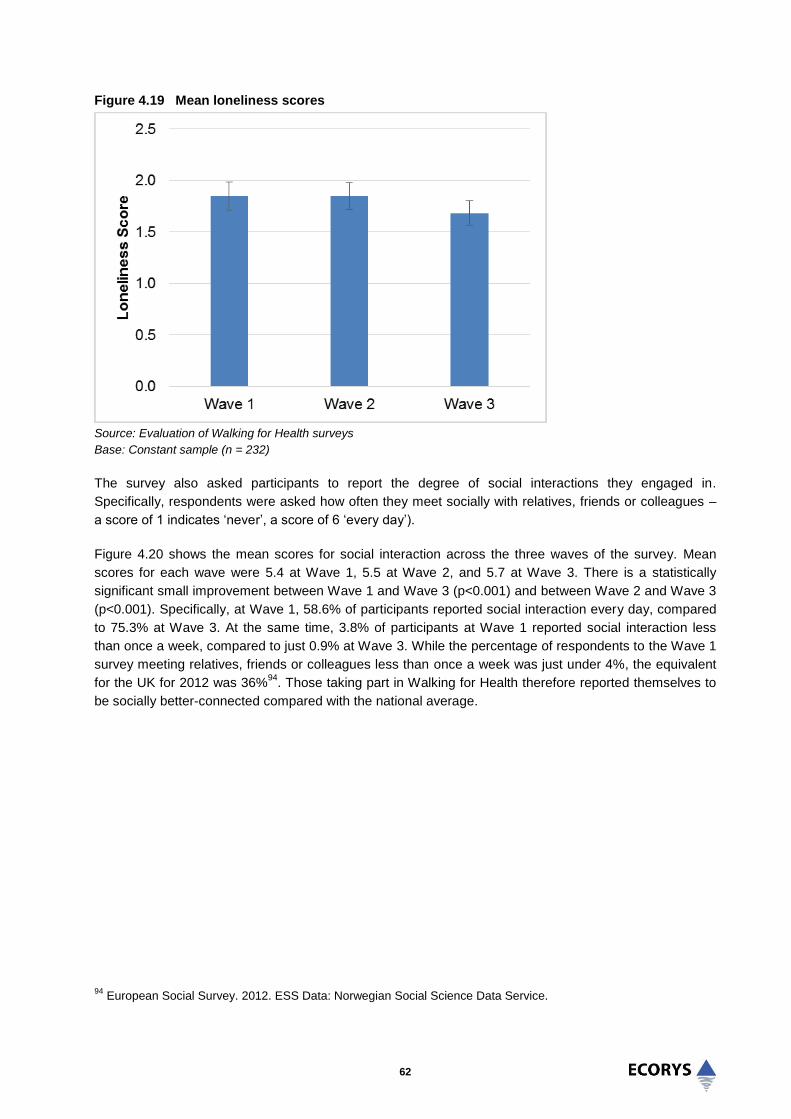
62
Figure 4.19 Mean loneliness scores
Source: Evaluation of Walking for Health surveys
Base: Constant sample (n = 232)
The survey also asked participants to report the degree of social interactions they engaged in.
Specifically, respondents were asked how often they meet socially with relatives, friends or colleagues –
a score of 1 indicates ‘never’, a score of 6 ‘every day’).
Figure 4.20 shows the mean scores for social interaction across the three waves of the survey. Mean
scores for each wave were 5.4 at Wave 1, 5.5 at Wave 2, and 5.7 at Wave 3. There is a statistically
significant small improvement between Wave 1 and Wave 3 (p<0.001) and between Wave 2 and Wave 3
(p<0.001). Specifically, at Wave 1, 58.6% of participants reported social interaction every day, compared
to 75.3% at Wave 3. At the same time, 3.8% of participants at Wave 1 reported social interaction less
than once a week, compared to just 0.9% at Wave 3. While the percentage of respondents to the Wave 1
survey meeting relatives, friends or colleagues less than once a week was just under 4%, the equivalent
for the UK for 2012 was 36%94
. Those taking part in Walking for Health therefore reported themselves to
be socially better-connected compared with the national average.
94
European Social Survey. 2012. ESS Data: Norwegian Social Science Data Service.

63
Figure 4.20 Mean social interaction scores
Source: Evaluation of Walking for Health surveys
Base: Constant sample (n = 232)
A large proportion of the qualitative comments from the surveys reflected on the social benefits of taking
part in Walking For Health, and on the friendliness of other walkers; this was clearly the most common
theme arising from the open survey responses:
“The people I have met are the nicest anyone can meet.”
(Walker: male, 65+)
“It’s a lovely way to meet people, getting out, and having new experiences.”
(Walker: female, under 65)
For some people and particularly those who had recently moved into the area, or who lived on their own,
the opportunity to meet new people was particularly important:
“I enjoy being part of the walking group, being with the other members of the group is very nice
for me, as I am living on my own now.”
(Walker: 65+, female)
“The walks have helped me, I moved to this country 12 months ago and the walks helped me to
be more active and meet people.”
(Walker: under 65, female)
Case study evidence based on focus groups and one to one interviews with walkers provided additional
qualitative evidence on the effects of the Walking for Health programme in reducing social isolation and
loneliness amongst older people. Amongst those walkers interviewed for the case studies, exercise was
generally regarded as the most important motivation for taking part in the walks, but meeting new people
was also important. Indeed, many participants valued social interaction as the key benefit they derived
from Walking for Health.

64
“…it has enriched my social life.”
(Walker)
“When I retired I wanted to meet new people; [through the walks] you meet a lot of people in the
same boat and you can learn a lot about local history and locations.”
(Walker)
“I enjoy the walking but I also enjoy the socialising.”
(Walker)
“The social side is as important, we have a coffee break and people walk with each other and mix
and match, that is very important…They like the social side as well as the exercise, they are both
important for health patients. The men like to walk together”
(Walk leader)
There was evidence of people socialising outside of Walking for Health walks, and even holidaying
together.
“They also do summer events, go to the cinema together, meals. It’s fantastic for people socially,
massively social for people on their own…It all expands from the walk, it all happens because
they have met here and made friends, and they go on to do other things, it’s brilliant”
(Scheme coordinator)
“It’s just nice to meet some new people…we have a raffle and a social night and a meal”
(Walker)
The case studies also provided corroborating evidence of Walking for Health schemes helping people
who had relocated to a new area to ‘settle in’ and to get to know their local area. Examples from the case
studies showed how the walks can help people to learn about their neighbourhood – one walker said that
she found it exciting to discover and explore new things, and to ‘get off the beaten track’.
A particularly positive finding from the case study research is that Walking for Health is providing
opportunities for inter-generational interaction. Older people particularly valued the opportunity to
converse with younger people over the shared interest of walking. Specifically in terms of mental
wellbeing, there was also evidence that attending the walks has helped in reducing the isolation of
recently bereaved older people:
“I lost my husband three and half years ago so you look for things to do to meet new people.”
(Walker)
“He had his rehabilitation with us twice a week. He lost his wife so his friend told him to come out
on the walks with us as he was very depressed and isolated. At first he didn’t speak to anyone
but now he does. We do get widows and widowers come along and they do integrate in”
(Walk leader)
For example, one walker used to walk with her husband and is now a widow. The opportunity to take part
in a group activity was key to her taking part, and has been vital to her enjoyment. The walk has enabled
her to make new friendships and has encouraged her to take part in other social activities outside of the
walk. She now goes on holiday with another walker and has recently been away together for weekends
with three other walkers.

65
According to carers interviewed for the case studies, participants with learning difficulties have also
benefited from Walking for Health in terms of giving them an opportunity to interact in a low-key way:
“It boosts their self-confidence, and it is transferable, they will talk to people they know a bit, and
then there will be new people. They might be nervous about going initially…it improves their
verbal skills and ability to cross the road, turn taking, not just pushing past people, and then
getting back and having a coffee and a chat”
(Carer)
The cumulative evidence from walkers and walk leaders was found to support the more general claims of
Walking for Health stakeholders, who view group walking as being beneficial for reducing social isolation
amongst both the public and for people with particular health conditions. One national charity highlighted
the value of group walking for mental health patients:
“Social interaction should never be underestimated in improving the determinants of health…The
group aspect of the walks is hugely important”
(National stakeholder)
This view was echoed by local authority representatives involved in the commissioning of Walking for
Health:
“We see it as an important part of our physical activity offer….low level activity and reducing
social isolation, they are the main benefits of walking”
(Local authority representative)
4.3.4 Contribution and Impact of Walking for Health
Following the approach for physical activity, outcomes amongst those that continued with the programme
at Wave 2 (four months) were compared with those that had ceased participating in Walking for Health, in
order to help assess the counterfactual position (i.e. how far these outcomes would have occurred in the
absence of taking part in Walking for Health). As shown in figure 4.21, there was no statistically significant
difference between the two groups at any of the waves. Aside from the small sample size (meaning
greater margin for error), it could be that even short-term participation in Walking for Health can have a
positive effect on wellbeing as it is possible that the programme provides an initial impetus to trying new
activities and meeting new people which in themselves can generate improved wellbeing (as explored in
the qualitative analysis above). Equally, and particularly given that based on their general characteristics
Walking for Health participants tend to be healthier, relatively active and less deprived, it could be that
participation in Walking for Health are just one of a number of positive factors contributing towards the
overall wellbeing of participants.
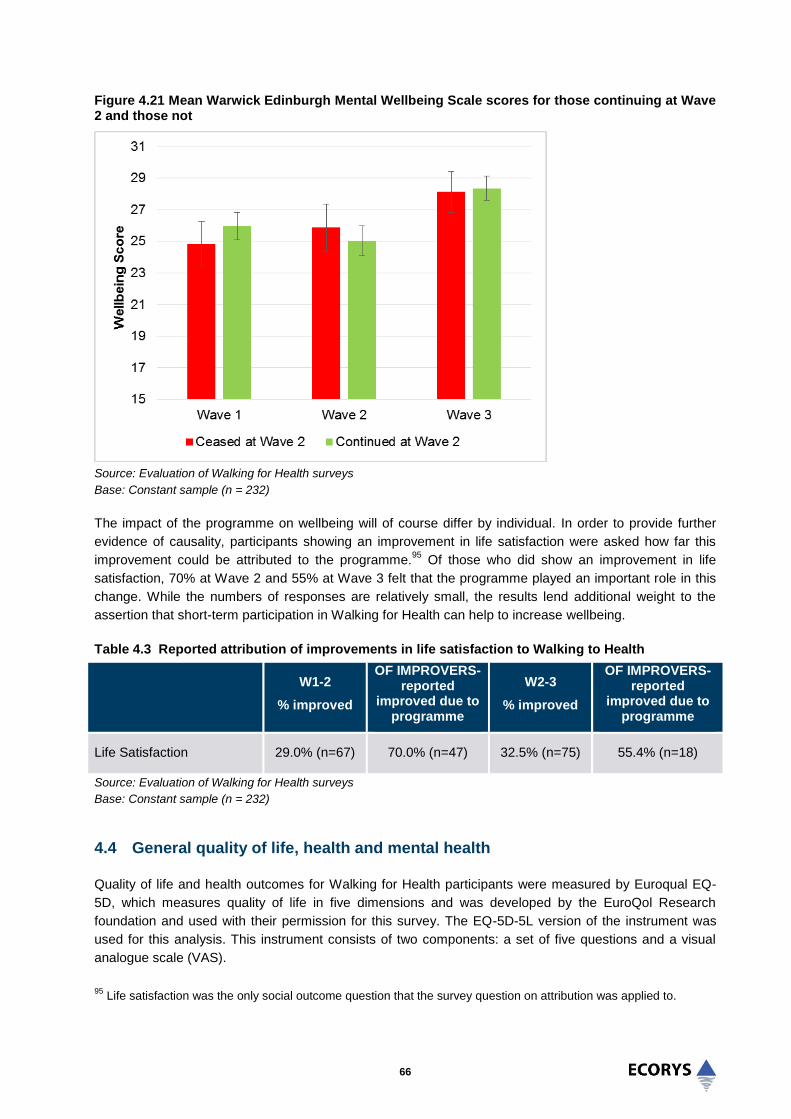
66
Figure 4.21 Mean Warwick Edinburgh Mental Wellbeing Scale scores for those continuing at Wave 2 and those not
Source: Evaluation of Walking for Health surveys
Base: Constant sample (n = 232)
The impact of the programme on wellbeing will of course differ by individual. In order to provide further
evidence of causality, participants showing an improvement in life satisfaction were asked how far this
improvement could be attributed to the programme.95
Of those who did show an improvement in life
satisfaction, 70% at Wave 2 and 55% at Wave 3 felt that the programme played an important role in this
change. While the numbers of responses are relatively small, the results lend additional weight to the
assertion that short-term participation in Walking for Health can help to increase wellbeing.
Table 4.3 Reported attribution of improvements in life satisfaction to Walking to Health
W1-2
% improved
OF IMPROVERS- reported
improved due to programme
W2-3
% improved
OF IMPROVERS- reported
improved due to programme
Life Satisfaction 29.0% (n=67) 70.0% (n=47) 32.5% (n=75) 55.4% (n=18)
Source: Evaluation of Walking for Health surveys
Base: Constant sample (n = 232)
4.4 General quality of life, health and mental health
Quality of life and health outcomes for Walking for Health participants were measured by Euroqual EQ-
5D, which measures quality of life in five dimensions and was developed by the EuroQol Research
foundation and used with their permission for this survey. The EQ-5D-5L version of the instrument was
used for this analysis. This instrument consists of two components: a set of five questions and a visual
analogue scale (VAS).
95
Life satisfaction was the only social outcome question that the survey question on attribution was applied to.

67
No significant changes were found for all participants when assessing responses for the EQ-5D general
health questionnaire, or for the EQ-5D VAS. Average scores for the respondents were similar to general
population scores.
There is some evidence of direct health benefits from the qualitative feedback gathered during the case
studies and from the surveys – these included a diverse range of examples from a smaller number of
participants, who felt that the programme had directly impacted upon their physical and mental health.
Figure 4.22 shows the mean score for the three survey waves for EQ-5D DS (a descriptive system,
comprising of five dimensions linked to quality of life and health). A higher score indicates poorer health.
Mean scores for each wave were 6.28 at Wave 1, 6.42 at Wave 2, and 6.46 at Wave 3. These scores are
not statistically significantly different.
Figure 4.22 Mean EQ-5D DS scores; a higher mean score signifies worse health
Source: Evaluation of Walking for Health surveys
Base: Constant sample (n = 232)
Figure 4.23 shows trends in EQ-5D VAS scores across the three survey waves; this asks respondents to
rate their health (on a scale of 1-100). Lower values indicate poorer reported health on the day of
interview. The mean VAS score at Wave 1 was 77.7, 79.1 at Wave 2 follow up, and 78.4 at Wave 3. The
differences in scores are not statistically significant. The scores appear similar to EQ-5D VAS norms for
the UK population for this age group, which are 81.7 for those aged 55-64, 77.3 for those aged 65-74,
and 73.8 for those aged 75+ (58% of the constant sample were aged 65 and over).96
96
Szende, A, Janssen, B., Cabases J (Eds), (2015), Self-Reported Population Health: An International Perspective,
Springer

68
Figure 4.23 Mean EQ-5D VAS scores (all in constant sample)
Source: Evaluation of Walking for Health surveys
Base: Constant sample (n = 232)
Whilst the survey generated limited quantitative evidence of direct health benefits; qualitative data and
case study interviewees provided a range of illustrative examples. The physical health benefits explained
by walkers consulted as part of the case studies included the following:
“I lost 11 pounds when I retired owing to increased walking – I wouldn’t have done that amount or
at that pace; it’s the continual walking that makes your heart rate increase”
(Walker)
“We [my partner and I] couldn’t walk before because we had asthma but now we can get up hills
and we don’t use our inhalers at all”
(Walker)
“I definitely feel healthier for coming along, it pushes you, quite a lot is uphill. I have a breathing
problem so I would probably give up if I was on my own. It pushes you to do that little bit extra”
(Walker)
One of the case studies, a medium-sized scheme, also demonstrated how Walking for Health had
improved the physical activity levels and health specifically of people with learning difficulties:
“The woman that I support has lost quite a bit of weight through the walking and she has also
increased her speed. She used to ask ‘when are we going back’ after 10 minutes but now she will
walk a lot further”
(Carer)
69
In a few examples, survey and case study respondents stated that the walks had helped with pre-existing
health problems or mental health (with the social aspects of the walks also having a positive effect on
participants’ mental health):
“I’m in rehabilitation at the moment, I suffer from Parkinson’s, and the walks are very good.”
(Walker: male, 65+, disabled)
“It’s just brilliant I would recommend it to everyone. I was type 2 diabetic; since joining the walking
scheme and a slimmer’s programme I am no longer diabetic and Walking for Health played a
great part in this… I now walk my dogs longer than before.”
(Walker: female, under 65)
“Joining the programme has saved my state of mind. The walk leaders always put in extra effort
for preparations and the walk itself; they give 1 to 1 to the walkers.”
(Walker: female, under 65)
“I do it to look after my health but it’s nice to get out and talk to people – this helps with my
depression.”
(Walker)
For example, one older walker who had suffered from osteoporosis said that the regular walking was
crucial to keeping her bones as strong as possible. She said that she aimed to walk at least three hours
every week and that the programme was helping to keep her exercise regular and patterned. Another
walker described how she had been suffering from depression and how her participation in Walking for
Health had helped her. The social contact and inclusiveness of the group was considered to have been a
very important aspect, but she also felt that the walks themselves gave people with mental health
problems an opportunity to get outside and forget their problems. This walker also reported reduced
stress levels and better sleep as a result of being part of the group.
4.4.1 Contribution and impact of Walking for Health
When comparing those that continued with the programme to those that ceased participating in Walking
for Health at Wave 2, a statistically significant difference was found for the EQ-5D DS score at Wave 2;
those continuing the programme at Wave 2 reported a lower score (and better health) than those that left
the programme (means 6.24, 7.15, p<0.05).
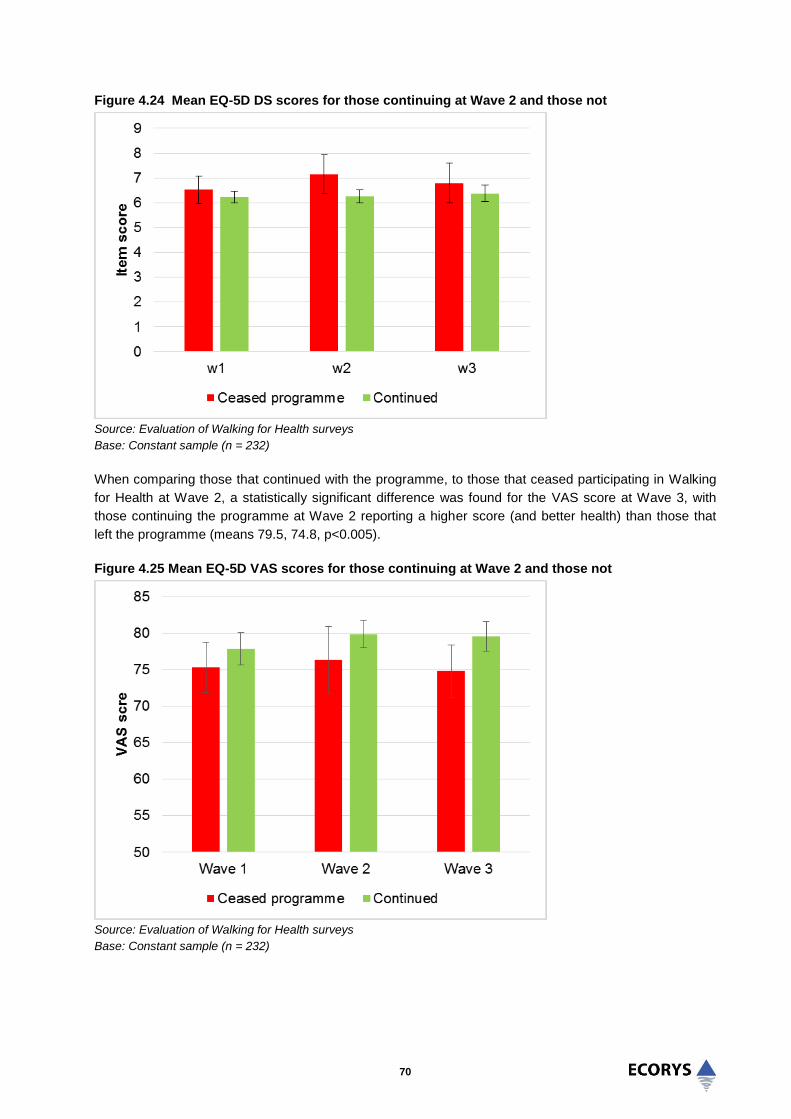
70
Figure 4.24 Mean EQ-5D DS scores for those continuing at Wave 2 and those not
Source: Evaluation of Walking for Health surveys
Base: Constant sample (n = 232)
When comparing those that continued with the programme, to those that ceased participating in Walking
for Health at Wave 2, a statistically significant difference was found for the VAS score at Wave 3, with
those continuing the programme at Wave 2 reporting a higher score (and better health) than those that
left the programme (means 79.5, 74.8, p<0.005).
Figure 4.25 Mean EQ-5D VAS scores for those continuing at Wave 2 and those not
Source: Evaluation of Walking for Health surveys
Base: Constant sample (n = 232)
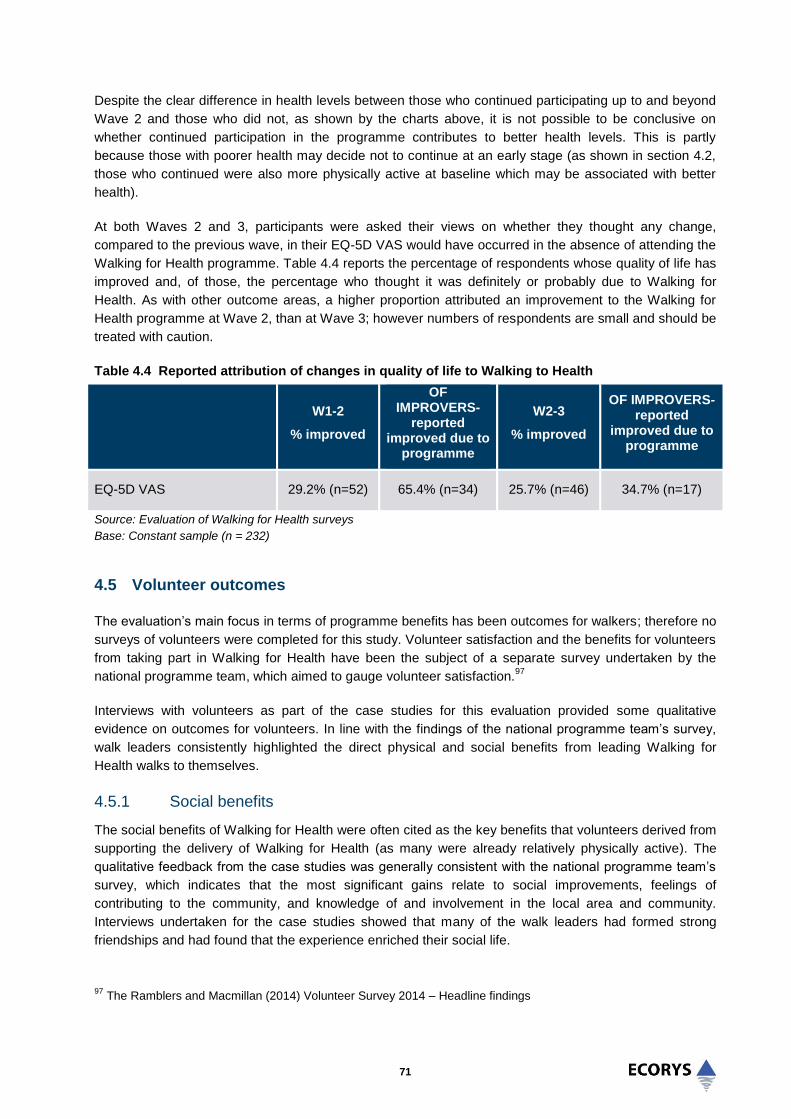
71
Despite the clear difference in health levels between those who continued participating up to and beyond
Wave 2 and those who did not, as shown by the charts above, it is not possible to be conclusive on
whether continued participation in the programme contributes to better health levels. This is partly
because those with poorer health may decide not to continue at an early stage (as shown in section 4.2,
those who continued were also more physically active at baseline which may be associated with better
health).
At both Waves 2 and 3, participants were asked their views on whether they thought any change,
compared to the previous wave, in their EQ-5D VAS would have occurred in the absence of attending the
Walking for Health programme. Table 4.4 reports the percentage of respondents whose quality of life has
improved and, of those, the percentage who thought it was definitely or probably due to Walking for
Health. As with other outcome areas, a higher proportion attributed an improvement to the Walking for
Health programme at Wave 2, than at Wave 3; however numbers of respondents are small and should be
treated with caution.
Table 4.4 Reported attribution of changes in quality of life to Walking to Health
W1-2
% improved
OF IMPROVERS-
reported improved due to
programme
W2-3
% improved
OF IMPROVERS- reported
improved due to programme
EQ-5D VAS 29.2% (n=52) 65.4% (n=34) 25.7% (n=46) 34.7% (n=17)
Source: Evaluation of Walking for Health surveys
Base: Constant sample (n = 232)
4.5 Volunteer outcomes
The evaluation’s main focus in terms of programme benefits has been outcomes for walkers; therefore no
surveys of volunteers were completed for this study. Volunteer satisfaction and the benefits for volunteers
from taking part in Walking for Health have been the subject of a separate survey undertaken by the
national programme team, which aimed to gauge volunteer satisfaction.97
Interviews with volunteers as part of the case studies for this evaluation provided some qualitative
evidence on outcomes for volunteers. In line with the findings of the national programme team’s survey,
walk leaders consistently highlighted the direct physical and social benefits from leading Walking for
Health walks to themselves.
4.5.1 Social benefits
The social benefits of Walking for Health were often cited as the key benefits that volunteers derived from
supporting the delivery of Walking for Health (as many were already relatively physically active). The
qualitative feedback from the case studies was generally consistent with the national programme team’s
survey, which indicates that the most significant gains relate to social improvements, feelings of
contributing to the community, and knowledge of and involvement in the local area and community.
Interviews undertaken for the case studies showed that many of the walk leaders had formed strong
friendships and had found that the experience enriched their social life.
97
The Ramblers and Macmillan (2014) Volunteer Survey 2014 – Headline findings
72
“It’s a very good social group. I think it’s more important to do it as a group than as an individual
because as a group you get more involved in the social side, talking, so whatever your problem is
you’re sharing your problem. So the social and walking side are both important.”
(Walk leader)
“We [my partner and I] live on our own so it’s having company… We got involved for the social
side, you give up working full-time and there’s a huge gap in your life”
(Walk leaders)
“We look forward to it…a lot of ladies say they wouldn’t want to walk on their own. And there’s
lots of new friendships been made through the walk”
(Walk leader)
4.5.2 Physical activity benefits
In terms of physical benefits, some walk leaders felt that the routine of walk leading had increased their
physical activity and fitness levels, and furthermore had encouraged them to try new activities:
“What Walking for Health has led me to do is take up other things that were happening in [the
local area]. I found out about their dancing classes, and then I’ve moved on to more advanced
dancing classes, so it’s opened lots of doors for me. I went into Walking for Health immediately
after I retired. I was a psychiatric social worker so I was out and about, but I wasn’t actually doing
a regular exercise programme”
(Walk leader)
“We do everything now, we joined the gym. We would like to get more fit….we also do swimming
classes and walk with the U3A, the Ramblers, we are full-time keeping fit…we do something
every day of the week, we’re never at home!”
(Walk leader)
It was also evident that Walking for Health provides an avenue for people that had overcome their own
health problems to act as role models for participants with similar conditions. One walk leader explained
how she had progressed from participating in her local scheme, to becoming a walk leader and acting as
a role model to others:
“I would never have attempted it (walk leading) if I hadn’t been walking so regularly. In the past I
had trouble getting out of chairs with my arthritis. I was so chuffed with myself”
(Walk leader)
4.5.3 Active citizenship
Corroborating the finding from the national programme team’s survey that 69% of volunteers were very
satisfied with their Walking for Health experience, walk leaders who were interviewed during the case
study visits appeared to be highly satisfied. The majority of these walk leaders interviewed had also been
volunteering on the walks for more than five years. A particularly rewarding part of their experience was
reported to be helping others and catering to the needs of different people, as one walk leader explained -
“I wanted to give something back to the community.” Many of the volunteers enjoyed meeting people from
diverse backgrounds and seeing their physical health improve. Volunteers of several schemes had
received awards for their involvement in Walking for Health, including ‘outstanding effort’ awards for
volunteer walk leaders from one community award scheme.
73
Volunteer walk leaders were highly satisfied with the training and support which is provided by the
programme. There is also a strong culture of exchanging information and learning amongst the volunteers
and walkers value this “strong team ethic”. Walk leaders were also highly positive about the support that
they received from the more experienced walk leaders when they started the role.
Walk leaders consistently valued the management and leadership function provided by scheme
coordinators. Generally, scheme coordinators also provided a clear ‘champion’ role, which steered and
galvanised the walk leaders.
4.6 Summary
Based on the findings of the survey and qualitative responses from the case studies, the following
conclusions can be made with respect to the participant outcomes of Walking for Health:
The Walking for Health programme is helping many participants to maintain their levels of physical
activity over the medium term (8 months+). Average levels of walking and physical activity at Wave 3
(8 months) did not drop below those at Wave 1, and furthermore half of the respondents reported it to
be unlikely that they would have joined a similar walking group in the absence of their local scheme.
Qualitative evidence points to the importance of Walking for Health in helping older people in
particular to maintain their levels of physical activity when stepping down from more vigorous or other
walking activities.
Pedometer research was undertaken to provide an objective measure of walking trajectories amongst
newly recruited Walking for Health participants. The results of this research were broadly consistent
with the survey findings on walking behaviour as it suggested that Walking for Health was allowing
participants to maintain their levels of walking at four months.
There are significant short-term overall increases in levels of weekly physical activity and walking
after first joining the programme; however these increases are generally not sustained. Statistically
significant increases in levels of walking (38.2 more minutes per week) and moderate physical activity
(1.17 extra days of at least 30 minutes per week) were detected through the survey after the four
month interval. However, at the eight month mark, physical activity levels had dropped back to those
immediately after the first walk. One possible explanation for this trend is that the initial enthusiasm of
walkers, as well as the opportunity to try out different types of walks offered by some Walking for
Health schemes, drives this initial increase, before walkers settle back into more manageable levels
of activity. A minority of respondents also dropped out of Walking for Health schemes altogether
(including some who were ‘inactive’ at Wave 1).
There was an improvement observed in a number of social measures between Wave 1 and Wave 3
of the survey. Improved scores were seen for general mental health (as measured by the Warwick
Edinburgh Mental Wellbeing Scale), loneliness, and social interaction. Overall life satisfaction did not
change. The qualitative responses through open-ended comments and more in-depth interviews in
the case studies suggest that the social aspects are an important benefit for many participants. In
their qualitative responses to the surveys and in the case study interviews participants valued the
opportunity for social interaction as a key benefit.

74
There was no overall evidence of improvements in reported in quality of life as measured by EQ-5D
DS scores. Similarly there was no improvement in self-reported health status, as measured by EQ-5D
VAS scores. Reflecting the findings above, participants continuing on the programme after four
months were generally healthier than those who ceased participation. This could either be because
ill-health caused individuals to leave the programme, or that the programme improved the health of
those that remained on it.
Corroborating the finding from the national programme team’s survey that 69% of volunteers were
very satisfied with their Walking for Health experience, walk leaders who were interviewed during the
case study visits appeared to be highly satisfied. The key benefits for Walking for Health volunteers
related to the social benefits of taking part, as well as increased levels of physical activity and active
citizenship benefits, in terms of the enjoyment and satisfaction derived from being able to give
something back to the community.
Comparison of outcomes between those continuing to participate and those ceasing at Wave 2
suggests that those who are more physically active and who regularly walk more, are more likely to
stay engaged in the programme. Greater effort needs to be made to retain those on Walking for
Health schemes who are less active to begin with, for example through providing more targeted and
intensive support for this group, and tailoring walks to their needs.

75
5.0 Economic Analysis of Walking for Health
5.1 Introduction
This chapter presents a set of economic assessments of the Walking for Health programme. The analysis
builds from a simple consideration of the costs of running the programme to more complex economic
analyses which take account of the programme’s costs and benefits.
The analysis in this chapter begins with a comparative assessment of the unit costs for the total numbers
of participants involved in Walking for Health. It then compares the short-term cost-effectiveness of the
programme with other schemes, based upon the conversion of physical activity outcomes at four months
into MET-hours gained per day. Finally, more complex cost-utility analysis is presented. This expresses
the longer-term return on investment (ROI) from the intervention in terms of NHS costs avoided as well as
cost per Quality-adjusted life years (QALYs) gained, following input of the scheme parameters into the
MOVES model (and in comparison with a similar group who did not participate). It is important to note that
the ROI calculation is underpinned by a number of assumptions, not least that participation is sustained
over time (in line with programme objectives). Sensitivity analysis is nonetheless conducted to assess
how varying this and other key assumptions impacts upon the cost-benefit ratio generated by MOVES.
The analysis of survey responses presented in the previous chapter covered a range of other outcomes
including mental wellbeing and social interaction. Physical activity is used as the key outcome measure in
the economic analysis since comparable cost-effectiveness benchmarks are more readily available for
this outcome, more robust work has been undertaken to place a financial value on undertaking physical
activity, and because in our view the maintenance of moderate physical activity levels is the clearest and
most attributable benefit of Walking for Health. Conversely there is limited evidence upon which to draw in
relation to the economic value of social effects such as increased social interaction and wellbeing. Finally,
the cost-utility analysis estimates the impact of Walking for Health on QALYs gained, which provide a
broad measure of quality of life. It should nonetheless be remembered, when considering the overall
value for money of Walking for Health that the benefits extend beyond increases physical activity.
5.2 Output-focused analysis
As explained in chapters two and three, annual programme costs can be calculated by aggregating the
cost to the Ramblers/Macmillan of running the national Walking for Health programme with overall local
scheme budget costs. The total programme costs to Macmillan and the Ramblers of running the Walking
for Health programme from 2012-15 were estimated to be £2,745,079. The annual funding for the
programme at national level is therefore assumed to be £915,026. The preferred method for assessing
scheme budgets is to consider responses to the 2013 Audit survey as this provides the most
comprehensive and up to date data. As set out in section 3.2, analysis of this data provides a revised
average scheme cost estimate of nearly £11,000 per annum.
A summary of the steps involved in calculating annual programme costs are set out in the table below:

76
Table 5.1 Estimation of programme costs
Steps in calculation
Figures
Average cost per scheme based on analysis of 2013 audit survey responses (A) £10,810
Estimated number of schemes in 2014-15 (B) 496
Total annual scheme costs (A x B) = C £5,361,760
Annual funding for national team (£2,745,079 divided by 3) (D) £915,026
Total annual programme costs (C + D) £6,276,786
Source: Ecorys analysis
Drawing on the expenditure analysis above and programme data, the unit cost calculation for Walking for
Health is set out in the table below. The estimated unit cost per participant (£76) provides a strong
indicator of the efficiency of the programme, as well as a basis for comparison (over time and with other
schemes).
Table 5.2 Derivation of programme unit costs
Annual programme expenditure
Key outputs
Unit cost
Total participants in Walking for Health (April 2014-March 2015)
Per participant in Walking for Health
£6,276,786 82,569 £76
Source: Ecorys analysis
For example, the estimated unit cost of Walking for Health is found to be closely aligned with that of the
Big Lottery Fund’s Fit as a Fiddle programme, which funded community based physical activities for older
people (including walking and exercise referral) across England. Ecorys’ 2012 evaluation found the unit
cost of Fit as a Fiddle to be £77.39. Similar to Walking for Health, unit costs at an individual scheme level
did vary significantly, from £36.56 to £408.12.98
5.3 Cost-effectiveness analysis
One considerable challenge in drawing cost-effectiveness comparisons with the results of other studies is
the diversity of outcome measures used. The cost of moving an individual from inactive to active was
initially considered for inclusion in the analysis here, yet it was not possible to identify directly comparable
benchmarks from similar interventions. Examples of other outcome measures used across studies which
have been subject to cost-effectiveness analysis include the number of additional steps taken per day,
precise changes in the minutes of moderate or vigorous physical activity undertaken per day, or the
percentage meeting physical activity guidelines. A further difficulty in comparative analysis is in the often
major differences in the size (number of participants) and duration (follow-up period) of the studies.
98
Ecorys UK and Centre for Social Gerontology, University of Keele (2013), Fit as a Fiddle Final evaluation report;
the estimation of costs did not include volunteer time.

77
One study that has attempted to make cost-effectiveness results from different studies comparable is Wu
et al (2012).99
Their pragmatic approach, which can be followed for Walking for Health, is to translate
outcomes recorded across a number of studies into the quantity of physical activity produced among the
population reached, measured in MET-hours (METs are a physiological measure expressing the energy
cost of physical activities100
). Several physical activity studies use MET-hours and most of the ones using
other measures can – under some assumptions – be transformed into the increase in MET-hours.
Wu et al firstly conducted a large scale systematic review of physical activity interventions to identify a
subset of interventions that a) are of some acceptable quality standard (according to the authors) and b)
have been shown to be effective in terms of increasing physical activity. They then further harmonised the
results of these studies to produce a comparable set of ‘cost-effectiveness’ results (expressed as ‘cost
per MET hour gained’). This sample provides a relevant set of cost-effectiveness benchmarks for Walking
for Health, albeit based upon a sample of successful interventions.
As mentioned above, the first step to making the evaluation results comparable to the studies in Wu et al
is to convert the outcome measure into MET-hours gained. One of the outcome measures used in
chapter four is the change in the number of physically active days per week, with ‘physically active days’
defined as days during which participants undertook “at least 30 minutes of moderate physical activity”.
Expressed in terms of MET hours, 30 minutes of moderate physical activity equates to at least 1.5 MET-
hours.
An important limitation of the approach adopted here is that we must restrict the analysis to increases in
physical activity four months after first participating in Walking for Health, since this provides a definitive
metric that can be converted into MET-hours. The analysis does not include the effects of the programme
in helping participants to maintain physical activity, which is highlighted in chapter four as the key medium
to longer-term positive outcome of Walking for Health. This is because we do not know precisely how
much of this physical activity Walking for Health is responsible for maintaining (and hence cannot convert
this into MET-hours) in the absence of either a pre-intervention baseline or more robust counterfactual.
Despite such limitations we include the analysis here since it allows us to compare the short-term cost-
effectiveness of Walking for Health with other schemes, as well as providing a useful illustration of how it
is possible to undertake such cost-effectiveness analysis in practice. It is recommended that the analysis
is updated once more robust impact data becomes available.
Using the conversion formula given by Wu et al, the outcome measure is converted into METs as follows:
99
Wu S., Cohen D., Shi Y., Pearson M, and Sturm R. (2011), Economic Analysis of Physical Activity Interventions,
Am J Prev Med. 2011 February ; 40(2): 149–158. 100
A MET stands for “the ratio of energy expended divided by resting energy expenditure, either measured or
estimated from body size. MET hours gained are derived by multiplying the METs associated with the type and
intensity of the activity promoted by the intervention by the time spent performing the activity using hours as the unit
of analysis. Estimating MET-hours as effectiveness measures accounts for the major parameters of physical activity
including frequency, duration, and intensity” (Wu S., Cohen D., Shi Y., Pearson M, and Sturm R. (2011), Economic
Analysis of Physical Activity Interventions, Am J Prev Med. 2011 February ; 40(2): 149–158.)

78
Table 5.3 Conversion of active days to METS
Change in number of active days per week at four months
MET-hours gained per day = (change in active days)*1.5 MET hours/7)
1.17 0.251
Source: Ecorys analysis
‘At least 30 minutes of physical per day’ should be seen as the lower boundary of the effect. Many people
may of course be doing more than 30 minutes. If we doubled the assumed minutes (which would equate
to the typical time spent on Walking for Health walks as measured by the survey, as well as to the
definition of a “day spent being physically active” used by Wu et al), this would accordingly double the
METs effect for Walking for Health (0.52).
If the estimated range of MET hours gained through Walking for Health (0.251-0.52) is compared to the
range of programme effects found by Wu et al, it appears that the Walking for Health outcome at four
months fits within the range of effect sizes found by Wu et al.
Similar conclusions can be drawn from comparing the effect size of Walking for Health with those
reviewed by another review paper, Laine et al 2014101
, although there the effect size ranges are
somewhat larger. This is likely because this particular review did not limit the derived cost-effectiveness
results to just the ‘successful’, effective physical activity interventions, but to all those that did meet the
inclusion criteria. The focus of Laine et al though was more specifically on community- and population-
level physical activity interventions – hence interventions closer in focus to the Walking for Health. Out of
the studies cited in Laine et al, one of the most comparable is an evaluation of a community-based
"10,000 steps" project promoting walking and enhancing the use of pedometers. Its effect was 0.38 MET-
hours gained per day.
In order to compare the cost-effectiveness of Walking for Health results with other schemes, Wu et al’s
approach is followed whereby interventions examined to one year are standardised for a potential 10,000
target population (where interventions were shorter than one year, it was assumed that the shorter term
actual effect was sustained for 1 year). In order to obtain the total physical activity benefits in this
hypothetical year, MET-hours gained per person per day are therefore multiplied by the (assumed) one-
year duration and then by 10,000.
For the estimated METs calculated above (0.251) this provides a total population benefit of 912,500
METs (or 1,825,000 if we double the minutes) from Walking for Health. Similarly, the total standardised
annual intervention cost to reach 10,000 people is calculated as the cost per participant (£76) multiplied
by 10,000, which gives £760,000. Dividing costs by physical activity benefits provides a cost-
effectiveness ratio of £0.83 per MET hour gained (or £0.42 in the more optimistic assumption). Again this
is well within the range of cost-effectiveness ratios presented in the Wu et al (and in the Laine et al) study.
101
Laine J. (2014) Cost-effectiveness analysis of population-level physical activity interventions, America Journal of
Health Promotion, Volume 29, No. 2

79
5.4 Cost-Utility Analysis and Return on Investment (Cost-Benefit Analysis)
Cost-Utility Analysis (CUA) is a specific form of economic evaluation based upon the quality of the health
outcomes produced or forgone by health programmes or treatments.102
The approach followed here
compares the expected costs amongst a cohort of people who were not participating in the Walking for
Health programme with the expected costs associated with a cohort who were involved. For the ‘non-
participating’ cohort the costs include the health care costs of treating people who develop conditions
such as diabetes, heart disease, cancer, or depression. The costs of the ‘participating’ cohort include
setting up and maintaining a Walking for Health programme as well as the health care costs of treating
the same conditions as in the non-participating cohort.103
However, as suggested by evidence reviewed in
chapter two, a more active lifestyle can reduce the likelihood of developing these conditions, and the
savings derived from avoiding some of these events would be expected to help offset some or all of the
programme costs. The key benefits monetised here therefore relate to the savings to the healthcare
system from not having to treat diseases, and the value of the QALYs gained (based upon willingness to
pay).
Cost-effectiveness analysis does not provide an indication of the value of the outcomes achieved. 'Return
on investment' (ROI) is a form of monetised Cost-Benefit Analysis (CBA) which measures the cost of the
programme against the financial and health outcomes returned from the programme, from the perspective
of the investor. It therefore provides a value of the financial return of Walking for Health schemes given
the monetary value of running the programme and the health outcome returns on investment given the
health benefits of the programme.
5.4.1 Modelling approach
In order to evaluate the Walking for Health programme in terms of cost-utility analysis and return on
investment, parameters from the Walking for Health survey were input into the MOVES model. At the
heart of the MOVES model is an ‘epidemiological engine’ which links the increases in units of physical
activity (METs) with changes in disease prevalence over time. The model then assesses both the
financial return to the NHS (health expenditure averted) and health impacts (QALYs gained) based upon
the estimated increases in physical activity (METs gained) for the following diseases – Type 2 Diabetes,
Coronary Heart Disease, Cardiovascular Disease (Stroke), Dementia, Depression, Breast Cancer, Colon
Cancer, as well as injuries. The results are produced for both the ‘treatment’ group and the counterfactual
group (‘no Walking for Health intervention’).
It should be noted that when calculating the financial and health impacts, the cost of disease
management is based on general pathways of care for the patient group and not each individual pathway.
An underestimation of the cost of disease management may result where treatments and procedures
additional to standard care arise across a varying population. Furthermore, the cost of injuries as a result
of the uptake of walking for health and inpatient costs, such as trips to the GP, are not included within the
model.
It is expected that the participating cohort will have a lower likelihood of developing chronic health
conditions and therefore that their health outcomes should be better. Better health outcomes are reflected
in terms of quality-adjusted life years (QALYs). The QALY measures a person’s quality-of-life over a
102
Drummond, M.F.; Sculpher, M.J.; Torrance, G.W.; O'Brien, B.J.; Stoddart, G.L. Methods for the economic
evaluation of health care programmes. Third edition. Oxford: Oxford University Press, 2005 103
Savings in management costs associated with treatment for those who contract diseases (e.g. a need for fewer
trips to the GP) are not factored into the model.

80
defined period of time. Quality of life (also known as utility) is defined on a 0 to 1 scale, with 0
representing dead and 1 representing perfect health. This utility value is used to weight individual years of
life. To illustrate, 10 years lived at a quality of 0.6 would represent 6 QALYs (10 x 0.6). The key
advantage of the QALY is that it allows changes in quality or in length to be summarised in a single
measure.
The financial return on investment to the NHS is a measure of the amount of money saved in treatment
costs by the NHS brought about as a result of the programme. The net investment of the programme is
calculated as the NHS costs avoided minus the total programme investment. The model calculates the
number of each disease averted for the intervention and on intervention, and the total cost for the disease
averted in the two groups. The calculation of the financial return on investment can be presented as
follows:
(Treatment Costs Saved – Programme Investment) = Financial Return on Investment
Programme Investment
The treatment costs saved are calculated as the money saved by the NHS as a result of the programme
preventing some illnesses. These are defined as the costs of averting diseases such as Type 2 diabetes,
Coronary Heart Disease, Cerebrovascular Disease, and Depression. A positive value would indicate that
the programme saved enough money in terms of these treatment costs averted to cover the cost of the
programme. However, even if the figure is negative, and there is less return than that being invested, this
does not necessarily imply that the programme is not worthwhile. In this case, consideration and
comparison of the health benefits of the programme by undertaking a cost-utility analysis of the potential
impact of the programme on QALYs gained was considered alongside the cost savings to the NHS.
The health outcome return on investment is calculated as the measure of the benefits achieved by the
programme monetised in terms of the willingness to pay for the benefits. The calculation of the health
outcome return on investment can be presented as follows:
ALYs Gained x Willingness to Pay Threshold = QALY Return on Investment
Programme Investment
5.4.2 Inputs and assumptions
MOVES models the impact of an intervention based upon its recorded inputs and outputs. This requires
the user to input information on the baseline level of activity, sex, age of participants, the number of hours
spent walking and the intensity and frequency of walking. In the case of Walking for Health, inputs were
generally taken from the Wave 1 and Wave 3 survey data. The specific assumptions are highlighted
below.
This means that the Cost-Utility Analysis underpinning MOVES is based conservatively on the average
time spent walking during Walking for Health walks (rather than any wider effects on physical activity).
This is considered to be a legitimate approach to the economic evaluation of Walking for Health given the
key finding from the previous chapter that Walking for Health helps participants to maintain regular,
moderate-intensity physical activity through their participation in Walking for Health walks. The results of
the modelling are nonetheless sensitive to the level of additionality delivered by the programme (the
survey analysis showed that some participants may have taken part in similar walking groups in the
absence of Walking for Health) as well as to the sustainability of participation, and different scenarios are
therefore tested to investigate the impact of varying this on the results.

81
The information was then matched to the number of Metabolic Equivalent Task (METs) used by
individuals involved in the walking intervention, which was calculated through computation of the time and
duration of the physical activity. Once the minutes of METs are matched to the walking intervention
(casual or strenuous), the impact on the number of cases of disease is calculated. The model then
compares the number of cases occurring to the same population assuming they did not take part in the
intervention.
The key input parameter values are shown in Table 5.4, overleaf. The model required the input
parameters to be rounded to whole numbers, and thus, the duration and frequency values have been
rounded down to the nearest integer. Where possible, values were rounded down to take a more
conservative estimate of the intervention.
The input assumptions were generally derived from survey responses regarding basic participation and
retention levels on Walking for Health schemes, baseline levels of physical activity and analysis of
programme expenditure, detailed as follows:
Demographic data, such as a median age, percentage of male and females were estimated using the
survey results.
The starting activity level was assumed as moderately inactive on the basis of the survey responses
and the average number of days of 30 minutes or more of physical exercise taken part in. Participants
averaged 1 day of 30 minutes of exercise, which most closely matched the definition outlined by the
General Practice Physical Activity Questionnaire (GPPAQ) of being moderately inactive.104
As a
result, participants have been defined as moderately inactive on the assumption that participants
have a sedentary job and undertake some but less than an hour of physical exercise and/or cycling
per week or a standing job and no physical exercise or cycling.
The duration of walks was calculated as the average of the number of minutes individuals spent
specifically on a Walking for Health walk taken from the Wave 3 survey results, representing the
duration of the ‘intervention’. The frequency of the intervention was assumed to be the average
calculation of the number of times walkers took part in Walking for Health on a monthly basis, based
on the survey responses.
The length of the programme was assumed to be 243 as the length of the programme follow up was
8 months e.g. 8 months x 30.4 days (average number of days in a month) = 243 days. The total
number of sessions was defined as the programme length, assumed as 243/(frequency*7(days in a
week)). It should be noted that the model accounts for participants continuing on the programme past
the defined length of the programme.
A five year time horizon has been assumed within the model in order to account for the health
benefits from physical activity, which is cumulative over the medium to longer-term. The time-horizon
assumes that the same level of physical activity is continued throughout this period and therefore that
the programme changes not only peoples’ attitudes towards and enjoyment of physical activity, but
also their medium to longer-term behaviours. Conversely, the five year time horizon also assumes
that there will be no gain in health benefits from the intervention (or wider participation in physical
activity) beyond the five years. One-year and 10-year time horizons are therefore also tested in the
sensitivity analysis to reflect the potential effect of different time horizons on mortality and morbidity.
104
The GPPAQ provides a classification of physical activity based on lifestyle and hours spent doing various physical
activities.

82
Table 5.4 Input Parameter Values
Category
Parameters Values Assumptions
Demographics
Age Group 60+ Modal age-band in survey data taken as age group
Starting Activity Level
Moderately Inactive
Based on baseline no. of days of 30 minutes or more exercise from Wave 1 survey
Activity
Type Walking
Intensity Brisk Requirement of Walking for Health accreditation
Duration 1 hrs
The average duration of Walking for Health in wave 3 = 74.35 mins. Thus, this was rounded down to the nearest whole no. in hours
Frequency 1 day per week
The average no. of walks per month = 3.14. (As 0 walks per week cannot be assumed, a frequency of 1 was assumed.)
Length of Programme
243
Whilst the schemes are continual, the programme input parameters are based upon 8 months (The length of the last follow up survey.) (8 x 30.4days)
Total Number of Sessions
35 The length of the programme/frequency. i.e. 243/7 = 34.71 (rounded to 35)
Scale
Time Horizon 5 years
Begins with 82,569 The number of participants registered in 2014-2015
Ends with 53,741 The drop-out rate from the Wave 3 survey data was 35%, which has been applied here.
Drop-outs rate 830.43 Drop-out rate per week
Costs Total Cost £6,276,786
See table 5.1 - estimation of programme cost
Average Cost £76.02 (£6,276,786/82,569 participants)
Source: Ecorys/UEA analysis
The number of participants entering the model at the start has been modelled to reflect the number of
registered walkers as of 2014-2015.
The average cost per participants was calculated on the basis of annual programme costs (see table
5.1) and number of registered participants.
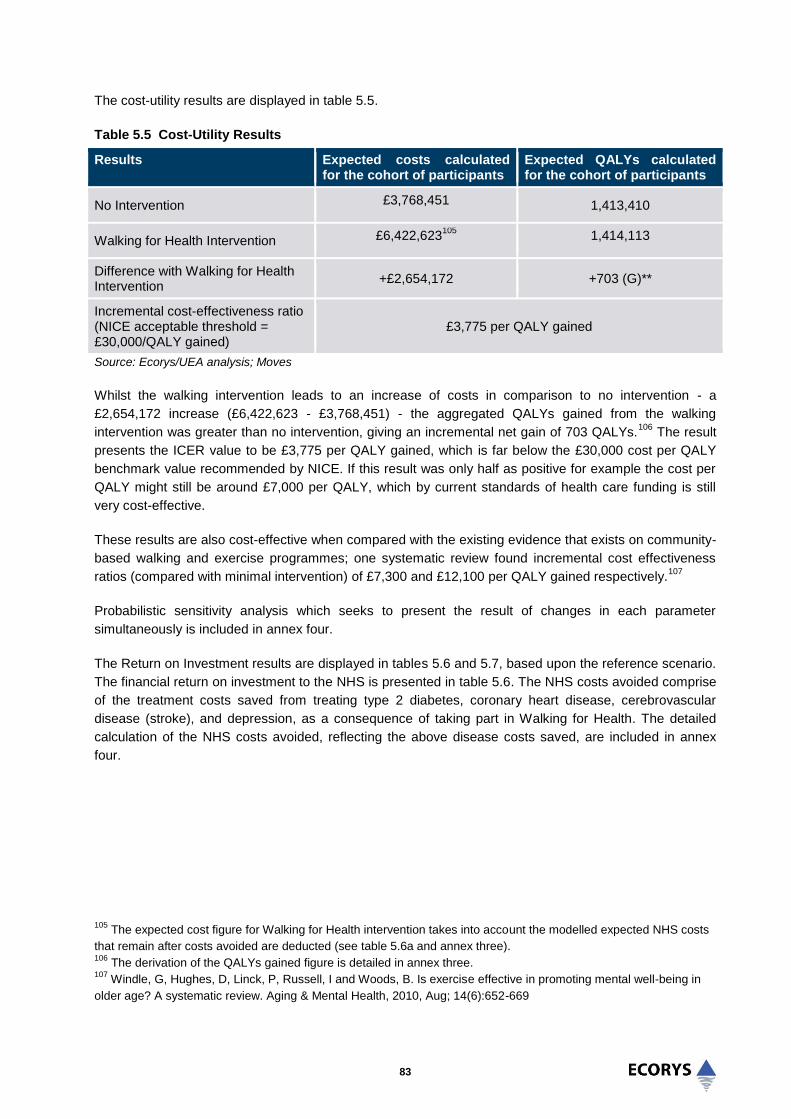
83
The cost-utility results are displayed in table 5.5.
Table 5.5 Cost-Utility Results
Results
Expected costs calculated for the cohort of participants
Expected QALYs calculated for the cohort of participants
No Intervention £3,768,451 1,413,410
Walking for Health Intervention £6,422,623105
1,414,113
Difference with Walking for Health Intervention
+£2,654,172 +703 (G)**
Incremental cost-effectiveness ratio (NICE acceptable threshold = £30,000/QALY gained)
£3,775 per QALY gained
Source: Ecorys/UEA analysis; Moves
Whilst the walking intervention leads to an increase of costs in comparison to no intervention - a
£2,654,172 increase (£6,422,623 - £3,768,451) - the aggregated QALYs gained from the walking
intervention was greater than no intervention, giving an incremental net gain of 703 QALYs.106
The result
presents the ICER value to be £3,775 per QALY gained, which is far below the £30,000 cost per QALY
benchmark value recommended by NICE. If this result was only half as positive for example the cost per
QALY might still be around £7,000 per QALY, which by current standards of health care funding is still
very cost-effective.
These results are also cost-effective when compared with the existing evidence that exists on community-
based walking and exercise programmes; one systematic review found incremental cost effectiveness
ratios (compared with minimal intervention) of £7,300 and £12,100 per QALY gained respectively.107
Probabilistic sensitivity analysis which seeks to present the result of changes in each parameter
simultaneously is included in annex four.
The Return on Investment results are displayed in tables 5.6 and 5.7, based upon the reference scenario.
The financial return on investment to the NHS is presented in table 5.6. The NHS costs avoided comprise
of the treatment costs saved from treating type 2 diabetes, coronary heart disease, cerebrovascular
disease (stroke), and depression, as a consequence of taking part in Walking for Health. The detailed
calculation of the NHS costs avoided, reflecting the above disease costs saved, are included in annex
four.
105
The expected cost figure for Walking for Health intervention takes into account the modelled expected NHS costs
that remain after costs avoided are deducted (see table 5.6a and annex three). 106
The derivation of the QALYs gained figure is detailed in annex three. 107
Windle, G, Hughes, D, Linck, P, Russell, I and Woods, B. Is exercise effective in promoting mental well-being in
older age? A systematic review. Aging & Mental Health, 2010, Aug; 14(6):652-669
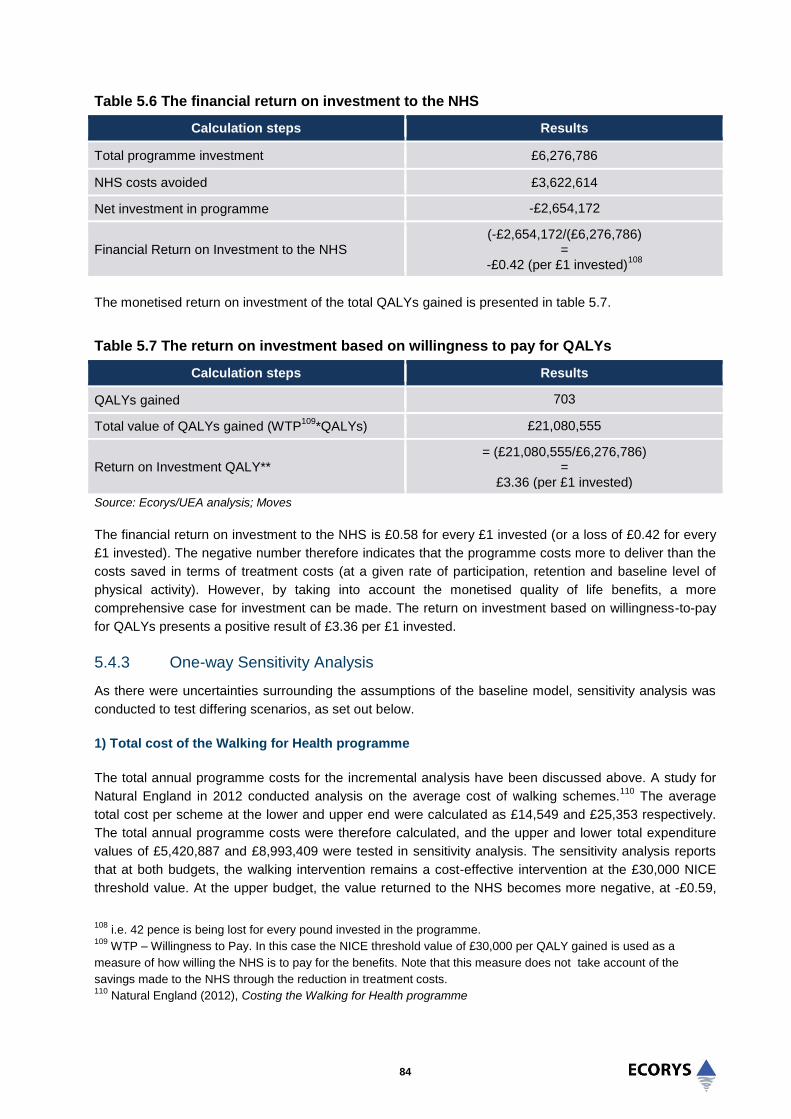
84
Table 5.6 The financial return on investment to the NHS
Calculation steps Results
Total programme investment £6,276,786
NHS costs avoided £3,622,614
Net investment in programme -£2,654,172
Financial Return on Investment to the NHS (-£2,654,172/(£6,276,786)
= -£0.42 (per £1 invested)
108
The monetised return on investment of the total QALYs gained is presented in table 5.7.
Table 5.7 The return on investment based on willingness to pay for QALYs
Calculation steps Results
QALYs gained 703
Total value of QALYs gained (WTP109
*QALYs) £21,080,555
Return on Investment QALY** = (£21,080,555/£6,276,786)
= £3.36 (per £1 invested)
Source: Ecorys/UEA analysis; Moves
The financial return on investment to the NHS is £0.58 for every £1 invested (or a loss of £0.42 for every
£1 invested). The negative number therefore indicates that the programme costs more to deliver than the
costs saved in terms of treatment costs (at a given rate of participation, retention and baseline level of
physical activity). However, by taking into account the monetised quality of life benefits, a more
comprehensive case for investment can be made. The return on investment based on willingness-to-pay
for QALYs presents a positive result of £3.36 per £1 invested.
5.4.3 One-way Sensitivity Analysis
As there were uncertainties surrounding the assumptions of the baseline model, sensitivity analysis was
conducted to test differing scenarios, as set out below.
1) Total cost of the Walking for Health programme
The total annual programme costs for the incremental analysis have been discussed above. A study for
Natural England in 2012 conducted analysis on the average cost of walking schemes.110
The average
total cost per scheme at the lower and upper end were calculated as £14,549 and £25,353 respectively.
The total annual programme costs were therefore calculated, and the upper and lower total expenditure
values of £5,420,887 and £8,993,409 were tested in sensitivity analysis. The sensitivity analysis reports
that at both budgets, the walking intervention remains a cost-effective intervention at the £30,000 NICE
threshold value. At the upper budget, the value returned to the NHS becomes more negative, at -£0.59,
108
i.e. 42 pence is being lost for every pound invested in the programme. 109
WTP – Willingness to Pay. In this case the NICE threshold value of £30,000 per QALY gained is used as a
measure of how willing the NHS is to pay for the benefits. Note that this measure does not take account of the
savings made to the NHS through the reduction in treatment costs. 110
Natural England (2012), Costing the Walking for Health programme

85
and the return in terms of QALYs also decreases to £2.34 per QALY. At the lower budget, the value of
return on investment to the NHS becomes less negative, and the return on investment on QALYs
increases.
2) Time horizon
The initial analysis assumed a five-year time horizon on the basis of evidence suggesting physical activity
can have a decreasing effect on all-cause mortality111
. A conservative estimate of the benefits to physical
activity was taken, by accounting for the benefits from the programme intervention for five years. The five-
year time horizon was tested to allow for the assumption that the benefits may be realised over a shorter
and longer period. A one-year time horizon would imply no significant return on investment overall, as
well as low cost-effectiveness. This demonstrates the importance of sustaining behavioural change
amongst individual participants beyond one year if good value for money is to be secured from the
investment of Walking for Health. In this context, it is worth noting that respondents to the Wave 3 survey
showed a general willingness to continue to take part in regular walks.
3) QALY values from the Survey
The EQ-5D values modelled into MOVES collected from the surveys were tested in a scenario analysis.
The results from the survey presented very similar EQ-5D values as those elicited from the general
population. The total number of QALYs accrued in the no intervention and intervention was greater than
from the modelled values, however, the difference remained very similar. The EQ-5D values from the
survey most likely presented the participants as having a higher quality of life than the quality of life
modelled and assumed calculated by Szende and Williams (2004)112
. Therefore the results of the cost-
effectiveness did not vary. The result remained cost-effective.
4) Change in additionality assumption
A different additionality scenario is presented based upon participants being more likely to have engaged
in a similar physical activity in the absence of Walking for Health. The scenario is based on responses to
a survey question at Wave 1, where participants were asked how likely it would have been for them to
have joined a different walking group if the Walking for Health group was not available at the time they
joined. Based on assumed probability weightings for each of the response categories, it is estimated that
around 56% of respondents would not have found a similar group elsewhere (table 5.8).
111
Ekelund U. et al (2015), Physical activity and all-cause mortality across levels of overall and abdominal adiposity
in European men and women: the European Prospective Investigation into Cancer and Nutrition Study (EPIC) Am J
Clin Nutr 2015 ajcn.100065; First published online January 14, 2015. 112
Agota S. and Williams A. (2004), Measuring Self-Reported Population Health: An International Perspective based
on EQ-5D. On behalf of The EuroQol Group’s International Task Force on Self-Reported Health. 2004. EuroQol
Group ISBN 963 94 56 47 0.

86
Table 5.8 Additionality of Walking for Health
If the [scheme name] walking group was
not available at the time you joined, how
likely is it that you would have joined a
different walking group?
Percentage Assumed probability
respondents would not
have attended a similar
group
Very likely 11% 0.1
Likely 34% 0.3
Neither likely nor unlikely 4% 0.5
Unlikely 10% 0.7
Very unlikely 39% 0.9
Sources: Evaluation survey (Wave 1)
Base: All Wave 1 respondents (excluding don’t knows)
This percentage is then applied to the number of participants continuing with the scheme at eight months,
thereby adjusting the model’s input assumption regarding number of participants. After allowing for this
change (deadweight), the programme remains relatively cost-effective (£12,660 per QALY gained), with
an overall ROI greater than one.
5) Summary of scenario testing
Table 5.9, overleaf, presents the results of the scenario testing with respect to Return on Investment.
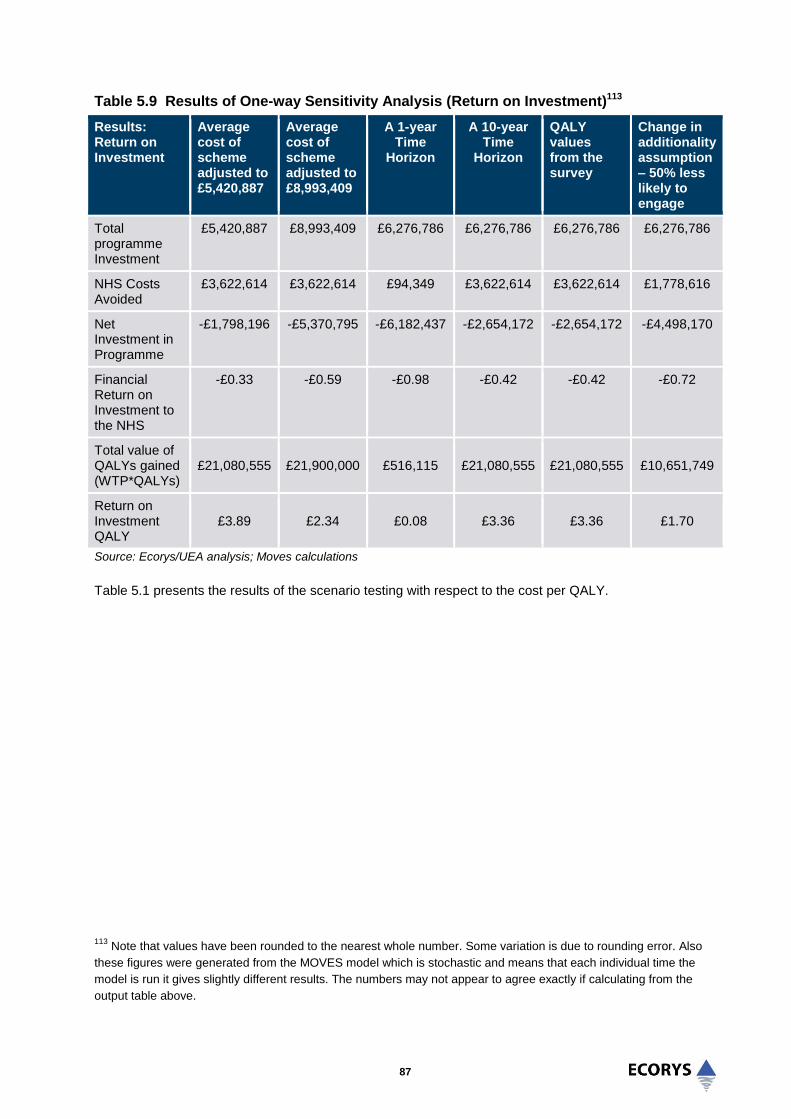
87
Table 5.9 Results of One-way Sensitivity Analysis (Return on Investment)113
Results: Return on Investment
Average cost of scheme adjusted to £5,420,887
Average cost of scheme adjusted to £8,993,409
A 1-year Time
Horizon
A 10-year Time
Horizon
QALY values from the survey
Change in additionality assumption – 50% less likely to engage
Total programme Investment
£5,420,887 £8,993,409
£6,276,786 £6,276,786 £6,276,786 £6,276,786
NHS Costs Avoided
£3,622,614 £3,622,614 £94,349 £3,622,614 £3,622,614 £1,778,616
Net Investment in Programme
-£1,798,196 -£5,370,795 -£6,182,437 -£2,654,172 -£2,654,172 -£4,498,170
Financial Return on Investment to the NHS
-£0.33 -£0.59 -£0.98 -£0.42 -£0.42 -£0.72
Total value of QALYs gained (WTP*QALYs)
£21,080,555 £21,900,000 £516,115 £21,080,555 £21,080,555 £10,651,749
Return on Investment QALY
£3.89 £2.34 £0.08 £3.36 £3.36 £1.70
Source: Ecorys/UEA analysis; Moves calculations
Table 5.1 presents the results of the scenario testing with respect to the cost per QALY.
113
Note that values have been rounded to the nearest whole number. Some variation is due to rounding error. Also
these figures were generated from the MOVES model which is stochastic and means that each individual time the
model is run it gives slightly different results. The numbers may not appear to agree exactly if calculating from the
output table above.

88
Table 5.10 Results of One-way Sensitivity Analysis (cost per QALY)
Results: Return on Investment
Average cost of scheme adjusted to £5,420,887
Average cost of scheme adjusted to £8,993,409
A 1-year Time
Horizon
A 10-year Time
Horizon
QALY values from the survey
Change in additionality assumption – 50% less likely to engage
Cost: No Intervention
£3,716,451 £3,733,644 £96,576 £3,711,574 £3,760,098 £1,852,667
Cost: Walking Intervention
£5,515,543 £9,104,439 £6,279,013 £6,365,746 £6,414,270 £6,350,667
Difference £1,799,092 £5,370,795 £6,182,437 £2,654,172 £2,654,172 £4,498,170
QALYs: No Intervention
1,425,141 1,387,326 282220 1404053 1,646,364 706,137
QALYS: Walking intervention
1,425,846 1,388,031 282237 1404757 1,647,069 706,493
QALY difference
705 705 17 704 705 355
ICER VALUE – Cost per QALY
£2,552 £7,622 £359,060 £3,767 £3,767 £12,660.21
Source: Ecorys/UEA analysis; Moves calculations
5.5 Summary
This chapter has examined the value for money of the Walking for Health programme. The analysis of the
programme’s value for money builds up from an initial analysis of cost per participant to cost-
effectiveness analysis, which examines cost per outcomes at the initial stage of engagement, to a more
comprehensive assessment of the long-term costs and benefits of the programme.
Analysis shows that Walking for Health is cost-efficient when the unit costs (£76 per participant) are
compared with similar Big Lottery funded community-based physical activities for older people evaluated
by Ecorys. If the programme adopts a more proactive targeting approach in the future, this is likely to
drive up the unit cost per participant (as it is expected that engagement costs will need to increase);
however overall value for money would improve if these costs are outweighed by improvements to
physical activity (and health) outcomes.
Cost-effectiveness analysis, based on the relationship between the physical activity outcomes of the
Walking for Health programme at four months and programme expenditure, produced a ratio of £0.83 per
MET hours gained (or £0.42 in the more optimistic assumption). This is well within the range of cost-
effectiveness ratios derived from evaluations of comparable interventions. An important limitation of the
cost-effectiveness analysis is that it is based upon short-term increases in physical activity at four months,
in order to facilitate the conversion of outcomes into MET-hours gained (and thus comparison with other
schemes). It is not based upon the programme’s longer-term outcome of helping participants to maintain
moderate-level physical activity, since Walking for Health’s precise contribution to this is not known.
Cost-utility and cost-benefit analyses are based conservatively on the specific time spent undertaking
walking through the programme (around 75 minutes of walking per week). Using data from the surveys as
89
input parameters, the modelling of Walking for Health’s cost-effectiveness indicates that that the
intervention is potentially highly cost-effective, at £3,775 per QALY gained. This is well below the value of
NICE’s recommended willingness to pay threshold of £30,000 per QALY. Converting the number of
QALYs gained into a monetary value gives an estimated potential return on investment (benefit-cost ratio)
of £3.36 per £1 invested. Taken alone, the potential financial cost saving to the NHS is less positive.
The MOVES model assumes that the physical activity undertaken for any evaluated programme is
additional to what would have occurred in its absence. Whilst no counterfactual data was available to
thoroughly test this assumption with regards to Walking for Health, this scenario is broadly consistent with
the overall evaluation finding that Walking for Health helps participants to maintain a level of regular,
moderate-intensity physical activity. MOVES also assumes that the level of physical activity is maintained
over the longer-term (in the base case for 5 years or more); this is necessary for physical activity to
generate sufficient positive health gains (as well as being consistent with the objectives of Walking for
Health to help people to remain active). However, even after adjusting these assumptions through
sensitivity testing (shorter time horizon, lower level of additionality), the cost-effectiveness results remain
positive.
The results of the MOVES analysis are therefore positive, from the perspective that even accounting for
some drop off and deadweight associated with the scheme, if assumptions regarding the retention and
longer-term behaviour change of participants hold true (and which are explicit in the programme’s
objective of supporting people to be more active and supported by the finding that the vast majority of
participants at eight months intend to continue participating), then the Walking for Health programme has
the potential to be highly cost-effective.
The lessons for Walking for Health and its individual schemes are that cost-effectiveness (and the return
on investment) can be maximised through greater engagement with target groups (and particularly those
with few other options to participate in organised physical activity in their local area), and through
supporting such groups to remain engaged in walking or other physical activity beyond a 12-month
period. These assumptions suggest there is a need for additional research into the longer-term impacts of
Walking for Health on changes in physical activity in order to analyse how far walking behaviour is
sustained in future years.
Going forwards there is also the potential for the MOVES model to be applied to local schemes (i.e. using
local scheme inputs). Modelling the costs and benefits of local scheme delivery approaches could be
appealing to commissioners as it would show the potential value for money of investing in Walking for
Health within a local area, providing certain conditions are satisfied (for example x number of walkers are
engaged over a four month period, x% of participants are inactive etc).

90
6.0 Process lessons from Walking for Health
6.1 Introduction
This chapter provides an analysis of the factors that have contributed to the achievement of Walking for
Health’s outputs and outcomes. These are again linked to the delivery of the detailed programme
objectives. The effectiveness of programme delivery is considered from two perspectives which are inter-
linked; the first is a consideration of effective approaches and challenges in delivery for Walking for
Health schemes at the local level, and the second focuses on the role of the national programme team in
supporting effective local delivery. From this analysis we derive a set of further learning points for the
programme.
6.2 Increasing participation and engagement of target groups
A key objective of Walking for Health is to increase participation in health walks, with a focus on reaching
those most in need of support (including people affected by cancer and other long-term health problems
and health inequality groups). The previous chapters noted how the accreditation process may have led
to a reduction in the number of Walking for Health schemes, and that some target groups are under-
represented in Walking for Health. Schemes must strike a difficult balance between open access, and
reaching these target groups. Nonetheless, it was also found that there is wide variation in the number of
walkers by scheme, suggesting that some have been more successful in helping to increase participation
than others. The following section explores the strengths and weaknesses of the approaches taken to
engage walkers in Walking for Health, both generally and in terms of targeting specific groups, and
includes any good practice identified.
6.2.1 General scheme promotion
Raising awareness of Walking for Health amongst the widest possible pool of eligible walkers is important
for meeting programme objectives. The evidence suggests that local schemes use a variety of methods in
support of the recruitment of new walkers, with varying degrees of effectiveness.
It is clear that word of mouth is an extremely important route to recruitment for Walking for Health. As
shown by the responses to the Wave 1 survey in table 6.1, nearly half of responses indicated that the
participant was told about the scheme by an unspecified person, and a further 6.3% stated that the
participant had heard about it from a health professional. It seems that posters and advertisements are
also an important recruitment route, with 22.9% of responses highlighting this route. The website appears
not to be such a significant route to recruitment, with just 7.5% of responses naming it. Of the 15
participants who mentioned a charity other than Macmillan Cancer Support or the Ramblers, 8 referred to
Age UK.

91
Table 6.1: Source of where participants found out about the scheme
Source Total
Percent
Told about it by someone (not covered above) / word of mouth
46.2%
Poster/advertisement 25.6%
Website 7.5%
GP/Nurse/Physio/Other health professional 6.3%
Leaflet 4.2%
Other Charity 3.0%
Ramblers 2.6%
Location (e.g. Leisure Centre or Church) 1.8%
Already Knew About the Scheme 1.4%
Pharmacy 0.8%
Press 0.4%
Macmillan Cancer Support 0.2%
TOTAL 100%
Source: Evaluation of Walking for Health baseline survey
Base: 496 responses - Participants were given the opportunity to specify three different sources of where they found
out about the scheme, and if they specified “Other – please state” then details were captured in a fourth sub-
question. At least one source was named by 479 people (92.1%) but only 17 people (3.3%) specified a second
source, and no-one specified a third. Of the 40 participants that responded “Other - please state”, 30 different
sources were given. The table combines the data for the first and second sources (including categorised responses
to the “Other – please state” sub-question). The base value reflects the number of responses and not the number of
individual participants responding.
Most of the case study schemes reported that word-of-mouth was their most used method of recruiting
new walkers. The case studies suggested that walk leaders and walkers were generally proactive in
promoting Walking for Health to friends and acquaintances. The use of word of mouth appeared to be
particularly important to small and medium-sized schemes where there were limited resources for other
marketing activities. One case study highlighted the potential value of social media in engaging younger
people, through the use of Twitter and Facebook, although no data was available on the effectiveness of
this approach and this method did not appear to be used widely.
The case studies also confirmed that posters displayed in local community venues, leisure centres,
libraries and retail outlets such as pharmacies were another effective way of advertising schemes. For
example a number of walkers interviewed for one of the case studies said that they had heard about their
scheme by seeing posters on a notice board situated in a leisure centre reception. Many of the schemes
were also being promoted through sports and social clubs. The church also helped to recruit participants
in several areas.

92
A number of schemes commented on the effectiveness of using screens and noticeboards in local GP
surgeries to increase participation. Some of the case study schemes also worked with other partner
organisations such as community centres to promote the scheme. To a lesser or greater degree, this
highlights the benefits of partnership working in helping to raise awareness of Walking for Health
schemes and recruit new walkers; nonetheless partnership working is also considered to be an area for
development (see sections 6.2 and 6.3 below).
The following small, volunteer-led scheme operating in a rural area demonstrated the importance of using
a variety of media to publicise Walking for Health walks.
Case Study Good Practice Evidence – Comprehensive approach to marketing and promotion
The scheme’s approach involved approaching local organisations and media, and sending out
publicity material on a regular basis. New walkers were often recruited through word of mouth but
many had also seen articles in the local newspaper as the scheme coordinator was regularly
sending press releases to local newspapers. The scheme coordinator also maintained a mailing list
which included hospital departments, libraries, swimming pools, sheltered housing providers and GP
surgeries. The updated schedule of walks is sent to organisations on the mailing list on a regular
basis and recipients are provided with posters and leaflets to display.
Walking group members are also encouraged to distribute leaflets and posters in their local villages
(e.g. churches or shops), and the Walking for Health database suggests that a relatively high
proportion of walkers first found out about the scheme through taking a leaflet or reading a poster.
The scheme coordinator has also talked to local health groups including Age UK, the Alzheimer’s
Society and Mind.
The effectiveness of the scheme’s approach to marketing and promotion was helped by the scheme
coordinator’s background in marketing and public relations. This shows how volunteers skills can be
utilised in delivering different aspects of the programme.
For the larger schemes it was more difficult to gauge the effectiveness of particular publicity methods
given that a greater range of promotional methods were being employed simultaneously. It was also
recognised that reliance on word of mouth can be less effective for engaging new and more diverse
groups of walkers including those affected by specific health issues. This is explored below.
6.2.2 Group targeting
A particular aim of Walking for Health is to reach those that need the most support to be physically active,
including people affected by cancer and other long-term health conditions, and those from recognised
health inequality groups such as older adults, BME communities and people on lower incomes.
Most stakeholders stressed that a balance needs to be struck between Walking for Health offering a more
targeted approach to delivering health walks, focusing on specific groups, and trying to benefit the
greatest number of people. A number of national level external stakeholders believed that Walking for
Health should be both open and targeted, highlighting the importance of open groups for prevention as
well as for those people who are managing a wide range of long term conditions:
93
“Walking for Health should be promoted as a preventative health measure for all, so encouraging
people of all ages to stay healthy and connect with nature and avoid health conditions and the
need for prescriptions. I like that it is targeted at people with specific health conditions too as
people may lose confidence so it may help them feel more confident as they know the leaders
know what they are doing and will be looked after if they have any health issues on the walk. So I
think it should be promoted as both a keep fit option for people who are already fit and also for
people who are unwell”
(national level external stakeholder)
Local authority stakeholders were also keen for Walking for Health to remain open to all to promote
inclusion:
“I think that’s where Macmillan have been quite successful. There was a fear, ‘its Macmillan, it will
be about walks for people with cancer’, and that hasn’t played through, so that’s really good, it’s
better for them [cancer patients] to be in an inclusive group”
(local stakeholder)
Walking for Health is able to strike such a balance since, as some stakeholders commented, it is seen as
being a responsible programme, with walk leaders perceived to have knowledge of health conditions,
which gives people with such conditions the confidence to participate.
One stakeholder representing a national health body commented that open and targeted approaches had
their benefits and drawbacks, and that targeting should probably be determined flexibly according to local
need. For example, as one stakeholder suggested, targeting specific groups could be a focus in affluent
local authority areas (as some schemes currently do: see section 3.3), while in deprived areas the
emphasis could be on promoting Walking for Health as a programme open to all.
Some external stakeholders nevertheless felt there was scope to improve the promotion of the
programme to specific target groups to help recruit more walkers from priority groups, including people
living in deprived areas, and people with health conditions and mental health issues. The effectiveness of
schemes in targeting specific groups is considered below.
Targeting health inequality groups
National programme objectives encourage schemes to engage with health inequality groups, including
older adults, BME communities and people on lower incomes.
While many of the schemes do not have an explicit objective to target older age groups, it is clear that
older people are attracted to Walking for Health more than other specific groups. Data presented in
chapter three showed that the vast majority of walkers are 55 years or older. The case studies highlighted
particular reasons why schemes have been successful at engaging older people. The schemes do not
necessarily adopt a specific targeting approach to attract older people; however the social accessibility of
schemes was seen as key to attracting older people; this means starting and finishing the walks near
public transport nodes and venues such as cafes where walkers can meet and socialise. The social
benefits of the walks also appear to encourage older people to attend on a regular basis, as supported by
the outcome evidence presented in chapter four.
Programme data on the profile of participants presented in chapter three showed that the programme
attracts a very small minority of people from BME groups and significantly lower than their the proportion
in the population as a whole. According to the 2013 Audit survey results, a very small minority of schemes

94
(less then 2%) actively target BME groups. A number of the case study schemes did not have any current
engagement or any future plans to develop their engagement with particular BME groups. In some areas
this appeared to be a consequence of the population characteristics of the area as the ethnic minority
populations were relatively small; however scheme coordinators expressed a desire to research and
understand the physical activity needs of particular ethnic groups if sufficient resources were available to
do this.
Engagement with BME groups had been attempted by some schemes, albeit with limited success to date;
it was felt that an important lesson from this experience was the need to recruit walk leader ‘champions’
from the target populations. Partnership working was also seen as essential to engaging particular target
groups, but in some cases schemes reported that they faced staff capacity constraints in terms of
pursuing this engagement.
The case studies provided a limited number of successful examples of walking groups being set up to
meet the needs of particular ethnic groups. The following medium-sized local authority-led scheme
operating in a central urban area demonstrated the importance of using a community outlet to publicise
Walking for Health walks to BME groups.
Case Study Good Practice Evidence – Approach to attracting people from BME groups
A local pharmacy initiated women-only walks to encourage its female customers from the local
ethnic minority population to take regular exercise. The walk was being promoted in the local
pharmacy through posters and word of mouth.
The pharmacist delivers monthly ‘health talks’ where customers are encouraged to attend the health
walks. The women-only group is now well established and has brought together walkers of a range
of ethnicities.
The Pharmacy pay a coordinator an hour or two a month to oversee the walk, complete the
administration and risk assessment, and also oversee the Pharmacy’s health talks. The Pharmacy
set up the walk originally by employing a project coordinator with Big Lottery Funding seven years
ago.
The female group is now well established and has brought together a range of ethnicities including
Filipino, Chinese and British women. The women interviewed for the case study were all local
residents and customers of the pharmacy. Some of them had seen the walks advertised in the
pharmacy or heard about it at the pharmacy’s health talks, and some of them had been recruited by
friends through word-of-mouth.
A key learning point from this initiative is the potential effectiveness of using particular outlets (in this
case a local pharmacy) with close links to the community and located in areas of need to raise the
profile of walking groups to ethnic minority groups.
This example also demonstrates the potential for local pharmacies to contribute to the ongoing
running costs of walking groups.
Internal stakeholders interviewed for the evaluation also highlighted the every step counts programme as
an example of good practice in engaging groups within the local community in walking and physical
activity. every step counts is a walking outreach project run by the Ramblers that supports the most

95
inactive people to take part in 12 week programmes of tailored walks. A pilot of every step counts took
place in three locations (Bristol, Blackburn with Darwen and the London Borough of Southwark). It was
funded by the Big Lottery until March 2015. A key lesson from this programme was highlighted as
needing to build relationships with community champions who can promote the walks and be trained to
become a walk leader in order to attract hard to reach groups to walking. Internal stakeholders suggested
that the lessons from the delivery of this programme could be taken on board in providing guidance to
local schemes.
Overall, the case study evidence also points to a need for schemes to link up more effectively with
broader physical activity strategies and programmes within their local areas, since Walking for Health can
potentially support strategies and actions to engage specific groups in physical activity.
People with long-term health conditions, illnesses and disabilities and those affected by cancer
The majority of the case study schemes did not have a specific focus on targeting people with long-term
health conditions, illnesses or disabilities and those affected by cancer. This means that they did not have
a specific mechanism or approach for engaging with these particular groups; however this does not
preclude such groups from being involved in health walks more generally.
Those schemes that did have some specific focus were generally larger schemes with the staff capacity
to establish specific walking groups that cater for groups with particular health conditions. For example,
one scheme’s programme included a walk for people with learning disabilities who attend with their
carers, a walk for people with mental health conditions, and a new walk designed for people recovering
from strokes or living with dementia or other conditions that require additional support.
Schemes with a strong focus on health issues were also generally those with established health links
such as engagement with local authority public health teams, CCGs and Health and Wellbeing Boards.
Schemes led by local authorities clearly have an advantage in establishing such links over volunteer-led
schemes. Partnerships had also been established with day centres to engage people with physical
disabilities and learning difficulties (one of the larger case study schemes was using this method), and
with children’s centres to promote family walks and engage young parents.
However, there was also evidence that schemes can effectively engage with health target groups,
providing that local champions are identified for Walking for Health. This is illustrated in the following
example, where a Breast Cancer Centre was referring patients as part of a ‘Walk Well’ referral scheme to
Walking for Health walks. This example nonetheless also highlights some of the challenges involved in
establishing referral systems; time is required to change perceptions and embed effective processes.

96
Case Study Good Practice Evidence – Engagement with cancer patients
This is a fairly new and innovative initiative that arose from a chance conversation between the
scheme coordinator and a breast cancer consultant at a survivorship event run by the consultant.
Despite initial drive and enthusiasm from these two individuals, it took two years to establish it with a
safe (confidential) effective referral system and trained mentors. Cancer care nurses were initially
resistant due to their understaffing and they also felt that it was ‘yet another thing’ to talk to patients
about during their consultations.
After trial and error the scheme now has a simple, effective referral system. The consultant dictates
a letter (as for all other referrals) which is sent to the scheme coordinator and contains pertinent
patient information. The patient is contacted by telephone by the walks scheme and an arrangement
is made to meet them on their first walk with a mentor. This personal, ‘joined up’ system is seen as a
key to success, as attested to by both parties.
Early referral to exercise is also seen as key to adoption by the patient as the appropriate “teachable
moment” is when patients start their therapy, not as an afterthought after surgery. Offering the walks
scheme as part of a total package of surgery, hormone therapy, chemotherapy and weight reduction
programme embeds Walking for Health and gives it medical legitimacy and enshrines walking as a
treatment. Including walking in this treatment package is something the consultant is promoting
amongst colleagues.
One further important lesson with respect to engaging cancer patients (and other target patient groups)
has been the need to promote Walking for Health at the right phase of their rehabilitation, which often
requires an individualised approach. For some patients, they may not feel able to take part until later on in
their journey:
“So it is looking more at the survivorship programme, once people are towards the end of
treatment. People often have side effects from treatment, so they need to be at the right point.”
(Macmillan Cancer Information and Support Facilitator)
Walking for Health can be an important exercise option for patients undergoing treatment:
“I had treatment for oesophageal cancer and I was told the best thing for me to do was walking
and the doctor said going on two walks a week is fantastic. I like the walks we do. I carried on
walking all the way through and felt great; the only time I didn’t walk was for the six weeks when I
was having radiotherapy”
(Walker)
Similarly, a cardiac rehabilitation walk was established for one of the large case study schemes that
targets patients in phase four cardiac rehabilitation.
97
Case Study Good Practice Evidence – Engagement with heart disease patients
A Cardiac Rehabilitation Programme (Action Heart) organises two weekly walks that fall under a
Walking for Health scheme’s umbrella. These walks are open to all but do include a higher
proportion of people who have heart problems, as they are advertised as a ‘moving on’ option for
people who have completed their Action Heart programme, either instead of or in addition to their
gym-based exercise.
Some patients are referred to Walking for Health after six months, but the majority after 12 months,
if they have passed their ECG stress test, which indicates that they are fit to exercise.
The scheme has demonstrated the benefits of engaging with local programmes that have a focus on
rehabilitation through the long-term maintenance of changes to lifestyle and physical activity in
rehab patients.
The case study schemes nevertheless generally faced challenges in engaging with people affected by
cancer (and other specific health conditions). Overall, schemes felt that health and social care providers
could be far more engaged with Walking for Health to help engage their target health groups. Larger
schemes with more resources, or those with identified local champions, appeared better-placed to
develop effective strategies for patient engagement. However such opportunities will not be available in
all cases. In the future, the Ramblers and Macmillan could potentially play a key role in helping to
facilitate signposting to the scheme from GPs, hospitals and support services for cancer patients. The
success and inhibiting factors associated with engaging with such health professionals, and the role of
the national programme team, are explored in more detail below.
One scheme has also attempted to establish a partnership with Boots. Macmillan facilitated this link with
Boots through their Information Pharmacists programme as an initial pilot to examine approaches to
involving Boots in Walking for Health more widely. The scheme coordinator gave talks to Boots staff at
several branches to encourage them to refer people to Walking for Health. However to date this has not
generated new participants. Interviewees felt that the reason why it has not been successful was that
signposting has been too reliant on individual Boots staff. It was felt that a more strategic and systematic
marketing campaign by Boots was required to raise awareness of the programme.
6.3 Engaging with health professionals
A further important objective of Walking for Health is to raise awareness of the value of the programme
among health and social care professionals. This is critical for encouraging the signposting of patients to
Walking for Health, as described above. Section 3.4 confirmed that specific signposting of walkers is at a
relatively low level (at around 6.5% of walkers).
The case study research suggested that certain schemes recognise the potential for the Walking for
Health association with Macmillan to facilitate engagement with health professionals and, as a result of
this, have increased their drive to engage with GPs through targeted promotion at GP surgeries. In some
cases this had led to an increase in the number of recommendations from GPs.
Alongside identifying local champions of Walking for Health, clearly where schemes are based from or
involve GP surgery staff as volunteers, the opportunities for engaging with health professionals and
hence signposting to the scheme increases. The following smaller, volunteer-led scheme provides a good

98
example of such an approach, consisting of one regular walking group that starts and finishes at a local
GP surgery.
Case Study Good Practice Evidence – Engagement with GPs
The scheme is entirely volunteer-led. It does not receive funding from any public or private sources.
The scheme coordinator is a volunteer who saw the potential benefits of Walking for Health for her
patients (in her role as a Practice Nurse).
The scheme coordinator acts as a ‘champion’ for the scheme locally; she has been pivotal in the
recruitment of both new walk leaders and walkers and her role in the surgery has been key to
engaging GPs in the benefits of walking.
The walks are advertised on the surgery website and the screen in reception. The Practice Nurse
also mentions the scheme whilst doing patients’ NHS Health Checks (for everyone aged 40-74),
cholesterol checks and at lifestyle counselling groups to people who are at risk of diabetes.
The partners and GPs at the Practice have all worked there for a number of years and know the
scheme well. GPs therefore routinely recommend Walking for Health as an option for exercise
referral. The success of the scheme has helped the surgery win the Royal College of General
Practitioners (RCGP) ‘Practice of the Year’ award. The surgery is very committed to Walking for
Health and held a celebration event to mark the fifth anniversary of the Walking for Health scheme.
A GP at the surgery gave the following feedback on the scheme, highlighting in particular the
important role of the scheme coordinator as ‘champion’ of the scheme:
“This excellent group is a place I encourage people to access with both physical and
psychological needs. Due to meeting regularly and going for some time, people with tremendous
needs end up being supportive and encouraging to others. I find it works well on many levels…
[the scheme coordinator] provides a very positive and empowering spirit. The group is highly
visible on a Tuesday afternoon and that also provides real example to the community.”
It was also evident that in the period between the two phases of the case study research (between
summer 2014 and summer 2015) some schemes had adopted a more strategic focus in their
engagement with health professionals. Over the same period there was also a small increase in the
proportion of walkers signposted from health professional (according to the database). In a couple of
cases, schemes had benefitted from the coordinator moving into the local authority’s public health team,
where they had been able to develop partnerships and referral routes with health professionals.
The case study example below demonstrates how one of the larger local authority-led schemes had been
particularly proactive in engaging with local public health agendas.

99
Case Study Good Practice Evidence – General engagement with health agendas
The scheme coordinator was regularly attending meetings at the local Clinical Commissioning
Group, which is attended by nine local GP surgeries. Through the CCG, the scheme coordinator had
linked up with district nurses and was attending their meetings to promote Walking for Health. The
scheme coordinator also attended Health and Wellbeing Board meetings every quarter which is
attended by over 30 local organisations including school nurses, sports practitioners, the Dementia
Friendly Society, and the local Citizen Advice Bureau. As a result, in 2014/15, the scheme
introduced a new walk for people recovering from a stroke or living with dementia. The scheme
coordinator also circulates a Health Walks pack to each GP and has seen an increase in the number
of GP recommendations or health professional recommendations in the past year.
It was clear from the case studies that some schemes were creating (or benefitting from) the right
conditions for stronger engagement with health professionals to develop in the future. Nonetheless, aside
from the smaller examples described above, larger local authority-led schemes were generally making
more progress in terms of developing links with health professionals. The evidence suggests that
schemes with more limited resources require guidance and additional support or staff resources to
strengthen such links.
The case studies highlighted particular reasons why some schemes face challenges in engaging health
professionals in the Walking for Health programme, aside from limited resources to promote their
schemes. For example, the coordinator of a medium-sized scheme had done two presentations to the
local Clinical Commissioning Group (CCG) but the presentations had not been able to affect the number
of recommendations from GPs – this was borne out by the scheme’s data which showed that only 3% of
walkers had been recommended by their GP or a health practitioner. A partner of this scheme
commented that it has been “difficult to change the mind-set of GPs who continue to focus on gyms as
the main route for exercise referrals”. Engagement with health professionals was shown to be constrained
in some instances by the lack of commitment of health professionals to promoting physical activity (or
Walking for Health) as a health prevention activity.
Some stakeholders felt that health and social care professionals could play more of a role in promoting
Walking for Health as a form of treatment. However external national-level stakeholders commented that
at present it is difficult for health and social care professionals to do this as Walking for Health as the
health benefits of Walking for Health as an intervention must be clearly specified and communicated to
health stakeholders:
“Its quite a busy market, health and social care, walking being one aspect…Walking for Health is
one of many things on offer…health professionals are supposed to make every contact count,
and social care making every visit count…Its been quite challenging for health and social care to
understand what’s out there.”
(local stakeholder)
External stakeholders were generally of the view that the Walking for Health programme team could be
doing more to promote the programme to the health care sector:
“They could definitely do more promotion in the general health care sector…GPs should be the
number one of the social prescribing commissioners…the programme should be trying to get
approved as a social prescribing intervention, so that GPs can prescribe it like they would do any
medication.” (national stakeholder)
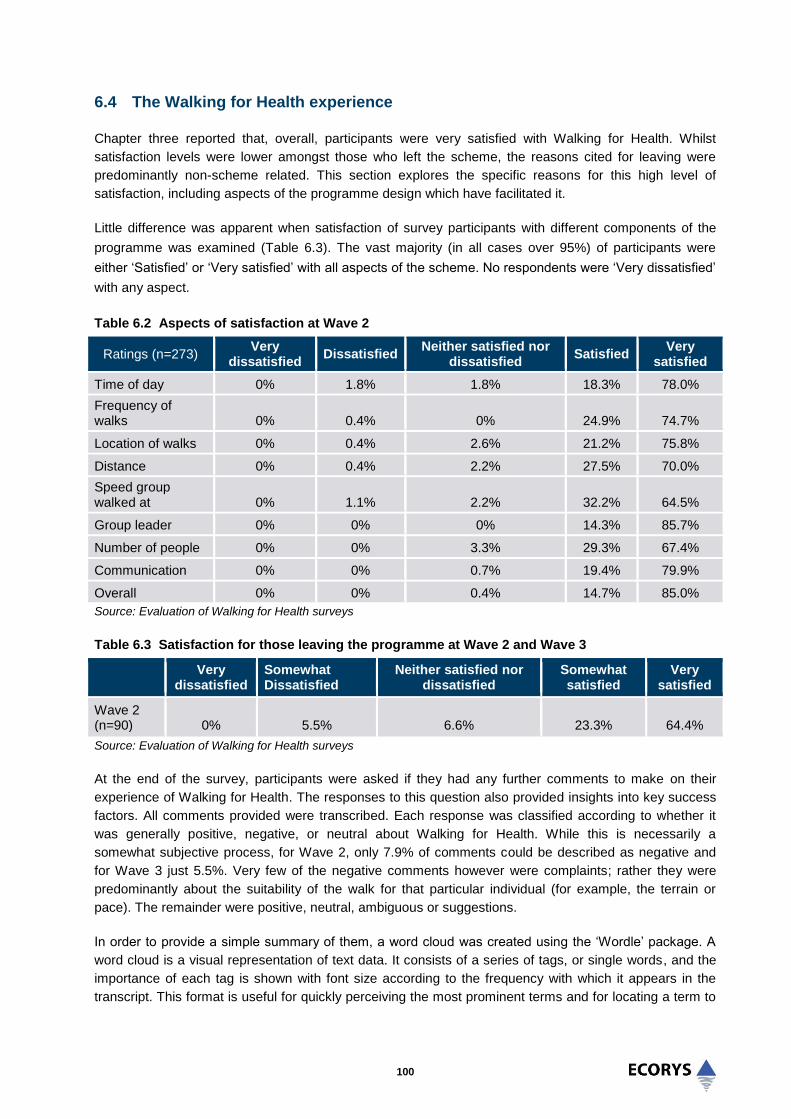
100
6.4 The Walking for Health experience
Chapter three reported that, overall, participants were very satisfied with Walking for Health. Whilst
satisfaction levels were lower amongst those who left the scheme, the reasons cited for leaving were
predominantly non-scheme related. This section explores the specific reasons for this high level of
satisfaction, including aspects of the programme design which have facilitated it.
Little difference was apparent when satisfaction of survey participants with different components of the
programme was examined (Table 6.3). The vast majority (in all cases over 95%) of participants were
either ‘Satisfied’ or ‘Very satisfied’ with all aspects of the scheme. No respondents were ‘Very dissatisfied’
with any aspect.
Table 6.2 Aspects of satisfaction at Wave 2
Ratings (n=273) Very
dissatisfied Dissatisfied
Neither satisfied nor dissatisfied
Satisfied Very
satisfied
Time of day 0% 1.8% 1.8% 18.3% 78.0%
Frequency of walks 0% 0.4% 0% 24.9% 74.7%
Location of walks 0% 0.4% 2.6% 21.2% 75.8%
Distance 0% 0.4% 2.2% 27.5% 70.0%
Speed group walked at 0% 1.1% 2.2% 32.2% 64.5%
Group leader 0% 0% 0% 14.3% 85.7%
Number of people 0% 0% 3.3% 29.3% 67.4%
Communication 0% 0% 0.7% 19.4% 79.9%
Overall 0% 0% 0.4% 14.7% 85.0%
Source: Evaluation of Walking for Health surveys
Table 6.3 Satisfaction for those leaving the programme at Wave 2 and Wave 3
Very dissatisfied
Somewhat Dissatisfied
Neither satisfied nor dissatisfied
Somewhat satisfied
Very satisfied
Wave 2 (n=90) 0% 5.5% 6.6% 23.3% 64.4%
Source: Evaluation of Walking for Health surveys
At the end of the survey, participants were asked if they had any further comments to make on their
experience of Walking for Health. The responses to this question also provided insights into key success
factors. All comments provided were transcribed. Each response was classified according to whether it
was generally positive, negative, or neutral about Walking for Health. While this is necessarily a
somewhat subjective process, for Wave 2, only 7.9% of comments could be described as negative and
for Wave 3 just 5.5%. Very few of the negative comments however were complaints; rather they were
predominantly about the suitability of the walk for that particular individual (for example, the terrain or
pace). The remainder were positive, neutral, ambiguous or suggestions.
In order to provide a simple summary of them, a word cloud was created using the ‘Wordle’ package. A
word cloud is a visual representation of text data. It consists of a series of tags, or single words, and the
importance of each tag is shown with font size according to the frequency with which it appears in the
transcript. This format is useful for quickly perceiving the most prominent terms and for locating a term to

101
determine its relative prominence. The resulting cloud is shown in Figure 6.1. The social benefits and
enjoyment of the programme come through strongly with ‘enjoy’ being the most prominent word, followed
by ‘people’ and ‘friendly’.
Figure 6.1 A word cloud highlighting the most common words used in the verbatim quotes collected in response to open ended question (Wave 3 responses)
This was also evident through the case study research. Walkers’ satisfaction with the programme and
willingness to attend regularly was supported by the sense of wellbeing it produced, as the case study
interviews indicated that Walking for Health was seen as providing a forum for like-minded people to meet
and form new friendships based on a shared interest. Therefore, while the social benefits of the schemes
can be considered to be outcomes in themselves (see section 4.2), they also help to create the conditions
for an effective and sustainable activity focused on improving levels of physical activity.
While many of the survey comments were of a generally positive nature, some specific themes within the
comments have been identified and are drawn out below.
The volunteer walker leaders, scheme co-ordinators and organisation
There were numerous positive comments about the importance of the role of the leaders in creating a
welcoming atmosphere and encouraging social interaction:
“The leaders are so welcoming and encouraging.”
(Walker: female, 65+)
“It’s all positive. The leaders are really good, they involve everybody, and no-one feels left out.”
(Walker: female, 65+)

102
The programme was also described as well run and organised:
“The schemes are really well organised, the group is very nice, it’s a really well thought out thing.”
(Walker: male, under, 65, long term or life limiting illness)
The pace and variety
Comments indicated the benefits of schemes offering a variety of walks and catering for different abilities.
“The programme is good and variable long/short…it’s perfect. Depending on how I feel I can
choose the pace.
“(Walker: male, 65+)
Corroborating this, walkers interviewed for the case studies commonly expressed their satisfaction with
the variety of walks on offer, in terms of their length, pace and intensity.
However, with a range of ability levels, it can be challenging to run walks that suit everyone in terms of
pace, length, terrain and time. There were a number of comments about this (for example that the pace
was too fast or too slow), and this was one reason why people left the programme. Often however, they
moved to other walking programmes.
“I enjoy the walks very much, but I am going to try walks that maybe help me to walk at a faster
pace.”
(Walker: male, 65+)
“The walk I did got very boring, they were very slow and people used them as a chit chat rather
than a walk, in the end it wasn’t a health walk. So I walk alone now. The scheme did not change
my habits in any way.”
(Walker: female, 65+)
“The people in the walking group were very friendly, but the walking pace was far too fast for
myself and my friend.”
(Walker: female, age not declared)
A very few individuals commented on the lack of variety in walks:
“We only go once a fortnight now as they do the same walks and one is very boring when you’ve
been several times, they are very good though…”
(Walker: female, under 65)
These comments and those in the sections above may be influenced by both an individual’s motivation
for joining the Walking for Health Programme and their life circumstances. For those for whom the social
aspects of the programme are more important, as long as they are able to keep up with the walks, the
pace or variety may not be so important. It is possible that those more interested in getting fit, or the
walking itself, may be more sensitive to the pace, location or variety of the walks.
The case studies provided further evidence on the contribution of the above factors that enable walkers to
maintain participation in Walking for Health. Walkers from across the case studies also commented that
the accessibility and length of the walks encouraged them to attend the walks on a regular basis.

103
The social accessibility of the schemes was supported by the common practice of finishing (or breaking
up) the walk with refreshments, which was highly valued by participants across the case study schemes.
“I don’t think you’d come up the Park on your own. You wouldn’t come out every Thursday at
10.30 on your own. It makes a difference, you meet up. I like socialising with people in the
group…people recommend theatres, museums as well so that’s nice, I’m looking for that the
social side as well”
(walker)
The regular schedule is seen as key to helping people sustain their physical activity:
“My Thursday morning walk is an important part of my week.”
(walker)
“…it helps to make me more regular with the activity and gives me more focus...”
(walker)
“I wanted to keep fit, but as I did not like jogging, walking seemed like the best option. I did not
have friends who were walkers, so Walking for Health was ideal.”
(walker)
As detailed in section 4.2.2, a key factor is providing opportunities for walkers to socialise and build
friendships. This is generally achieved by ending the walks near a café or other sociable environments.
Participants also often commented on the inclusive nature of Walking for Health, which helped to facilitate
the social benefits. Inclusive approaches have included:
The provision of additional support to enable people recovering from particular conditions (such as
strokes or cardiac procedures) or with learning difficulties to participate (with support from their
carers).
Shorter/slower walks that could be undertaken by people with limited mobility, including those using
walking aids such as Zimmer frames and mobility scooters.
Rural walks which enabled people to access the local countryside. This benefit was most commonly
expressed by female participants, who said they would not feel safe or comfortable walking in rural or
isolated areas on their own. In contrast, urban walks in local nature spots were valued by local
residents who could not afford to travel by car or public transport to access rural activities.
There were very few negative views from walkers interviewed through the case studies. However some
felt that it was difficult at first to mix with people on the walks because of existing cliques. It was
suggested by these participants that walk leaders/volunteers could do more to facilitate interaction
although this was a minority view.
6.5 Sustainability of delivery approaches
Two of the key objectives for the programme in the period 2012-5 relate to ensuring the sustainability of
delivery approaches. These focus on supporting schemes to secure additional funding and supporting
local schemes to recruit and retain a sufficient pool of volunteers and ensure that those volunteers are
well supported through training and resources. The role of the national programme team in supporting

104
these objectives is considered in section 6.6. This section focuses on the issues, challenges and
successes of local schemes in ensuring their sustainability.
6.5.1 Access to funding sources for local schemes
The case studies generally reflected the 2013 Audit survey results on funding sources, presented in
section 3.1, as the majority were supported by local authority funding. Whilst the case studies suggests
that a range of funders are contributing to Walking for Health, they also highlight the potential for many
schemes to further diversify their funding base through accessing external funds beyond local authorities
and the public sector.
The case studies demonstrated the importance of accessing small amounts of ‘top-up’ funding to cover
items such as the production of promotional literature and volunteer expenses. This was particularly the
case for volunteer-led schemes. One scheme for example had secured annual funding of £1,000 from a
‘Lifestyle Fund’ administered by the local Clinical Commissioning Group (CCG). The funding had been
used to produce leaflets and cover volunteer expenses, including walkie talkies for the walk leaders to
improve communication between them during the walks. Another scheme attracted an annual grant of
£5,000 per year from the Big Lottery Fund ‘Awards for All’ programme to fund meetings, overheads and
volunteer expenses. A small volunteer-led scheme received a small community grant from the local
council to support the running of the scheme (otherwise funds were raised through fundraising events
such as coffee mornings, cake sales and annual birthday and Christmas parties).
The case study evidence suggests that the local authority-led model provides a number of advantages
regarding sustainability of funding:
Local authorities are able to provide in-kind support for Walking for Health schemes through making
use of local authority owned premises free-of-charge.
Local authorities can provide greater capacity to develop external partnerships and promote the
scheme to appropriate health organisations. This can help to diversify schemes and increase take-up
from particular target groups.
Progression walks can be offered, as walk leaders are insured by the local authority to provide these.
Although these now fall outside of the Walking for Health umbrella, the progression walks offer
groups the flexibility to explore new places, try more challenging terrain or walk longer distances.
In the first phase of the research (summer 2014) there was some concern that local authorities would
start to reduce or cut their funding for the scheme coordinator posts. At this time it was felt that the
reduction of local authority resources would have a severe impact on the sustainability of the schemes.
In the second phase of the research (summer 2015) schemes appeared to be more confident that funding
would continue and that the long-term sustainability of the schemes had been secured. This can be
attributed in part to the fit with the local authority’s new public health responsibility. In one case it was
considered that there was limited risk of the scheme being affected by reduced budgets as the local
authority had identified the scheme as a priority for 2014-15 and, as a result, had freed up the Physical
Activity Specialist’s time to focus on maintaining and developing the scheme’s programme of walks.
However, there are still several challenges facing local authority-led schemes:
Some of the local authority-led schemes analysed for the case studies were focused on maintaining,
rather than expanding, their Walking for Health provision. This was partly due to the wider context of

105
local authority cuts, with a number of scheme coordinators commenting that all local authority
commitments are reviewed on an annual basis. Whilst local authorities consistently appreciated the
contribution Walking for Health makes to their public health priorities, the case study analysis
suggests that local authorities were generally not in a position to provide the additional scheme
coordinator capacity or resources that would enable schemes to expand walk numbers or diversify
types of walk on offer. A wider survey of schemes would be required to test whether this analysis is
typical of all local authority-led schemes.
There was limited evidence of local authority schemes leveraging external funding to help grow their
Walking for Health schemes (for example from the NHS). Although most local authority schemes had
developed some partnerships and referral links with external organisations, these were not levering in
additional funding per se. A possible explanation is that schemes require more time for the effects of
the refocusing of schemes through accreditation to bed in and to allow them to communicate the
benefits of schemes in terms of impacts on physical activity and health more effectively to appropriate
funding bodies.
The case studies of volunteer-led schemes demonstrate that this model of delivery can be cost-effective
and successful. One volunteer-led scheme explained that it has been able to follow the Walking for
Health ethos through ensuring that walks allow for walks of a moderate intensity, are accessible to
everyone regardless of disability or health needs and are free of charge to all. The case studies have
shown that a possible limitation of the volunteer-led model is that volunteers have limited capacity to
develop and maintain local partnerships and tap into additional sources of funding; however this is not a
general conclusion given the small number of cases in question. The national Walking for Health team
may have a role to support and complement these efforts, for example through raising awareness of
Walking for Health as a national programme and its mental and physical health benefits. Moreover, direct
support for applying for funding would help volunteer-led schemes become more efficient at raising their
own funds.
6.5.2 Ensuring a sufficient pool of volunteers
The need to ensure a sufficient pool of volunteers partly depends on maintaining satisfaction levels and
ensuring a sense of ownership. Volunteer satisfaction was explored in detail in section 4.3. Walk leaders
interviewed for the case studies demonstrated a high degree of commitment and responsibility towards
maintaining the walks they delivered. Route planning tended to be a shared activity between scheme
coordinators and walk leaders, although in one scheme a ‘lead’ walk leader was responsible for route
planning. Schemes consistently emphasised the importance of involving walk leaders in route planning, to
increase their ownership of their local scheme.
The following medium-sized local authority-led scheme operating in an urban fringe area demonstrated
the importance of volunteers in supporting the delivery of an efficient walking scheme. The case study
highlighted the importance of the scheme coordinator’s role in facilitating commitment and enthusiasm
from volunteers.
106
Case Study Good Practice Evidence – Volunteer commitment
For this scheme it was clear there is a high level of commitment amongst the walk leaders who
according to one partner organisation are always “very keen, very enthusiastic and willing to help”. If
walk leaders are not officially leading walks they will help out by engaging with the slower walkers
and ensuring that nobody gets into problems on the route.
Walk leaders invest time in doing reconnaissance prior to the walk – it is not uncommon for walk
leaders to check the route two or three times if necessary prior to doing a formal risk assessment.
They are flexible to change the planned route according to the weather or the particular needs of the
walkers attending.
The walk leaders feel valued by the scheme coordinator and are trusted to take an active role in the
planning and promotion of the scheme. The walk leaders play an active role in searching for new
walking routes and adding variety to “keep the programme fresh”. Quarterly committee meetings are
held to allow all volunteers to contribute ideas in the development of the scheme.
There is also a strong culture of exchanging information and learning amongst the volunteers and
walkers value this “strong team ethic”. Walk leaders were also highly positive about the support that
they received from the more experienced walk leaders when they started the role.
A community award scheme recognised the efforts of the walk leaders through awards for
“outstanding effort”. One walk leader who had delivered a 'walks after work' programme for the last 5
years was given an award for his “great feedback received on the quality of his walks and his
knowledge about the local area” Another received an award for his signing skills for deaf people.
The analysis above emphasises the importance of maintaining the current pool of volunteer walk leaders,
and developing further capacity to recruit, train and coordinate new walk leaders and other volunteers to
grow and diversify the programme in the future. However a challenge for some schemes was maintaining
a sufficiently large pool of volunteers to ensure cover was available if regular walk leaders could not
attend on certain weeks. One medium-sized scheme had aspirations to increase the number of walk
leaders as the current number was not regarded as sufficient to support a structured rota system for walk
leaders. There was not always a pool of reserves to draw on if a walk leader has to drop out and this is
considered a risk to the operation of the scheme. The scheme coordinator was also doubling up as a walk
leader, to address the shortfall in walk leader capacity..
A related challenge highlighted in the case study research was the external recruitment of walk leaders.
Case study evidence suggests that volunteers are typically recruited from the pool of regular walkers.
While this has been an effective method of recruitment for some schemes (as regular walkers are familiar
with the approach and ethos of Walking for Health), there is evidence from some schemes that reliance
on this method alone can become a barrier to expansion.
“We rely on a central core of walk leaders, that is one of the problems we face, the recruitment of
walk leaders. The walk leaders aren’t getting any younger, they ask the walkers if any of them
want to volunteer but it falls on deaf ears, they want to come along but they don’t want to lead the
walks, I think that is fairly typical on all the walks”
(scheme coordinator)
107
Requiring too regular a commitment was identified as a barrier to engaging volunteers:
“A lot of people don’t want to train as walk leaders as they don’t want the commitment of having
to turn out every week”
(walk leader)
Scheme coordinators identified perceptions regarding the time commitments and level of responsibilities
involved in being a walk leader as the main reasons why they faced challenges with recruitment.
The 2013 Audit asked schemes to estimate how many hours of volunteer time are contributed to their
scheme in a typical week. The responses indicate an average was 18.1 hours and a median of 10 hours
committed per scheme.
The case studies provided some examples of proactive approaches to recruitment, for example one
scheme included biographies of walk leaders in its promotional literature in order to advertise the benefits
of volunteering. In most cases however there were no particular formal channels for promoting
volunteering – recruitment was generally from the pool of more established walkers who are more familiar
with the scheme’s ethos and approach. Schemes found it easier to recruit volunteers if they had a large
committed pool of walkers to draw on.
6.6 Role of national programme team
A key aim of the evaluation is to assess the extent to which the national programme team has been
effective at engaging and supporting existing and new schemes. As set out in chapter two, the key
activities of the national team include: programme management; branding; communication and marketing;
scheme accreditation; training and volunteer development; provision of support resources; networking;
events and workshops; monitoring and evaluation; advocacy, in particular with health and social care
professionals; and migrating walkers to other Ramblers and Macmillan activities.
6.6.1 Training
An important objective of the national programme team has been to ensure that volunteers are well
supported through training and resources. This contributes to the wider programme objective of
supporting local schemes to recruit and retain a sufficient pool of volunteers.
The Walking for Health national team employs a dedicated training officer who delivers training to scheme
coordinators, who in turn cascade the training down to walk leaders. Local authority stakeholders in the
case studies generally believed that scheme coordinators were effective in executing their role of training,
managing and supporting volunteers, providing an indication of the effectiveness of the cascade training.
The cascade training has also generally been highly valued by scheme coordinators.
The take up of the training provided by scheme coordinators through the cascade approach has also
been very good. Based on data provided by the national programme team, close to 3,000 walk leaders
were trained between July 2013 and October 2014. These included a combination of new walk leaders
and existing walk leaders that had come through Natural England’s training programme but had been
advised to update their skills and knowledge.
Overall the training and insurance procedures for volunteers were seen by external stakeholders as being
well managed, and essential to the overall structure and support model. In this regard Walking for Health
was seen as an exemplar programme.

108
While the one day training programme was viewed very positively overall, some walk leaders felt too
much emphasis was placed on managing and communicating with people with particular conditions and
disabilities, who in practice would be receiving additional support to participate in the walks, as
demonstrated in the case studies. However feedback from walkers and their carers suggested that the
caring approach adopted by walk leaders and the knowledge that walk leaders are trained is a valued
part of their experience of Walking for Health.
6.6.2 Accreditation
The programme rationale for a scheme accreditation process is that promoting Walking for Health to
people who are currently inactive requires consistency in the quality of provision of short and accessible
walks. Evidence from the case studies suggests that the main role and benefit of the national Walking for
Health team to schemes in the period between 2012 and 2015 was indeed training and guidance relating
to the process of accreditation. This support was seen as crucial in helping to provide an overall structure
for the local management and delivery of Walking for Health schemes but also to support the branding of
Walking for Health as a programme of health walks (through ensuring consistent provision of short and
accessible walking opportunities for inactive people). The accreditation process was designed to support
broader objectives for the programme including raising awareness of the value of Walking for Health
among health and social care professionals.
Several of the case study schemes commented that the new accreditation requirements (detailed in
chapter two) had improved the structure and quality of Walking for Health locally. For example it was felt
that the accreditation process helped to make some schemes’ management approaches more structured.
In some cases the process of accreditation led directly to the introduction of 10-30 minute walks. The
Walking for Health accreditation is also viewed as important in providing a “badge of quality assurance”
and giving the schemes a brand identity – local stakeholders commented that the consistent provision of
shorter walks are what makes the programme different from other walking groups offered.
The first phase of the case study research suggested a mixed reception for introduction of shorter walks;
however responses were generally more positive during the second phase of the research. This
appeared to reflect the increasing buy-in of the schemes to the idea of shorter walks as a means of
attracting less active people.
However some scheme coordinators and stakeholders interviewed as part of the case studies continued
to believe that shorter walks had limited appeal and were less popular. This may suggest that the
provision of shorter walks needs to be combined with efforts on the demand-side to attract more people
with longer-term health conditions and people who are inactive which the shorter walks are targeted at.
Wider stakeholders viewed the move to focus Walking for Health on short walks positively as it is
recognised that the real impact organisations can make is in moving people from inactivity to activity. As a
result of accreditation, Walking for Health is seen as resonating well with the public health policy focus on
moderate activity. One local authority stakeholder felt the introduction of the shorter walks was timely and
was the main reason they had commissioned the scheme locally:
“That was one of the requirements that you must have the entry level walks. That coincided with
the national change so that worked well locally as that’s what we were asking for anyway”
(local authority representative)
There was also still some concern from schemes that the cap on the progression walks limited the
programme, as progression walks addressed a gap between the longest walks offered by Walking for
Health of 90 minute walks and the Ramblers provision. It was felt that the previous arrangement whereby
progression walks could be seen as a recognised part of Walking for Health delivery had encouraged

109
some people to increase their activity levels within a familiar environment. Concerns were raised that the
removal of progression walks from Walking for Health made their provision more dependent on local
authority funding at a time of spending cuts.
6.6.3 Volunteer recruitment
As highlighted above, most of the case study schemes were very reliant on recruiting walk leaders and
other volunteers from within their existing pool of walkers, and some were consequently struggling to
maintain their current walk programme. Some walk leaders felt there was a particular opportunity for the
national team to help increase the pool of volunteer walk leaders – it was felt that Ramblers would be able
to identify potential volunteers from the pool of volunteers already supporting Ramblers walks. This could
be a potential avenue for building the capacity of Walking for Health schemes, by increasing the pool of
walk leaders (as well as their ethnic diversity). The Macmillan ‘volunteering village’ has been promoted to
schemes as a possible source for recruiting new volunteers but there was little evidence of take-up of this
opportunity in the case studies.
6.6.4 Helping local schemes to access funding
There was no evidence that the involvement of Ramblers and Macmillan had helped to secure in-kind
resources for schemes, although external stakeholders valued the national programme team’s role in
raising the profile of Walking for Health to potential commissioners through the Walking Works report,
which was produced by The Ramblers and Macmillan to provide an overview of research on the benefits
of regular walking. It was felt that the findings from the report, in particular the benefits of walking in
terms of health outcomes will help scheme leads to influence potential local funders.
A number of scheme coordinators envisaged that the Macmillan and Ramblers association with Walking
for Health should be useful in securing external funding, and possibly sponsorship, in the future. Several
schemes felt that this would be essential in expanding their scope and increasing participation levels
going forwards as funding would enable the schemes to enhance their promotional activity. One
volunteer-led scheme suggested the Walking for Health team could help improve the sustainability of the
programme by providing support for grant applications.
The case study research did not find any evidence that the Macmillan and the Ramblers brands had
played a part in helping to secure in-kind inputs for local Walking for Health schemes to date. Feedback
from the schemes was that it is too early to have seen any evidence of impact; however schemes expect
the brands to play an important role in the future.
6.6.5 Other on-going support and advice
In terms of other on-going support and advice, the regional development officers (RDOs) and support
officers from the national programme team liaise with the scheme coordinators themselves, via phone
and email, or in person. Some scheme coordinators have attended regional network meetings and have
found these a useful opportunity to share information and good practice with other schemes.
Most of the external stakeholders consulted had accessed the Walking for Health website, but some had
only done so as a precursor to the interview. Most stakeholders were positive about the website content.
Overall the website was seen as being easy to navigate, using clear fonts and images. Several
stakeholders commented that they found it easy to find the Walking Works report on the website. One
stakeholder commented that it was not very overt which organisations were running the programme.
One external stakeholder commented that the new website was a “definite improvement”, although it
seemed more geared to the needs of health and social care professionals than beneficiaries. Another

110
stakeholder commented that evidence demonstrating the benefits of walking could be stated more clearly
upfront on the website in a “Research has shown” section, and felt that more facts and figures could be
provided in the “benefits for people” information in the general section to encourage participation. The
local authority stakeholders consulted referred to the website regularly for information and found it useful.
Generally, the website and e-alerts tailored for walkers, walk leaders and scheme coordinators were
viewed positively. The level of support provided by the RDOs was also viewed positively given their
capacity constraints and the reduction in resources for the RDO roles compared to the period prior to
2012 when Natural England were running the programme. It is understood that in 2012 the number of
RDOs was reduced from nine to three.
6.6.6 National level advocacy and promotion
The national programme team recognised that it was important to develop the identity and branding of
Walking for Health before commencing a systematic programme of engagement with national health
organisations. National level promotion and advocacy was therefore less of a priority for the national team
in the first three years and the programme’s resources focused on ensuring that schemes reached a
common standard in the delivery of health walks via the accreditation process.
Examples of the national programme team’s approach to national level advocacy included two planned
press pushes a year; for example a cancer press push in summer 2014 saw Walking for Health on the
front page of a number of national newspapers. There have been examples of other effective promotional
work although this appears to have been taken forward on a reactive basis when approached by other
organisations. For example an article in the British Heart Foundation's support magazine generated an
increase in calls from potential walkers interested in joining walks. In Slimming World, there was a case
study and guidance on walking that goes out to half a million people who are interested in improving their
physical activity.
Some external stakeholders were unable to comment on the national team’s promotional work as they
had not previously been made aware of the programme – this may be indicative of the lower priority
afforded to national level advocacy in the first three years. However Ramblers and Macmillan were seen
as being well placed to raise the profile of the programme, and bring their different expertise and
audiences together. Most of the national stakeholders consulted for the evaluation had limited knowledge
of the Walking for Health programme. Some had some broad knowledge of the aims of the programme
but had not worked jointly with the national team. One stakeholder commented that they had heard about
Walking for Health through the Fit as a Fiddle programme, run by Age UK. The stakeholder was unclear
about the link between Age UK and Walking for Health, and thought there could be real benefits for
Walking for Health in linking up with Age UK to promote the programme to Age UK service users.
Some external stakeholders identified specific challenges around promoting Walking for Health, as
described above and would like to know more about Walking for Health to encourage them to support the
programme at a national, regional and local level. One stakeholder highlighted that the training standards
reached by the volunteer walk leaders could be promoted more clearly, to reassure participants with
health conditions that any emergencies would be well managed. This would also reassure health
professionals signposting people to the programme. Some would feel more confident promoting Walking
for Health if they were able to cite a robust evaluation demonstrating the tangible benefits of walking.
6.6.7 Marketing and branding
Several schemes felt the new branding was an improvement, and more clearly demonstrated the health
benefits of the programme. In the first phase of the case study research (spring/summer 2014) some

111
schemes were concerned that the Ramblers connection might be off-putting for people seeking more
moderate exercise, given the traditional association of the Ramblers with longer, more challenging walks.
This concern regarding the Ramblers’ role was less apparent in the second phase of the research in
summer 2015.
Free templates have been created which schemes can use – these are free and include programme and
poster templates with all the necessary branding that schemes can just drop their walk details in. The
interviewees believe that the new posters are much improved and that the Walking for Health branding is
useful as a means of promoting the health benefits of the scheme.
Furthermore, in the first phase of the case study research several local authority led schemes reported
that they were not using the new national branding as they thought this would be confusing for users;
however this has changed as schemes are now required to use the main logo as part of the accreditation
process.
Overall external stakeholders felt Walking for Health’s messaging is correct for attracting those who are
the least active and key target groups including those with long term health conditions including cancer:
“I think Walking for Health is a much better brand for the programme than the Ramblers…there
might be someone there that understands their health needs, and its less intimidating. Everyone
sees Ramblers as these hearty older people who go off and do twenty mile walks, whereas this is
seen as less intimidating”
(national stakeholder)
External stakeholders were keen for Walking for Health to retain a consistent message, as it is seen to be
a very enduring programme, which is well promoted through word of mouth and volunteers.
As above, some stakeholders felt Walking for Health’s messaging could be strengthened by enhancing
the evaluation evidence demonstrating the health benefits of walking activity, although some were aware
that the Walking Works report has been endorsed by Public Health England.
Stakeholders felt there was potential for greater ‘joint messaging’ across national level public health
organisations to increase the take-up of moderate-intensity outdoor activities by physically inactive
people:
“I think there is an opportunity for us all to get together and talk about how physical activity in the
natural environment is positive for people’s wellbeing, the broad evidence is indisputable in my
mind…irrespective of whatever condition they have…I think there is an opportunity for us to be
more joined up in talking about physical activity and the natural environment”
(national charity representative)
Developing a consistent brand and product identity was seen by stakeholders as key to engaging with
health stakeholders and attracting additional funding from local authority and health sector
commissioners.
Stakeholders also highlighted the importance of developing strong case studies and disseminating these
at national conferences as there are too many stakeholders to target individually.

112
6.6.8 Supporting scheme engagement with specific target groups
Wider stakeholders were unable to comment on the extent to which Macmillan and the Ramblers have
supported partnership working and stakeholder involvement in Walking for Health locally. Local authority
stakeholders felt the Ramblers and Macmillan have supported partnership working locally to some extent,
mainly through the work of the RDOs. However, wider stakeholders suggested that creating partnerships
with other large, national charities is key to promoting Walking for Health to a wider audience.
A challenge of the targeting as it stands at the moment is that it assumes that all of the groups can benefit
equally. Public health and local authorities can have specific target groups that they are interested in
tailoring the Walking for Health message to, so it is believed that Walking for Health needs to join up with
other local strategies that target particular groups. Promotion was seen to be primarily the responsibility of
local scheme coordinators; however it was felt that the national programme team have a continuing role
to play in identifying good practice approaches to targeting and then promoting its take-up through
promotion to the schemes.
6.7 The partnership
Stakeholders were generally positive regarding the rationale, operation and effectiveness of the
Macmillan and Ramblers partnership. The rationale for the partnership was clear to many stakeholders
given the depth of Macmillan’s experience of engaging and developing relationships with health
professionals and groups and Ramblers’ vast experience in supporting the delivery of organised walks
(as well as engaging people in physical activity). One stakeholder commented that the programme has
demonstrated how charities can work together effectively to deliver a national programme for physical
activity.
Interviews highlighted some operational ‘teething problems’ in the relationship. This was partly a result of
the different cultures and ways of working of the two organisations given that ‘one is a big charity and the
other a smaller charity’. However there was a sense from the interviews with stakeholders (internal and
external) that the initial operational problems had been addressed and that roles and responsibilities in
the management and operation of the programme had become more clearly defined.
6.8 Summary and conclusions
The analysis in this chapter has addressed a key evaluation aim which is to identify and share key
learning that can inform the development of the programme.
The key findings with regard to process lessons at the scheme level are as follows:
The evidence suggests that local schemes use a variety of methods in support of the recruitment of
new walkers, with varying degrees of effectiveness. The most effective methods of promotion have
been word of mouth and posters in community outlets. Volunteers also play an important role in
recruiting new walkers. There is a risk however that reliance on word of mouth can limit a scheme’s
ability to engage with more diverse groups of walkers including those affected by specific health
issues.
113
There is a general consensus amongst stakeholders that a balance needs to be struck between
Walking for Health offering a targeted approach to delivering health walks, focusing on specific
groups, and trying to benefit the greatest number of people by offering walks that are open to all. The
evidence nevertheless suggests that there is scope to improve the promotion of the programme to
specific target groups to help recruit more walkers from these groups.
Schemes increasingly recognise the potential for the Walking for Health association with Macmillan to
facilitate engagement with health professionals and, as a result of this, there are some signs that
schemes are increasing their drive to engage with GPs through targeted promotion at GP surgeries
and engagement with health professionals and commissioners more generally. However generally
schemes face challenges in increasing this engagement because of resource constraints.
The schemes have had limited success in engaging people from BME groups and deprived
communities. Generally the case studies point to the need for schemes to engage more effectively
with wider strategies to address health inequalities in order to support scheme targeting. The
evidence also suggests there is potential for recruiting more walk leader ‘champions’ from the target
populations.
The viability of the Walking for Health programme is based on a volunteer walk leader model, with
volunteers generally providing the majority of the hours required to deliver the programme. The
reliance on volunteers creates challenges to some schemes’ in terms of maintaining a sufficient pool
of volunteers to sustain regular weekly walks.
The majority of schemes are supported by local authority funding. Although most local authority
schemes had developed some partnerships and referral links with external organisations, these were
generally not levering in additional funding per se.
The case studies highlight the potential for many schemes to further diversify their funding base
through accessing external funds beyond local authorities and the public sector. The evidence has
shown that even small pools of money can be useful in supporting the sustainability of schemes, for
example by supporting targeting activities and volunteer recruitment.
The case study research has demonstrated examples of good practice in attracting people with long-
term health conditions, engaging with health professionals and engaging with harder-to-reach groups
who are physically inactive. There were examples of successful referral schemes whereby cancer
and heart patients are referred directly on to the programme and schemes which use health talks at
community meeting points to reach out to people living in deprived areas.
Overall the evidence also points to a need for schemes to link up more effectively with the broader
physical activity strategies and programmes within their local areas as Walking for Health can
potentially support strategies and actions to engage specific groups in physical activity.
The evidence identified a number of factors which have helped to facilitate the high satisfaction levels
as well as the physical activity and social benefits derived from Walking for Health (these were shown
by the survey responses and were common across many of the case studies). Specific factors
included: the regularity of walks; the role of the walk leaders in creating a welcoming atmosphere and
encouraging social interaction; walks starting and ending in accessible locations; the variety of walks
and catering for different abilities; and providing the conditions for social interaction beyond the
walking activity, such as starting and finishing at appropriate meeting places such as cafes.
The analysis in this chapter has helped to assess the extent to which the Walking for Health national
programme team has been effective at engaging and supporting existing and new schemes. The key
findings and learnings in respect of this objective are as follows:
114
The national team’s key role in the 2012-15 period has been to roll out scheme accreditation to
ensure the Walking for Health ‘product’ is fit for purpose. There is a broad consensus that this role
has been executed effectively.
The take up of training to volunteers provided by a cascade approach whereby scheme coordinators
are trained as trainers has been very good and the training approach highly valued.
The national programme team has to date had limited involvement in helping to support the targeting
and engagement efforts of the schemes and partnership development (including support for
sustainability).
The national programme team has played an important role in developing Walking for Health
branding in order to ensure that the national programme and delivery at the local level is fit-for-
purpose as a programme which promotes health walks to people with long-term health conditions and
those who are currently inactive. Raising the profile of Walking for Health could be helped by more
targeted promotion by the national programme team.
There is potential for the national programme team to play a greater facilitative role in rolling out good
practice approaches particularly with respect to the targeting of BME groups, people living in deprived
communities and in targeting people with health conditions through engagement with health
professionals and health bodies.
The key recommendations that emerge from this chapter (and others) are included in chapter seven.
115
7.0 Evaluation Conclusions
7.1 Introduction
This chapter summarises the findings and learning points from the evaluation research. In the sections
below, conclusions, learning points, and specific questions for further research are addressed in relation
to the programme objectives and key evaluation criteria. Each section includes specific recommendations
for consideration by the national programme team and local schemes. The final section highlights some
key methodological lessons from the study.
7.2 Relevance
The aim of Walking for Health is grounded in a strong rationale, based upon evidence of the importance
of physical activity in reducing long-term health risks and the potential for physical activity to help people
living with and beyond cancer. The programme also strongly complements the growing body of evidence
highlighting the benefits of physical activity for personal wellbeing and overall quality of life. It aims to be
an inclusive scheme with the potential to increase the activity levels of a large number of people nation-
wide, due to the fact that it is free to take part in, participants do not need any special equipment and
walking is a manageable activity for people of different abilities. Walking for Health groups are especially
suited to introducing people who are inactive to physical activity – “stepping up” – or to supporting others
to remain active when health problems occur – “stepping down”.
The national programme team has responded effectively to the changing policy agenda by putting
Walking for Health schemes on a firm footing to promote themselves within the changing policy funding
context. This has been achieved by allowing local schemes (through the accreditation process) to
develop a clearer product identity with potential appeal to health commissioners.
7.3 Participant outcomes
An important focus of the evaluation has been the extent to which the Walking for Health programme
generates positive outcomes and impacts for participants. Programme achievements have been explored
with respect to changes in overall physical activity, including walking and sitting, people’s wellbeing and
improvements in general health.
It is important to note that the evaluation was conducted while changes to the composition of the
schemes, through the accreditation process, were taking place and new marketing and promotion
initiatives were being implemented by the national programme team. The impacts of some of these
changes are shown by the case study analysis; however, given the timing of the evaluation’s longitudinal
survey (which pre-dated the completion of the accreditation process in March 2015), it has not been
possible for the survey analysis to consider the impact of these programme changes on participant
outcomes.
Based on the findings of the survey from the period March 2014 – June 2015 and qualitative responses
from the case studies, the following conclusions are made with regard to participant outcomes of Walking
for Health:

116
Overall, participants in Walking for Health maintained their levels of weekly physical activity over the
full period of the survey (8 months), even allowing for some drop out. This is a positive finding given
the aims of the programme to sustain moderate-level physical activity, and the older target group
engaged. On average, participants were undertaking around 2.5 days of (at least 30 minutes)
moderate physical activity at the baseline and final follow-up stages. Furthermore, half of the
respondents reported that it was unlikely they would have found a similar scheme in the absence of
Walking for Health. Qualitative evidence pointed to the importance of Walking for Health in helping
older people to maintain their physical activity when stepping down from more vigorous or other
walking activities.
Amongst the minority of respondents who increased their level of activity between Wave 1 and Wave
3 of the survey (including people who self-reported themselves as inactive at Wave 1 according to
standard definitions), positively, a proportion of these attributed this change to involvement in Walking
for Health. However (and aligning with the findings above on the engagement of target groups), it
should be noted participants continuing on the programme after four months were generally more
active and healthier than those who ceased participating.
Walking for Health leads to a significant short-term overall increase in levels of weekly physical
activity after first joining the programme; however this increase is generally not sustained. Statistically
significant increases in levels of walking (38.2 more minutes per week) and moderate physical activity
(1.17 extra days of at least 30 minutes per week) were detected through the survey after the four
month interval. However, at the eight month mark, physical activity levels had dropped back to those
immediately after the first walk. One possible explanation for this trend is that the initial enthusiasm of
walkers, as well as the opportunity to try out different types of walks offered by some Walking for
Health schemes, drives this initial increase, before walkers settle back into more manageable levels
of activity. A minority of respondents also dropped out of Walking for Health schemes altogether
(including some who were ‘inactive’ at Wave 1).
Comparison of outcomes between those continuing to participate and those ceasing at four months
suggests that those who are more engaged in physical activity and walking at the start are more likely
to stay on the programme.
There was an improvement observed in a number of measures of wellbeing. Statistically significant
improved scores were observed for general mental health (as measured by the Warwick Edinburgh
Mental Wellbeing Scale), loneliness, and social interaction. Overall life satisfaction did not change.
The qualitative responses to the survey and in-depth interviews conducted for the case studies
confirmed that the social aspects of Walking for Health represent an important benefit for many
participants, for example the opportunity for increased social interaction.
There was no evidence of improvements in reported quality of life as measured by EQ-5D DS scores.
Similarly there was no improvement in self-reported health status, as measured by EQ-5D VAS
scores. Participants continuing on the programme after four months were generally healthier than
those who ceased participating.
Corroborating the finding from the national programme team’s survey that 69% of volunteers were
very satisfied with their Walking for Health experience, walk leaders who were interviewed during the
case study visits appeared to be highly satisfied. Key benefits for volunteers were increasing levels of
physical activity and the enjoyment gained from being able to give something back to the community.

117
Overall, the evidence suggested a number of factors that have helped to facilitate high satisfaction levels,
as well as the physical activity and social benefits from the programme:
The regularity of walks, in particular opportunities to attend walks on a weekly basis.
The role of the walk leaders in creating a welcoming atmosphere and encouraging social interaction.
Walks starting and ending in accessible locations.
Allowing walking groups to divide into smaller groups of faster and slower walkers when requested by
the walkers.
The variety of walks and catering for different abilities.
Providing the conditions for social interaction beyond the walking activity such as starting and
finishing at appropriate meeting places such as cafes.
Being free of charge and open to all.
Evaluation recommendations:
Strategies and actions should be developed to focus on retaining those on Walking for Health
schemes, who are less active to begin with. This could be achieved through more intensive support,
and/or by tailoring walks to their needs.
7.4 Economic analysis
The economic analysis of the programme has utilised a number of approaches.
A cost-effectiveness approach, based on analysis of the relationship between the physical activity
outcomes of the Walking for Health programme at four months and programme expenditure, derived a
ratio of £0.83 per MET hour gained (or £0.42 in the more optimistic assumption). This is well within the
range of cost-effectiveness ratios derived from evaluations of comparable interventions.
Using data from the survey as an input to the MOVES model suggests that the Walking for Health
programme has the potential to be highly cost effective, at £3,691 per QALY gained. Although there is a
cost associated with the programme, the evidence suggests that it is more cost effective than no
intervention at all due to the additional QALYs it generates. The estimated cost per QALY is substantially
less than the NICE recommended threshold cost of £30,000 per QALY gained. The potential return on
investment (or benefit-cost ratio, which compares the value of QALYs gained with the cost of the
programme) is estimated to be £3.36 per £1 spent.
The MOVES model assumes that the physical activity undertaken for any evaluated programme is
additional to what would have occurred in its absence. Whilst no counterfactual data was available to
Future research priorities:
Further investigation of why participants’ levels of physical activity tend to decline four months
after starting to participate in Walking for Health.
More systematic research on schemes’ links to progression opportunities (including walks and
other physical activity): opportunities, barriers and good practice.
118
thoroughly test this assumption with regards to Walking for Health, this scenario is broadly consistent with
the overall evaluation finding that Walking for Health helps participants to maintain a level of regular,
moderate-intensity physical activity. The analysis is also based conservatively on the specific time spent
undertaking walking through Walking for Health (rather than assuming that Walking for Health impacts on
all physical activity, even if it may do so in practice for some participants). This equates to 75 minutes of
walking per week. MOVES also assumes that the level of physical activity is maintained over the longer-
term (in the base case for 5 years or more); this is necessary for physical activity to generate sufficient
positive health gains (as well as being consistent with the objectives of Walking for Health to help people
to remain active). However, even after adjusting these assumptions through sensitivity testing (shorter
time horizon, lower level of additionality), the cost-effectiveness results remain positive.
The assumptions underpinning the model suggest there is a need for additional research into the longer-
term impacts of Walking for Health on changes in physical activity in order to analyse how far walking
behaviour is sustained in future years.
A limitation of applying the MOVES model in a national evaluation exercise is that it can only effectively
provide an assessment of a ‘hypothetical’ scheme which reflects the average cost per participant based
on national data. It is limited therefore in terms of comparing the cost-effectiveness of different types of
delivery approaches and does not account for differences between schemes in set up costs or ongoing
maintenance costs.
Evaluation recommendations:
The national programme team should consider applying cost-benefit modelling to a variety of
scheme types in order to demonstrate the value for money of the Walking for Health ‘product’ to
potential commissioners. The application of the MOVES model, for example, to local schemes (i.e.
using local scheme inputs) could be potentially appealing to commissioners as it can show the potential
value for money of investing in Walking for Health providing certain conditions are satisfied (for example x
number of walkers are engaged over a four month period, x% of participants are inactive etc).
7.5 Meeting specific programme objectives
This section returns to the key process objectives highlighted in chapter two in order to provide an overall
assessment of the programme’s progress and achievements between 2012 and 2015.
7.5.1 Widening the programme’s reach to people who are currently inactive
Over the period 2012-2015 the Walking for Health national programme team has sought to increase the
availability of and participation in Walking for Health so that people who are currently inactive, or who
need support to remain active, are encouraged to walk to improve their health and wellbeing. Participants
who are new to the programme have similar levels of activity to the population as a whole and it has not
been possible to do trend analysis to assess whether the programme is improving its effectiveness in
Future research priority:
The national Cost Benefit Analysis of Walking for Health using the MOVES model should be
updated once more robust longer-term impact data is available for the programme, and in
particular data on how long participants remain engaged in walking and/or other physical activity.

119
targeting inactive people is over time. The survey findings indicate that only a small proportion of
participants move from being inactive at baseline to active after eight months.
Overall, the evidence nonetheless points to the effectiveness and long-term potential of the Walking for
Health brand in promoting the programme to those who are currently inactive. The accreditation process,
which has been a key focus of the national programme team, has provided an overall structure for the
local management and delivery of Walking for Health schemes and supported the branding of Walking for
Health as a programme of health walks (through ensuring consistent provision of short and accessible
walking opportunities for inactive people).
The accreditation process and the resulting reductions in the number of registered walkers and numbers
per scheme has made it difficult to provide an assessment of the effectiveness of the programme’s
engagement approaches in the 2012-15 period. The recent decline in the number of schemes is largely
attributed to the accreditation process as some schemes merged with others as a result of the process
and some did not apply for accreditation and are therefore no longer recognised as Walking for Health
schemes. The reduction in schemes has therefore also affected overall attendance levels.
Case study evidence nevertheless shows that schemes use their resources efficiently to promote the
scheme to prospective walkers. While word of mouth is often important, the distribution of leaflets and
posters provide an effective means of attracting new walkers. Volunteers also play an important role in
communicating the benefits of the schemes to the wider community of potential participants. The case
studies suggest that there is still scope for schemes to improve their engagement approaches through
more focused targeting of local clubs, community groups and retail outlets.
Targeting specific groups
A particular aim of Walking for Health is to reach those that need the most support, including people
affected by cancer and other long-term health conditions, and those from recognised health inequality
groups such as older adults, BME communities and people on lower incomes. A related objective is to
raise awareness of the value of Walking for Health among health and social care professionals and
encourage them to signpost patients to Walking for Health.
Increasing effectiveness in targeting people affected by cancer is shown by analysis of the database
which indicates an increase in the proportion of walkers affected by cancer. In the year to March 2015,
4.3% of all walkers and 7.3% of new walkers were affected by cancer. This is a higher proportion than
suggested by the analysis of the 12 months up to September 2014 when 3.3% of all walkers and 5.6% of
new walkers were affected by cancer.
Although a significant percentage of participants have reported living with health conditions, the
prevalence of health conditions would be expected to be high in older adults who form the majority of
participants. It is noteworthy that participants appear to be healthier than would be expected of a general
Future research priority:
The national programme team should continue to monitor changes in participation numbers
(including new walkers) against a new baseline position in March 2015, the date when the
accreditation process was completed.

120
population sample of comparable age. It is reasonable to assume however that the programme will attract
an increasing proportion of walkers affected by long-term health conditions in future years given the
effectiveness of the accreditation process in developing a clearer brand identity for Walking for Health as
a programme of health walks.
Regarding other key target groups, programme data on the profile of participants shows that the
programme attracts a very small minority of people from BME groups. Moreover, in the year to March
2015, 5.3% of walkers lived in the 20% most deprived areas using the Index of Multiple Deprivation (IMD)
according to the database.
Targeting people with long-term health conditions could be improved through more targeted promotion by
the national programme team to health professionals and health bodies. This is seen as an important step
to ensuring that Walking for Health can be recommended through social prescribing and local exercise
referral schemes.
The findings also suggest that work is needed to engage more effectively with BME groups and lower
income groups. There is potential for Waking for Health to complement the every step counts programme
which is a 12 weeks outreach programme as Walking for Health provides a natural progression by
providing more sustainable walking opportunities. A key lesson from this programme was highlighted as
needing to build relationships with community champions who can promote the walks and be trained to a
walk leader in order to attract hard to reach groups to walking. There is a potential to embed the lessons
from this programme into Walking for Health.
A further learning point from the case study research is using particular venues (for example local
pharmacies) with close links to the community to raise the profile of walking groups to local communities.
With guidance from the national team, local schemes could also be more proactive in developing links
with Health Champions114
.
Evaluation recommendations:
The national programme team should place greater emphasis (and resources) on mechanisms to
identify and share information and good practice on specific targeting approaches. There is scope
to develop more resources for schemes such as templates for action that can be adapted to local
circumstances. The evaluation research has identified a number of examples of engagement with health
professionals that provide examples of good practice sharing and should be replicated across schemes,
where relevant:
Strengthening links with (or being managed from within) the local authority public health department
as this facilitates working relationships and opportunities for increased partnership working with the
wider health community.
Targeted promotion at GP surgeries by sending Walking for Health promotional packs including
leaflets and posters.
Regular attendance by the scheme coordinator at meetings of CCGs and Health and Well Being
Boards to promote the Walking for Health schemes and establish links with specific health bodies and
groups.
114
Health Champions are trained volunteers who are helping to transform health and wellbeing in their communities.
Health Champions work in a range of settings, including GP Practices and acute hospitals
http://www.altogetherbetter.org.uk/health-champions

121
Community champions with existing links to GP surgeries training to be walk leaders and starting
groups from the surgery.
Establishing referral schemes with patient recovery programmes to Walking for Health walks.
Including Walking for Health on local exercise referral systems which are used by medical
professionals.
Encouraging Walking for Health schemes to engage with and meet the criteria for social prescribing
and exercise on prescription initiatives.
Working with national bodies to ensure incentives are in place for GP surgeries to signpost to the
programme – one mechanism highlighted in the interviews was to ensure that referrals to physical
activity schemes had Quality and Outcomes Framework (QOF) points.
The efforts of local schemes should be supported by increased engagement with national level
health bodies from the programme team, as a step towards ensuring that Walking for Health can
be recommended through social prescribing and local exercise referral schemes (as well as to
help increase the engagement of particular groups with health conditions). For example, it was
suggested that Walking for Health should work with national bodies to help ensure that sufficient
incentives are in place for GP surgeries to signpost to the programme – one mechanism highlighted was
to ensure that more local surgeries adhere to the voluntary Quality and Outcomes Framework.
Specific national bodies and networks that the programme could engage more intensively with include:
Mental health charities.
Charities supporting older people.
Other large charities connected with the health and social care sector.
Ramblers and Macmillan should also enhance links with Public Health England, for example
through more targeted promotion of the Walking for Health ‘product’ and its appeal to
commissioners. This is particularly important given Public Health England’s role in supporting public
health teams in local authorities to develop health prevention strategies. The development of Walking for
Health as a specific preventative intervention that can be promoted to commissioners is taken up further
below in the section on funding and sustainability.
It is recommended that the national programme team promotes Walking for Health as a vehicle for
supporting people to maintain independent living and reduce social isolation. Much of the work
around promoting the health benefits of Walking for Health has focused on the physical activity health
benefits, for example the Walking Works report. The evaluation survey evidence points to the social
benefits of Walking for Health, in particular its effect in reducing loneliness and social isolation, which
could be used a basis for engaging with organisations such as the Social Care Institute for Excellence
(SCIE).
Schemes should be encouraged as much as possible to develop links with local physical activity
strategies. This should ensure that the Walking for Health product is offered as part of a ‘pathway’ to
increasing physical activity, linking to potential progression opportunities and by supporting local actions
focused on targeting specific groups that are currently inactive.
The national programme team should identify further ways to promote the health benefits of
Walking for Health in order to attract people who are currently inactive. For example more facts and

122
figures on the benefits of walking and physical activity could be provided in the “benefits for people”
information in the general section of the Walking for Health website to encourage participation.
7.5.2 Funding and sustainability
The national programme aims to ensure the financial sustainability of Walking for Health schemes, and
support existing and new schemes to secure additional funding. Local authorities make a significant
contribution to the funding of local Walking for Health schemes particularly by funding the scheme
coordinator role. The case studies have demonstrated the advantages of the local authority-led model
namely the capacity of some scheme coordinators based within local authorities to develop external
partnerships and promote the scheme to appropriate health organisations in order to help diversify their
schemes and increase take-up. Over the period of the evaluation there appeared to be an increasing
confidence that funding would continue and that the long-term sustainability of the schemes would be
secured. This can be attributed in part to the fit with the local authority’s new public health responsibility.
Such engagement is seen to be more challenging for volunteer-led schemes as these generally have
more limited staff capacity and connections to develop such relationships.
However in some cases scheme coordinators still only have limited time to spend on Walking for Health
as this role is combined with other responsibilities. Case study evidence shows that additional funding
gained from sources such as the Big Lottery Fund and funding provided through local funding
programmes (e.g. initiatives delivered through of health and wellbeing boards) can nonetheless make a
valuable contribution to the financial overheads of delivering Walking for Health schemes.
Based on the case study research to date there is little evidence that the brands of Macmillan and the
Ramblers have helped to secure in-kind inputs. This suggests that further guidance or sharing of good
practice is required on ways of using the Macmillan and Ramblers branding, in order to attract resources
from wider partners. However it will also be important to build on the accreditation process by promoting
Walking for Health as a clearly defined and identifiable product that not only meets social prescribing
criteria but also fits into developing pathways to participation in physical activity.
Future research priority:
Mapping walking group locations against the country’s most deprived areas to provide an
assessment of Walking for Health’s accessibility for people on lower incomes.
Research into the specific needs of different target groups and their experience of Walking for
Health
Future research priority:
Mapping schemes success in accessing additional funding sources so good practice can be
identified and shared.

123
Evaluation recommendations:
The national programme team should support the financial sustainability of local schemes by
helping to develop the Walking for Health ‘offer’ to local commissioners. This could be taken
forward through the following actions:
Developing the case for Walking for Health as a specific preventative measure to commissioners –
this means providing a clearer specification on what a typical Walking for Health scheme provides as
a preventative intervention including scheme-related inputs, outputs and health outcomes. Drawing
on the lessons from the modelling of programme cost-effectiveness from this evaluation, the cost and
benefits of a typical Walking for Health scheme could be used to demonstrate potential cost savings
to the NHS and health benefits.
Highlighting reassuring evidence to participants and GPs that walk leaders are well trained and safety
procedures are in place on the walks.
Identifying and sharing good practice models for delivering Walking for Health within the local
authority’s public health responsibility.
Identifying the role of Walking for Health within broader pathways that lead to longer-term
involvement in physical activity; this means enabling schemes to develop clearer links with a range of
progression activities.
7.5.3 Volunteers
The programme also aims to support local schemes to recruit and retain a sufficient pool of volunteers
and ensure that those volunteers are well supported through training and resources. The viability of the
Walking for Health programme is based on a volunteer walk leader model, with volunteers providing the
majority of hours required to deliver the programme. The volunteering model brings continuity and scale
to the programme that would not be achievable otherwise; however the maintenance of a sufficient pool
of volunteers to ensure the sustainability of schemes presents challenges for some schemes.
Evaluation recommendations:
The national programme team could provide further support to local schemes for volunteer
recruitment and retention. Potential actions include:
Facilitating the sharing of good practice on volunteer recruitment and management.
Publicising as widely as possible the benefits of volunteering for Walking for Health through existing
forums such as the Macmillan Volunteering village.
Future research priority:
Developing a clearer understanding of issues surrounding the availability of volunteers for
schemes through more systematic research, for example by undertaking an audit of volunteer
skills.

124
7.6 Methodological lessons and recommendations
The earlier sections have highlighted the challenges and limitations of the methodology. As it was not
possible within the confines of the evaluation to use a comparator group methodology, the evaluation
adopted a longitudinal approach to the assessment of impact additionality with the baseline effectively
acting as the counterfactual reference point for the analysis; however it was not possible to collect data
on validated measures of physical activity, health and wellbeing from participants prior to their first walk.
The evaluation nevertheless also raised the question of whether a true baseline can ever be measured
completely accurately in a before-and-after physical activity study, given that some participants may
increase levels of physical activity in preparation for their first walk.
To help improve the relevance and quality of the evaluation findings, the longitudinal survey analysis was
considered alongside a comparison of outcomes with the non-constant sample (those who ceased to
participate at four months), analysis of additionality questions (to examine the influence of the programme
on participation) and significance testing. The survey data was also corroborated with qualitative data
gathered from in-depth case studies, as well as a theoretical appreciation supported by qualitative
analysis that Walking for Health has an important role to play in helping to maintain levels of physical
activity. Using a combination of approaches supported a more robust and defensible evaluation
approach. Nevertheless there are lessons from the study that should be taken on board in future
evaluation studies.
The survey instruments and questions employed for measuring physical activity and walking (the modified
single item question from the OHQ and the IPAQ question) provided valid and relevant measures of
change in one of the principal outcomes of interest to Walking for Health. However, it is possible that the
single-item measure of physical activity used in the surveys was not sensitive enough to measure
change, given the size of the constant sample. The size of the sample did not allow for the detection of
changes of less than 0.45 days of 30 minutes of physical activity between baseline and eight months.
Sample sizes would therefore need to be increased to detect smaller changes in behaviour (see below).
This would also facilitate greater sub-group analysis. The pedometer study proved less effective due to a
number of practical issues associated with the use and return of pedometers. The majority of measures of
wellbeing were also fit-for-purpose; EQ-5D proved less useful due to the length of the questions, and their
suitability to be asked as part of a telephone survey.
Many of the case study interviews with walkers showed how the schemes provide opportunities for older
walkers to step down from more vigorous physical activity. This may partly explain the finding that
Walking for Health helps participants to maintain (rather than increase) physical activity over the medium-
term. A lesson here for future evaluations is to ask more specific questions at the baseline stage
regarding participants’ pre-existing levels of activity (and to link this to their motivations for taking part),
beyond simply the objective measurement of activity levels. The outcomes assessment can then be
related more closely to the motivations or reasons for taking part, whether this is maintaining a certain
level of activity for those who are stepping down from more vigorous activity for health or other reasons,
or increasing activity for those who were previously inactive.
Finally, the MOVES model proved a useful tool for understanding the cost-effectiveness and return on
investment of Walking for Health. The inputs and thus accuracy of this analysis can be tweaked in the
future through access to improved data on the additionality of Walking for Health schemes, and the
sustainability of involvement. For example, a key assumption the economic analysis is that the
programme leads to longer-term changes in behaviour beyond one year. For this assumption to be
tested, a further longer-term follow-up survey of participants could be undertaken to help assess rates of
attrition beyond 12 months, as well as the persistence of outcomes.

125
Ideally, a randomised control method or quasi-experimental design would be introduced into future
evaluations of Walking for Health, to robustly estimate the counterfactual position and hence impact of
Walking for Health. In the absence of this the following options should be considered for boosting the
robustness of the longitudinal survey approach:
Using the revised validated single item question on physical activity, and capturing baseline data from
all new participants, as part of the walker registration forms. Walking for Health volunteers for
example could be encouraged to more closely supervise the completion of this specific question, to
help boost the response rate for evaluation purposes.
Investigating the option of administering a more detailed survey to a sub-sample of participants
before their first walk, in order that a robust baseline is in place for a wider range of outcomes for
follow-up (this may also enable the response rate on the key measure of physical activity to be more
carefully monitored, through the sampling strategy).
Boosting the sample size for follow-up surveys (and oversampling of specific target groups). This
would require drawing from a larger sample-frame of schemes, but would allow for a more robust
analysis of changes in physical activity (through the detection of smaller changes) as well as the
development of a deeper analysis of change within particular sub groups.

A1
Annex One: Research Tools

A2
1. Participants questionnaires
2. Case study research tools
3. Stakeholder topic guides

A3
Evaluation Baseline Questionnaire
Good morning / afternoon / evening, my name is ___________ and I work for Ecorys Survey. We understand that you have recently attended _____________[insert name of walk]. Your local walk is run by Walking for Health and we would like to understand how, if at all, these walks benefit people like you. Working closely with Walking for Health, Ecorys and the University of East Anglia are undertaking independent research to find this out. We would like to invite you to participate in this research. If you are happy to take part, in a moment I will ask you some questions; they will only take about 15 minutes. If now isn’t a convenient time, may I arrange to call you at another time this week? We would then like to give you a call in about four months time to see if anything has changed. Are you happy to take part in this survey?
□ Yes (interviewer note: proceed with survey)
□ No (interviewer note: check if they would like to take part in the survey in another format (e.g. posting
a hard copy). If not, thank them for their time and end the survey) I will explain the tasks full as I go along but please interrupt me if you do not understand something or if things are not clear to you. Please also remember that there are no right or wrong answers. We are only interested in your personal view. You do not have to answer the questions if you do not want to and you can chose to opt out of the survey at any stage. We can also assure you that your responses will remain confidential and the information you provide will not be shared with anyone outside Ecorys and the University of East Anglia.
INTERVIEWER NOTE: Please record the name of the walk and the name of the Walking for Health scheme, as confirmed by the information provided on the database. Some walkers may not realise their walk is part of the national Walking for Health programme.
1. How did you find out about the ___________[insert name of walking group]? (interviewer to
select all that apply)
□ GP/Nurse/Physio/Other health professional
□ Pharmacy
□ Press
□ Poster/advertisement
□ Leaflet
□ Website
□ Macmillan Cancer Support
□ Ramblers
□ Told about it by someone (not covered above)
□ Other – please state:
_____________________
2. If the _____________[insert name of walking group], was not available at the time you joined,
how likely is it that you would have joined a different walking group? I will read out five responses so please let me know which one you agree with. (interviewer to read out responses and
select one)

A4
□ Very likely □ Likely
□ Neither likely nor unlikely □ Unlikely
□ Very unlikely □ Don’t know
3. How many times have you taken part in walks with ___________[insert name of walking
group]? (interviewer to insert number)
4. How much time did you spend on your first walk? (interviewer note: this should only include the time spent undertaking the walk and should not include any time allocated to form filling, briefings at the start etc)
_____ hours and ___________________minutes 5. How far did you walk on your first walk?
__________miles or ___________km
I would now like you to ask about the amount of physical activity you take part in.
6. In the past week, on how many days have you done a total of 30 minutes or more of physical activity, which was enough to raise your breathing rate? This might have included sport, exercise and brisk walking with Walking for Health or at other times or cycling for recreation or to get to and from places, but should not include housework or physical activity that is part of your job. (select one)
0 □ 1 □ 2 □ 3 □ 4 □ 5 □ 6 □ 7 □
7. This question is about all the walking that you did in the last 7 days solely for recreation, sport,
exercise or leisure. During the last 7 days (not including today) on how many days did you
walk for at least 10 minutes at a time in your leisure time? (select one)
0 □ 1 □ 2 □ 3 □ 4 □ 5 □ 6 □ 7 □ 8. How much time did you usually spend on one of those days walking in your leisure time?
(interviewer to complete )
_____ hours per day _____ minutes per day 9. This is about the time you spent sitting on weekdays during the last 7 days. Include time spent
at work, at home, while doing course work and during leisure time. This may include time spent sitting at a desk, visiting friends, reading, or sitting or lying down to watch television. During the last 7 days how much time did you usually spend sitting on a week day? (interviewer to complete )
_____ hours per day _____ minutes per day
In order for us to understand how the Walking for Health programme benefits people over time,
we would like to understand how much walking and sitting you did before taking part in your first

A5
Walking for Health walk. Your answers may not be very different to the ones you have just told
me, but I would like to just check.
10. So, prior to taking part in your first Walking for Health walk, on how many days did you do a total of 30 minutes or more of physical activity, which was enough to raise your breathing rate? This might have included sport, exercise and brisk walking or cycling for recreation or to get to and from places, but should not include housework or physical activity that is part of your job. (select one)
0 □ 1 □ 2 □ 3 □ 4 □ 5 □ 6 □ 7 □
11. This question is about all the walking that you did solely for recreation, sport, exercise or
leisure. Prior to taking part in your first Walking for Health walk, in an average week, on how
many days did you walk for at least 10 minutes at a time in your leisure time? (select one)
0 □ 1 □ 2 □ 3 □ 4 □ 5 □ 6 □ 7 □
12. How much time did you usually spend on one of those days walking in your leisure time?
(interviewer to complete )
_____ hours per day _____ minutes per day
13. This is about the time you spent sitting on weekdays, including time spent at work, at
home, while doing course work and during leisure time. This may include time spent sitting at a desk, visiting friends, reading, or sitting or lying down to watch television. Prior to taking part in your first Walking for Health walk, in an average week, how much time did you usually spend
sitting on a week day? (interviewer to complete )
_____ hours per day _____ minutes per day
14. Prior to taking part in your first Walking for Health walk, what were your expectations of
the amount of physical activity that you would undertake over the coming year? (interviewer to
read out responses and select one)
You expected to be more physically active over the next year than you have been in recent years.
You expected to be less physically active over the next year than you have been in recent years.
You were not expecting that the amount of physical activity you do over the next year will change compared to recent years.
I would now like you to answer some questions on your general wellbeing. This will help us to see
if Walking for Health is contributing to any changes to your overall wellbeing.
15. On a scale of 0 to 10, where 0 is ‘not at all satisfied’ and 10 is ‘completely satisfied’, how satisfied are you with your life nowadays? (Interviewer to complete)
16. I would just like to check if this was different to the time before you took part in your first Walking for Health walks, so on a scale of 0 to 10, where 0 is ‘not at all satisfied’ and 10 is ‘completely satisfied’, how satisfied were you with your life before you took part in your first

A6
Walking for Health walk? (Interviewer to complete)
17. I am going to read out some statements about feelings and thoughts. Thinking about the last four weeks, for each one, I would like you to tell me how often you have experienced the feeling: none of the time, rarely, some of the time, often, or all of the time. (Interviewer to read out and select one per row)
None of the time
Rarely Some of the time
Often All of the time
I’ve been feeling optimistic about the future I’ve been feeling useful I’ve been feeling relaxed I’ve been dealing with problems well I’ve been thinking clearly I’ve been feeling close to other people I’ve been able to make up my own mind about things
Warwick Edinburgh Mental Well-Being Scale (WEMWBS) © NHS Health Scotland, University of Warwick and University of Edinburgh, 2006, all rights reserved.
18. How often do you meet socially with relatives, friends or colleagues? I will read out six responses so please let me know which one you agree with. (Interviewer to read out responses and select one)
□ Never □ Less than once a month □ Several times a month □ Once a week □ Several times a week □ Every day □ Don’t know
19. And on average, prior to taking part in your first Walking for Health walk, how often did you meet socially with relatives, friends or colleagues? I will read out the same six responses so please let me know which one you agree with. (Interviewer to read out responses and select
one)
□ Never □ Less than once a month □ Several times a month □ Once a week □ Several times a week □ Every day □ Don’t know
20. How often do you feel lonely? I will read out four responses so please let me know which one you agree with. (Interviewer to read out responses and select one)
□ Often □ Sometimes □ Rarely □ Never □ Don’t know
21. And on average, prior to taking part in your first Walking for Health walk, how often did you feel lonely? I will read out the same four responses so please let me know which one you agree with. (Interviewer to read out responses and select one)
□ Often □ Sometimes □ Rarely □ Never □ Don’t know
We are also interested in what you think about your health at the current time, so that we can then measure impacts of the programme at a later date on participants’ health. I will ask you a few brief and simple questions about your own health state today. If you prefer not to answer any particular question, please say so.
INTERVIEWER NOTE: It maybe necessary to remind the respondent regularly that the timeframe is today. If the respondent does not feel comfortable answering these questions, please skip to

A7
question Q27. 22. First, I would like to ask you about mobility, would you say that you…
INTERVIEWER NOTE: Unlikely to need to read last response out. □ have no problems in walking about? □ have slight problems in walking about? □ have moderate problems in walking about? □ have severe problems in walking about? □ are unable to walk about? 23. Next, I would like to ask you about self care. Would you say you……
INTERVIEWER NOTE: Unlikely to need to read last response out. □ have no problems washing or dressing yourself? □ have slight problems washing or dressing yourself? □ have moderate problems washing or dressing yourself? □ have severe problems washing or dressing yourself ? □ are unable to wash or dress yourself?
24. Next I’d like to ask you about usual activities, for example, work, study, housework, family or leisure activities. Would you say you… □ have no problems doing your usual activities? □ have slight problems doing your usual activities? □ have moderate problems doing your usual activities? □ have severe problems performing your usual activities? □ are unable to do your usual activities? 25. Next, I would like to ask you about pain and discomfort. Would you say you…… □ have no pain or discomfort? □ have slight pain or discomfort? □ have moderate pain or discomfort? □ have severe pain or discomfort? □ have extreme pain or discomfort? 26. Finally, I would like to ask you about anxiety and depression. Would you say you……. □ are not anxious or depressed? □ are slightly anxious or depressed? □ are moderately anxious or depressed? □ are severely anxious or depressed? □ are extremely anxious or depressed?
27. I would now like to ask you a different task. To help you say how good or bad your health state is, I’d like you to try to picture in your mind a scale that looks a bit like a thermometer. The best state you can imagine is 100 at the top of the scale and the worst state you can imagine is 0 at the bottom. I would now like you to tell me the point on the scale where you would put your own health state today. (insert number 1 – 100 below) Finally, the last few questions. 28. I know you have only recently joined the Walking for Health programme but based on your
experiences so far, how satisfied are you with the Walking for Health programme? I will read out five responses so please let me know which one you agree with. (interviewer to read out responses and
select one)

A8
□ I am very satisfied
□ I am somewhat satisfied
□ I am neither satisfied nor dissatisfied
□ I am somewhat dissatisfied
□ I am very dissatisfied
□ Don’t know
29. Do you think you will attend another Walking for Health walk in the future? I will read out five responses so please let me know which one you agree with. (interviewer to read out responses and
select one)
□ Definitely
□ Probably
□ Possibly
□ Probably not
□ Definitely not □ Don’t know
30. Which of the following age categories do you fall within? (interviewer to read out responses and select one)
□ 16-24
□ 25-44
□ 45 – 64
□ 65+
□ Prefer not to say
31. Could you tell me what the highest level of education you have completed is? I will read out some options so please let me know which one applies to you. (interviewer to read out responses and select one)
Primary or middle school
High school (school certificate, CSE, GCSE, O Level, O grade or equivalent)
High school (Higher School Certificate, A Level, AS Level, or equivalent)
College (vocational qualification) or apprenticeship
University (Bachelor’s degree, Master’s degree or equivalent)
University (research degree, PhD or equivalent)
None of the above
A9
32. That’s the last question I would like to ask you but do you have any other comments about Walking for Health that you would like to tell me? These could be positive or negative. (Interviewer to complete, a sample of verbatim quotes is important)
Thank you very much for your time. As I mentioned at the start, we would like to give you a call back in about four months time so that we can see if anything has changed. Would this be ok?
Yes
No
Thank you. Goodbye.

A10
Evaluation Follow-up Questionnaire
Good morning / afternoon /evening, my name is ___________ and I work for Ecorys Survey. We understand that you have taken part in _____________[insert name of walk]. Your local walk is run by Walking for Health and we would like to understand how, if at all, these walks benefit people like you, and as part of this, we spoke to you about _____ months ago. We would now like to ask you some more questions; they will only take about 15 minutes and it doesn’t matter if you are no longer walking with the group. If now isn’t a convenient time, may I arrange to call you at another time this week? We would then like to give you a final call in about four months time to see if anything has changed. Are you happy to take part in this survey?
□ Yes (interviewer note: proceed with survey)
□ No (interviewer note: check if they would like to take part in the survey in another format (e.g. posting
a hard copy). If not, thank them for their time and end the survey) I will explain the tasks full as I go along but please interrupt me if you do not understand something or if things are not clear to you. Please also remember that there are no right or wrong answers. We are only interested in your personal view. You do not have to answer the questions if you do not want to and you can chose to opt out of the survey at any stage. We can also assure you that your responses will remain confidential and the information you provide will not be shared with anyone outside Ecorys and the University of East Anglia.
INTERVIEWER NOTE: Please record the name of the walk and the name of the Walking for Health scheme, as confirmed by the information provided on the database. First, we would like to find out how much, if any, walking you are doing as part of Walking for Health.
1. How long ago did you last attend a Walking for Health walk? (interviewer to complete number of months, or number of weeks or number of days)
_________________months ago OR __________ weeks ago OR __________ days ago
2. Are you still taking part in _____________[insert name of the walk]? (If no, interviewer to prompt if respondent is attending a different Walking for Health walk or none at all)
□ Yes (Go to Q8)
□ No, but I am taking part in a different Walking for Health walk (Please provide the name of the walk and
Go to Q8) □ No, I am not taking part in Walking for Health walks anymore (Go to Q3)
3. I would like to find out why you are no longer attending Walking for Health walks. I’m going to read out some possible reasons and after each one, I’d like you to say either yes or no depending on if it applies to you. You can say yes to as many of the reasons that apply to you. (interviewer to read out responses and select all that apply)
□ I don’t have time
□ I don’t enjoy it
□ I don’t feel well enough

A11
□ The walks were too difficult
□ The walks were too easy
□ It was too difficult to get to the walks
□ I prefer to attend walks when the weather is warmer
□ I joined another walking group
□ I took up another activity
□ I walk on my own or with friends now
Are there any other reasons that I haven’t mentioned?
□ Other reason Please state: _______________________________
4. When you were still taking part in Walking for Health walks how many walks did you
typically attend each month? (Interviewer to complete)
INTERVIEWER NOTE: Please try to complete the average per month. If frequency is less than once a month, please complete the average per year
______ walks per month. _________walks per year
5. And how much time did you typically spend on a walk? (Interviewer to complete)
_____ hours and ___________________minutes
6. How far did you typically walk, if you know? (Interviewer to complete)
__________miles or ___________km
7. I’d like to ask you how satisfied you were with the Walking for Health programme. Please say yes when I read out the level of satisfaction that applies to you. (interviewer to read out responses and select one)
□ I was very satisfied
□ I was somewhat satisfied
□ I was neither satisfied nor dissatisfied
□ I was somewhat dissatisfied
□ I was very dissatisfied
INTERVIEWER NOTE: Skip to Q12
8. How many Walking for Health walks do you typically attend each month? (Interviewer to complete)
INTERVIEWER NOTE: Please try to complete the average per month. If frequency is less than once a month, please complete the average per year.
______ walks per month. _________walks per year
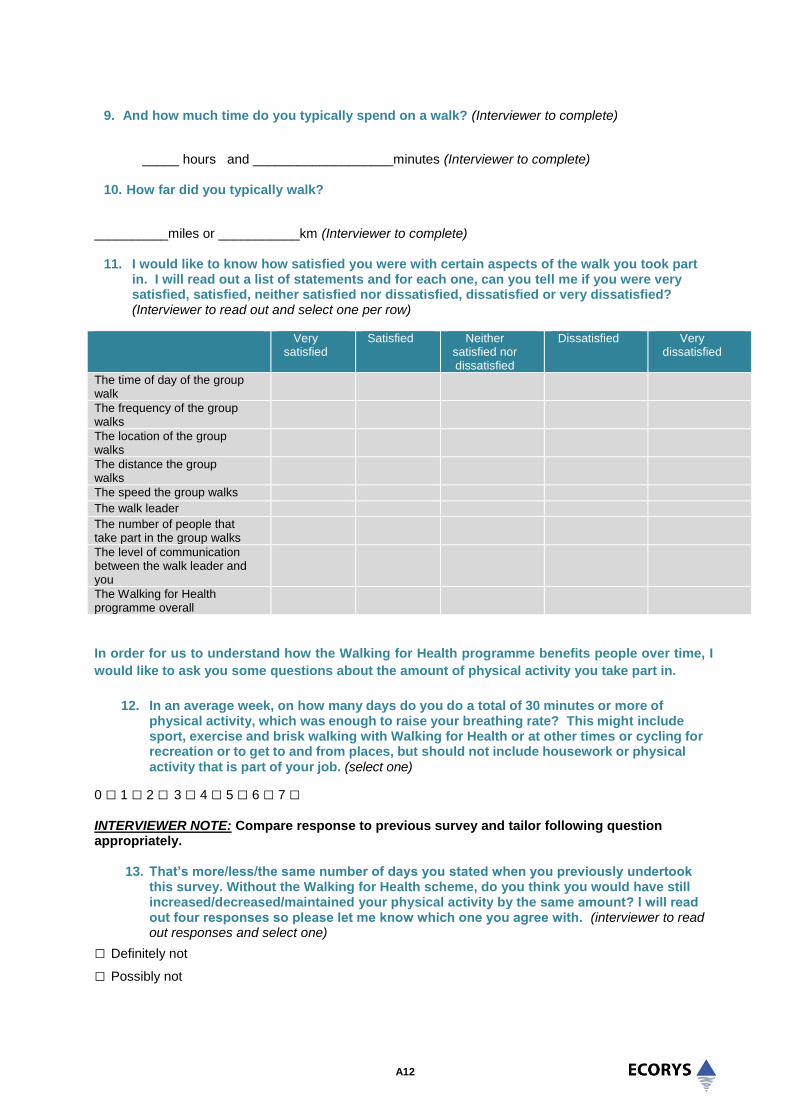
A12
9. And how much time do you typically spend on a walk? (Interviewer to complete)
_____ hours and ___________________minutes (Interviewer to complete)
10. How far did you typically walk?
__________miles or ___________km (Interviewer to complete)
11. I would like to know how satisfied you were with certain aspects of the walk you took part in. I will read out a list of statements and for each one, can you tell me if you were very satisfied, satisfied, neither satisfied nor dissatisfied, dissatisfied or very dissatisfied? (Interviewer to read out and select one per row)
Very satisfied
Satisfied Neither satisfied nor dissatisfied
Dissatisfied Very dissatisfied
The time of day of the group walk
The frequency of the group walks
The location of the group walks
The distance the group walks
The speed the group walks The walk leader The number of people that take part in the group walks
The level of communication between the walk leader and you
The Walking for Health programme overall
In order for us to understand how the Walking for Health programme benefits people over time, I
would like to ask you some questions about the amount of physical activity you take part in.
12. In an average week, on how many days do you do a total of 30 minutes or more of physical activity, which was enough to raise your breathing rate? This might include sport, exercise and brisk walking with Walking for Health or at other times or cycling for recreation or to get to and from places, but should not include housework or physical activity that is part of your job. (select one)
0 □ 1 □ 2 □ 3 □ 4 □ 5 □ 6 □ 7 □
INTERVIEWER NOTE: Compare response to previous survey and tailor following question appropriately.
13. That’s more/less/the same number of days you stated when you previously undertook this survey. Without the Walking for Health scheme, do you think you would have still increased/decreased/maintained your physical activity by the same amount? I will read out four responses so please let me know which one you agree with. (interviewer to read out responses and select one)
□ Definitely not
□ Possibly not

A13
□ Probably yes
□ Definitely yes
□ Don't know
14. This question is about all the walking that you did solely for recreation, sport, exercise or
leisure. In an average week (not including today), on how many days did you walk for at
least 10 minutes at a time in your leisure time? (select one)
0 □ 1 □ 2 □ 3 □ 4 □ 5 □ 6 □ 7 □
15. How much time do you usually spend on one of those days walking in your leisure time?
(interviewer to complete )
_____ hours per day _____ minutes per day
INTERVIEWER NOTE: Compare response to previous survey and tailor following question appropriately.
16. That’s more/less/the same number of days you stated when you previously undertook this survey. Without the Walking for Health scheme, do you think you would have still increased/decreased/maintained your walking hours by the same amount? I will read out four responses so please let me know which one you agree with. (interviewer to read out responses and select one)
□ Definitely not
□ Possibly not
□ Probably yes
□ Definitely yes
□ Don't know
17. This is about the time you spent sitting on weekdays, including time spent at work, at home, while doing course work and during leisure time. This may include time spent sitting at a desk, visiting friends, reading, or sitting or lying down to watch television. In an average week, how much time did you usually spend sitting on a week day? (interviewer to complete )
_____ hours per day _____ minutes per day INTERVIEWER NOTE: Compare response to previous survey and tailor following question appropriately.
18. That’s more/less/the same amount of time you stated when you previously undertook this survey. Without the Walking for Health scheme, do you think you would have still increased/decreased/maintained your walking hours by the same amount? I will read out four responses so please let me know which one you agree with. (interviewer to read out responses and select one)
□ Definitely not
□ Possibly not
□ Probably yes
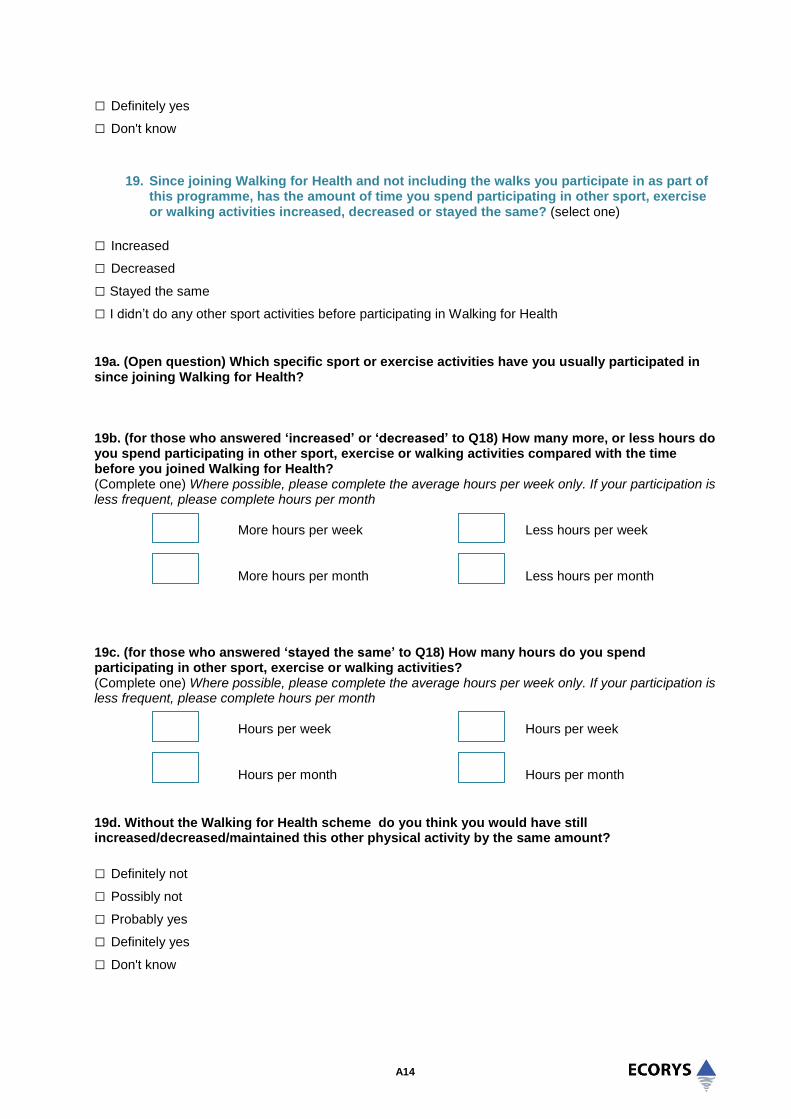
A14
□ Definitely yes
□ Don't know
19. Since joining Walking for Health and not including the walks you participate in as part of this programme, has the amount of time you spend participating in other sport, exercise or walking activities increased, decreased or stayed the same? (select one)
□ Increased
□ Decreased
□ Stayed the same
□ I didn’t do any other sport activities before participating in Walking for Health
19a. (Open question) Which specific sport or exercise activities have you usually participated in since joining Walking for Health? 19b. (for those who answered ‘increased’ or ‘decreased’ to Q18) How many more, or less hours do you spend participating in other sport, exercise or walking activities compared with the time before you joined Walking for Health? (Complete one) Where possible, please complete the average hours per week only. If your participation is less frequent, please complete hours per month
More hours per week Less hours per week
More hours per month Less hours per month 19c. (for those who answered ‘stayed the same’ to Q18) How many hours do you spend participating in other sport, exercise or walking activities? (Complete one) Where possible, please complete the average hours per week only. If your participation is less frequent, please complete hours per month
Hours per week Hours per week
Hours per month Hours per month
19d. Without the Walking for Health scheme do you think you would have still increased/decreased/maintained this other physical activity by the same amount?
□ Definitely not
□ Possibly not
□ Probably yes
□ Definitely yes
□ Don't know
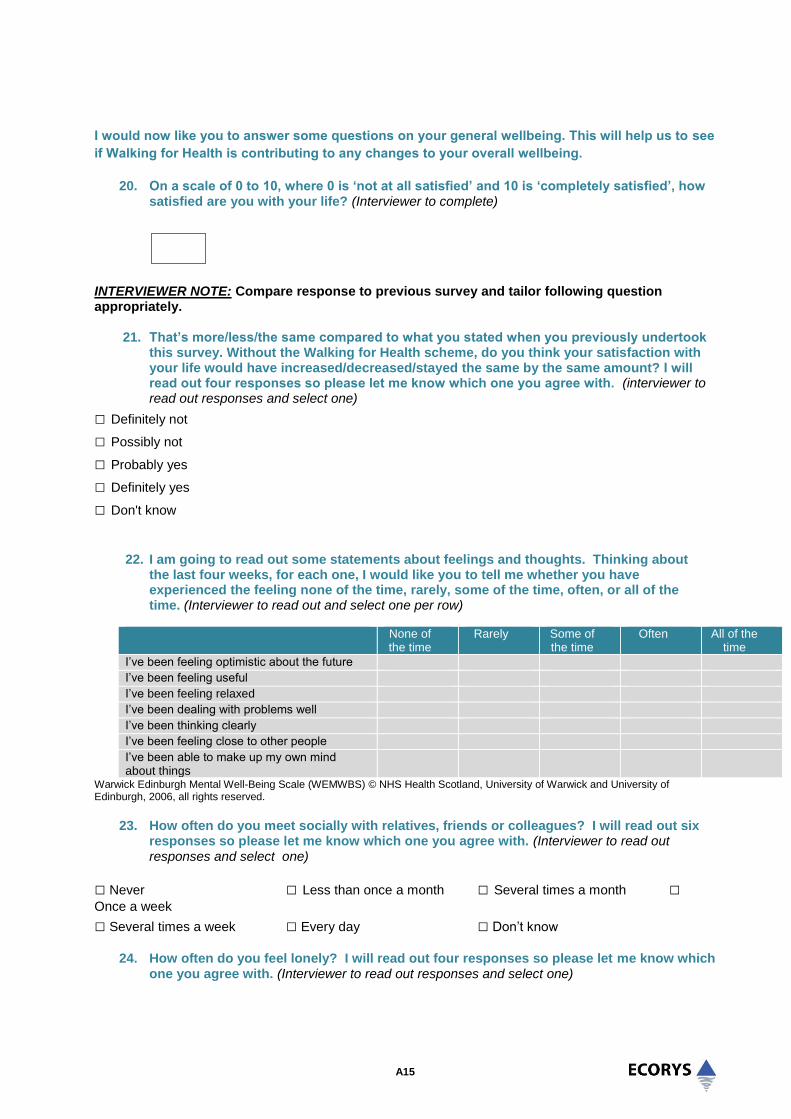
A15
I would now like you to answer some questions on your general wellbeing. This will help us to see
if Walking for Health is contributing to any changes to your overall wellbeing.
20. On a scale of 0 to 10, where 0 is ‘not at all satisfied’ and 10 is ‘completely satisfied’, how
satisfied are you with your life? (Interviewer to complete)
INTERVIEWER NOTE: Compare response to previous survey and tailor following question appropriately.
21. That’s more/less/the same compared to what you stated when you previously undertook this survey. Without the Walking for Health scheme, do you think your satisfaction with your life would have increased/decreased/stayed the same by the same amount? I will read out four responses so please let me know which one you agree with. (interviewer to read out responses and select one)
□ Definitely not
□ Possibly not
□ Probably yes
□ Definitely yes
□ Don't know
22. I am going to read out some statements about feelings and thoughts. Thinking about the last four weeks, for each one, I would like you to tell me whether you have experienced the feeling none of the time, rarely, some of the time, often, or all of the time. (Interviewer to read out and select one per row)
None of the time
Rarely Some of the time
Often All of the time
I’ve been feeling optimistic about the future I’ve been feeling useful I’ve been feeling relaxed I’ve been dealing with problems well I’ve been thinking clearly I’ve been feeling close to other people I’ve been able to make up my own mind about things
Warwick Edinburgh Mental Well-Being Scale (WEMWBS) © NHS Health Scotland, University of Warwick and University of Edinburgh, 2006, all rights reserved.
23. How often do you meet socially with relatives, friends or colleagues? I will read out six
responses so please let me know which one you agree with. (Interviewer to read out responses and select one)
□ Never □ Less than once a month □ Several times a month □ Once a week
□ Several times a week □ Every day □ Don’t know
24. How often do you feel lonely? I will read out four responses so please let me know which
one you agree with. (Interviewer to read out responses and select one)

A16
□ Often □ Sometimes □ Rarely □ Never □ Don’t know
We are also interested in what you think about your health at the current time, so that we can then measure impacts of the programme at a later date on participants’ health. I will first ask you a few brief and simple questions about your own health state today. If you prefer not to answer any particular question, please say so.
INTERVIEWER NOTE: It maybe necessary to remind the respondent regularly that the timeframe is today. If the respondent does not feel comfortable answering these questions, please skip to question 30. 25. First, I would like to ask you about mobility, would you say that you…
INTERVIEWER NOTE: Unlikely to need to read last response out. □ have no problems in walking about? □ have slight problems in walking about? □ have moderate problems in walking about? □ have severe problems in walking about? □ are unable to walk about? 26. Next, I would like to ask you about self care. Would you say you……
INTERVIEWER NOTE: Unlikely to need to read last response out. □ have no problems washing or dressing yourself? □ have slight problems washing or dressing yourself? □ have moderate problems washing or dressing yourself? □ have severe problems washing or dressing yourself ? □ are unable to wash or dress yourself?
27. Next I’d like to ask you about usual activities, for example, work, study, housework, family or leisure activities. Would you say you… □ have no problems doing your usual activities? □ have slight problems doing your usual activities? □ have moderate problems doing your usual activities? □ have severe problems performing your usual activities? □ are unable to do your usual activities? 28. Next, I would like to ask you about pain and discomfort. Would you say you…… □ have no pain or discomfort? □ have slight pain or discomfort? □ have moderate pain or discomfort? □ have severe pain or discomfort? □ have extreme pain or discomfort? 29. Finally, I would like to ask you about anxiety and depression. Would you say you……. □ are not anxious or depressed? □ are slightly anxious or depressed? □ are moderately anxious or depressed? □ are severely anxious or depressed? □ are extremely anxious or depressed?
30. I would now like to ask you a different task. To help you say how good or bad your health state is, I’d like you to try to picture in your mind a scale that looks a bit like a thermometer. The best state you can imagine is 100 at the top of the scale and the worst state you can imagine is 0 at the bottom. I would now like you to tell me the point on the scale where you would put your own health state today. (interviewer to insert number 1 – 100 below)

A17
31. That’s more/less/the same compared to what you stated when you previously undertook this survey. Without the Walking for Health scheme, do you think your overall health state would have increased/decreased/stayed the same by the same amount? I will read out four responses so please let me know which one you agree with. (interviewer to read out responses and select one)
□ Definitely not
□ Possibly not
□ Probably yes
□ Definitely yes
□ Don't know
Finally, the last few questions. INTERVIEWER NOTE: If the respondent is no longer walking with Walking for Health (as per Q2), please skip question 32 and move to question 33.
32. Do you think you will continue to attend Walking for Health walks in the future? I will read out five responses so please let me know which one you agree with. (interviewer to read out
responses and select one)
□ Definitely
□ Probably
□ Possibly
□ Probably not
□ Definitely not □ Don’t know
33. Would you recommend Walking for Health to other people, such as colleagues, friends or family? (interviewer to select one)
□ Yes
□ Maybe
□ No
34. That’s the last question I would like to ask you but do you have any other comments about
Walking for Health that you would like to tell me? These could be positive or negative. (Interviewer to complete, a sample of verbatim quotes is important)
INTERVIEWER NOTE: If this is the second survey to be completed with the respondent, please read out statement A. If this is the third survey to be completed with the respondent, please read out statement B.
A. Thank you very much for your time. As I mentioned at the start, we would like to give you a call back in about four months time so that we can see if anything has changed. Would

A18
this be ok?
Yes
No
B. Thank you very much for your time. Walking for Health may wish to contact some people involved in this study in future years to help with research and evaluation. Would you be happy to be contacted in the future?
Yes
No
Thank you very much for your time. Goodbye.
CASE STUDIES
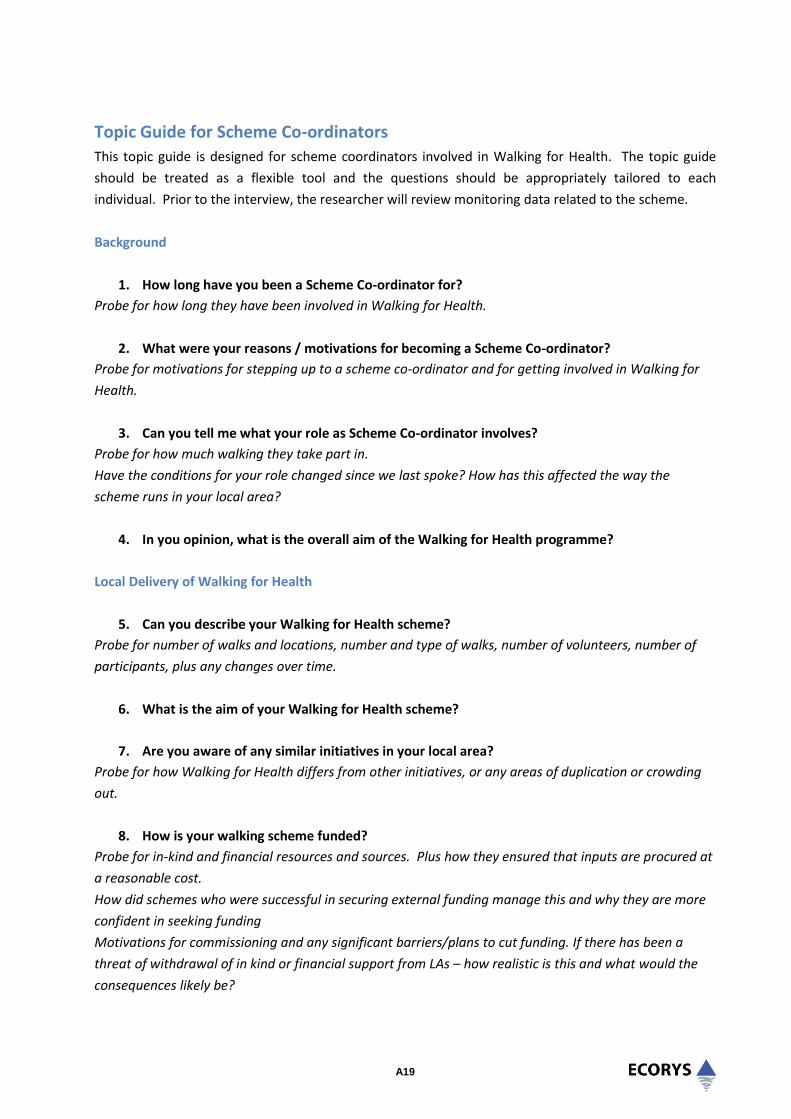
A19
Topic Guide for Scheme Co-ordinators
This topic guide is designed for scheme coordinators involved in Walking for Health. The topic guide
should be treated as a flexible tool and the questions should be appropriately tailored to each
individual. Prior to the interview, the researcher will review monitoring data related to the scheme.
Background
1. How long have you been a Scheme Co-ordinator for?
Probe for how long they have been involved in Walking for Health.
2. What were your reasons / motivations for becoming a Scheme Co-ordinator?
Probe for motivations for stepping up to a scheme co-ordinator and for getting involved in Walking for
Health.
3. Can you tell me what your role as Scheme Co-ordinator involves?
Probe for how much walking they take part in.
Have the conditions for your role changed since we last spoke? How has this affected the way the
scheme runs in your local area?
4. In you opinion, what is the overall aim of the Walking for Health programme?
Local Delivery of Walking for Health
5. Can you describe your Walking for Health scheme?
Probe for number of walks and locations, number and type of walks, number of volunteers, number of
participants, plus any changes over time.
6. What is the aim of your Walking for Health scheme?
7. Are you aware of any similar initiatives in your local area?
Probe for how Walking for Health differs from other initiatives, or any areas of duplication or crowding
out.
8. How is your walking scheme funded?
Probe for in-kind and financial resources and sources. Plus how they ensured that inputs are procured at
a reasonable cost.
How did schemes who were successful in securing external funding manage this and why they are more
confident in seeking funding
Motivations for commissioning and any significant barriers/plans to cut funding. If there has been a
threat of withdrawal of in kind or financial support from LAs – how realistic is this and what would the
consequences likely be?

A20
Which part of LAs funding is currently from i.e. parks and leisure, social care or public health. How does
this affect the way the scheme operates/ what the main target audiences are etc?
Impact of scheme coordinators having limited hours allocated to the programme, understanding LA
funding for staff and other elements, impact of not having funding for scheme coordinator
9. Are there any threats to the sustainability of the scheme?
How vulnerable are they to funding cuts, would they be able to transition to voluntary led service etc
Do they have enough time to effectively deliver the scheme?
Probe for hours spent and what ideally would spend. Reasons for limited numbers of hours available.
10. Can you describe the involvement of any partners in your scheme?
Probe for partnership working at a national and local level (including Health and Wellbeing Boards and
Commissioning Groups), the nature of partners’ involvement and the added value of their involvement.
Implications of having no partners
Constraints to expanding partnership working
Examples of how partnership working helps schemes to extend reach into new communities
11. What are the barriers and enablers to the NHS incorporating Walking for Health as a core
programme?
Referrals by health professionals: what is being done to engage them, successes and failures.
Do they use new HSCP section of website?
12. What other aspects of your partnership working are working particularly well?
Probe for any aspects that are working less well.
13. Do you have any particular groups of individuals that you aim to recruit to your walks?
Examples might be people affected by cancer, with long term health conditions or disabilities, from
deprived areas, and older people
Efforts to target men and BME groups : successes and failures.
Targeting people with cancer and other long-term health conditions: successes and failures.
Why have they chosen those particular groups over others?
If not targeting, why not
14. How do you raise awareness of your Walking for Health scheme / walks?
Probe for successful awareness raising approaches, particularly for target groups, plus stakeholders.
Explore extent to which they receive referrals from partners and the effectiveness of this. Also explore
ways that the profile could be increased further.
Do they have promotional volunteers who are separate to walk leaders? How effective are these?
15. Can you describe the type of individuals that take part in your walks? How has the profile of
your walkers changed over the last 12 months?

A21
Probe for increases / decreases in numbers of walkers, new walkers, retention of walkers, changes in
types of walkers.
Probe for whether they are recruiting inactive people or people who are stepping down their activity as a
result of illness
16. How do you ensure that your walks effectively cater for individuals with different needs?
Probe for successful approaches of supporting people affected by cancer, with long term health
conditions or disabilities, from deprived areas and older people. Explore approaches that are working
well and less well and any walks that demonstrate good practice.Probe: catering for both people who
want to step up and people that are having to step down
17. What different walks do you offer and why? Has this changed recently due to accreditation?
Probe: Implementing shorter walks – takeup and issues surrounding this. Have new audiences been
attracted to these walks?
Which walks are health walks within the accreditation criteria and which are added extras that need to find new homes do they link with other organisations to keep longer walks running or does their own insurance cover them.
Progression walks for those who want something more strenuous? Any schemes that also run progression walks - How do they encourage walkers to progress onto these from Walking for Health? Is this successful or are walkers reluctant to move on as they have formed friendships in their existing group? Probe capacity for introducing new walks – what is possible given current vols etc.
Probe evening and weekend walks for workers
More info on regularity of walks, is there a benefit to walkers of having a pattern – does it help them to
ensure they attend each time.
Probe why some schemes keep the location the same each time whereas others prefer different
locations. Do different approaches work better indifferent settings i.e. urban v rural?
18. How do you recruit and support volunteers for Walking for Health?
Clarify number of volunteer walk leaders. Most schemes have either had an increase or a decline in the
number of volunteers in the past few years. What has this change meant for the scheme?
Information on volunteers who are not leading walks: what are they doing and how do they feel about
their activities, how do schemes get volunteers to do the other tasks
Probe for successful recruitment channels.
How volunteers have been recruited: explore if any attempts to recruit outside pool of current walkers
(and if not, why not).
Methods of encouraging volunteer satisfaction and retention
19. What aspects of your Walking for Health scheme do you think work particularly well? What
do you think has helped you to be so successful in this area?
Probe for anything that has worked less well.

A22
20. Have you faced any challenges delivering Walking for Health in your area? How have these
been overcome?
Probe for any challenges relating to recruiting new walkers (especially those in target groups), adapting
the scheme to align with new national priorities, monitoring and evaluation, working with partners,
recruiting and supporting volunteers etc.
21. Without the national Walking for Health programme, to what extent do you think your walks
would have still been delivered?
National Delivery of Walking for Health
22. How often do you communicate with the national Walking for Health team?
Do they have a good relationship with the national team? Why or why not?
23. What support do you receive from the Walking for Health team to help you deliver your
scheme? Is this the right type and level of support?
Probe for the type of support they receive (e.g. awareness raising, branding, staff and volunteer training,
guidance, support for volunteers), whether it meets their needs, any gaps, and if anything could be
improved.
Explore use of resources provided by national team including the ‘volunteering village’ , template press
release etc
Probe for types of support that would be welcomed that don’t receive at the moment and why needed
e.g. grant applications
24. How effective do you think the OHQ survey and database are for monitoring Walking for
Health?
Explore strengths and weaknesses / challenges of the OHQ survey, the database and any other monitoring processes. Probe for how effective these processes are and if anything could be improved. what do they do to get the data inputted, challenges of keeping up to date. Why do some not use the database at all
25. How effective is the Walking for Health branding?
Explore the extent to which they use the national branding and how it supports the delivery of their local
scheme.
Schemes will all now be required to use the national Walking for Health branding. Explore views on
compulsory branding, if there has been any challenges with using this in conjunction with other logos
they are required to use by funders etc. What benefits do they feel that using the branding brings them?
Explore use of free template that has been created which schemes can use – this is a free programme
template with all the necessary branding that schemes can just drop their walk details in, same with
posters as well.
Explore use of merchandise provided by the national team
26. Are there any other benefits of being part of a national programme?

A23
27. Overall, how effective have Ramblers and Macmillan been in managing Walking for Health?
Probe for aspects that are working well and less well. If they were involved prior to 2012, explore how
the new delivery arrangements compare to the previous ones. Probe for any benefits of having Ramblers
and Macmillan involved, such as the profile of the organisations and whether their involvement has
helped to secure in-kind resources.
28. How effective was the cascade training?
29. Is there anything that could be done to improve the Walking for Health programme?
Benefits
30. How do you think Walking for Health benefits the individuals that take part in the walks?
Probe for benefits to physical wellbeing, mental wellbeing, social inclusion etc.
31. How do you think Walking for Health benefits the volunteers?
Probe for benefits to skills and knowledge, physical wellbeing, mental wellbeing, social inclusion etc.
32. How do you think Walking for Health benefits your partners?
Probe for benefits for local health and social care economies and assist local public health delivery, plus
benefits to Ramblers and Macmillan.
33. (If not covered above) To what extent has Walking for Health supported increased partnership
working between organisations?
Probe for the type of partnerships created, whether these partnerships would have been established
without the programme, and the extent to which they are likely to be sustained.
Sustainability
34. What are your plans for your Walking for Health scheme over the next 12 months?
Probe for whether they are looking to expand.
35. To what extent do you think your Walking for Health scheme will be sustainable?
Probe for how the scheme will be sustainable, the role of the National Walking for Health team in
supporting sustainability, and if they require any support to make their scheme sustainable.
Other Comments
36. What are the key lessons that have been learnt from this programme?
37. Do you have any other comments (positive or negative) about your involvement in Walking
for Health?

A24

A25
Topic Guide for Volunteers
This topic guide is designed for volunteers involved in Walking for Health, for example walk leaders. The
topic guide should be treated as a flexible tool and the questions should be appropriately tailored to
each individual.
Background
1. How long have you been volunteering with Walking for Health for?
2. Prior to volunteering with Walking for Health, had you undertaken any other volunteering?
Probe for whether they had previously volunteered with Ramblers or Macmillan.
3. Before volunteering with Walking for Health, how physically active were you?
Probe for the amount of walking they did and whether they took part in other walks / physical activities.
4. How did you find out about Walking for Health?
Probe for how long they have been involved in Walking for Health.
5. What were your reasons / motivations for volunteering with Walking for Health?
Probe for whether they have been involved in volunteering before.
6. How much time do you spend volunteering with Walking for Health?
Record average hours per week/month they spend volunteering with Walking for Health and explore
frequency of volunteering.
7. Can you describe the volunteering role you undertake through Walking for Health?
Probe for the type of activities they undertake and how much time they volunteer (e.g. hours per week or
per month).
Delivery of Walking for Health
8. What do you enjoy most about volunteering with Walking for Health?
9. Is there anything you do not enjoy about volunteering with Walking for Health?
10. What support do you receive from the Walking for Health team to help you undertake your
volunteering role? Is this the right type and level of support?
Probe for the type of support they receive (e.g. training, guidance, support for monitoring), whether it
meets their needs and if anything could be improved.
Particular benefits of the walk leader training.

A26
11. To what extent are you satisfied with your level of involvement in the management and running
of the scheme?
Explore methods of encouraging volunteer satisfaction and retention e.g. meetings / social gatherings
12. Are you aware that Walking for Health is delivered by Ramblers and Macmillan? Do you think
there any benefits of having these organisations involved?
Do volunteers feel that they are receiving enough information about the national programme and what
has the coordinator done to support with this, i.e. encouraged them to sign up to the volunteer
newsletter?
13. Are there any benefits of volunteering as part of a national programme?
14. In your opinion, what is the best way to encourage people to volunteer with Walking for Health?
Interviewer note: Questions 13-19 are designed for walk leaders.
15. Can you describe a typical Walking for Health walk that you lead?
Probe for location of walk, time of walk, length of walk, number of participants, number of volunteers
etc, plus any changes to the walks over time.
16. Do you have any particular groups of individuals that you aim to cater for on your walks?
Examples might be people affected by cancer, with long term health conditions or disabilities, from
deprived areas, and older people
17. Do you help to raise awareness of your Walking for Health walks? If so, how?
Probe for successful awareness raising approaches, particularly for target groups, plus stakeholders.
Explore extent to which they receive referrals from partners and the effectiveness of this. Also explore
ways that the profile could be increased further.
18. Can you describe the type of individuals that take part in your walks? How has the profile of your
walkers changed over the last 12 months?
Probe for increases / decreases in numbers of walkers, new walkers, retention of walkers, changes in
types of walkers.
19. How do you ensure that your walks effectively cater for individuals with different needs?
Probe for successful approaches of supporting people affected by cancer, with long term health
conditions or disabilities, from deprived areas and older people. Explore approaches that are working
well and less well and any walks that demonstrate good practice.
20. What aspects of your walks do you think work particularly well? What do you think has helped
you to be so successful in this area?
Probe for anything that has worked less well.
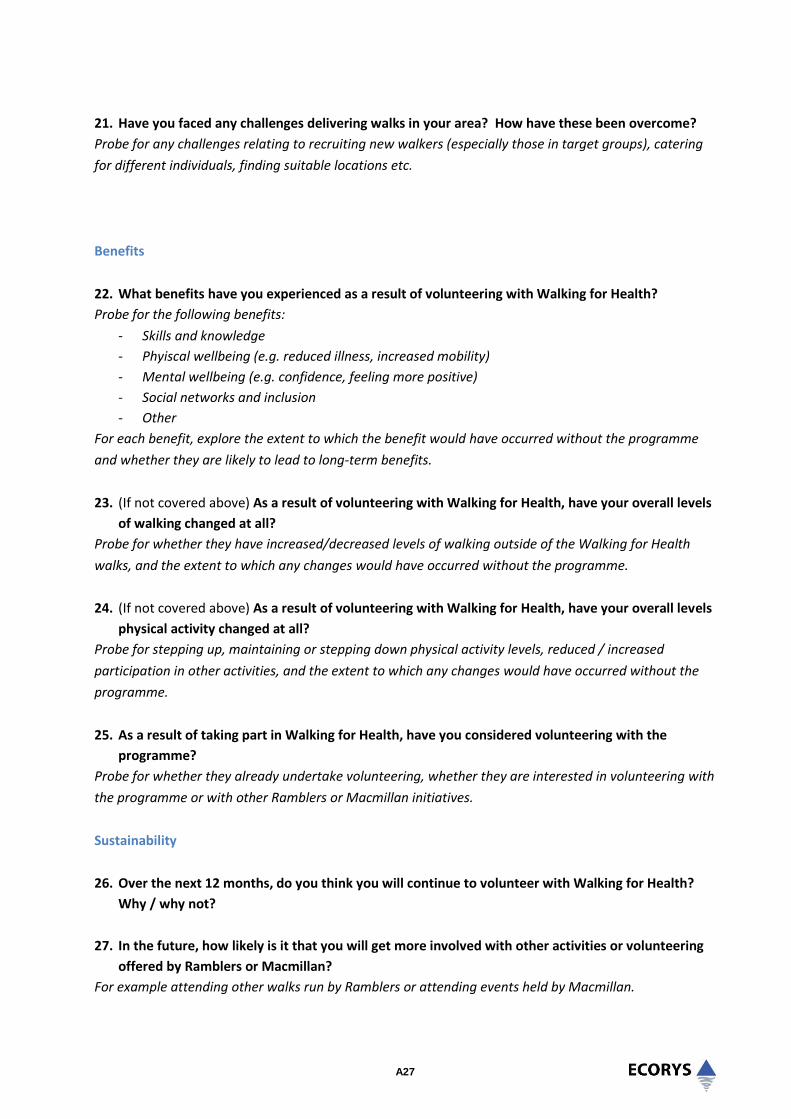
A27
21. Have you faced any challenges delivering walks in your area? How have these been overcome?
Probe for any challenges relating to recruiting new walkers (especially those in target groups), catering
for different individuals, finding suitable locations etc.
Benefits
22. What benefits have you experienced as a result of volunteering with Walking for Health?
Probe for the following benefits:
- Skills and knowledge
- Phyiscal wellbeing (e.g. reduced illness, increased mobility)
- Mental wellbeing (e.g. confidence, feeling more positive)
- Social networks and inclusion
- Other
For each benefit, explore the extent to which the benefit would have occurred without the programme
and whether they are likely to lead to long-term benefits.
23. (If not covered above) As a result of volunteering with Walking for Health, have your overall levels
of walking changed at all?
Probe for whether they have increased/decreased levels of walking outside of the Walking for Health
walks, and the extent to which any changes would have occurred without the programme.
24. (If not covered above) As a result of volunteering with Walking for Health, have your overall levels
physical activity changed at all?
Probe for stepping up, maintaining or stepping down physical activity levels, reduced / increased
participation in other activities, and the extent to which any changes would have occurred without the
programme.
25. As a result of taking part in Walking for Health, have you considered volunteering with the
programme?
Probe for whether they already undertake volunteering, whether they are interested in volunteering with
the programme or with other Ramblers or Macmillan initiatives.
Sustainability
26. Over the next 12 months, do you think you will continue to volunteer with Walking for Health?
Why / why not?
27. In the future, how likely is it that you will get more involved with other activities or volunteering
offered by Ramblers or Macmillan?
For example attending other walks run by Ramblers or attending events held by Macmillan.

A28
28. To what extent do you think Walking for Health will contribute to lasting benefits for you?
Other Comments
29. Would you recommend volunteering with Walking for Health to other individuals? Why/why
not?
Explore whether there are any particular types of people they would recommend the volunteering role
to.
30. Is there anything that could be done to improve the Walking for Health programme?
31. Do you have any other comments (positive or negative) about your involvement in Walking for
Health?
Topic Guide for Partners
This topic guide is designed for partners involved in Walking for Health, for example Local Authority or
NHS. The topic guide should be treated as a flexible tool and the questions should be appropriately
tailored to each individual.
Background
1. Could you give me an overview of your role and your organisation?
Probe for the aims and strategic priorities of the organisation and key activities.
2. In what way is your organisation involved in Walking for Health?
Probe for when the organisation got involved in Walking for Health (i.e. before or after Ramblers and
Macmillan took over the programme in 2012) and what their role is.
3. What was the motivation of your organisation for getting involved in Walking for Health?
Probe for strategic fit with local plans or strategies, development of strategic partnerships, delivery of
outcomes in response to local needs etc.
4. In you opinion, what is the overall aim of the Walking for Health programme?
Local Delivery of Walking for Health
5. How does your organisation add value to Walking for Health?
Probe for in-kind or financial inputs.

A29
6. How do you work with other partners (including Ramblers and Macmillan) to support the delivery
of Walking for Health?
Probe for partnership working at a national and local level, plus aspects that are working well and less
well.
7. Do you have any particular groups of individuals that you aim to involve in the walks?
Examples might be people affected by cancer, with long term health conditions or disabilities, from
deprived areas, and older people
8. How effectively is Walking for Health engaging and working with particular target groups?
Probe for engagement of people affected by cancer, with long term health conditions or disabilities, from
deprived areas and older people. Also explore approaches that are working well and less well.
9. (If applicable) How effectively is Walking for Health engaging and supporting volunteers?
Probe for successful awareness raising approaches, particularly for target groups, the role of the partner
organisation in supporting volunteers, and ways that the profile could be increased further.
10. How, if at all, has the profile of Walking for Health changed over the last 12 months?
Probe for increased awareness among participants and stakeholders, reasons for this, and ways that the
profile could be increased further.
11. Do you help to recruit and support volunteers for Walking for Health? If so, how?
Probe for successful recruitment channels.
12. What aspects of the Walking for Health scheme do you think work particularly well? What do you
think has helped the scheme to be so successful in this area?
Probe for anything that has worked less well.
13. Have there been any challenges delivering Walking for Health in your area? How have these been
overcome?
Probe for any challenges relating to recruiting new walkers (especially those in target groups), adapting
the scheme to align with new national priorities, monitoring and evaluation, working with partners,
recruiting and supporting volunteers etc.
14. Are you aware of any similar initiatives in your local area?
Probe for whether the organisation delivers / funds any similar activities, how Walking for Health differs
from other initiatives, or any areas of duplication or crowding out.
15. Without the national Walking for Health programme, to what extent do you think your walks
would have still been delivered?

A30
National Delivery of Walking for Health
16. How effective is the Walking for Health branding?
Explore the extent to which they use the national branding and how it supports the delivery of their local
scheme.
17. Are there any benefits of being part of a national programme?
18. Overall, how effective have Ramblers and Macmillan been in managing Walking for Health?
Probe for aspects that are working well and less well. If they were involved prior to 2012, explore how
the new delivery arrangements compare to the previous ones. Probe for any benefits of having Ramblers
and Macmillan involved, such as the profile of the organisations and whether their involvement has
helped to secure in-kind resources.
19. Is there anything that could be done to improve the Walking for Health programme?
Benefits
20. As a result of being involved in Walking for Health, has your organisation experienced any
benefits?
Probe for whether the programme has supported their strategic priorities and aims.
21. (If not covered above) To what extent has Walking for Health supported increased partnership
working between organisations?
Probe for the type of partnerships created, whether these partnerships would have been established
without the programme, and the extent to which they are likely to be sustained.
22. How do you think Walking for Health benefits the individuals that take part in the walks?
Probe for benefits to physical wellbeing, mental wellbeing, social inclusion etc.
23. How do you think Walking for Health benefits the volunteers?
Probe for benefits to skills and knowledge, physical wellbeing, mental wellbeing, social inclusion etc.
Sustainability
24. Over the next 12 months, do you think you will continue to take part in Walking for Health?
Probe for any changes to the nature of their involvement.
25. To what extent do you think Walking for Health schemes will be sustainable locally?
Probe for how the schemes will be sustainable.
A31
Other Comments
26. What are the key lessons that have been learnt from this programme?
27. Do you have any other comments (positive or negative) about your involvement in Walking for
Health?

A32
Topic Guide for Walkers
This topic guide is designed for individuals taking part in Walking for Health walks. It can be used to
inform one to one interviews or focus groups. The topic guide should be treated as a flexible tool and
the questions should be appropriately tailored to each individual.
Background and decision to join Walking for Health
1. How long have you been attending Walking for Health walks?
2. Before taking part in Walking for Health walks, how physically active were you?
Probe for the amount of walking they did and whether they took part in other walks / physical activities.
3. How did you find out about Walking for Health?
Explore how easy it was to find information about Walking for Health and if anything could be improved.
4. What were your reasons / motivations for joining Walking for Health?
Probe for physical activity reasons (stepping up, maintaining or stepping down), health reasons, social
reasons etc. Explore if there was anything/ anyone that helped / encouraged them to get involved.
5. Do you undertake any volunteering with Walking for Health?
If yes, please consider asking some of the questions on the volunteer topic guide.
6. Are you aware of any other walking groups in your area that you could have joined?
Probe for reasons why they did not join other walking or physical activity groups.
Experiences of Walking for Health
7. How often do you attend Walking for Health walks?
8. Can you describe a typical Walking for Health walk that you attend?
Probe for location of walk, time of walk, length of walk, number of participants, number of volunteers
etc.
9. How satisfied are you with the pace and distance of the walks?
10. How satisfied are you with the walk leader(s)?
Explore what the walk leaders’ role is, how they help walkers, how they cater for different walkers, how
well they lead the walk, how they communicate with walkers etc.
11. What do you like about the Walking for Health walks?
12. Is there anything you don’t like about the Walking for Health walks?

A33
13. Is there anything that could be done to improve the walks?
14. Are you aware that Walking for Health is delivered by Ramblers and Macmillan? Do you think
there any benefits of having these organisations involved?
Benefits
15. What benefits have you experienced as a result of taking part in Walking for Health walks?
Probe for the following benefits:
- Phyiscal wellbeing (e.g. reduced illness, increased mobility)
- Mental wellbeing (e.g. confidence, feeling more positive)
- Social networks and inclusion
- Other
For each benefit, explore the extent to which the benefit would have occurred without the programme
and whether they are likely to lead to long-term benefits.
16. (If not covered above) As a result of taking part in Walking for Health, have your overall levels of
walking changed at all?
Probe for whether they have increased/decreased levels of walking outside of the Walking for Health
walks, and the extent to which any changes would have occurred without the programme.
Probe how schemes encourage walkers move on to activities beyond Walking for Health.
Do they do additional ‘everyday’ walking as a result of being part of Walking for Health. i.e. do they walk
more to get from a to b instead of taking the bus or driving now?
17. (If not covered above) As a result of taking part in Walking for Health, have your overall levels
physical activity changed at all?
Probe for stepping up, maintaining or stepping down physical activity levels, reduced / increased
participation in other activities, and the extent to which any changes would have occurred without the
programme.
18. As a result of taking part in Walking for Health, have you considered volunteering with the
programme?
Probe for whether they already undertake volunteering, whether they are interested in volunteering with
the programme or with other Ramblers or Macmillan initiatives. Also explore whether there is anything
that would encourage them to take up volunteering or stopping them from taking up volunteering..
Sustainability
19. Over the next 12 months, do you think you will continue to take part in Walking for Health
walks?
Probe for any changes in participation levels.

A34
20. In the future, how likely is it that you will get more involved with other activities or
volunteering offered by Ramblers or Macmillan?
For example attending other walks run by Ramblers or attending events held by Macmillan.
21. To what extent do you think Walking for Health will contribute to lasting benefits for you?
Other Comments
22. Would you recommend Walking for Health to other individuals? Why/why not?
Explore whether there are any particular types of people they would recommend the walks to.
23. Do you have any other comments (positive or negative) about your involvement in Walking
for Health?

A35
Stakeholder topic guide
Background
1. Could you give me an overview of your role and your organisation? Probe for the aims and strategic priorities of the organisation and key activities.
2. Are you aware of Walking for Health schemes? What knowledge of Walking for Health did you have prior to being asked to take part in the interview. Please tell us what you know about the programme
Benefits of Walking
3. What is your view on the benefits of walking (esp. group walking) as a way of getting people more active and improving wellbeing? Compared to other activities?
4. What evidence are you aware of that supports the benefits of walking in improving physical activity and wellbeing? Do you know of the Walking Works report? If yes, has this influenced your thinking?
Relationship with Walking for Health
5. What do you see as the overall aim of the Walking for Health programme?
6. What is your organisation’s connection to Walking for Health? Probe for when the organisation got involved in Walking for Health (i.e. before or after Ramblers
and Macmillan took over the programme in 2012) and what the extent of involvement is.
7. Why were (are) you/your organisation interested in engaging with Walking for Health (or walk schemes generally)? Where does/could Walking for Health (or walk schemes) fit within your organisation’s priorities and activities or the services you provide? ?
Probe for strategic fit with national/local plans or strategies, development of strategic
partnerships, delivery of outcomes in response to local/population level needs etc .any barriers
for them engaging in it / referring people / supporting schemes
The partnership
8. Are you aware of the partnership responsible for the running of Walking for Health? Probe for what they know about the organisations that have run Walking for Health over its
history and in particular awareness of the current partnership that are running the programme,
and the role that they both play in this?
9. Do you have any links directly with either the Ramblers or Macmillan and if so, in what form?
10. Have you had any communication from the Walking for Health team directly as a result of your involvement? If yes, then what form did this take, and if not, what contact or support would help you in the future?
11. What do you see to be the challenges of this partnership delivering the programme?
12. What changes to the programme are you aware of as a result of it being run by the current partnership?
13. What impact do you feel these have had on the profile of Walking for Health? Do/would the changes make a difference to you in terms of how you view/support the programme?
14. Overall, how effective have Ramblers and Macmillan been in managing Walking for Health?
Probe for aspects that are working well and less well. If they were involved prior to 2012, explore

A36
how the new delivery arrangements compare to the previous ones. Probe for any benefits of
having Ramblers and Macmillan involved, such as the profile of the organisations and whether
their involvement has helped to secure in-kind resources.
15. Do you/would you be willing to promote Walking for Health to your stakeholders? How and why or why not? What priorities should Walking for Health address in order for you to promote it?
16. Please let us know what, if any challenges you encounter when promoting/would foresee in promoting Walking for Health?
17. What more would you need to know about Walking for Health to encourage you to support the programme on a national / regional / local level?
18. Do you favour a more targeted approach to delivering health walks, focusing on specific groups, or do you think it’s (more) appropriate to try and benefit the greatest number of people?
Probe for any specific target groups they would want to promote a scheme like this to
19. (If applicable) How effectively is Walking for Health (and other health walks programmes) engaging and working with particular target groups?
Probe for engagement of people affected by cancer, with long term health conditions or
disabilities, from deprived areas and older people. Also explore approaches that are working
well and less well.
20. (If applicable) How effectively is Walking for Health engaging and supporting volunteers?
Probe for successful approaches to recruiting and managing volunteers
21. To what extent have Macmillam and the Ramblers supported partnership working and stakeholder involvement in Walking for Health locally?
Probe for the type of partnerships created, whether these partnerships would have been
established without the programme, and the extent to which they are likely to be sustained.
22. What other types of physical activity schemes compete for your attention, who are you most likely to engage with and why?
23. What level and kind of evidence are needed for you to promote a physical activity programme such as Walking for Health?
24. Do you have Walking for Health schemes locally? Are they successful? Would you change anything about the way they are run? What do you see to be the benefits to the schemes you have been involved with, of being part of Walking for Health?
Messaging and branding
25. What messaging relating to Walking for Health are you aware of?
26. Do you think Walking for Health’s messaging is correct for attracting those who are the least active to Walking for Health?
Probe on the role of the branding.
27. Do you think Walking for Health’s messaging and approach are correct for attracting key target groups including those with long term health conditions including cancer? How else do you think these groups can best be targeted?
Improving Walking for Health’s profile / presence
28. What sense/opinion do you have of Walking for Health’s current profile/presence?
29. (If applicable) How, if at all, has the profile of Walking for Health changed over the last 12 months?

A37
Probe for awareness among participants and stakeholders, reasons for this, and ways that the
profile could be increased further.
30. Have you accessed the Walking for Health website? What do you think of the content?
31. Have you been in contact with Walking for Health staff?
32. Do you help to raise awareness of Walking for Health programme locally? Probe for successful awareness raising approaches, particularly for target groups, plus
stakeholders. Explore ways that the profile could be increased further.
33. What role do/could Health and Social Care professionals play in promoting Walking for Health as a form of treatment? Why do you think they do this / not do this (as applicable)?
34. What more could be done to encourage Health and Social care professionals to recommend their clients to Walking for Health?
35. What suggestions do you have for Walking for Health to enhance its profile across the health and social care sector locally / nationally?
Sustainability
36. To what extent do you think Walking for Health schemes are sustainable locally? Probe for how schemes will be sustainable and the role of the National Walking for Health team
in supporting sustainability.
37. When commissioning services related to health and physical activity, what are your top three priorities that Walking for Health should address (or did address that others didn’t if they have previously commissioned Walking for Health)?
38. Who in your opinion who are the main competitors to Walking for Health re physical activity commissioning in your area?
39. What type or level of evidence is required by you to fund Walking for Health. Prompts to include increased physical activity or economic savings?
40. In commissioning do you tend to prioritise projects which benefit the greatest number of people, even in a small way, or do you tend to focus on targeting smaller groups who need programmes the most?
41. What do you perceive to be the barriers and enablers for commissioning physical activity programmes in comparison to other prevention programmes?
42. How do you think your relationship with Walking for Health will evolve if at all over the next 12 months?
43. Probe for any changes to the nature of their involvement.
44. How would you like to see Walking for Health develop in the next 3 years?
45. Do you have any other comments (positive or negative) about Walking for Health?

A38
Annex Two: List of stakeholder consultees
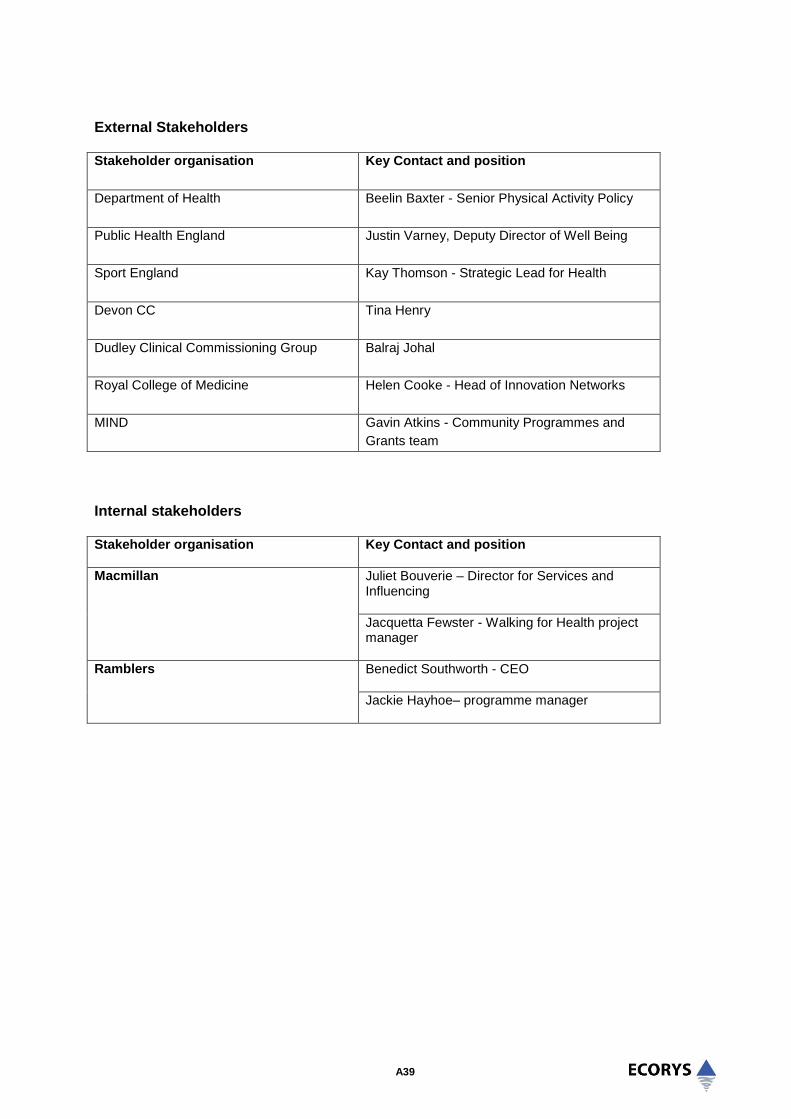
A39
External Stakeholders Stakeholder organisation Key Contact and position
Department of Health
Beelin Baxter - Senior Physical Activity Policy
Public Health England
Justin Varney, Deputy Director of Well Being
Sport England
Kay Thomson - Strategic Lead for Health
Devon CC Tina Henry
Dudley Clinical Commissioning Group
Balraj Johal
Royal College of Medicine
Helen Cooke - Head of Innovation Networks
MIND Gavin Atkins - Community Programmes and
Grants team
Internal stakeholders Stakeholder organisation
Key Contact and position
Macmillan Juliet Bouverie – Director for Services and Influencing
Jacquetta Fewster - Walking for Health project manager
Ramblers Benedict Southworth - CEO
Jackie Hayhoe– programme manager
A40
Annex Three: Additional information on methodology
A41
Pedometer Research
Everyone participating in the survey was asked at the end of their first telephone interview if they would
be willing to wear a pedometer for two one-week periods. The contact details of those expressing
willingness to do this were sent to the team at UEA and pedometers were dispatched (where a unit was
available) within a working week to ensure the device was worn as quickly as possible after the
participant had attended their first walk. The pedometer used was the Yamaxx Digi-Walker CW-700
device. This is commonly used in research studies as it has an on-board memory meaning it can be read
by the research team rather than requiring the participant to return a reading, plus the ‘clamshell’ design
means it can be sealed shut which helps prevent reactivity associated with participants being able to read
their own step-counts.
All participants were sent a consent form, instruction sheet, plus wear diary with their pedometer. The
instruction sheet asked participants to wear the pedometer during waking hours for a seven day period
starting on the Monday after they received the device. The wear diary allowed them to record times that
the device was not worn (for example they forgot to wear it or were swimming) but these diaries were
generally very poorly completed or not returned and hence were not used in this research. Each
participant returning a worn pedometer at baseline was sent another four months later and asked to
repeat wear, and this constituted the follow-up. As the device has a two week memory (the best of any
pedometer available on the market) participants were asked to return it immediately after completing wear
so that their data was not lost. All participants were sent an email message (or text message if no email
was available) reminding them to return the device. In some cases participants contacted the research
team because they had not been able to wear the device when instructed. In these cases they were
asked to wear the device the following week. As the Digiwalker memory only stores the cumulative total
for an entire week, it was not possible to determine if the device was worn or not on any given day and
therefore all values presented are based on an assumption the device was worn for 7 days as specified
on the included instructions.
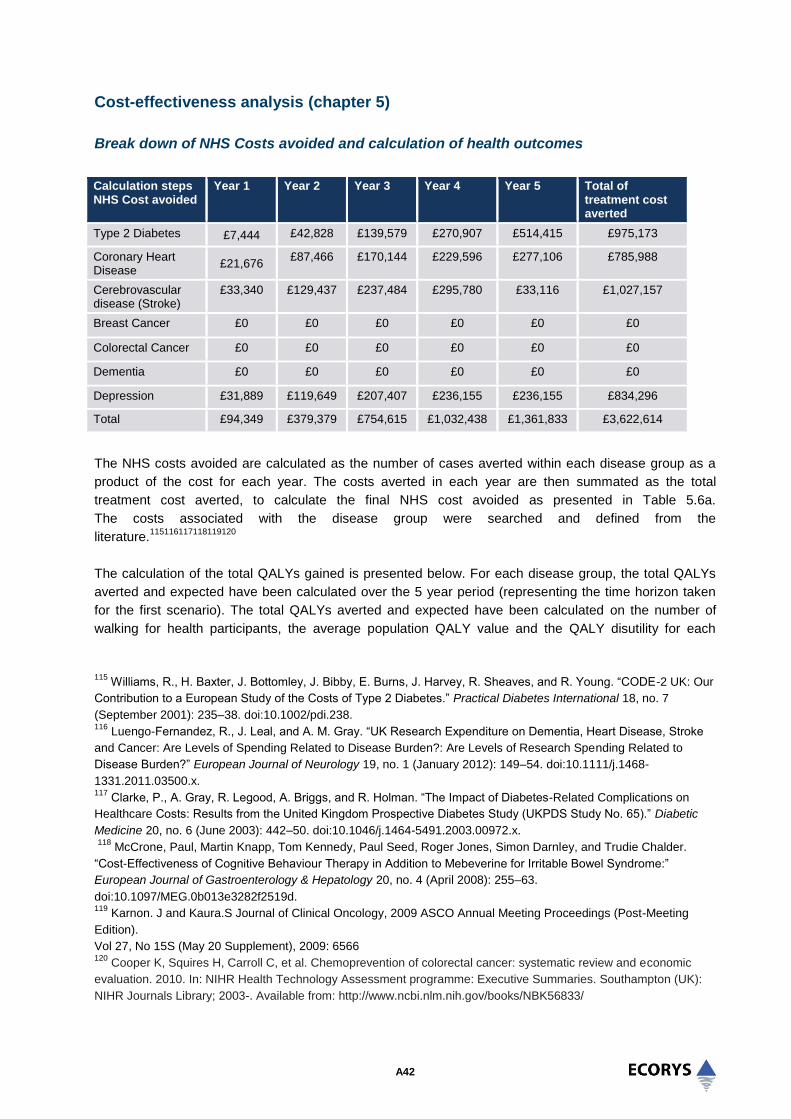
A42
Cost-effectiveness analysis (chapter 5)
Break down of NHS Costs avoided and calculation of health outcomes
Calculation steps NHS Cost avoided
Year 1 Year 2 Year 3 Year 4 Year 5 Total of treatment cost averted
Type 2 Diabetes £7,444 £42,828 £139,579 £270,907 £514,415 £975,173
Coronary Heart Disease
£21,676 £87,466 £170,144 £229,596 £277,106 £785,988
Cerebrovascular disease (Stroke)
£33,340 £129,437 £237,484 £295,780 £33,116
£1,027,157
Breast Cancer £0 £0 £0 £0 £0 £0
Colorectal Cancer £0 £0 £0 £0 £0 £0
Dementia £0 £0 £0 £0 £0 £0
Depression £31,889 £119,649 £207,407 £236,155 £236,155 £834,296
Total £94,349 £379,379 £754,615 £1,032,438 £1,361,833 £3,622,614
The NHS costs avoided are calculated as the number of cases averted within each disease group as a
product of the cost for each year. The costs averted in each year are then summated as the total
treatment cost averted, to calculate the final NHS cost avoided as presented in Table 5.6a.
The costs associated with the disease group were searched and defined from the
literature.115116117118119120
The calculation of the total QALYs gained is presented below. For each disease group, the total QALYs
averted and expected have been calculated over the 5 year period (representing the time horizon taken
for the first scenario). The total QALYs averted and expected have been calculated on the number of
walking for health participants, the average population QALY value and the QALY disutility for each
115
Williams, R., H. Baxter, J. Bottomley, J. Bibby, E. Burns, J. Harvey, R. Sheaves, and R. Young. “CODE-2 UK: Our
Contribution to a European Study of the Costs of Type 2 Diabetes.” Practical Diabetes International 18, no. 7
(September 2001): 235–38. doi:10.1002/pdi.238. 116
Luengo-Fernandez, R., J. Leal, and A. M. Gray. “UK Research Expenditure on Dementia, Heart Disease, Stroke
and Cancer: Are Levels of Spending Related to Disease Burden?: Are Levels of Research Spending Related to
Disease Burden?” European Journal of Neurology 19, no. 1 (January 2012): 149–54. doi:10.1111/j.1468-
1331.2011.03500.x. 117
Clarke, P., A. Gray, R. Legood, A. Briggs, and R. Holman. “The Impact of Diabetes-Related Complications on
Healthcare Costs: Results from the United Kingdom Prospective Diabetes Study (UKPDS Study No. 65).” Diabetic
Medicine 20, no. 6 (June 2003): 442–50. doi:10.1046/j.1464-5491.2003.00972.x.
118
McCrone, Paul, Martin Knapp, Tom Kennedy, Paul Seed, Roger Jones, Simon Darnley, and Trudie Chalder.
“Cost-Effectiveness of Cognitive Behaviour Therapy in Addition to Mebeverine for Irritable Bowel Syndrome:”
European Journal of Gastroenterology & Hepatology 20, no. 4 (April 2008): 255–63.
doi:10.1097/MEG.0b013e3282f2519d. 119
Karnon. J and Kaura.S Journal of Clinical Oncology, 2009 ASCO Annual Meeting Proceedings (Post-Meeting
Edition).
Vol 27, No 15S (May 20 Supplement), 2009: 6566 120
Cooper K, Squires H, Carroll C, et al. Chemoprevention of colorectal cancer: systematic review and economic
evaluation. 2010. In: NIHR Health Technology Assessment programme: Executive Summaries. Southampton (UK):
NIHR Journals Library; 2003-. Available from: http://www.ncbi.nlm.nih.gov/books/NBK56833/

A43
disease group (defined from the literature as a value between 0 and 1). Through the model simulation,
the number of expected cases and the number of averted cases for each disease group is computed. The
total QALYs averted is then calculated as the number of participants multiplied by the population average
QALY value minus the number of averted cases as a product of the disease disutility. The total QALYs
expected is calculated as the number of participants multiplied by the population average QALY value
minus the number of expected cases as a product of the disease utility.
Calculation Health Outcomes
Total QALYs averted in 5 years
Total QALYs expected in 5 years
Total QALYs gained in 5 years
Type 2 Diabetes 202490.02 202497.25 7.23
Coronary Heart Disease 202277.63 202516.30 239.68
Cerebrovascular disease (Stroke)
202325.46 202513.46 188.00
Breast Cancer 202496.09 202496.09 0.00
Colorectal Cancer 202496.09 202496.09 0.00
Dementia 202496.09 202496.09 0.00
Depression 202264.62 202531.39 267.78
Total 1416844.98 1417547.67 702.7
Example
Year 1, number of type 2 diabetes expected cases = 3 (A)
Population Average QALY = 0.7536 (B)
Type 2 Diabetes Disutility = 0.015 (C)
Number of Participants = 53741 (D)
=[(D)*(B) – (A)*(C)] = Expected QALYs in Year 1
The total QALYs expected for the five years is calculated as the summation of the expected QALYs over
the five years, calculated in the same manner as above.
Probabilistic sensitivity analysis
Due to the many assumptions made surrounding the input parameters, sensitivity analysis was conducted
to test the robustness of the assumptions on the initial result. The input parameters in this case are
assigned a range of distributed inputs and the model can randomly select one value within the range
specified for each input, to present the result. The cost-effectiveness plane is produced when 1,000
iterations are run to record the result each time for each iteration. This presents the probability each
result, when inputs are varied around the uncertainty will be cost-effective. Each point represents the two
components of the ICER against one another – costs vs benefits. This shows how each component
varies around its mean and how each component varies with respect to each other. Figure 1 shows the
cost-effectiveness distribution when uncertainties around the input parameters are varied in probabilistic
sensitivity analysis.

A44
Figure 1 Cost-effectiveness distribution
A very dispersed pattern, rather than a closely concentrated one, indicates that we must take care
particularly in interpreting the single number ICER (the average value masks the variation underneath).
Figure 2 presents the cost-effectiveness acceptability curve which compares the results of the ICER
values from the probabilistic sensitivity analysis with the threshold willingness to pay. As the threshold
rises, the proportion of simulations being cost-effective increases. At the £30,000 NICE threshold value,
all the ICER 1000 iterations are cost-effective. Therefore, the probability that the programme is cost-
effective is 100%. The curve also gives a good understanding of what the probability of cost-effectiveness
will be given how much the funder is willing to pay per QALY gained.

A45
Figure 2 Cost-effectiveness acceptability curve
Figure 3 displays the variability of the results for each simulation and each disease as the number of
cases averted and the consequent reduction in treatment costs. For each disease, the number of cases
averted and the savings or cost differs. For a number of diseases, there are negative cases averted,
which are the disease cases occurring in spite of the health walks provision. The distribution of the graph
shows that a large number of depression and type 2 diabetes cases will be averted. Additionally, cases of
stroke and ischaemic heart disease will be averted at a certain cost value. Diseases such as breast
cancer, colorectal cancer, and dementia do not appear to be averted. This is due to the time to effect of
the intervention. The benefits to health can take a length of time to influence some diseases, which leads
to different lags. The model adjusts for this by assuming different lag lengths depending on the disease.
For Ischaemic heart disease, Stroke and Depression, we assume a 2 year lag, while for Type 2 diabetes
we assume a 3.2 year lag and for cancers and dementia we assume a 17 year lag.

A46
Figure 3 Treatment cost saving by cases averted

A47
Annex Four: Documents reviewed

A48
Bibliography
Bowler, D., Buyung-Ali, L., Knight, T., & Pullin, A. (2010). A systematic review of evidence for the added
benefits to health of exposure to natural environments. BMC Public Health, 10(1), 456.
British Heart Foundation (2013) National Centre Physical Activity and Health. Making the Case for
Physical Activity
Chief Medical Officers (2011) Start active, stay active A report on physical activity for health from the four
home countries’
Cramp, F., Byron-Daniel, J. (2012), Exercise for the management of cancer-related fatigue in adults.
status and date: New search for studies and content updated (conclusions changed), published in
Cochrane Database of Systematic Reviews, 11 (131)
Department of Health (2011), Start active, stay active: a report on physical activity from the four home
countries’ Chief Medical Officers
Fitches, T. (2011), Who took part in Walking for Health? Natural England Research Reports, Number
NERR041 R
Kaplan, S., & Talbot, J. F. (1983), Psychological benefits of a wilderness experience. Behaviour and the
Natural Environment, 6, 163-203
Maas, J., van Dillen, S. M., Verheij, R. A., & Groenewegen, P. P. (2008). Social contacts as a possible
mechanism behind the relation between green space and health. Health and Place, 5(2):586-9
Joint Health Surveys Unit. Health Survey for England (2008), Physical Activity and Fitness.
Kassavou, A., Turner, A., French, D.P. (2013), Do interventions to promote walking in groups increase
physical activity? A meta-analysis. International Journal of Behavioral Nutrition & Physical Activity, 10, 18
.
McAuley E, Elavsky S, Motl RW, Konopack JF, Hu L, Marquez DX. Physical activity, self-efficacy, and
self-esteem: longitudinal relationships in older adults. J Gerontol B Psychol Sci Soc Sci 2005, 60:268–
275.
Macmillan Cancer Support (2011) The importance of physical activity for people living with and beyond
cancer: A concise evidence review.
Mishra, S.I., Scherer, R. W., Snyder, C., Geigle, P. M., Berlanstein, D. R., Topaloglu, O. (2012), Exercise
interventions on health‐related quality of life for people with cancer during active treatment, The Cochrane
Library.
Ogilvie, D., Foster, C., Rothnie, H. (2007), Interventions to promote walking: systematic review, BMJ,
334, 1204 – 1207.
Ogunleye AA, Holmes, MD. Physical activity and breast cancer survival. Brest Cancer Research (2009),
11(5): 106.
Phillips, R., Knox, A. & Langley, E. (2012), What impact did Walking for Health have on the physical
activity levels of participants? Natural England Commissioned Reports, Number 075.

A49
Public Health England (2014), Everybody active, every day: an evidence-based approach to physical
activity.
Robertson, R., Robertson, A., Jepson, R., Maxwell, M. (2012), Walking for depression or depressive
symptoms: A systematic review and meta-analysis. Mental Health and Physical Activity, 5, 66-75.
The Ramblers (2013), Walking works Making the case to encourage greater uptake of walking as a
physical activity and recognise the value and benefits of Walking for Health.
The Ramblers and Macmillan (2013), walking Works: Making the case to encourage uptake of walking as
a physical activity and recognise the value and benefits of Walking for Health.
Townsend N, Bhatnagar P, Wickramasinghe K, Scarborough P, Foster C, Rayner M. Physical Activity
Statistics 2012.
Townsend N, Wickramasinghe K, Williams J, Bhatnagar P, Rayner M. (2015), Physical Activity Statistics
2015.
UKActive (2014), Turning the Tide of Inactivity.
Villalba Van Dijk, L., Cacace, M., Nolte, E., Sach, T., Fordham, R. & Suhrcke, M. (2012), Costing the
Walking for Health programme, Natural England Commissioned Reports, Number 099: foreword.
Walking for Health (2013), The case for Walking for Health: a briefing for Scheme Coordinators, February
2013.
Walking for Health (2013), The case for Walking for Health: a briefing for Scheme Coordinators, February
2013.
Walking for Health (2013), The case for Walking for Health: a briefing for Scheme Coordinators, February
2013.
Walking for Health (2012), Your Training Manual.