Evaluation of Two Guralp Preamplifiers for GS21 ...Evaluation of Two Guralp Preamplifiers for GS21...
67
SANDIA REPORT SAND2015-7076 Unlimited Release Printed August 2015 Evaluation of Two Guralp Preamplifiers for GS21 Seismometer Application B. John Merchant George W. Slad Prepared by Sandia National Laboratories Albuquerque, New Mexico 87185 and Livermore, California 94550 Sandia National Laboratories is a multi-program laboratory managed and operated by Sandia Corporation, a wholly owned subsidiary of Lockheed Martin Corporation, for the U.S. Department of Energy's National Nuclear Security Administration under contract DE-AC04-94AL85000. Approved for public release; further dissemination unlimited.
Transcript of Evaluation of Two Guralp Preamplifiers for GS21 ...Evaluation of Two Guralp Preamplifiers for GS21...
SANDIA REPORTSAND2015-7076Unlimited ReleasePrinted August 2015
Evaluation of Two Guralp Preamplifiers for GS21 Seismometer ApplicationB. John MerchantGeorge W. Slad
Prepared bySandia National LaboratoriesAlbuquerque, New Mexico 87185 and Livermore, California 94550
Sandia National Laboratories is a multi-program laboratory managed and operated by Sandia Corporation, a wholly owned subsidiary of Lockheed Martin Corporation, for the U.S. Department of Energy's National Nuclear Security Administration under contract DE-AC04-94AL85000.
Approved for public release; further dissemination unlimited.
2
Issued by Sandia National Laboratories, operated for the United States Department of Energy by Sandia Corporation.
NOTICE: This report was prepared as an account of work sponsored by an agency of the United States Government. Neither the United States Government, nor any agency thereof, nor any of their employees, nor any of their contractors, subcontractors, or their employees, make any warranty, express or implied, or assume any legal liability or responsibility for the accuracy, completeness, or usefulness of any information, apparatus, product, or process disclosed, or represent that its use would not infringe privately owned rights. Reference herein to any specific commercial product, process, or service by trade name, trademark, manufacturer, or otherwise, does not necessarily constitute or imply its endorsement, recommendation, or favoring by the United States Government, any agency thereof, or any of their contractors or subcontractors. The views and opinions expressed herein do not necessarily state or reflect those of the United States Government, any agency thereof, or any of their contractors.
Printed in the United States of America. This report has been reproduced directly from the best available copy.
Available to DOE and DOE contractors fromU.S. Department of EnergyOffice of Scientific and Technical InformationP.O. Box 62Oak Ridge, TN 37831
Telephone: (865) 576-8401Facsimile: (865) 576-5728E-Mail: [email protected] ordering: http://www.osti.gov/bridge
Available to the public fromU.S. Department of CommerceNational Technical Information Service5285 Port Royal Rd.Springfield, VA 22161
Telephone: (800) 553-6847Facsimile: (703) 605-6900E-Mail: [email protected] order: http://www.ntis.gov/help/ordermethods.asp?loc=7-4-0#online
3
SAND2015-7076Unlimited Release
Printed August 2015
Evaluation of Two Guralp Preamplifiers for GS21 Seismometer Application
B. John Merchant George W. Slad
Ground-based Monitoring R and ESandia National Laboratories
P.O. Box 5800Albuquerque, New Mexico 87185-MS0404
Abstract
Sandia National Laboratories has tested and evaluated two Guralp preamplifiers for use with a GS21 seismometer application. The two preamplifiers have a gain factor of 61.39. The purpose of the preamplifier evaluation was to determine a measured gain factor, transfer function, total harmonic distortion, self-noise, application passband, dynamic range, seismometer calibration pass-through, and to comment on any issues encountered during the evaluation. The test results included in this report were in response to static, tonal, and dynamic input signals. The Guralp GS21 preamplifiers are being evaluated for potential use in the International Monitoring System (IMS) of the Comprehensive Nuclear Test-Ban-Treaty Organization (CTBTO).
Test methodologies used were based on IEEE Standards 1057 for Digitizing Waveform Recorders and 1241 for Analog to Digital Converters

4
ACKNOWLEDGMENTS
This work was funded by the United States Department of State as a CTBT Contribution-in-Kind with the support of the Department of Energy Office of Nuclear Verification (NA-243).
We would like to thank Guralp for providing the GS21 preamplifiers to evaluate.

5
CONTENTS
1 Introduction..............................................................................................................................112 Testing Overview.....................................................................................................................13
2.1 Objectives ......................................................................................................................132.2 Test and Evaluation Background...................................................................................132.3 Standardization/Traceability..........................................................................................132.4 Test/Evaluation Process.................................................................................................13
2.4.1 Preamplifier Testing ........................................................................................132.4.2 General Preamplifier Performance Tests.........................................................13
2.5 Test Configuration and System Specifications..............................................................142.5.1 Preamplifier Description and Test Configuration............................................14
2.6 Test Configuration and System Specifications..............................................................162.6.1 Power ...............................................................................................................172.6.2 Data Recording ................................................................................................172.6.3 Signal Generation ............................................................................................182.6.4 Ambient Conditions.........................................................................................20
3 Evaluation ................................................................................................................................213.1 Power Consumption.......................................................................................................213.2 Input Impedance ............................................................................................................223.3 Input Terminated Noise .................................................................................................233.4 AC Clip..........................................................................................................................263.5 Dynamic Range .............................................................................................................303.6 Seismic System Noise....................................................................................................313.7 DC Accuracy .................................................................................................................333.8 AC Accuracy .................................................................................................................363.9 Harmonic Distortion ......................................................................................................413.10 Time Tag........................................................................................................................453.11 Response Verification....................................................................................................47
3.11.1 Complex Response ..........................................................................................483.11.2 Time Delay ......................................................................................................503.11.3 Passband ..........................................................................................................513.11.4 Dynamic Noise ................................................................................................52
3.12 Calibrator Pass-through .................................................................................................533.12.1 5 Hz Sinusoid...................................................................................................543.12.2 Broadband........................................................................................................55
3.13 GS21 Calibration ...........................................................................................................584 Evaluation Summary ...............................................................................................................61References......................................................................................................................................63Appendix........................................................................................................................................64
Geotech GS21 Response..........................................................................................................64Distribution ....................................................................................................................................65

6
7
FIGURES
Figure 1 Guralp GS21 Preamplifiers ...............................................................................................9Figure 2 Guralp preamplifier G20307 and G20311 at FACT .......................................................13Figure 3 Test Configuration Diagram............................................................................................14Figure 4 Test Setup........................................................................................................................14Figure 5 Lab Power Supplies.........................................................................................................15Figure 6 Agilent 3458A Serial #MY45048371 .............................................................................15Figure 7 CMD-DM24S3AM Serial #2187 ....................................................................................16Figure 8 Stanford Research Systems DS360 Ultra Low Distortion Oscillator .............................16Figure 9 Quanterra Supertonal Signal Source and GPS ................................................................17Figure 10 Martel DC Voltage Calibrator.......................................................................................17Figure 11 Power Consumption Evaluation....................................................................................19Figure 12 Guralp GS21 Preamplifier Power Consumption ...........................................................19Figure 13 G20307 Input Impedance .............................................................................................20Figure 14 G20311 Input Impedance ..............................................................................................20Figure 15 Preamplifier Input Terminated Noise Configuration Diagram .....................................21Figure 16 Preamplifier Input Terminated Noise Configuration ....................................................21Figure 17 G20307 Preamplifier Input Terminated Noise Power Spectra......................................22Figure 18 G20311 Preamplifier Input Terminated Noise Power Spectra......................................22Figure 19 Preamplifier Input Terminated RMS Noise ..................................................................22Figure 20 Guralp Digitizer Clip.....................................................................................................23Figure 21 Preamplifier Input Terminated Noise Configuration Diagram .....................................24Figure 22 Preamplifier Input Terminated Noise Configuration ....................................................25Figure 23 G20307 Clip Waveforms ..............................................................................................25Figure 24 G20311 Clip Waveforms ..............................................................................................26Figure 25 G20307 Preamplifier Seismic System Noise Power Spectra ........................................28Figure 26 G20311 Preamplifier Seismic System Noise Power Spectra ........................................28Figure 27 Preamplifier DC Accuracy Configuration Diagram......................................................29Figure 28 Preamplifier DC Accuracy Configuration.....................................................................30Figure 29 DC Accuracy Waveform...............................................................................................30Figure 30 Preamplifier AC Accuracy Configuration Diagram......................................................32Figure 31 Preamplifier AC Accuracy Configuration.....................................................................33Figure 32 AC Accuracy Tone Time Series for 0.1 V and a sweep of frequencies........................33Figure 33 G20307 AC Accuracy gain levels .................................................................................34Figure 34 G20311 AC Accuracy gain levels .................................................................................35Figure 35 Preamplifier Harmonic Distortion Configuration Diagram ..........................................37Figure 36 Preamplifier Harmonic Distortion Configuration .........................................................37Figure 37 Guralp Digitizer 0.2 V Harmonic Distortion ................................................................38Figure 38 Guralp Digitizer 10 V Harmonic Distortion ................................................................38Figure 39 G20307 0.2V Harmonic Distortion ...............................................................................39Figure 40 G20311 0.2V Harmonic Distortion ...............................................................................40Figure 41 Guralp Digitizer Response Verification Configuration Diagram .................................41Figure 42 Preamplifier Response Verification Configuration Diagram........................................41Figure 43 G20307 Complex Response – Power Spectra, Coherence, Magnitude, and Phase Response ........................................................................................................................................42
8
Figure 44 G20311 Complex Response – Power Spectra, Coherence, Magnitude, and Phase Response ........................................................................................................................................43Figure 45 G20307 Time Delay .....................................................................................................45Figure 46 G20311 Time Delay .....................................................................................................45Figure 47 G20307 Passband Coherence and Magnitude Response..............................................46Figure 48 G20311 Passband Coherence and Magnitude Response..............................................46Figure 49 G20307 Incoherent Dynamic Noise ..............................................................................47Figure 49 G20311 Incoherent Dynamic Noise ..............................................................................47Figure 51 Geotech GS21 Response ...............................................................................................52
TABLES
Table 1 Minimum requirements for station specifications ............................................................10Table 2 Preamplifier input connector pin outs provide by Guralp Systems..................................12Table 3 Preamplifier output connector pin outs provided by Guralp Systems..............................13Table 4 Guralp CMG-DM24S3AM Bitweights ............................................................................16Table 5 Guralp GS21 Preamplifier Input Impedance ...................................................................20Table 6 Guralp Digitizer Clip Levels ............................................................................................23Table 7 G20307 Clip Levels..........................................................................................................26Table 8 G20311 Clip Levels..........................................................................................................26Table 9 Preamplifier Clip Levels...................................................................................................26Table 10 Preamplifier Dynamic Range .........................................................................................27Table 12 DC Accuracy Results......................................................................................................31Table 13 Tone Amplitudes ............................................................................................................32Table 14 Tone Frequencies............................................................................................................32Table 15 G20307 AC Accuracy gain levels ..................................................................................34Table 16 G20311 AC Accuracy gain levels ..................................................................................35Table 17 Preamplifier AC gain......................................................................................................36Table 18 Guralp Digitizer 0.2 V Harmonic Distortion..................................................................38Table 19 Guralp Digitizer 10 V Harmonic Distortion...................................................................38Table 20 G20307 0.2V Harmonic Distortion ................................................................................39Table 21 G20311 0.2V Harmonic Distortion ................................................................................40Table 22 Complex Response Roll-off over 0.5 to 16 Hz ..............................................................44Table 23 Time Delay .....................................................................................................................45

9
NOMENCLATURE
CTBTO Comprehensive Nuclear-Test-Ban Treaty OrganizationdB decibelDOE Department of EnergyIMS International Monitoring SystemLNM Low Noise ModelPSD Power Spectral DensitySNL Sandia National Laboratories

10

11
1 INTRODUCTION
Figure 1 Guralp GS21 Preamplifiers
The evaluation of the two Guralp GS21 preamplifiers, serial numbers G20307 and G20311, was performed by Sandia National Laboratories (SNL) in order to determine their performance for IMS applications. The preamplifiers were developed by Guralp for interfacing between a Geotech GS21 short-period seismometer and a Guralp CMG-DM24S3AM digitizer. A preamplifier is needed in this configuration in order to reduce the quantization and electronic noise of the digitizer and associated amplifiers to a level that is below the local site noise.
12
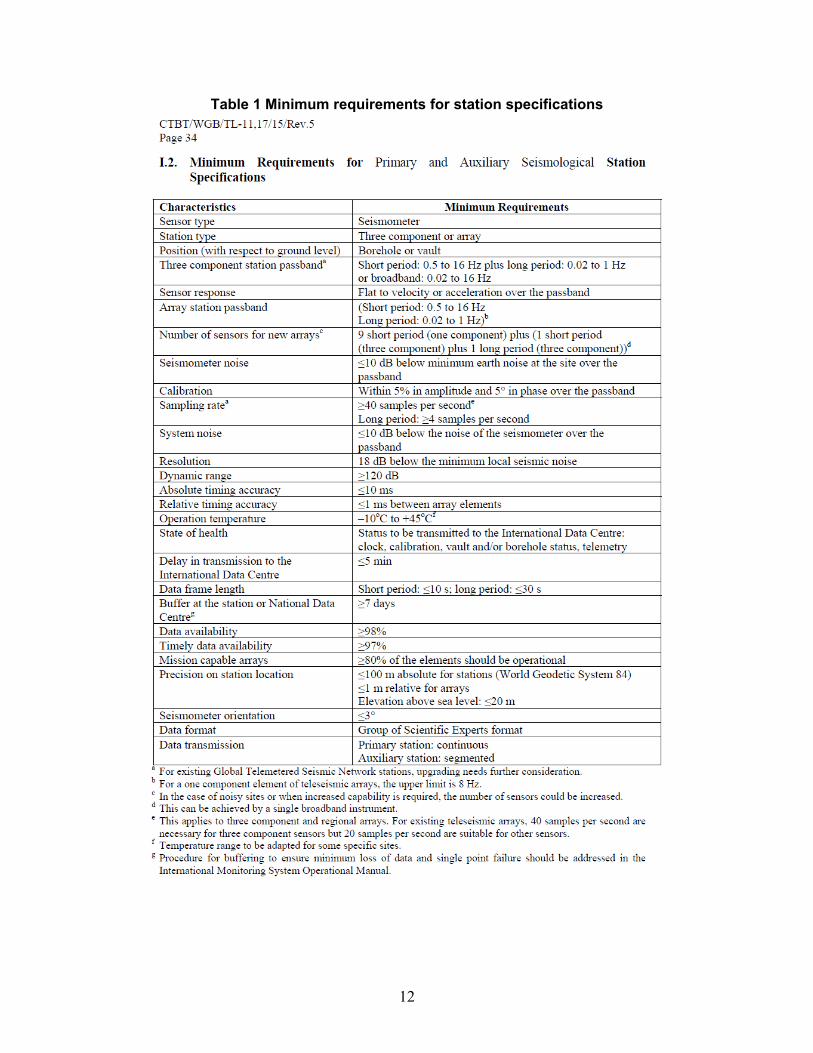
Table 1 Minimum requirements for station specifications

13
2 TESTING OVERVIEW
2.1 ObjectivesThe objective of this work was to evaluate the overall technical performance of two Guralp preamplifiers. Basic preamplifier characterization includes determining DC gain factor, AC gain factor, noise, dynamic range, transfer function, relative total harmonic distortion, system noise performance, and calibration pass-through. The results of this evaluation were compared to relevant application requirements or specifications of the preamplifier provided by the manufacturer.
2.2 Test and Evaluation BackgroundSandia National Laboratories (SNL), Ground-based Monitoring R&E Department has the capability of evaluating the performance of preamplifiers, digitizing waveform recorders and analog-to-digital converters/high-resolution digitizers for geophysical applications.
2.3 Standardization/TraceabilityTests are based on the Institute of Electrical and Electronics Engineers (IEEE) Standard 1057 for Digitizing Waveform Recorders and Standard 1241 for Analog to Digital Converters . The analyses based on these standards were performed in the frequency domain or time domain as required. When appropriate, instrumentation calibration was traceable to the National Institute for Standards Technology (NIST).
2.4 Test/Evaluation Process2.4.1 Preamplifier TestingTesting of the preamplifiers, serial numbers G20307 and G20311, were performed during March-April 2015, at the Sandia National Laboratories Facility for Acceptance, Calibration and Testing (FACT) Site, Albuquerque, NM.
2.4.2 General Preamplifier Performance TestsThe tests that were conducted on the Guralp Systems GS21 Preamplifier were based on digitizer tests described in the test plan: Test Definition and Test Procedures for the Evaluation of Digitizing Waveform Recorders (Kromer, 2007).
The tests selected provide a high level of characterization for IMS when evaluating digitizers and preamplifiers for seismic or acoustic applications.
Preamplifier Configuration
Static Performance TestsPreamplifiers DC Gain Factor (PA-DCGF)Preamplifier Input Terminated Noise (PA-ITN)Maximum Potential Dynamic Range (PA-MPDR)
Tonal Dynamic Performance TestsPreamplifier AC Gain Factor (PA-ACGF)Preamplifier Relative Total Harmonic Distortion (PA-RTHD)

14
Broadband Dynamic Performance TestsPreamplifier Analog Bandwidth (PA-ABW)Preamplifier Relative Transfer Function (PA-RTF)
Application TestsPreamplifier Seismic System Noise (PA-SSN)Preamplifier Bandwidth Limited Dynamic Range (PA-BLDR)
2.5 Test Configuration and System Specifications2.5.1 Preamplifier Description and Test ConfigurationThe GS21 preamplifiers under evaluation were manufactured by Guralp Systems, Inc. The two preamplifiers were designed to accept a differential input from a GS21 seismometer and provide a differential output with a gain of 61.39x. The preamplifiers were also designed to allow for pass-through the calibration signal from the digitizer to the sensor.
Since the Geotech GS21 seismometer is a short-period instrument, this evaluation will focus on the IMS short period pass-band of 0.5 to 16 Hz.
Custom test cables were built to allow the preamplifiers to interface with the FACT site testbed equipment. Two methods were used to collect test data. The Agilent 3458A multimeter provided a calibrated voltage reference for tests that did not require the data to be GPS time stamped. The Guralp CMG-DM24S3AM serial number 2187 was used for tests that did require the data to be GPS time stamped or time synchronized.
Guralp Systems provided notes on the preamplifier:
Output connector pinout (26-way mil plug)
Input connector pinout (26 way mil socket)
Input impedance of the amplifier is 2 meg Ohm
Input voltage range +/- 0.3 Volts
The input and output connector pin outs are shown in tables below.
Table 2 Preamplifier sensor connector pin outs provide by Guralp Systems26-pin mil-spec socket MIL-DTL-26482 DescriptionC INPUT-D GNDN CAL+U INPUT+V GNDZ CAL-
15
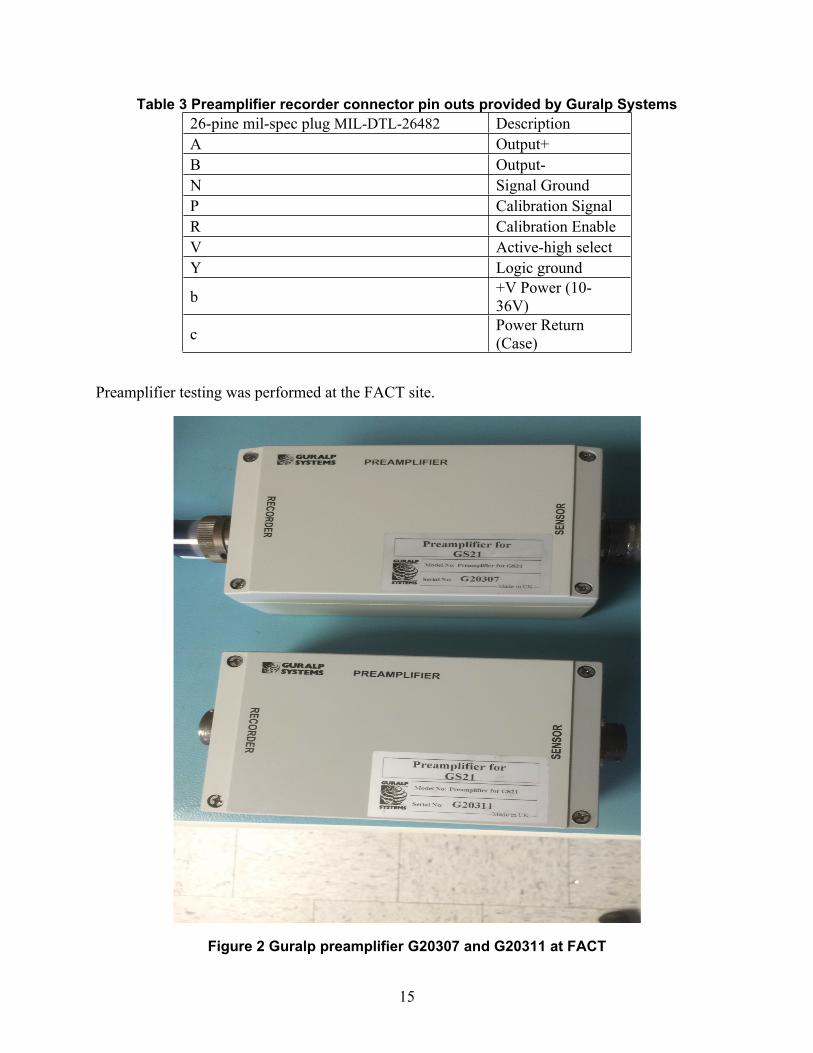
Table 3 Preamplifier recorder connector pin outs provided by Guralp Systems26-pine mil-spec plug MIL-DTL-26482 DescriptionA Output+B Output-N Signal GroundP Calibration SignalR Calibration EnableV Active-high selectY Logic ground
b +V Power (10-36V)
c Power Return (Case)
Preamplifier testing was performed at the FACT site.
Figure 2 Guralp preamplifier G20307 and G20311 at FACT

16
2.6 Test Configuration and System SpecificationsThe general test configuration was setup consistent with the diagram below. A specific configuration diagram is provided to document each test that is performed.
Guralp GS21 Preamplifier
Guralp CMG DM2453AM (A2187)
Channel 2
Channel 1
SRS DS360
Quanterra Supertonal
Precision DC Source
Agilent 3458A Meter
Figure 3 Test Configuration Diagram
Figure 4 Test Setup

17
2.6.1 PowerThe digitizer within the testbed was powered off of precision laboratory power supplies configured for 12 Volts.
Figure 5 Lab Power Supplies
For the evaluation of the GS21 Preamplifier power consumption, the digitizer and preamplifier were powered independently from their own power supplies. For the remainder of the evaluation, the preamplifier was powered directly from the digitizer.
2.6.2 Data RecordingThe data used in this test were recorded on either an Agilent 3458A meter with a current NIST calibration from Sandia’s Primary Standards Laboratory or a Guralp CMG-DM24S3AM #2187 that was evaluated against the same Agilent meter for this test.
Figure 6 Agilent 3458A Serial #MY45048371
The Guralp digitizer is configured with a nominal bitweight of 2.86 uV/count with a 48 V peak-to-peak input range. The digitizer was configured to record each channel of data at both 40 and 80 Hz. The 80 Hz rate data is used to more fully capture the pass band of the preamplifier and the 40 Hz rate data is representative of the intended IMS use.

18
Figure 7 CMD-DM24S3AM Serial #2187
The digitizer bitweights were verified prior to testing using a precision DC source that was verified against an Agilent 3458A that has been calibrated by the SNL Primary Standards Lab to provide traceability. The measured bitweights, shown in the digitizer configuration tables below, were used for all collected sensor data. In addition, the digitizer input channels were evaluated separately from the amplifier evaluations in order to confirm their performance. Details on the digitizer input channel performance is presented along-side the evaluations of the amplifier for reference.
Table 4 Guralp CMG-DM24S3AM BitweightsChannel Name BitweightChannel 1 (Z) 2.8684 uV/countChannel 2 (N) 2.86815 uV/count
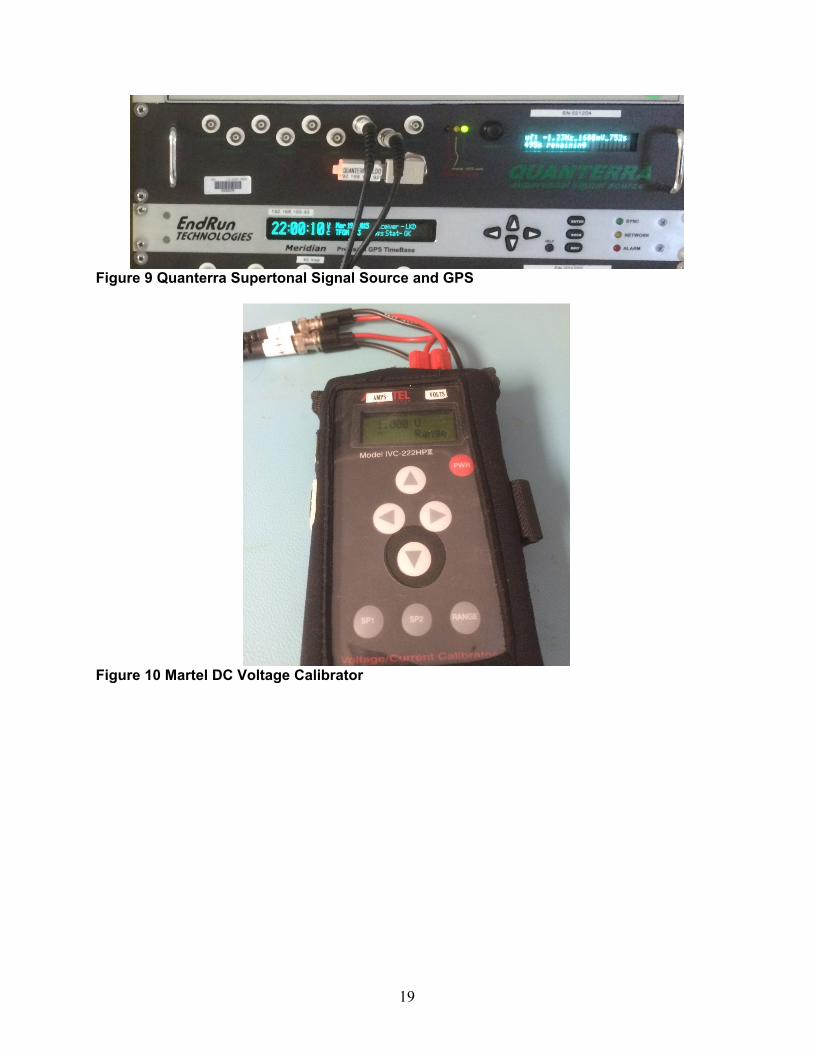
2.6.3 Signal GenerationThe test signals were generated either from a Stanford Research Systems DS360 Ultra Low Distortion Oscillator, a Quanterra Supertonal Signal Source, or a precision DC voltage calibrator.
Figure 8 Stanford Research Systems DS360 Ultra Low Distortion Oscillator
19
Figure 9 Quanterra Supertonal Signal Source and GPS
Figure 10 Martel DC Voltage Calibrator

20
2.6.4 Ambient Conditions
Testing of the Guralp GS21 Preamplifiers was conducted at Sandia National Laboratories Facility for Acceptance, Calibration and Testing (FACT) Site in Albuquerque, NM. The FACT site is at approximately 1830 meters in elevation. Testing was performed at an electronics laboratory at the FACT site in which the ambient temperature was kept at approximately 20 degrees Celsius.

21
3 EVALUATION
3.1 Power ConsumptionTest description: Measure power consumption of the preamplifier. The preamplifier was powered independently on its own lab power supply while connected to the digitizer. Power consumption was recorded with the preamplifiers input terminated with a 467 ohm resistor and while actively driven with a 1 Hz, 0.1 V sinusoid from the SRS DS360.
Figure 11 Power Consumption Evaluation
The preamplifiers were measured to have the power consumption in the table below using the lab power supplies:
Sensor Power Supply Voltage
Current Power Consumption
G20307 (idle) 12.0 V 82 mA 984 mWG20307 (active) 12.0 V 83 mA 996 mWG20311 (idle) 12.0 V 80 mA 960 mWG20311 (active) 12.0 V 81 mA 972 mW
Figure 12 Guralp GS21 Preamplifier Power Consumption
The observed power consumption of the Guralp GS21 Preamplifier was between 960 and 996 mW at 12.0 V.

22
3.2 Input ImpedanceTest Description: The purpose of the input impedance test is to measure the impedance of the Guralp GS21 Preamplifier sensor input lines. Input impedance was measured using a hand-held Fluke multimeter while the preamplifiers were powered by the digitizer.
Figure 13 G20307 Input Impedance
Figure 14 G20311 Input Impedance

23
Table 5 Guralp GS21 Preamplifier Input ImpedanceSensor Input Impedance
G20307 1.468 MohmG20311 1.620 Mohm
3.3 Input Terminated NoiseTest Description: The purpose of the input terminated noise test isolation noise test is to evaluate the noise present in the output of the preamplifier without a driven input signal.
The preamplifier input is terminated with a resistor of the approximate output impedance of the application seismometer. Since the application is for GS21 seismometer, we used a 467 ohm resistor that matches the nominal coil impedance of the GS21.
The output of the resistor terminated preamplifier was recorded by digitizer channel 1 (Z). The digitizer channel 2 (N) was also terminated with common resistors for reference. Over 12 hours of input terminated data were collected for each terminated noise test of the preamplifiers.
Guralp GS21 Preamplifier
Guralp CMG DM2453AM (A2187)
Channel 2 (N)
Channel 1(Z)
467 ohm terminator
467 ohm terminator
Figure 15 Preamplifier Input Terminated Noise Configuration Diagram
24
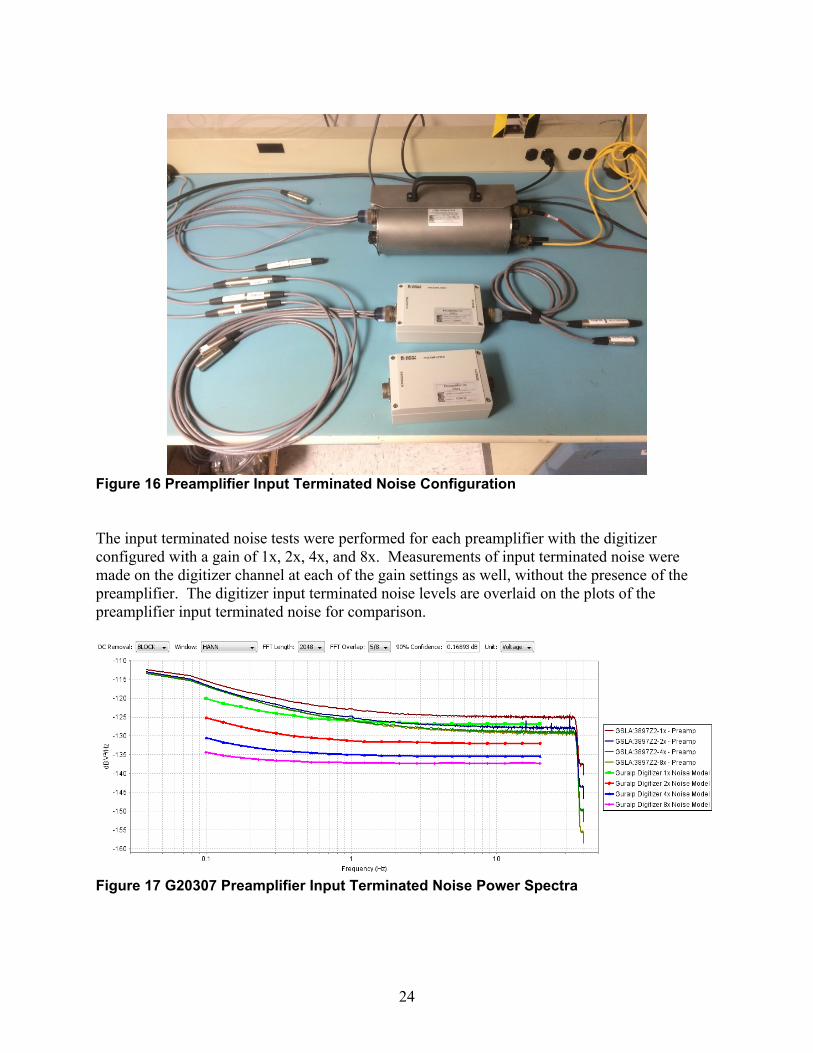
Figure 16 Preamplifier Input Terminated Noise Configuration
The input terminated noise tests were performed for each preamplifier with the digitizer configured with a gain of 1x, 2x, 4x, and 8x. Measurements of input terminated noise were made on the digitizer channel at each of the gain settings as well, without the presence of the preamplifier. The digitizer input terminated noise levels are overlaid on the plots of the preamplifier input terminated noise for comparison.
Figure 17 G20307 Preamplifier Input Terminated Noise Power Spectra

25
Figure 18 G20311 Preamplifier Input Terminated Noise Power Spectra
We observe that at a digitizer gain of 1x, the input terminated noise of the digitizer and preamplifier are very close to each other. In fact, due to the noise power of the digitizer and preamplifier being additive, the observed noise in the preamplifier at a digitizer gain of 1x is greater than the intrinsic preamplifier noise. At a digitizer gain of 2x, the digitizer is able to better resolve just the preamplifier noise with as much as a 2.5 dB reduction in system noise. At 4x gain, the digitizer appears able to resolve just the preamplifier noise level. At 8x gain, there is minimal improvement in the noise floor suggesting that the observed noise is due solely to the preamplifier.
The preamplifier could be operated with a digitizer gain of between 1x and 4x depending upon the requirements for noise level and dynamic range. Gain levels beyond 4x will only serve to reduce dynamic range without any significant improvement in noise level.
Measurements of the RMS noise level across 0.5 to 16 Hz were calculated for the power spectra at each gain level for the two preamplifiers.
1x Gain 2x Gain 4x Gain 8x GainG20307 2.28062 uV rms 1.71114 uV rms 1.52518 uV rms 1.47571 uV rmsG20311 2.27935 uV rms 1.66947 uV rms 1.49986 uV rms 1.44004 uV rms
Figure 19 Preamplifier Input Terminated RMS Noise
Note that this analysis uses the digitizer bit weight for channel 1 and so does not take into account the gain of the preamplifier, which would serve to reduce the noise level in volts by a factor equal to the preamplifiers gain (61.39x or 35.76 dB). The reported terminated noise values should be interpreted as being voltage amplitudes on the output of the preamplifier.

26
3.4 AC ClipTest Description: The purpose of the ac clip test is to evaluate the voltage at which the preamplifier’s output will clip.
Prior to this evaluation, the clip levels of channels 1 and 2 of the Guralp digitizer were evaluated with a 30 V peak input sinusoid whose amplitude was verified on the Agilent meter:
Figure 20 Guralp Digitizer Clip
Table 6 Guralp Digitizer Clip LevelsWaveform Positive
meanNegative mean
Agilent 3458 MY45048371
29.73054 V -29.72299 V
GSLA:3897N4 24.06165 V -23.84857 VGSLA:3897Z4 24.06373 V -23.85059 V
The Guralp digitizer was verified to have a maximum input voltage of +/- 24 Vp (48 Vpp). Based upon this determination, the test bed configuration was modified to record the output of the preamplifier on both the Guralp digitizer and the reference Agilent 3458A meter. This would
27
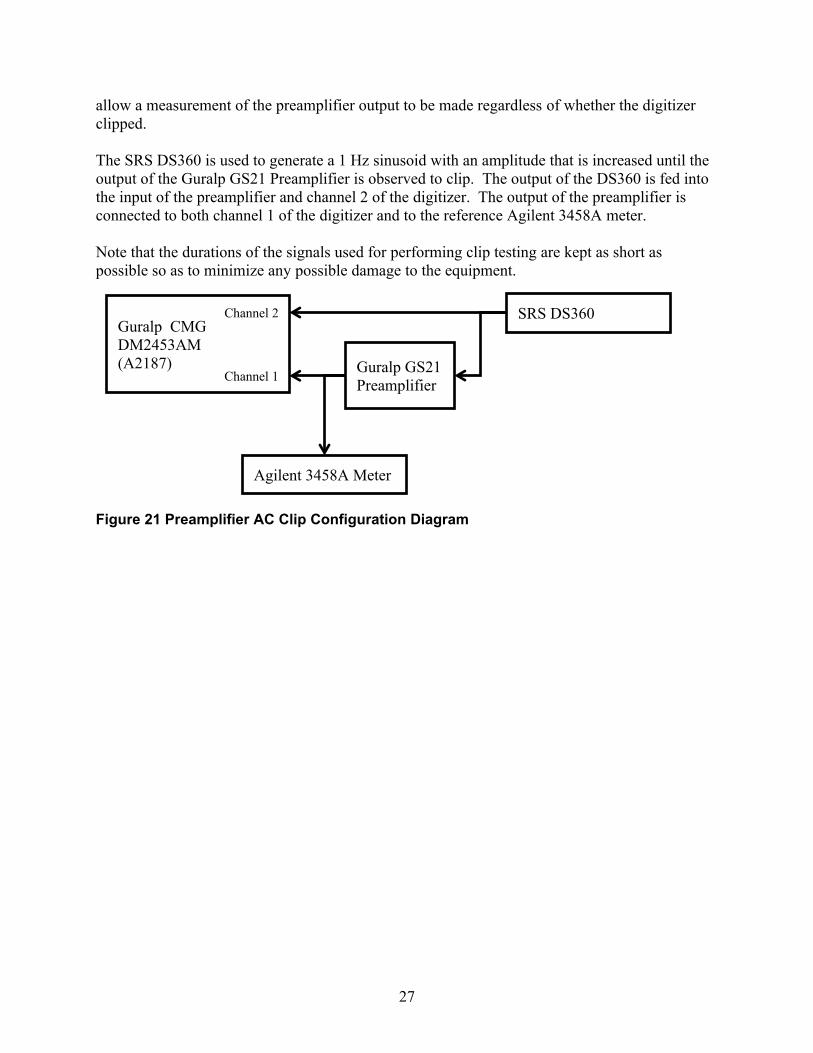
allow a measurement of the preamplifier output to be made regardless of whether the digitizer clipped.
The SRS DS360 is used to generate a 1 Hz sinusoid with an amplitude that is increased until the output of the Guralp GS21 Preamplifier is observed to clip. The output of the DS360 is fed into the input of the preamplifier and channel 2 of the digitizer. The output of the preamplifier is connected to both channel 1 of the digitizer and to the reference Agilent 3458A meter.
Note that the durations of the signals used for performing clip testing are kept as short as possible so as to minimize any possible damage to the equipment.
Guralp GS21 Preamplifier
Guralp CMG DM2453AM (A2187)
Channel 2
Channel 1
SRS DS360
Agilent 3458A Meter
Figure 21 Preamplifier AC Clip Configuration Diagram

28
Figure 22 Preamplifier AC Clip Configuration
Clipping of the preamplifier output was observed with an input of a 1.0 Hz, 0.4 V sinusoid.
Figure 23 G20307 Clip Waveforms

29
Table 7 G20307 Clip LevelsWaveform Positive NegativeAgilent 3458 MY45048371 22.64714 V -21.78202 VGSLA:3897N4 0.35749 V -0.43577 VGSLA:3897Z4 22.66293 V -21.795 V
Figure 24 G20311 Clip Waveforms
Table 8 G20311 Clip LevelsWaveform Positive NegativeAgilent 3458 MY45048371 22.35357 V -21.65059 VGSLA:3897N4 0.35748 V -0.43577 VGSLA:3897Z4 22.60836 V -21.68021 V
Based upon the measurements made on the reference meter, the preamplifier outputs were observed to clip at the following levels:
Table 9 Preamplifier Clip LevelsPositive clip Negative clip Range (peak-peak)
G20307 22.64714 V -21.78202 V 44.4292 VG20311 22.35357 V -21.65059 V 44.0042 V
Based upon these results, the preamplifier clip levels appears to be well matched to the Guralp CMG-DM24’s clip level so as to maximize the available dynamic range.

30
3.5 Dynamic RangeTest Description: The purpose of the dynamic range test is to determine the ratio between the largest and smallest possible signals that may be observed on the sensor. SNL defines dynamic range as the ratio between the RMS of a full-scale sinusoid at the calibration frequency, typically 1 Hz, and the RMS noise present in the self-noise across the application pass band, in this case 0.5 to 16 Hz.
The full scale values at a gain of 1x were obtained from the observed clip level of the preamplifier output. The full scale values at gain setting of 2x, 4x, and 8x were obtained from the theoretical 48 V full scale of the Guralp digitizer scaled by the gain setting.
Using the self-noise estimates obtained from section 3.3 Input Terminated Noise, which are believed to be the best estimate of self-noise available, the preamplifier dynamic ranges are:
Table 10 Preamplifier G20307 Dynamic RangeFull Scale (peak-peak) Noise Dynamic Range
1x Gain 44.4292 V 2.28062 uV rms 136.76 dB2x Gain 24 V 1.71114 uV rms 133.91 dB4x Gain 12 V 1.52518 uV rms 128.89 dB8x Gain 6 V 1.47571 uV rms 123.15 dB
Table 10 Preamplifier G20311 Dynamic RangeFull Scale (peak-peak) Noise Dynamic Range
1x Gain 44.0042 V 2.27935 uV rms 136.68 dB2x Gain 24 V 1.66947 uV rms 134.12 dB4x Gain 12 V 1.49986 uV rms 129.03 dB8x Gain 6 V 1.44004 uV rms 123.36 dB
Both the G20307 and G20311 preamplifiers have a measured dynamic range in excess of 136 dB at a gain of 1x. In the quietest configuration of the preamplifier and digitizer at a gain setting of 8x, the combination still has a dynamic range better than 123 dB.

31
3.6 Seismic System NoiseTest Description: The purpose of the seismic system noise to evaluate the noise present in the output of the preamplifier without a driven input signal, shaped by the intended seismometer response.
We treat the preamplifier as if it was part of the digitizer input channel, and use the data obtained from section 3.3 Input Terminated Noise shaped by the GS21 response. The bitweight of the digitizer channel recording the preamplifier is adjusted to reflect the 61.39x gain. The response model of the GS21 is applied to shape the noise spectra and the compared to the Low Noise Model and the Geotech GS21 noise model in the plots below.
The terminated noise data from each of the 1x, 2x, 4x, and 8x gain levels are shown below scaled by the GS21 response with and without the Guralp preamplifier.
Figure 25 G20307 Preamplifier Seismic System Noise Power Spectra
Figure 26 G20311 Preamplifier Seismic System Noise Power Spectra

32
We observe that introducing the preamplifier greatly decreases the ground motion equivalent noise due to the digitizer and preamplifier as compared to using a GS21 without a preamplifier. The seismic system noise of both preamplifiers, when paired with a Guralp CMG-DM24S3AM with a bitweight 2.86 uV/count, is entirely below the seismic low noise model over 0.5 to 16 Hz. Even with the digitizer gain at 4x or 8x, which minimizes total system noise, the noise is not entirely below the Geotech GS21 noise mode. Increasing the digitizer gain further will not result in any additional reduction in the equivalent seismic system noise.

33
3.7 DC AccuracyTest description: The purpose of the DC Accuracy test is to evaluate the gain of the preamplifier for a constant DC voltage.
A precision DC calibration voltage source is used to generate a positive and negative DC voltage. The output of the DC voltage source is fed into the input of the preamplifier, channel 2 of the digitizer, and a reference Agilent 3458A meter. The output of the preamplifier is connected to channel 1 of the digitizer. The resulting amplitudes from the output of the preamplifier will then be compared to the reference meter. The preamplifier gains levels are evaluated at two DC voltage levels: 0.01V and 0.1V.
Guralp GS21 Preamplifier
Guralp CMG DM2453AM (A2187)
Channel 2
Channel 1
Precision DC Source
Agilent 3458A Meter
Figure 27 Preamplifier DC Accuracy Configuration Diagram

34
Figure 28 Preamplifier DC Accuracy Configuration
Figure 29 DC Accuracy Waveform

35
Table 12 DC Accuracy ResultsInput Range Output Range Gain Percent Difference
(from 61.39)G20307 (0.01 V) 19.65258 mV 1.204390 V 61.2841 0.1725 %G20307 (0.1 V) 0.20018 V 12.26631 V 61.2764 0.1850 %G20311 (0.01 V) 19.65342 mV 1.205490 V 61.3374 0.0857 %G20311 (0.1 V) 0.20017 V 12.27462 V 61.3210 0.1124 %
G20307 was observed to have a DC gain of approximately 61.28 and G20311 was observed to have a DC gain of 61.33. The preamplifiers deviated from their nominal gain of 61.39 by less than 0.2%.
36
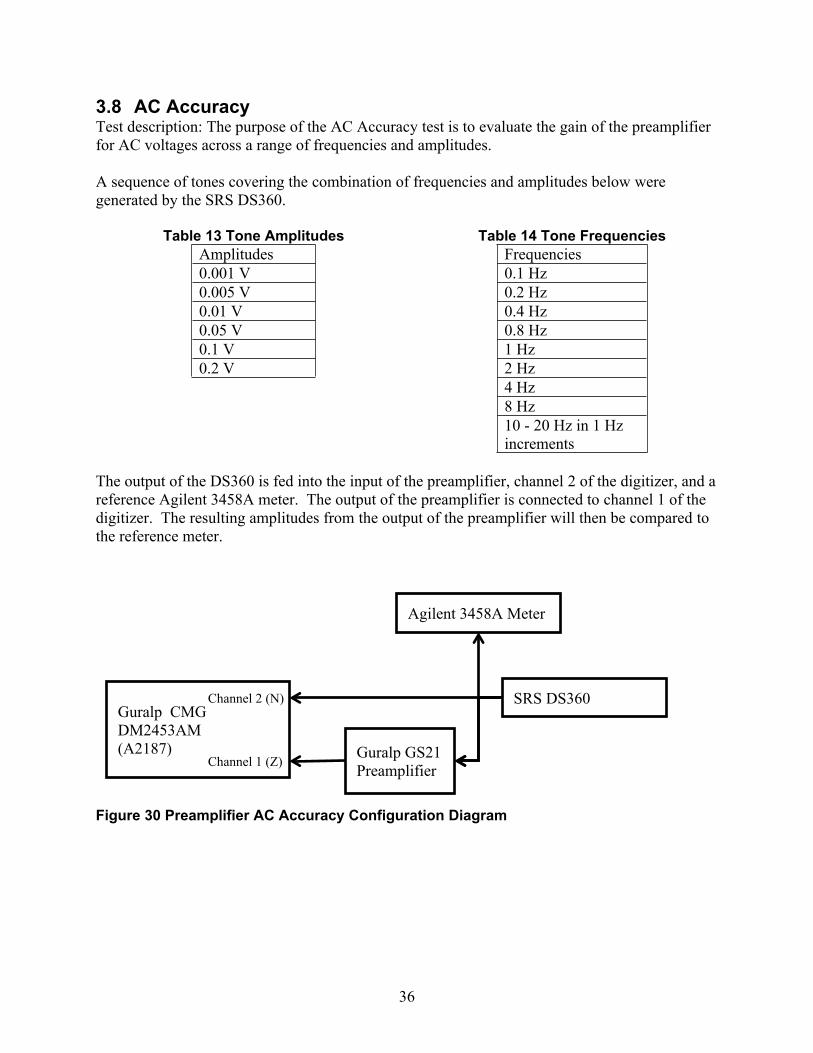
3.8 AC AccuracyTest description: The purpose of the AC Accuracy test is to evaluate the gain of the preamplifier for AC voltages across a range of frequencies and amplitudes.
A sequence of tones covering the combination of frequencies and amplitudes below were generated by the SRS DS360.
Table 13 Tone AmplitudesAmplitudes 0.001 V0.005 V0.01 V0.05 V0.1 V0.2 V
Table 14 Tone FrequenciesFrequencies0.1 Hz0.2 Hz0.4 Hz0.8 Hz1 Hz2 Hz4 Hz8 Hz10 - 20 Hz in 1 Hz increments
The output of the DS360 is fed into the input of the preamplifier, channel 2 of the digitizer, and a reference Agilent 3458A meter. The output of the preamplifier is connected to channel 1 of the digitizer. The resulting amplitudes from the output of the preamplifier will then be compared to the reference meter.
Guralp GS21 Preamplifier
Guralp CMG DM2453AM (A2187)
Channel 2 (N)
Channel 1 (Z)
SRS DS360
Agilent 3458A Meter
Figure 30 Preamplifier AC Accuracy Configuration Diagram

37
Figure 31 Preamplifier AC Accuracy Configuration
Although the Agilent 3458A meter was used to acquire a reference measurement, comparison of the input and output amplitudes of the preamplifiers was performed using the data collected on the two channels of the Guralp digitizer. This was done so that both measurements of input and output would have the same roll-off characteristics versus frequency. Any digitizer roll-off present in the Guralp will cancel out when the ratios between input and output amplitudes are computed to get the preamplifier gain.
Figure 32 AC Accuracy Tone Time Series for 0.1 V and a sweep of frequencies
The observed gain between the output and input of the preamplifiers are shown in the tables below. No processing of the waveform time series was required to obtain stable sine fits.

38
Table 15 G20307 AC Accuracy gain levelsInput Amplitude
Frequency 0.001 V 0.005 V 0.01 V 0.05 V 0.1 V 0.2 V
0.1 Hz 61.26568 61.27510 61.27757 61.27660 61.27620 61.275930.2 Hz 61.26129 61.27610 61.27576 61.27616 61.27616 61.275810.4 Hz 61.27944 61.27737 61.27692 61.27665 61.27610 61.275780.8 Hz 61.27977 61.27646 61.27503 61.27611 61.27634 61.275771 Hz 61.28315 61.27318 61.27740 61.27608 61.27612 61.275742 Hz 61.28288 61.27905 61.27541 61.27593 61.27584 61.275644 Hz 61.27629 61.27043 61.27466 61.27492 61.27576 61.275378 Hz 61.31566 61.26819 61.27634 61.27434 61.27455 61.2741410 Hz 61.28165 61.27459 61.27829 61.27389 61.27414 61.2730611 Hz 61.22394 61.26168 61.27299 61.27356 61.27290 61.2727212 Hz 61.26107 61.27151 61.27273 61.27278 61.27286 61.2722013 Hz 61.28061 61.26639 61.26643 61.27194 61.27229 61.2715014 Hz 61.27990 61.25944 61.27491 61.27180 61.27144 61.2706615 Hz 61.30712 61.26651 61.26763 61.27056 61.27052 61.2699816 Hz 61.24318 61.25983 61.27087 61.26979 61.26911 61.2692717 Hz 61.32906 61.28362 61.26507 61.26993 61.26816 61.2681418 Hz 61.24555 61.25975 61.26695 61.26789 61.26782 61.2675619 Hz 61.24425 61.26121 61.26731 61.26734 61.26608 61.2668420 Hz 61.25588 61.23681 61.27042 61.26505 61.26698 61.26577
Figure 33 G20307 AC Accuracy gain levels
39
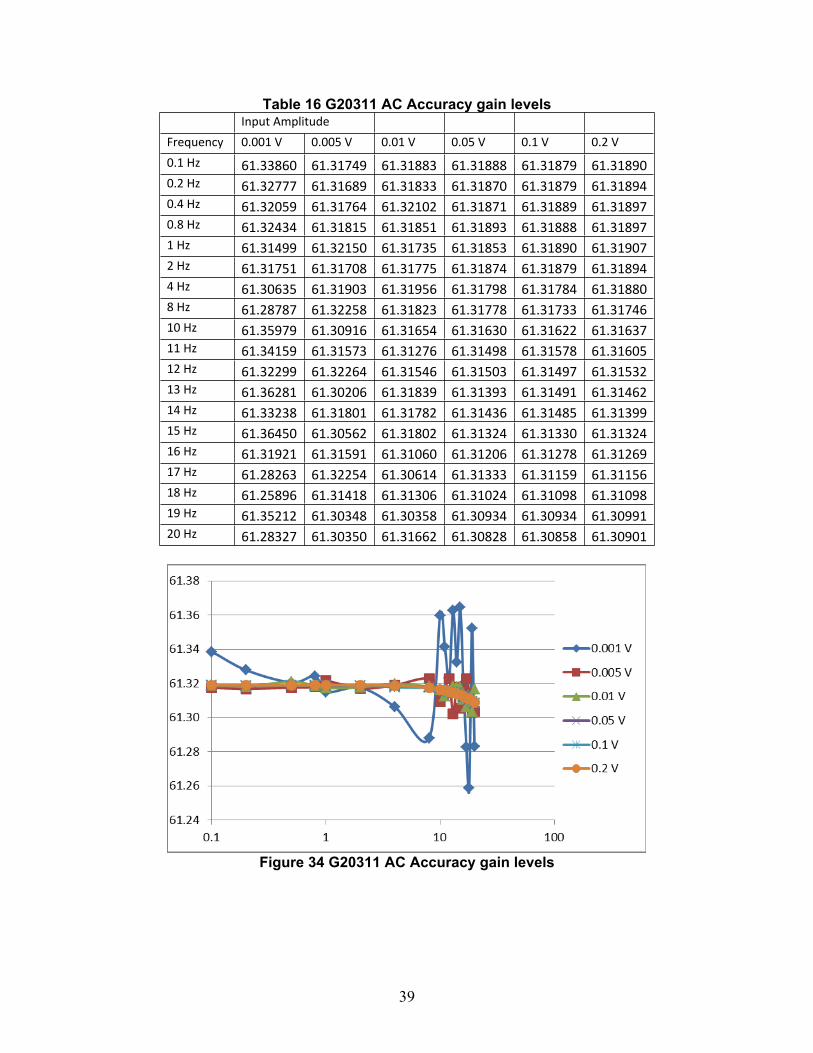
Table 16 G20311 AC Accuracy gain levelsInput Amplitude
Frequency 0.001 V 0.005 V 0.01 V 0.05 V 0.1 V 0.2 V0.1 Hz 61.33860 61.31749 61.31883 61.31888 61.31879 61.318900.2 Hz 61.32777 61.31689 61.31833 61.31870 61.31879 61.318940.4 Hz 61.32059 61.31764 61.32102 61.31871 61.31889 61.318970.8 Hz 61.32434 61.31815 61.31851 61.31893 61.31888 61.318971 Hz 61.31499 61.32150 61.31735 61.31853 61.31890 61.319072 Hz 61.31751 61.31708 61.31775 61.31874 61.31879 61.318944 Hz 61.30635 61.31903 61.31956 61.31798 61.31784 61.318808 Hz 61.28787 61.32258 61.31823 61.31778 61.31733 61.3174610 Hz 61.35979 61.30916 61.31654 61.31630 61.31622 61.3163711 Hz 61.34159 61.31573 61.31276 61.31498 61.31578 61.3160512 Hz 61.32299 61.32264 61.31546 61.31503 61.31497 61.3153213 Hz 61.36281 61.30206 61.31839 61.31393 61.31491 61.3146214 Hz 61.33238 61.31801 61.31782 61.31436 61.31485 61.3139915 Hz 61.36450 61.30562 61.31802 61.31324 61.31330 61.3132416 Hz 61.31921 61.31591 61.31060 61.31206 61.31278 61.3126917 Hz 61.28263 61.32254 61.30614 61.31333 61.31159 61.3115618 Hz 61.25896 61.31418 61.31306 61.31024 61.31098 61.3109819 Hz 61.35212 61.30348 61.30358 61.30934 61.30934 61.3099120 Hz 61.28327 61.30350 61.31662 61.30828 61.30858 61.30901
Figure 34 G20311 AC Accuracy gain levels

40
The gain in both preamplifiers is very consistent across the input amplitude range of the preamplifier. There is a greater distribution of gain values at low input amplitudes, likely due to a lower signal-to-noise ratio reducing the accuracy of the sine-fit. A very slight decrease in gain is observed with increasing frequency.
Table 17 Preamplifier AC gainAverage Gain at 1 Hz Difference between 1
Hz average and nominal gain of 61.39
Difference between 1 Hz average and gain at 16 Hz and 0.2 V
G20307 61.277 0.18 % (0.008 dB) -0.0126 % ( -0.00055 dB)G20311 61.318 0.12 % (0.005 dB) -0.0147 % ( -0.00064 dB)
G20307 and G20311 were observed to have gains of 61.277 and 61.318, respectively, at 1 Hz. The preamplifiers deviated from their nominal gain of 61.39 by less than 0.18% (0.008 dB) and 0.12% (0.005 dB), respectively. The preamplifiers exhibited a very small roll-off in gain at higher frequencies for a maximum of -0.0126 % (-0.00055 dB) and -0.0147 % (-0.00064 dB), respectively.

41
3.9 Harmonic DistortionTest description: The purpose of the harmonic distortion test is to verify the linearity of the preamplifier. A Quanterra Supertonal ultra-low-distortion oscillator is used to generate a very pure sinusoid with a frequency of 1.23 Hz and amplitude of 0.2 V. The output of the Quanterra Supertonal is fed into the input of the preamplifier, channel 2 of the digitizer, and a reference Agilent 3458A meter. The output of the preamplifier is connected to channel 1 of the digitizer. The resulting harmonic distortion in the output of the preamplifier will then be compared to the reference meter.
Guralp GS21 Preamplifier
Guralp CMG DM2453AM (A2187)
Channel 2 (N)
Channel 1 (Z)
Quanterra Supertonal(ULDO)
Agilent 3458A Meter
Figure 35 Preamplifier Harmonic Distortion Configuration Diagram
Figure 36 Preamplifier Harmonic Distortion Configuration

42
Prior to evaluating the harmonic distortion of the preamplifier, harmonic distortion tests of both the digitizer channels were performed at 0.2 V and 10 V without the preamplifier. This was done to account for the contributions of the digitizer channel versus the preamplifier to the total amount of measured harmonic distortion.
Figure 37 Guralp Digitizer 0.2 V Harmonic Distortion
Table 18 Guralp Digitizer 0.2 V Harmonic DistortionWaveform Peak Count Peak Frequency Peak RMS Secondary RMS THDAgilent 3458 MY45048371 2 1.23015 Hz 0.13976 V rms 23.42435 nV rms -135.51456 dBGSLA:3897N4 2 1.23014 Hz 0.13993 V rms 0.14358 uV rms -119.77607 dBGSLA:3897Z4 2 1.23014 Hz 0.13992 V rms 0.15744 uV rms -118.97567 dB
At 0.2 V, there are no visible harmonics in the signal that was generated by the Quanterra Supertonal or the recordings made on channels 1 and 2 of the digitizer. The resulting estimate of harmonic distortion is bounded by the noise floor of each device at the predicted location of the first harmonic. For the Agilent 3458A, this corresponds to better than -135.5 dB. For the digitizer input channels 1 and 2, this corresponds to better than -118.9 and -119.7, respectively.
Figure 38 Guralp Digitizer 10 V Harmonic Distortion
Table 19 Guralp Digitizer 10 V Harmonic DistortionWaveform Peak Count Peak Frequency Peak RMS Secondary RMS THDAgilent 3458 MY45048371 4 1.22995 Hz 6.98851 V rms 0.30333 uV rms -142.35065 dBGSLA:3897N4 6 1.22995 Hz 6.99642 V rms 2.84569 uV rms -125.45763 dBGSLA:3897Z4 5 1.22995 Hz 6.99634 V rms 3.07508 uV rms -125.485 dB

43
At 10.0 V, there are visible harmonics in the signal that was generated by the Quanterra Supertonal and the recordings made on channels 1 and 2 of the digitizer, allowing for a more accurate estimate of harmonic distortion. For the Agilent 3458A reference measurement of the generated sinusoid, harmonic distortion is estimated at better than -142.3 dB. Both digitizer input channels 1 and 2 had measured harmonic distortion better than -125.4 dB. It is also worth pointing out that the Guralp digitizer self-noise levels are greater than the self-noise of the Quanterra ULDO, which is in turn greater than the self-noise of the Agilent 3458A meter.
Knowing the harmonic distortion present in the digitizer input channels at these two signal levels as a baseline, the results of the preamplifier harmonic distortion evaluation may be interpreted.
An ultra-low distortion sinusoid with a frequency of 1.23 Hz and amplitude of 0.2 V is inputted to each of the preamplifiers. With the preamplifiers nominal gain of 61.39, this should result in an output voltage of 12.278 V. This is approximately one-half of the measured full scale of both the preamplifier output and the digitizer channels.
Figure 39 G20307 0.2V Harmonic Distortion
Table 20 G20307 0.2V Harmonic DistortionWaveform Peak Count Peak Frequency Peak RMS Secondary RMS THDAgilent 3458 MY45048371 2 1.22995 Hz 0.13988 V rms 27.84865 nV rms -134.01885 dBGSLA:3897N4 - Digitizer 4 1.22995 Hz 0.14003 V rms 0.26206 uV rms -111.46205 dBGSLA:3897Z4 - Preamp 5 1.22995 Hz 8.58036 V rms 2.26634 uV rms -126.66074 dB
At 0.2 V input to the G20307 (~ 12 V output), there were visible harmonics on the output of the preamplifier. The harmonic distortion is estimated to be -126.7 dB, which was approximately equal to the earlier evaluation of this digitizer channel at 10 V of -125.4 dB.
It is likely the harmonic distortion using the preamplifier appears improved because fewer harmonics were able to be identified because of the elevated baseline noise in the output of the preamplifier as compared to the digitizer. Note that this elevated baseline noise is not the self-noise of preamplifier output, it is the self-noise of the Quanterra ULDO that has been amplified 61.39x (35.76 dB) by the preamplifier.
The harmonic distortion of the G20307 appears to be better than the Guralp digitizer.

44
Figure 40 G20311 0.2V Harmonic Distortion
Table 21 G20311 0.2V Harmonic DistortionWaveform Peak Count Peak Frequency Peak RMS Secondary RMS THDAgilent 3458 MY45048371 2 1.22995 Hz 0.13988 V rms 26.58984 nV rms -134.42058 dBGSLA:3897N4 - Digitizer 3 1.22995 Hz 0.14003 V rms 0.18339 uV rms -113.5176 dBGSLA:3897Z4 - Preamp 6 1.22995 Hz 8.5864 V rms 6.14458 uV rms -120.91495 dB
At 0.2 V input to the G20311 (~ 12 V output), there were visible harmonics on the output of the preamplifier. The harmonic distortion is estimated to be -120.9 dB, which is greater than the earlier evaluation of this digitizer channel at 10 V of -125.4 dB.

45
3.10Time Tag Test description: The purpose of the Time Tag test is to evaluate the accuracy of the digitizer time tag characteristics using a synchronous timing signal. Analysis of the recorded signal is able to identify the time difference between an observed signal transition and the digitizer time tag. For the purpose of evaluating the preamplifier, the time tag test will serve to identify any timing delay introduced by the preamplifier.
Prior to testing either of the preamplifiers, a test was run on just the two digitizers channels in which a 1 pulse-per-minute (PPM) timing signal was used to evaluate the channels. Verifying that the two channels have consistent timing accuracy will establish confidence when comparing the timing results from the preamplifier with the other digitizer channel. This estimate of time tag error was made using the same attenuator as was used in the evaluation of the preamplifier.
The measured timing accuracy of the digitizer channels, averaged over 30 minutes, is as follows:
Table 21 Guralp Digitizer Time Tag AccuracyTiming Accuracy
Channel 1 5.62 microsecondsChannel 2 6.09 microseconds
Both of the Guralp digitizer channels have similar timing results with less than 0.5 microseconds of timing skew between them.
A 1 PPM synchronous signal was generated using the Quanterra ULDO. An attenuator was used in order to keep the 5 V PPM signal from clipping the preamplifier. The output of the Quanterra ULDO is fed into the input of the preamplifier and channel 2 of the digitizer. The output of the preamplifier is connected to channel 1 of the digitizer. The resulting recorded signals will then be compared to each other to determine the characteristics of the preamplifier.
Guralp GS21 Preamplifier
Guralp CMG DM2453AM (A2187)
Channel 2 (N)
Channel 1 (Z)
Quanterra Supertonal(ULDO)
12xAtten
Figure 41 Preamplifier Time Tag Configuration Diagram

46
Figure 42 Preamplifier Time Tag Configuration
The measured timing accuracy of the preamplifier and digitizer channels, for each preamplifier averaged over 30 minutes, are as follows:
Table 21 Preamplifier Timing AccuracyChannel 1 (preamplifier) Channel 2 (digitizer)
G20307 -185.9 microseconds -16.5 microsecondsG20311 -191.9 microseconds -15.4 microseconds
The difference between the observed timing error on the preamplifier and just the digitizer channel is 169.4 and 176.5 microseconds for G20307 and G20311, respectively.
47
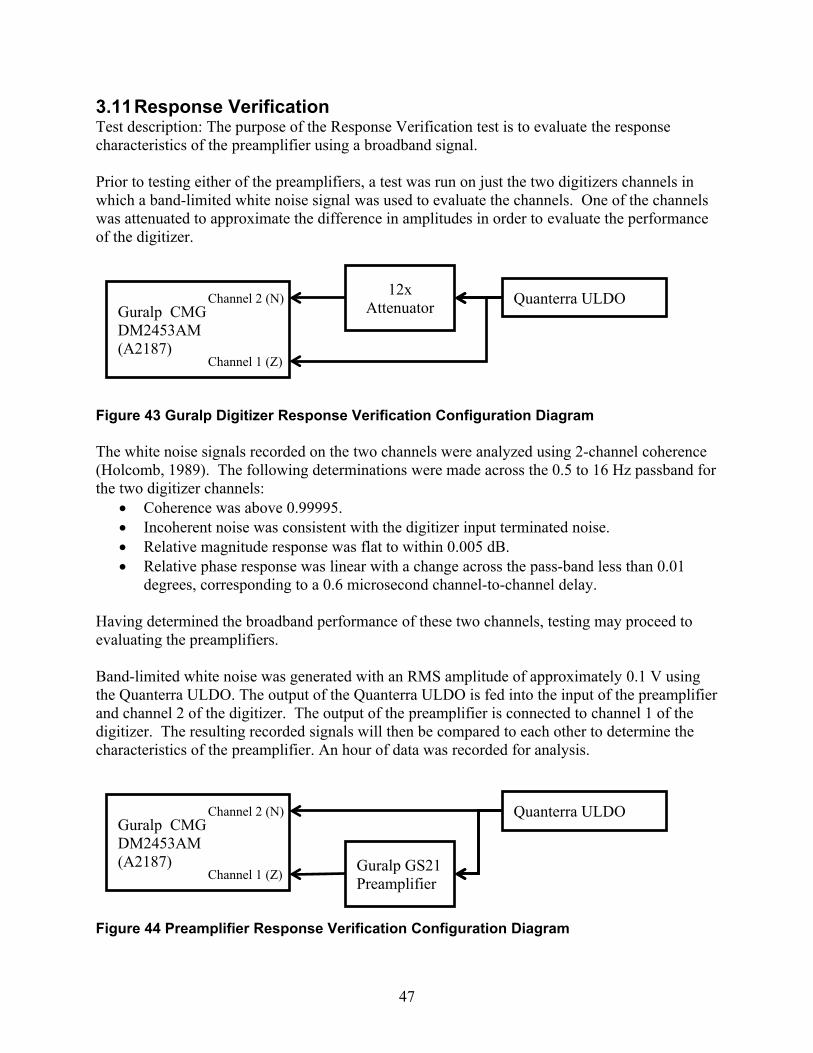
3.11Response VerificationTest description: The purpose of the Response Verification test is to evaluate the response characteristics of the preamplifier using a broadband signal.
Prior to testing either of the preamplifiers, a test was run on just the two digitizers channels in which a band-limited white noise signal was used to evaluate the channels. One of the channels was attenuated to approximate the difference in amplitudes in order to evaluate the performance of the digitizer.
12x AttenuatorGuralp CMG
DM2453AM (A2187)
Channel 2 (N)
Channel 1 (Z)
Quanterra ULDO
Figure 43 Guralp Digitizer Response Verification Configuration Diagram
The white noise signals recorded on the two channels were analyzed using 2-channel coherence (Holcomb, 1989). The following determinations were made across the 0.5 to 16 Hz passband for the two digitizer channels:
Coherence was above 0.99995. Incoherent noise was consistent with the digitizer input terminated noise. Relative magnitude response was flat to within 0.005 dB. Relative phase response was linear with a change across the pass-band less than 0.01
degrees, corresponding to a 0.6 microsecond channel-to-channel delay.
Having determined the broadband performance of these two channels, testing may proceed to evaluating the preamplifiers.
Band-limited white noise was generated with an RMS amplitude of approximately 0.1 V using the Quanterra ULDO. The output of the Quanterra ULDO is fed into the input of the preamplifier and channel 2 of the digitizer. The output of the preamplifier is connected to channel 1 of the digitizer. The resulting recorded signals will then be compared to each other to determine the characteristics of the preamplifier. An hour of data was recorded for analysis.
Guralp GS21 Preamplifier
Guralp CMG DM2453AM (A2187)
Channel 2 (N)
Channel 1 (Z)
Quanterra ULDO
Figure 44 Preamplifier Response Verification Configuration Diagram
48
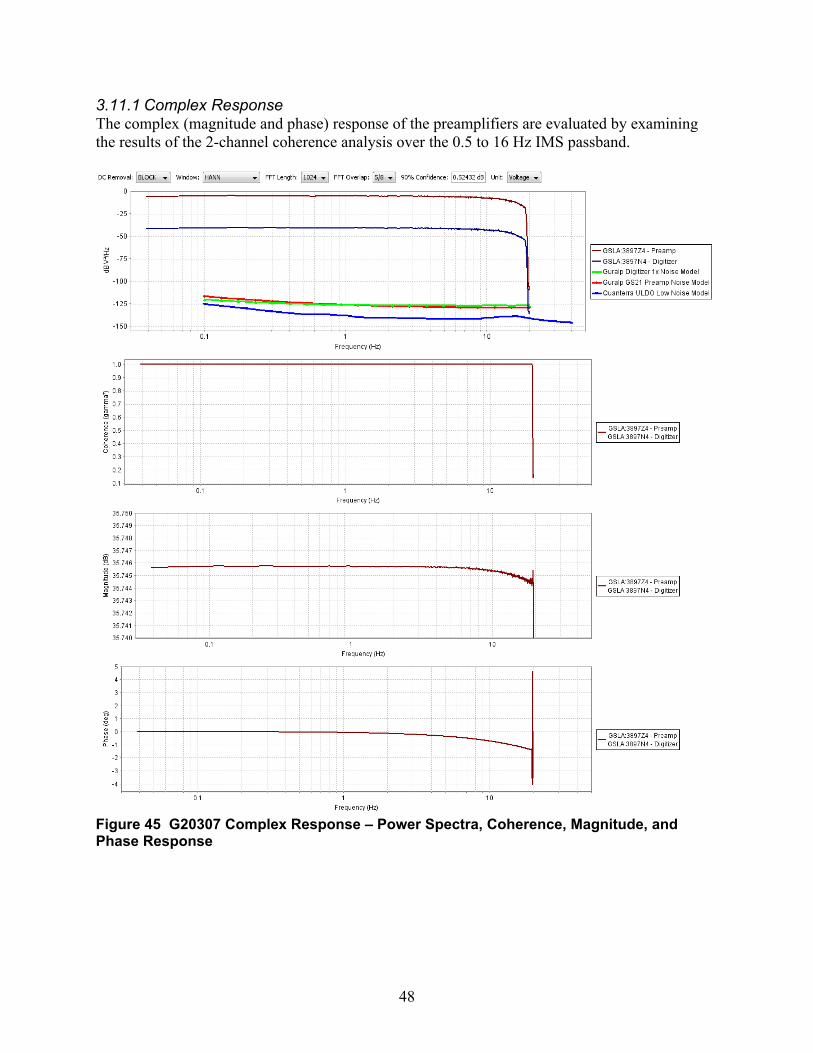
3.11.1 Complex ResponseThe complex (magnitude and phase) response of the preamplifiers are evaluated by examining the results of the 2-channel coherence analysis over the 0.5 to 16 Hz IMS passband.
Figure 45 G20307 Complex Response – Power Spectra, Coherence, Magnitude, and Phase Response

49
Figure 46 G20311 Complex Response – Power Spectra, Coherence, Magnitude, and Phase Response
Table 22 Complex Response Roll-off over 0.5 to 16 HzCoherence Magnitude
ResponsePhase Response
G20307 1.0 -0.001 dB -1.16 degreesG20311 1.0 -0.001 dB -1.15 degrees
Both preamplifiers had near perfect coherence over 0.5 to 16 Hz. Their magnitude and phase response rolled off by less than 0.001 dB and 1.16 degrees, respectively, at 16 Hz. Further analysis of the time delay represented by the phase response is performed in the next section.

50
3.11.2 Time DelayThe phase response of the preamplifiers indicates that there is a slight delay introduced by the presence of the amplifier. The extent to which the phase response is linear indicates that it represents a delay of a constant time value.
Figure 47 G20307 Time Delay
Figure 48 G20311 Time Delay
The time delays computed using a least-squared solution for a linear phase response over the 0.5 to 16 Hz pass-band are shown in the table below.
Table 23 Complex Response Time DelayTime Delay
G20307 200.8 usG20311 200.2 us
Both preamplifiers introduce a time delay of approximately 200 micro-seconds over the application pass-band. The timing skew of digitizer channels 1 and 2 was measured prior to evaluating the preamplifier was determined to be approximately 0.6 microseconds. This indicates that the observed 200 micro-second time delay may be attributed to the preamplifier.
In addition, an earlier time tag test was also performed in which synchronous timing pulses from a GPS receiver were recorded on both digitizer channels.

51
3.11.3 Passband
Evaluating the passband of the Guralp GS21 Preamplifiers will examine the coherence and relative magnitude between the amplified and unamplified channels to examine their corner frequencies. Data was collected at 80 Hz on the Guralp digitizer in order to evaluate outside of the IMS pass-band.
Figure 49 G20307 Passband Coherence and Magnitude Response
Figure 50 G20311 Passband Coherence and Magnitude Response
Both the G20307 and G20311 preamplifiers have a bandwidth that exceeds 0.01 to 20 Hz.
52
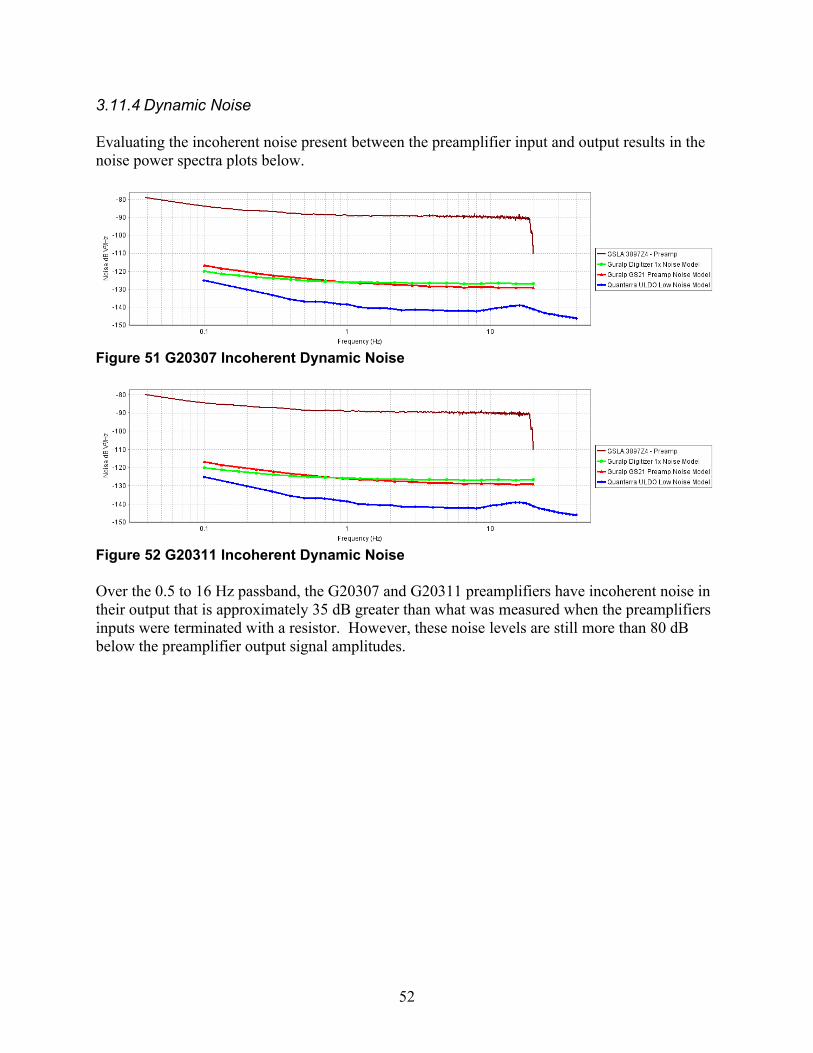
3.11.4 Dynamic Noise
Evaluating the incoherent noise present between the preamplifier input and output results in the noise power spectra plots below.
Figure 51 G20307 Incoherent Dynamic Noise
Figure 52 G20311 Incoherent Dynamic Noise
Over the 0.5 to 16 Hz passband, the G20307 and G20311 preamplifiers have incoherent noise in their output that is approximately 35 dB greater than what was measured when the preamplifiers inputs were terminated with a resistor. However, these noise levels are still more than 80 dB below the preamplifier output signal amplitudes.

53
3.12Calibrator Pass-throughTest description: The purpose of the Calibrator Pass-through test is to validate that the preamplifier is able to pass the calibration signal from the digitizer to the GS21 seismometer.
The digitizer calibrator output is connected to the calibrator input connection on the preamplifier. Note that the calibrator-enable and active-high select lines must also be connected between the digitizer and preamplifier. The input to the preamplifier is split off and recorded on the digitizer channel 2. The preamplifier output of the calibration signal is recorded on digitizer channel 1.
Guralp CMG DM2453AM (A2187)
Channel 2 (N)
Channel 1 (Z)
Calibrator Output Guralp GS21 Preamplifier
Cal In Cal Out
Figure 53 Preamplifier Calibrator Pass-through Configuration Diagram
Figure 54 Preamplifier Calibrator Pass-through Configuration Diagram

54
3.12.1 5 Hz SinusoidIn the first iteration of the Calibrator Pass-through test, a 5 Hz sinusoid was generated from the Guralp digitizer. The waveforms recorded at the output of the digitizer calibrator and the preamplifier calibrator are shown below.
Figure 55 G20307 5 Hz Calibrator Loopback Waveforms
Figure 56 G20311 5 Hz Calibrator Loopback Waveforms
The Guralp calibrator output is single sided and the GS21 requires a differential calibration signal. Therefore, the preamplifier converts the input calibration signal and applies some amount of amplification.
A 20 cycle sine fit of the 5 Hz calibration signal was performed. A ratio of the input and output peak amplitudes of the preamplifier calibration signal provides the following sensitivity terms for the preamplifiers. In addition, the relative phase delay between the sinusoids is observed.
Table 23 Preamplifier 5 Hz Calibrator LoopbackInput Amplitude Output Amplitude Calibrator Gain Phase Delay
G20307 1.26337 V 10.9224 V 8.645 0.157 degreesG20311 1.26332 V 10.9344 V 8.655 0.164 degrees

55
3.12.2 BroadbandIn the second iteration of the Calibrator Pass-through test, a broadband signal was generated from the Guralp digitizer for 20 minutes for each preamplifier. The waveforms for the output of the digitizer calibrator and the preamplifier calibrator are shown below.
Figure 57 G20307 Broadband Calibrator Loopback Waveforms
Figure 58 G20311 Broadband Calibrator Loopback Waveforms
Performing 2 channel coherence analysis (Holcomb, 1989) on each of the sets of broadband signals, we are able to observe the power spectra, coherence, and relative magnitude and phase below.

56
Figure 59 G20307 Broadband Calibrator Loopback Power Spectra, Coherence, Relative Magnitude, and Relative Phase
57
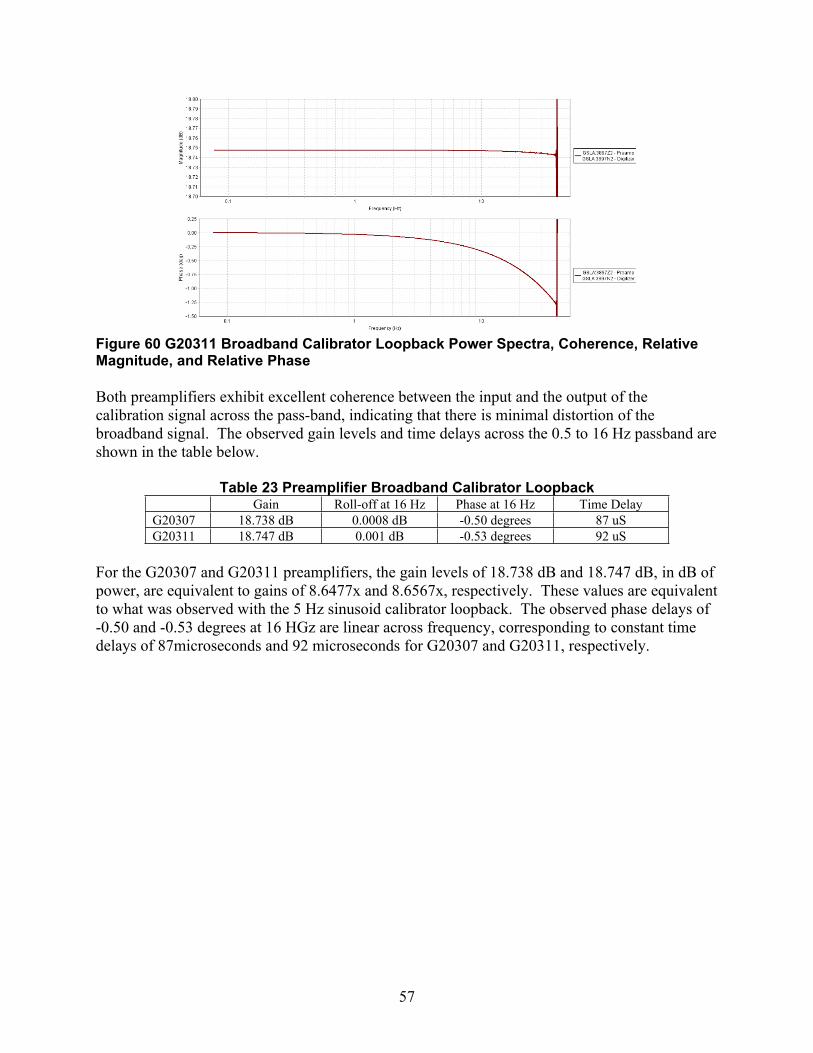
Figure 60 G20311 Broadband Calibrator Loopback Power Spectra, Coherence, Relative Magnitude, and Relative Phase
Both preamplifiers exhibit excellent coherence between the input and the output of the calibration signal across the pass-band, indicating that there is minimal distortion of the broadband signal. The observed gain levels and time delays across the 0.5 to 16 Hz passband are shown in the table below.
Table 23 Preamplifier Broadband Calibrator LoopbackGain Roll-off at 16 Hz Phase at 16 Hz Time Delay
G20307 18.738 dB 0.0008 dB -0.50 degrees 87 uSG20311 18.747 dB 0.001 dB -0.53 degrees 92 uS
For the G20307 and G20311 preamplifiers, the gain levels of 18.738 dB and 18.747 dB, in dB of power, are equivalent to gains of 8.6477x and 8.6567x, respectively. These values are equivalent to what was observed with the 5 Hz sinusoid calibrator loopback. The observed phase delays of -0.50 and -0.53 degrees at 16 HGz are linear across frequency, corresponding to constant time delays of 87microseconds and 92 microseconds for G20307 and G20311, respectively.

58
3.13GS21 CalibrationTest description: The purpose of the GS21 Calibration test is to demonstrate a functional calibration using a Guralp digitizer, Guralp preamplifier, and Geotech GS21 Seismometer.
The digitizer calibrator output is connected to the calibrator input connection on the preamplifier. Note that the calibrator-enable and active-high select lines must also be connected between the digitizer and preamplifier. A resistor calibration is being performed using a 91 ohm resistor in series with the calibration input to the GS21 Seismometer. The current into the calibration coil is monitoring by recording the voltage drop across the resistor on channel 2. This will result in an acceleration of the GS21 mass that is proportional to the current input. The seismometer output is fed back into the preamplifier input. The preamplifier output is then recorded on channel 1 of the digitizer.
Guralp CMG DM2453AM (A2187)
Channel 2 (N)
Channel 1 (Z)
Calibrator Output
Guralp GS21 Preamplifier
Cal In Cal Out
GS21 Seismometer
+ -
Figure 61 GS21 Calibration Configuration Diagram
Figure 62 GS21 Calibration Configuration
The evaluation of the preamplifier using a GS21 seismometer was performed in a lab environment. Although this was non-ideal from the perspective of evaluating a seismometer, it was sufficient for verifying the ability of the preamplifier to perform a calibration on the seismometer. The expected output from the preamplifier is:
𝑉𝑜𝑢𝑡 =
𝑉𝑐𝑟
𝑅𝑐𝐺𝑐𝑎𝑙 𝑐𝑜𝑖𝑙
𝑀∗
12𝜋𝑓
∗ 𝐺𝑔𝑠21 ∗ 𝐺𝑝𝑟𝑒𝑎𝑚𝑝

59
Where
𝑉𝑜𝑢𝑡 Output of the preamplifier in volts recorded by the digitizer𝑉𝑐𝑟 Voltage drop across the calibration resistor recorded by the digitizer𝑅𝑐 Calibration resistor, 91 ohms𝐺𝑐𝑎𝑙 𝑐𝑜𝑖𝑙 Calibration coil motor constant, 0.1975 N/A𝑀 Inertial mass, 5 kg2𝜋𝑓 Conversion from velocity to acceleration at a frequency of 5 Hz𝐺𝑔𝑠21 Generator constant of the GS21, 458 V/(m/s)𝐺𝑝𝑟𝑒𝑎𝑚𝑝 Gain of the Guralp GS21 preamplifier, 61.39
A 5 Hz sinusoid is generated on the calibrator output of the digitizer. A 20 cycle sine fit of the 5 Hz calibration signal was performed. The waveform was filtered with a 2 – 10 Hz Butterworth filter to remove noise that may complicate the results of the sine fit.
Figure 63 GS21 Calibration Configuration Waveforms
A ratio of the input and output of the preamplifier calibration signal provides the following sensitivity terms for the preamplifiers:
Table 27 GS21 Calibration𝑉𝑐𝑟 𝐺𝑝𝑟𝑒𝑎𝑚𝑝 Theoretical 𝑉𝑜𝑢𝑡 Measured 𝑉𝑜𝑢𝑡
G20307 3.112 V 61.28 1.207 V 1.275 V G20311 3.122 V 61.32 1.211 V 1.28 V
A resistor calibration of a Geotech GS21 seismometer was successfully performed using a Guralp digitizer and the Guralp GS21 preamplifier with calibration pass-through. The results of the calibration deviated by the expected amount by approximately 5.5 %. However, this was using the nominal GS21 sensitivity and calibration coil motor constant.

60

61
4 EVALUATION SUMMARY
Power:The measured power consumption of the two Guralp GS21 preamplifiers was just under 1 watt at 12 V.
Input Impedance:The measured sensor input impedance of the Guralp G20307 and G20311 GS21 preamplifiers was 1.468 Mohm and 1.620 Mohm, respectively.
Input Terminated Noise:The measured sensor input terminated noise across 0.5 to 16 Hz of the Guralp G20307 and G20311 GS21 preamplifiers was as low as 1.47571 uV rms and 1.44004 uV rms, respectively. These noise levels are only fully resolved at a digitizer gain of 8x. At lower digitizer gains of 1x, 2x, and 4x the digitizer self-noise has a more significant presence in the observed system noise. However, trade-offs must be made in dynamic range at higher gain levels.
AC ClipThe measured output clip level at 1 Hz the Guralp G20307 and G20311 GS21 preamplifiers was 44.4292 Vpp and 44.0042 Vpp, respectively. This corresponds to input clip levels of 0.7237 Vpp and 0.7168 Vpp, respectively.
Dynamic Range:The computed dynamic range of the Guralp G20307 and G20311 GS21 preamplifiers, using the results of the input terminated noise and the combined digitizer and amplifier clip levels across the 0.5 to 16 Hz passband was approximately 136.7 dB at 1x gain, 134 dB at 2x gain, 129 dB at 4x gain, and 123 dB at 8x gain.
Seismic System Noise:The computed seismic system noise, using the input terminated noise data and the GS21 response model, places the preamplifier self-noise below the seismic low noise model and above the GS21 noise model across the 0.5 to 16 Hz passband.
DC Accuracy:The measured DC gain of the Guralp G20307 and G20311 GS21 preamplifiers was 61.28 and 61.33, respectively. This represents a deviation from the nominal gain of 61.39 by less than 0.2%.
AC Accuracy:The measured AC gain at 1 Hz of the Guralp G20307 and G20311 GS21 preamplifiers was 61.277 and 61.318, respectively. This represents a deviation from the nominal gain of 61.39 by less than 0.2%. The gain was not observed to vary significantly across amplitude with only a slight roll-off across frequency. The G20307 and G20311 preamplifiers had a roll-off in gain at 16 Hz of -0.0126 % and -0.0147 %, respectively.
Harmonic Distortion:
62
The measured harmonic distortion of the Guralp G20307 and G20311 GS21 preamplifiers was -126.7 dB and -120.9 dB, respectively.
Time Tag:The measured time tag accuracy of the Guralp G20307 and G20311 GS21 preamplifiers measured a timing delay of 169.4 and 176.5 microseconds, respectively.
Response Verification:The broadband response of the Guralp G20307 and G20311 GS21 preamplifiers was measured to have a roll-off of less than 0.001 dB in magnitude and 1.16 degrees in phase across 0.5 to 16 Hz. The phase response roll-off is linear and corresponds to a constant time delay of 200 microseconds. The bandwidth of the preamplifiers exceeds 0.01 to 20 Hz. The incoherent noise present in the output of the preamplifiers in the presence of a broadband signal approximately half of full scale was measured to be 24 dB greater than the input terminated noise, but still more than 80 dB below the amplitude of the input signal.
Calibrator Pass-through:The calibrator pass-through evaluation determined that the Guralp GS21 preamplifiers were successfully passing the calibration signal when commanded by the digitizer using both tonal and broadband signals. The Guralp G20307 and G20311 GS21 preamplifiers are performing a single ended to balanced conversion with observed gains at 5 Hz of 8.645 and 8.655, respectively. Both preamplifiers calibrator pass-through was observed to have a constant time delay of approximately 90 microseconds.
GS21 Seismometer Calibration:A successful resistor calibration of a Geotech GS21 seismometer was performed using a Guralp digitizer and each of the Guralp GS21 preamplifiers. The results of the seismometer calibration were consistent to within 5.5 % of the expected values when using the nominal seismometer sensitivity and calibration coil motor constant.

63
REFERENCES
1. Holcomb, Gary L. (1989), A Direct Method for calculating Instrument Noise Levels in Side-by-Side Seismometer Evaluations, DOI USGS Open-File Report 89-214.
2. IEEE Standard for Digitizing Waveform Recorders, IEEE Std. 1057-1994.
3. IEEE Standard for Analog to Digital Converters, IEEE Std. 1241-2001.
4. Kromer, Richard P., Hart, Darren M. and J. Mark Harris (2007), Test Definition for the Evaluation of Digitial Waveform Recorders Version 1.0, SAND2007-5037.
5. McDonald, Timothy S. (1994), Modified Noise Power Ratio Testing of High Resolution digitizers, SAND94-0221.
6. Merchant, B. John, and Darren M. Hart (2011), Component Evaluation Testing and Analysis Algorithms, SAND2011-8265.
7. Sleeman, R., Wettum, A., Trampert, J. (2006), Three-Channel Correlation Analysis: A New
Technique to Measure Instrumental Noise of Digitizers and Seismic Sensors, Bulletin of the Seismological Society of America, Vol. 96, No. 1, pp. 258-271, February 2006.

64
APPENDIX
Geotech GS21 Response
Geotech GS21 response provided to SNL by the CTBTO.
Figure 64 Geotech GS21 Response

65
DISTRIBUTION
1 Leslie CaseyU.S. Department of Energy/NNSAOffice of Nuclear Nonproliferation Research and Development (NA-222)1000 Independence Avenue SWWashington, DC 20585
1 Timothy EvansU.S. Department of Energy/NNSAOffice of Nuclear Verification (NA-243)1000 Independence Avenue SWWashington, DC 20585
1 Dr. Terrill W. RayOffice of Multilateral and Nuclear AffairsBureau of Arms Control, Verification, and ComplianceRoom 5669U.S. Department of State2201 C St., N.W.Washington, DC 20520
1 Julien MartyComprehensive Nuclear-Test-Ban Treaty Organization (CTBTO)Vienna International CentreP.O. Box 12001400 Vienna, Austria
1 MS0404 B. John Merchant 057521 MS0404 George W. Slad 057521 MS0404 Randy K. Rembold 057521 MS0404 Neill P. Symons 057521 MS0404 Mary Clare Stoddard 06831
1 MS0899 Technical Library 9536 (electronic copy)