Evaluation of transport management measures for sustainable development in Beijing
23
Evaluation of a Selection of Transport Management Measures for Sustainable Development in Beijing, China (15-4084) Meng Xu a, b ; Susan Grant-Muller a a Institute for Transport Studies (ITS), University of Leeds b State Key Laboratory of Rail Traffic Control and Safety, Beijing Jiaotong University Session 402-Implementing TDM Strategies The 94 th TRB Annual Meeting
-
Upload
institute-for-transport-studies-its -
Category
Environment
-
view
272 -
download
0
Transcript of Evaluation of transport management measures for sustainable development in Beijing
Evaluation of a Selection of Transport
Management Measures for Sustainable
Development in Beijing, China (15-4084)
Meng Xu a, b; Susan Grant-Muller a
a Institute for Transport Studies (ITS), University of Leeds b State Key Laboratory of Rail Traffic Control and Safety,
Beijing Jiaotong University
Session 402-Implementing TDM Strategies
The 94th TRB Annual Meeting

2
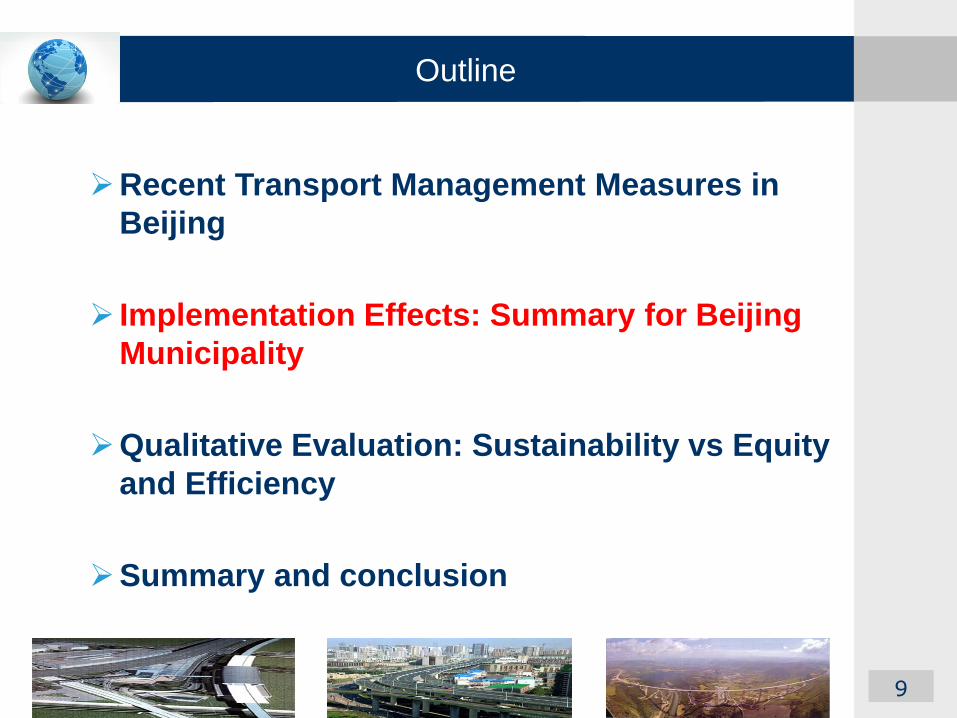
Outline
Recent Transport Management Measures in
Beijing
Implementation Effects: Summary for Beijing
Municipality
Qualitative Evaluation: Sustainability vs Equity
and Efficiency
Summary and conclusion
3
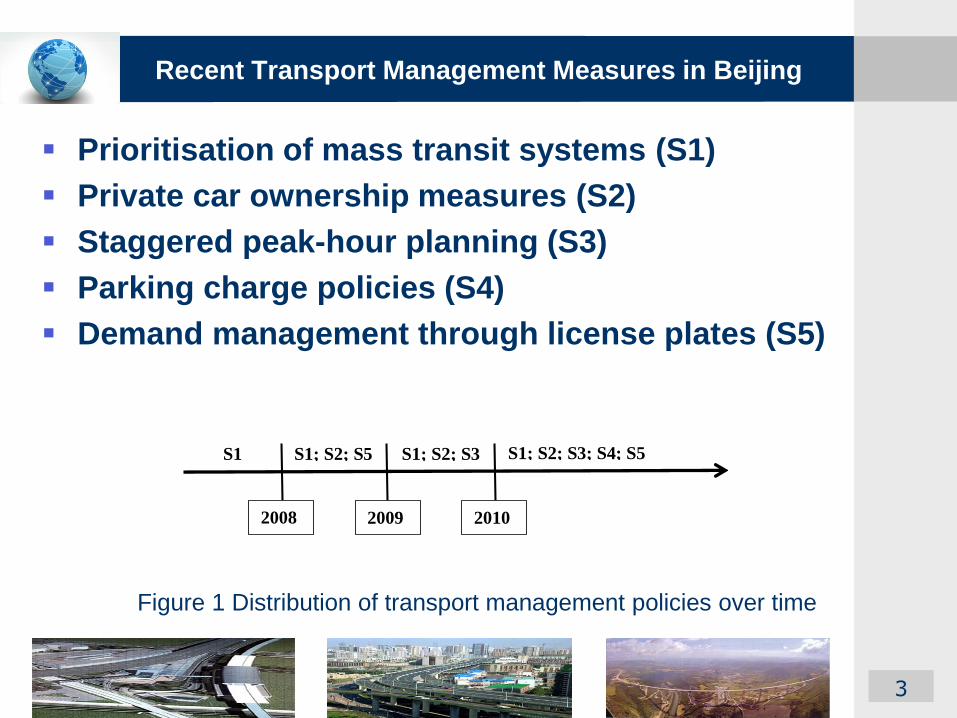
Prioritisation of mass transit systems (S1)
Private car ownership measures (S2)
Staggered peak-hour planning (S3)
Parking charge policies (S4)
Demand management through license plates (S5)
S1 S1; S2; S5 S1; S2; S3 S1; S2; S3; S4; S5
2008 2009 2010
Figure 1 Distribution of transport management policies over time
Recent Transport Management Measures in Beijing

With rapid socio-economic growth, the development of mass
transit has been prioritised to increase transport efficiency
and mitigate congestion;
A focus on the development of subways and large capacity
rapid transit systems, an aspiration to develop as a ‘public-
transport city’ with an attractive, fast and convenient mass
transit service;
Implementation of ‘four priority’ policies to improve the PT
system (land use; investment; dedicated road lanes; fiscal
support);
Establish the social welfare importance of public transport.
Recent Transport Management Measures in Beijing
Prioritisation of mass transit systems (S1)

Application process and use of the quota for private car
and official business car purchase;
The new measures started from the 1st January of 2012,
with Beijing car purchasers needing to draw lots to
obtain a car license plate;
A Beijing driver is only allowed to own one car, but car
owners can update vehicles without entering the lot-
drawing procedure;
For a period of five years (2012-2017), applications
which would increase the size of the governmental and
public agency vehicle fleet are not allowed.
Recent Transport Management Measures in Beijing
Private car ownership measures (S2)

Commuters in Beijing changed their peak hour departure
times as the new ‘adjusted-work-hour’ policy was launched on
12th April of 2010;
Around 0.81 million municipal government employees have
been involved in the scheme, including employees from all
parties and governmental organizations, social groups, public
units, state-owned enterprises and urban collective-owned
enterprises;
The working day was adjusted to start at 9:00am instead of
8:30am and to end at 6:00pm instead of 5:30pm.
Recent Transport Management Measures in Beijing
Staggered peak-hour planning (S3)

Parking fee regulations divide Beijing's non-residential
parking areas into three zones (within the 3rd ring road area;
between 3rd ring road and 5th ring road area; outside the 5th
ring road area) and different parking fees apply in each zone;
Specification of new charges standard for parking in daytime
(7:00am-21:00pm) based on three defined zone types;
The parking fee is as high as ¥15 (about $2.45 USD) per hour
in some highly congested areas, putting many employees
under financial pressure if they need to park near to their
work place.
Recent Transport Management Measures in Beijing
Parking charge policies (S4)

During 07:00am and 8:00pm, private cars and official business
vehicles inside the 5th ring road (inclusive) should not be
driven on public roads for one day per week;
Every three months, the group of vehicles that could not use
public road space for a certain weekday would rotate;
Traffic permits for entering Beijing are needed for Non-Beijing
passenger service vehicles, and Non-Beijing passenger
service vehicles heading for Beijing and with traffic permits to
entering Beijing will be prohibited to run within the 5th Ring
Road (inclusive) from 7:00am to 9:00am and from 5:00pm to
8:00pm on workdays.
Recent Transport Management Measures in Beijing
Demand management through license plates (S5)
9
Outline
Recent Transport Management Measures in
Beijing
Implementation Effects: Summary for Beijing
Municipality
Qualitative Evaluation: Sustainability vs Equity
and Efficiency
Summary and conclusion

Implementation Effects
Vehicle growth
179.8 206.5
235.8
269.4
318.6
390.9 402.8
419.2
258.3
287.6 312.8
350.4
401.9
480.9 498.3
520
0
100
200
300
400
500
600
2005 2006 2007 2008 2009 2010 2011 2012
V
ehic
le N
um
ber
(U
nit
: 10,0
00 V
eh)
Year
Private Car Number
Total Vehicle Number
Expon. (Private Car Number)
Expon. (Total Vehicle
Number)
Figure 2. Annual variation in vehicles in
Beijing municipality (2005-2012)
Total private cars in
Beijing has
increased
dramatically from
2005-2010.
With the
introduction of S2
in late 2010, the
growth in
motorization
decreased.
Implementation Effects
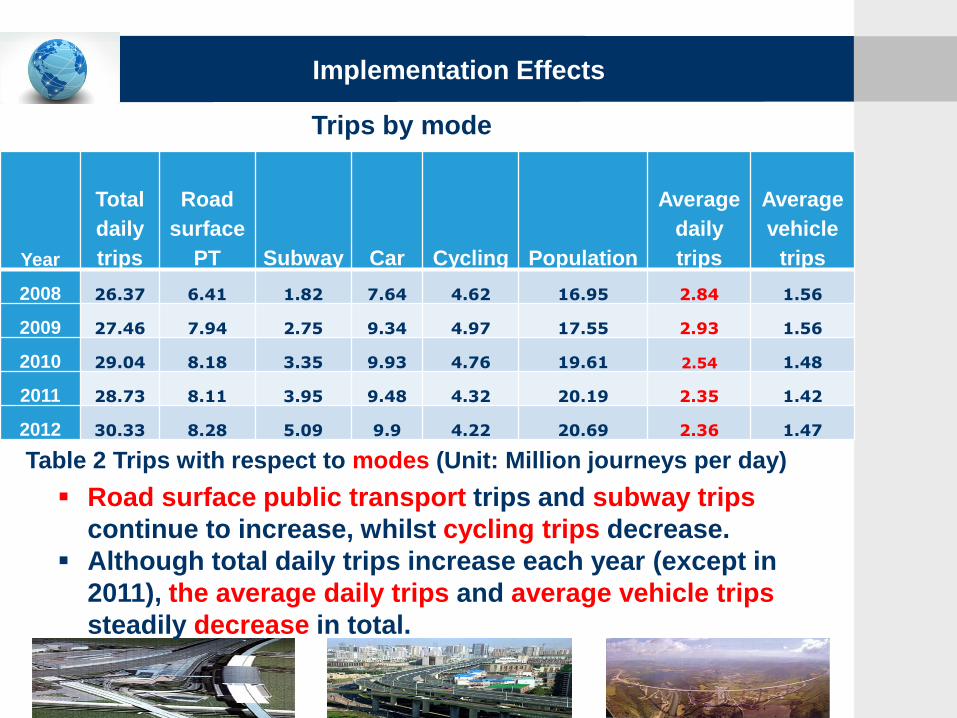
Trips by mode
Year
Total
daily
trips
Road
surface
PT Subway Car Cycling Population
Average
daily
trips
Average
vehicle
trips
2008 26.37 6.41 1.82 7.64 4.62 16.95 2.84 1.56
2009 27.46 7.94 2.75 9.34 4.97 17.55 2.93 1.56
2010 29.04 8.18 3.35 9.93 4.76 19.61 2.54 1.48
2011 28.73 8.11 3.95 9.48 4.32 20.19 2.35 1.42
2012 30.33 8.28 5.09 9.9 4.22 20.69 2.36 1.47
Table 2 Trips with respect to modes (Unit: Million journeys per day)
Road surface public transport trips and subway trips
continue to increase, whilst cycling trips decrease.
Although total daily trips increase each year (except in
2011), the average daily trips and average vehicle trips
steadily decrease in total.
Implementation Effects
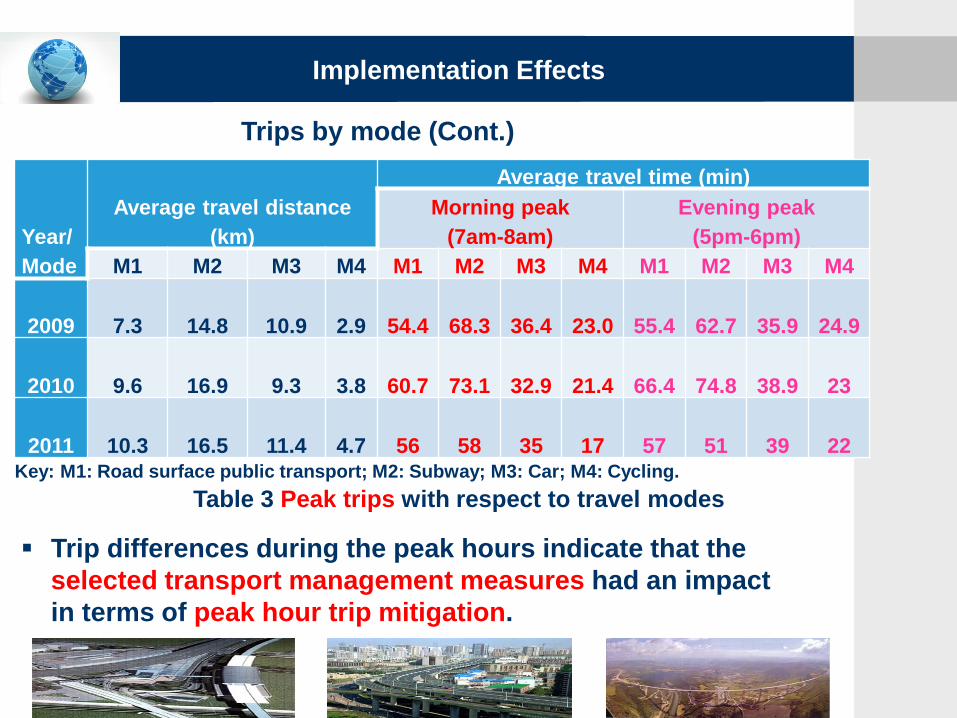
Trips by mode (Cont.)
Year/
Mode
Average travel distance
(km)
Average travel time (min)
Morning peak
(7am-8am)
Evening peak
(5pm-6pm)
M1 M2 M3 M4 M1 M2 M3 M4 M1 M2 M3 M4
2009 7.3 14.8 10.9 2.9 54.4 68.3 36.4 23.0 55.4 62.7 35.9 24.9
2010 9.6 16.9 9.3 3.8 60.7 73.1 32.9 21.4 66.4 74.8 38.9 23
2011 10.3 16.5 11.4 4.7 56 58 35 17 57 51 39 22
Table 3 Peak trips with respect to travel modes
Trip differences during the peak hours indicate that the
selected transport management measures had an impact
in terms of peak hour trip mitigation.
Key: M1: Road surface public transport; M2: Subway; M3: Car; M4: Cycling.
13
Outline
Recent Transport Management Measures in
Beijing
Implementation Effects: Summary for Beijing
Municipality
Qualitative Evaluation: Sustainability vs Equity
and Efficiency
Summary and conclusion

Qualitative Evaluation
Sustainable aspects of transport management policies
With respect to society:
(So1) Meet basic human needs for health, comfort, and convenience
in ways that do not stress the social fabric
(So2) Allow and support development at a human scale, provide for
a reasonable choice of transport modes, types of housing,
community and living styles
(So3) Produce no more noise than is acceptable by communities
(So4) Be safe for people and their property
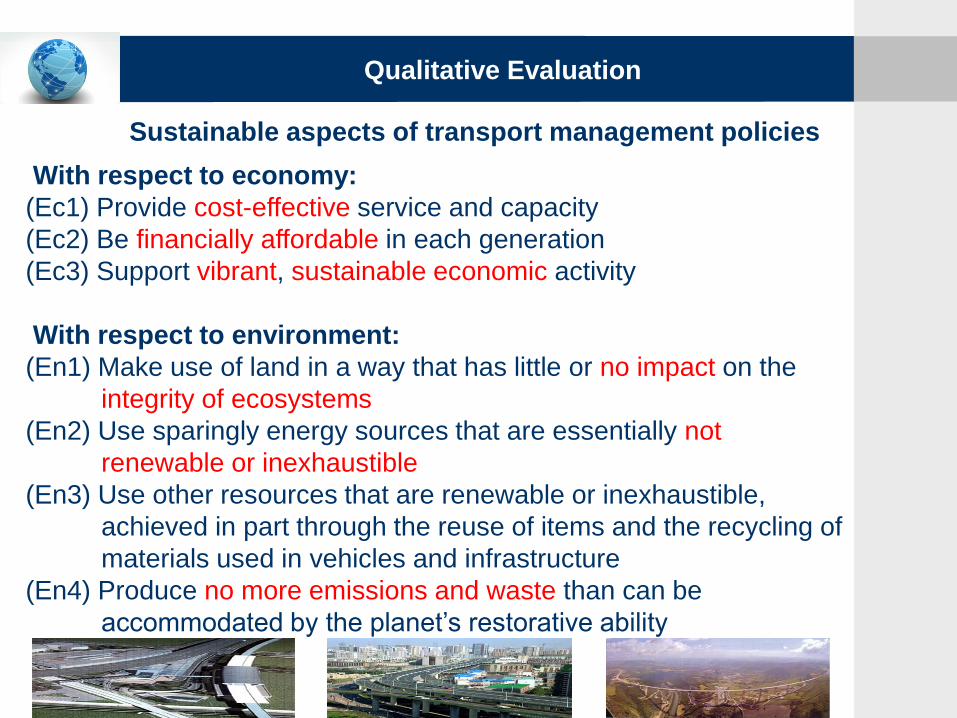
Qualitative Evaluation
Sustainable aspects of transport management policies
With respect to economy:
(Ec1) Provide cost-effective service and capacity
(Ec2) Be financially affordable in each generation
(Ec3) Support vibrant, sustainable economic activity
With respect to environment:
(En1) Make use of land in a way that has little or no impact on the
integrity of ecosystems
(En2) Use sparingly energy sources that are essentially not
renewable or inexhaustible
(En3) Use other resources that are renewable or inexhaustible,
achieved in part through the reuse of items and the recycling of
materials used in vehicles and infrastructure
(En4) Produce no more emissions and waste than can be
accommodated by the planet’s restorative ability

Qualitative Evaluation
An assessment approach based on equity and efficiency criteria
a) Equity Principles:
EP1- Utilitarian policy principle
EP2 – Equal shares policy principle
EP3 – Rawlsian policy principle
EP4 – Egalitarian policy principle
EP5 – Minimum floor policy principle
EP6 – Maximum range policy principle
b) Efficiency Criteria:
ET1- Minimizing Cost
ET2- Maximizing Service Level

Qualitative Evaluation
Evaluation of Transport Management Policies
Sustainability
Index
Society Economy Environment
So1 So2 So3 So4 Ec1 Ec2 Ec3 En1 En2 En3 En4
Equity EP1 S1+,+
S3+,+
S4+,+
S5+,-
S1+,+
S4+,-
S1+,+
S5+,-
S1+,+
S3+,+
S4+,+
S1+,+
S3+,+
S4+,+
S5+,-
S1+,+
S4+,+
S1+,+
S3+,+
S4+,+
S5+,-
S1+,+
S4+,+
S1+,+ S1+,- S1+,+
EP2 S1+,+
S2+,+
S1+,+
S2+,+
S1+,+
S2+,+
S1+,+
S2+,+
S1+,+ S1+,+ S1+,+
S2+,-
S1+,+ S1+,+ S1+,- S1+,+
EP3 / / / / / / / / / / /
EP4 S4+,+ S4+,- / S4+,+ S4+,+ / S4+,+ / / / /
EP5 / / / / / / / / / / /
EP6 / / / / / / / / / / /
Efficie
ncy
ET1 S1+,+
S5+,-
S1+,+ S1+,+;
S5+,-
S1+,+ S1+,+
S5+,-
S1+,+ S1+,+;
S5+,-
S1+,+ S1+,+ S1+,- S1+,+
ET2 S1+,+
S3+,+
S4+,+
S1+,+
S4+,-
S1+,+ S1+,+
S3+,+
S4+,+
S1+,+
S3+,+
S4+,+
S1+,+
S4+,+
S1+,+
S3+,+
S4+,+
S1+,+
S4+,+
S1+,+ S1+,- S1+,+
Table 4. Multi-criteria evaluation of selected transport management measures

Qualitative Evaluation
Sustainable aspects of transport management policies
In Table 4, the row consists of assessment indices covering
equity principles and efficiency criteria. The column consists of
the social, economic and environmental aspects from the
definition of transport sustainability.
The subscript “+” represents ‘satisfied’, the subscript “-”
represents “not satisfied” and the notation “/” represents “not
applicable” for the evaluation.
E.g, “S1+,+” in the first cell reflects that the policy S1 satisfies the
principle EP1 and the criterion So1. “S1+,-” crossing EP1 and
En3 reflects that policy S1 satisfies the principle EP1 but does
not satisfy the criterion En3.
Qualitative Evaluation
Sustainable aspects of transport management policies
• The selected measures (S1-S5) are subparts of society and
economy. More effective transport management policies
covering other aspects of sustainable transport still need to
be considered.
• The priority development of a mass transit system is aligned
with a sustainable transport system. To reflect travel and
structural characteristics of Beijing, a more effective
evaluation approach to capture the impacts of mass transit
policies is needed.
• Other transport management policies (S2-S4) are focused on
reducing levels of activity and adjusting mode shares. These
are expected to impact on social and economic factors
rather than broader sustainability.
20
Outline
Recent Transport Management Measures in
Beijing
Implementation Effects: Summary for Beijing
Municipality
Qualitative Evaluation: Sustainability vs Equity
and Efficiency
Summary and conclusion

Beijing authorities have focused in depth and over time on the
problem of congestion and need for transport sustainability.
Effects of the selected transport management measures with
respect to vehicle growth and trips growth are illustrated. They
indicate that the measures generally had a positive impact.
Selected measures have been evaluated using a qualitative
framework comprising equity and efficiency in one dimension
and sustainability elements in the other dimension.
Qualitative evaluation shows the measures were targeted to the
society and economy and demonstrate a utilitarian policy
principle and cover efficiency criteria. They still leave gaps to
satisfying other important principles as listed in Table 4.
Summary and Conclusion
The framework is flexible in that either quantitative
information or a mixture of quantitative and heuristic data
may be used.
Although from an economic perspective these measures fail
to achieve an efficient market outcome, the government
backing still made them effective.
The evaluation approach can be used to help policymakers
appreciate the range of effects of transport management
measures and potential ‘trade-offs’ between these, resulting in
the improved design of future measures.
Summary and Conclusion

Thank You!