EVALUATION OF TRACTOR DIESEL ENGINE PERFORMANCE …
22
FARM MACHINERY AND POWER Misr J. Ag. Eng., April 2014 - 403 - EVALUATION OF TRACTOR DIESEL ENGINE PERFORMANCE USING BIODIESEL FROM THREE DIFFERENT INDIVIDUAL SOURCES A. E. Gomaa 1 , H. H. Mohamed 2 , A. A. El Gwady 3 and M. D. Al-Aseebee 4 ABSTRACT Biodiesel was prepared from three different individual sources: waste frying oil, palm oil, and castor oil; to compare their performance versus conventional diesel and with respect to each other on the performance of a KUBOTA 67 kW tractor diesel engine. All tested fuels were purely used without any blending. Tractor engine was tested through a P.T.O. hydraulic brake dynamometer at the tractors testing station - Agricultural Engineering Research Institute. Engine performance characteristics and main indicators were determined: P.T.O. torque and power, engine brake power (BP), brake thermal efficiency (BTE), brake specific fuel consumption (BSFC), brake mean effective pressure (BMEP), and air fuel ratio (AFR). The highest performance was achieved by the conventional diesel. The performance of all tested biodiesels were close to each other; and no clear preference of any specific biodiesel could be considered. Their tested properties were also very close. So, the decision of selecting a specific biodiesel (prepared from a specific source) depends mainly on its availability and economical feasibility wherever is used. Keywords: Biodiesel, I.C. engines, Transesterification, Vegetable fuels. INTRODUCTION iodiesel is a clean renewable fuel made from natural sources such as new or used vegetable oils and animal fats. The biodiesel is quite similar to conventional diesel in its main characteristics. Biodiesel contains no petroleum products, but it is compatible with conventional diesel and can be blended in any proportion with mineral diesel to create a stable biodiesel blend. 1- Prof. Emeritus of Ag. Eng.- Fac. of Ag. Saba Basha, Univ. of Alex. Egypt. 2- Assist. Prof. of Ag. Eng.- Fac. of Ag. Saba Basha, Univ. of Alex. Egypt. 3- Senior Researcher-Agricultural Engineering, Research Institute, Egypt. 4- M.Sc. student, Fac. of Ag. Saba Basha, Univ. of Alex. Egypt. – Comer from Ministry of Agriculture, Iraq. B Misr J. Ag. Eng., 31 (2): 403 - 424
Transcript of EVALUATION OF TRACTOR DIESEL ENGINE PERFORMANCE …
FARM MACHINERY AND POWER
Misr J. Ag. Eng., April 2014 - 403 -
EVALUATION OF TRACTOR DIESEL ENGINE
PERFORMANCE USING BIODIESEL FROM THREE
DIFFERENT INDIVIDUAL SOURCES
A. E. Gomaa1, H. H. Mohamed2, A. A. El Gwady3 and M. D. Al-Aseebee4
ABSTRACT
Biodiesel was prepared from three different individual sources: waste
frying oil, palm oil, and castor oil; to compare their performance versus
conventional diesel and with respect to each other on the performance of
a KUBOTA 67 kW tractor diesel engine. All tested fuels were purely used
without any blending. Tractor engine was tested through a P.T.O.
hydraulic brake dynamometer at the tractors testing station - Agricultural
Engineering Research Institute. Engine performance characteristics and
main indicators were determined: P.T.O. torque and power, engine brake
power (BP), brake thermal efficiency (BTE), brake specific fuel
consumption (BSFC), brake mean effective pressure (BMEP), and air fuel
ratio (AFR). The highest performance was achieved by the conventional
diesel. The performance of all tested biodiesels were close to each other;
and no clear preference of any specific biodiesel could be considered.
Their tested properties were also very close. So, the decision of selecting
a specific biodiesel (prepared from a specific source) depends mainly on
its availability and economical feasibility wherever is used.
Keywords: Biodiesel, I.C. engines, Transesterification, Vegetable fuels.
INTRODUCTION
iodiesel is a clean renewable fuel made from natural sources
such as new or used vegetable oils and animal fats. The biodiesel
is quite similar to conventional diesel in its main characteristics.
Biodiesel contains no petroleum products, but it is compatible with
conventional diesel and can be blended in any proportion with mineral
diesel to create a stable biodiesel blend.
1- Prof. Emeritus of Ag. Eng.- Fac. of Ag. Saba Basha, Univ. of Alex. Egypt.
2- Assist. Prof. of Ag. Eng.- Fac. of Ag. Saba Basha, Univ. of Alex. Egypt.
3- Senior Researcher-Agricultural Engineering, Research Institute, Egypt.
4- M.Sc. student, Fac. of Ag. Saba Basha, Univ. of Alex. Egypt. – Comer from
Ministry of Agriculture, Iraq.
B
Misr J. Ag. Eng., 31 (2): 403 - 424
FARM MACHINERY AND POWER
Misr J. Ag. Eng., April 2014 - 404 -
Shahid and Jamal (2011) reported that transesterification is regarded as
the best method to prepare biodiesel, among other approaches due to its
low cost and simplicity which consists of a number of reversible
reactions. In these reactions, the triglycerides are converted step wise to
glycerol which sinks to the bottom and biodiesel which floats on top and
can be separated. In this reaction, methanol and ethanol are the two main
light alcohols used for transesterification process due to their relatively
low cost.
Barsin and Humke (1981) reported that when diesel engine was run with
vegetable oil as fuel, produced equivalent power to that of the diesel fuel
because fuel mass flow energy delivery increased due to higher density
and viscosity of vegetable oil. It also increased fuel flow by reducing
internal pump leakage. The lower mass-based heating values of vegetable
oils required larger mass fuel flow to maintain constant energy input to
the engine. Reed et al. (1991) converted waste cooking oils to methyl and
ethyl esters and tested pure biodiesel and a 30% blend in diesel fuel in a
diesel-powered bus on a chassis dynamometer. No significant difference
in power and performance was observed except for a visible reduction of
smoke on acceleration with the esters of the used oil. They also found
that the smoke opacity was reduced to 60% of the diesel value by the
30% blend and to 26% of the diesel value by the pure ester. Baiju et al.
(2009) found that the brake specific fuel consumption BSFC increased
when using biodiesel as compared to diesel for the same power output.
This was because the heat value of biodiesel is less than this of the diesel.
Krawczyk (1996) reported that increasing the use of petroleum will
intensify local air pollution and magnify the global warming problems
caused by carbon dioxide. Biodiesel has the potential to reduce the level
of pollutants and the level of potential for probable carcinogens. This
research was carried out in order to: 1) evaluate the tractor diesel engine
performance with biodiesel from waste frying oil, palm oil and castor oil,
2) compare the performance between the above mentioned biodiesel fuels
and diesel fuel, and 3) determine the best operating conditions to
maximize tractor engine performance using biodiesel fuels.
FARM MACHINERY AND POWER
Misr J. Ag. Eng., April 2014 - 405 -
MATERIALS AND METHOD
In the laboratory of Soil and Agricultural Engineering dept.-Faculty of
Agriculture (Saba Basha); three different biodiesels were prepared from
three different individual sources: waste frying oil, palm oil, and castor
oil, by transesterification process. They were tested as alternative fuels
for tractor engine at the Testing and Research Station for Tractors and
Agricultural Machinery, Alexandria.
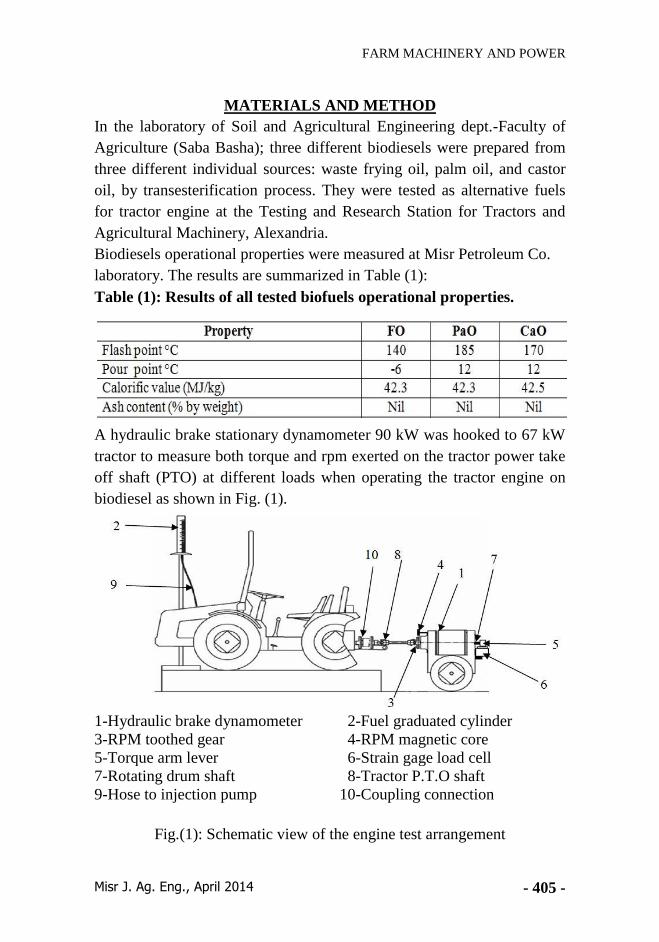
Biodiesels operational properties were measured at Misr Petroleum Co.
laboratory. The results are summarized in Table (1):
Table (1): Results of all tested biofuels operational properties.
A hydraulic brake stationary dynamometer 90 kW was hooked to 67 kW
tractor to measure both torque and rpm exerted on the tractor power take
off shaft (PTO) at different loads when operating the tractor engine on
biodiesel as shown in Fig. (1).
1-Hydraulic brake dynamometer 2-Fuel graduated cylinder
3-RPM toothed gear 4-RPM magnetic core
5-Torque arm lever 6-Strain gage load cell
7-Rotating drum shaft 8-Tractor P.T.O shaft
9-Hose to injection pump 10-Coupling connection
Fig.(1): Schematic view of the engine test arrangement
FARM MACHINERY AND POWER
Misr J. Ag. Eng., April 2014 - 406 -
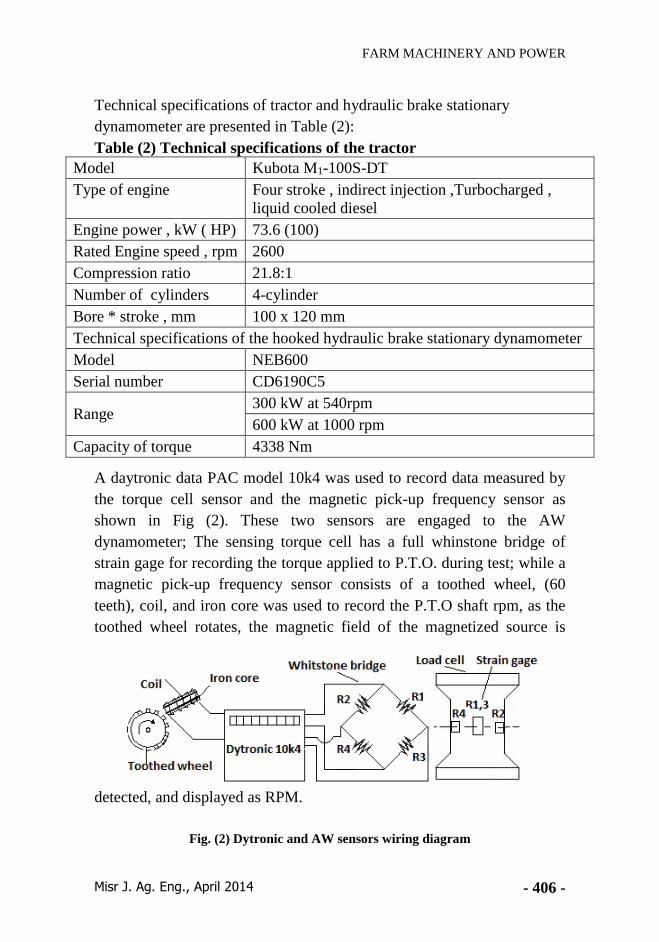
Technical specifications of tractor and hydraulic brake stationary
dynamometer are presented in Table (2):
Table (2) Technical specifications of the tractor
Model Kubota M1-100S-DT
Type of engine Four stroke , indirect injection ,Turbocharged ,
liquid cooled diesel
Engine power , kW ( HP) 73.6 (100)
Rated Engine speed , rpm 2600
Compression ratio 21.8:1
Number of cylinders 4-cylinder
Bore * stroke , mm 100 x 120 mm
Technical specifications of the hooked hydraulic brake stationary dynamometer
Model NEB600
Serial number CD6190C5
Range 300 kW at 540rpm
600 kW at 1000 rpm
Capacity of torque 4338 Nm
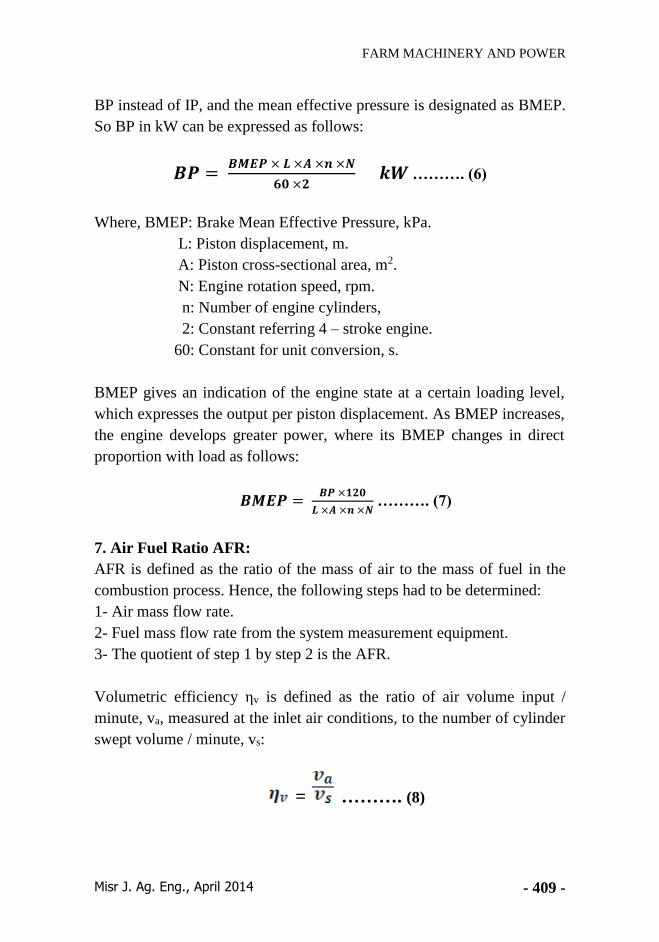
A daytronic data PAC model 10k4 was used to record data measured by
the torque cell sensor and the magnetic pick-up frequency sensor as
shown in Fig (2). These two sensors are engaged to the AW
dynamometer; The sensing torque cell has a full whinstone bridge of
strain gage for recording the torque applied to P.T.O. during test; while a
magnetic pick-up frequency sensor consists of a toothed wheel, (60
teeth), coil, and iron core was used to record the P.T.O shaft rpm, as the
toothed wheel rotates, the magnetic field of the magnetized source is
detected, and displayed as RPM.
Fig. (2) Dytronic and AW sensors wiring diagram

FARM MACHINERY AND POWER
Misr J. Ag. Eng., April 2014 - 407 -
Prior to the measurements, the tractor was left running for 1 hr to warm
up all parts and liquids to the working temperature. At the same time and
before each measurement for each fuel type, the whole system was
running for 10 min at full throttle. Every measurement of torque and
rotational frequency of PTO was recorded at tractor full throttle. During
the experiments, the time required for consuming 100 cm3 of each fuel
was also recorded; the first measurement was carried out at load set zero,
then at standard PTO speed 540 rpm, and at maximum load. For every
subsequent measurement, the load on the AW hydraulic brake was
increased in order to decrease the rotational frequency of the PTO. All
engine settings (throttle, cooling...) remained unchanged during the
whole experiment for each particular fuel type. Two test run
measurements were performed for each fuel type. When testing a new
fuel it was made sure that, the previously tested fuel was completely
removed from the pipelines and filter system by running the engine on
the new fuel for 10 min at full throttle before doing any measurements.
Calculation of performance indicators
1. PTO Torque and Power:
Both torque in N.m and rotational speed in rpm, were measured in the lab
using the AW hydraulic brake stationary dynamometer for tractor power
take off shaft calculation, , at different PTO speed, using the following
equation.
P = 2 π n τ c kW⁄ ………. (1)
Where:
P Power take off shaft P.T.O kW
n Measured rotational speed for P.T.O rpm
τ Measured torque for P.T.O in N.m
c constant, equals 60000
2. Engine Brake Power BP:
According to KUBOTA tractor technical data, PTO power is 88.9% of
the engine BP. For a used tractor the present work considered the PTO
power as 88% of the engine BP; and the ratio between engine and PTO
shaft speeds (rpm) is (2205/540) or 4.0833:1.

FARM MACHINERY AND POWER
Misr J. Ag. Eng., April 2014 - 408 -
𝑩𝑷 = 𝑷𝑻𝑶 𝒑𝒐𝒘𝒆𝒓
𝟎.𝟖𝟖 𝒌𝑾 ………. (2)
3. Fuel Consumption:
A volume of fuel consumed (cm3) was measured during each test run at
no load, at standard PTO speed, and at full load. Consumption time for
each test was also measured and the volumetric fuel consumption rate
was calculated for each load as follows:
𝑽𝑭𝑪 = (𝑽 ∗ 𝟑𝟔𝟎𝟎)/(𝒕 ∗ 𝟏𝟎𝟎𝟎) l/h ………. (3)
Where:
V: volume of consumed fuel in glass bulb, cm3
t :Time of running the test, s
VFC: Volumetric fuel consumption rate, l.h-1
4. Brake thermal efficiency BTE:
This parameter is obtained by dividing the effective power from engine
to the amount of energy given to the engine.
𝜼 = 𝑩𝑷×𝟑𝟔𝟎𝟎
𝑽𝑭𝑪×𝝆𝑭×𝑯𝑽 ………. (4)
Where:
BP = Brake power, kW
f = density of the tested fuel, kg/l
VFC=Fuel consumption rate, l/h
HV = heat value of the tested fuel, kJ/kg.
5. Brake Specific Fuel Consumption BSFC:
BSFC is the quotient of fuel consumption rate (l/h) and the corresponding
BP (kW) at the same loading conditions represented by the different
levels of engine speed (rpm) starting from 408.33 to 2858.31(100 to 700
PTO rpm).
𝑩𝑺𝑭𝑪 = 𝑽𝑭𝑪
𝑩𝑷 𝒍/(𝒌𝑾. 𝒉) ………. (5)
6. Brake Mean Effective Pressure BMEP:
BMEP is a useful concept which can be obtained if the standard
expression for computing indicated power IP is applied to brake power
FARM MACHINERY AND POWER
Misr J. Ag. Eng., April 2014 - 409 -
BP instead of IP, and the mean effective pressure is designated as BMEP.
So BP in kW can be expressed as follows:
𝑩𝑷 = 𝑩𝑴𝑬𝑷 × 𝑳 ×𝑨 ×𝒏 ×𝑵
𝟔𝟎 ×𝟐 𝒌𝑾 ………. (6)
Where, BMEP: Brake Mean Effective Pressure, kPa.
L: Piston displacement, m.
A: Piston cross-sectional area, m2.
N: Engine rotation speed, rpm.
n: Number of engine cylinders,
2: Constant referring 4 – stroke engine.
60: Constant for unit conversion, s.
BMEP gives an indication of the engine state at a certain loading level,
which expresses the output per piston displacement. As BMEP increases,
the engine develops greater power, where its BMEP changes in direct
proportion with load as follows:
𝑩𝑴𝑬𝑷 = 𝑩𝑷 ×𝟏𝟐𝟎
𝑳 ×𝑨 ×𝒏 ×𝑵 ………. (7)
7. Air Fuel Ratio AFR:
AFR is defined as the ratio of the mass of air to the mass of fuel in the
combustion process. Hence, the following steps had to be determined:
1- Air mass flow rate.
2- Fuel mass flow rate from the system measurement equipment.
3- The quotient of step 1 by step 2 is the AFR.
Volumetric efficiency ηv is defined as the ratio of air volume input /
minute, va, measured at the inlet air conditions, to the number of cylinder
swept volume / minute, vs:
= ………. (8)
FARM MACHINERY AND POWER
Misr J. Ag. Eng., April 2014 - 410 -
The ηv of the KUBOTA tractor supercharged engine, could be
determined at any operating point (engine speed) As later shown and
explained from Fig.(15), from which the actual air volume flow rate, va
(𝑚3 (𝑚𝑖𝑛 ∙ 𝑐𝑦𝑙)) ⁄ could also be determined per one single cylinder from
equation (8) as follows:
………. (9)
Where,
𝑣𝑠 = (𝑛𝑢𝑚𝑏𝑒𝑟 𝑜𝑓 𝑠𝑢𝑐𝑡𝑖𝑜𝑛 𝑠𝑡𝑟𝑜𝑘𝑒𝑠
𝑚𝑖𝑛 ∙ 𝑐𝑦𝑙) × 𝑝𝑖𝑠𝑡𝑜𝑛 𝑠𝑢𝑟𝑓𝑎𝑐𝑒 𝑎𝑟𝑒𝑎 × 𝑑𝑖𝑠𝑝𝑙𝑎𝑐𝑒𝑚𝑒𝑛𝑡
𝑣𝑠 = (𝐸𝑛𝑔𝑖𝑛𝑒 𝑟𝑒𝑣𝑠.
𝑚𝑖𝑛 ∙ 2 ∙ 𝑐𝑦𝑙) ×
𝑐𝑚2 ∙ 𝑐𝑚
106
𝐴𝑖𝑟 𝑚𝑎𝑠𝑠 𝑓𝑙𝑜𝑤 𝑟𝑎𝑡𝑒 (𝑘𝑔𝑚𝑎
𝑚𝑖𝑛∙𝑐𝑦𝑙) = 𝑣𝑎 (
𝑚3
𝑚𝑖𝑛∙𝑐𝑦𝑙) × 𝑎𝑖𝑟 𝑑𝑒𝑛𝑠𝑖𝑡𝑦 (
𝑘𝑔𝑚𝑎
𝑚3 ) ..(10)
An average air density of 1.204 (kgm/m3) is considered. Table (1) showed the
measured density data for all tested fuels in (kgm/l). The measured fuel
consumption rate for all tested fuels was divided by 4 cylinders to determine
the fuel consumption rate vf per one single cylinder in (l/min.cyl). Then the
mass flow rate of all tested fuels is determined as follows:
𝐹𝑢𝑒𝑙 𝑚𝑎𝑠𝑠 𝑓𝑙𝑜𝑤 𝑟𝑎𝑡𝑒 (𝑘𝑔𝑚𝑓
𝑚𝑖𝑛∙𝑐𝑦𝑙) = 𝑣𝑓 (
𝑙
𝑚𝑖𝑛∙𝑐𝑦𝑙) × 𝑓𝑢𝑒𝑙 𝑑𝑒𝑛𝑠𝑖𝑡𝑦 (
𝑘𝑔𝑚𝑓
𝑙) … (11)
AFR = equ. (10) equ. (11)⁄ ………. (12)
RESULTS AND DISCUSSION
Engine performance characteristics:
1. PTO Torque and Power
For all tested fuels, the measured variation of PTO torque with the variable
PTO speed due to loading effect is shown by Fig.(3), their corresponding best
fit relationships and equations are shown in Fig.(4); then for each PTO torque
recorded value and the corresponding rpm coordinate of all fuels in Fig.(3), a

FARM MACHINERY AND POWER
Misr J. Ag. Eng., April 2014 - 411 -
PTO power value was calculated to locate the relationships between their PTO
power and PTO speed as illustrated by Fig.(5). Torque values in Fig.(3), were
minimum at no load conditions (max. speed), then increased for all tested
fuels with the PTO or engine speed decrease, until 500-540 PTO rpm (around
2000 engine rpm), then they started to slightly decrease with load increase
towards maximum (min. speed). The highest torque values, fluctuated within
900-1000 Nm, (0.9-1.0 kJ), were of conventional diesel, followed by a bundle
of the three biodiesels fluctuated around 800-900 Nm for all engine operation
conditions.
0
200
400
600
800
1000
1200
0 100 200 300 400 500 600 700
PT
O T
orq
ue
-N
m
PTO Rotation speed - rpm
Fig.(3):Measured PTO Torque output versus its rotation speed
CAO
FO
PAO
Diesel
yCAO = -0.0045x2 + 2.4631x + 634.76
R² = 0.8889
yFO = -0.0043x2 + 2.2745x + 700.2
R² = 0.9179
yPAO = -0.005x2 + 3.0593x + 484.75
R² = 0.9273
yDiesel = -0.0062x2 + 3.8595x + 510.27
R² = 0.9496
0
200
400
600
800
1000
1200
50 150 250 350 450 550 650 750
PT
O T
orq
ue
-N
m
PTO Rotation speed - rpm
Fig.(4): Best fit of PTO Torque output versus its rotation speed
CAO
FO
PAO
Diesel
FARM MACHINERY AND POWER
Misr J. Ag. Eng., April 2014 - 412 -
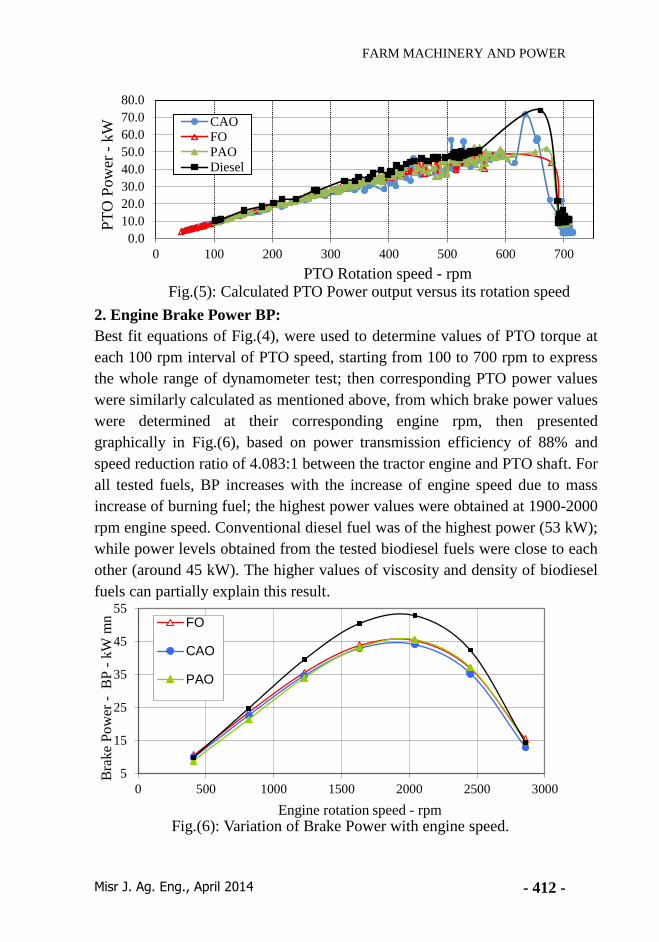
2. Engine Brake Power BP:
Best fit equations of Fig.(4), were used to determine values of PTO torque at
each 100 rpm interval of PTO speed, starting from 100 to 700 rpm to express
the whole range of dynamometer test; then corresponding PTO power values
were similarly calculated as mentioned above, from which brake power values
were determined at their corresponding engine rpm, then presented
graphically in Fig.(6), based on power transmission efficiency of 88% and
speed reduction ratio of 4.083:1 between the tractor engine and PTO shaft. For
all tested fuels, BP increases with the increase of engine speed due to mass
increase of burning fuel; the highest power values were obtained at 1900-2000
rpm engine speed. Conventional diesel fuel was of the highest power (53 kW);
while power levels obtained from the tested biodiesel fuels were close to each
other (around 45 kW). The higher values of viscosity and density of biodiesel
fuels can partially explain this result.
0.0
10.0
20.0
30.0
40.0
50.0
60.0
70.0
80.0
0 100 200 300 400 500 600 700
PT
O P
ow
er -
kW
PTO Rotation speed - rpmFig.(5): Calculated PTO Power output versus its rotation speed
CAO
FO
PAO
Diesel
5
15
25
35
45
55
0 500 1000 1500 2000 2500 3000
Bra
ke
Po
wer
-B
P -
kW
mn
Engine rotation speed - rpmFig.(6): Variation of Brake Power with engine speed.
FO
CAO
PAO
FARM MACHINERY AND POWER
Misr J. Ag. Eng., April 2014 - 413 -
Buyukkaya (2010) pointed to the higher viscosity of biodiesel fuels, which
may affect the engine brake effective power and engine torque especially at
full-load conditions, increases the fuel momentum and consequently
penetration depth in-cylinder. On the other hand, the higher viscosity and
surface tension of biodiesel fuels prevent their sufficient breaking during
injection process.
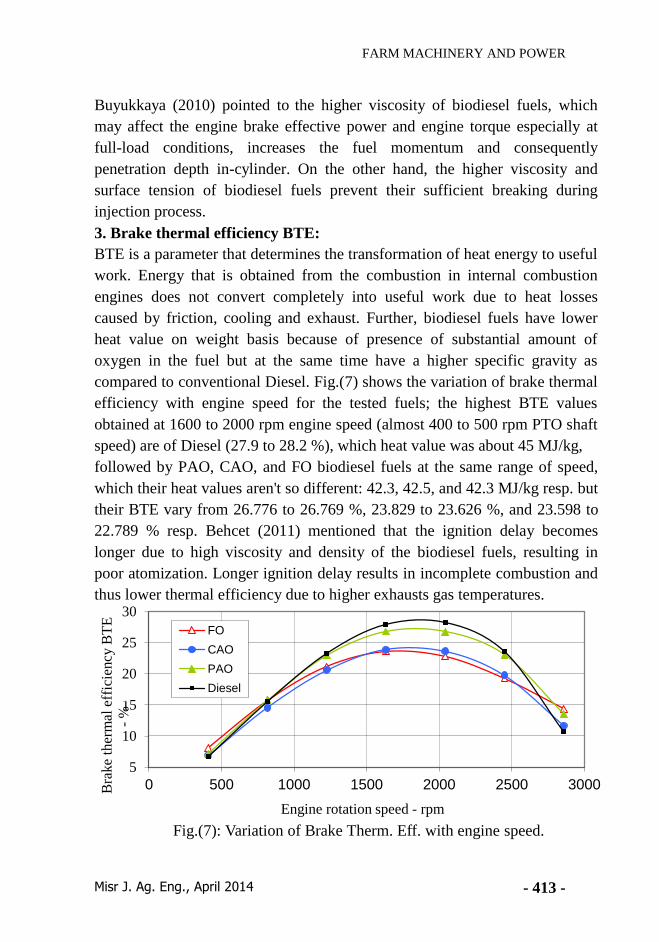
3. Brake thermal efficiency BTE:
BTE is a parameter that determines the transformation of heat energy to useful
work. Energy that is obtained from the combustion in internal combustion
engines does not convert completely into useful work due to heat losses
caused by friction, cooling and exhaust. Further, biodiesel fuels have lower
heat value on weight basis because of presence of substantial amount of
oxygen in the fuel but at the same time have a higher specific gravity as
compared to conventional Diesel. Fig.(7) shows the variation of brake thermal
efficiency with engine speed for the tested fuels; the highest BTE values
obtained at 1600 to 2000 rpm engine speed (almost 400 to 500 rpm PTO shaft
speed) are of Diesel (27.9 to 28.2 %), which heat value was about 45 MJ/kg,
followed by PAO, CAO, and FO biodiesel fuels at the same range of speed,
which their heat values aren't so different: 42.3, 42.5, and 42.3 MJ/kg resp. but
their BTE vary from 26.776 to 26.769 %, 23.829 to 23.626 %, and 23.598 to
22.789 % resp. Behcet (2011) mentioned that the ignition delay becomes
longer due to high viscosity and density of the biodiesel fuels, resulting in
poor atomization. Longer ignition delay results in incomplete combustion and
thus lower thermal efficiency due to higher exhausts gas temperatures.
5
10
15
20
25
30
0 500 1000 1500 2000 2500 3000Bra
ke
ther
mal
eff
icie
ncy
BT
E
-%
mn
Engine rotation speed - rpm
Fig.(7): Variation of Brake Therm. Eff. with engine speed.
FO
CAO
PAO
Diesel
FARM MACHINERY AND POWER
Misr J. Ag. Eng., April 2014 - 414 -
The main reasons for lower thermal efficiency are the lower effective power,
higher fuel consumption and lower calorific values of biodiesel fuels in
comparison to conventional Diesel fuel.
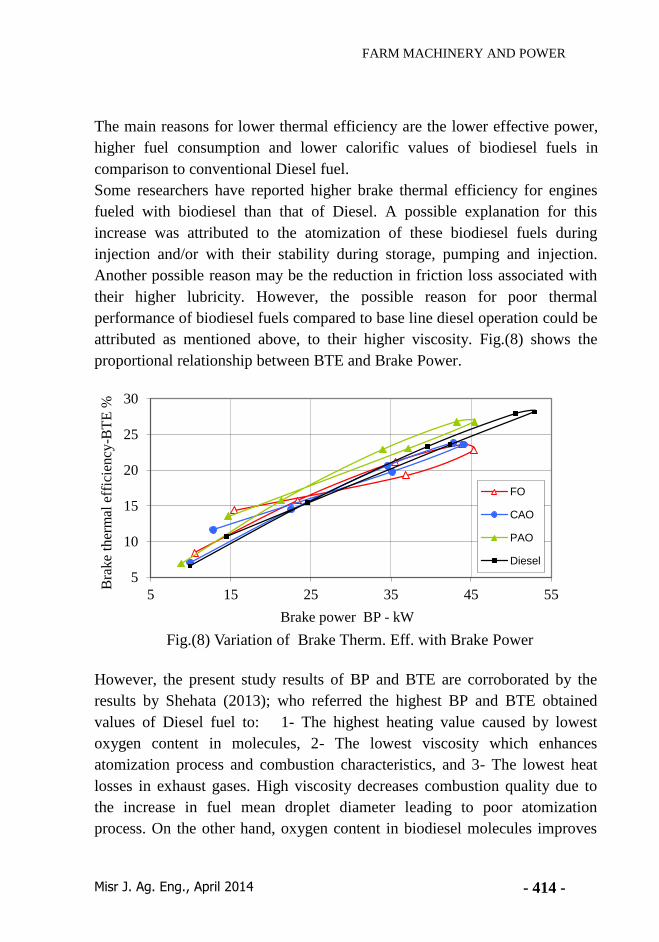
Some researchers have reported higher brake thermal efficiency for engines
fueled with biodiesel than that of Diesel. A possible explanation for this
increase was attributed to the atomization of these biodiesel fuels during
injection and/or with their stability during storage, pumping and injection.
Another possible reason may be the reduction in friction loss associated with
their higher lubricity. However, the possible reason for poor thermal
performance of biodiesel fuels compared to base line diesel operation could be
attributed as mentioned above, to their higher viscosity. Fig.(8) shows the
proportional relationship between BTE and Brake Power.
However, the present study results of BP and BTE are corroborated by the
results by Shehata (2013); who referred the highest BP and BTE obtained
values of Diesel fuel to: 1- The highest heating value caused by lowest
oxygen content in molecules, 2- The lowest viscosity which enhances
atomization process and combustion characteristics, and 3- The lowest heat
losses in exhaust gases. High viscosity decreases combustion quality due to
the increase in fuel mean droplet diameter leading to poor atomization
process. On the other hand, oxygen content in biodiesel molecules improves
5
10
15
20
25
30
5 15 25 35 45 55
Bra
ke
ther
mal
eff
icie
ncy
-BT
E %
Brake power BP - kW
Fig.(8) Variation of Brake Therm. Eff. with Brake Power
FO
CAO
PAO
Diesel
FARM MACHINERY AND POWER
Misr J. Ag. Eng., April 2014 - 415 -
combustion quality and decreases heat of combustion. So, the drop in BP and
BTE with biodiesel fuels prove that their poor combustion characteristics due
to high viscosity and poor volatility overcomes the effect of excess oxygen
content in biodiesel molecules. The mass flow rates of biodiesel fuels are
higher than diesel but the heat value of diesel fuel is higher than biodiesel
fuels. So, the effect of heat value magnitude of diesel fuel overcomes the
effect of biodiesel fuels mass flow rate magnitude and the net result is
decreasing BP of biodiesel fuels than diesel fuel.
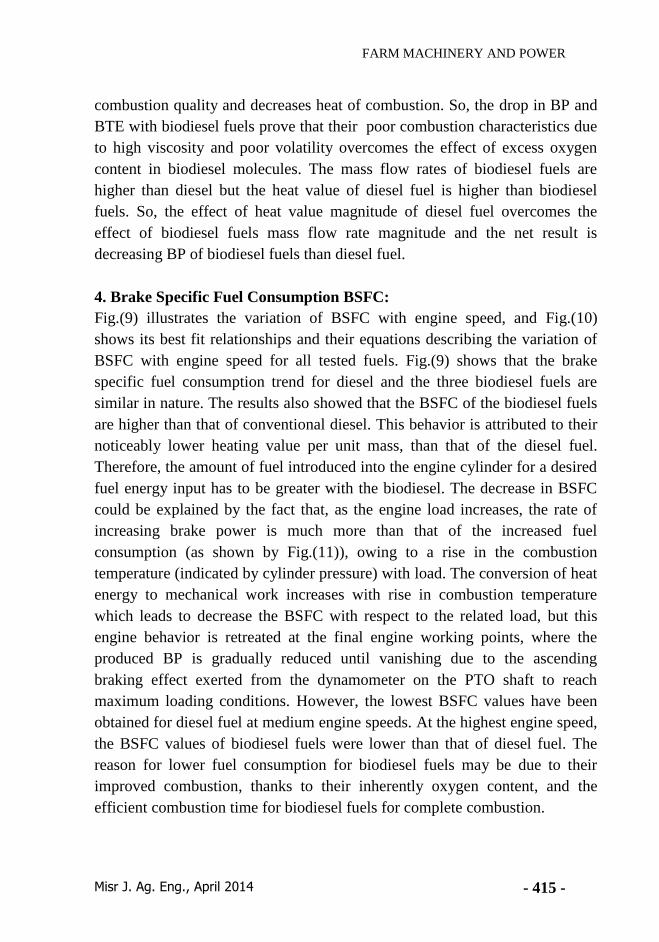
4. Brake Specific Fuel Consumption BSFC:
Fig.(9) illustrates the variation of BSFC with engine speed, and Fig.(10)
shows its best fit relationships and their equations describing the variation of
BSFC with engine speed for all tested fuels. Fig.(9) shows that the brake
specific fuel consumption trend for diesel and the three biodiesel fuels are
similar in nature. The results also showed that the BSFC of the biodiesel fuels
are higher than that of conventional diesel. This behavior is attributed to their
noticeably lower heating value per unit mass, than that of the diesel fuel.
Therefore, the amount of fuel introduced into the engine cylinder for a desired
fuel energy input has to be greater with the biodiesel. The decrease in BSFC
could be explained by the fact that, as the engine load increases, the rate of
increasing brake power is much more than that of the increased fuel
consumption (as shown by Fig.(11)), owing to a rise in the combustion
temperature (indicated by cylinder pressure) with load. The conversion of heat
energy to mechanical work increases with rise in combustion temperature
which leads to decrease the BSFC with respect to the related load, but this
engine behavior is retreated at the final engine working points, where the
produced BP is gradually reduced until vanishing due to the ascending
braking effect exerted from the dynamometer on the PTO shaft to reach
maximum loading conditions. However, the lowest BSFC values have been
obtained for diesel fuel at medium engine speeds. At the highest engine speed,
the BSFC values of biodiesel fuels were lower than that of diesel fuel. The
reason for lower fuel consumption for biodiesel fuels may be due to their
improved combustion, thanks to their inherently oxygen content, and the
efficient combustion time for biodiesel fuels for complete combustion.
FARM MACHINERY AND POWER
Misr J. Ag. Eng., April 2014 - 416 -
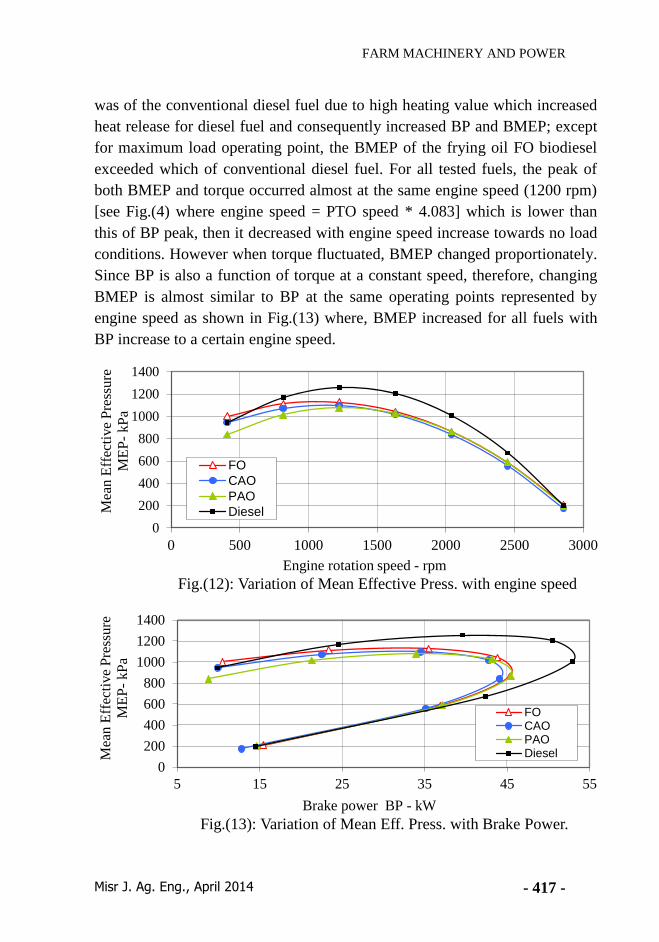
5. Brake Mean Effective Pressure BMEP:
Fig.(12) illustrates the calculated changes in BMEP, for all tested fuels from
no load to full load conditions expressed by engine speed. The highest BMEP
0.3
0.5
0.7
0.9
1.1
1.3
1.5
1.7
0 500 1000 1500 2000 2500 3000
Bra
ke
Sp
ecif
ic F
uel
Co
ns.
l/kW
.h
Engine rotation speed - rpm
Fig.(9) Brake Specific Fuel Consumption BSFC variation
with engine rotation speed, for all tested fuels.
FOCaOPaODiesel
yFO = 4E-07x2 - 0.0014x + 1.7305
R² = 0.9375
yCAO = 5E-07x2 - 0.0018x + 2.0007
R² = 0.9489
yPAO = 5E-07x2 - 0.002x + 2.182
R² = 0.9293
yDiesel = 6E-07x2 - 0.0021x + 2.0954
R² = 0.9411
0.1
0.3
0.5
0.7
0.9
1.1
1.3
1.5
0 500 1000 1500 2000 2500 3000
Bra
ke
Spec
ific
Fuel
Cons.
l/kW
.h
Engine rotation speed - rpm Fig.(10) Best fit of Brake Specific Fuel Consumption
variation with engine rotation speed, for all tested fuels.
FOCAOPAODiesel
0.3
0.5
0.7
0.9
1.1
1.3
1.5
1.7
5 10 15 20 25 30 35 40 45 50 55
Bra
ke
Sp
ecif
ic F
uel
Cons.
l/kW
.h
Engine brake power - kWFig.(11): Variation of Brake Specific Fuel Cons. BSFC
with engine Brake Power BP for all tested fuels.
FO
CAO
PAO
Diesel
FARM MACHINERY AND POWER
Misr J. Ag. Eng., April 2014 - 417 -
was of the conventional diesel fuel due to high heating value which increased
heat release for diesel fuel and consequently increased BP and BMEP; except
for maximum load operating point, the BMEP of the frying oil FO biodiesel
exceeded which of conventional diesel fuel. For all tested fuels, the peak of
both BMEP and torque occurred almost at the same engine speed (1200 rpm)
[see Fig.(4) where engine speed = PTO speed * 4.083] which is lower than
this of BP peak, then it decreased with engine speed increase towards no load
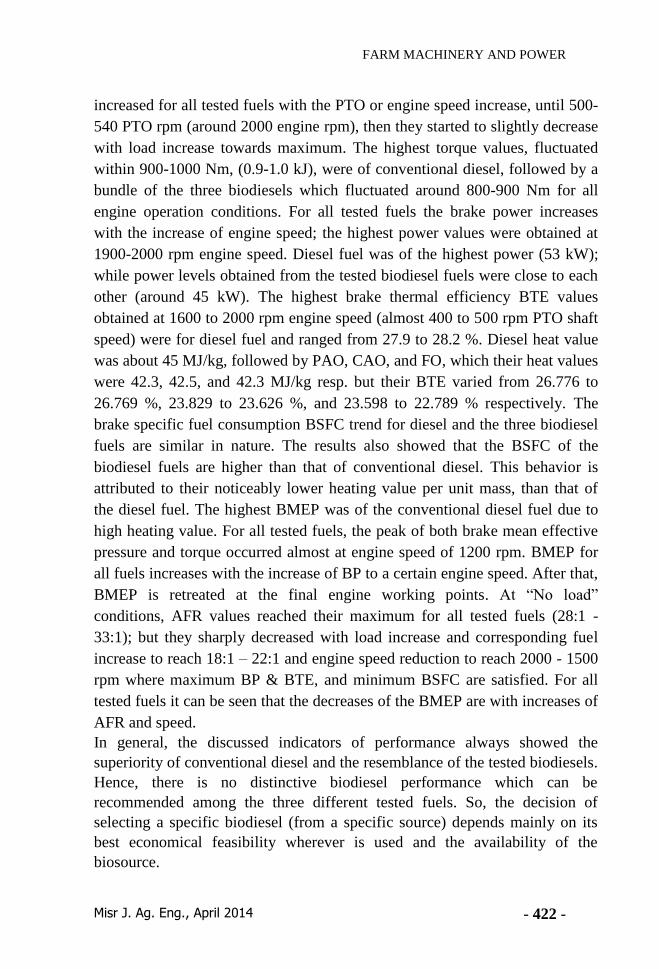
conditions. However when torque fluctuated, BMEP changed proportionately.
Since BP is also a function of torque at a constant speed, therefore, changing
BMEP is almost similar to BP at the same operating points represented by
engine speed as shown in Fig.(13) where, BMEP increased for all fuels with
BP increase to a certain engine speed.
0
200
400
600
800
1000
1200
1400
0 500 1000 1500 2000 2500 3000
Mea
n E
ffec
tive
Pre
ssure
ME
P-
kP
a
Engine rotation speed - rpm
Fig.(12): Variation of Mean Effective Press. with engine speed
FO
CAO
PAO
Diesel
0
200
400
600
800
1000
1200
1400
5 15 25 35 45 55
Mea
n E
ffec
tive
Pre
ssu
re
ME
P-
kP
a
Brake power BP - kW
Fig.(13): Variation of Mean Eff. Press. with Brake Power.
FOCAOPAODiesel

FARM MACHINERY AND POWER
Misr J. Ag. Eng., April 2014 - 418 -
After that, BMEP is retreated at the final engine working points, where the
produced BP is gradually reduced until vanishing at lowest engine speed.
6. Air Fuel Ratio AFR:
The actual air volume flow rate consumed with all tested fuels, was estimated
based on the standard evaluation taken from Gupta (2009), for both of air/fuel
ratio AFR, and volumetric efficiency ηv. The nature of each is explained as
follows:
For a given engine speed, the supply of air in the engine is almost constant and
does not depend upon the engine load. This engine may be termed a constant
air supply engine. With the change in load the quantity of fuel is changed,
which alters the AFR. As the load increases, more fuel is used. The overall
AFR may vary from 100:1 at no load to 20:1 at full load. On the other hand,
this constant air supply at any defined engine speed is completely based on
another parameter which is the ηv.
ηv: Is simply the efficiency of the engine cylinders fullness with air. ηv is a
measure of the effectiveness of an engine process. It is affected by many
variables such as compression ratio, valve timing, induction and port design,
mixture strength, latent heat of evaporation of the fuel, heating of the
induced charge, cylinder pressure, and the atmospheric conditions. The most
influencing variable is the induction system components, which directly
restrict the amount of air that an engine of given displacement can induct. ηv
is only used with four- stroke cycle engines which have a distinct induction
process. ηv of a normally aspirated engine is the ratio of the actual volume
flow rate of air entering the engine cylinder va at the atmospheric pressure
and temperature conditions surrounding the engine to the rate at which the
volume is displaced by the piston (swept volume) vs , while ηv of a
supercharged engine is based on the intake manifold pressure and
temperature conditions. Using forced induction, such as supercharging or
turbo charging, can easily pushes the ηv up to 120% or more.
The variation of ηv with engine speed presented by Gupta (2009) is shown in
Fig.(14); this relationship is assumed applicable for KUBOTA tractor
supercharged engine utilized in this study, with replacing its engine speed
limits (from 0 to 6000 rpm) on x-axis, by the KUBOTA tractor engine speed
range (from 0 to 3000 rpm). Then, on the basis of the above justification, all
vertical coordinates of the original relationship were adapted by increasing
them with a minimum amount of 20%, to reach an assumed relevant ηv level

FARM MACHINERY AND POWER
Misr J. Ag. Eng., April 2014 - 419 -
to represent the KUBOTA tractor supercharged engine performance
illustrated by Fig.(15). However, the ηv is maximum at a certain engine
speed and decreases at both higher and lower speeds. Shehata (2013)
measured ηv when using biodiesel fuels prepared from cotton seed oil, palm
oil and flax oil. He commonly found that ηv for the different fuels decreased
with the increase of engine speed due to the increase in air entering the
engine cylinder with decrease suction pressure. But the rate of increasing air
mass flow rate was lower than the rate of increasing engine speed, so, ηv
decreases with the increase of engine speed. Further increase in engine speed
does not increase air flow rate significantly so ηv decreases sharply. This
sharp decrease happens due to high speed is accompanied by heating of
charge in the inlet manifold and high friction flow losses which increases as
the square of engine speed. At high engine speeds and loads, engine elements
40
50
60
70
80
90
0 1000 2000 3000 4000 5000 6000 7000Vo
lum
etri
c ef
fici
ency
-η
v %
Engine rotation speed - rpm
Fig.(14): ηv as a function of engine speed from Gupta (2009)
normal. aspirated eng.
y = -1E-05x2 + 0.0312x + 60.8
R² = 0.9978
35
45
55
65
75
85
95
105
0 500 1000 1500 2000 2500 3000 3500
Vo
lum
etri
c ef
fici
ency
-η
v %
KUBOTA tractor superch. engine rotation speed - rpm
Fig.(15): adapted ηv from Gupta (2009) vs. superch.eng.speed.
normal.aspiratedeng.

FARM MACHINERY AND POWER
Misr J. Ag. Eng., April 2014 - 420 -
have high temperature causes air density to decrease which decreases ηv for
all tested fuels. He also found that diesel fuel had higher ηv than biodiesel
fuels due to higher air flow rate entering to engine cylinder.
AFR is calculated at all operating points similarly as done with all of the
above indicators. Fig.(16) shows the variation of AFR with engine speed. At
test beginning, the tractor engine is set at full throttle position without any
load, then the dynamometer is gradually started to exert loading on PTO shaft
while engine is freely running at maximum rotation speed. At “No load”
conditions, AFR values reached their maximum for all tested fuels (28:1 -
33:1) despite the diminishing ηv in this stage; this can be referred to the little
amount of fuel used under no load conditions; but they sharply decreased with
load increase and corresponding fuel increase to reach 18:1 – 22:1. The
ascended load caused more fuel consumption, and engine speed reduction to
reach 2000 - 1500 rpm where maximum BP & BTE, minimum BSFC, are
satisfied under maximum ηv, and decreased AFR. The ascended load
continuation leads to more of AFR decrease until reaching its minimum at full
load conditions which almost braked engine speed due the braking effect of
dynamometer loading, which in turn:
1) reduced the amount of fuel used
2) significantly reduced the air flow rate due to the sharp reduction in engine
speed and the corresponding low ηv in this stage.
The AFR level of the conventional diesel along the whole engine speed range
wasn’t the highest as it usually was in the precedent engine performance
characteristics. The biodiesel from palm oil was of the highest AFR. However
0
5
10
15
20
25
30
35
0 500 1000 1500 2000 2500 3000
Air
/ F
uel
rat
io -
AF
R
Engine rpm
Fig.(16): Variation of AFR with engine speed .
DieselPAOCAOFO

FARM MACHINERY AND POWER
Misr J. Ag. Eng., April 2014 - 421 -
the general behavior of AFR shown in this study for all tested fuels was in
good corroboration with which was described by Gupta (2009). Mohammadi
et al.(2012) pointed to that poor ratio of fuel to air (which is high AFR) was
more visible at higher engine speeds, and increasing torque resulted in poor
AFR, which is also in good corroboration with the present study results; while
Shehata (2013) presented an inverse AFR relationship to that of the present
study, with engine speed where AFR decreased with increasing engine speed.
This could probably be referred to accelerating the engine from idle to
maximum speed under constant load, since he stated that for different fuels, as
mass of fuel increases engine speed increases due to increase in heat
generation. Fig.(17) shows the effect of AFR on the BMEP.
The AFR was varied from AFR =4.25:1 based on mass to a very lean limit
AFR =33:1 and engine speed varied from 400 to 2800 rpm. For all tested fuels
it can be seen that the decreases of the BMEP are with increases of AFR and
speed. It is obvious that the BMEP falls with a nonlinear behavior from the
richest condition where AFR is 4.25:1 to the leanest condition where the AFR
is 33:1. Leaving lean operating conditions (BMEP = 143 to 172 kPa), the
engine power was decreasing from its maximum at lower speed 1000 to 1500
rpm (BMEP =834 to 985kPa).
4. CONCLUSIONS
The performance of a KUBOTA 67 kW tractor diesel engine has been tested
with diesel fuel and three different biodiesels prepared from waste frying oil,
palm oil and castor oil. The results were very comparable. Torque values
100
300
500
700
900
1100
0 5 10 15 20 25 30 35Bra
ke
Mea
n E
ff. P
res.
BM
EP
-kP
a
air/fuel ratio - AFR
Fig.(17): Variation of BMEP with AFR
FO
CAO
FARM MACHINERY AND POWER
Misr J. Ag. Eng., April 2014 - 422 -
increased for all tested fuels with the PTO or engine speed increase, until 500-
540 PTO rpm (around 2000 engine rpm), then they started to slightly decrease
with load increase towards maximum. The highest torque values, fluctuated
within 900-1000 Nm, (0.9-1.0 kJ), were of conventional diesel, followed by a
bundle of the three biodiesels which fluctuated around 800-900 Nm for all
engine operation conditions. For all tested fuels the brake power increases
with the increase of engine speed; the highest power values were obtained at
1900-2000 rpm engine speed. Diesel fuel was of the highest power (53 kW);
while power levels obtained from the tested biodiesel fuels were close to each
other (around 45 kW). The highest brake thermal efficiency BTE values
obtained at 1600 to 2000 rpm engine speed (almost 400 to 500 rpm PTO shaft
speed) were for diesel fuel and ranged from 27.9 to 28.2 %. Diesel heat value
was about 45 MJ/kg, followed by PAO, CAO, and FO, which their heat values
were 42.3, 42.5, and 42.3 MJ/kg resp. but their BTE varied from 26.776 to
26.769 %, 23.829 to 23.626 %, and 23.598 to 22.789 % respectively. The
brake specific fuel consumption BSFC trend for diesel and the three biodiesel
fuels are similar in nature. The results also showed that the BSFC of the
biodiesel fuels are higher than that of conventional diesel. This behavior is
attributed to their noticeably lower heating value per unit mass, than that of
the diesel fuel. The highest BMEP was of the conventional diesel fuel due to
high heating value. For all tested fuels, the peak of both brake mean effective
pressure and torque occurred almost at engine speed of 1200 rpm. BMEP for
all fuels increases with the increase of BP to a certain engine speed. After that,
BMEP is retreated at the final engine working points. At “No load”
conditions, AFR values reached their maximum for all tested fuels (28:1 -
33:1); but they sharply decreased with load increase and corresponding fuel
increase to reach 18:1 – 22:1 and engine speed reduction to reach 2000 - 1500
rpm where maximum BP & BTE, and minimum BSFC are satisfied. For all
tested fuels it can be seen that the decreases of the BMEP are with increases of
AFR and speed.
In general, the discussed indicators of performance always showed the
superiority of conventional diesel and the resemblance of the tested biodiesels.
Hence, there is no distinctive biodiesel performance which can be
recommended among the three different tested fuels. So, the decision of
selecting a specific biodiesel (from a specific source) depends mainly on its
best economical feasibility wherever is used and the availability of the
biosource.
FARM MACHINERY AND POWER
Misr J. Ag. Eng., April 2014 - 423 -
5. REFERENCES
Agarwal, D. and A. K. Agarwal, 2007 . Performance and emission
characteristics of Jatropha oil (preheated and blends) in a direct
injection compression ignition engine. Applied Thermal Eng.
27(13), 2314 – 2323.
Baiju, B.; M.K. Naik, and L.M. Das, 2009 . A comparative evaluation of
compression ignition engine characteristics using methyl and ethyl
esters of Karanja oil, ,Renewable Energy 34 , 1616-1621.
Barsin, N. J.; A. L. Humke, and J. Deere, 1981. Performance and
emission characteristics of a naturally aspirated diesel engine with
vegetable oil fuels.SAE 810262, SAE 810955,.
Behcet, R., 2011. Performance and emission study of waste anchovy fish
biodiesel in a diesel engine, Fuel Processing Technology Vol 92,
Iss 6, June, Pages 1187–1194
Buyukkaya, E., 2010 . "Effects of biodiesel on a DI diesel engine
performance, emission and combustion characteristics”, Fuel, 89,
pp. 3099– 3105.
Gupta, H.N., 2009. Fundamental of Internal Combustion Engines. ,
ISBN-978-81-203-2854-9
Krawczyk, T., 1996. Biodiesel Alternative fuel makes inroads but hurdles
remain. INFORM 7, 801:829.
Mohammadi, P.; A. M. Nikbakht, M. Tabatabaei, and K. Farhadi, 2012
Experimental investigation of performance and emission
characteristics of DI. Energy, 46 , 596e605.
Otera, J., 1993. Transesterification Chem Rev;93(4):1449–70.
Reed, T. B.; M. S. Graboski, and S. Gaur, 1991 Development and
commercialization of oxygenated diesel fuels from waste vegetable
oils. Energy from Biomass and Wastes. 907-914.
Shahid, E. M. and J. Jamal, 2011 Production of biodiesel : a technical
review. Renew Sustain Energy Rev ;15(9):4732–45.
Shehata, M.S., 2013 Emissions, performance and cylinder pressure of
diesel engine fuelled by biodiesel fuel. Fuel .
Saka, S. and D. Kusdiana, 2001 Biodiesel fuel from rapeseed oil as
prepared in supercritical methanol. Fuel ;80:225–31.
Staat, F. and E. Vallet, 1994. Vegetable oil methyl ester as a diesel
substitute. Chem Ind, 863–856.
FARM MACHINERY AND POWER
Misr J. Ag. Eng., April 2014 - 424 -
Zhang, Y.; M.A. Dube, and M. Kates, 2003. Biodiesel production from
waste cooking oil: Economic assessment and sensitivity analysis,
Bioresour Technol, 90: 229–240.
الملخص العربي
مختلفةمنفردة مصادر ثلاثة من وقود حيوي باستخدام جرارلل الديزلداء محرك أتقيم
3عادل احمد عبد الهادي الجوادي /د 2 د/ هيثم حسين يوسف محمد 1احمد السيد علي جمعه /ا.د
4يمناف ذياب فندي العصيبم/
ثلاثة كميات منفردة من وقود الديزل و باستخدامكيلوواط 76 قدرتهزراعي تم اختبار جرار
قيم عزم وجد ان ، وزيت النخيل وزيت الخروع.الهالكزيت القلي منمجهزة حيويال وقودال
مع زيادة سرعة المحرك، المختبر تزداد لجميع أنواع الوقود للجرار القدرةلعمود مأخذ الدوران
محرك(، لل دقيقة /دورة 0555دقيقة )حوالي / دورة 045 -055 خذ القدرةعمود مأ سرعة حتى
حوالي وقود الديزلل لمحركاعزم دوران لأعلى قيم ىتم الحصول عل تبدأ في الانخفاض قليلا. ثم
بلغت نيوتن.متر. 055حوالي الأداء ، و لمجموعة الوقود الحيوي المتقاربةنيوتن متر 1555
ىعلوكانت أ ،دقيقة /دورة 0555 ىال1055عند سرعة المحرك من يةالفرملقيم للقدرة ىقصأ
أصناف من ناتجةال درةكيلوواط، في حين كانت مستويات الق 05 حوالي وقود الديزل من هي قدرة
كفاءة للكيلوواط(. وكانت أعلى قيم 40وقود الديزل الحيوي قريبة من بعضها البعض )حوالي
055-455)تقريبا دقيقة /دورة 0555الي 1755 من سرعة المحركعند الفرملية الحرارية
يةيمة الحرارقال ذو وقود الديزلل ٪02.0-06.0 هي ما بين (الخلفي الإدارةلعمود دقيقة /دورة
و هي الزيت الهالك، وزيت الخروع ، زيت النخيل ليها يرام، ج/ كيلو ميجا جول 40حوالي
هم الكفاءة الحرارية الفرملية ل أما. على التوالي رامج/ كيلوميجا جول 40.5، و 40.0، 40.5
٪00,620-05,002، و٪05,707-05,200، ٪07,670-07,667 ت على النحو الآتي:ختلفا
أعلى الثلاثة صنافهبأالحيوي لديزلالوقود الاستهلاك النوعي أظهرت النتائج أن و - على التوالي
نظرا لانخفاض قيمتهم الحرارية. من الديزل التقليدي
الوقود المختبر أنواعالنوعي لجميع الاستهلاكمعدل والقدرة الفرملية قاتعلاو قد وجد أن
كانت لوقود الديزل. لمتوسط الضغط الفرملي الفعال قيمة ىعلأ إن. و قد وجد اتجاهاتهاي ف ماثلةمت
عند سرعة ، تحدثاالعزم و متوسط الضغط الفرملي الفعاللكل أنواع الوقود المختبرة كانت قمتي و
لجميع أنواع الوقود يزيد مع متوسط الضغط الفرملي الفعال. / دقيقةدورة 1055دورانية للمحرك
متوسط الضغط الفرملي الفعال عند المحرك. بعد ذلك، تراجع اتلبعض سرع القدرة الفرمليةزيادة
جميع في الهواء للوقودلنسبة ةقيم أقصيعند ظروف اللاحمل كانت .النهائية محركال تشغيل نقاط
، ولكنها انخفضت بشكل حاد مع زيادة الحمل وما يقابلها من زيادة 1:55 - 1:02من أنواع الوقود
كتلةعلى أساس ال1:4.00 نم نسبة الهواء للوقودوقد تباينت .1 :00 - 1 :12 إلى صلتالوقود ل
دقيقة. دورة / 0255 -455 منسرعة المحرك مع تغير 1:55إلى
ج.م.ع. -جامعة الإسكندرية –كلية الزراعة، سابا باشا -أستاذ الهندسة الزراعية المتفرغ - 1
ج.م.ع. - جامعة الإسكندرية –سابا باشا ،كلية الزراعة -مدرس الهندسة الزراعية - 2
ج.م.ع. - الزراعة وزارة - بحوث الهندسة الزراعية معهد - باحث أول -3
.العراق –وزارة الزراعة وافد من –ج.م.ع. -جامعة الإسكندرية –دارس لدرجة الماجستير بكلية الزراعة، سابا باشا -4