Evaluation of the State Ambulatory Surgery Databases - HCUP
68
HCUP Methods Series
Transcript of Evaluation of the State Ambulatory Surgery Databases - HCUP
HCUP Methods Series
kbr33831
Contact Information:
Healthcare Cost and Utilization Project (HCUP) Agency for Healthcare Research and Quality
540 Gaither Road Rockville, MD 20850
http://www.hcup-us.ahrq.gov
For Technical Assistance with HCUP Products:
Email: [email protected]
or
Phone: 1-866-290-HCUP
Recommended Citation: Senathirajah M, Preti L, Sun C. Evaluation of the State Ambulatory Surgery Databases, Available through the HCUP Central Distributor, 2009. ONLINE January 3, 2012. U.S. Agency for Healthcare Research and Quality. Available: http://www.hcup-us.ahrq.gov/reports/methods/methods.jsp.
HCUP (09/23/11) 2009 CD SASD Comparison Report
TABLE OF CONTENTS
EXECUTIVE SUMMARY ............................................................................................................... I
INTRODUCTION .......................................................................................................................... II
PART I: OVERVIEW OF THE SASD-CD ..................................................................................... 1
Introduction ............................................................................................................................. 1
Data Sources .......................................................................................................................... 1
Defining Ambulatory Surgery in the SASD-CD ....................................................................... 2
Hospital-Owned and Non-Hospital-Owned Facilities .............................................................. 3
Understanding Records Not Classified as Ambulatory Surgery .............................................. 8
PART II: UNDERSTANDING AMBULATORY SURGERY RECORDS AND FACILITIES CONTAINED IN THE 2009 SASD-CD ....................................................................................... 12
Introduction ........................................................................................................................... 12
Comparative Ambulatory Surgery Database ......................................................................... 12
Comparisons between the SASD-CD and the AHA Annual Survey Data ............................. 13
Types of Procedure Categories Defined as Ambulatory Surgery in the 2009 SASD-CD by Coding System ...................................................................................................................... 17
Comparisons between ICD-9-CM Codes and CPT Codes ................................................... 20
CONCLUSION ............................................................................................................................ 22
APPENDIX A: COMPARISON OF ICD-9-CM AND CPT PROCEDURE CODE USE BY SELECT STATE ....................................................................................................................... A-1
APPENDIX B: COMPARISON OF ICD-9-CM AND CPT PROCEDURE CODE USE BY BODY SYSTEM BY STATE ................................................................................................................ B-1

HCUP (09/23/11) 2009 CD SASD Comparison Report
INDEX OF TABLES
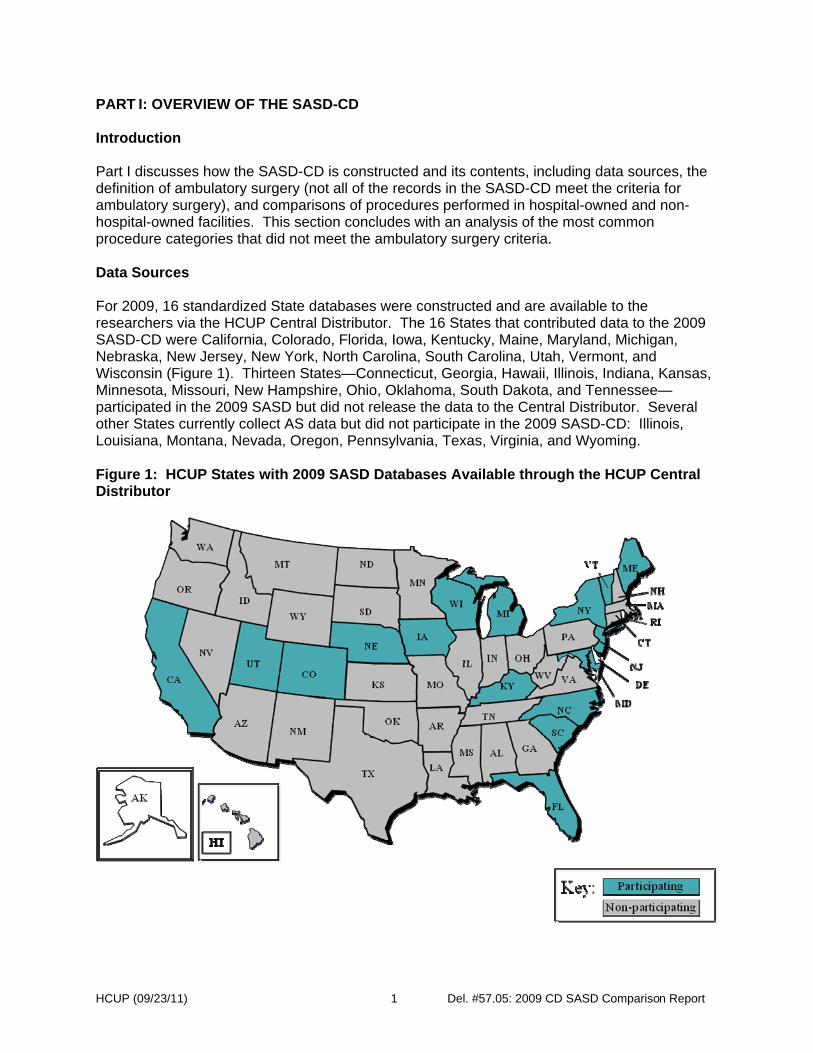
Figure 1: HCUP States with 2009 SASD Databases Available through the HCUP Central Distributor .............................................................................................................................. 1
Table 1: Types of Ambulatory Surgery Facilities .......................................................................... 3
Table 2: Number of Hospital-Owned and Non-Hospital-Owned Facilities by State Available through the HCUP Central Distributor, 2009 SASD-CD ........................................................ 6
Table 3: Number of Records in Both the 2009 SASD-CD and SEDD by State and Proportion of Ambulatory Surgeries in Both Databases .............................................................................. 7
Table 4: Top 20 Procedure Categories (CCS) from ICD-9-CM Codes for Non-Ambulatory Surgeries in Hospital-Owned and Non-Hospital-Owned Facilities, 2009 SASD-CD ............. 9
Table 5: Top 20 Procedure Categories (CCS) from CPT Codes for Non-Ambulatory Surgeries in Hospital-Owned and Non-Hospital-Owned Facilities, 2009 SASD-CD ................................ 11
Table 6: Number of Facilities and Surgical Visits by State and Data Source Available through the HCUP Central Distributor, 2009 SASD-CD Ambulatory Surgeries ................................ 14
Table 7: Number of ICD-9-CM and CPT Procedure Codes by CCS Hospital-Owned Facilities, 2009 SASD-CD Ambulatory Surgery Records .................................................................... 18
Table 8: Number of ICD-9-CM and CPT Surgeries by CCS Procedure Category in Non-Hospital-Owned Facilities, 2009 SASD-CD Ambulatory Surgeries .................................................... 19
Table A-1: Use of ICD-9-CM Procedure Codes and the CPT Procedure Codes Available through the HCUP Central Distributor, by State ................................................................ A-2
Table A-2: Percent of Surgical Visit Records by Coding System, ICD-9-CM and CPT Available through the HCUP Central Distributor, by State, 2009 SASD-CD, Among All Surgery Visits ........................................................................................................................................... A-3
Table A-3: Percent of Records with Matching CCS Categories Among All Surgical Visit Records with Dual Coding Available through the HCUP Central Distributor, by State, 2009 SASD-CD Ambulatory Surgeries ........................................................................................................ A-4
Table A-4: Percent of Surgical Visit Records with Matching CCS Categories from Among Surgical Visit Records with a Single Procedure Code of Each Type Available through the HCUP Central Distributor, 2009 SASD-CD Ambulatory Surgeries .................................... A-5
Table A-5: Pairing Between CCS ICD-9-CM and CCS CPT Categories for Top 10 ICD-9-CM Categories, Surgical Visit Records with a Single ICD-9-CM Code and a Single CPT Code Available through the HCUP Central Distributor, 2009 SASD-CD Ambulatory Surgeries . A-6
Table A-6: Pairing Between CCS CPT and CCS ICD-9-CM Categories for Top 10 CPT Categories, Surgical Visit Records with a Single ICD-9-CM Code and a Single CPT Code Available through the HCUP Central Distributor, 2009 SASD-CD Ambulatory Surgeries A-12
Table B-1: Number of Procedure Codes by State and Body System, ICD-9-CM CCS and CPT CCS Procedure Classification Available through the HCUP Central Distributor, 2009 SASD-CD Ambulatory Surgeries .................................................................................................. B-1
HCUP (09/23/11) i Del. #57.05: 2009 CD SASD Comparison Report
EXECUTIVE SUMMARY Overview This report provides an overview of the contents and uses of the Healthcare Cost and Utilization Project (HCUP) Central Distributor (CD) 2009 State Ambulatory Surgery Database (SASD) and compares the SASD-CD database to the 2009 American Hospital Association (AHA) Annual Survey. The 16 States that provided data for the 2009 SASD-CD are included in this comparison: California, Colorado, Florida, Iowa, Kentucky, Maine, Maryland, Michigan, Nebraska, New Jersey, New York, North Carolina, South Carolina, Utah, Vermont, and Wisconsin. This report provides information about the volume of records coming from hospital-owned and non-hospital-owned facilities, and also explores the types of procedures performed that qualify as ambulatory surgery, and the use of ICD-9-CM and CPT coding systems contained in the 2009 SASD. Key Findings The 2009 SASD-CD files contain 24,166,894 records from 16 HCUP States. Discharges with indications of outpatient surgery, according to AHRQ criteria, were classified as ambulatory surgeries. Of the total records contained in the SASD-CD, 65.1% (15,725,597) represent discharges for ambulatories per AHRQ criteria described in the “Defining Ambulatory Surgery in the SASD” section of this report. The total number of ambulatory surgery procedures decreased 2% from the 2008 total (15,760,446) from 16 participating states. There are a total of 2,823 ambulatory surgery facilities in the SASD files. A majority (67.0% or 1,893) of the facilities contributing data to the SASD-CD are hospital-owned. The States with the greatest number of facilities were Florida (588 or 20.8% of the total) and California (584 or 20.6% of the total). Comparisons between the SASD-CD and the AHA Annual Survey for these 16 States demonstrate that the SASD-CD contains a greater number of facilities and surgical visits. The AHA data contain information on hospital-owned ambulatory surgery facilities, whereas the SASD-CD includes data from non-hospital-owned facilities as well as hospital-owned facilities. This report demonstrates that the majority of ambulatory surgery is performed in one of five body systems: 47.1% of the total procedures in hospital-owned facilities are performed on the digestive, integumentary, musculoskeletal, cardiovascular, or eye systems (based on the ICD-9-CM procedure coding system). Two different coding systems are used in the SASD-CD; six States use only CPT codes, one State uses only ICD-9-CM codes, and nine States employ both codes. On average, the number of CPT procedure codes is higher (3.3 per record in the core file and 5.7 in the charge detail file) than the number of ICD-9-CM procedure codes (1.9) per record. Although there was general agreement between Clinical Classifications Software (CCS) categories for both systems, analysts should use caution when combining data across States which use different procedure coding systems.
HCUP (09/23/11) ii Del. #57.05: 2009 CD SASD Comparison Report
INTRODUCTION Motivation The last two decades have witnessed a steep rise in the number of surgical centers performing ambulatory surgeries: these facilities have increased from 336 in 1985 to 6,167 in 2009.1 In addition, ambulatory surgeries have become more common over the past two decades, with the number of ambulatory surgical centers in the U.S. rising in accord. For example, between 1988 and 2009, the number of ambulatory surgeries reported by Colorado, New Jersey, and New York rose from 0.9 million to 2,845,260.2 This dramatic growth in ambulatory surgeries and surgical centers was prompted by concern over rising health care costs and emerging medical technologies that made ambulatory surgery more practical and generally less expensive than inpatient surgery. Ambulatory surgery is defined herein as any surgical procedure performed on the same day a patient is admitted and released from a facility.3 Ambulatory surgery facilities incorporate both hospital-owned or non-hospital-owned surgical facilities. An ambulatory surgery visit refers to a record-level identification of ambulatory surgery visits. Multiple ambulatory surgery visits, as defined by an appropriate procedure code, may occur during the same ambulatory surgery visit (i.e., multiple procedure codes qualifying as ambulatory surgery may appear on the same record). In 1997, the Agency for Healthcare Research and Quality (AHRQ) began collecting ambulatory surgery (AS) data as part of the Healthcare Cost and Utilization Project (HCUP, pronounced “H-Cup”) and making public versions of these databases available via the HCUP Central Distributor (CD). The State Ambulatory Surgery Databases (SASD) are a powerful set of databases, from data organizations in participating States, that capture surgeries performed on the same day in which patients are admitted and released. The SASD-CD contains the ambulatory surgery encounter abstracts in participating States, translated into a uniform format to facilitate multi-State comparisons and analyses. All of the databases include abstracts from hospital-owned ambulatory surgery sites. Some contain the universe of ambulatory surgery encounter abstracts for that State, including records from both hospital-owned and non-hospital-owned facilities. The report also describes the composition of the 2009 SASD with respect to facilities performing ambulatory surgery, both hospital-owned and non-hospital-owned. The SASD-CD contain a core set of clinical and non-clinical information on all patients, regardless of payer, including persons covered by Medicare, Medicaid, private insurance, and the uninsured. The SASD-CD is well-suited for research that requires complete enumeration of hospital-owned ambulatory surgery within market areas or States. Researchers and policymakers use the SASD-CD to compare inpatient surgery data with ambulatory surgery data, conduct market area research or small area variation analyses, and identify State-specific trends in ambulatory surgery utilization, access, charges, and outcomes.
1Centers for Medicare & Medicaid Services. 2010 CMS Data Compendium. November 2010. Accessed at http://www.cms.gov/DataCompendium/14_2010_Data_Compendium.asp#TopOfPage on July 19, 2011.
2Number of visits in HCUP SASD files 2009. Accessed at http://www.hcup-us.ahrq.gov/. Data from author’s calculations on August
19, 2010.
3 State Ambulatory Surgery Databases. Accessed at http://www.hcup-us.ahrq.gov/sasdoverview.jsp on July 19, 2011.
HCUP (09/23/11) iii Del. #57.05: 2009 CD SASD Comparison Report
The first part (Part I) of this report contains an overview of the 2009 SASD-CD and focuses on the contents of the database. This part includes a comparison of the records captured in both the SASD-CD and State Emergency Department Databases (SEDD). It also presents information about the origins of records defined as ambulatory surgery and an analysis of the types of procedures defined as ambulatory surgery using the definition developed by AHRQ. The second part (Part II) includes an evaluation of the completeness of the 2009 SASD-CD with respect to ambulatory surgical facilities. The method used to accomplish this evaluation was to compare the SASD-CD with the American Hospital Association (AHA) Annual Survey data. This part also discusses the coding systems used, including the frequencies of ambulatory surgeries contained in the SASD-CD by body system. The report concludes with recommendations regarding the usefulness and potential research value of the 2009 SASD-CD.
HCUP (09/23/11) 1 Del. #57.05: 2009 CD SASD Comparison Report
PART I: OVERVIEW OF THE SASD-CD Introduction Part I discusses how the SASD-CD is constructed and its contents, including data sources, the definition of ambulatory surgery (not all of the records in the SASD-CD meet the criteria for ambulatory surgery), and comparisons of procedures performed in hospital-owned and non-hospital-owned facilities. This section concludes with an analysis of the most common procedure categories that did not meet the ambulatory surgery criteria. Data Sources For 2009, 16 standardized State databases were constructed and are available to the researchers via the HCUP Central Distributor. The 16 States that contributed data to the 2009 SASD-CD were California, Colorado, Florida, Iowa, Kentucky, Maine, Maryland, Michigan, Nebraska, New Jersey, New York, North Carolina, South Carolina, Utah, Vermont, and Wisconsin (Figure 1). Thirteen States—Connecticut, Georgia, Hawaii, Illinois, Indiana, Kansas, Minnesota, Missouri, New Hampshire, Ohio, Oklahoma, South Dakota, and Tennessee—participated in the 2009 SASD but did not release the data to the Central Distributor. Several other States currently collect AS data but did not participate in the 2009 SASD-CD: Illinois, Louisiana, Montana, Nevada, Oregon, Pennsylvania, Texas, Virginia, and Wyoming. Figure 1: HCUP States with 2009 SASD Databases Available through the HCUP Central Distributor
HCUP (09/23/11) 2 Del. #57.05: 2009 CD SASD Comparison Report
Defining Ambulatory Surgery in the SASD-CD Many States submit files that include a range of outpatient services, including but not limited to ambulatory surgery. For example, emergency department data is often combined with ambulatory surgery data. Records in the 2009 SASD-CD are defined in the same way as data in the 2004-2008 SASD-CD, which differs substantially from previous years. In an attempt to create uniformly defined outpatient databases, AHRQ approved, starting with the 2004 data, screening the outpatient data provided by the HCUP Partners and assigning records to the SASD-CD or State Emergency Department Databases (SEDD) based on information coded on the record. Records identified as having emergency department services4 were placed in the SEDD. All other records were placed in the SASD-CD. Therefore, the SASD-CD file can contain both records for ambulatory surgeries as well as records for other outpatient services. As this report indicates, States can vary greatly in the content of their outpatient file and the extent to which non-ambulatory surgery outpatient records are provided. The variable HCUP_AS is used to identify ambulatory surgery records within the SASD files. In addition, to ensure that all ambulatory surgery records were included in the SASD-CD, records satisfying the criteria for an ambulatory surgery were included in the SASD-CD files without regard to their origin in an ambulatory surgery or emergency department file. Those records that satisfied both ambulatory surgery and emergency department criteria were included in the SASD-CD files, as well as the SEDD files. Records included in the 2009 SASD-CD are derived from the UB04/CMS1450 forms for hospital-owned ambulatory centers and the CMS 1500 form for freestanding ambulatory surgery centers. Ambulatory surgery records (HCUP_AS>0) are defined based on at least one of the following criteria:
1) ICD-9-CM ranges included codes 00.50-86.99 (excluded were procedure codes in the range 88.4-88.59),
2) CPT procedures codes indicating surgery (yearly updates can be downloaded from Centers for Medicare and Medicaid Services (CMS) and generally include 10121-69930, G0105, G0121, and G0260),
3) Presence of at least one revenue center code in the following range 036x (operating room services), 037x (anesthesia), or 049x (ambulatory surgical care), or
4) Presence of a UB04 bill type of 83 indicating outpatient services.
All records in the SASD-CD not meeting the criteria for ambulatory surgery were designated with HCUP_AS=0.
4 Emergency department services met at least one of the following criteria: 1) emergency department revenue code of 450-459, 2) positive emergency department charge, when revenue center codes were not available, or 3) emergency department CPT code of 99281-99285.
HCUP (09/23/11) 3 Del. #57.05: 2009 CD SASD Comparison Report
Hospital-Owned and Non-Hospital-Owned Facilities Facilities that provide ambulatory surgery visits are classified into the following two types: Table 1: Types of Ambulatory Surgery Facilities
1 Hospital-Owned 2 Non-Hospital-Owned Hospital-owned facilities are identified through match to the AHA annual survey data. A facility in the SASD-CD is identified as hospital-owned if it can be matched to the AHA data by hospital identifier (IDNUMBER). Non-hospital-owned facilities are those facilities in the SASD-CD that could not be matched to the AHA survey by hospital identifier (IDNUMBER). Note that hospital-owned facilities may provide outpatient surgeries in dedicated AS units within the hospital, dedicated same-day surgery beds that use the IP OR, or have freestanding outpatient care centers, ambulatory surgery centers and/or hospital-based outpatient care services. While hospitals describe the outpatient surgeries services and facilities in the survey, they do not report what portion of their outpatient surgeries occur in each of these settings or facilities. The AHA survey provides only a single count of “outpatient surgical operations” at a hospital-level, defined as follows:
Outpatient surgical operation. For outpatient surgical operations, please record operations performed on patients who do not remain in the hospital overnight. Include all operations whether performed in the inpatient operating rooms or in procedure rooms located in an outpatient facility. Include an endoscopy only when used as operative tool and not when used for diagnosis alone. Count each patient undergoing surgery as one surgical operation regardless of the number of surgical procedures that were performed while the patient was in the operating or procedure room.
Counts of outpatient surgical operations are based on therapeutic procedures and are not specific to a unit or department within the hospital. Therefore, for hospital-owned facilities, the location of surgeries cannot be determined from the AHA data (i.e., same-day surgical units within hospital outpatient departments, ambulatory surgery centers, freestanding outpatient care centers and/or hospital-based outpatient care centers). Note that the AHA survey also asks whether the hospital provides outpatient surgery as a service, defined as follows:
Outpatient surgery. Scheduled surgical services provided to patients who do not remain in the hospital overnight. The surgery may be performed in operating suites also used for inpatient surgery, specially designated surgical suites for outpatient surgery, or procedure rooms within an outpatient care facility.
Hospitals are asked to report whether the outpatient surgery service is 1) owned or provided by my hospital or its subsidiary; 2) provided by my health system (in my local community); 3)
HCUP (09/23/11) 4 Del. #57.05: 2009 CD SASD Comparison Report
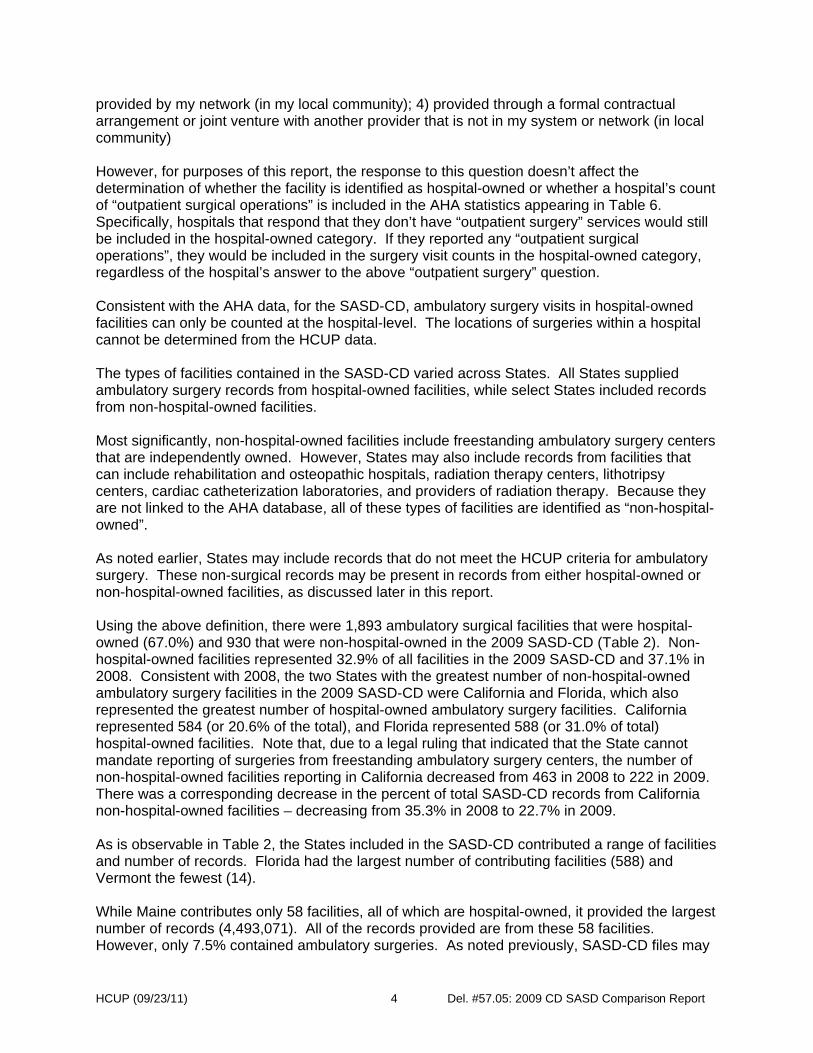
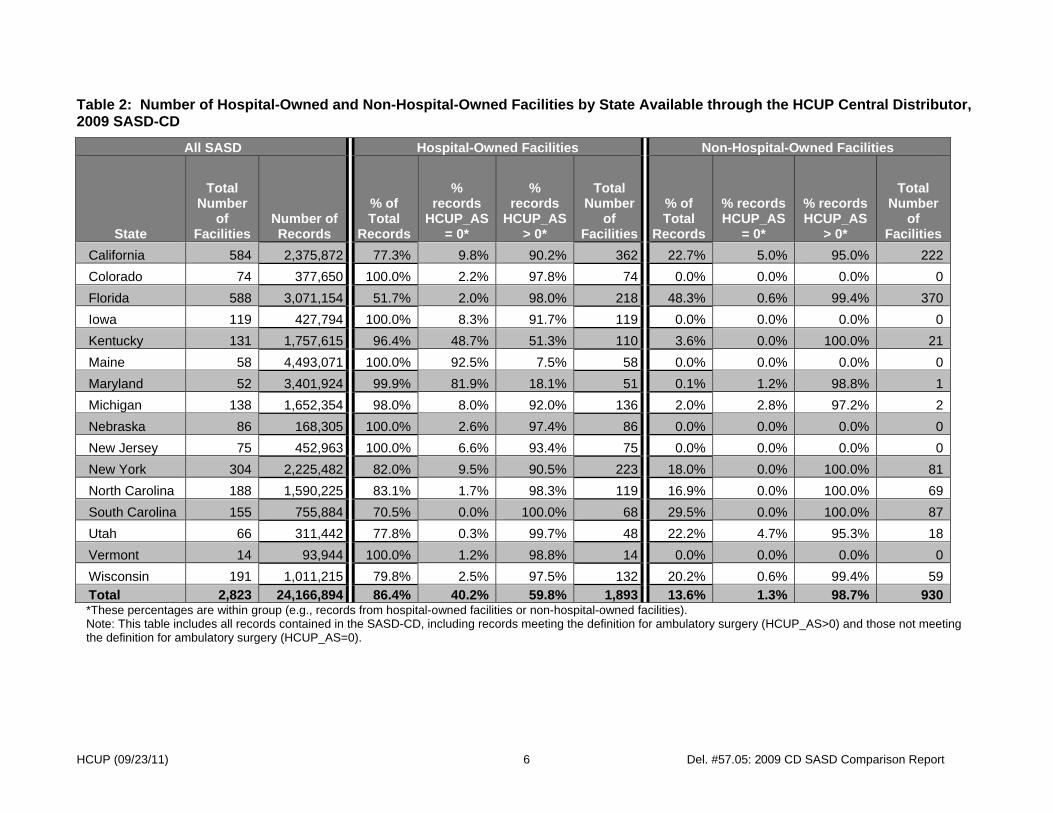
provided by my network (in my local community); 4) provided through a formal contractual arrangement or joint venture with another provider that is not in my system or network (in local community) However, for purposes of this report, the response to this question doesn’t affect the determination of whether the facility is identified as hospital-owned or whether a hospital’s count of “outpatient surgical operations” is included in the AHA statistics appearing in Table 6. Specifically, hospitals that respond that they don’t have “outpatient surgery” services would still be included in the hospital-owned category. If they reported any “outpatient surgical operations”, they would be included in the surgery visit counts in the hospital-owned category, regardless of the hospital’s answer to the above “outpatient surgery” question. Consistent with the AHA data, for the SASD-CD, ambulatory surgery visits in hospital-owned facilities can only be counted at the hospital-level. The locations of surgeries within a hospital cannot be determined from the HCUP data. The types of facilities contained in the SASD-CD varied across States. All States supplied ambulatory surgery records from hospital-owned facilities, while select States included records from non-hospital-owned facilities. Most significantly, non-hospital-owned facilities include freestanding ambulatory surgery centers that are independently owned. However, States may also include records from facilities that can include rehabilitation and osteopathic hospitals, radiation therapy centers, lithotripsy centers, cardiac catheterization laboratories, and providers of radiation therapy. Because they are not linked to the AHA database, all of these types of facilities are identified as “non-hospital-owned”. As noted earlier, States may include records that do not meet the HCUP criteria for ambulatory surgery. These non-surgical records may be present in records from either hospital-owned or non-hospital-owned facilities, as discussed later in this report. Using the above definition, there were 1,893 ambulatory surgical facilities that were hospital-owned (67.0%) and 930 that were non-hospital-owned in the 2009 SASD-CD (Table 2). Non-hospital-owned facilities represented 32.9% of all facilities in the 2009 SASD-CD and 37.1% in 2008. Consistent with 2008, the two States with the greatest number of non-hospital-owned ambulatory surgery facilities in the 2009 SASD-CD were California and Florida, which also represented the greatest number of hospital-owned ambulatory surgery facilities. California represented 584 (or 20.6% of the total), and Florida represented 588 (or 31.0% of total) hospital-owned facilities. Note that, due to a legal ruling that indicated that the State cannot mandate reporting of surgeries from freestanding ambulatory surgery centers, the number of non-hospital-owned facilities reporting in California decreased from 463 in 2008 to 222 in 2009. There was a corresponding decrease in the percent of total SASD-CD records from California non-hospital-owned facilities – decreasing from 35.3% in 2008 to 22.7% in 2009. As is observable in Table 2, the States included in the SASD-CD contributed a range of facilities and number of records. Florida had the largest number of contributing facilities (588) and Vermont the fewest (14). While Maine contributes only 58 facilities, all of which are hospital-owned, it provided the largest number of records (4,493,071). All of the records provided are from these 58 facilities. However, only 7.5% contained ambulatory surgeries. As noted previously, SASD-CD files may
HCUP (09/23/11) 5 Del. #57.05: 2009 CD SASD Comparison Report
contain hospital outpatient records beyond ambulatory surgery. Maine’s data includes a large number of outpatient services/procedures that occur in hospital-owned facilities but do not meet the HCUP criteria for ambulatory surgery. Vermont contributed the fewest records with 93,944, of which 98.8% met the ambulatory surgery definition. Of the total records coming from hospital-owned facilities included in the 2009 SASD-CD, 65.1% of records met the criteria for ambulatory surgeries (HCUP_AS>0), with the rest of the records not meeting the criteria for ambulatory surgeries (HCUP_AS=0). However, the proportion of records from hospital-owned facilities that qualified as ambulatory services varied by state. In 13 States: California, Colorado, Florida, Iowa, Michigan, Nebraska, New Jersey, New York, North Carolina, South Carolina, Utah, Vermont, and Wisconsin, over 90% of the records from hospital-owned facilities met the criteria for ambulatory surgery. In contrast, the percentage of AS qualifying records from non-hospital-owned facilities was consistently high (>95%) across all States that contributed non-hospital-owned data.
HCUP (09/23/11) Del. #57.05: 2009 CD SASD Comparison Report 6
Table 2: Number of Hospital-Owned and Non-Hospital-Owned Facilities by State Available through the HCUP Central Distributor, 2009 SASD-CD
All SASD Hospital-Owned Facilities Non-Hospital-Owned Facilities
State
Total Number
of Facilities
Number of Records
% of Total
Records
% records
HCUP_AS = 0*
% records
HCUP_AS > 0*
Total Number
of Facilities
% of Total
Records
% records HCUP_AS
= 0*
% records HCUP_AS
> 0*
Total Number
of Facilities
California 584 2,375,872 77.3% 9.8% 90.2% 362 22.7% 5.0% 95.0% 222
Colorado 74 377,650 100.0% 2.2% 97.8% 74 0.0% 0.0% 0.0% 0
Florida 588 3,071,154 51.7% 2.0% 98.0% 218 48.3% 0.6% 99.4% 370
Iowa 119 427,794 100.0% 8.3% 91.7% 119 0.0% 0.0% 0.0% 0
Kentucky 131 1,757,615 96.4% 48.7% 51.3% 110 3.6% 0.0% 100.0% 21
Maine 58 4,493,071 100.0% 92.5% 7.5% 58 0.0% 0.0% 0.0% 0
Maryland 52 3,401,924 99.9% 81.9% 18.1% 51 0.1% 1.2% 98.8% 1
Michigan 138 1,652,354 98.0% 8.0% 92.0% 136 2.0% 2.8% 97.2% 2
Nebraska 86 168,305 100.0% 2.6% 97.4% 86 0.0% 0.0% 0.0% 0
New Jersey 75 452,963 100.0% 6.6% 93.4% 75 0.0% 0.0% 0.0% 0
New York 304 2,225,482 82.0% 9.5% 90.5% 223 18.0% 0.0% 100.0% 81
North Carolina 188 1,590,225 83.1% 1.7% 98.3% 119 16.9% 0.0% 100.0% 69
South Carolina 155 755,884 70.5% 0.0% 100.0% 68 29.5% 0.0% 100.0% 87
Utah 66 311,442 77.8% 0.3% 99.7% 48 22.2% 4.7% 95.3% 18
Vermont 14 93,944 100.0% 1.2% 98.8% 14 0.0% 0.0% 0.0% 0
Wisconsin 191 1,011,215 79.8% 2.5% 97.5% 132 20.2% 0.6% 99.4% 59Total 2,823 24,166,894 86.4% 40.2% 59.8% 1,893 13.6% 1.3% 98.7% 930*These percentages are within group (e.g., records from hospital-owned facilities or non-hospital-owned facilities). Note: This table includes all records contained in the SASD-CD, including records meeting the definition for ambulatory surgery (HCUP_AS>0) and those not meeting the definition for ambulatory surgery (HCUP_AS=0).

HCUP (09/23/11) Del. #57.05: 2009 CD SASD Comparison Report 7
Table 3 compares the number of records from both hospital-owned and non-hospital-owned facilities that were found both in the SASD-CD and the SEDD, which represents 3.6% of the total SASD-CD records. All of the records in both databases came from hospital-owned facilities. Of the records that were found both in the SASD-CD and SEDD, 69.4% overall were classified as ambulatory surgery records. This percent varied by state; the records from Colorado, Nebraska, North Carolina, and South Carolina, and Utah were almost entirely ambulatory surgeries. However, fewer records (50% or fewer) from California, Iowa, Maine, Maryland, New Jersey, and Vermont were ambulatory surgeries.
Table 3: Number of Records in Both the 2009 SASD-CD and SEDD by State and Proportion of Ambulatory Surgeries in Both Databases
State
Total Number of Records in Both SASD
and SEDD Percent of
Total Records from
Hospital-Owned
Facilities Matched to SEDD in the
SASD
Number of both SASD and SEDD Records Identified with AS
Surgeries*
Percent of Records
Identified as AS
Surgeries* in Both SASD and SEDD
Number of Records
from Hospital-Owned
Facilities
Number of Records
from Non-Hospital-Owned
Facilities
California 7,059 0 0.3% 3,526 50.0%
Colorado 86,138 0 23.3% 86,060 99.9%
Florida 32,756 0 1.1% 28,027 85.6%
Iowa 1,076 0 0.3% 479 44.5%
Kentucky 295,205 0 31.6% 220,241 74.6%
Maine 43,715 0 13.0% 5,006 11.5%
Maryland 70,480 2,275 11.4% 30,186 41.5%
Michigan 316,091 0 20.8% 223,846 70.8%
Nebraska 4,351 0 2.7% 4,083 93.8%
New Jersey 14,043 0 3.3% 6,987 49.8%
New York 49,664 0 2.4% 37,883 76.3%
North Carolina 364,408 0 23.2% 357,063 98.0%
South Carolina 62,475 0 8.3% 62,468 100.0%
Utah 5,342 0 1.7% 5,338 99.9%
Vermont 270 0 0.3% 121 44.8%
Wisconsin 110,501 0 11.2% 92,944 84.1%Total 1,353,073 2,275 9.6% 1,071,314 69.4%
*HCUP_AS>0
HCUP (09/23/11) Del. #57.05: 2009 CD SASD Comparison Report 8
Understanding Records Not Classified as Ambulatory Surgery Understanding the types of procedures that are not classified as ambulatory surgery is important for research using the SASD-CD data. Table 4 is an analysis of the top procedure categories for records not classified as ambulatory surgery according to the aforementioned definition of ambulatory surgery5 (coded as HCUP_AS=0) which was conducted to learn more about these procedures. Because some States use both the ICD-9-CM and CPT coding system, AHRQ’s Clinical Classification Software (CCS) was employed in this analysis. The two versions of the CCS classifications, one for ICD-9-CM procedure codes and another for CPT procedure codes, are reported. The ICD-9-CM CCS program aggregates procedure codes into 231 mutually exclusive procedure categories. The CPT CCS program aggregates procedure codes into the same 231 categories plus 13 additional, CPT-specific categories. Table 4 presents the top CCS procedure categories, coded using the ICD-9-CM coding system, that did not qualify as ambulatory surgeries (HCUP_AS=0) by type of facility. The top CCS procedure categories for non-ambulatory surgery in hospital-owned facilities were: 231: Other therapeutic procedures, 198: Magnetic resonance imaging, 182: Mammography, 180: Other CT scan, and 227: Other diagnostic procedures (interview; evaluation; consultation). The CCS procedure category 231: Other therapeutic procedures includes miscellaneous diagnostic or therapeutic procedures such as therapeutic ultrasounds, insulin injections, allergy immunizations, light therapy, and acupuncture.
5 Ambulatory surgery services met at least one of the following criteria: 1) ICD-9-CM ranges included codes 00.50-86.99 (excluded were procedure codes in the range 88.4-88.59), 2) CPT procedures codes indicating surgery (yearly updates can be downloaded from Centers for Medicare and Medicaid Services (CMS) and generally include 10121-69930, G0105, G0121, and G0260), 3) presence of at least one revenue center code in the following range 036x (operating room services), 037x (anesthesia), or 049x (ambulatory surgical care), or 4) presence of a UB04 bill type of 83 indicating outpatient services.

HCUP (09/23/11) Del. #57.05: 2009 CD SASD Comparison Report 9
Table 4: Top 20 Procedure Categories (CCS) from ICD-9-CM Codes for Non-Ambulatory Surgeries in Hospital-Owned and Non-Hospital-Owned Facilities, 2009 SASD-CD
CCS Procedure Category
Number Occurring in
Hospital-Owned
Facilities
Number Occurring in Non Hospital-
Owned Facilities
231: Other therapeutic procedures 896,364 138
198: Magnetic resonance imaging 160,948 38
182: Mammography 154,992 0
180: Other CT scan 107,755 1
227: Other diagnostic procedures (interview; evaluation; consultation) 97,588 21
179: CT scan abdomen 87,403 0
226: Other diagnostic radiology and related techniques 76,408 48
193: Diagnostic ultrasound of heart (echocardiogram) 61,046 0
178: CT scan chest 60,256 0
177: Computerized axial tomography (CT) scan head 56,133 0
211: Therapeutic radiology for cancer treatment 40,489 0
183: Routine chest X-ray 38,721 10
206: Microscopic examination (bacterial smear; culture; toxicology) 35,616 0
163: Other non-OR therapeutic procedures on musculoskeletal system 30,990 1
202: Electrocardiogram 26,807 0
209: Radioisotope scan and function studies 25,988 0
197: Other diagnostic ultrasound 21,537 1
210: Other radioisotope scan 13,205 0
201: Cardiac stress tests 13,018 0
213: Physical therapy exercises; manipulation; and other procedures 12,475 1Note: Non-ambulatory surgery records are records where HCUP_AS=0. The Invalid or Inconsistent and HCPCS CCS procedure categories are not included. Data are based on all States providing ICD-9-CM procedures codes. A list of these States can be found in Appendix A: Table A-1. Similar to Table 4, Table 5 presents the top CCS procedure categories by frequency, coded using the CPT coding system, that did not qualify as ambulatory surgeries (HCUP_AS=0). The CPT coded records tended to differ from those coded by the ICD-9-CM coding system. The top procedure categories for CPT coding in hospital-owned facilities were: 233: Laboratory – Chemistry and Hematology, 227: Other diagnostic procedures (interview; evaluation; consultation), 231: Other therapeutic procedures, which includes miscellaneous diagnostic or therapeutic procedures such as therapeutic ultrasounds, insulin injections, allergy immunizations, light therapy, and acupuncture. 235: Other laboratory, and 206: Microscopic examination (bacterial smear; culture; toxicology). Appendix A contains a more detailed description of the ICD-9-CM and CPT coding systems as well as further comparisons. The top procedure categories in non-hospital-owned facilities were: 47: Diagnostic cardiac catheterization; coronary arteriography, 226: Other diagnostic radiology and related techniques, 240: Medications (Injections, infusions and other forms), 243: DME and supplies, and 227: Other diagnostic procedures (interview; evaluation; consultation). Some of the top CCS procedure categories found in the ICD-9-CM codes did not appear in the CPT codes, such as 201: Cardiac stress tests, 180: Other CT scan, 178: CT scan chest, 177:
HCUP (09/23/11) Del. #57.05: 2009 CD SASD Comparison Report 10
CT scan head, 209: Radioisotope scan and function studies, 210: Other radioisotope, 193: Diagnostic ultrasound of heart (echocardiogram), and 163: Other non-OR therapeutic procedures on musculoskeletal system. Likewise, some of the top CCS procedure categories coded using the CPT coding system did not appear in the top procedure categories captured by the ICD-9-CM coding system.

HCUP (09/23/11) Del. #57.05: 2009 CD SASD Comparison Report 11
Table 5: Top 20 Procedure Categories (CCS) from CPT Codes for Non-Ambulatory Surgeries in Hospital-Owned and Non-Hospital-Owned Facilities, 2009 SASD-CD
CCS Procedure Category
Number Occurring in
Hospital-Owned
Facilities
Number Occurring in Non Hospital-
Owned Facilities
233: Laboratory - Chemistry and Hematology 7,271,467 98
227: Other diagnostic procedures (interview; evaluation; consultation) 3,025,348 1,035
231: Other therapeutic procedures 2,112,189 537
235: Other laboratory 1,679,865 25
206: Microscopic examination (bacterial smear; culture; toxicology) 1,156,588 24
213: Physical therapy exercises; manipulation; and other procedures 943,903 0
226: Other diagnostic radiology and related techniques 943,436 5,893
240: Medications (Injections, infusions and other forms) 789,720 2,316
47: Diagnostic cardiac catheterization; coronary arteriography 543,891 27,455
182: Mammography 522,140 0
218: Psychological and psychiatric evaluation and therapy 484,898 358
243: DME and supplies 412,186 1,617
197: Other diagnostic ultrasound 372,797 93
211: Therapeutic radiology for cancer treatment 371,465 14
228: Prophylactic vaccinations and inoculations 364,553 0
202: Electrocardiogram 312,026 119
179: CT scan abdomen 308,092 0
183: Routine chest X-ray 275,471 15
198: Magnetic resonance imaging 262,499 0
215: Other physical therapy and rehabilitation 246,248 0Note: Non-ambulatory surgery records are records where HCUP_AS=0. The Invalid or Inconsistent and HCPCS CCS procedure categories are not included. Data are based on all States providing CPT codes. A list of these States can be found in Appendix A: Table A-1.

HCUP (09/23/11) Del. #57.05: 2009 CD SASD Comparison Report 12
PART II: UNDERSTANDING AMBULATORY SURGERY RECORDS AND FACILITIES CONTAINED IN THE 2009 SASD-CD Introduction Part II presents comparisons between the SASD-CD and AHA Annual Survey Data and examines the types of procedure categories that are captured in the 2009 SASD-CD limited to ambulatory surgery visits only (HCUP_AS>0). This section also investigates the most common types of procedure categories in hospital-owned facilities and in non-hospital-owned facilities and the extent to which the two coding systems (ICD-9-CM and CPT) are used in the States contributing to the 2009 SASD-CD. Additionally, this section demonstrates the research utility of AHRQ’s Clinical Classification Software (CCS) for aggregating ICD-9-CM or CPT procedure codes into mutually exclusive procedure categories. In the 2009 SASD-CD, the most common procedures tend to be concentrated in a few major body system procedure categories. Comparative Ambulatory Surgery Database In order to provide perspective on the capture of ambulatory surgery in the 2009 SASD-CD, the database was compared with the Annual Survey Database, fielded and maintained by the American Hospital Association (AHA). This section of the report provides information on both hospital-owned and non-hospital-owned facilities from both the AHA database and SASD-CD. Also, as noted earlier, the definition of ambulatory surgery differs between HCUP and the AHA. In HCUP, records are identified as ambulatory surgery records (HCUP_AS>0) if they have any of the following:
1) ICD-9-CM ranges included codes 00.50-86.99 (excluded were procedure codes in the range 88.4-88.59),
2) CPT procedure codes indicating surgery (yearly updates can be downloaded from Centers for Medicare and Medicaid Services (CMS) and generally include 10121-69930, G0105, G0121, and G0260),
3) Presence of at least one revenue center code in the following range 036x (operating room services), 037x (anesthesia), or 049x (ambulatory surgical care), or
4) Presence of a UB04 bill type of 83 indicating outpatient services. The AHA Survey asks hospitals to report “outpatient surgical operations” defined as:
Outpatient surgical operation. For outpatient surgical operations, please record operations performed on patients who do not remain in the hospital overnight. Include all operations whether performed in the inpatient operating rooms or in procedure rooms located in an outpatient facility. Include an endoscopy only when used as operative tool and not when used for diagnosis alone. Count each patient undergoing surgery as one surgical operation regardless of the number of surgical procedures that were performed while the patient was in the operating or procedure room.
Note that this difference in definition may explain differences between AHA and SASD-CD counts of ambulatory surgery visits.
HCUP (09/23/11) Del. #57.05: 2009 CD SASD Comparison Report 13
Comparisons between the SASD-CD and the AHA Annual Survey Data
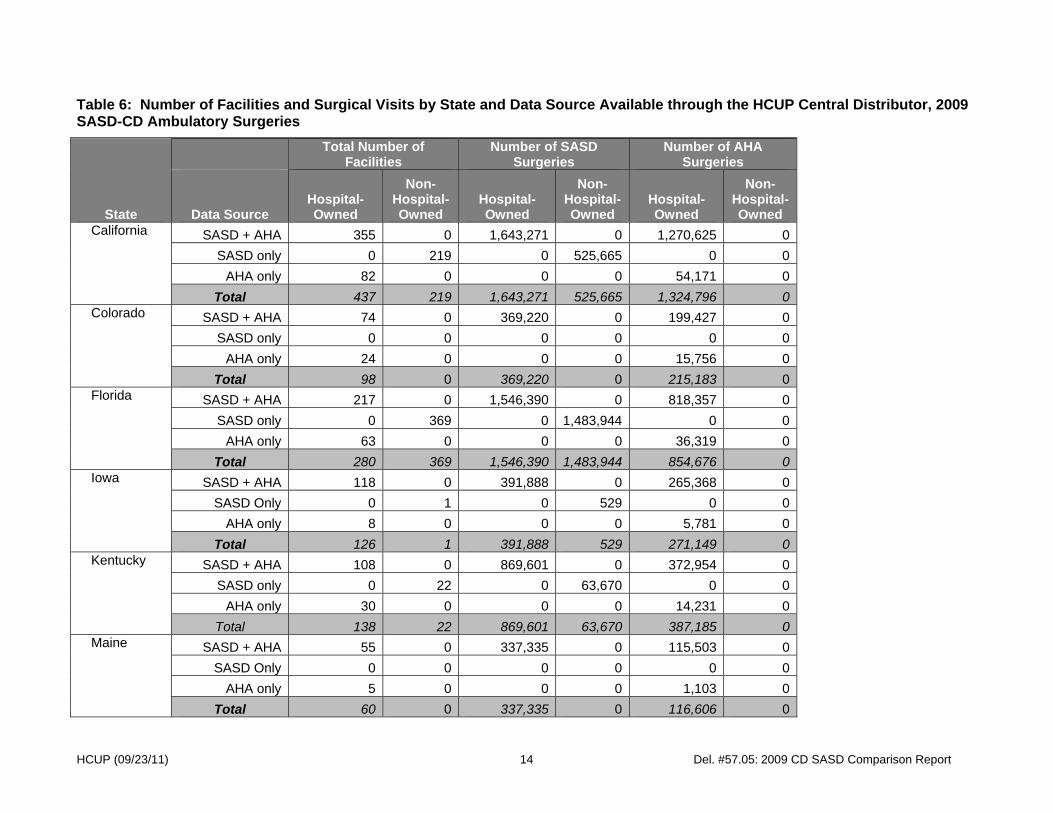
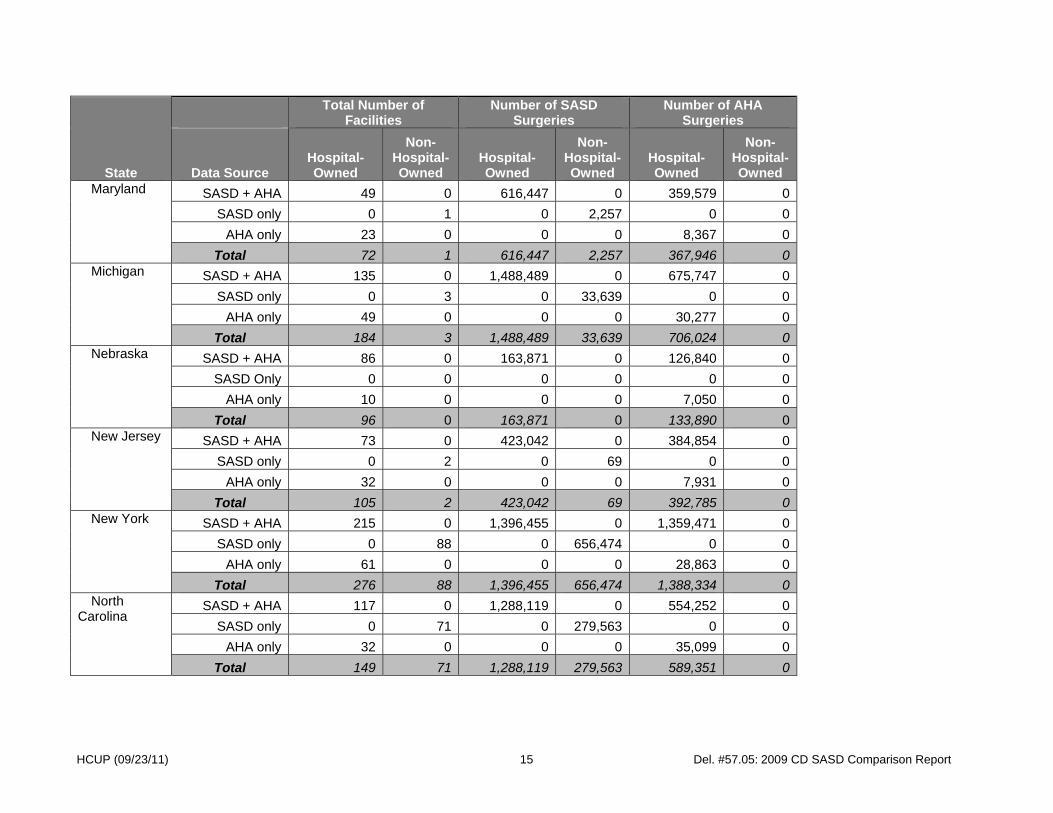
Table 6 compares 2009 SASD-CD surgical visit6 counts from the 2009 AHA data for 16 States. These counts are limited to the subset of visits that meet the criteria for ambulatory surgery (HCUP_AS>0). For each state, the table presents the number of facilities and the number of surgical visits for each combination of data sources, stratified by type of facility.7
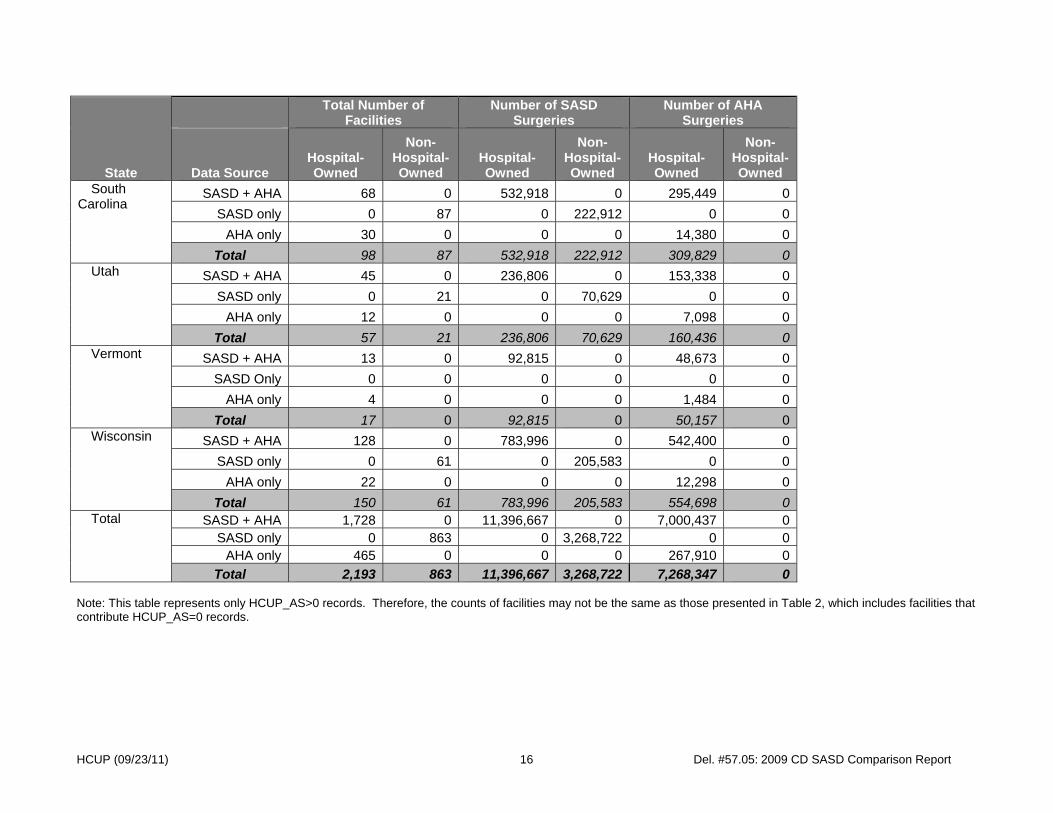
As an example, for California, the first row shows that 355 hospital-owned facilities were present in both data sources, while 82 were present in the AHA database only. There were 219 non-hospital-owned facilities in California in the SASD-CD. For hospital-owned facilities in California, the SASD-CD reported 1,643,271 surgical visits, and the AHA reported 1,324,796 surgical visits, of which 54,171 (4.0%) were reported in the AHA database only. The SASD-CD reported 525,665 surgical visits from non-hospital-owned facilities in California. The “Total” portion of Table 6 also demonstrates how the SASD-CD and the AHA files compare. For hospital-owned facilities matched between these two files (the row labeled “SASD+AHA” within the “Total” section at the bottom of the table), a greater number of SASD-CD surgical visit counts (11,396,667) than AHA surgical visit counts (7,268,347) were noted. Table 6 shows a total of 3,268,722 ambulatory surgical visits from non-hospital-owned facilities were recorded in the SASD-CD. Some States, such as Maine, Michigan and North Carolina, exhibited more than twice the number of SASD surgical visits than AHA surgical visits for hospital-owned facilities. Within the SASD-CD, 2,193 facilities were hospital-owned (37.2%) and 863 were non-hospital-owned facilities (28.2%). Within the SASD-CD, 77.7% (11,396,667) of the surgical visits came from hospital-owned facilities. Non-hospital-owned facilities provided 22.3% (3,268,722) of the ambulatory surgical visits. Of the 14,665,389 ambulatory surgical visits contained in the SASD-CD, 11,396,667 (77.7%) were contained in the 1,728 facilities matched to the AHA file. The total number of facilities reported in Table 6 (3,056) exceeds the number of SASD-CD facilities reported in Table 2 (2,823), since there are three types of facilities: those that match between SASD-CD and the AHA (1,728), those in the SASD-CD only (863), and those in the AHA only (465). It is also important to recognize that the facility and discharge totals might possibly double-count some units contained in both files that could not be matched for an unknown reason.
6 The term “surgical visit” is used instead of surgeries because multiple surgeries may be performed in one ambulatory surgery visit.
7 Matching between facilities in the SASD-CD and AHA was not necessarily one-to-one, and many-to-many matching may have occurred. Each facility in the AHA is assigned an IDNUMBER, while hospital identifiers in the SASD-CD (DSHOSPID) are provided by the data source. In rare occasions, multiple DSHOSPIDs in the SASD-CD may be matched to the same AHA IDNUMBER, such as hospitals in a health system, or multiple AHA IDNUMBERs may also be corresponding to the same SASD-CD DSHOSPID due to hospital mergers and divisions.
HCUP (09/23/11) Del. #57.05: 2009 CD SASD Comparison Report 14
Table 6: Number of Facilities and Surgical Visits by State and Data Source Available through the HCUP Central Distributor, 2009 SASD-CD Ambulatory Surgeries
State
Total Number of
Facilities Number of SASD
Surgeries Number of AHA
Surgeries
Data Source Hospital-Owned
Non-Hospital-Owned
Hospital-Owned
Non-Hospital-Owned
Hospital-Owned
Non-Hospital-Owned
California SASD + AHA 355 0 1,643,271 0 1,270,625 0
SASD only 0 219 0 525,665 0 0
AHA only 82 0 0 0 54,171 0
Total 437 219 1,643,271 525,665 1,324,796 0Colorado SASD + AHA 74 0 369,220 0 199,427 0
SASD only 0 0 0 0 0 0
AHA only 24 0 0 0 15,756 0
Total 98 0 369,220 0 215,183 0Florida SASD + AHA 217 0 1,546,390 0 818,357 0
SASD only 0 369 0 1,483,944 0 0
AHA only 63 0 0 0 36,319 0
Total 280 369 1,546,390 1,483,944 854,676 0Iowa SASD + AHA 118 0 391,888 0 265,368 0
SASD Only 0 1 0 529 0 0
AHA only 8 0 0 0 5,781 0
Total 126 1 391,888 529 271,149 0Kentucky SASD + AHA 108 0 869,601 0 372,954 0
SASD only 0 22 0 63,670 0 0
AHA only 30 0 0 0 14,231 0
Total 138 22 869,601 63,670 387,185 0Maine SASD + AHA 55 0 337,335 0 115,503 0
SASD Only 0 0 0 0 0 0
AHA only 5 0 0 0 1,103 0
Total 60 0 337,335 0 116,606 0
HCUP (09/23/11) Del. #57.05: 2009 CD SASD Comparison Report 15
State
Total Number of
Facilities Number of SASD
Surgeries Number of AHA
Surgeries
Data Source Hospital-Owned
Non-Hospital-Owned
Hospital-Owned
Non-Hospital-Owned
Hospital-Owned
Non-Hospital-Owned
Maryland SASD + AHA 49 0 616,447 0 359,579 0
SASD only 0 1 0 2,257 0 0
AHA only 23 0 0 0 8,367 0
Total 72 1 616,447 2,257 367,946 0Michigan SASD + AHA 135 0 1,488,489 0 675,747 0
SASD only 0 3 0 33,639 0 0
AHA only 49 0 0 0 30,277 0
Total 184 3 1,488,489 33,639 706,024 0Nebraska SASD + AHA 86 0 163,871 0 126,840 0
SASD Only 0 0 0 0 0 0
AHA only 10 0 0 0 7,050 0
Total 96 0 163,871 0 133,890 0New Jersey SASD + AHA 73 0 423,042 0 384,854 0
SASD only 0 2 0 69 0 0
AHA only 32 0 0 0 7,931 0
Total 105 2 423,042 69 392,785 0New York SASD + AHA 215 0 1,396,455 0 1,359,471 0
SASD only 0 88 0 656,474 0 0
AHA only 61 0 0 0 28,863 0
Total 276 88 1,396,455 656,474 1,388,334 0North
Carolina SASD + AHA 117 0 1,288,119 0 554,252 0
SASD only 0 71 0 279,563 0 0
AHA only 32 0 0 0 35,099 0
Total 149 71 1,288,119 279,563 589,351 0
HCUP (09/23/11) Del. #57.05: 2009 CD SASD Comparison Report 16
State
Total Number of
Facilities Number of SASD
Surgeries Number of AHA
Surgeries
Data Source Hospital-Owned
Non-Hospital-Owned
Hospital-Owned
Non-Hospital-Owned
Hospital-Owned
Non-Hospital-Owned
South Carolina
SASD + AHA 68 0 532,918 0 295,449 0
SASD only 0 87 0 222,912 0 0
AHA only 30 0 0 0 14,380 0
Total 98 87 532,918 222,912 309,829 0Utah SASD + AHA 45 0 236,806 0 153,338 0
SASD only 0 21 0 70,629 0 0
AHA only 12 0 0 0 7,098 0
Total 57 21 236,806 70,629 160,436 0Vermont SASD + AHA 13 0 92,815 0 48,673 0
SASD Only 0 0 0 0 0 0
AHA only 4 0 0 0 1,484 0
Total 17 0 92,815 0 50,157 0Wisconsin SASD + AHA 128 0 783,996 0 542,400 0
SASD only 0 61 0 205,583 0 0
AHA only 22 0 0 0 12,298 0
Total 150 61 783,996 205,583 554,698 0Total SASD + AHA 1,728 0 11,396,667 0 7,000,437 0
SASD only 0 863 0 3,268,722 0 0AHA only 465 0 0 0 267,910 0
Total 2,193 863 11,396,667 3,268,722 7,268,347 0 Note: This table represents only HCUP_AS>0 records. Therefore, the counts of facilities may not be the same as those presented in Table 2, which includes facilities that contribute HCUP_AS=0 records.
HCUP (09/23/11) Del. #57.05: 2009 CD SASD Comparison Report 17
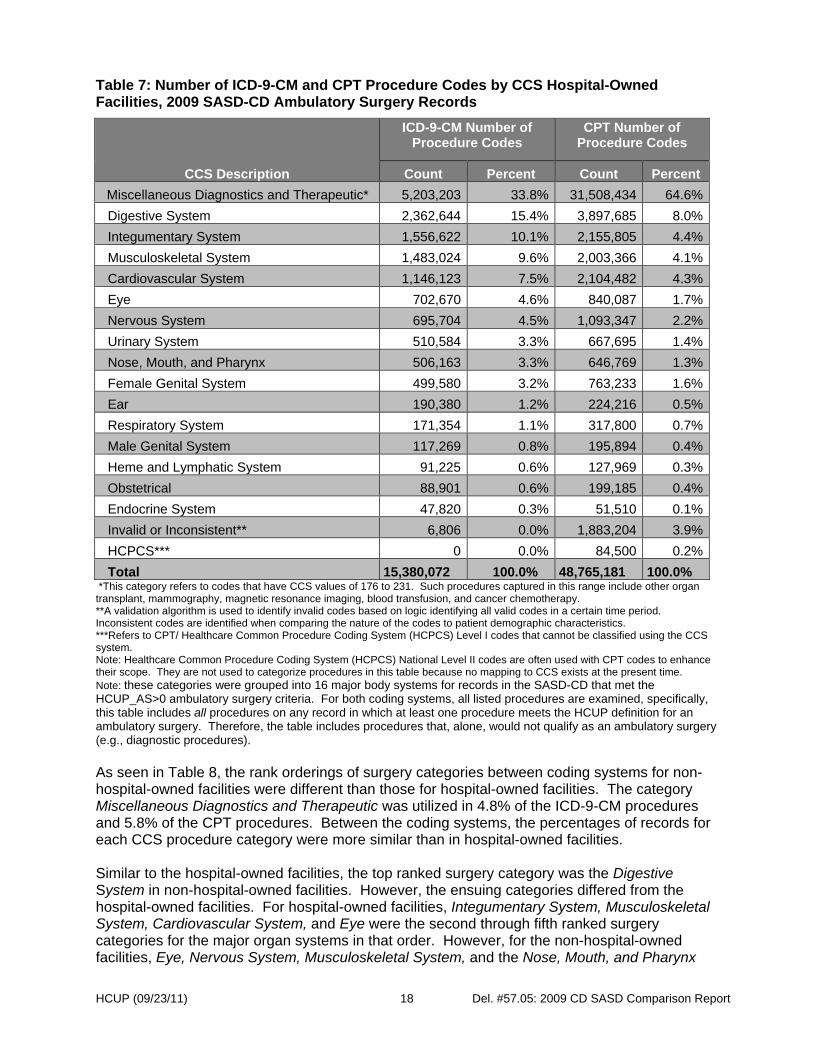
Types of Procedure Categories Defined as Ambulatory Surgery in the 2009 SASD-CD by Coding System An important consideration when using the SASD-CD is the alignment of surgeries reported using two different coding systems, ICD-9-CM and CPT. Tables 7 and 8 address this consideration, using the 16 major body systems. As discussed above, this classification was accomplished using AHRQ’s Clinical Classification Software (CCS). There are two versions of the software, one for ICD-9-CM procedure codes and another for CPT procedure codes. As mentioned previously, the ICD-9-CM CCS program aggregates procedure codes into 231 mutually exclusive procedure categories. The CPT CCS program aggregates procedure codes into the same 231 categories plus 13 additional, CPT-specific categories. Missing values are ignored. As shown in Table 7, the rank orderings of the surgery categories for hospital-owned facilities were similar. However, the Miscellaneous Diagnostics and Therapeutic procedures category represented 33.8% of the ICD-9-CM procedures compared to 64.6% of the CPT procedures. Note, however, that the CPT coding system contains a greater number of procedures as well as greater granularity. Therefore, it is expected that a higher percentage of records with CPT codes would not meet the HCUP criteria for ambulatory surgery and may have co-occurred on the records. For example, lab tests associated with an ambulatory surgery may be included in the record as a CPT code. Also, the number of Invalid or Inconsistent category was less for ICD-9-CM CCS codes (0.0%) compared to CPT CCS (3.9%). Appendix A contains a more detailed description of the ICD-9-CM and CPT coding systems as well as further comparisons. Table 7 also demonstrates that ambulatory surgery was concentrated in treatments for only a few body systems in hospital-owned facilities. For instance, digestive system-related surgeries accounted for 15.4% of the ICD-9-CM based procedures and 8.0% of the CPT based procedures. The top three body systems, not counting the Miscellaneous Diagnostics and Therapeutic category, Digestive System, Integumentary System, and Musculoskeletal System accounted for 35.1% of the ICD-9-CM based procedures and 16.5% of all CPT based procedures, and the top five Digestive, Integumentary, Musculoskeletal, Cardiovascular and Eye systems accounted for 47.1% of procedures with ICD-9-CM based procedures and 22.6% of the CPT coded procedures.
HCUP (09/23/11) Del. #57.05: 2009 CD SASD Comparison Report 18
Table 7: Number of ICD-9-CM and CPT Procedure Codes by CCS Hospital-Owned Facilities, 2009 SASD-CD Ambulatory Surgery Records
CCS Description
ICD-9-CM Number of Procedure Codes
CPT Number of Procedure Codes
Count Percent Count Percent
Miscellaneous Diagnostics and Therapeutic* 5,203,203 33.8% 31,508,434 64.6%
Digestive System 2,362,644 15.4% 3,897,685 8.0%
Integumentary System 1,556,622 10.1% 2,155,805 4.4%
Musculoskeletal System 1,483,024 9.6% 2,003,366 4.1%
Cardiovascular System 1,146,123 7.5% 2,104,482 4.3%
Eye 702,670 4.6% 840,087 1.7%
Nervous System 695,704 4.5% 1,093,347 2.2%
Urinary System 510,584 3.3% 667,695 1.4%
Nose, Mouth, and Pharynx 506,163 3.3% 646,769 1.3%
Female Genital System 499,580 3.2% 763,233 1.6%
Ear 190,380 1.2% 224,216 0.5%
Respiratory System 171,354 1.1% 317,800 0.7%
Male Genital System 117,269 0.8% 195,894 0.4%
Heme and Lymphatic System 91,225 0.6% 127,969 0.3%
Obstetrical 88,901 0.6% 199,185 0.4%
Endocrine System 47,820 0.3% 51,510 0.1%
Invalid or Inconsistent** 6,806 0.0% 1,883,204 3.9%
HCPCS*** 0 0.0% 84,500 0.2%
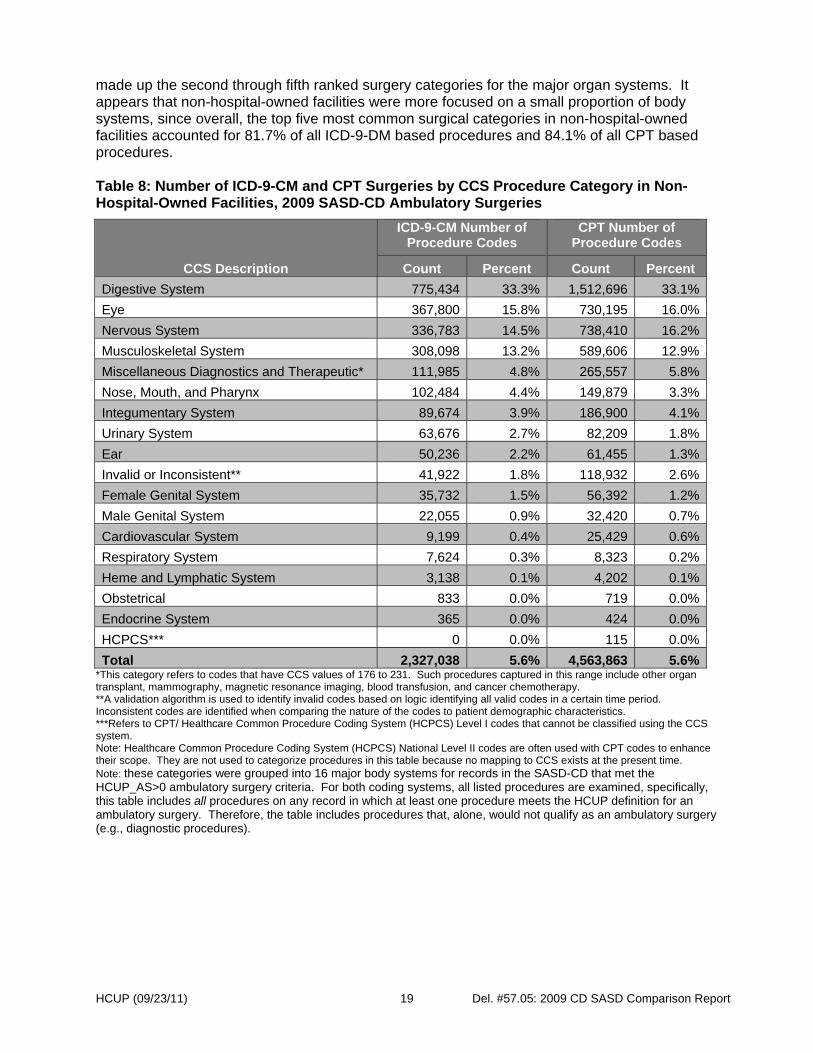
Total 15,380,072 100.0% 48,765,181 100.0% *This category refers to codes that have CCS values of 176 to 231. Such procedures captured in this range include other organ transplant, mammography, magnetic resonance imaging, blood transfusion, and cancer chemotherapy. **A validation algorithm is used to identify invalid codes based on logic identifying all valid codes in a certain time period. Inconsistent codes are identified when comparing the nature of the codes to patient demographic characteristics. ***Refers to CPT/ Healthcare Common Procedure Coding System (HCPCS) Level I codes that cannot be classified using the CCS system. Note: Healthcare Common Procedure Coding System (HCPCS) National Level II codes are often used with CPT codes to enhance their scope. They are not used to categorize procedures in this table because no mapping to CCS exists at the present time. Note: these categories were grouped into 16 major body systems for records in the SASD-CD that met the HCUP_AS>0 ambulatory surgery criteria. For both coding systems, all listed procedures are examined, specifically, this table includes all procedures on any record in which at least one procedure meets the HCUP definition for an ambulatory surgery. Therefore, the table includes procedures that, alone, would not qualify as an ambulatory surgery (e.g., diagnostic procedures). As seen in Table 8, the rank orderings of surgery categories between coding systems for non-hospital-owned facilities were different than those for hospital-owned facilities. The category Miscellaneous Diagnostics and Therapeutic was utilized in 4.8% of the ICD-9-CM procedures and 5.8% of the CPT procedures. Between the coding systems, the percentages of records for each CCS procedure category were more similar than in hospital-owned facilities. Similar to the hospital-owned facilities, the top ranked surgery category was the Digestive System in non-hospital-owned facilities. However, the ensuing categories differed from the hospital-owned facilities. For hospital-owned facilities, Integumentary System, Musculoskeletal System, Cardiovascular System, and Eye were the second through fifth ranked surgery categories for the major organ systems in that order. However, for the non-hospital-owned facilities, Eye, Nervous System, Musculoskeletal System, and the Nose, Mouth, and Pharynx
HCUP (09/23/11) Del. #57.05: 2009 CD SASD Comparison Report 19
made up the second through fifth ranked surgery categories for the major organ systems. It appears that non-hospital-owned facilities were more focused on a small proportion of body systems, since overall, the top five most common surgical categories in non-hospital-owned facilities accounted for 81.7% of all ICD-9-DM based procedures and 84.1% of all CPT based procedures. Table 8: Number of ICD-9-CM and CPT Surgeries by CCS Procedure Category in Non-Hospital-Owned Facilities, 2009 SASD-CD Ambulatory Surgeries
CCS Description
ICD-9-CM Number of Procedure Codes
CPT Number of Procedure Codes
Count Percent Count Percent
Digestive System 775,434 33.3% 1,512,696 33.1%
Eye 367,800 15.8% 730,195 16.0%
Nervous System 336,783 14.5% 738,410 16.2%
Musculoskeletal System 308,098 13.2% 589,606 12.9%
Miscellaneous Diagnostics and Therapeutic* 111,985 4.8% 265,557 5.8%
Nose, Mouth, and Pharynx 102,484 4.4% 149,879 3.3%
Integumentary System 89,674 3.9% 186,900 4.1%
Urinary System 63,676 2.7% 82,209 1.8%
Ear 50,236 2.2% 61,455 1.3%
Invalid or Inconsistent** 41,922 1.8% 118,932 2.6%
Female Genital System 35,732 1.5% 56,392 1.2%
Male Genital System 22,055 0.9% 32,420 0.7%
Cardiovascular System 9,199 0.4% 25,429 0.6%
Respiratory System 7,624 0.3% 8,323 0.2%
Heme and Lymphatic System 3,138 0.1% 4,202 0.1%
Obstetrical 833 0.0% 719 0.0%
Endocrine System 365 0.0% 424 0.0%
HCPCS*** 0 0.0% 115 0.0%
Total 2,327,038 5.6% 4,563,863 5.6%*This category refers to codes that have CCS values of 176 to 231. Such procedures captured in this range include other organ transplant, mammography, magnetic resonance imaging, blood transfusion, and cancer chemotherapy. **A validation algorithm is used to identify invalid codes based on logic identifying all valid codes in a certain time period. Inconsistent codes are identified when comparing the nature of the codes to patient demographic characteristics. ***Refers to CPT/ Healthcare Common Procedure Coding System (HCPCS) Level I codes that cannot be classified using the CCS system. Note: Healthcare Common Procedure Coding System (HCPCS) National Level II codes are often used with CPT codes to enhance their scope. They are not used to categorize procedures in this table because no mapping to CCS exists at the present time. Note: these categories were grouped into 16 major body systems for records in the SASD-CD that met the HCUP_AS>0 ambulatory surgery criteria. For both coding systems, all listed procedures are examined, specifically, this table includes all procedures on any record in which at least one procedure meets the HCUP definition for an ambulatory surgery. Therefore, the table includes procedures that, alone, would not qualify as an ambulatory surgery (e.g., diagnostic procedures).

HCUP (09/23/11) Del. #57.05: 2009 CD SASD Comparison Report 20
Comparisons between ICD-9-CM Codes and CPT Codes Appendix A provides additional information for analysts who are interested in working with SASD-CD data. Comparisons are made between the ICD-9-CM and CPT procedure codes, including direct, record-level comparisons for States that use both systems. The States that use each coding system are identified, and the numbers of SASD-CD surgical visit records (meeting the HCUP_AS>0 ambulatory surgery criteria) using each system are presented. Similarities and differences between the ICD-9-CM and CPT procedure coding systems are illustrated by comparing CCS categories for both coding systems. The level of agreement between the two systems based on data from States that use both procedure coding systems is also evaluated. Therefore, the information presented in Appendix A also provides important information regarding which coding system to use to study ambulatory surgery and the extent to which ambulatory surgeries are dually coded in States that use both coding systems. The number of procedure codes reported on a record depends on the file type from which they were obtained. The lowest average number of procedure codes on a surgical visit record was reported using the ICD-9-CM coding system. Overall, more CPT procedure codes were used on a surgical visit record, with the average number being higher for the States where these codes were included in the line item charge detail files. These consist of files with surgical visit records providing detailed information about individual charges. For these States, there is no upper limit on the number of procedure codes per surgical visit record. To obtain a complete view of the procedures performed during a visit, it is generally necessary to refer to both the ICD-9-CM and CPT procedure codes. In some States, almost every surgical visit record with ICD-9-CM procedure codes also provides CPT procedure codes. For the remainder of the States providing codes in both systems, the coding frequencies are mixed: some surgical visit records contain only ICD-9-CM procedure codes or only CPT procedure codes, while some records contain both types of procedure codes. When ICD-9-CM and CPT procedure codes are both present on a surgical visit record, they often provide different information. The frequency with which the information provided in the two systems translates to the same set of CCS categories varies widely, ranging from 16.5% to 74.4% based on the CPT coding system, depending on the State (Table A-3). For surgical visit records with only a single ICD-9-CM and CPT procedure code, the CCS categories matched more than 75% of the time for six of 10 States and 60.2% of the time in the State with the lowest match rate (Vermont) (Table A-4). The CPT CCS matched the ICD-9-CM CCS more than 90% of the time in nine of 10 categories, and the ICD-9-CM CCS matched the CPT CCS over 90% of the time in nine of 10 categories (Appendix A). Appendix B contains a table presenting CCS statistics derived from the ICD-9-CM and CPT procedures for records meeting the HCUP_AS>0 ambulatory surgery criteria in all of the HCUP SASD-CD States by body system. In Table B-1, the procedure range captured by each CCS category is shown under each column heading, denoting the major body system, for HCUP_AS>0 records only. Two additional CCS categories are also presented as columns: HCPCS codes, which are only encountered in conjunction with CPT codes, and the Invalid or Inconsistent category, capturing records that were found to include values that are inconsistent or invalid with the patient demographic characteristics available. This latter category includes only those surgical visit records with no valid procedure codes and one or more invalid or inconsistent codes. The rows of this table, organized by state, present the number of records for each CCS procedure category coded using the ICD-9-CM and CPT coding systems. Because a single record can have more than one procedure, it is important to note that more than one body system code can appear on a single record. The percentages represent the proportion of
HCUP (09/23/11) Del. #57.05: 2009 CD SASD Comparison Report 21
surgeries from a specific State that included one or more body system codes in a category in relation to the total number of records for that state. Because there may be more than one procedure code per ambulatory surgery record, the sum of the percentages for each State does not add to one hundred. States that use ICD-9-CM procedure codes on more than half their records, such as Wisconsin, generally have a greater number of observations for ICD-9-CM than CPT procedure codes for a particular body system.8 For the digestive system (CCS 68-99), for example, Wisconsin has 335,447 procedure codes using the ICD-9-CM coding system compared to 253,746 codes using the CPT coding system (Table B-1). Other States, such as Florida, have more CPT codes than ICD-9-CM codes; more than 32.9% of Florida records use only the CPT coding system (Table A-2). Florida has more CPT codes than ICD-9-CM codes for nearly all 16 body system categories. The influence of the reporting practices and capabilities of the States may be seen by comparing the percentages reported between coding systems for a single category. For example, in North Carolina where the ICD-9-CM and CPT systems each have 20 fields on a record, the percentage of records with digestive codes are nearly equal (25.5% ICD-9-CM vs. 25.6% CPT). By way of contrast, in Florida where there are five ICD-9-CM fields and 10 CPT fields, the percentage of records with digestive codes exhibits a larger difference between the two systems (20.8% ICD-9-CM vs. 33.9% CPT). See Table B-1. Appendix B also reflects the variation in the use of both ICD-9-CM and CPT procedure coding by State in the SASD-CD. South Carolina uses only ICD-9-CM procedure coding in their SASD-CD data. Conversely, California, Iowa, Maine, Maryland, Nebraska, and New York use only CPT coding. Hence, some States presented in Appendix B do not have observations for a particular procedure coding system. Analysts should be aware of the utilization of different procedure coding systems during their analyses of SASD-CD data.
8 See Table A-2 in Appendix A for a report on the percent of records with each type of coding system.
HCUP (09/23/11) Del. #57.05: 2009 CD SASD Comparison Report 22
CONCLUSION The data contained in the SASD-CD are a rich source of ambulatory surgery information. Through linkage to AHA data, ambulatory surgery visits carried out in the following facilities can be identified:
Hospital-owned Non-hospital-owned
Hospital-owned facilities are identified through match to the AHA annual survey data. A facility in the SASD-CD is identified as hospital-owned if it can be matched to the AHA data by hospital identifier (IDNUMBER). Note that hospital-owned facilities may provide outpatient surgeries in dedicated AS units within the hospital, dedicated same-day surgery beds that use the IP OR, or have freestanding outpatient care centers, ambulatory surgery centers and/or hospital-based outpatient care services. Non-hospital-owned facilities are those facilities in the SASD-CD that could not be matched to the AHA survey by hospital identifier (IDNUMBER). Non-hospital-owned includes freestanding ambulatory surgery centers that are not owned by hospitals. The SASD-CD from some States are limited mainly to hospital-owned facilities, while the SASD-CD from other States also include a substantial number of non-hospital-owned facilities. Across all States, there were 1,893 ambulatory surgical facilities that were hospital-owned (67.0%) and 930 that were non-hospital-owned facilities in 2009. States also vary in the type of records provided to the SASD-CD. Some States limit the records primarily to those containing ambulatory surgery visits, per the HCUP definition. Other States can include a large number of records that are non-ambulatory surgery outpatient services. The proportion of records in the 2009 SASD-CD meeting the definition of ambulatory surgery is much higher (98.7%) among non-hospital-owned facilities than hospital-owned facilities (59.8%). South Carolina had the highest percentage of services in hospital-owned facilities qualifying as ambulatory surgery visits at 100%, and Maine had the lowest percentage at 7.5%. In contrast, the percentage of AS qualifying records from non-hospital-owned facilities was consistently high (>95%) across all States that contributed non-hospital-owned data. When comparing ambulatory surgery visits counts recorded in the AHA database and the SASD, a substantially greater number of SASD surgical visit counts (11,396,667) than AHA surgical visit counts (7,268,347) were noted. In terms of the types of surgeries recorded in the SASD-CD files, the greatest proportions of ambulatory surgeries are related to the digestive, musculoskeletal, and integumentary systems. Overall, the pattern of use by body system appears relatively consistent among States. However, for States that use both coding systems such as Florida, which have low amounts of overlap between ICD-9-CM and CPT procedure coding, reporting of use is split between the two systems. In these cases, it is particularly important to use information from both procedure coding systems to obtain a complete picture of the procedures performed. Alternatively, researchers must be cautious when analyzing ambulatory surgeries in States that use both
HCUP (09/23/11) Del. #57.05: 2009 CD SASD Comparison Report 23
coding systems to ensure that surgeries are not counted twice in States in which a surgery is coded twice per record. Substantial variability exists in the utilization of procedures for particular body systems. A notable example is found in the particularly high utilization of procedures on the digestive system and on the musculoskeletal system. Such variability in healthcare needs could serve as an interesting research application of the SASD-CD. Additionally, assessing differences in the volume of ambulatory surgeries across body systems or States could also be a valuable research application of the SASD-CD data. The wide disparity in utilization displayed for the category Miscellaneous Diagnostic and Therapeutic procedures (Table B-1), which might be expected given the different emphasis of this category of procedures that includes organ transplant, mammography, magnetic resonance imaging, blood transfusion, and cancer chemotherapy by the coding systems, was evident in the data. The percentage of codes reported using the ICD-9-CM coding system occurred between 9.0% to 55.7%, while CPT procedure codes ranged from 2.5% to 92.1%. Even those States with substantial coding in both systems, such as North Carolina, the Miscellaneous Diagnostic and Therapeutic category was coded 18.3% of the time using ICD-9-CM codes and 25.6% of the time using the CPT coding system (Table B-1). This analysis demonstrated that, although a substantial amount of information is duplicated between the two coding systems, there is still an appreciable amount of information that is unique to one or the other set of codes. This is especially important for the Miscellaneous Diagnostic and Therapeutic category. Employing the CCS as a means to compare and combine information from the ICD-9-CM and CPT procedure codes proved to be a fruitful approach albeit with limitations as noted. Using it as a grouper allowed consistent comparisons without encountering the problems associated with attempting to translate directly between incompatible coding systems. In conclusion, the 2009 SASD-CD is a rich source of ambulatory surgery data, providing information on 15,725,597 ambulatory surgery visits in a total of 2,823 facilities in 16 States. The SASD-CD is also an important resource for studying ambulatory surgery in non-hospital-owned facilities, despite not having a comparison source of information. As this report demonstrates, over 98% of records from these facilities are ambulatory surgeries, concentrated in a small number of body systems, which may have implications for research involving those body systems (e.g., the number of surgeries may be underestimated if non-hospital-owned facilities are not included). These files can be useful to a broad range of researchers and policy analysts, particularly for state-specific analyses.
APPENDIX A
HCUP (09/23/11) A-1 el. #57.05: 2009 CD SASD Comparison Report
APPENDIX A: COMPARISON OF ICD-9-CM AND CPT PROCEDURE CODE USE BY SELECT STATE This appendix makes comparisons between ICD-9-CM procedure codes and CPT procedure codes among States that employ both coding systems. The International Classification of Diseases, 9th Revision, Clinical Modification (ICD-9-CM) coding system was originally developed as a modification of the World Health Organization (WHO) ICD system for statistical and epidemiological research. Eventually they became a means to calculate diagnosis related groups (DRGs) for inpatient prospective payment systems. The ICD-9-CM procedure codes are used to classify surgical procedures and some diagnostic procedures in the inpatient setting. The procedures are organized by body system (e.g., nervous, endocrine, respiratory, digestive, obstetrical procedures, musculoskeletal, etc.). Procedures are coded using approximately 3,900 codes comprised of two main digits followed by a decimal and one or two additional digits. Current Procedural Terminology (CPT), developed by the American Medical Association (AMA), is a collection of terms and codes to describe medical, surgical, and diagnostic services and procedures performed by physicians in the outpatient setting. Because they were created for physician billing purposes, the CPT codes are significantly more detailed than the ICD-9-CM codes. In addition to a surgery section which parallels the ICD-9-CM procedure codes, the CPT codes are also used for evaluation and management, anesthesia, radiology, lab and pathology, and medicine. CPT codes are Level I of the Healthcare Common Procedure Coding System (HCPCS) and comprise a major portion of the Healthcare Common Procedure Coding System (HCPCS). Procedures are coded using approximately 9,000 codes comprised of five digits, to which two-digit modifiers may be added to explain unusual circumstances. CPT or HCPCS codes are becoming the standard for outpatient data because they are required for ambulatory patient classification systems, such as the Ambulatory Payment Classification (APC) and the Ambulatory Surgery Classification (ASC) systems, both of which are part of CMS’ Outpatient Prospective Payment System. A general description of the CPT coding system can be found on the AMA website at http://www.ama-assn.org/ama/pub/physician-resources/solutions-managing-your-practice/coding-billing-insurance/cpt.shtml. There are also a number of third party CPT coding manuals available. Table A-1 lists the States that use each coding system. There are two types of records that contain CPT codes: the “core” files and the “charge detail” files. The core file supplies a fixed number of CPT code variables on a single record for each surgical visit. In contrast, the charge detail file may include a CPT code for each individual charge. A single surgical visit is represented by as many records as necessary to supply all of the charge information. As shown in Table A-1, most States that supply CPT codes provide a core file along with diagnostic and demographic information. For States with CPT codes on both the “core” and “charge detail” files in 2009, analysts should use both files to identify all CPT codes related to the surgery. States that use both coding systems include: Colorado, Florida, Kentucky, Michigan, New Jersey, North Carolina, Utah, Vermont, and Wisconsin. For users of the SASD-CD, understanding which coding system a State uses is important because there are subtle differences between the two systems.

HCUP (09/23/11) A-2 el. #57.05: 2009 CD SASD Comparison Report
Table A-1: Use of ICD-9-CM Procedure Codes and the CPT Procedure Codes Available through the HCUP Central Distributor, by State
State ICD-9-CM
Procedures Core File CPT
Variables
Charge Detail File CPT Records
California N/A N/A Colorado N/A Florida N/A Iowa N/A Kentucky Maine N/A Maryland N/A Michigan N/A Nebraska N/A New Jersey New York N/A North Carolina N/A South Carolina N/A N/A Utah N/A Vermont Wisconsin
For States that use both procedure coding systems, the average number of ICD-9-CM procedure codes is 1.9 compared to 3.3 CPT codes in the core file and 5.7 CPT codes in the charge detail file. Thus, there tend to be more CPT codes than ICD-9-CM codes, especially if the CPT codes are derived from the charge detail file. Among States that employ both procedure coding systems, Table A-2 shows the percentage of records that have 1) both CPT procedure codes and ICD-9-CM procedure codes, 2) only ICD-9-CM procedure codes, and 3) only CPT procedure codes. For example, in Colorado, 71.2% of the records employ both coding systems, and 28.8% employ only the ICD-9-CM procedure coding system. Wisconsin had a very low percentage of records that used both systems (10.9%).
HCUP (09/23/11) A-3 el. #57.05: 2009 CD SASD Comparison Report
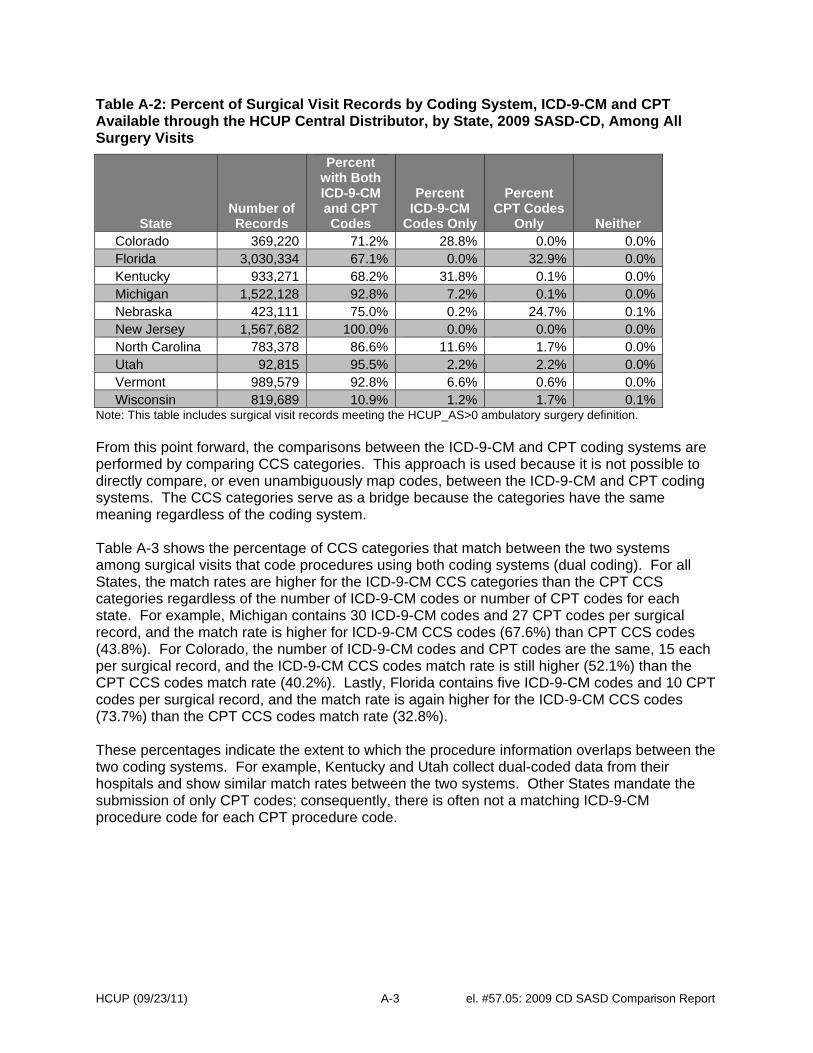
Table A-2: Percent of Surgical Visit Records by Coding System, ICD-9-CM and CPT Available through the HCUP Central Distributor, by State, 2009 SASD-CD, Among All Surgery Visits
State Number of Records
Percent with Both ICD-9-CM and CPT Codes
Percent ICD-9-CM
Codes Only
Percent CPT Codes
Only Neither Colorado 369,220 71.2% 28.8% 0.0% 0.0%Florida 3,030,334 67.1% 0.0% 32.9% 0.0%Kentucky 933,271 68.2% 31.8% 0.1% 0.0%Michigan 1,522,128 92.8% 7.2% 0.1% 0.0%Nebraska 423,111 75.0% 0.2% 24.7% 0.1%New Jersey 1,567,682 100.0% 0.0% 0.0% 0.0%North Carolina 783,378 86.6% 11.6% 1.7% 0.0%Utah 92,815 95.5% 2.2% 2.2% 0.0%Vermont 989,579 92.8% 6.6% 0.6% 0.0%Wisconsin 819,689 10.9% 1.2% 1.7% 0.1%
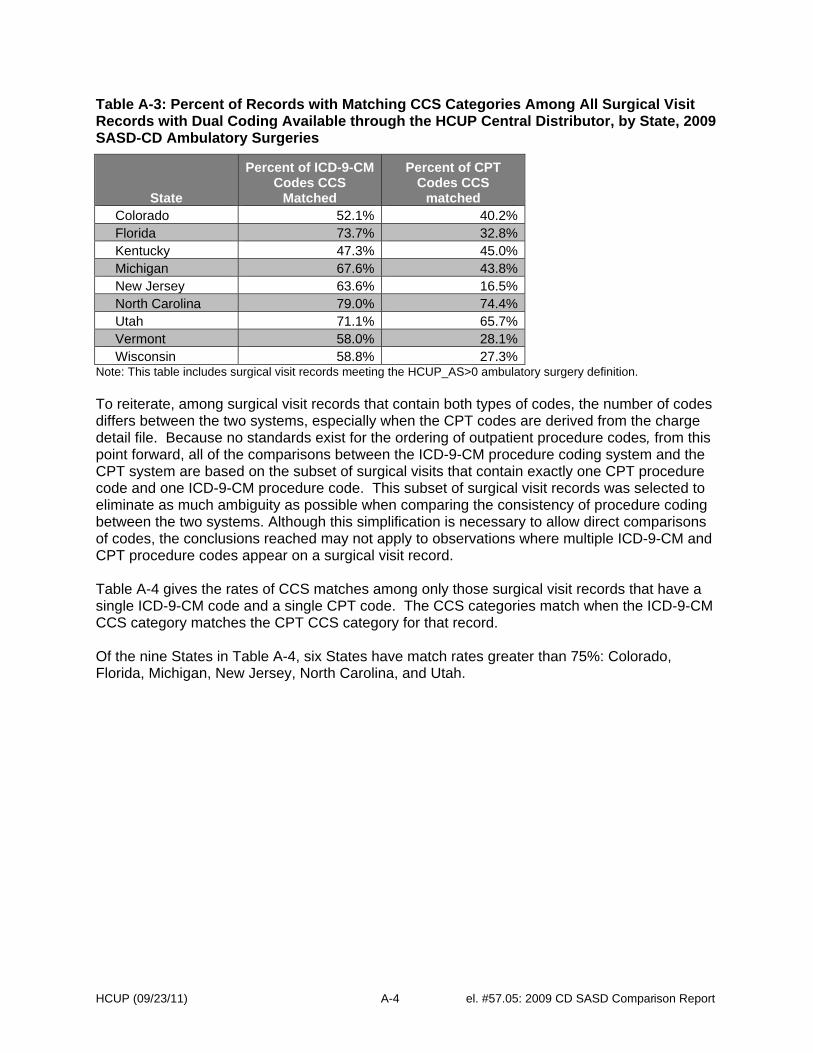
Note: This table includes surgical visit records meeting the HCUP_AS>0 ambulatory surgery definition. From this point forward, the comparisons between the ICD-9-CM and CPT coding systems are performed by comparing CCS categories. This approach is used because it is not possible to directly compare, or even unambiguously map codes, between the ICD-9-CM and CPT coding systems. The CCS categories serve as a bridge because the categories have the same meaning regardless of the coding system. Table A-3 shows the percentage of CCS categories that match between the two systems among surgical visits that code procedures using both coding systems (dual coding). For all States, the match rates are higher for the ICD-9-CM CCS categories than the CPT CCS categories regardless of the number of ICD-9-CM codes or number of CPT codes for each state. For example, Michigan contains 30 ICD-9-CM codes and 27 CPT codes per surgical record, and the match rate is higher for ICD-9-CM CCS codes (67.6%) than CPT CCS codes (43.8%). For Colorado, the number of ICD-9-CM codes and CPT codes are the same, 15 each per surgical record, and the ICD-9-CM CCS codes match rate is still higher (52.1%) than the CPT CCS codes match rate (40.2%). Lastly, Florida contains five ICD-9-CM codes and 10 CPT codes per surgical record, and the match rate is again higher for the ICD-9-CM CCS codes (73.7%) than the CPT CCS codes match rate (32.8%). These percentages indicate the extent to which the procedure information overlaps between the two coding systems. For example, Kentucky and Utah collect dual-coded data from their hospitals and show similar match rates between the two systems. Other States mandate the submission of only CPT codes; consequently, there is often not a matching ICD-9-CM procedure code for each CPT procedure code.
HCUP (09/23/11) A-4 el. #57.05: 2009 CD SASD Comparison Report
Table A-3: Percent of Records with Matching CCS Categories Among All Surgical Visit Records with Dual Coding Available through the HCUP Central Distributor, by State, 2009 SASD-CD Ambulatory Surgeries
State
Percent of ICD-9-CM Codes CCS
Matched
Percent of CPT Codes CCS
matched Colorado 52.1% 40.2%Florida 73.7% 32.8%Kentucky 47.3% 45.0%Michigan 67.6% 43.8%New Jersey 63.6% 16.5%North Carolina 79.0% 74.4%Utah 71.1% 65.7%Vermont 58.0% 28.1%Wisconsin 58.8% 27.3%
Note: This table includes surgical visit records meeting the HCUP_AS>0 ambulatory surgery definition. To reiterate, among surgical visit records that contain both types of codes, the number of codes differs between the two systems, especially when the CPT codes are derived from the charge detail file. Because no standards exist for the ordering of outpatient procedure codes, from this point forward, all of the comparisons between the ICD-9-CM procedure coding system and the CPT system are based on the subset of surgical visits that contain exactly one CPT procedure code and one ICD-9-CM procedure code. This subset of surgical visit records was selected to eliminate as much ambiguity as possible when comparing the consistency of procedure coding between the two systems. Although this simplification is necessary to allow direct comparisons of codes, the conclusions reached may not apply to observations where multiple ICD-9-CM and CPT procedure codes appear on a surgical visit record. Table A-4 gives the rates of CCS matches among only those surgical visit records that have a single ICD-9-CM code and a single CPT code. The CCS categories match when the ICD-9-CM CCS category matches the CPT CCS category for that record. Of the nine States in Table A-4, six States have match rates greater than 75%: Colorado, Florida, Michigan, New Jersey, North Carolina, and Utah.
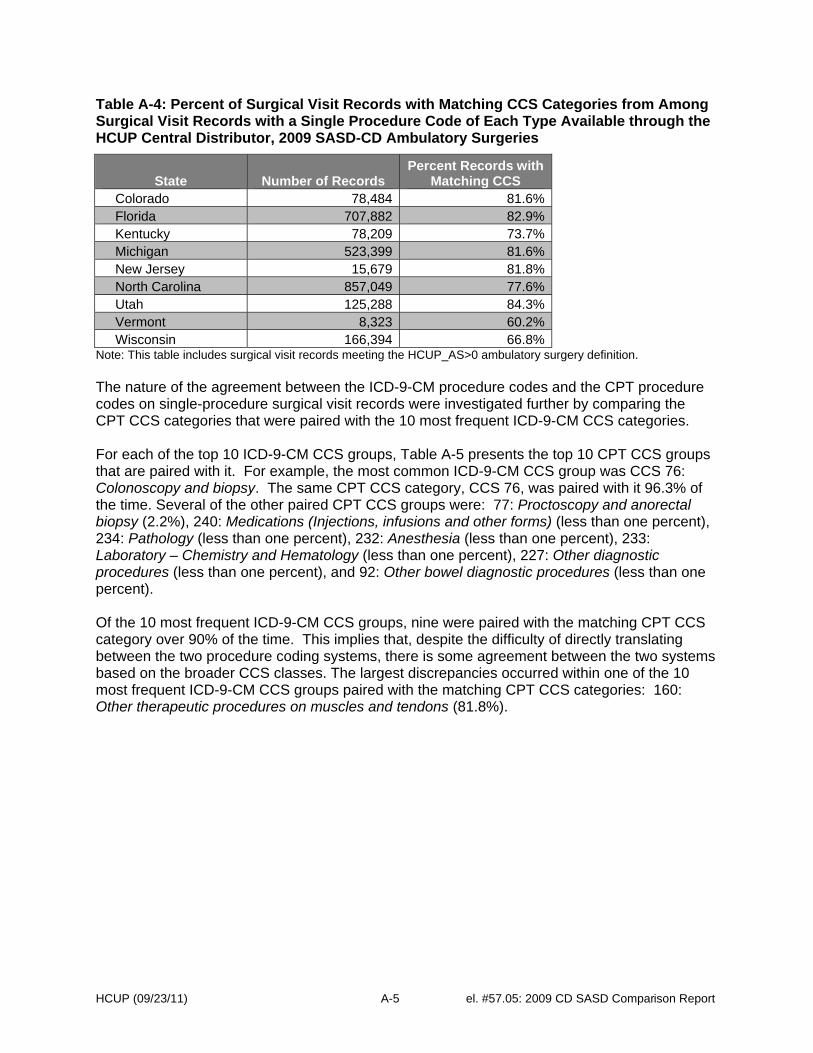
HCUP (09/23/11) A-5 el. #57.05: 2009 CD SASD Comparison Report
Table A-4: Percent of Surgical Visit Records with Matching CCS Categories from Among Surgical Visit Records with a Single Procedure Code of Each Type Available through the HCUP Central Distributor, 2009 SASD-CD Ambulatory Surgeries
State Number of Records Percent Records with
Matching CCS Colorado 78,484 81.6%Florida 707,882 82.9%Kentucky 78,209 73.7%Michigan 523,399 81.6%New Jersey 15,679 81.8%North Carolina 857,049 77.6%Utah 125,288 84.3%Vermont 8,323 60.2%Wisconsin 166,394 66.8%
Note: This table includes surgical visit records meeting the HCUP_AS>0 ambulatory surgery definition. The nature of the agreement between the ICD-9-CM procedure codes and the CPT procedure codes on single-procedure surgical visit records were investigated further by comparing the CPT CCS categories that were paired with the 10 most frequent ICD-9-CM CCS categories. For each of the top 10 ICD-9-CM CCS groups, Table A-5 presents the top 10 CPT CCS groups that are paired with it. For example, the most common ICD-9-CM CCS group was CCS 76: Colonoscopy and biopsy. The same CPT CCS category, CCS 76, was paired with it 96.3% of the time. Several of the other paired CPT CCS groups were: 77: Proctoscopy and anorectal biopsy (2.2%), 240: Medications (Injections, infusions and other forms) (less than one percent), 234: Pathology (less than one percent), 232: Anesthesia (less than one percent), 233: Laboratory – Chemistry and Hematology (less than one percent), 227: Other diagnostic procedures (less than one percent), and 92: Other bowel diagnostic procedures (less than one percent). Of the 10 most frequent ICD-9-CM CCS groups, nine were paired with the matching CPT CCS category over 90% of the time. This implies that, despite the difficulty of directly translating between the two procedure coding systems, there is some agreement between the two systems based on the broader CCS classes. The largest discrepancies occurred within one of the 10 most frequent ICD-9-CM CCS groups paired with the matching CPT CCS categories: 160: Other therapeutic procedures on muscles and tendons (81.8%).
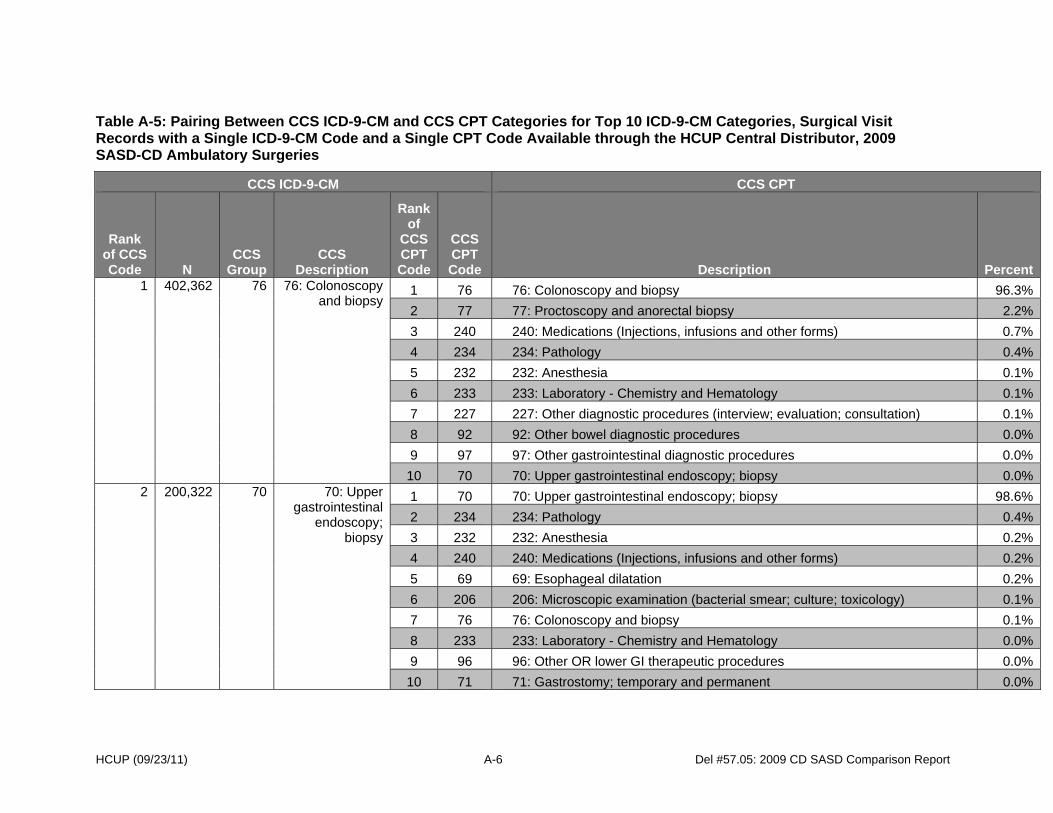
HCUP (09/23/11) A-6 Del #57.05: 2009 CD SASD Comparison Report
Table A-5: Pairing Between CCS ICD-9-CM and CCS CPT Categories for Top 10 ICD-9-CM Categories, Surgical Visit Records with a Single ICD-9-CM Code and a Single CPT Code Available through the HCUP Central Distributor, 2009 SASD-CD Ambulatory Surgeries
CCS ICD-9-CM CCS CPT
Rank of CCS Code N
CCS Group
CCS Description
Rank of
CCS CPT Code
CCS CPT Code Description Percent
1 402,362 76 76: Colonoscopy and biopsy
1 76 76: Colonoscopy and biopsy 96.3%
2 77 77: Proctoscopy and anorectal biopsy 2.2%
3 240 240: Medications (Injections, infusions and other forms) 0.7%
4 234 234: Pathology 0.4%
5 232 232: Anesthesia 0.1%
6 233 233: Laboratory - Chemistry and Hematology 0.1%
7 227 227: Other diagnostic procedures (interview; evaluation; consultation) 0.1%
8 92 92: Other bowel diagnostic procedures 0.0%
9 97 97: Other gastrointestinal diagnostic procedures 0.0%
10 70 70: Upper gastrointestinal endoscopy; biopsy 0.0% 2 200,322 70 70: Upper
gastrointestinal endoscopy;
biopsy
1 70 70: Upper gastrointestinal endoscopy; biopsy 98.6%
2 234 234: Pathology 0.4%
3 232 232: Anesthesia 0.2%
4 240 240: Medications (Injections, infusions and other forms) 0.2%
5 69 69: Esophageal dilatation 0.2%
6 206 206: Microscopic examination (bacterial smear; culture; toxicology) 0.1%
7 76 76: Colonoscopy and biopsy 0.1%
8 233 233: Laboratory - Chemistry and Hematology 0.0%
9 96 96: Other OR lower GI therapeutic procedures 0.0%
10 71 71: Gastrostomy; temporary and permanent 0.0%
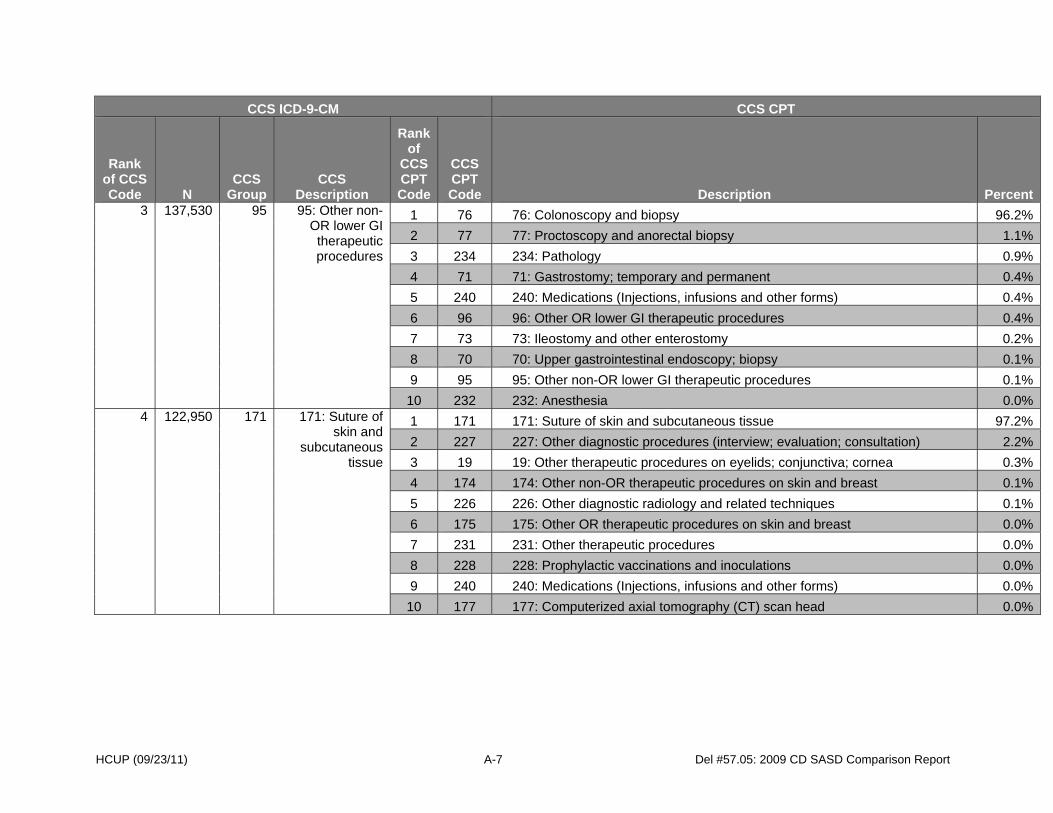
HCUP (09/23/11) A-7 Del #57.05: 2009 CD SASD Comparison Report
CCS ICD-9-CM CCS CPT
Rank of CCS Code N
CCS Group
CCS Description
Rank of
CCS CPT Code
CCS CPT Code Description Percent
3 137,530 95 95: Other non-OR lower GI therapeutic procedures
1 76 76: Colonoscopy and biopsy 96.2%
2 77 77: Proctoscopy and anorectal biopsy 1.1%
3 234 234: Pathology 0.9%
4 71 71: Gastrostomy; temporary and permanent 0.4%
5 240 240: Medications (Injections, infusions and other forms) 0.4%
6 96 96: Other OR lower GI therapeutic procedures 0.4%
7 73 73: Ileostomy and other enterostomy 0.2%
8 70 70: Upper gastrointestinal endoscopy; biopsy 0.1%
9 95 95: Other non-OR lower GI therapeutic procedures 0.1%
10 232 232: Anesthesia 0.0% 4 122,950 171 171: Suture of
skin and subcutaneous
tissue
1 171 171: Suture of skin and subcutaneous tissue 97.2%
2 227 227: Other diagnostic procedures (interview; evaluation; consultation) 2.2%
3 19 19: Other therapeutic procedures on eyelids; conjunctiva; cornea 0.3%
4 174 174: Other non-OR therapeutic procedures on skin and breast 0.1%
5 226 226: Other diagnostic radiology and related techniques 0.1%
6 175 175: Other OR therapeutic procedures on skin and breast 0.0%
7 231 231: Other therapeutic procedures 0.0%
8 228 228: Prophylactic vaccinations and inoculations 0.0%
9 240 240: Medications (Injections, infusions and other forms) 0.0%
10 177 177: Computerized axial tomography (CT) scan head 0.0%
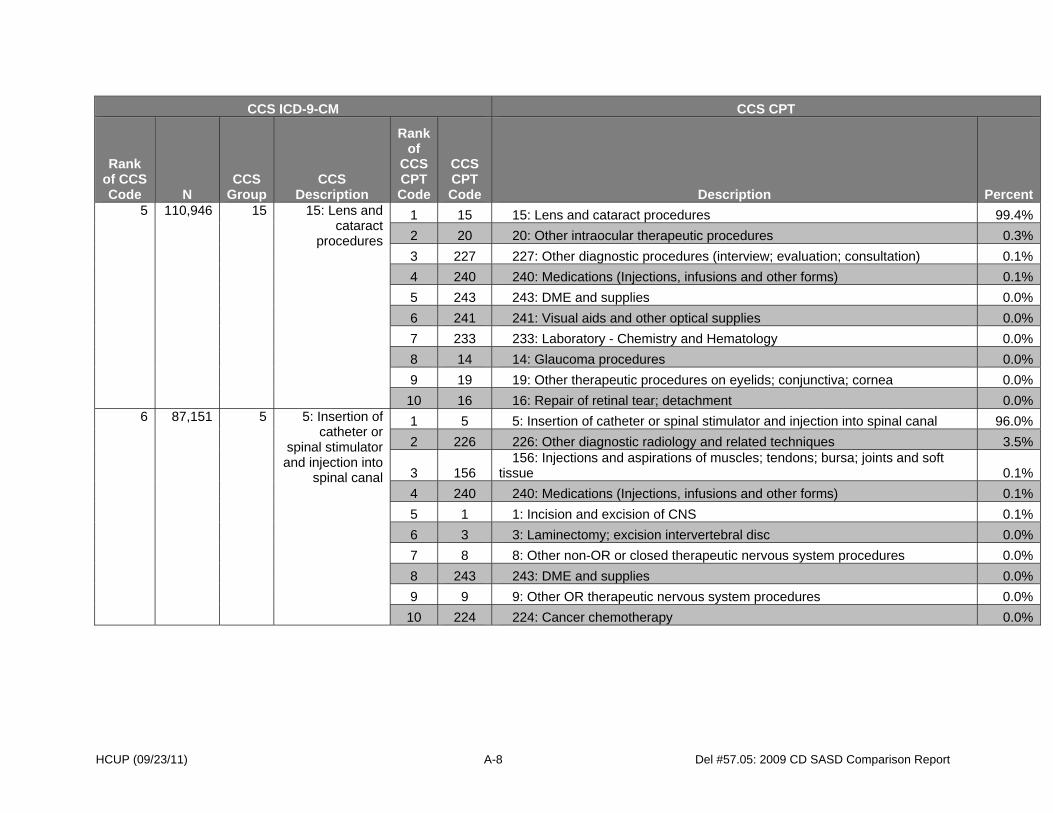
HCUP (09/23/11) A-8 Del #57.05: 2009 CD SASD Comparison Report
CCS ICD-9-CM CCS CPT
Rank of CCS Code N
CCS Group
CCS Description
Rank of
CCS CPT Code
CCS CPT Code Description Percent
5 110,946 15 15: Lens and cataract
procedures
1 15 15: Lens and cataract procedures 99.4%
2 20 20: Other intraocular therapeutic procedures 0.3%
3 227 227: Other diagnostic procedures (interview; evaluation; consultation) 0.1%
4 240 240: Medications (Injections, infusions and other forms) 0.1%
5 243 243: DME and supplies 0.0%
6 241 241: Visual aids and other optical supplies 0.0%
7 233 233: Laboratory - Chemistry and Hematology 0.0%
8 14 14: Glaucoma procedures 0.0%
9 19 19: Other therapeutic procedures on eyelids; conjunctiva; cornea 0.0%
10 16 16: Repair of retinal tear; detachment 0.0% 6 87,151 5 5: Insertion of
catheter or spinal stimulator and injection into
spinal canal
1 5 5: Insertion of catheter or spinal stimulator and injection into spinal canal 96.0%
2 226 226: Other diagnostic radiology and related techniques 3.5%
3 156 156: Injections and aspirations of muscles; tendons; bursa; joints and soft
tissue 0.1%
4 240 240: Medications (Injections, infusions and other forms) 0.1%
5 1 1: Incision and excision of CNS 0.1%
6 3 3: Laminectomy; excision intervertebral disc 0.0%
7 8 8: Other non-OR or closed therapeutic nervous system procedures 0.0%
8 243 243: DME and supplies 0.0%
9 9 9: Other OR therapeutic nervous system procedures 0.0%
10 224 224: Cancer chemotherapy 0.0%
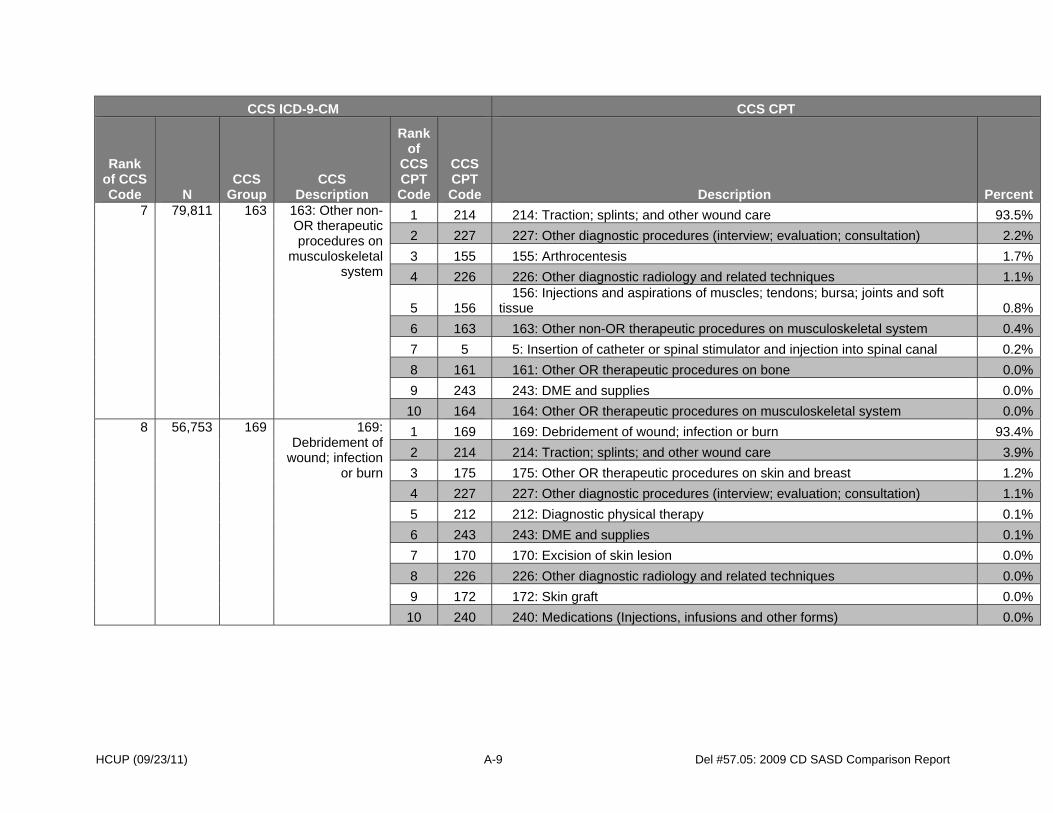
HCUP (09/23/11) A-9 Del #57.05: 2009 CD SASD Comparison Report
CCS ICD-9-CM CCS CPT
Rank of CCS Code N
CCS Group
CCS Description
Rank of
CCS CPT Code
CCS CPT Code Description Percent
7 79,811 163 163: Other non-OR therapeutic procedures on
musculoskeletal system
1 214 214: Traction; splints; and other wound care 93.5%
2 227 227: Other diagnostic procedures (interview; evaluation; consultation) 2.2%
3 155 155: Arthrocentesis 1.7%
4 226 226: Other diagnostic radiology and related techniques 1.1%
5 156 156: Injections and aspirations of muscles; tendons; bursa; joints and soft
tissue 0.8%
6 163 163: Other non-OR therapeutic procedures on musculoskeletal system 0.4%
7 5 5: Insertion of catheter or spinal stimulator and injection into spinal canal 0.2%
8 161 161: Other OR therapeutic procedures on bone 0.0%
9 243 243: DME and supplies 0.0%
10 164 164: Other OR therapeutic procedures on musculoskeletal system 0.0% 8 56,753 169 169:
Debridement of wound; infection
or burn
1 169 169: Debridement of wound; infection or burn 93.4%
2 214 214: Traction; splints; and other wound care 3.9%
3 175 175: Other OR therapeutic procedures on skin and breast 1.2%
4 227 227: Other diagnostic procedures (interview; evaluation; consultation) 1.1%
5 212 212: Diagnostic physical therapy 0.1%
6 243 243: DME and supplies 0.1%
7 170 170: Excision of skin lesion 0.0%
8 226 226: Other diagnostic radiology and related techniques 0.0%
9 172 172: Skin graft 0.0%
10 240 240: Medications (Injections, infusions and other forms) 0.0%
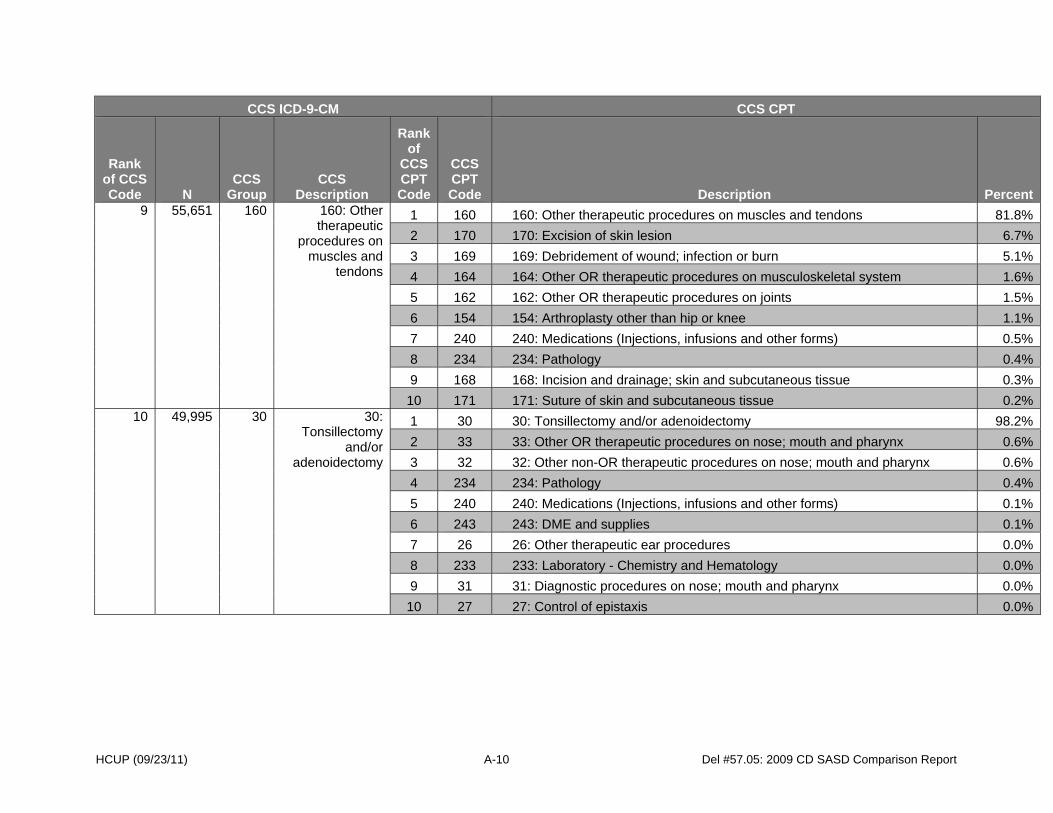
HCUP (09/23/11) A-10 Del #57.05: 2009 CD SASD Comparison Report
CCS ICD-9-CM CCS CPT
Rank of CCS Code N
CCS Group
CCS Description
Rank of
CCS CPT Code
CCS CPT Code Description Percent
9 55,651 160 160: Other therapeutic
procedures on muscles and
tendons
1 160 160: Other therapeutic procedures on muscles and tendons 81.8%
2 170 170: Excision of skin lesion 6.7%
3 169 169: Debridement of wound; infection or burn 5.1%
4 164 164: Other OR therapeutic procedures on musculoskeletal system 1.6%
5 162 162: Other OR therapeutic procedures on joints 1.5%
6 154 154: Arthroplasty other than hip or knee 1.1%
7 240 240: Medications (Injections, infusions and other forms) 0.5%
8 234 234: Pathology 0.4%
9 168 168: Incision and drainage; skin and subcutaneous tissue 0.3%
10 171 171: Suture of skin and subcutaneous tissue 0.2% 10 49,995 30 30:
Tonsillectomy and/or
adenoidectomy
1 30 30: Tonsillectomy and/or adenoidectomy 98.2%
2 33 33: Other OR therapeutic procedures on nose; mouth and pharynx 0.6%
3 32 32: Other non-OR therapeutic procedures on nose; mouth and pharynx 0.6%
4 234 234: Pathology 0.4%
5 240 240: Medications (Injections, infusions and other forms) 0.1%
6 243 243: DME and supplies 0.1%
7 26 26: Other therapeutic ear procedures 0.0%
8 233 233: Laboratory - Chemistry and Hematology 0.0%
9 31 31: Diagnostic procedures on nose; mouth and pharynx 0.0%
10 27 27: Control of epistaxis 0.0%

HCUP (09/23/11) A-11 Del #57.05: 2009 CD SASD Comparison Report
For each of the top 10 CPT CCS categories, Table A-6 presents the top 10 ICD-9-CM CCS categories that are paired with it. Once again, this table includes only those surgical visit records with a single ICD-9-CM code and a single CPT code. In Table A-6, nine of the top 10 CPT CCS classifications were paired with the same ICD-9-CM CCS classifications at least 90% of the time. The largest discrepancies occurred within one of the top 10 CPT CCS categories, 76: Colonoscopy and biopsy (74.1%). Eight of the top 10 CPT CCS categories shown in Table A-6 are also in the top 10 ICD-9-CM CCS categories shown in Table A-5. Both tables have categories 76: Colonoscopy and biopsy, and 70: Upper gastrointestinal endoscopy; biopsy listed as first and second, respectively. The two of the top 10 CPT CCS categories shown in Table A-6 that do not appear in the top 10 ICD-9-CM CCS categories shown in Table A-5 are 214: Traction; splints; and other wound care, and 168: Incision and drainage; skin and subcutaneous tissue.
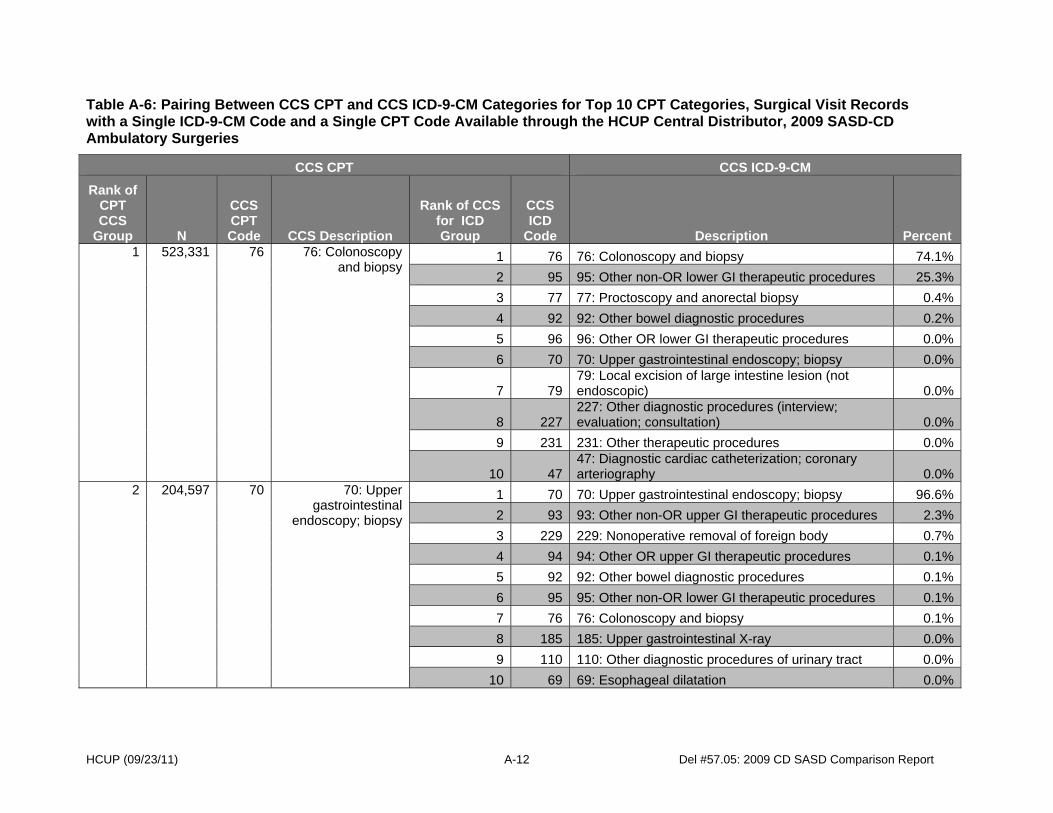
HCUP (09/23/11) A-12 Del #57.05: 2009 CD SASD Comparison Report
Table A-6: Pairing Between CCS CPT and CCS ICD-9-CM Categories for Top 10 CPT Categories, Surgical Visit Records with a Single ICD-9-CM Code and a Single CPT Code Available through the HCUP Central Distributor, 2009 SASD-CD Ambulatory Surgeries
CCS CPT CCS ICD-9-CM
Rank of CPT CCS
Group N
CCS CPT Code CCS Description
Rank of CCS for ICD Group
CCS ICD
Code Description Percent 1 523,331 76 76: Colonoscopy
and biopsy1 76 76: Colonoscopy and biopsy 74.1%
2 95 95: Other non-OR lower GI therapeutic procedures 25.3%
3 77 77: Proctoscopy and anorectal biopsy 0.4%
4 92 92: Other bowel diagnostic procedures 0.2%
5 96 96: Other OR lower GI therapeutic procedures 0.0%
6 70 70: Upper gastrointestinal endoscopy; biopsy 0.0%
7 7979: Local excision of large intestine lesion (not endoscopic) 0.0%
8 227227: Other diagnostic procedures (interview; evaluation; consultation) 0.0%
9 231 231: Other therapeutic procedures 0.0%
10 4747: Diagnostic cardiac catheterization; coronary arteriography 0.0%
2 204,597 70 70: Upper gastrointestinal
endoscopy; biopsy
1 70 70: Upper gastrointestinal endoscopy; biopsy 96.6%
2 93 93: Other non-OR upper GI therapeutic procedures 2.3%
3 229 229: Nonoperative removal of foreign body 0.7%
4 94 94: Other OR upper GI therapeutic procedures 0.1%
5 92 92: Other bowel diagnostic procedures 0.1%
6 95 95: Other non-OR lower GI therapeutic procedures 0.1%
7 76 76: Colonoscopy and biopsy 0.1%
8 185 185: Upper gastrointestinal X-ray 0.0%
9 110 110: Other diagnostic procedures of urinary tract 0.0%
10 69 69: Esophageal dilatation 0.0%

HCUP (09/23/11) A-13 Del #57.05: 2009 CD SASD Comparison Report
CCS CPT CCS ICD-9-CM
Rank of CPT CCS
Group N
CCS CPT Code CCS Description
Rank of CCS for ICD Group
CCS ICD
Code Description Percent 3 128,749 171 171: Suture of skin
and subcutaneous tissue
1 171 171: Suture of skin and subcutaneous tissue 92.8%
2 1919: Other therapeutic procedures on eyelids; conjunctiva; cornea 3.1%
3 3232: Other non-OR therapeutic procedures on nose; mouth and pharynx 2.2%
4 28 28: Plastic procedures on nose 0.7%
5 26 26: Other therapeutic ear procedures 0.5%
6 175175: Other OR therapeutic procedures on skin and breast 0.2%
7 170 170: Excision of skin lesion 0.1%
8 160160: Other therapeutic procedures on muscles and tendons 0.1%
9 132132: Other OR therapeutic procedures; female organs 0.1%
10 117117: Other non-OR therapeutic procedures; male genital 0.0%
4 110,812 15 15: Lens and cataract procedures
1 15 15: Lens and cataract procedures 99.5%
2 17 17: Destruction of lesion of retina and choroid 0.2%
3 20 20: Other intraocular therapeutic procedures 0.2%
4 14 14: Glaucoma procedures 0.0%
5 1919: Other therapeutic procedures on eyelids; conjunctiva; cornea 0.0%
6 2121: Other extraocular muscle and orbit therapeutic procedures 0.0%
7 16 16: Repair of retinal tear; detachment 0.0%
8 29 29: Dental procedures 0.0%
9 70 70: Upper gastrointestinal endoscopy; biopsy 0.0%
10
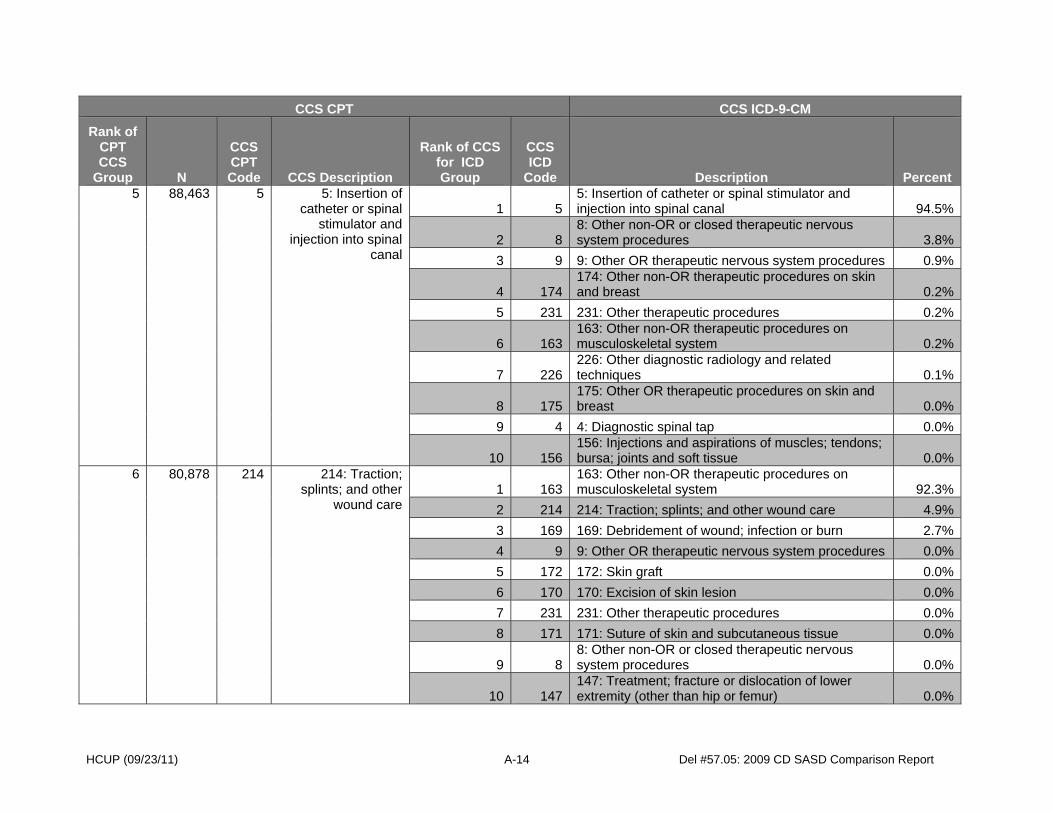
HCUP (09/23/11) A-14 Del #57.05: 2009 CD SASD Comparison Report
CCS CPT CCS ICD-9-CM
Rank of CPT CCS
Group N
CCS CPT Code CCS Description
Rank of CCS for ICD Group
CCS ICD
Code Description Percent 5 88,463 5 5: Insertion of
catheter or spinal stimulator and
injection into spinal canal
1 55: Insertion of catheter or spinal stimulator and injection into spinal canal 94.5%
2 88: Other non-OR or closed therapeutic nervous system procedures 3.8%
3 9 9: Other OR therapeutic nervous system procedures 0.9%
4 174174: Other non-OR therapeutic procedures on skin and breast 0.2%
5 231 231: Other therapeutic procedures 0.2%
6 163163: Other non-OR therapeutic procedures on musculoskeletal system 0.2%
7 226226: Other diagnostic radiology and related techniques 0.1%
8 175175: Other OR therapeutic procedures on skin and breast 0.0%
9 4 4: Diagnostic spinal tap 0.0%
10 156156: Injections and aspirations of muscles; tendons; bursa; joints and soft tissue 0.0%
6 80,878 214 214: Traction; splints; and other
wound care1 163
163: Other non-OR therapeutic procedures on musculoskeletal system 92.3%
2 214 214: Traction; splints; and other wound care 4.9%
3 169 169: Debridement of wound; infection or burn 2.7%
4 9 9: Other OR therapeutic nervous system procedures 0.0%
5 172 172: Skin graft 0.0%
6 170 170: Excision of skin lesion 0.0%
7 231 231: Other therapeutic procedures 0.0%
8 171 171: Suture of skin and subcutaneous tissue 0.0%
9 88: Other non-OR or closed therapeutic nervous system procedures 0.0%
10 147147: Treatment; fracture or dislocation of lower extremity (other than hip or femur) 0.0%

HCUP (09/23/11) A-15 Del #57.05: 2009 CD SASD Comparison Report
CCS CPT CCS ICD-9-CM
Rank of CPT CCS
Group N
CCS CPT Code CCS Description
Rank of CCS for ICD Group
CCS ICD
Code Description Percent 7 57,856 169 169: Debridement of
wound; infection or burn
1 169 169: Debridement of wound; infection or burn 91.6%
2 160160: Other therapeutic procedures on muscles and tendons 5.0%
3 142 142: Partial excision bone 2.0%
4 26 26: Other therapeutic ear procedures 0.7%
5 214 214: Traction; splints; and other wound care 0.2%
6 148 148: Other fracture and dislocation procedure 0.2%
7 166 166: Lumpectomy; quadrantectomy of breast 0.1%
8 9999: Other OR gastrointestinal therapeutic procedures 0.1%
9 172 172: Skin graft 0.1%
10 1 1: Incision and excision of CNS 0.0%8 49,145 30 30: Tonsillectomy
and/or adenoidectomy
1 30 30: Tonsillectomy and/or adenoidectomy 99.9%
2 3333: Other OR therapeutic procedures on nose; mouth and pharynx 0.1%
3 25 25: Diagnostic procedures on ear 0.0%
4 94 94: Other OR upper GI therapeutic procedures 0.0%
5 227227: Other diagnostic procedures (interview; evaluation; consultation) 0.0%
6 7 8
9
10
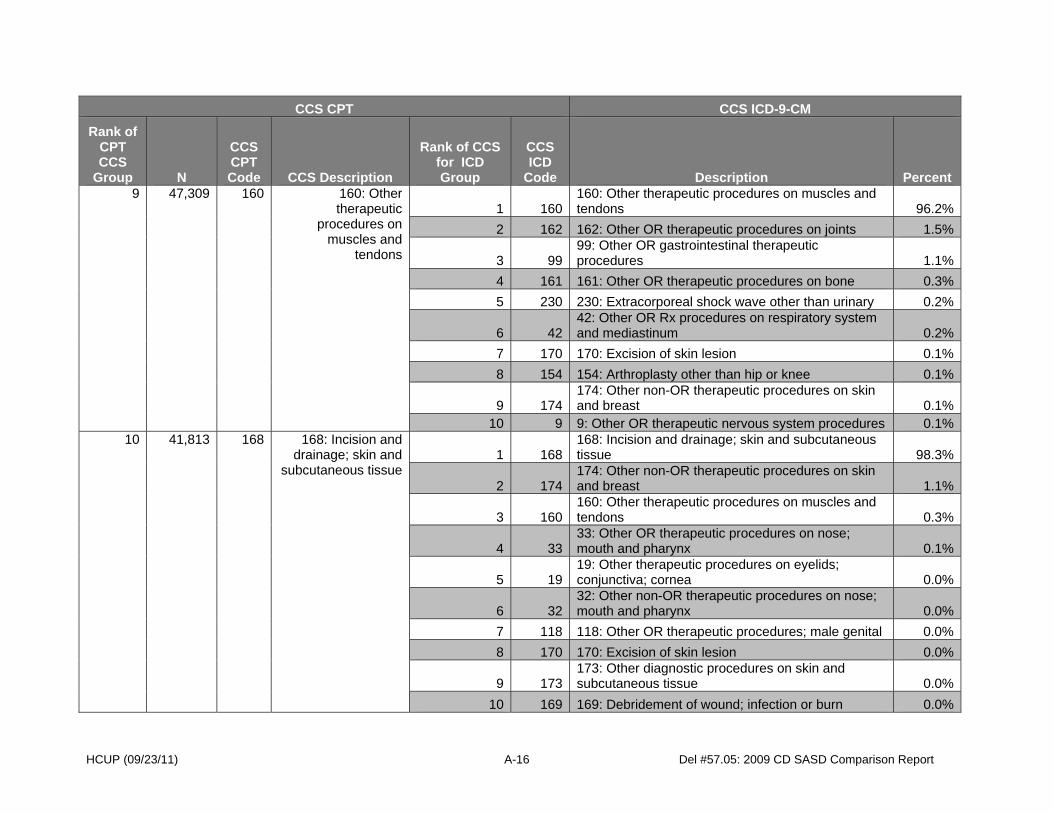
HCUP (09/23/11) A-16 Del #57.05: 2009 CD SASD Comparison Report
CCS CPT CCS ICD-9-CM
Rank of CPT CCS
Group N
CCS CPT Code CCS Description
Rank of CCS for ICD Group
CCS ICD
Code Description Percent 9 47,309 160 160: Other
therapeutic procedures on
muscles and tendons
1 160160: Other therapeutic procedures on muscles and tendons 96.2%
2 162 162: Other OR therapeutic procedures on joints 1.5%
3 9999: Other OR gastrointestinal therapeutic procedures 1.1%
4 161 161: Other OR therapeutic procedures on bone 0.3%
5 230 230: Extracorporeal shock wave other than urinary 0.2%
6 4242: Other OR Rx procedures on respiratory system and mediastinum 0.2%
7 170 170: Excision of skin lesion 0.1%
8 154 154: Arthroplasty other than hip or knee 0.1%
9 174174: Other non-OR therapeutic procedures on skin and breast 0.1%
10 9 9: Other OR therapeutic nervous system procedures 0.1%10 41,813 168 168: Incision and
drainage; skin and subcutaneous tissue
1 168168: Incision and drainage; skin and subcutaneous tissue 98.3%
2 174174: Other non-OR therapeutic procedures on skin and breast 1.1%
3 160160: Other therapeutic procedures on muscles and tendons 0.3%
4 3333: Other OR therapeutic procedures on nose; mouth and pharynx 0.1%
5 1919: Other therapeutic procedures on eyelids; conjunctiva; cornea 0.0%
6 3232: Other non-OR therapeutic procedures on nose; mouth and pharynx 0.0%
7 118 118: Other OR therapeutic procedures; male genital 0.0%
8 170 170: Excision of skin lesion 0.0%
9 173173: Other diagnostic procedures on skin and subcutaneous tissue 0.0%
10 169 169: Debridement of wound; infection or burn 0.0%
HCUP (09/23/11) A-17 Del #57.05: 2009 CD SASD Comp Rpt
Appendix A: Summary Nine States in the SASD-CD employ both ICD-9-CM and CPT procedure codes. Six States (California, Iowa, Maine, Maryland, Nebraska, and New York) use only CPT procedure codes, while one State (South Carolina) uses only ICD-9-CM procedure codes. Among States that employ both coding systems, varying levels of agreement exist between the two. CPT codes may be supplied in the core file or in the charge detail file. On average, the number of CPT procedure codes is higher (3.3 in the core file and 5.7 in the charge detail file) than the number of ICD-9-CM procedure codes (1.9). Also, the average number of CPT codes in the charge detail file is higher than the average number of CPT codes in the core file. Among surgical visit records with a single ICD-9-CM procedure code and a single CPT procedure code, there tends to be a high level of agreement between the CCS categories generated by the two coding systems. However, there are subtle differences between the two systems that result in different classifications for some procedures using the two types of codes. Consequently, analysts should exercise care when combining SASD-CD data across States that use different procedure coding systems.
APPENDIX B
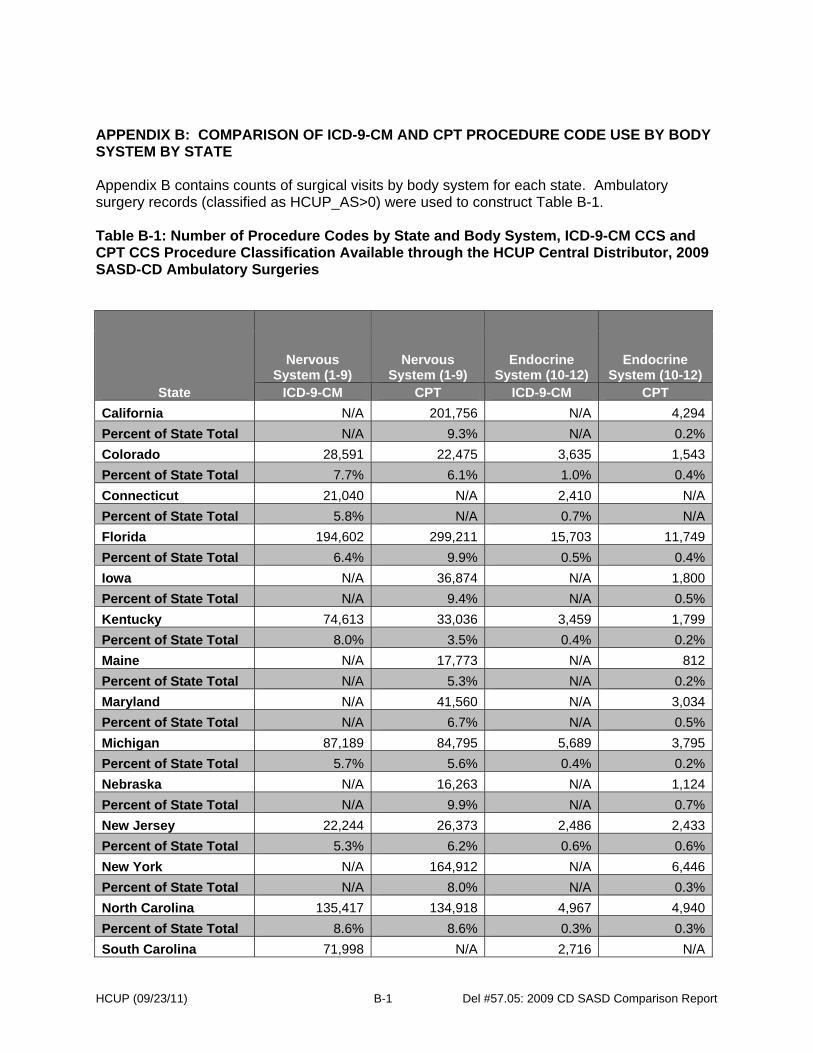
HCUP (09/23/11) B-1 Del #57.05: 2009 CD SASD Comparison Report
APPENDIX B: COMPARISON OF ICD-9-CM AND CPT PROCEDURE CODE USE BY BODY SYSTEM BY STATE Appendix B contains counts of surgical visits by body system for each state. Ambulatory surgery records (classified as HCUP_AS>0) were used to construct Table B-1. Table B-1: Number of Procedure Codes by State and Body System, ICD-9-CM CCS and CPT CCS Procedure Classification Available through the HCUP Central Distributor, 2009 SASD-CD Ambulatory Surgeries
State
Nervous System (1-9)
Nervous System (1-9)
Endocrine System (10-12)
Endocrine System (10-12)
ICD-9-CM CPT ICD-9-CM CPT
California N/A 201,756 N/A 4,294
Percent of State Total N/A 9.3% N/A 0.2%
Colorado 28,591 22,475 3,635 1,543
Percent of State Total 7.7% 6.1% 1.0% 0.4%
Connecticut 21,040 N/A 2,410 N/A
Percent of State Total 5.8% N/A 0.7% N/A
Florida 194,602 299,211 15,703 11,749
Percent of State Total 6.4% 9.9% 0.5% 0.4%
Iowa N/A 36,874 N/A 1,800
Percent of State Total N/A 9.4% N/A 0.5%
Kentucky 74,613 33,036 3,459 1,799
Percent of State Total 8.0% 3.5% 0.4% 0.2%
Maine N/A 17,773 N/A 812
Percent of State Total N/A 5.3% N/A 0.2%
Maryland N/A 41,560 N/A 3,034
Percent of State Total N/A 6.7% N/A 0.5%
Michigan 87,189 84,795 5,689 3,795
Percent of State Total 5.7% 5.6% 0.4% 0.2%
Nebraska N/A 16,263 N/A 1,124
Percent of State Total N/A 9.9% N/A 0.7%
New Jersey 22,244 26,373 2,486 2,433
Percent of State Total 5.3% 6.2% 0.6% 0.6%
New York N/A 164,912 N/A 6,446
Percent of State Total N/A 8.0% N/A 0.3%
North Carolina 135,417 134,918 4,967 4,940
Percent of State Total 8.6% 8.6% 0.3% 0.3%
South Carolina 71,998 N/A 2,716 N/A

HCUP (09/23/11) B-2 Del #57.05: 2009 CD SASD Comparison Report
State
Nervous System (1-9)
Nervous System (1-9)
Endocrine System (10-12)
Endocrine System (10-12)
ICD-9-CM CPT ICD-9-CM CPT
Percent of State Total 9.5% N/A 0.4% N/A
Utah 19,222 24,909 1,798 1,433
Percent of State Total 6.3% 8.1% 0.6% 0.5%
Vermont 9,373 8,439 552 221
Percent of State Total 10.1% 9.1% 0.6% 0.2%
Wisconsin 123,508 106,739 3,203 2,475Percent of State Total 12.5% 10.8% 0.3% 0.3%Total 1,206,139 1,608,905 83,142 62,905
Percent of Grand Total 5.1% 6.8% 0.3% 0.3%
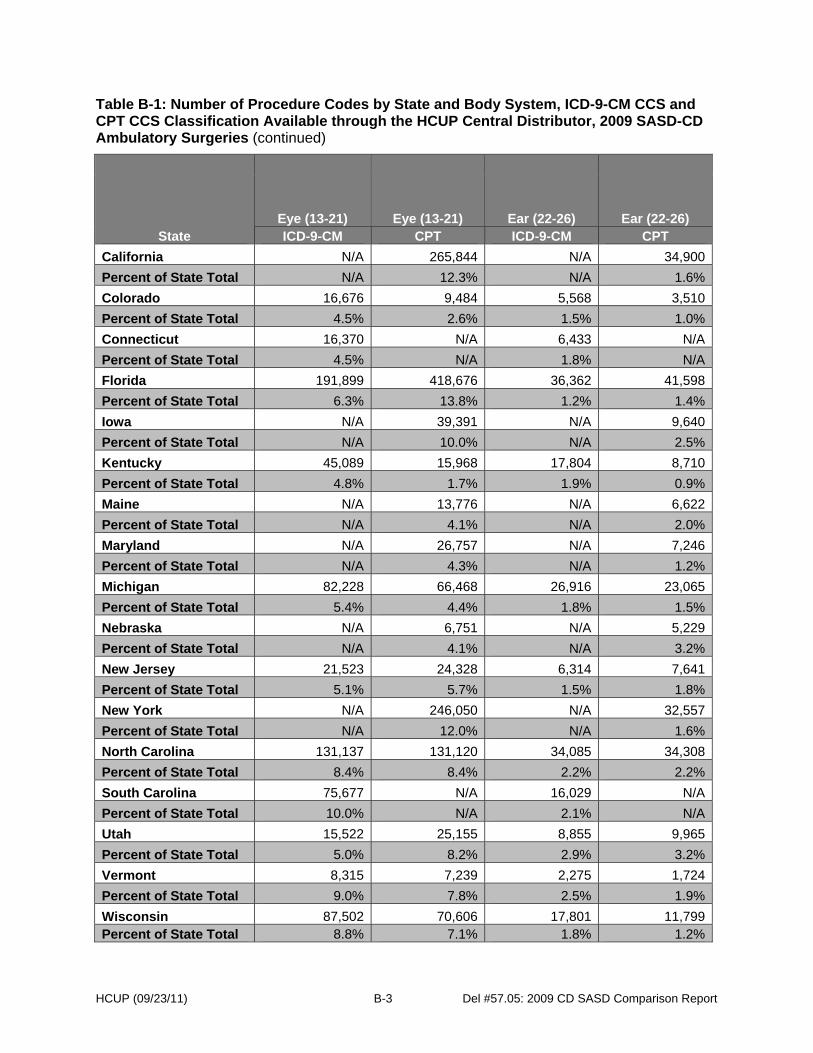
HCUP (09/23/11) B-3 Del #57.05: 2009 CD SASD Comparison Report
Table B-1: Number of Procedure Codes by State and Body System, ICD-9-CM CCS and CPT CCS Classification Available through the HCUP Central Distributor, 2009 SASD-CD Ambulatory Surgeries (continued)
State Eye (13-21) Eye (13-21) Ear (22-26) Ear (22-26) ICD-9-CM CPT ICD-9-CM CPT
California N/A 265,844 N/A 34,900
Percent of State Total N/A 12.3% N/A 1.6%
Colorado 16,676 9,484 5,568 3,510
Percent of State Total 4.5% 2.6% 1.5% 1.0%
Connecticut 16,370 N/A 6,433 N/A
Percent of State Total 4.5% N/A 1.8% N/A
Florida 191,899 418,676 36,362 41,598
Percent of State Total 6.3% 13.8% 1.2% 1.4%
Iowa N/A 39,391 N/A 9,640
Percent of State Total N/A 10.0% N/A 2.5%
Kentucky 45,089 15,968 17,804 8,710
Percent of State Total 4.8% 1.7% 1.9% 0.9%
Maine N/A 13,776 N/A 6,622
Percent of State Total N/A 4.1% N/A 2.0%
Maryland N/A 26,757 N/A 7,246
Percent of State Total N/A 4.3% N/A 1.2%
Michigan 82,228 66,468 26,916 23,065
Percent of State Total 5.4% 4.4% 1.8% 1.5%
Nebraska N/A 6,751 N/A 5,229
Percent of State Total N/A 4.1% N/A 3.2%
New Jersey 21,523 24,328 6,314 7,641
Percent of State Total 5.1% 5.7% 1.5% 1.8%
New York N/A 246,050 N/A 32,557
Percent of State Total N/A 12.0% N/A 1.6%
North Carolina 131,137 131,120 34,085 34,308
Percent of State Total 8.4% 8.4% 2.2% 2.2%
South Carolina 75,677 N/A 16,029 N/A
Percent of State Total 10.0% N/A 2.1% N/A
Utah 15,522 25,155 8,855 9,965
Percent of State Total 5.0% 8.2% 2.9% 3.2%
Vermont 8,315 7,239 2,275 1,724
Percent of State Total 9.0% 7.8% 2.5% 1.9%
Wisconsin 87,502 70,606 17,801 11,799Percent of State Total 8.8% 7.1% 1.8% 1.2%

HCUP (09/23/11) B-4 Del #57.05: 2009 CD SASD Comparison Report
State Eye (13-21) Eye (13-21) Ear (22-26) Ear (22-26) ICD-9-CM CPT ICD-9-CM CPT
Total 951,678 1,712,482 292,712 326,422
Percent of Grand Total 4.0% 7.2% 1.2% 1.4%

HCUP (09/23/11) B-5 Del #57.05: 2009 CD SASD Comparison Report
Table B-1: Number of Procedure Codes by State and Body System, ICD-9-CM CCS and CPT CCS Procedure Classification Available through the HCUP Central Distributor, 2009 SASD-CD Ambulatory Surgeries (continued)
State
Nose, Mouth, and Pharynx
(27-33)
Nose, Mouth, and Pharynx
(27-33) Respiratory
System (34-42) Respiratory
System (34-42) ICD-9-CM CPT ICD-9-CM CPT
California N/A 79,358 N/A 27,561
Percent of State Total N/A 3.7% N/A 1.3%
Colorado 25,934 16,134 7,933 4,237
Percent of State Total 7.0% 4.4% 2.1% 1.1%
Connecticut 15,466 N/A 5,790 N/A
Percent of State Total 4.3% N/A 1.6% N/A
Florida 75,626 82,743 39,846 47,168
Percent of State Total 2.5% 2.7% 1.3% 1.6%
Iowa N/A 17,808 N/A 11,322
Percent of State Total N/A 4.5% N/A 2.9%
Kentucky 28,951 12,808 10,157 7,696
Percent of State Total 3.1% 1.4% 1.1% 0.8%
Maine N/A 7,091 N/A 5,851
Percent of State Total N/A 2.1% N/A 1.7%
Maryland N/A 21,689 N/A 27,157
Percent of State Total N/A 3.5% N/A 4.4%
Michigan 71,137 55,763 29,472 38,876
Percent of State Total 4.7% 3.7% 1.9% 2.6%
Nebraska N/A 9,938 N/A 4,803
Percent of State Total N/A 6.1% N/A 2.9%
New Jersey 18,525 19,662 4,294 6,301
Percent of State Total 4.4% 4.6% 1.0% 1.5%
New York N/A 70,922 N/A 27,187
Percent of State Total N/A 3.5% N/A 1.3%
North Carolina 61,002 59,504 22,704 24,248
Percent of State Total 3.9% 3.8% 1.4% 1.5%
South Carolina 36,645 N/A 14,158 N/A
Percent of State Total 4.8% N/A 1.9% N/A
Utah 21,339 22,424 2,584 2,763
Percent of State Total 6.9% 7.3% 0.8% 0.9%
Vermont 3,424 2,130 1,397 1,241
Percent of State Total 3.7% 2.3% 1.5% 1.3%
Wisconsin 37,511 25,401 12,376 12,311Percent of State Total 3.8% 2.6% 1.3% 1.2%

HCUP (09/23/11) B-6 Del #57.05: 2009 CD SASD Comparison Report
State
Nose, Mouth, and Pharynx
(27-33)
Nose, Mouth, and Pharynx
(27-33) Respiratory
System (34-42) Respiratory
System (34-42) ICD-9-CM CPT ICD-9-CM CPT
Total 628,648 667,718 237,370 325,313
Percent of Grand Total 2.6% 2.8% 1.0% 1.4%
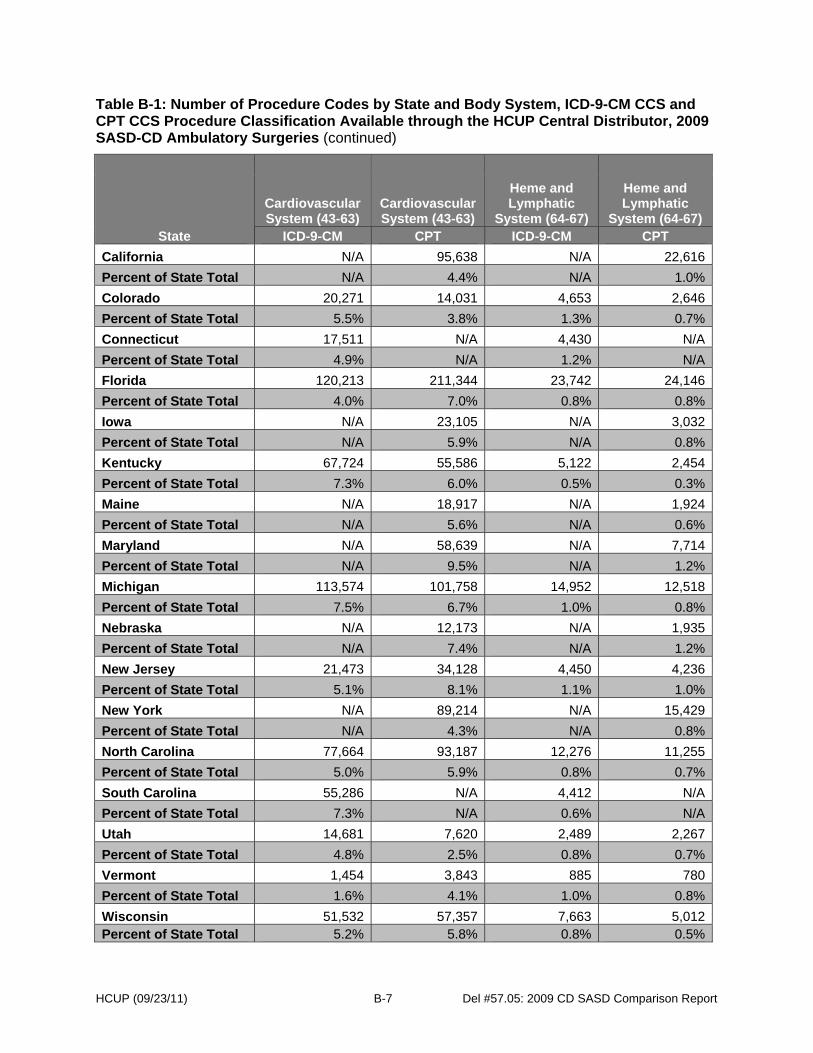
HCUP (09/23/11) B-7 Del #57.05: 2009 CD SASD Comparison Report
Table B-1: Number of Procedure Codes by State and Body System, ICD-9-CM CCS and CPT CCS Procedure Classification Available through the HCUP Central Distributor, 2009 SASD-CD Ambulatory Surgeries (continued)
State
Cardiovascular System (43-63)
Cardiovascular System (43-63)
Heme and Lymphatic
System (64-67)
Heme and Lymphatic
System (64-67) ICD-9-CM CPT ICD-9-CM CPT
California N/A 95,638 N/A 22,616
Percent of State Total N/A 4.4% N/A 1.0%
Colorado 20,271 14,031 4,653 2,646
Percent of State Total 5.5% 3.8% 1.3% 0.7%
Connecticut 17,511 N/A 4,430 N/A
Percent of State Total 4.9% N/A 1.2% N/A
Florida 120,213 211,344 23,742 24,146
Percent of State Total 4.0% 7.0% 0.8% 0.8%
Iowa N/A 23,105 N/A 3,032
Percent of State Total N/A 5.9% N/A 0.8%
Kentucky 67,724 55,586 5,122 2,454
Percent of State Total 7.3% 6.0% 0.5% 0.3%
Maine N/A 18,917 N/A 1,924
Percent of State Total N/A 5.6% N/A 0.6%
Maryland N/A 58,639 N/A 7,714
Percent of State Total N/A 9.5% N/A 1.2%
Michigan 113,574 101,758 14,952 12,518
Percent of State Total 7.5% 6.7% 1.0% 0.8%
Nebraska N/A 12,173 N/A 1,935
Percent of State Total N/A 7.4% N/A 1.2%
New Jersey 21,473 34,128 4,450 4,236
Percent of State Total 5.1% 8.1% 1.1% 1.0%
New York N/A 89,214 N/A 15,429
Percent of State Total N/A 4.3% N/A 0.8%
North Carolina 77,664 93,187 12,276 11,255
Percent of State Total 5.0% 5.9% 0.8% 0.7%
South Carolina 55,286 N/A 4,412 N/A
Percent of State Total 7.3% N/A 0.6% N/A
Utah 14,681 7,620 2,489 2,267
Percent of State Total 4.8% 2.5% 0.8% 0.7%
Vermont 1,454 3,843 885 780
Percent of State Total 1.6% 4.1% 1.0% 0.8%
Wisconsin 51,532 57,357 7,663 5,012Percent of State Total 5.2% 5.8% 0.8% 0.5%

HCUP (09/23/11) B-8 Del #57.05: 2009 CD SASD Comparison Report
State
Cardiovascular System (43-63)
Cardiovascular System (43-63)
Heme and Lymphatic
System (64-67)
Heme and Lymphatic
System (64-67) ICD-9-CM CPT ICD-9-CM CPT
Total 906,844 1,170,697 138,019 153,488
Percent of Grand Total 3.8% 4.9% 0.6% 0.6%

HCUP (09/23/11) B-9 Del #57.05: 2009 CD SASD Comparison Report
Table B-1: Number of Procedure Codes by State and Body System, ICD-9-CM CCS and CPT CCS Procedure Classification Available through the HCUP Central Distributor, 2009 SASD-CD Ambulatory Surgeries (continued)
State
Digestive System (68-99)
Digestive System (68-99)
Urinary System (100-112)
Urinary System (100-112)
ICD-9-CM CPT ICD-9-CM CPT
California N/A 759,003 N/A 79,981
Percent of State Total N/A 35.0% N/A 3.7%
Colorado 83,108 59,042 18,354 11,583
Percent of State Total 22.5% 16.0% 5.0% 3.1%
Connecticut 136,017 N/A 13,018 N/A
Percent of State Total 37.7% N/A 3.6% N/A
Florida 629,121 1,025,875 102,247 120,354
Percent of State Total 20.8% 33.9% 3.4% 4.0%
Iowa N/A 127,633 N/A 13,663
Percent of State Total N/A 32.5% N/A 3.5%
Kentucky 212,009 102,627 47,626 23,052
Percent of State Total 22.7% 11.0% 5.1% 2.5%
Maine N/A 87,529 N/A 15,684
Percent of State Total N/A 25.9% N/A 4.6%
Maryland N/A 112,603 N/A 28,804
Percent of State Total N/A 18.2% N/A 4.7%
Michigan 402,956 380,627 86,520 79,351
Percent of State Total 26.5% 25.0% 5.7% 5.2%
Nebraska N/A 60,225 N/A 7,824
Percent of State Total N/A 36.8% N/A 4.8%
New Jersey 82,100 106,634 19,337 22,845
Percent of State Total 19.4% 25.2% 4.6% 5.4%
New York N/A 707,144 N/A 73,591
Percent of State Total N/A 34.4% N/A 3.6%
North Carolina 399,731 401,639 91,011 86,147
Percent of State Total 25.5% 25.6% 5.8% 5.5%
South Carolina 228,985 N/A 34,673 N/A
Percent of State Total 30.3% N/A 4.6% N/A
Utah 94,726 105,526 7,628 9,324
Percent of State Total 30.8% 34.3% 2.5% 3.0%
Vermont 27,276 22,936 3,953 3,552
Percent of State Total 29.4% 24.7% 4.3% 3.8%
Wisconsin 335,447 253,746 37,439 24,490Percent of State Total 33.9% 25.6% 3.8% 2.5%
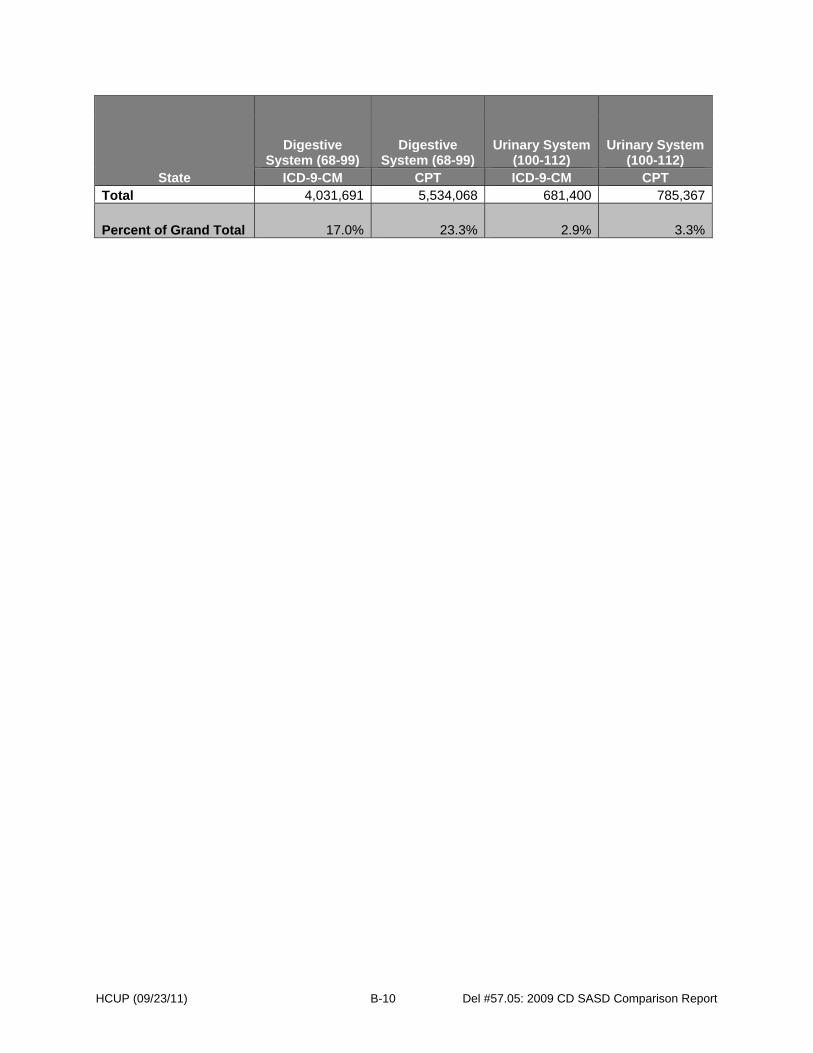
HCUP (09/23/11) B-10 Del #57.05: 2009 CD SASD Comparison Report
State
Digestive System (68-99)
Digestive System (68-99)
Urinary System (100-112)
Urinary System (100-112)
ICD-9-CM CPT ICD-9-CM CPT Total 4,031,691 5,534,068 681,400 785,367
Percent of Grand Total 17.0% 23.3% 2.9% 3.3%
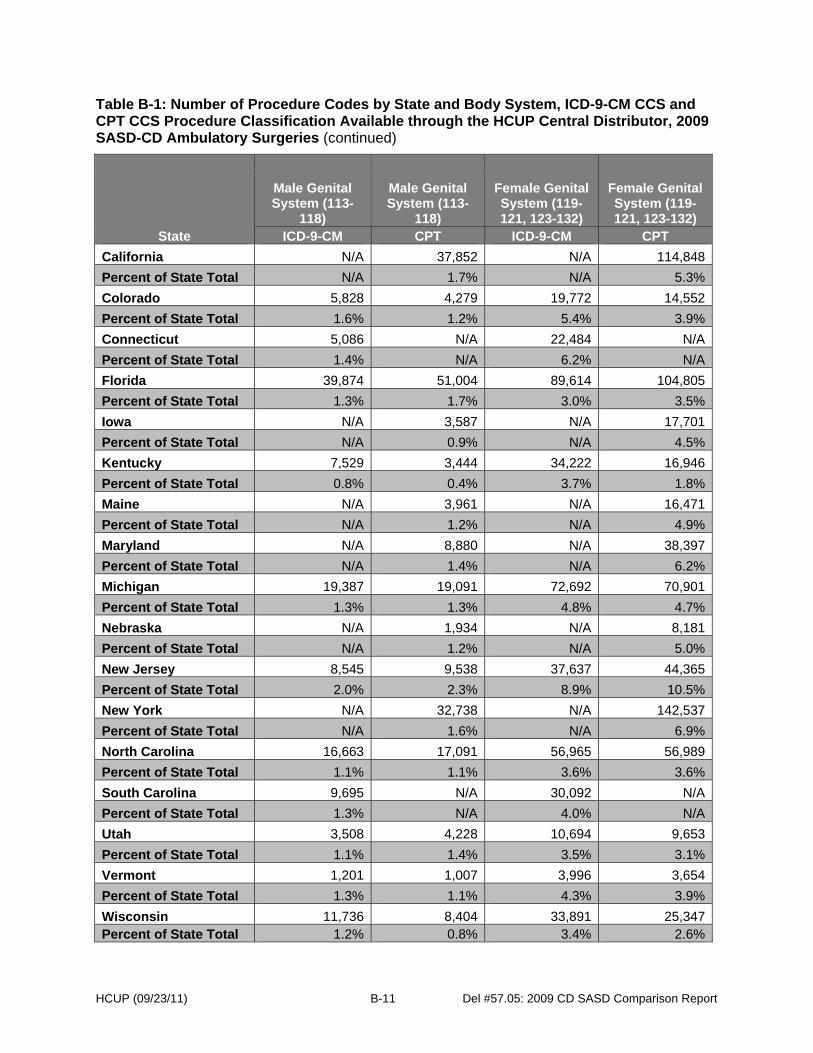
HCUP (09/23/11) B-11 Del #57.05: 2009 CD SASD Comparison Report
Table B-1: Number of Procedure Codes by State and Body System, ICD-9-CM CCS and CPT CCS Procedure Classification Available through the HCUP Central Distributor, 2009 SASD-CD Ambulatory Surgeries (continued)
State
Male Genital System (113-
118)
Male Genital System (113-
118)
Female Genital System (119-121, 123-132)
Female Genital System (119-121, 123-132)
ICD-9-CM CPT ICD-9-CM CPT
California N/A 37,852 N/A 114,848
Percent of State Total N/A 1.7% N/A 5.3%
Colorado 5,828 4,279 19,772 14,552
Percent of State Total 1.6% 1.2% 5.4% 3.9%
Connecticut 5,086 N/A 22,484 N/A
Percent of State Total 1.4% N/A 6.2% N/A
Florida 39,874 51,004 89,614 104,805
Percent of State Total 1.3% 1.7% 3.0% 3.5%
Iowa N/A 3,587 N/A 17,701
Percent of State Total N/A 0.9% N/A 4.5%
Kentucky 7,529 3,444 34,222 16,946
Percent of State Total 0.8% 0.4% 3.7% 1.8%
Maine N/A 3,961 N/A 16,471
Percent of State Total N/A 1.2% N/A 4.9%
Maryland N/A 8,880 N/A 38,397
Percent of State Total N/A 1.4% N/A 6.2%
Michigan 19,387 19,091 72,692 70,901
Percent of State Total 1.3% 1.3% 4.8% 4.7%
Nebraska N/A 1,934 N/A 8,181
Percent of State Total N/A 1.2% N/A 5.0%
New Jersey 8,545 9,538 37,637 44,365
Percent of State Total 2.0% 2.3% 8.9% 10.5%
New York N/A 32,738 N/A 142,537
Percent of State Total N/A 1.6% N/A 6.9%
North Carolina 16,663 17,091 56,965 56,989
Percent of State Total 1.1% 1.1% 3.6% 3.6%
South Carolina 9,695 N/A 30,092 N/A
Percent of State Total 1.3% N/A 4.0% N/A
Utah 3,508 4,228 10,694 9,653
Percent of State Total 1.1% 1.4% 3.5% 3.1%
Vermont 1,201 1,007 3,996 3,654
Percent of State Total 1.3% 1.1% 4.3% 3.9%
Wisconsin 11,736 8,404 33,891 25,347Percent of State Total 1.2% 0.8% 3.4% 2.6%

HCUP (09/23/11) B-12 Del #57.05: 2009 CD SASD Comparison Report
State
Male Genital System (113-
118)
Male Genital System (113-
118)
Female Genital System (119-121, 123-132)
Female Genital System (119-121, 123-132)
ICD-9-CM CPT ICD-9-CM CPT Total 199,337 264,949 683,874 919,763
Percent of Grand Total 0.8% 1.1% 2.9% 3.9%
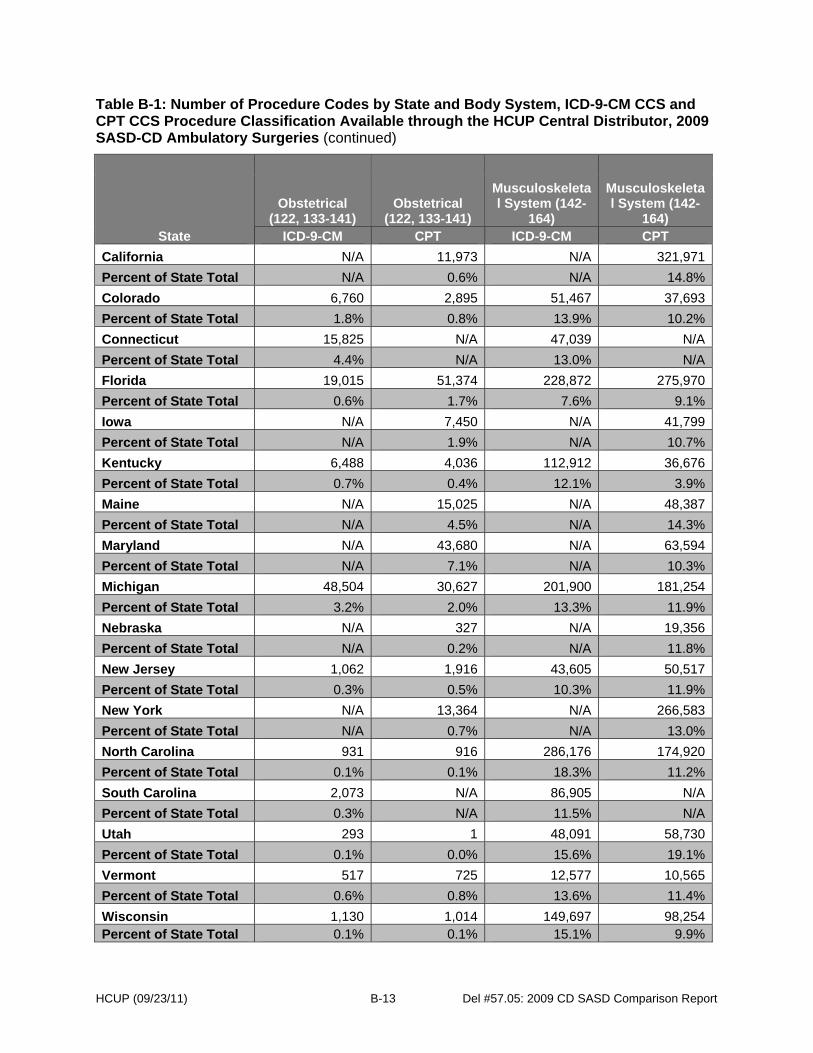
HCUP (09/23/11) B-13 Del #57.05: 2009 CD SASD Comparison Report
Table B-1: Number of Procedure Codes by State and Body System, ICD-9-CM CCS and CPT CCS Procedure Classification Available through the HCUP Central Distributor, 2009 SASD-CD Ambulatory Surgeries (continued)
State
Obstetrical (122, 133-141)
Obstetrical (122, 133-141)
Musculoskeletal System (142-
164)
Musculoskeletal System (142-
164) ICD-9-CM CPT ICD-9-CM CPT
California N/A 11,973 N/A 321,971
Percent of State Total N/A 0.6% N/A 14.8%
Colorado 6,760 2,895 51,467 37,693
Percent of State Total 1.8% 0.8% 13.9% 10.2%
Connecticut 15,825 N/A 47,039 N/A
Percent of State Total 4.4% N/A 13.0% N/A
Florida 19,015 51,374 228,872 275,970
Percent of State Total 0.6% 1.7% 7.6% 9.1%
Iowa N/A 7,450 N/A 41,799
Percent of State Total N/A 1.9% N/A 10.7%
Kentucky 6,488 4,036 112,912 36,676
Percent of State Total 0.7% 0.4% 12.1% 3.9%
Maine N/A 15,025 N/A 48,387
Percent of State Total N/A 4.5% N/A 14.3%
Maryland N/A 43,680 N/A 63,594
Percent of State Total N/A 7.1% N/A 10.3%
Michigan 48,504 30,627 201,900 181,254
Percent of State Total 3.2% 2.0% 13.3% 11.9%
Nebraska N/A 327 N/A 19,356
Percent of State Total N/A 0.2% N/A 11.8%
New Jersey 1,062 1,916 43,605 50,517
Percent of State Total 0.3% 0.5% 10.3% 11.9%
New York N/A 13,364 N/A 266,583
Percent of State Total N/A 0.7% N/A 13.0%
North Carolina 931 916 286,176 174,920
Percent of State Total 0.1% 0.1% 18.3% 11.2%
South Carolina 2,073 N/A 86,905 N/A
Percent of State Total 0.3% N/A 11.5% N/A
Utah 293 1 48,091 58,730
Percent of State Total 0.1% 0.0% 15.6% 19.1%
Vermont 517 725 12,577 10,565
Percent of State Total 0.6% 0.8% 13.6% 11.4%
Wisconsin 1,130 1,014 149,697 98,254Percent of State Total 0.1% 0.1% 15.1% 9.9%

HCUP (09/23/11) B-14 Del #57.05: 2009 CD SASD Comparison Report
State
Obstetrical (122, 133-141)
Obstetrical (122, 133-141)
Musculoskeletal System (142-
164)
Musculoskeletal System (142-
164) ICD-9-CM CPT ICD-9-CM CPT
Total 205,740 264,061 1,869,025 2,152,577
Percent of Grand Total 0.9% 1.1% 7.9% 9.1%
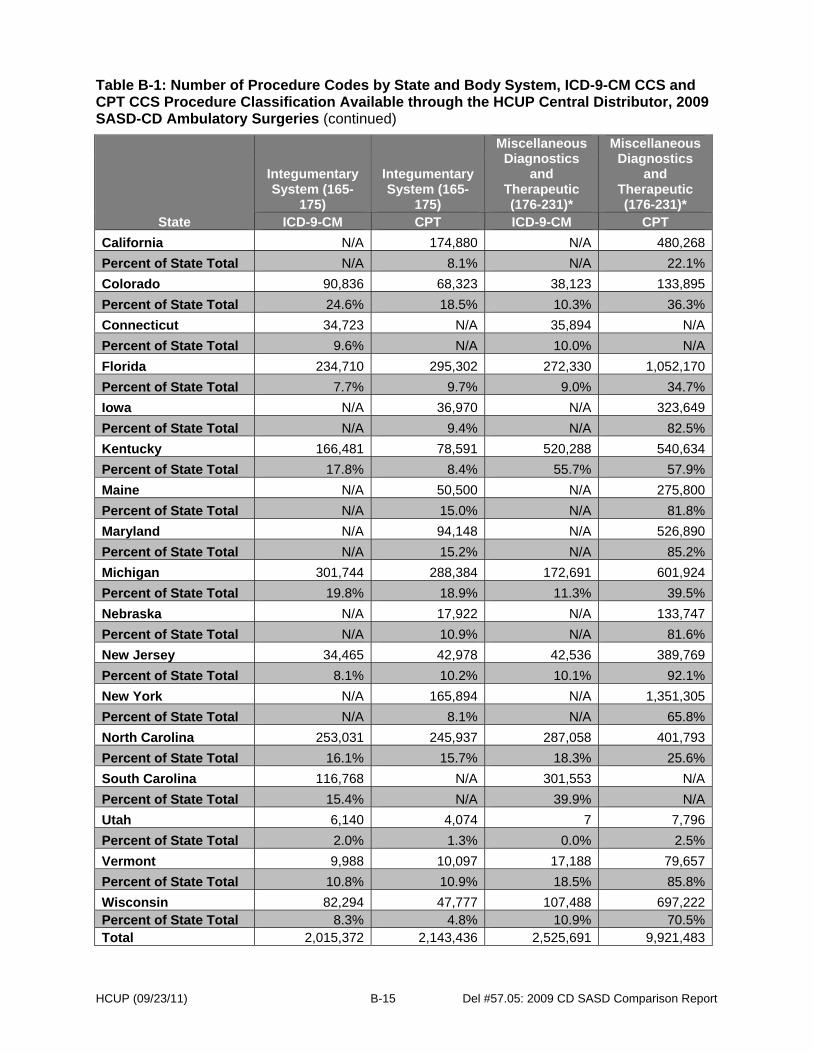
HCUP (09/23/11) B-15 Del #57.05: 2009 CD SASD Comparison Report
Table B-1: Number of Procedure Codes by State and Body System, ICD-9-CM CCS and CPT CCS Procedure Classification Available through the HCUP Central Distributor, 2009 SASD-CD Ambulatory Surgeries (continued)
State
Integumentary System (165-
175)
Integumentary System (165-
175)
Miscellaneous Diagnostics
and Therapeutic (176-231)*
Miscellaneous Diagnostics
and Therapeutic (176-231)*
ICD-9-CM CPT ICD-9-CM CPT
California N/A 174,880 N/A 480,268
Percent of State Total N/A 8.1% N/A 22.1%
Colorado 90,836 68,323 38,123 133,895
Percent of State Total 24.6% 18.5% 10.3% 36.3%
Connecticut 34,723 N/A 35,894 N/A
Percent of State Total 9.6% N/A 10.0% N/A
Florida 234,710 295,302 272,330 1,052,170
Percent of State Total 7.7% 9.7% 9.0% 34.7%
Iowa N/A 36,970 N/A 323,649
Percent of State Total N/A 9.4% N/A 82.5%
Kentucky 166,481 78,591 520,288 540,634
Percent of State Total 17.8% 8.4% 55.7% 57.9%
Maine N/A 50,500 N/A 275,800
Percent of State Total N/A 15.0% N/A 81.8%
Maryland N/A 94,148 N/A 526,890
Percent of State Total N/A 15.2% N/A 85.2%
Michigan 301,744 288,384 172,691 601,924
Percent of State Total 19.8% 18.9% 11.3% 39.5%
Nebraska N/A 17,922 N/A 133,747
Percent of State Total N/A 10.9% N/A 81.6%
New Jersey 34,465 42,978 42,536 389,769
Percent of State Total 8.1% 10.2% 10.1% 92.1%
New York N/A 165,894 N/A 1,351,305
Percent of State Total N/A 8.1% N/A 65.8%
North Carolina 253,031 245,937 287,058 401,793
Percent of State Total 16.1% 15.7% 18.3% 25.6%
South Carolina 116,768 N/A 301,553 N/A
Percent of State Total 15.4% N/A 39.9% N/A
Utah 6,140 4,074 7 7,796
Percent of State Total 2.0% 1.3% 0.0% 2.5%
Vermont 9,988 10,097 17,188 79,657
Percent of State Total 10.8% 10.9% 18.5% 85.8%
Wisconsin 82,294 47,777 107,488 697,222Percent of State Total 8.3% 4.8% 10.9% 70.5%Total 2,015,372 2,143,436 2,525,691 9,921,483
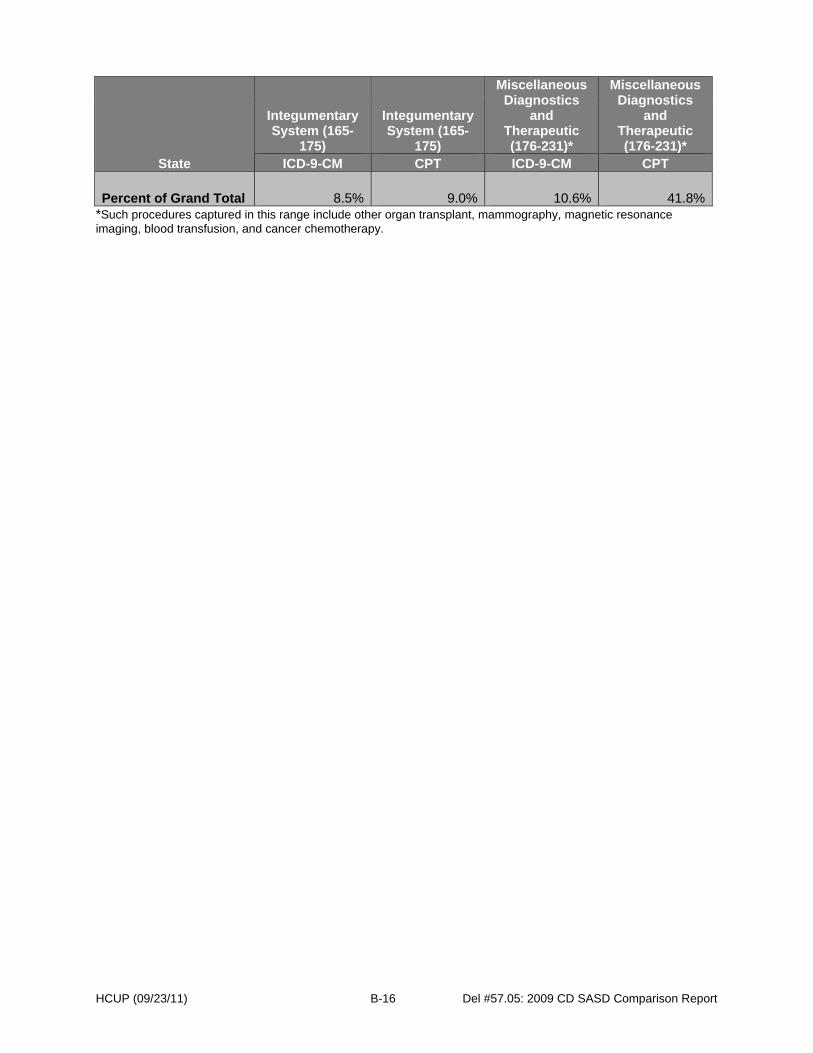
HCUP (09/23/11) B-16 Del #57.05: 2009 CD SASD Comparison Report
State
Integumentary System (165-
175)
Integumentary System (165-
175)
Miscellaneous Diagnostics
and Therapeutic (176-231)*
Miscellaneous Diagnostics
and Therapeutic (176-231)*
ICD-9-CM CPT ICD-9-CM CPT
Percent of Grand Total 8.5% 9.0% 10.6% 41.8%*Such procedures captured in this range include other organ transplant, mammography, magnetic resonance imaging, blood transfusion, and cancer chemotherapy.
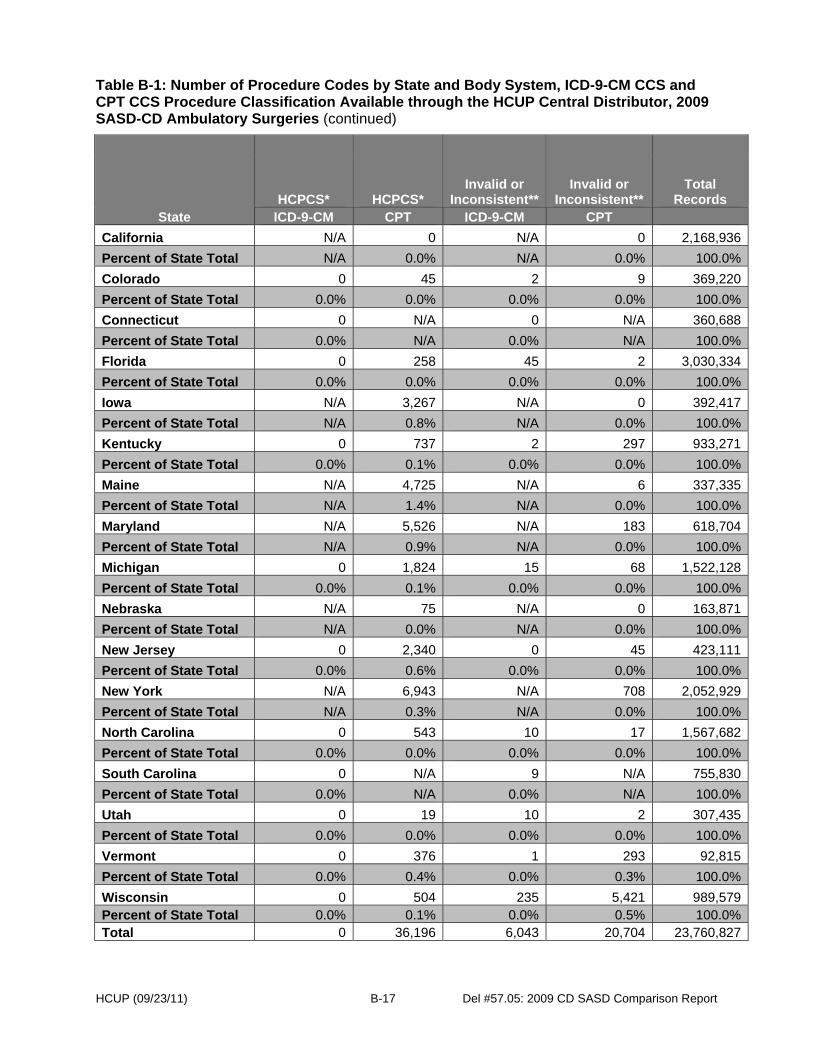
HCUP (09/23/11) B-17 Del #57.05: 2009 CD SASD Comparison Report
Table B-1: Number of Procedure Codes by State and Body System, ICD-9-CM CCS and CPT CCS Procedure Classification Available through the HCUP Central Distributor, 2009 SASD-CD Ambulatory Surgeries (continued)
State HCPCS* HCPCS*
Invalid or Inconsistent**
Invalid or Inconsistent**
Total Records
ICD-9-CM CPT ICD-9-CM CPT
California N/A 0 N/A 0 2,168,936
Percent of State Total N/A 0.0% N/A 0.0% 100.0%
Colorado 0 45 2 9 369,220
Percent of State Total 0.0% 0.0% 0.0% 0.0% 100.0%
Connecticut 0 N/A 0 N/A 360,688
Percent of State Total 0.0% N/A 0.0% N/A 100.0%
Florida 0 258 45 2 3,030,334
Percent of State Total 0.0% 0.0% 0.0% 0.0% 100.0%
Iowa N/A 3,267 N/A 0 392,417
Percent of State Total N/A 0.8% N/A 0.0% 100.0%
Kentucky 0 737 2 297 933,271
Percent of State Total 0.0% 0.1% 0.0% 0.0% 100.0%
Maine N/A 4,725 N/A 6 337,335
Percent of State Total N/A 1.4% N/A 0.0% 100.0%
Maryland N/A 5,526 N/A 183 618,704
Percent of State Total N/A 0.9% N/A 0.0% 100.0%
Michigan 0 1,824 15 68 1,522,128
Percent of State Total 0.0% 0.1% 0.0% 0.0% 100.0%
Nebraska N/A 75 N/A 0 163,871
Percent of State Total N/A 0.0% N/A 0.0% 100.0%
New Jersey 0 2,340 0 45 423,111
Percent of State Total 0.0% 0.6% 0.0% 0.0% 100.0%
New York N/A 6,943 N/A 708 2,052,929
Percent of State Total N/A 0.3% N/A 0.0% 100.0%
North Carolina 0 543 10 17 1,567,682
Percent of State Total 0.0% 0.0% 0.0% 0.0% 100.0%
South Carolina 0 N/A 9 N/A 755,830
Percent of State Total 0.0% N/A 0.0% N/A 100.0%
Utah 0 19 10 2 307,435
Percent of State Total 0.0% 0.0% 0.0% 0.0% 100.0%
Vermont 0 376 1 293 92,815
Percent of State Total 0.0% 0.4% 0.0% 0.3% 100.0%
Wisconsin 0 504 235 5,421 989,579Percent of State Total 0.0% 0.1% 0.0% 0.5% 100.0%Total 0 36,196 6,043 20,704 23,760,827

HCUP (09/23/11) B-18 Del #57.05: 2009 CD SASD Comparison Report
State HCPCS* HCPCS*
Invalid or Inconsistent**
Invalid or Inconsistent**
Total Records
ICD-9-CM CPT ICD-9-CM CPT
Percent of Grand Total 0.0% 0.2% 0.0% 0.1% 100.0%*Refers to CPT/ Healthcare Common Procedure Coding System (HCPCS) Level I codes that cannot be classified using the CCS system. Note: Healthcare Common Procedure Coding System (HCPCS) National Level II codes are often used with CPT codes to enhance their scope. They are not used to categorize procedures in this table because no mapping to CCS exists at the present time. **A validation algorithm is used to identify invalid codes based on logic identifying all valid codes in a certain time period. Inconsistent codes are identified when comparing the nature of the codes to patient demographic characteristics.
HCUP (09/23/11) B-19 Del #57.05: 2009 CD SASD Comparison Report
Appendix B: Summary The State variation in the use of the two coding systems is apparent when comparing the number of codes available by body system in the CCS Procedure Classification software available through the HCUP Central Distributor for records in the 2009 SASD-CD that qualified as ambulatory surgery (HCUP_AS>0). At times, the variation in codes available between coding systems can be large. Thus, researchers interested in studying ambulatory surgery for particular diagnosis or procedure areas should select States with sufficient procedure codes available for analysis.