EVALUATION OF THE SERVICE QUALITY FOR HOTEL INDUSTRY: …
15
© UIJIR | ISSN (O) – 2582-6417 OCT. 2020 | Vol. 1 Issue 5 www.uijir.com Universe International Journal of Interdisciplinary Research (Peer Reviewed Refereed Journal) DOI: http://www.doi-ds.org/doilink/10.2020-44767748/ www.uijir.com Page 15 EVALUATION OF THE SERVICE QUALITY FOR HOTEL INDUSTRY: A CASE STUDY OF RESORT HOTELS Author Name: 1 Mateen Yousuf, 2 Dr. Mohit Sharma Affiliation: Sri Venketeshwara University, Uttar pradesh, India E-Mail: [email protected] DOI No. – 08.2020-25662434 Abstract Tourist Satisfaction is the measure of a tourist’s perception of service delivery. Diversity and sophistication in tourists’ attitudes have led to a renewed interest in developing better models for measuring customer satisfaction as it is considered to be a critical factor of competitive advantage especially inhospitality sector. Existing literature have suggested various recommendations which have been successfully adopted by the hotel industry. This research was aimed at measuring customer satisfaction of tourists staying in selected resort hotels in Srinagar by comparing their expectations with the perceived delivery of service during their stay in the resort hotels in Srinagar. A sample size of 385 respondents was chosen using Non-Probability Convenience Sampling Technique. The model used in this research was the basic SERVQUAL scale designed by (Ananthanarayanan Parasuraman et al., 1988)containing 5 dimensions over 22 variables measured before and after the service delivery. Statistical techniques like Cochran’s Sampling Technique, Cronbach’s Alpha reliability testing , Descriptive Analysis Technique, t-test, p-test, KMO and Bartlett's Test, Principal Component Analysis , Pearson’s Correlation Technique and GAP analysis were employed to examine the statistics using SPSS software. The results provided an insight as to how the service quality of hotels was rated by the customers and also assessed customer satisfaction by identifying, quantifying and deliberating on service quality gaps. The findings indicated the service perceptions of tourists overall was higher than what they had expected. It meant the hotels in Srinagar had created very good infrastructure and provided best possible service and training to its staff which helped exceed the expectations of the tourists. The only dimension where hotels in Srinagar needed to improve was their responsiveness culture. Based on the empirical evidence, hotel managers were made aware of implications and improvements were suggested. Keywords customer satisfaction, service quality, customer perception, SERVQUAL, hotels in Srinagar, customer expectation INTRODUCTION The association between superiority of provisions and fulfillment of clienteles is a very important research topic in the 21 st century especially after the boom in the service sector. “Yet the nature of their relationship is still not clearly defined yet”(Sureshchandar et al., 2002). With the advent of the internet, service quality models had to be modified to e-service quality models to conform to the changed reality. With new concepts like AR, VR, AI, etc., service quality researchers are continuously modifying the existing models and relationships so as to be able to meet academic and industry requirements. “Single item scales have been employed by many management scientists while as other have made use of multiple item scales to measure customer satisfaction” (Sureshchandar et al., 2002). Quality of services and fulfillment of customers are the factors which have been validated and reliably used in assessment by
Transcript of EVALUATION OF THE SERVICE QUALITY FOR HOTEL INDUSTRY: …
© UIJIR | ISSN (O) – 2582-6417 OCT. 2020 | Vol. 1 Issue 5 www.uijir.com
Universe International Journal of Interdisciplinary Research
(Peer Reviewed Refereed Journal)
DOI: http://www.doi-ds.org/doilink/10.2020-44767748/ www.uijir.com
Page 15
EVALUATION OF THE SERVICE QUALITY FOR HOTEL INDUSTRY: A
CASE STUDY OF RESORT HOTELS
Author Name: 1Mateen Yousuf,
2Dr. Mohit Sharma
Affiliation: Sri Venketeshwara University, Uttar pradesh, India
E-Mail: [email protected]
DOI No. – 08.2020-25662434
Abstract
Tourist Satisfaction is the measure of a tourist’s perception of service delivery. Diversity and sophistication in
tourists’ attitudes have led to a renewed interest in developing better models for measuring customer
satisfaction as it is considered to be a critical factor of competitive advantage especially inhospitality sector.
Existing literature have suggested various recommendations which have been successfully adopted by the hotel
industry. This research was aimed at measuring customer satisfaction of tourists staying in selected resort
hotels in Srinagar by comparing their expectations with the perceived delivery of service during their stay in
the resort hotels in Srinagar. A sample size of 385 respondents was chosen using Non-Probability Convenience
Sampling Technique. The model used in this research was the basic SERVQUAL scale designed by
(Ananthanarayanan Parasuraman et al., 1988)containing 5 dimensions over 22 variables measured before and
after the service delivery. Statistical techniques like Cochran’s Sampling Technique, Cronbach’s Alpha
reliability testing , Descriptive Analysis Technique, t-test, p-test, KMO and Bartlett's Test, Principal
Component Analysis , Pearson’s Correlation Technique and GAP analysis were employed to examine the
statistics using SPSS software. The results provided an insight as to how the service quality of hotels was rated
by the customers and also assessed customer satisfaction by identifying, quantifying and deliberating on
service quality gaps. The findings indicated the service perceptions of tourists overall was higher than what
they had expected. It meant the hotels in Srinagar had created very good infrastructure and provided best
possible service and training to its staff which helped exceed the expectations of the tourists. The only
dimension where hotels in Srinagar needed to improve was their responsiveness culture. Based on the
empirical evidence, hotel managers were made aware of implications and improvements were suggested.
Keywords customer satisfaction, service quality, customer perception, SERVQUAL, hotels in Srinagar, customer
expectation
INTRODUCTION
The association between superiority of provisions and fulfillment of clienteles is a very
important research topic in the 21st century especially after the boom in the service sector. “Yet
the nature of their relationship is still not clearly defined yet”(Sureshchandar et al., 2002). With
the advent of the internet, service quality models had to be modified to e-service quality models
to conform to the changed reality. With new concepts like AR, VR, AI, etc., service quality
researchers are continuously modifying the existing models and relationships so as to be able to
meet academic and industry requirements. “Single item scales have been employed by many
management scientists while as other have made use of multiple item scales to measure
customer satisfaction” (Sureshchandar et al., 2002). Quality of services and fulfillment of
customers are the factors which have been validated and reliably used in assessment by

© UIJIR | ISSN (O) – 2582-6417 OCT. 2020 | Vol. 1 Issue 5 www.uijir.com
Universe International Journal of Interdisciplinary Research
(Peer Reviewed Refereed Journal)
DOI: http://www.doi-ds.org/doilink/10.2020-44767748/ www.uijir.com
Page 16
researchers and it pays a very important role in purchase and re-purchase decisions of
customers(Taylor & Baker, 1994). Satisfaction through the service is important concept to
create competitive advantage and customer loyalty(Iacobucci et al., 1995). Service Quality had
been found to considerably influence behavioral intentions(González et al., 2007). Service
quality measurement is useful to determine how service process and service outcomes are
consistent with the quality of services and tourist’s satisfaction evaluation. Patterns were
examined between these four concepts(Yap & Kew, 2007). Service excellence and its relative
effect bearing on approval are of immense importance to industry and every study could be
framed in order to fill a research Gap or improve on an existing study. Customer satisfaction
acts as an important factor which determines a relationship between delivery of service and
customer loyalty.
SERVQUAL is a 5 dimensional service quality measurement construct published by (A. P.
Parasuraman et al., 1985). It was first introduced in the year 1985. It was designed to measure
perceptions and expectations of customers along 44 variables representing various dimensions
of service quality. It was designed in a way which was considered in research parlance as the
expectancy-disconfirmation paradigm, which means pre-delivery expectations are measured
against post-delivery perception of service. Gap analysis measurement did not had a steep
learning curve and thus could be used in academia, industry and student community without
much difficulty.
The model of SERVQUAL has been continuously being modified by researchers many times over
all over the world including many times by the principal authors themselves. With internet age
and service delivery shifting online, the original research team developed e-SERVQUAL model to
measure customer satisfaction online. Further modifications were carried out on the model
itself. When the perception of service is equal or more than expectation, service quality is
considered to be high and vice versa. SERVQUAL has been used by researchers all over the
world to measure customers satisfaction in various kinds of service industries such as
hospitals(Babakus & Boller, 1992), hotels(Bukhari et al., 2013), “travel and tourism”(Fick &
Brent Ritchie, 1991) and banks(Arun Parasuraman et al., 1991) etc.
LITERATURE REVIEW
“Customer Satisfaction concept is a relatively older one used in marketing parlance and it means
how a service delivery and execution is perceived by customers”(Professor, Administrative
Management College, Bangalore & Rao, 2013). “It can help in developing customer trust and
customer loyalty. Trust can act as a mediating variable between customer satisfaction and
service quality”(Kundu & Datta, 2015). “Customer satisfaction is a significant antecedent of
engagement and loyalty of a customer”(Abror et al., 2019). “Customer satisfaction is calculated
by using the functions of service delivery vis a vis expectations of the customers”(Professor,
Administrative Management College, Bangalore & Rao, 2013). “Customer being the kind has the
final say how a particular service ought to happen in the most satisfying manner”(Professor,
Administrative Management College, Bangalore & Rao, 2013). “The concept of quality of
services between a customer and his expectations determines the extent of his
satisfaction”(Tessera et al., 2016). “A customer will re-indulge in buying the same product or
service only after taking into consideration his previous experiences of quality of goods and
services delivered”(Tessera et al., 2016). “Customer satisfaction is thus a person’s experience of
a performance of service with relation to what was expected out of the service”(Schiffman &
© UIJIR | ISSN (O) – 2582-6417 OCT. 2020 | Vol. 1 Issue 5 www.uijir.com
Universe International Journal of Interdisciplinary Research
(Peer Reviewed Refereed Journal)
DOI: http://www.doi-ds.org/doilink/10.2020-44767748/ www.uijir.com
Page 17
Kanuk, 2004). “Researches have shown that there is a direct relation between the worth of
amenities and comparative satisfaction of customers. It also determines whether the customer
will be loyal and what effect it will have on the revenues of the company in long-term”(Wilkins
et al., 2007). According to (Ananthanarayanan Parasuraman et al., 1988), “service quality has
been defined as how better a company can perform in comparison to the expectations
customers have of their services. Service quality can be defined and expressed as how much of
the customer’s expectations can be reached or exceeded by the company”(it can be the brand
image of the company, the cost of the service or the previous encounters of the service delivery
by the customer) in comparison with what the customers have perceived of the actual service
delivery (Grönroos, 1993), 1984; (A. P. Parasuraman et al., 1985); (Johnston & Heineke, 1998).
(Principles of Marketing - Philip Kotler, Gary M. Armstrong - Google Books, n.d.)“Suggest that the
two way paradigm of post purchase satisfaction and pre purchase expectations determines
service quality in an actual measure”. “Some of the researches have concluded that quality of
services lead to customer satisfaction while other researches have disagreed with this
presumption”(Ting, 2004). The studies of (Lee, n.d.); and (Buttle, 1996)have suggested “the
former in conformance with majority other scholars”.
“The hotel industry is a customer centric service industry where entire focus is on meeting the
expectations of the customers. The focus should be on increasing customer satisfaction and
providing value for money”(DilPazir & Amin, 2012).“There should be a continuous focus of total
improvement in quality, they have to be served well, provided value for money, being courteous
to and they should feel welcomed in your hotel at all times at a reasonable cost”(Hospitality and
Catering: A Closer Look - Ursula Jones, Shirley Newton, Pauline Dixon - Google Books, n.d.). “In
order to improve on customer relationship management, hotels are investing a lot of money in
improving their service quality which eventually tips to increase in satisfaction and loyalty of
customers and helps in attracting customers”(Brandon‐Jones &Silvestre, 2010). “In a cut throat
competition, only the hotels which can attract new customers, maintain their service quality and
retain the existing customers has a chance of surviving in the market”(Choi & Chu, 2001). “The
longer association of customers with an organization leads to more profitability for hotels in the
long turn”(Ara, 2013). “Hotels have understood there is no space for delivering ordinary
services to customers who have become very sophisticated in their needs for a better
service”(Yen & Lu, 2008). “Customer relationship management with tourists has become a
strategic asset to the hotels”(Gruen et al., 2000).
RESEARCH METHODOLOGY
Objectives of the Study
1. To calculate the expectation and perception levels of tourists towards service quality in
the hotels of Srinagar.
2. To measure the gap between the expectation and perception of tourists towards service
quality in hotels.
3. Provide suggestions to hotels managers and owners how to improve their quality of
services and increase satisfaction of customers.
HYPOTHESIS
H0: Service Quality had no impact on Customer Satisfaction in Hotels in Srinagar.
H1: Service Quality had a significant impact on Customer Satisfaction in Hotels in Srinagar.

© UIJIR | ISSN (O) – 2582-6417 OCT. 2020 | Vol. 1 Issue 5 www.uijir.com
Universe International Journal of Interdisciplinary Research
(Peer Reviewed Refereed Journal)
DOI: http://www.doi-ds.org/doilink/10.2020-44767748/ www.uijir.com
Page 18
SAMPLING
This being an empirical research, we collected most of the data from primary sources. A survey
questionnaire was used for this purpose. An aggregate of 385 surveys were distributed among
the tourists residing at various guesthouses in Srinagar. The number was reached by using
Cochran formula for huge population where the inconsistency in percentage is unidentified.
Assuming p=0.5 (maximum variability), we anticipated 95% assurance level and ± 5% accuracy.
SURVEY QUESTIONNAIRE
198 questionnaires were sent for final
analysis after rejecting incomplete ones and
post-adjusting various sampling errors. The
sample represented a fair balance of various
demographic factors. The sampling technique
used was non-probability convenience
sampling technique. The questionnaire
compromised four segments. The first
segment gathered respondents’ demographic
statistics. The next two sections contained questions that measured expectations levels and
perception levels according to the original SERVQUAL scale developed by (Ananthanarayanan
Parasuraman et al., 1988). Each section had 22 attributes. The last section asked for overall
customer satisfaction rating of the hotel. The expectation and perception questionnaire asked
customers to rate the service of the hotel on a 7 point Like RT Scale vacillating from 1 (strongly
disagree) to 7 (strongly agree).The same scale was used for measuring overall satisfaction of
tourists with the service quality of the hotel. The five proportions were the independent
variables whereas customer satisfaction was the dependent variable.
STATISTICAL TECHNIQUES
1. Cronbach’s Alpha (Consistency Analysis): It was used to fix the level of trustworthiness
of data inside each dimension. 0.70 And above is considered as acceptable.
2. Descriptive statistics: Standard Deviation and Average mean was measured in every
variable across the two questionnaires. Also an average mean was taken on each of the
dimensions.
3. Paired Sample t-test: The paired t-test was checked to associate and give the t-value of
“before-and-after observations” on the same question.
4. Factor Analysis: a. KMO and Bartlett's Test, b. Principal Component Analysis
5. GAP Analysis: The means of each of the 22 variables was derived by subtracting the
mean of Perception minus the Expectation across the same questions and Gap score was
obtained. If the gap score is equal or positive, the customer is satisfied with the service
and Vice-Versa.
6. Pearson’s Correlation Technique.
RESULTS AND DISCUSSIONS
Table1: Demographic frequencies Frequency Percent
Gender Male 101 51.0 Female 97 49.0 Marital Status Married 171 86.4
© UIJIR | ISSN (O) – 2582-6417 OCT. 2020 | Vol. 1 Issue 5 www.uijir.com
Universe International Journal of Interdisciplinary Research
(Peer Reviewed Refereed Journal)
DOI: http://www.doi-ds.org/doilink/10.2020-44767748/ www.uijir.com
Page 19
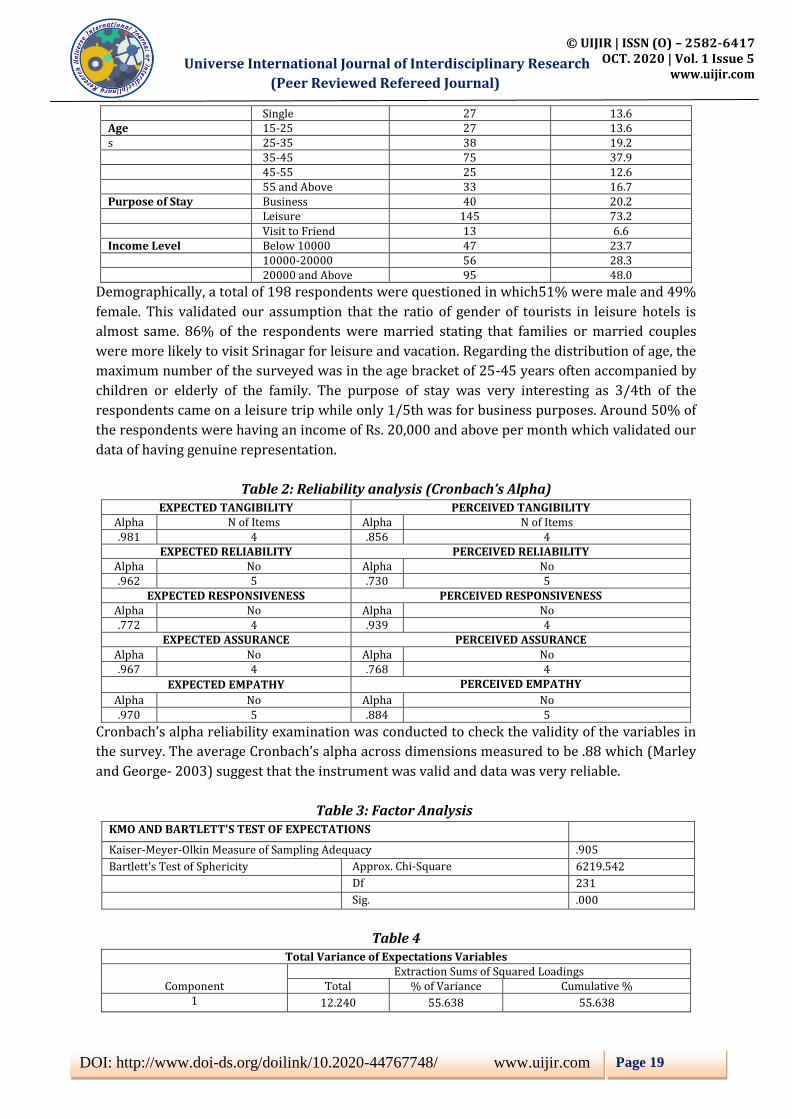
Single 27 13.6 Age 15-25 27 13.6 s 25-35 38 19.2 35-45 75 37.9 45-55 25 12.6 55 and Above 33 16.7 Purpose of Stay Business 40 20.2 Leisure 145 73.2 Visit to Friend 13 6.6 Income Level Below 10000 47 23.7 10000-20000 56 28.3 20000 and Above 95 48.0
Demographically, a total of 198 respondents were questioned in which51% were male and 49%
female. This validated our assumption that the ratio of gender of tourists in leisure hotels is
almost same. 86% of the respondents were married stating that families or married couples
were more likely to visit Srinagar for leisure and vacation. Regarding the distribution of age, the
maximum number of the surveyed was in the age bracket of 25-45 years often accompanied by
children or elderly of the family. The purpose of stay was very interesting as 3/4th of the
respondents came on a leisure trip while only 1/5th was for business purposes. Around 50% of
the respondents were having an income of Rs. 20,000 and above per month which validated our
data of having genuine representation.
Table 2: Reliability analysis (Cronbach’s Alpha) EXPECTED TANGIBILITY PERCEIVED TANGIBILITY
Alpha N of Items Alpha N of Items .981 4 .856 4
EXPECTED RELIABILITY PERCEIVED RELIABILITY Alpha No Alpha No .962 5 .730 5
EXPECTED RESPONSIVENESS PERCEIVED RESPONSIVENESS Alpha No Alpha No .772 4 .939 4
EXPECTED ASSURANCE PERCEIVED ASSURANCE Alpha No Alpha No .967 4 .768 4
EXPECTED EMPATHY PERCEIVED EMPATHY
Alpha No Alpha No .970 5 .884 5
Cronbach’s alpha reliability examination was conducted to check the validity of the variables in
the survey. The average Cronbach’s alpha across dimensions measured to be .88 which (Marley
and George- 2003) suggest that the instrument was valid and data was very reliable.
Table 3: Factor Analysis KMO AND BARTLETT'S TEST OF EXPECTATIONS Kaiser-Meyer-Olkin Measure of Sampling Adequacy .905 Bartlett's Test of Sphericity Approx. Chi-Square 6219.542 Df 231 Sig. .000
Table 4 Total Variance of Expectations Variables
Component Extraction Sums of Squared Loadings
Total % of Variance Cumulative % 1 12.240 55.638 55.638
© UIJIR | ISSN (O) – 2582-6417 OCT. 2020 | Vol. 1 Issue 5 www.uijir.com
Universe International Journal of Interdisciplinary Research
(Peer Reviewed Refereed Journal)
DOI: http://www.doi-ds.org/doilink/10.2020-44767748/ www.uijir.com
Page 20
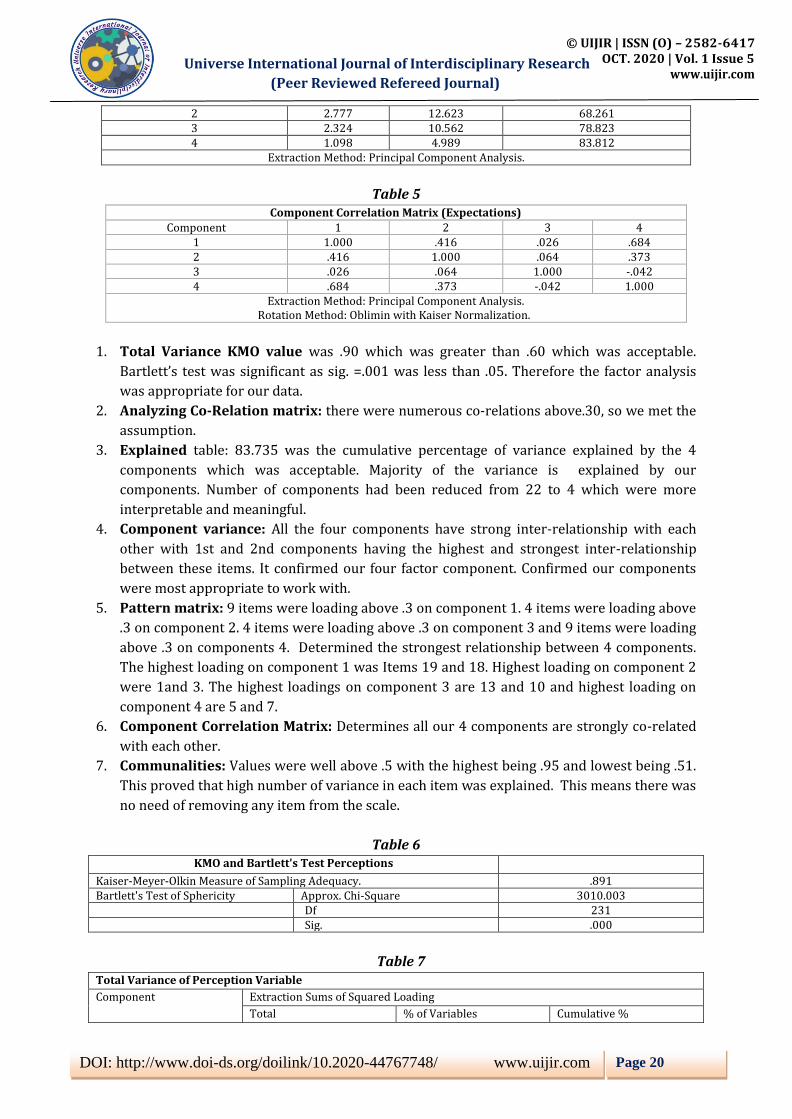
2 2.777 12.623 68.261 3 2.324 10.562 78.823 4 1.098 4.989 83.812
Extraction Method: Principal Component Analysis.
Table 5 Component Correlation Matrix (Expectations)
Component 1 2 3 4 1 1.000 .416 .026 .684 2 .416 1.000 .064 .373 3 .026 .064 1.000 -.042 4 .684 .373 -.042 1.000
Extraction Method: Principal Component Analysis. Rotation Method: Oblimin with Kaiser Normalization.
1. Total Variance KMO value was .90 which was greater than .60 which was acceptable.
Bartlett’s test was significant as sig. =.001 was less than .05. Therefore the factor analysis
was appropriate for our data.
2. Analyzing Co-Relation matrix: there were numerous co-relations above.30, so we met the
assumption.
3. Explained table: 83.735 was the cumulative percentage of variance explained by the 4
components which was acceptable. Majority of the variance is explained by our
components. Number of components had been reduced from 22 to 4 which were more
interpretable and meaningful.
4. Component variance: All the four components have strong inter-relationship with each
other with 1st and 2nd components having the highest and strongest inter-relationship
between these items. It confirmed our four factor component. Confirmed our components
were most appropriate to work with.
5. Pattern matrix: 9 items were loading above .3 on component 1. 4 items were loading above
.3 on component 2. 4 items were loading above .3 on component 3 and 9 items were loading
above .3 on components 4. Determined the strongest relationship between 4 components.
The highest loading on component 1 was Items 19 and 18. Highest loading on component 2
were 1and 3. The highest loadings on component 3 are 13 and 10 and highest loading on
component 4 are 5 and 7.
6. Component Correlation Matrix: Determines all our 4 components are strongly co-related
with each other.
7. Communalities: Values were well above .5 with the highest being .95 and lowest being .51.
This proved that high number of variance in each item was explained. This means there was
no need of removing any item from the scale.
Table 6 KMO and Bartlett's Test Perceptions
Kaiser-Meyer-Olkin Measure of Sampling Adequacy. .891 Bartlett's Test of Sphericity Approx. Chi-Square 3010.003
Df 231 Sig. .000
Table 7 Total Variance of Perception Variable
Component Extraction Sums of Squared Loading
Total % of Variables Cumulative %

© UIJIR | ISSN (O) – 2582-6417 OCT. 2020 | Vol. 1 Issue 5 www.uijir.com
Universe International Journal of Interdisciplinary Research
(Peer Reviewed Refereed Journal)
DOI: http://www.doi-ds.org/doilink/10.2020-44767748/ www.uijir.com
Page 21
1 8.404 38.201 38.201
2 3.443 15.651 53.852
3 1.680 7.635 61.487
4 1.265 5.735 67.235
5 1.066 4.846 72.081
Extraction Method: Principal Component Analysis
Table 8 Component Correlation Matrix (Perception)
Component 1 2 3 4 5 1 1.000 -.005 -.427 -.461 .319 2 -.005 1.000 -.050 .058 -.027 3 -.427 .058 .355 1.000 -.270 4 -.461 .058 .355 1.000 -.270 5 .319 -.027 -.324 -.270 1.000
Extraction Method: Principal Component Analysis. Rotation Method: Oblimin with Kaiser Normalization.
1. KMO value was .89 which was greater than .60 which was acceptable. Bartlett’s test was
significant as sig. =.001 was less than .05. Therefore factor analysis was appropriate for our
data.
2. Analyzing Co-Relation matrix: there were numerous co-relations above.30, so we met the
assumption.
3. Total Variance Explained table: 72.081was the cumulative percentage of variance explained
by the 5 components which was acceptable. Majority of the variance was explained by our
components. Number of components had been reduced from 22 to 5 which were more
interpretable and meaningful.
4. Component variance: All the five components had strong inter-relationship with each other
with 1st and 2nd components had the vast and strongest inter-relationship between these
items. Confirmed our four factor component. Confirmed our components were most
appropriate to work with.
5. Pattern matrix: 7 items were loading above .3 on component 1. 4 items were loading above
.3 on component 2. 4 items were loading above .5 items are loading on component 5. It
determinedthe strongest relationship between 3 out of 5 components. Highest loading on
component 2were Items 13, 12, 11 and 10.
6. Component Correlation Matrix: Determined all our 4 components were strongly co-related
with each other.
7. Communalities: Values were well above .5 with the highest being .95 and lowest being .51.
This proved that high number of variance in each item was explained. This means there was
no need of removing any item from the scale.
PEARSON’S CO-EFFICIENT
Table 9 Pearson’s Co-efficient Correlations (Service Quality And Customer Satisfaction)
Service Quality Customer Satisfaction Service Quality Pearson Correlation
(Independent Sig. -2 Tailed Variable) N 1 .828
198 .000 198
Customer Satisfaction Pearson Correlation (Depend Sig. – 2 Tailed) Variable N
.828 1
.000 198 198

© UIJIR | ISSN (O) – 2582-6417 OCT. 2020 | Vol. 1 Issue 5 www.uijir.com
Universe International Journal of Interdisciplinary Research
(Peer Reviewed Refereed Journal)
DOI: http://www.doi-ds.org/doilink/10.2020-44767748/ www.uijir.com
Page 22
**. Correlation is significant at the 0.01 level (2-tailed).
H0: Service Quality does not have any impact of Customer Satisfaction.
Pearson’s Correlation was conducted to examine the relationship between Service Quality and
Customer Satisfaction. Pearson Co-relation came at 0.82 which meant there existed a
relationship between the two variables. R(196)=.82, P=0.001 <0.05 meant there was a
significant positive relationship between Service quality and Customer Satisfaction in hotels in
Srinagar. Thus, null hypothesis was rejected. It was observed that dependent variable
significantly correlated with dependent variable as more than 80% of independent variables
were able to explain customer satisfaction.
*Customer Satisfaction was calculated by asking all 198 respondents to rate overall satisfaction
from their stay in hotel on a 7 point Like rt scale.
GAP ANALYSIS
Table 10 EXPECTED MEAN PERCEPTION MEAN GAP
T1 6.2525 5.2626 0.99 T2 6.202 5.2727 0.93
T3 6.3384 5.3131 1.03 T4 6.303 5.2374 1.07
TANGIBILITY 6.273975 5.27145 1.005 RE1 6.3586 5.4091 0.95 RE2 6.2929 5.303 0.99 RE3 6.3687 5.4899 0.88
RE4 6.4242 5.2778 1.15 RE5 6.3081 5.3788 0.93
RELIABILITY 6.3505 5.37172 0.98 RS1 5.3636 6.3636 -1
RS2 5.4394 6.3889 -0.95 RS3 5.4242 6.2487 -0.82 RS4 5.4343 6.2778 -0.84
RESPONSIVENESS 5.415375 6.31975 -0.9025
EM1 6.3838 5.5202 0.86 EM2 6.2475 5.4798 0.77 EM3 6.3737 5.4747 0.9 EM4 6.3232 5.3737 0.95
EMPATHY 6.33205 5.4621 0.87 AS1 6.2677 5.4394 0.83 AS2 6.1465 5.4444 0.7 AS3 6.2475 5.5202 0.73 AS4 6.1313 5.303 0.83 AS5 6.2879 5.5303 0.76
ASSURANCE 6.21618 5.44746 0.77
TOTAL 6.11 5.57 0.54
The total average Gap of all the 198 respondents across 5 dimensions was 0.54 which showed
that the hotels in Srinagar not only matched the expectations of the tourists but also exceeded
them. This analysis showed that the resort hotels in Srinagar provided quality services to the
visitors.
Table 11
TANGIBILITY Paired Differences Perception Mean
Expectation Mean
t test Sig. (2-tailed)
GAP Score( P-E)
1. The Hotel will have modern looking equipment
6.2525 5.2626 -6.895
.000 0.99
© UIJIR | ISSN (O) – 2582-6417 OCT. 2020 | Vol. 1 Issue 5 www.uijir.com
Universe International Journal of Interdisciplinary Research
(Peer Reviewed Refereed Journal)
DOI: http://www.doi-ds.org/doilink/10.2020-44767748/ www.uijir.com
Page 23
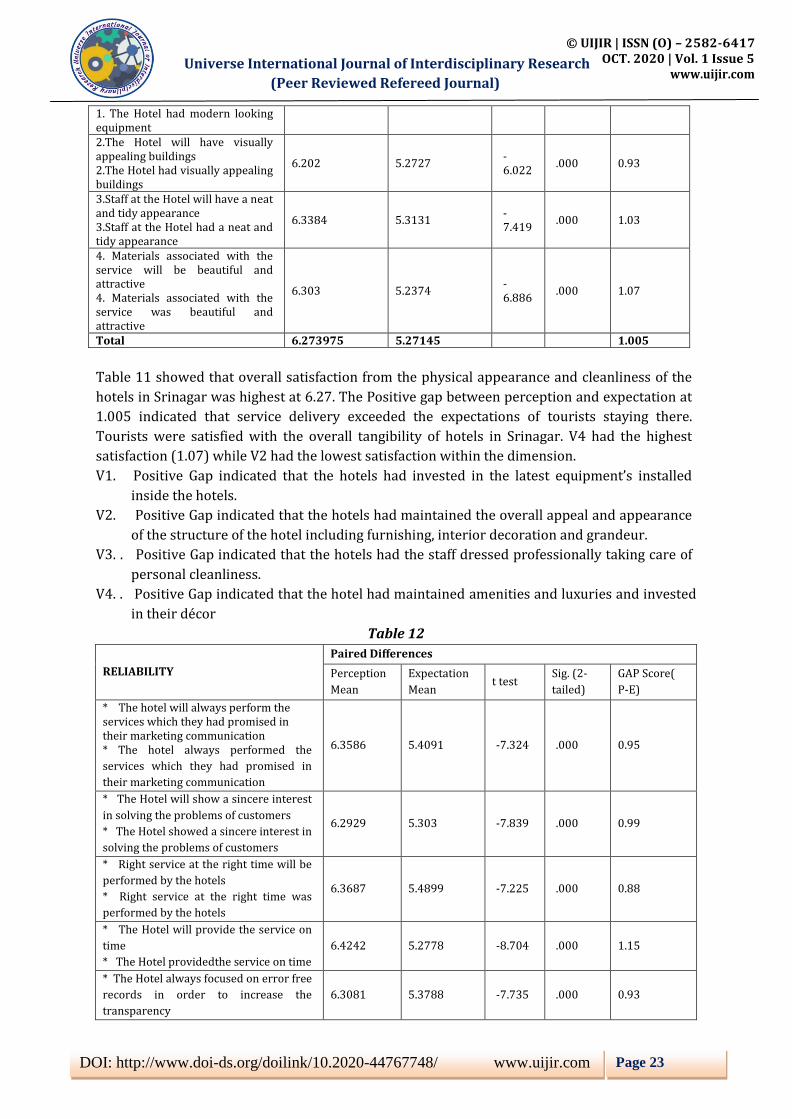
1. The Hotel had modern looking equipment 2.The Hotel will have visually appealing buildings 2.The Hotel had visually appealing buildings
6.202 5.2727 -6.022
.000 0.93
3.Staff at the Hotel will have a neat and tidy appearance 3.Staff at the Hotel had a neat and tidy appearance
6.3384 5.3131 -7.419
.000 1.03
4. Materials associated with the service will be beautiful and attractive 4. Materials associated with the service was beautiful and attractive
6.303 5.2374 -6.886
.000 1.07
Total 6.273975 5.27145 1.005
Table 11 showed that overall satisfaction from the physical appearance and cleanliness of the
hotels in Srinagar was highest at 6.27. The Positive gap between perception and expectation at
1.005 indicated that service delivery exceeded the expectations of tourists staying there.
Tourists were satisfied with the overall tangibility of hotels in Srinagar. V4 had the highest
satisfaction (1.07) while V2 had the lowest satisfaction within the dimension.
V1. Positive Gap indicated that the hotels had invested in the latest equipment’s installed
inside the hotels.
V2. Positive Gap indicated that the hotels had maintained the overall appeal and appearance
of the structure of the hotel including furnishing, interior decoration and grandeur.
V3. . Positive Gap indicated that the hotels had the staff dressed professionally taking care of
personal cleanliness.
V4. . Positive Gap indicated that the hotel had maintained amenities and luxuries and invested
in their décor
Table 12
RELIABILITY
Paired Differences
Perception
Mean
Expectation
Mean t test
Sig. (2-
tailed)
GAP Score(
P-E)
* The hotel will always perform the services which they had promised in their marketing communication * The hotel always performed the
services which they had promised in
their marketing communication
6.3586 5.4091 -7.324 .000 0.95
* The Hotel will show a sincere interest
in solving the problems of customers
* The Hotel showed a sincere interest in
solving the problems of customers
6.2929 5.303 -7.839 .000 0.99
* Right service at the right time will be
performed by the hotels
* Right service at the right time was
performed by the hotels
6.3687 5.4899 -7.225 .000 0.88
* The Hotel will provide the service on
time
* The Hotel providedthe service on time
6.4242 5.2778 -8.704 .000 1.15
* The Hotel always focused on error free
records in order to increase the
transparency
6.3081 5.3788 -7.735 .000 0.93
© UIJIR | ISSN (O) – 2582-6417 OCT. 2020 | Vol. 1 Issue 5 www.uijir.com
Universe International Journal of Interdisciplinary Research
(Peer Reviewed Refereed Journal)
DOI: http://www.doi-ds.org/doilink/10.2020-44767748/ www.uijir.com
Page 24
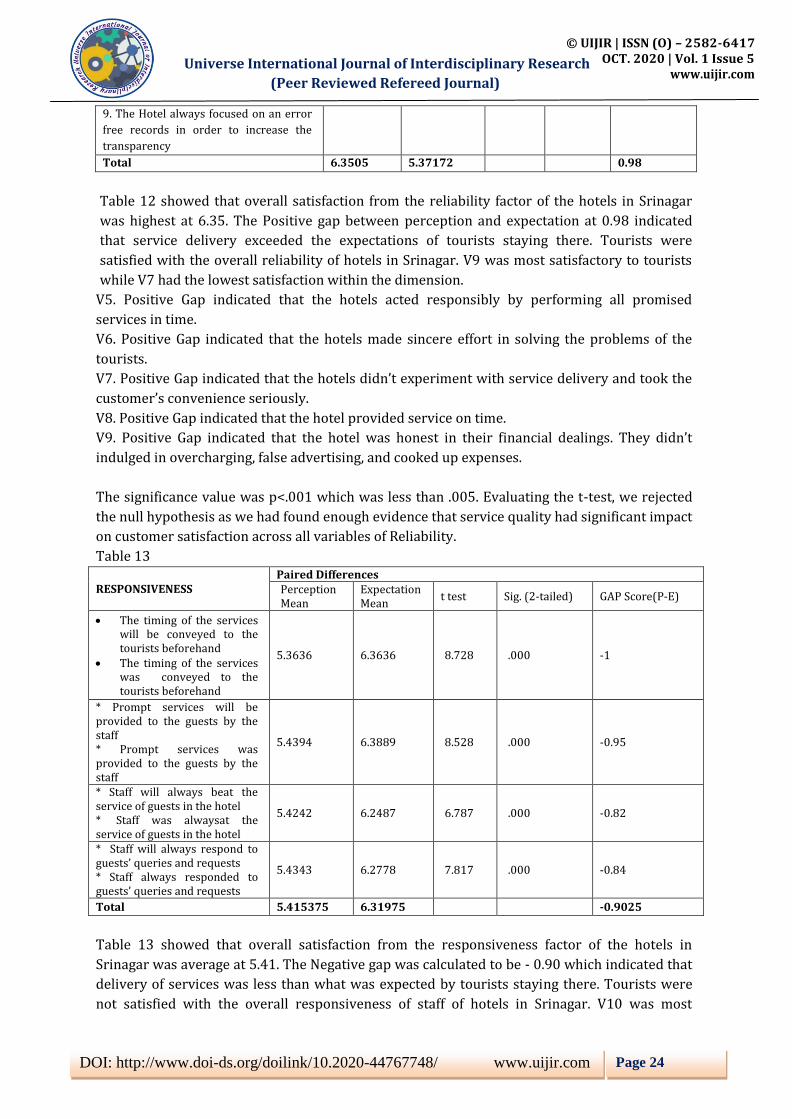
9. The Hotel always focused on an error
free records in order to increase the
transparency
Total 6.3505 5.37172 0.98
Table 12 showed that overall satisfaction from the reliability factor of the hotels in Srinagar
was highest at 6.35. The Positive gap between perception and expectation at 0.98 indicated
that service delivery exceeded the expectations of tourists staying there. Tourists were
satisfied with the overall reliability of hotels in Srinagar. V9 was most satisfactory to tourists
while V7 had the lowest satisfaction within the dimension.
V5. Positive Gap indicated that the hotels acted responsibly by performing all promised
services in time.
V6. Positive Gap indicated that the hotels made sincere effort in solving the problems of the
tourists.
V7. Positive Gap indicated that the hotels didn’t experiment with service delivery and took the
customer’s convenience seriously.
V8. Positive Gap indicated that the hotel provided service on time.
V9. Positive Gap indicated that the hotel was honest in their financial dealings. They didn’t
indulged in overcharging, false advertising, and cooked up expenses.
The significance value was p<.001 which was less than .005. Evaluating the t-test, we rejected
the null hypothesis as we had found enough evidence that service quality had significant impact
on customer satisfaction across all variables of Reliability.
Table 13
RESPONSIVENESS Paired Differences Perception Mean
Expectation Mean
t test Sig. (2-tailed) GAP Score(P-E)
The timing of the services will be conveyed to the tourists beforehand
The timing of the services was conveyed to the tourists beforehand
5.3636 6.3636 8.728 .000 -1
* Prompt services will be provided to the guests by the staff * Prompt services was provided to the guests by the staff
5.4394 6.3889 8.528 .000 -0.95
* Staff will always beat the service of guests in the hotel * Staff was alwaysat the service of guests in the hotel
5.4242 6.2487 6.787 .000 -0.82
* Staff will always respond to guests’ queries and requests * Staff always responded to guests’ queries and requests
5.4343 6.2778 7.817 .000 -0.84
Total 5.415375 6.31975 -0.9025
Table 13 showed that overall satisfaction from the responsiveness factor of the hotels in
Srinagar was average at 5.41. The Negative gap was calculated to be - 0.90 which indicated that
delivery of services was less than what was expected by tourists staying there. Tourists were
not satisfied with the overall responsiveness of staff of hotels in Srinagar. V10 was most
© UIJIR | ISSN (O) – 2582-6417 OCT. 2020 | Vol. 1 Issue 5 www.uijir.com
Universe International Journal of Interdisciplinary Research
(Peer Reviewed Refereed Journal)
DOI: http://www.doi-ds.org/doilink/10.2020-44767748/ www.uijir.com
Page 25
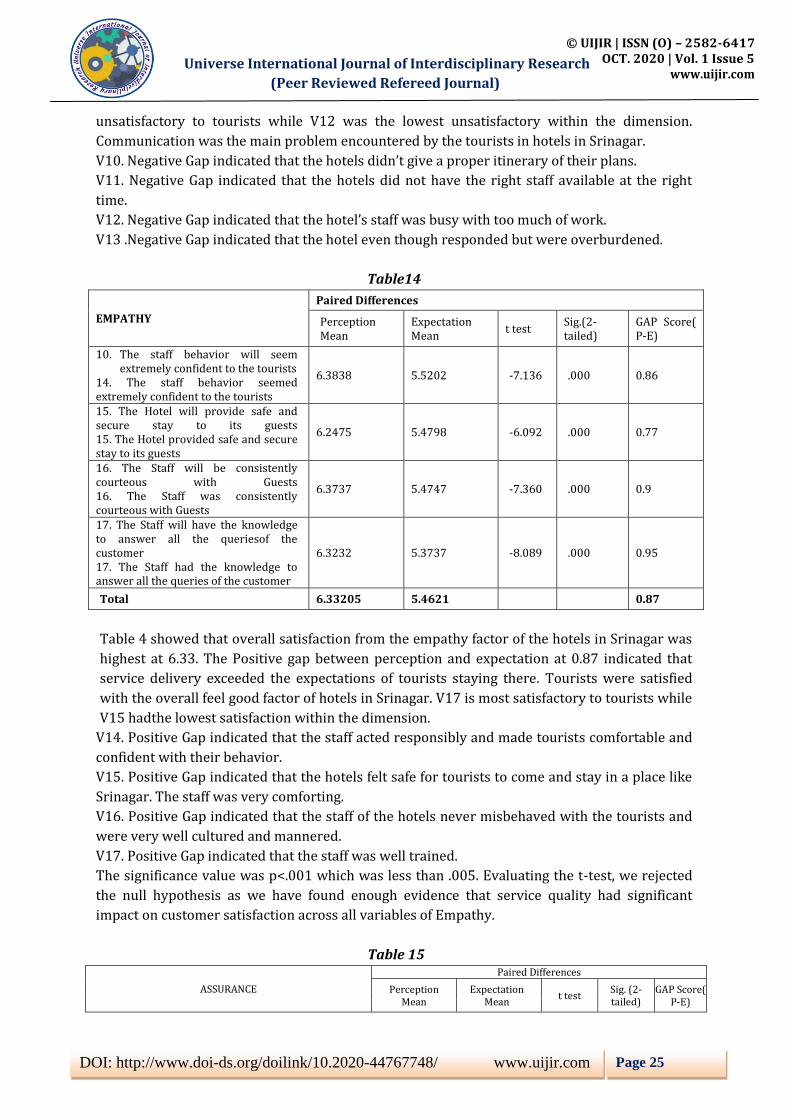
unsatisfactory to tourists while V12 was the lowest unsatisfactory within the dimension.
Communication was the main problem encountered by the tourists in hotels in Srinagar.
V10. Negative Gap indicated that the hotels didn’t give a proper itinerary of their plans.
V11. Negative Gap indicated that the hotels did not have the right staff available at the right
time.
V12. Negative Gap indicated that the hotel’s staff was busy with too much of work.
V13 .Negative Gap indicated that the hotel even though responded but were overburdened.
Table14
EMPATHY
Paired Differences
Perception Mean
Expectation Mean
t test Sig.(2-tailed)
GAP Score( P-E)
10. The staff behavior will seem extremely confident to the tourists
14. The staff behavior seemed extremely confident to the tourists
6.3838 5.5202 -7.136 .000 0.86
15. The Hotel will provide safe and secure stay to its guests 15. The Hotel provided safe and secure stay to its guests
6.2475 5.4798 -6.092 .000 0.77
16. The Staff will be consistently courteous with Guests 16. The Staff was consistently courteous with Guests
6.3737 5.4747 -7.360 .000 0.9
17. The Staff will have the knowledge to answer all the queriesof the customer 17. The Staff had the knowledge to answer all the queries of the customer
6.3232 5.3737 -8.089 .000 0.95
Total 6.33205 5.4621 0.87
Table 4 showed that overall satisfaction from the empathy factor of the hotels in Srinagar was
highest at 6.33. The Positive gap between perception and expectation at 0.87 indicated that
service delivery exceeded the expectations of tourists staying there. Tourists were satisfied
with the overall feel good factor of hotels in Srinagar. V17 is most satisfactory to tourists while
V15 hadthe lowest satisfaction within the dimension.
V14. Positive Gap indicated that the staff acted responsibly and made tourists comfortable and
confident with their behavior.
V15. Positive Gap indicated that the hotels felt safe for tourists to come and stay in a place like
Srinagar. The staff was very comforting.
V16. Positive Gap indicated that the staff of the hotels never misbehaved with the tourists and
were very well cultured and mannered.
V17. Positive Gap indicated that the staff was well trained.
The significance value was p<.001 which was less than .005. Evaluating the t-test, we rejected
the null hypothesis as we have found enough evidence that service quality had significant
impact on customer satisfaction across all variables of Empathy.
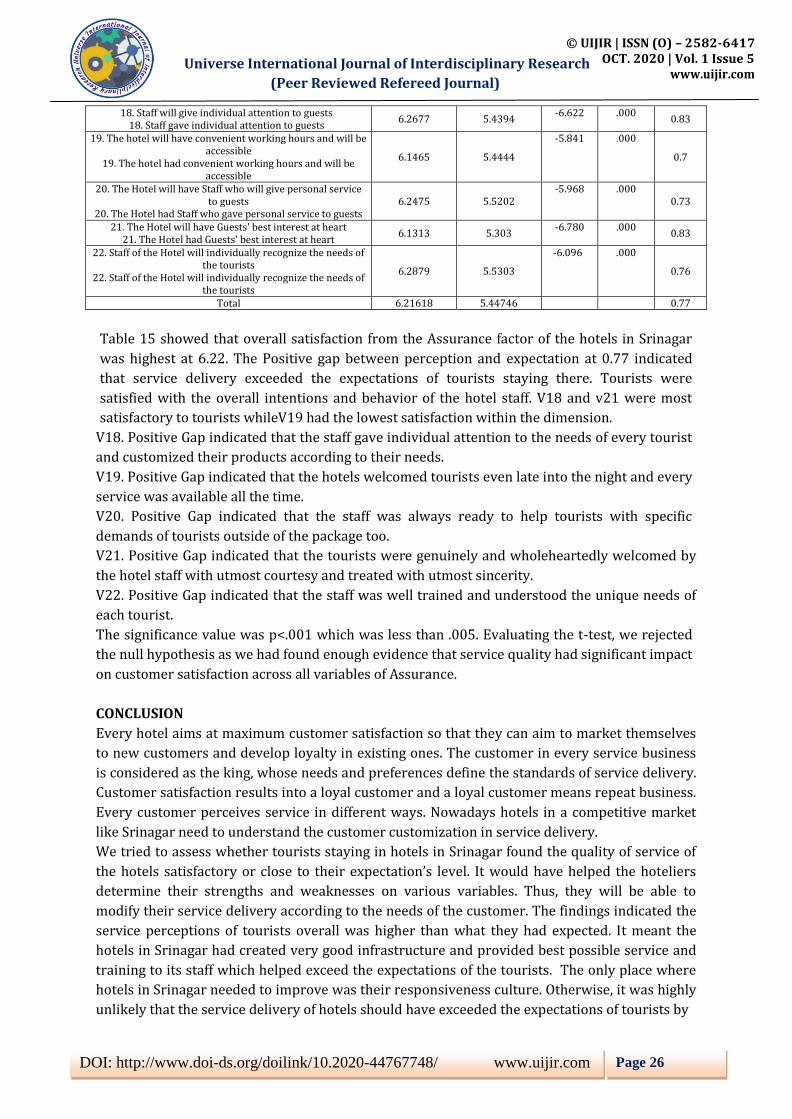
Table 15
ASSURANCE
Paired Differences
Perception Mean
Expectation Mean
t test Sig. (2-tailed)
GAP Score( P-E)
© UIJIR | ISSN (O) – 2582-6417 OCT. 2020 | Vol. 1 Issue 5 www.uijir.com
Universe International Journal of Interdisciplinary Research
(Peer Reviewed Refereed Journal)
DOI: http://www.doi-ds.org/doilink/10.2020-44767748/ www.uijir.com
Page 26
18. Staff will give individual attention to guests 18. Staff gave individual attention to guests
6.2677 5.4394 -6.622 .000
0.83
19. The hotel will have convenient working hours and will be accessible
19. The hotel had convenient working hours and will be accessible
6.1465 5.4444
-5.841 .000
0.7
20. The Hotel will have Staff who will give personal service to guests
20. The Hotel had Staff who gave personal service to guests 6.2475 5.5202
-5.968 .000 0.73
21. The Hotel will have Guests' best interest at heart 21. The Hotel had Guests' best interest at heart
6.1313 5.303 -6.780 .000
0.83
22. Staff of the Hotel will individually recognize the needs of the tourists
22. Staff of the Hotel will individually recognize the needs of the tourists
6.2879 5.5303
-6.096 .000
0.76
Total 6.21618 5.44746 0.77
Table 15 showed that overall satisfaction from the Assurance factor of the hotels in Srinagar
was highest at 6.22. The Positive gap between perception and expectation at 0.77 indicated
that service delivery exceeded the expectations of tourists staying there. Tourists were
satisfied with the overall intentions and behavior of the hotel staff. V18 and v21 were most
satisfactory to tourists whileV19 had the lowest satisfaction within the dimension.
V18. Positive Gap indicated that the staff gave individual attention to the needs of every tourist
and customized their products according to their needs.
V19. Positive Gap indicated that the hotels welcomed tourists even late into the night and every
service was available all the time.
V20. Positive Gap indicated that the staff was always ready to help tourists with specific
demands of tourists outside of the package too.
V21. Positive Gap indicated that the tourists were genuinely and wholeheartedly welcomed by
the hotel staff with utmost courtesy and treated with utmost sincerity.
V22. Positive Gap indicated that the staff was well trained and understood the unique needs of
each tourist.
The significance value was p<.001 which was less than .005. Evaluating the t-test, we rejected
the null hypothesis as we had found enough evidence that service quality had significant impact
on customer satisfaction across all variables of Assurance.
CONCLUSION
Every hotel aims at maximum customer satisfaction so that they can aim to market themselves
to new customers and develop loyalty in existing ones. The customer in every service business
is considered as the king, whose needs and preferences define the standards of service delivery.
Customer satisfaction results into a loyal customer and a loyal customer means repeat business.
Every customer perceives service in different ways. Nowadays hotels in a competitive market
like Srinagar need to understand the customer customization in service delivery.
We tried to assess whether tourists staying in hotels in Srinagar found the quality of service of
the hotels satisfactory or close to their expectation’s level. It would have helped the hoteliers
determine their strengths and weaknesses on various variables. Thus, they will be able to
modify their service delivery according to the needs of the customer. The findings indicated the
service perceptions of tourists overall was higher than what they had expected. It meant the
hotels in Srinagar had created very good infrastructure and provided best possible service and
training to its staff which helped exceed the expectations of the tourists. The only place where
hotels in Srinagar needed to improve was their responsiveness culture. Otherwise, it was highly
unlikely that the service delivery of hotels should have exceeded the expectations of tourists by

© UIJIR | ISSN (O) – 2582-6417 OCT. 2020 | Vol. 1 Issue 5 www.uijir.com
Universe International Journal of Interdisciplinary Research
(Peer Reviewed Refereed Journal)
DOI: http://www.doi-ds.org/doilink/10.2020-44767748/ www.uijir.com
Page 27
such a huge gap. Because in service industry, it is often found that the customer is never
satisfied and a modern customer being a sophisticated one with his/her complexities’ demands
more out of the service provider. The hospitable culture of Kashmir contributes to the single
most satisfaction factor among tourists. One factor which was lacking in previous studies was
tangibility of the hotels, which hotels in Srinagar seemed to have improved substantially. The
reason many be a prolonged shutdown which enabled old hotels to renovate and hire new staff.
Also, many students who have completed professional studies in Hospitality and Tourism have
been inducted in the industry, thus improving service quality to tourists.
Management of hotels should train staff on the job and conduct special workshops from experts
within and outside the industry. Tie-ups should be made with more business and hospitality
institutes so that trained and skilled manpower is introduced who will bring new concepts to
the industry. Skilled manpower is mannered, cultured, knowledgeable, confident and forward
looking and serves what is demanded by the modern customer.
The limitations of study included that the sample for the study was collected only from 11
centrally located hotels around Dal Lake in Srinagar with 3 star rating. Future research needs to
examine a wider range of the sample with a bigger number of respondents. The study was
undertaken when the tourist season was in shambles in Kashmir, so we could not get a reliable
sample representation.
According to Pearson’s Correlation, there was a significance of p> 0.005 which meant our null
hypothesis that there is no impact of dimensions of service quality on satisfaction of customers
was rejected. GAP analysis also determined the positive service gap between perceived qualities
of service along with the expected service quality which also reject our null hypothesis.
BIBLIOGRAPHY
1. Abror, A., Patrisia, D., Engriani, Y., Evanita, S., Yasri, Y., & Dastgir, S. (2019). Service
quality, religiosity, customer satisfaction, customer engagement and Islamic bank’s
customer loyalty. Journal of Islamic Marketing, ahead-of-print(ahead-of-print), Article
ahead-of-print. https://doi.org/10.1108/JIMA-03-2019-0044
2. Ara, A. (2013). GUESTS’ SATISFACTION IN HOTELS OF KASHMIR VALLEY: AN EMPIRICAL
ASSESSMENT. 2, 13.
3. Babakus, E., & Boller, G. W. (1992). An empirical assessment of the SERVQUAL scale.
Journal of Business Research, 24(3), 253–268. https://doi.org/10.1016/0148-
2963(92)90022-4
4. Brandon‐Jones, A., & Silvestro, R. (2010). Measuring internal service quality: Comparing
the gap‐based and perceptions‐only approaches. International Journal of Operations &
Production Management, 30(12), 1291–1318.
https://doi.org/10.1108/01443571011094271
5. Bukhari, S. M. F., Ghoneim, A., Dennis, C., & Jamjoom, B. (2013). The antecedents of
travellers’ e-satisfaction and intention to buy airline tickets online: A conceptual model.
Journal of Enterprise Information Management, 26(6), 624–641.
https://doi.org/10.1108/JEIM-07-2013-0040
6. Buttle, F. (1996). SERVQUAL: Review, critique, research agenda. European Journal of
Marketing, 30, 8–32. https://doi.org/10.1108/03090569610105762
7. Choi, T., & Chu, R. (2001). Determinants of hotel Guests’s satisfaction and repeat
patronage in the Hong Kong hotel industry. International Journal of Hospitality
Management, 20, 277–297. https://doi.org/10.1016/S0278-4319(01)00006-8
© UIJIR | ISSN (O) – 2582-6417 OCT. 2020 | Vol. 1 Issue 5 www.uijir.com
Universe International Journal of Interdisciplinary Research
(Peer Reviewed Refereed Journal)
DOI: http://www.doi-ds.org/doilink/10.2020-44767748/ www.uijir.com
Page 28
8. DilPazir, D., & Amin, I. (2012). A STUDY OF CUSTOMER SATISFACTION TOWARDS HOTEL
INDUSTRY IN KASHMIR VALLEY. 8.
9. Fick, G. R., & Brent Ritchie, J. R. (1991). Measuring Service Quality in the Travel and
Tourism Industry. Journal of Travel Research, 30(2), 2–9.
https://doi.org/10.1177/004728759103000201
10. González, M. E. A., Comesaña, L. R., & Brea, J. A. F. (2007). Assessing tourist behavioral
intentions through perceived service quality and customer satisfaction. Journal of
Business Research, 60(2), 153–160. https://doi.org/10.1016/j.jbusres.2006.10.014
11. Grönroos, C. (1993). A Service Quality Model and Its Marketing Implications. European
Journal of Marketing, 18, 36–44. https://doi.org/10.1108/EUM0000000004784
12. Gruen, T., Summers, J., & Acito, F. (2000). Relationship Marketing Activities,
Commitment, and Membership Behaviors in Professional Associations. Journal of
Marketing, 64. https://doi.org/10.1509/jmkg.64.3.34.18030
13. Iacobucci, D., Ostrom, A., & Grayson, K. (1995). Distinguishing Service Quality and
Customer Satisfaction: The Voice of the Consumer. Journal of Consumer Psychology, 4(3),
277–303. https://doi.org/10.1207/s15327663jcp0403_04
14. Johnston, R., & Heineke, J. (1998). Exploring the Relationship between Perception and
Performance: Priorities for Action. The Service Industries Journal, 18(1), 101–112.
15. Kundu, S., & Datta, S. K. (2015). Impact of trust on the relationship of e-service quality
and customer satisfaction. EuroMed Journal of Business, 10(1), 21–46.
https://doi.org/10.1108/EMJB-10-2013-0053
16. Lee, H. S. (n.d.). Major Moderators Influencing the Relationships of Service Quality,
Customer Satisfaction and Customer Loyalty.
17. Parasuraman, A. P., Zeithaml, V., & Berry, L. (1985). A Conceptual Model of Service
Quality and its Implication for Future Research (SERVQUAL). The Journal of Marketing,
49, 41–50. https://doi.org/10.2307/1251430
18. Parasuraman, Ananthanarayanan, Zeithaml, V. A., & Berry, L. L. (1988). Servqual: A
multiple-item scale for measuring consumer perc. Journal of Retailing, 64(1), 12.
19. Parasuraman, Arun, Berry, L. L., & Zeithaml, V. A. (1991). Refinement and reassessment
of the SERVQUAL scale. Journal of Retailing, 67(4), 420.
20. Principles of Marketing—Philip Kotler, Gary M. Armstrong—Google Books. (n.d.).
Retrieved July 25, 2020, from
https://books.google.co.in/books/about/Principles_of_Marketing.html?id=qYbPtgAACA
AJ&redir_esc=y
21. Professor, Administrative Management College, Bangalore, & Rao, P. S. (2013). Impact of
Service Quality on Customer Satisfaction in Hotel Industry. IOSR Journal Of Humanities
And Social Science, 18(5), 39–44. https://doi.org/10.9790/0837-1853944
22. Sureshchandar, G. S., Rajendran, C., & Anantharaman, R. N. (2002). The relationship
between service quality and customer satisfaction – a factor specific approach. Journal of
Services Marketing, 16(4), 363–379. https://doi.org/10.1108/08876040210433248
23. Taylor, S. A., & Baker, T. L. (1994). An assessment of the relationship between service
quality and customer satisfaction in the formation of consumers’ purchase intentions.
Journal of Retailing, 70(2), 163–178. https://doi.org/10.1016/0022-4359(94)90013-2
24. Tessera, F. A., Hussain, I. A., & Ahmad, N. (2016). Service Quality and Hotel’s Customer
Satisfaction: An Empirical Evidence from Ethiopia. 1(1), 9.

© UIJIR | ISSN (O) – 2582-6417 OCT. 2020 | Vol. 1 Issue 5 www.uijir.com
Universe International Journal of Interdisciplinary Research
(Peer Reviewed Refereed Journal)
DOI: http://www.doi-ds.org/doilink/10.2020-44767748/ www.uijir.com
Page 29
25. Ting,
D. H. (2004). Service quality and satisfaction perceptions: Curvilinear and interaction
effect. International Journal of Bank Marketing, 22, 407–420.
https://doi.org/10.1108/02652320410559330
26. Wilkins, H., Merrilees, B., & Herington, C. (2007). Toward an understanding of total
service quality in hotels. International Journal of Hospitality Management, 26.
https://doi.org/10.1016/j.ijhm.2006.07.006
27. Yap, S. F., & Kew, M. L. (2007). Service quality and customer satisfaction: Antecedents of
customer’s re-patronage intentions. Sunway Academic Journal, 4, 59–73.
28. Yen, C., & Lu, H. (2008). Effects of e‐service quality on loyalty intention: An empirical
study in online auction. Managing Service Quality: An International Journal, 18(2), 127–
146. https://doi.org/10.1108/09604520810859193