Evaluation of the QA forms used for deposition...
29
Evaluation of the QA forms used for deposition analyses EU/UN ECE - International Co-operative Programme on Assessment and Monitoring of Air Pollution Effects on Forests ________________________________________________________________ Working Group on QA/QC in Laboratories Meeting of the Heads of the Laboratories Zadar, Croatia, 19-20 September 2013 Aldo Marchetto, Gabriele Tartari & Rosario Mosello, C.N.R. Institute of Ecosystem Study, Verbania (Italy) e-mail: [email protected] http://www.ise.cnr.it/it/verbania-it/home-vb http://www.idrolab.ise.cnr.it/
Transcript of Evaluation of the QA forms used for deposition...

Evaluation of the QA forms used for
deposition analyses
EU/UN ECE - International Co-operative Programme on Assessment and Monitoring of Air Pollution Effects on Forests________________________________________________________________
Working Group on QA/QC in Laboratories
Meeting of the Heads of the Laboratories
Zadar, Croatia, 19-20 September 2013
Aldo Marchetto, Gabriele Tartari & Rosario Mosello,
C.N.R. Institute of Ecosystem Study, Verbania (Italy)
e-mail: [email protected]
http://www.ise.cnr.it/it/verbania-it/home-vb http://www.idrolab.ise.cnr.it/
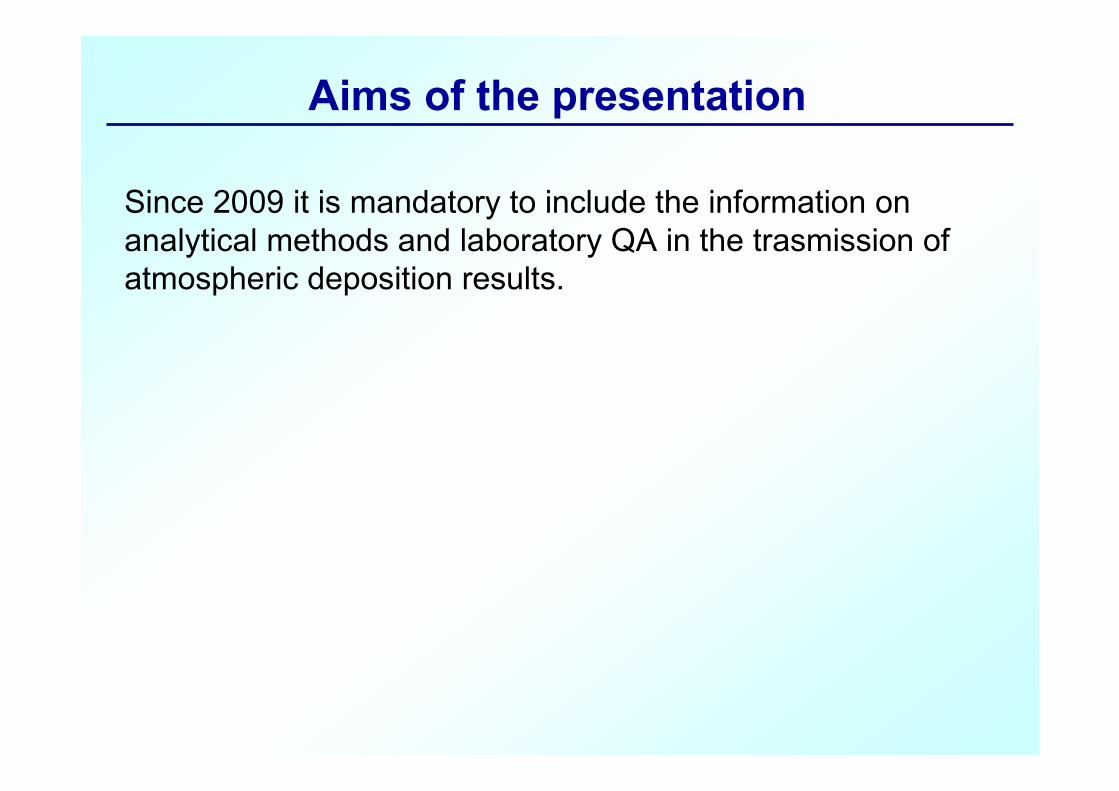
Aims of the presentation
Since 2009 it is mandatory to include the information on
analytical methods and laboratory QA in the trasmission of
atmospheric deposition results.
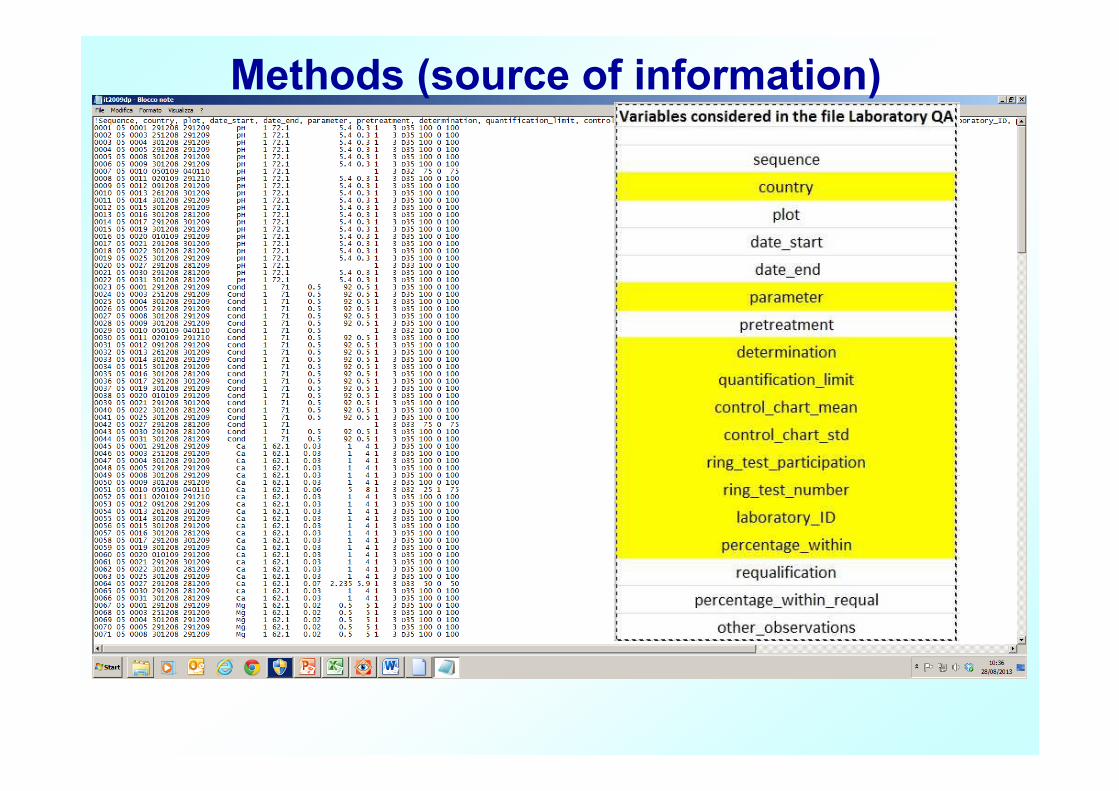
Methods (source of information)
Since 2009 it is mandatory to include the information on
analytical methods and laboratory QA in the trasmission of
atmospheric deposition results.
Aims of the presentation
Taking account of the different analytical techniques, the
presentation will focus on anomalous reported values (e.g. for
LOQs) and missing or wrong information, which highlight
problems in the laboratories or in the transmission of data.
5
Aldo Marchetto, Gabriele Tartari & Rosario Mosello
Limit of Detection (LOD)and
Limit of Quantification (LOQ)
estimation and use in the chemical lab
Life+ FutMon - Working Group on QA/QC in Laboratories
Meeting of the Heads of the Laboratories
C.N.R. Institute of Ecosystem Study, Verbania (Italy)
e-mail: [email protected] http://www.iii.to.cnr.it
12-13 October 2009 in Warsaw
6
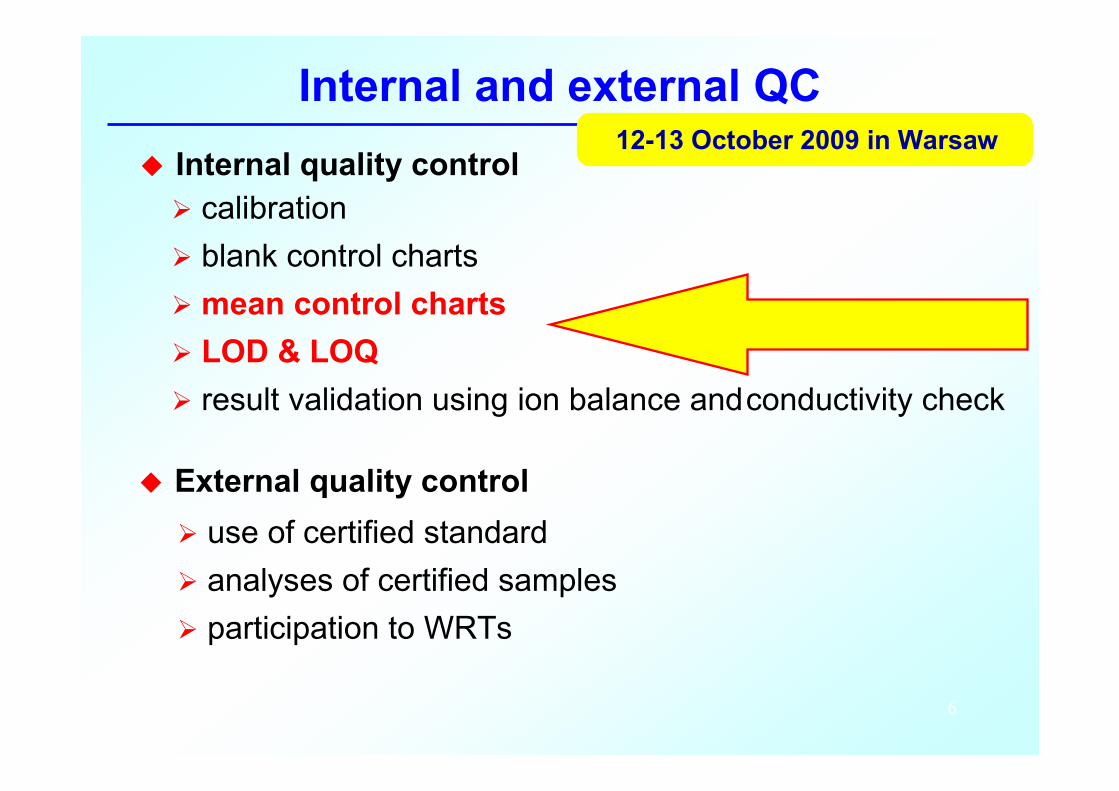
Internal and external QC
Ø calibration
Ø blank control charts
Ø mean control charts
Ø LOD & LOQ
Ø result validation using ion balance andconductivity check
u Internal quality control
u External quality control
Ø use of certified standard
Ø analyses of certified samples
Ø participation to WRTs
12-13 October 2009 in Warsaw

7
Why to estimate LOD and LOQ?
Ø To evaluate the suitability of the used
analytical technique and conditions to the
aims of the monitoring.
Ø To compare the quality of the determination
with other published results in order to
evaluate if there is necessity and possibility of
improvement.
12-13 October 2009 in Warsaw
8
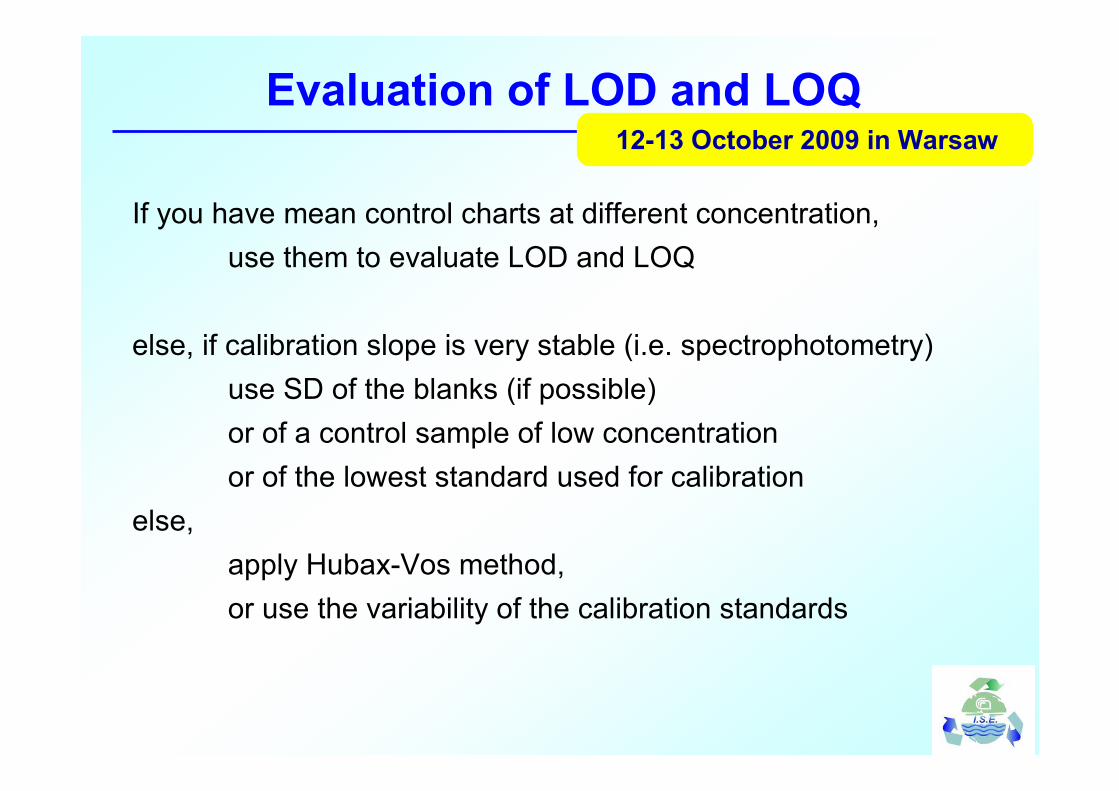
Evaluation of LOD and LOQ
If you have mean control charts at different concentration,
use them to evaluate LOD and LOQ
else, if calibration slope is very stable (i.e. spectrophotometry)
use SD of the blanks (if possible)
or of a control sample of low concentration
or of the lowest standard used for calibration
else,
apply Hubax-Vos method,
or use the variability of the calibration standards
12-13 October 2009 in Warsaw

9
Statistics mg L-1
Average 0.508
Standard Deviation 0.013
Standard Deviation recommended 0.025
RSD % 2.7
RSD % recommended 5.0
Minimum 0.47
Maximum 0.54
N. data 115
0
5
10
15
20
25
0 1 2 3 4 5 6 7 8 9 10 11
mg L-1
R.S
.D.
Co
ntr
ol
Ch
art
s
Using control chart
Chloride
Ion Chromatography
C.N.R.- I.S.E.Verbania - Italy
0.40
0.42
0.44
0.46
0.48
0.50
0.52
0.54
0.56
0.58
0.601 6
11
16
21
26
31
36
41
46
51
56
61
66
71
76
81
86
91
96
101
106
111
mg
L-1
UWL
LWL
UCL
LCL
RSD = 3.37 (mg/L)-0.46
Single control chart in use
from Nov 2006 to Aug 2007
All control charts used in the lab for
IC determinations (in 20 years)
12-13 October 2009 in Warsaw

10
Conclusions
u Quality Control is an important tool to criticize analytical
activity, to improve it and to assure that it is suitable for
the purpose of monitoring.
u The estimation of LOD and LOQ is an important part of
Quality Control.
u LOD and LOQ can be simply evaluated using results of
control charts, blank samples or calibration curves.
u If you do not store these data yet, please store them
anywhere and in a few years you will have years of data...
12-13 October 2009 in Warsaw

LO
Qs
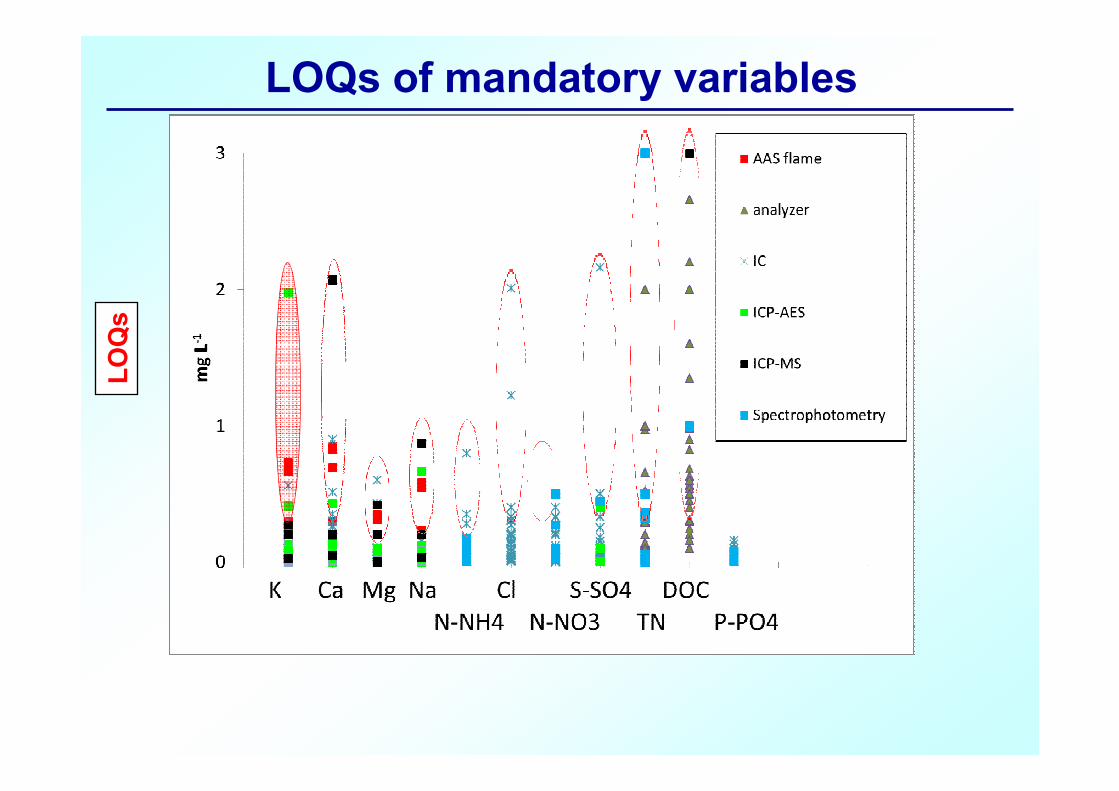
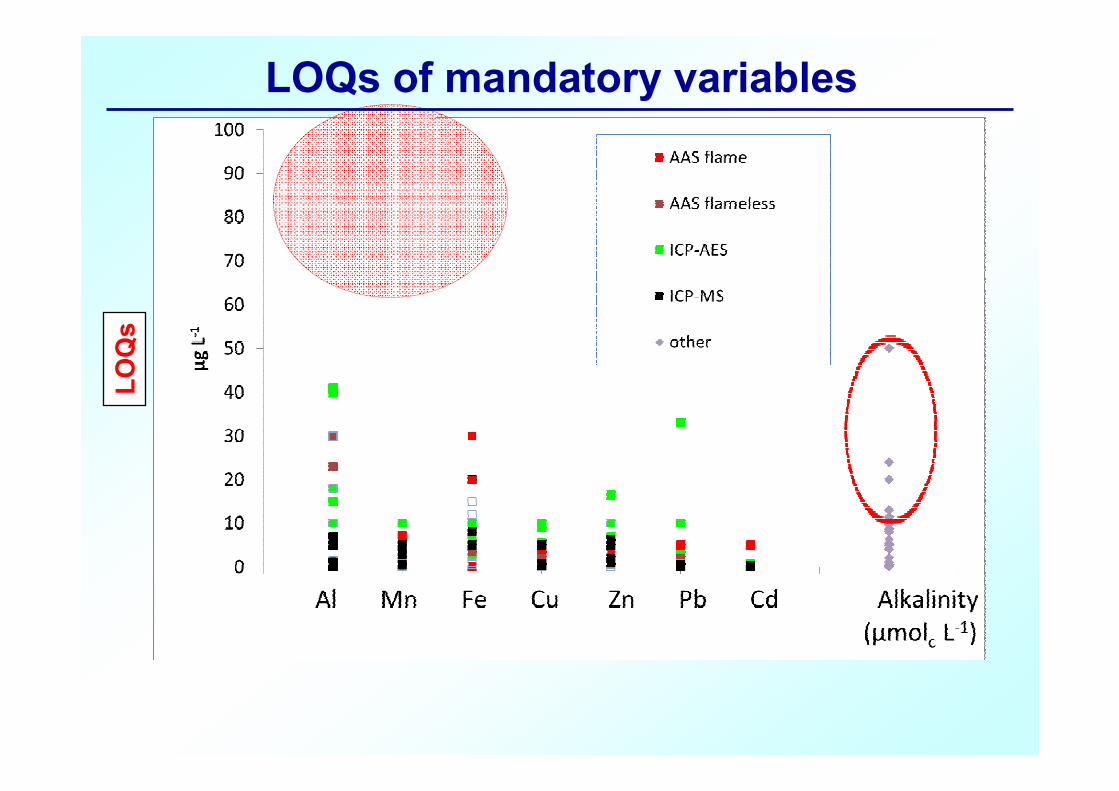
LOQs of mandatory variables

LOQs of mandatory variablesL
OQ
s
Strong outliers

Values of LOQ obtained in each laboratory
should be compared with those
suggested in Arcachon (2011)
LOQArcachon (2011)
Alkalinity 10 µeq/L
Conductivity 2 µS/cm
Cl- 0.2 mg/L
S-SO4= 0.1 mg/L
N-NO3- 0.08 mg/L
Total N 0.2 mg/L
LOQArcachon (2011)
Ca++ 0.1 mg/L
Mg++ 0.05 mg/L
Na+ 0.1 mg/L
K+ 0.4mg/L
N-NH4+ 0.08 mg/L
DOC 1 mg/L
P-PO4--- 0.1 mg/L
LOQs of mandatory variablesL
OQ
s
LOQs of mandatory variablesL
OQ
s
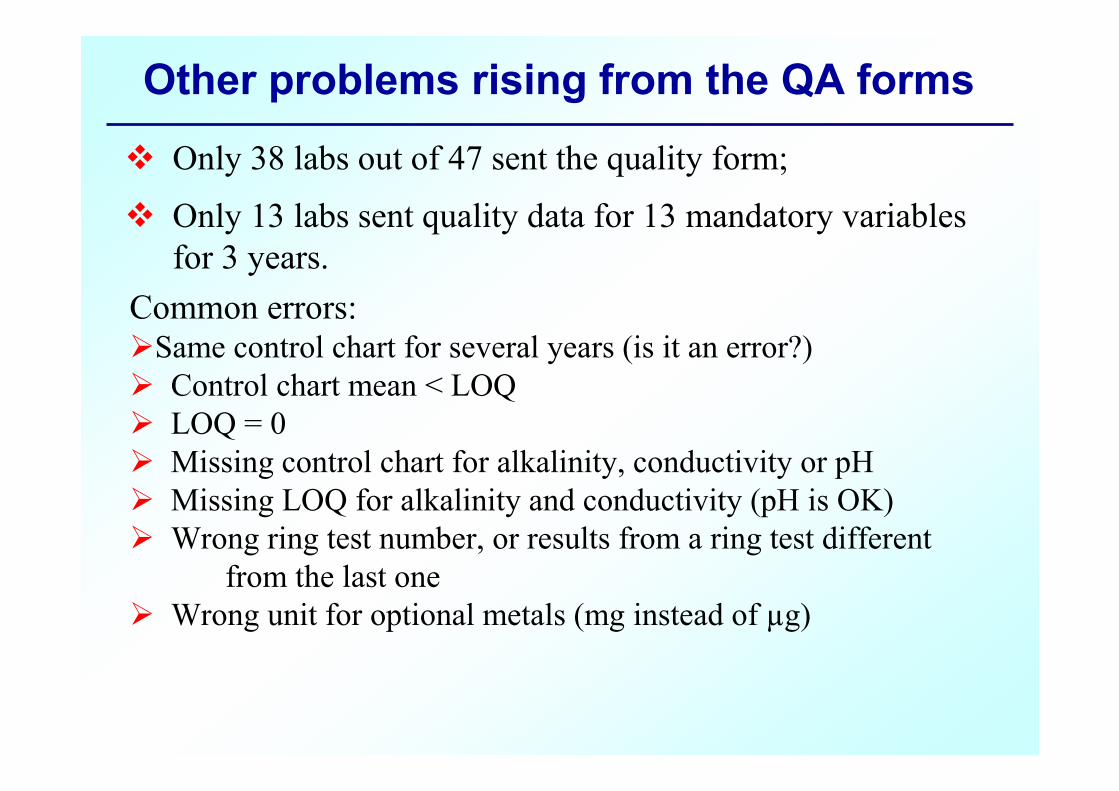
Other problems rising from the QA forms
v Only 38 labs out of 47 sent the quality form;
v Only 13 labs sent quality data for 13 mandatory variables
for 3 years.
Common errors:ØSame control chart for several years (is it an error?)
Ø Control chart mean < LOQ
Ø LOQ = 0
Ø Missing control chart for alkalinity, conductivity or pH
Ø Missing LOQ for alkalinity and conductivity (pH is OK)
Ø Wrong ring test number, or results from a ring test different
from the last one
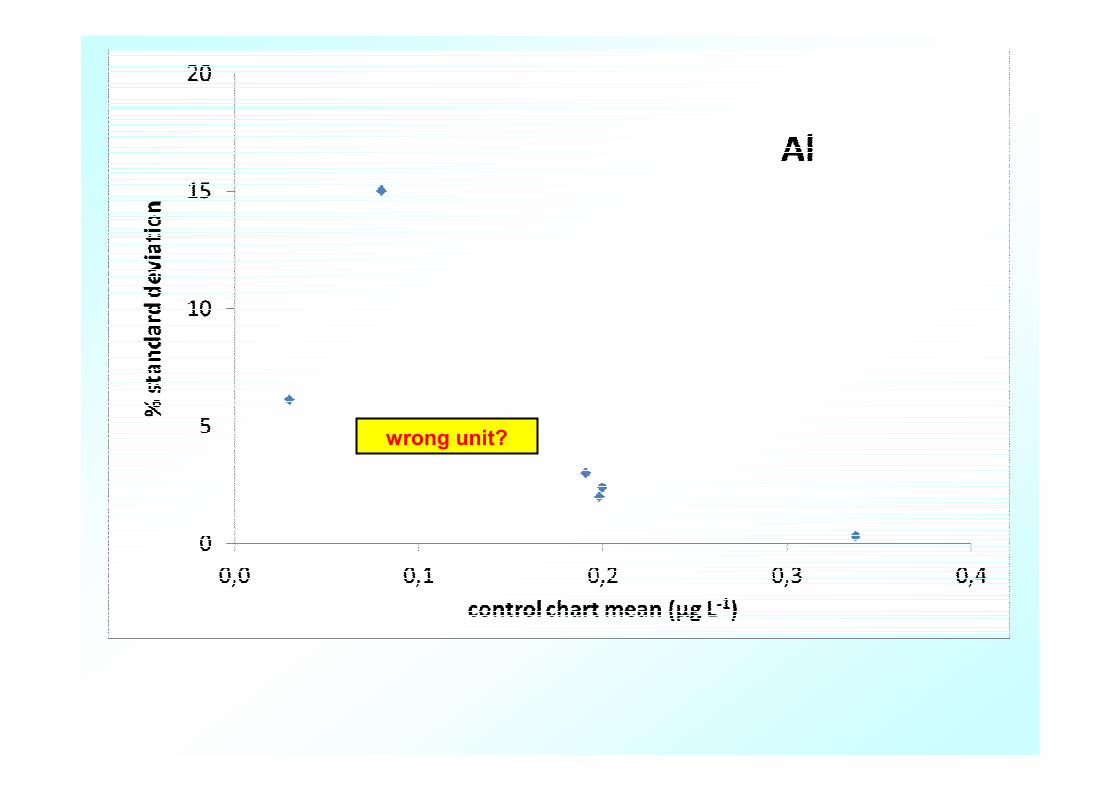
Ø Wrong unit for optional metals (mg instead of µg)
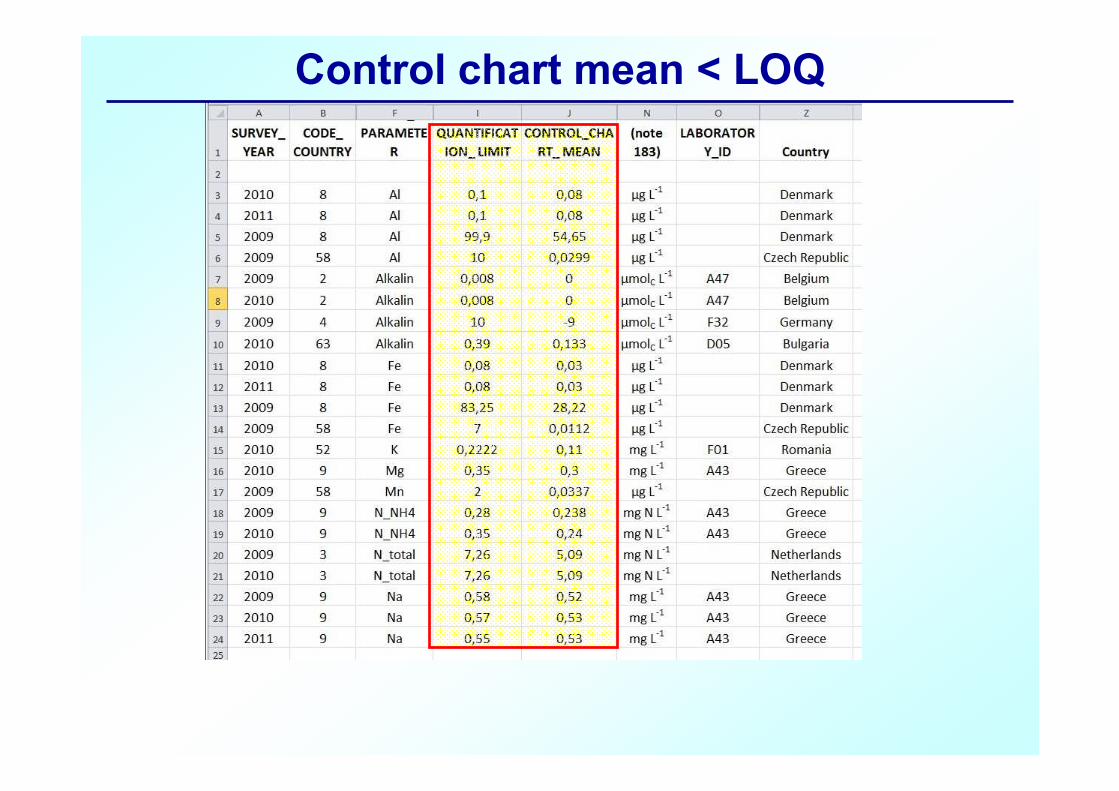
Control chart mean < LOQ
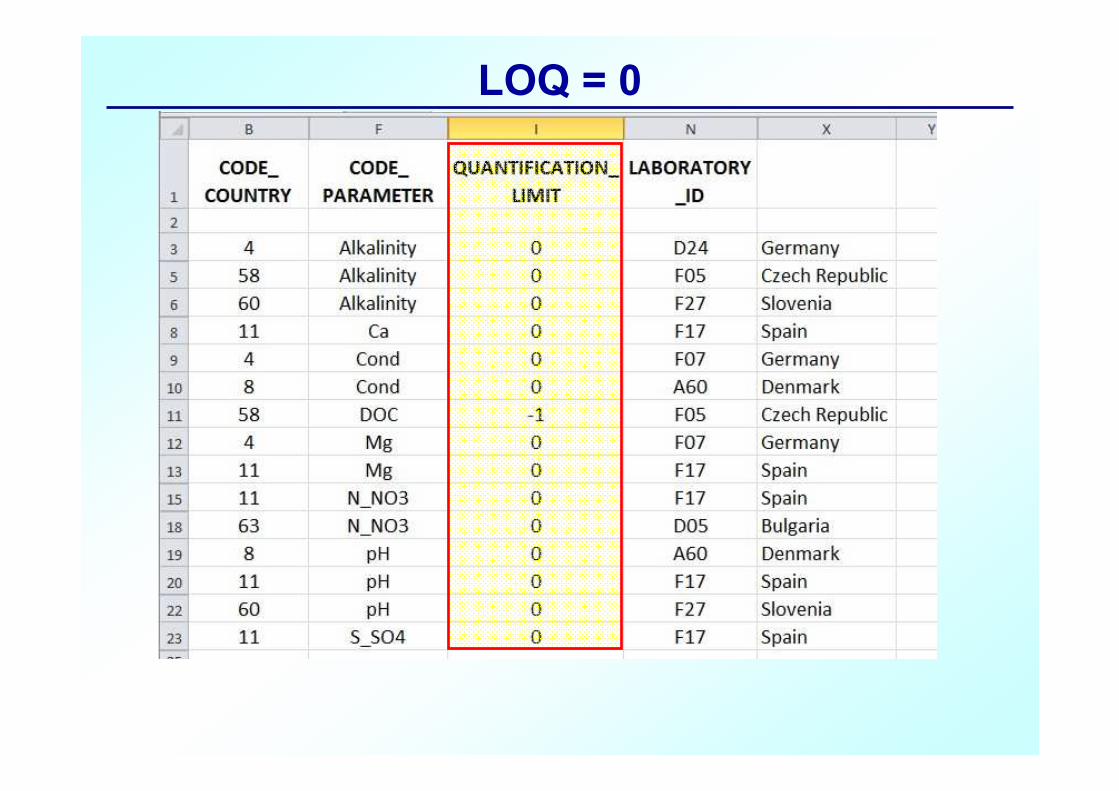
LOQ = 0

Missing
control chart for:
alkalinity
conductivity
pH
Missing LOQ for:
alkalinity
conductivity
(pH is OK)
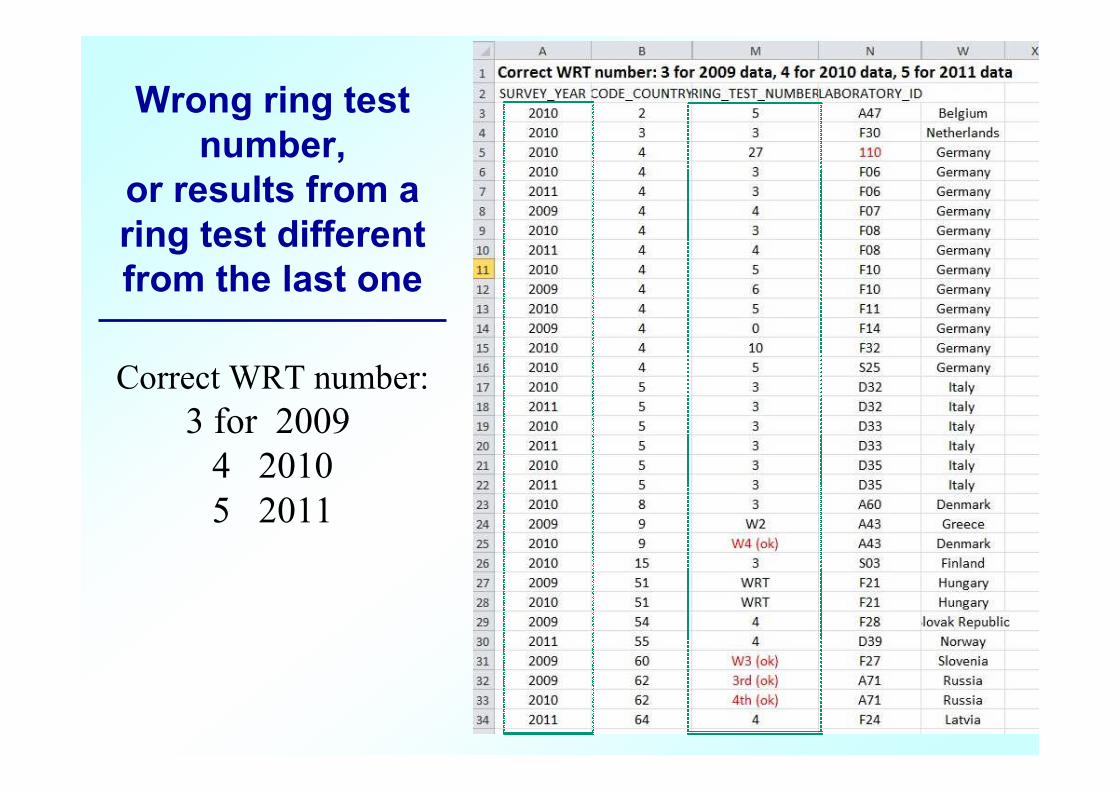
Wrong ring test
number,
or results from a
ring test different
from the last one
Correct WRT number:
3 for 2009
4 2010
5 2011

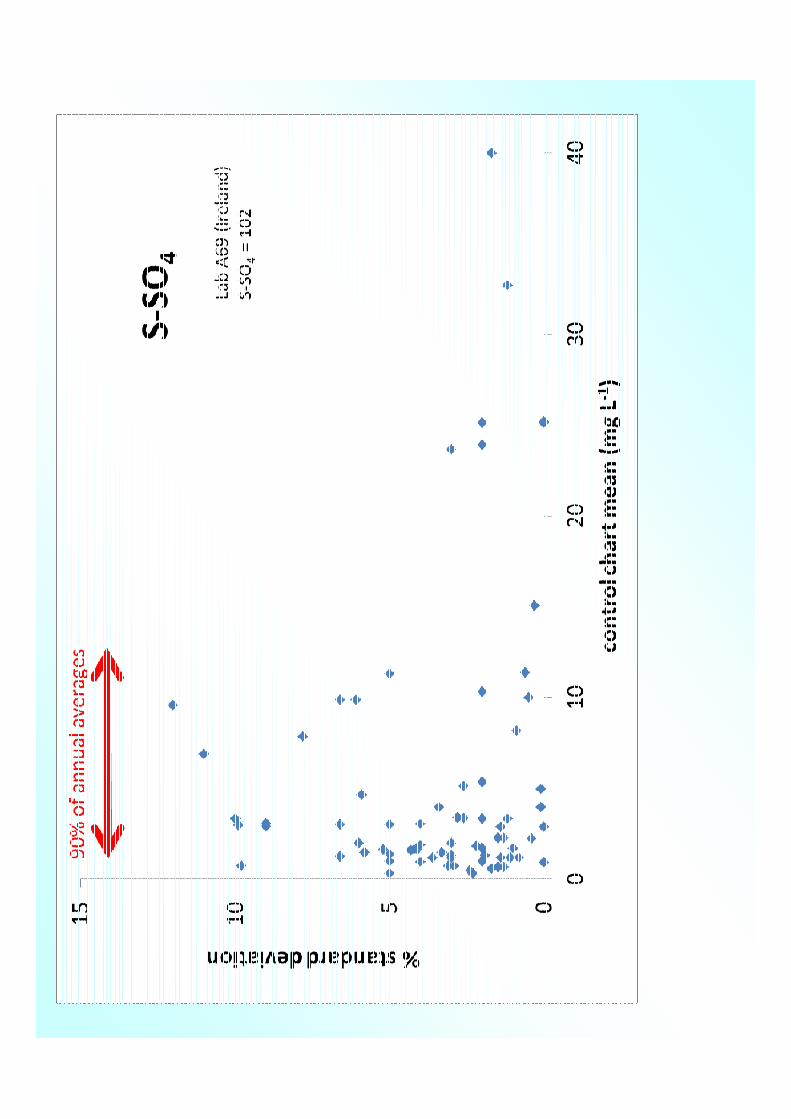
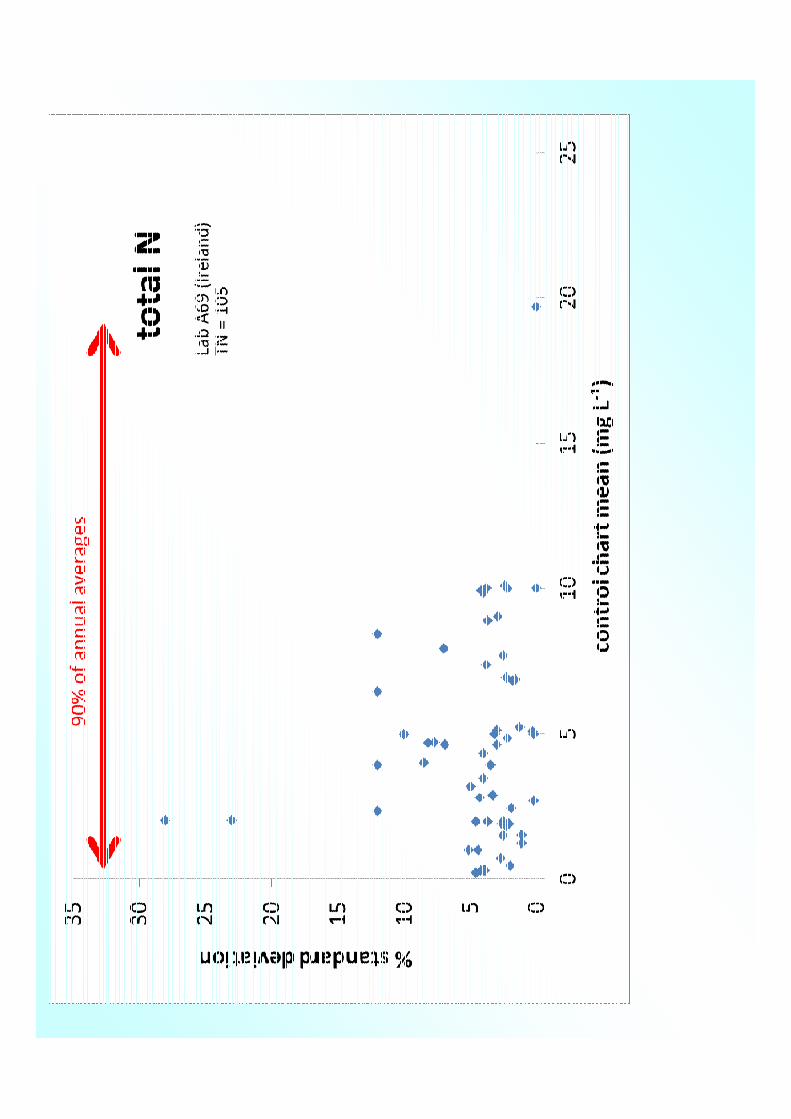
Mean values of the control charts
vs the deposition concentrations

wrong unit?
wrong unit?
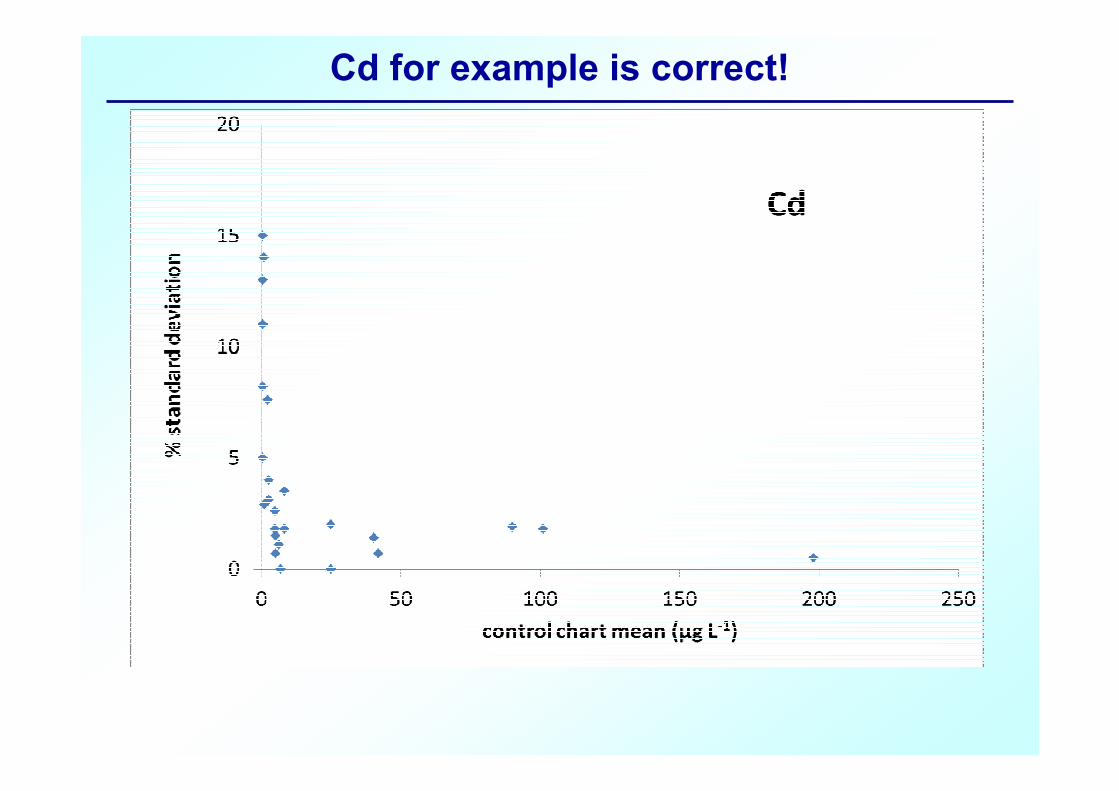
Cd for example is correct!
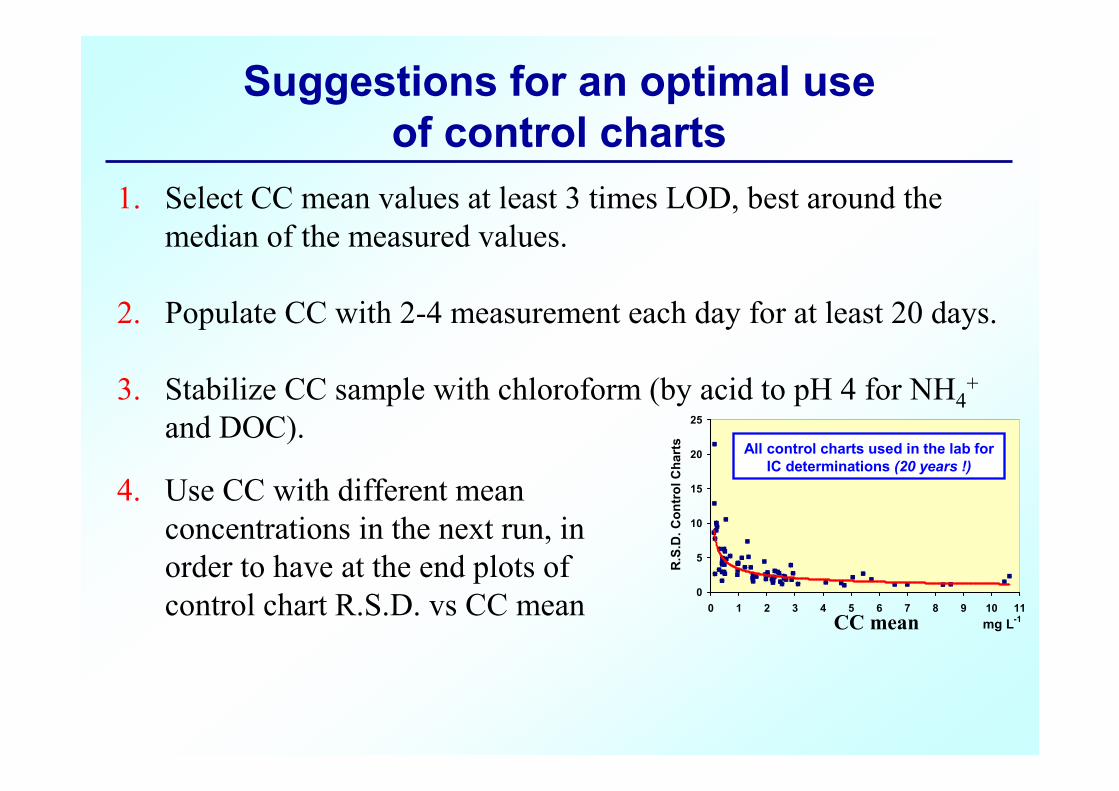
1. Select CC mean values at least 3 times LOD, best around the
median of the measured values.
2. Populate CC with 2-4 measurement each day for at least 20 days.
3. Stabilize CC sample with chloroform (by acid to pH 4 for NH4+
and DOC).
Suggestions for an optimal use
of control charts
4. Use CC with different mean
concentrations in the next run, in
order to have at the end plots of
control chart R.S.D. vs CC mean0
5
10
15
20
25
0 1 2 3 4 5 6 7 8 9 10 11
mg L-1
R.S
.D. C
on
tro
l C
hart
s
All control charts used in the lab for
IC determinations (20 years !)
CC mean
Conclusions
üThe highest care is needed in the QA/QC practices and
documentation in the laboratory.
üThe comparison of LOD and other QC parameters among
laboratories gives information on the reliability of the
applied methods and the possibility of improvements.
üThe highest attention should be used in the transmission
of results and details on the methods and QA/QC, as
essential documentation for the evaluation of the quality
of data produced in the laboratory.

Thank you for your attention


![Painting Contractor QA/QC Plan Sample - … · Pat [Pick the date] Painting Contractor QA/QC Plan Sample Specific Quality Plan Quality Manual Painting Standards & Inspection Forms](https://static.fdocuments.in/doc/165x107/5b66f72f7f8b9a2a5c8d9661/painting-contractor-qaqc-plan-sample-pat-pick-the-date-painting-contractor.jpg)


![Fireproofing & Firestopping QA/QC Manual Sample · 2018. 3. 9. · Pat [Pick the date] Selected pages (not a complete plan) • Quality Manual • Reporting Forms • Inspection Forms](https://static.fdocuments.in/doc/165x107/60b0bfd39877162a98663bb6/fireproofing-firestopping-qaqc-manual-sample-2018-3-9-pat-pick-the.jpg)