EVALUATION OF THE PM AND OZONE PRODUCING POTENTIAL …
40
EVALUATION OF THE PM AND OZONE PRODUCING POTENTIAL OF NATURAL GAS-POWERED VEHICLES Final Report California Institute For Energy Efficiency Lawrence Berkeley National Laboratory Agreement 4910210 by: Dennis R. Fitz, William P.L. Carter and David Cocker October 19, 1998 Center for Environmental Research and Technology College of Engineering University of California Riverside, CA 92521 98-AP-RT9J-001-FR
Transcript of EVALUATION OF THE PM AND OZONE PRODUCING POTENTIAL …

EVALUATION OF THE PM ANDOZONE PRODUCING POTENTIAL
OF NATURAL GAS-POWERED VEHICLES
Final ReportCalifornia Institute For Energy EfficiencyLawrence Berkeley National Laboratory
Agreement 4910210
by:
Dennis R. Fitz, William P.L. Carter and David Cocker
October 19, 1998
Center for Environmental Research and TechnologyCollege of EngineeringUniversity of California
Riverside, CA 92521
98-AP-RT9J-001-FR

ABSTRACT
The use of natural gas as a vehicle fuel has benefits over petroleum-based fuels in reducing the
primary emission of volatile organic compounds (VOC) and particulate matter (PM). The objective of this
research was to provide information concerning the relative PM forming potential of exhaust emissions
from vehicles fueled with natural gas compared with that from gasoline and diesel-fueled vehicles. A dual-
reactor, large (~20 m3 each) indoor environmental chamber was constructed to allow for growth and
measurement under controlled conditions simulating the atmosphere. A chassis dynamometer facility was
used to generate and characterize exhausts from a natural gas, a gasoline, and from a diesel-fueled vehicle.
The exhaust gases were added to propene - NOx - air mixtures to simulate gas-phase pollutants from other
sources in polluted urban atmospheres. Cold-start exhaust was injected into one reactor and hot start
exhaust from the same vehicle was injected into the other, and the two mixtures were irradiated with
blacklights for 4-6 hours, with gas-phase species measured before and during the irradiations. A
Differential Mobility Analyzer (DMA) was used to obtain particle number and volume information
throughout the experiments, and the final aerosol mass was also determined by passing the contents of the
reactors through filters which were weighed at the end of the experiments. Significant small particle
formation was observed in control experiments due to nucleation by background contaminants, which
prevented quantitative particle growth information to be obtained from the DMA data. The particle mass
emitted or formed from the natural gas vehicle was found to be not significantly different from the control
experiments, while significantly higher particle mass was formed from the vehicle fueled by conventional
gasoline. The data from the diesel vehicle were inconclusive because of the small amount added.
Additional experiments using an improved air purification system and including separate particle loss
measurements in the chamber are needed before quantitative information can be obtained concerning
differences in PM forming potentials in vehicle emissions. Nevertheless, the data obtained indicate that
emissions from natural gas vehicles are likely to have lower PM forming potentials than those from
gasoline vehicles.
ii

ACKNOWLEDGMENTS
We wish to thank Mr. Matthew Smith and Mr. Kurt Bumiller for their assistance in designing and
overseeing the construction of the chamber and Mr. Michael Boeck for constructing the chamber. Our
thanks to Ms. Irina Malkina and Dr. Dongmin Luo in conducting the chamber runs. We wish to thank Dr.
Richard Flagan of the California Institute (Caltech) of Technology for making Mr. David Cocker and the
Caltech Differential Mobility Aerosol Analyzer available for this project. Mr. Cocker is currently a
graduate student at Caltech.
The research reported here was funded by the California Institute for Energy Efficiency (CIEE),
a research unit of the University of California. Publication of research results does not imply CIEE
endorsement of or agreement with these findings, nor that of any CIEE sponsor. The opinions and
conclusions given herein are entirely those of the authors.
iii

TABLE OF CONTENTS
Section Page
LIST OF TABLES . . . . . . . . . . . . . . . . . . . . . . . . . . . . . . . . . . . . . . . . . . . . . . . . . . . . . . . . v
LIST OF FIGURES. . . . . . . . . . . . . . . . . . . . . . . . . . . . . . . . . . . . . . . . . . . . . . . . . . . . . . . . v
INTRODUCTION . . . . . . . . . . . . . . . . . . . . . . . . . . . . . . . . . . . . . . . . . . . . . . . . . . . . . . . . . 1
APPROACH . . . . . . . . . . . . . . . . . . . . . . . . . . . . . . . . . . . . . . . . . . . . . . . . . . . . . . . . . . . . . 3Chamber Design. . . . . . . . . . . . . . . . . . . . . . . . . . . . . . . . . . . . . . . . . . . . . . . . . . . . . 3Instrumentation . . . . . . . . . . . . . . . . . . . . . . . . . . . . . . . . . . . . . . . . . . . . . . . . . . . . . 5Dynamometer Operations and Vehicles Employed. . . . . . . . . . . . . . . . . . . . . . . . . . . . . 6Experimental Procedures. . . . . . . . . . . . . . . . . . . . . . . . . . . . . . . . . . . . . . . . . . . . . . . 7
RESULTS AND DISCUSSION. . . . . . . . . . . . . . . . . . . . . . . . . . . . . . . . . . . . . . . . . . . . . . . . 8Characterization Experiments. . . . . . . . . . . . . . . . . . . . . . . . . . . . . . . . . . . . . . . . . . . . 8
Light Characterization. . . . . . . . . . . . . . . . . . . . . . . . . . . . . . . . . . . . . . . . . . . 8Ozone Conditioning. . . . . . . . . . . . . . . . . . . . . . . . . . . . . . . . . . . . . . . . . . . . 11Mixing Time Determination. . . . . . . . . . . . . . . . . . . . . . . . . . . . . . . . . . . . . . 11Pure Air Irradiations . . . . . . . . . . . . . . . . . . . . . . . . . . . . . . . . . . . . . . . . . . . 11N-Butane - NOx Experiment. . . . . . . . . . . . . . . . . . . . . . . . . . . . . . . . . . . . . . 13Surrogate - NOx Conditioning and Control Experiment. . . . . . . . . . . . . . . . . . . 16
Particle Measurement Experiments. . . . . . . . . . . . . . . . . . . . . . . . . . . . . . . . . . . . . . . 18Pure Air Experiments . . . . . . . . . . . . . . . . . . . . . . . . . . . . . . . . . . . . . . . . . . 20Propene - NOx Control Experiments . . . . . . . . . . . . . . . . . . . . . . . . . . . . . . . . 20Gasoline Exhaust Experiments. . . . . . . . . . . . . . . . . . . . . . . . . . . . . . . . . . . . 24CNG Exhaust Experiments. . . . . . . . . . . . . . . . . . . . . . . . . . . . . . . . . . . . . . . 24Diesel Exhaust Experiment. . . . . . . . . . . . . . . . . . . . . . . . . . . . . . . . . . . . . . . 29
CONCLUSIONS . . . . . . . . . . . . . . . . . . . . . . . . . . . . . . . . . . . . . . . . . . . . . . . . . . . . . . . . . 32
REFERENCES . . . . . . . . . . . . . . . . . . . . . . . . . . . . . . . . . . . . . . . . . . . . . . . . . . . . . . . . . . 33
iv

LIST OF TABLESNumber page
1. Summary of conditions and major results of all the chamber experiments carried out forthis program. . . . . . . . . . . . . . . . . . . . . . . . . . . . . . . . . . . . . . . . . . . . . . . . . . . . . . . . 9
2. Results of the NO2 actinometry experiment.. . . . . . . . . . . . . . . . . . . . . . . . . . . . . . . . . 10
LIST OF FIGURES
Number page
1. Chamber housing containing interior blacklights.. . . . . . . . . . . . . . . . . . . . . . . . . . . . . . 42. Inside and outside of panels containing fluorescent blacklights.. . . . . . . . . . . . . . . . . . . . 43. Measured spectral distribution of the chamber, compared to standard blacklight spectrum
recommended for modeling.. . . . . . . . . . . . . . . . . . . . . . . . . . . . . . . . . . . . . . . . . . . . 104. Plots of O3 and ln[O3]
initial/[O3]) vs time for the ozone conditioning experiment.. . . . . . . . 125. Concentration - time plots for NOx during the mixing time determination experiment. . . . 126. Experimental and calculated concentration - time plots for ozone during the pure air
experiments. . . . . . . . . . . . . . . . . . . . . . . . . . . . . . . . . . . . . . . . . . . . . . . . . . . . . . . 147. Experimental and calculated concentration-time plots for the n-butane - NOx experiment
(Run 12) and for the surrogate - NOx experiment (Run 3). . . . . . . . . . . . . . . . . . . . . . . 158. Experimental and calculated concentration-time plots for monitored species for the
surrogate - NOx experiment.. . . . . . . . . . . . . . . . . . . . . . . . . . . . . . . . . . . . . . . . . . . . 179. DMA Particulate Measurements during the second pure air irradiation experiment.. . . . . 2110. Experimental and calculated concentration-time plots for selected species for the propene
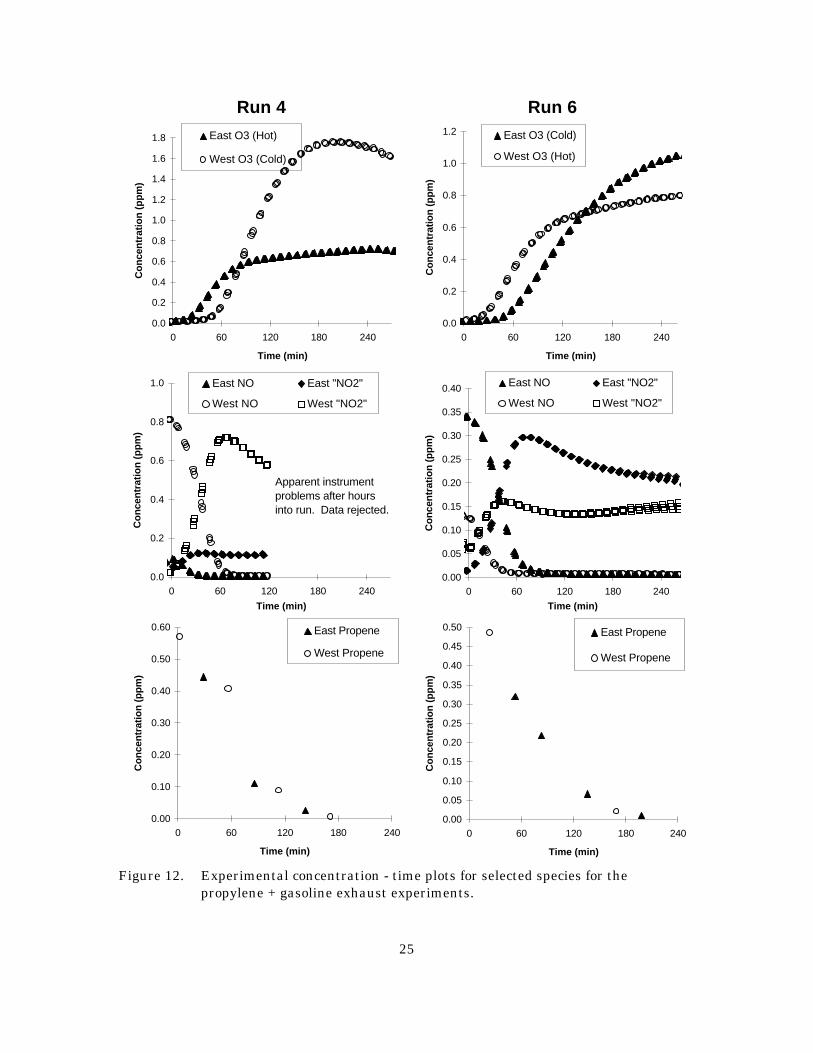
- NOx control experiments.. . . . . . . . . . . . . . . . . . . . . . . . . . . . . . . . . . . . . . . . . . . . 2211. DMA particulate measurements during the first propene - NOx experiment.. . . . . . . . . . . 2312. Experimental concentration-time plots for selected experiments in the propylene + gasoline
exhaust experiments.. . . . . . . . . . . . . . . . . . . . . . . . . . . . . . . . . . . . . . . . . . . . . . . . . 2513. DMA particulate measurements during the propylene + gasoline exhaust experiments. . . . 2614. Experimental concentration-time plots for selected experiments in the propylene + CNG
exhaust experiments.. . . . . . . . . . . . . . . . . . . . . . . . . . . . . . . . . . . . . . . . . . . . . . . . . 2715. DMA particulate measurements during the propylene + CNG exhaust experiments.. . . . . 2816. Experimental concentration - time plots for selected species in the propylene + diesel
exhaust experiment.. . . . . . . . . . . . . . . . . . . . . . . . . . . . . . . . . . . . . . . . . . . . . . . . . 3017. DMA particulate measurements during the propylene + diesel exhaust experiment.. . . . . 31
v

INTRODUCTION
Vehicle exhausts contribute significantly to the atmospheric loadings of particulate matter (PM),
nitrogen oxides (NOx) and reactive organic carbon gases (ROG) (US EPA, 1987). While standard methods
may be used to measure the amount of primary emissions, determining the potential for the formation of
secondary pollutants is much more difficult. The impact of NOx into a polluted environment is fairly well
understood and the amount of resulting ozone predicted from mechanistic models. The impact of ROG
emissions are much more difficult to evaluate since ROG consists of hundreds of compounds, which each
have their own reactivity to form photochemical ozone. A great deal of research has been conducted to
understand the mechanism of the photochemical production of ozone by using smog chambers. This
research, for example, has resulted in the development of a detailed chemical mechanism that can be used
to assess the reactivity of individual ROG components to produce ozone under a variety of environmental
conditions (Carter, 1990; 1995; Carter et al, 1993, 1995a). Airshed models have be developed based on
this and other data in which ozone impact within an airshed can be modeled from changes in the
concentration and composition of the ROG (e.g., Carter, 1994).
The processes in which ROG photochemically react to form compounds of lower volatility that
self-nucleate or condense onto existing PM are more complex since both homogeneous and heterogeneous
reactions are involved. The issue is further complicated since the concentration and composition of emitted
ROG and PM vary among vehicles, fuels, and modes of operation of a single vehicle. Environmental
conditions such as temperature and relative humidity also can influence ROG reactivity and particle
formation. Finally, the role of PM on ozone formation is not well understood. Particulate-forming
processes have been studied for individual compounds or simple synthetic mixtures in both the laboratory
and in environmental smog chambers (Grosjean, 1984; Stern et. al., 1987; Grosjean and Seinfeld, 1989;
Pandis et al., 1991: Wang et al., 1992a,b). The composition of ambient particulate organic carbon (POC)
has also been studied to determine precursors (Grosjean and Fung 1984 and Grosjean 1992) while others
(Pandis et al. 1992, Schauer et al. 1996) used model simulations to estimate ambient secondary POC and
compared the results with measurements. The transformation of gasoline-powered vehicular exhaust to
form secondary POC has been studied by Kleindienst et al. (1992) in smog chambers, to test for
mutagenic activity.
We are not aware of published smog chamber data involving actual vehicular exhausts to quantify
secondary particulate formation. One reason for this lack of data is that only several environmental smog
chambers suitable for this type of work exist, and their access to vehicle emission production and test
equipment is limited.
1

While NG powered vehicles have been shown to produce substantially less fine PM, the overall
benefit to air quality must also consider the photochemical production potential compared with these
petroleum fuels. There is currently no data on these formation potentials for vehicle exhausts, although
it is likely that the benefit compared to conventional duels is likely to be even greater for secondary PM.
This likely would result in policies that will further encourage the use of NG as a vehicle fuel. As an
added benefit, the use of NG as a fuel results in an overall energy savings since the distribution of NG
is more energy efficient than petroleum based fuels.
2

APPROACH
In this project, we used smog chamber simulations to evaluate the PM forming ability of exhausts
from spark ignition CNG exhaust compared to diesel and gasoline. Smog chambers have long been used
to investigate the reaction mechanisms of air pollutants (e.g., Carter and Lurmann, 1991; Carter et al,
1993, 1995a-c, 1997), but their usefulness in observing the transformations of particulate matter has been
limited, in part because of particle interaction with chamber walls (Grosjean, 1984; Stern et. al., 1987;
Grosjean and Seinfeld, 1989; Wang et al., 1992a,b). Previously, smog chambers use for aerosol research
have been relatively large (greater than 50,000 liters) in an attempt to decrease the surface-to-volume ratio
(Wang et al., 1992a,b). With such a large size, artificial irradiation is more difficult; therefore, the
chambers have been set up outdoors to use solar irradiation.
Previous outdoor Teflon chambers used for aerosol generation studies have had many
shortcomings that affect particle growth rates, such as lack of control over light intensity and temperature.
Therefore, for this project we constructed and employed a large-volume indoor environmental chamber
system for such studies.
Chamber Design
The chamber constructed for this project consisted of two large (approximately 20 m3), identical
Teflon bag reactors inside a housing with fluorescent blacklight as an irradiation source. The design was
based on smaller but similar chambers that have been successfully employed in our laboratories for a
number of years to investigate the gas-phase reactions of VOCs responsible for ozone formation (Carter
et al., 1993; 1995a-c, 1997). The indoor environment allowed for temperature and light intensity control.
Added advantages of the indoor approach were the reduction of thermal gradients (by cooling from the
bottom, heating from the top), less flow agitation and surface charge buildup (due to shielding from wind),
and longer chamber lifetime.
The Teflon bag reactors were constructed by heat sealing together six 2 mil thick FEP Teflon
panels each 58 inches wide and 3m long to form a tube. Additional panels were then heat-sealed in place
to form ends. All seams were covered with 2 in wide mylar tape for additional strength and to insure the
chamber was leak-free. The resulting reactors were ~8 feet high x ~8 feet wide x ~12 feet long. The
reactors were placed in a housing containing the blacklights as shown in Figure 1. The housing was
fabricate from panels 50 inches wide and 96 inches high. As shown in figure 2. Each panel consisted of
a frame welded from 3/4-inch square mild steel box tubing. Styrofoam sheets (3/4 inch thick) 10 wide
were set inside each length of the frame, two inches from the edge. Fiberboard sheets (1/8 inch thick and
12 inches wide) were glued over the Styrofoam and riveted to the outside of the frame leaving a 1 1/4
3

25 ft
8ft
8ft
Figure 1. Chamber housing containing interior blacklights.
Panel InsideBlacklight
Everbright
Steel Frame
Figure 2. Inside and outside of panels containing fluorescent blacklights.
Panel Outside
Ballasts
Fiberboard
FiberboardCoveredFoam
50 in
96 in
4

inch gap for wiring the lights. The panels along each length of the housing were equipped with sixteen
40 watt fluorescent blacklights. 4 x 8 foot fiberboard sheets were then glued to the other side of the
Styrofoam (the "inside" of the panel) and overlayed with a 4x8 foot Everbright aluminum sheet. The eight
ballasts for each panel were attached on the outside, near the bottom. The panels were bolted to a base
frame consisting of2 x 2 inch steel angle supported eight inches above the floor by cinder blocks. At the
top, panels were held together by bolting to the base of an "L" bracket located between the panels. For
rigidity, two by four wood beams were placed across the housing with at the top and bolted to the angle
bracket used to hold panels together. Everbright sheets were laid on the floor and attached to the 2x4
beams. The lights were wired so that they could be lit by quadrants. Within each quadrant, all or
alternating pair of two bulbs could be turned on.
On the bottom of each side of each chamber 2.5 inch diameter Teflon bulkhead fittings were
installed. On one side these were used for filling the chamber with purified air or exhaust and injecting
surrogate hydrocarbons. On the other side one port was used for the ozone and NOx analyzer and the other
for obtaining syringe samples for GC analysis. On the fill side an additional 2 inch diameter PCV gate
valve was installed into each chamber installing the RH sensor and for collecting aerosol samples using
an adaptor to a 47mm open face filter holder. Four-inch diameter PVC gate valves were installed between
both chambers on each side near the bottom. A four-inch muffin fan was installed on each gate valve and
positioned so that the flows were in opposite directions. These four-inch gate valves were used to mix the
chambers from side to side.
The two Teflon bag reactors in the chamber are designated the "east" side and the "west" side in
the subsequent discussion. This reflects the fact that the long axis of the chamber has an east-west
orientation.
Instrumentation
Temperature and humidity were be monitored continuously on each side. Nitrogen oxides were
measured by a chemilumenescent analyzer (Thermoenvironmental model 42) and ozone by a photometric
analyzer (Dasibi model 1003AH). These instruments used a three-way Teflon solenoid valve to sample
for 5 minutes on each side. Data were recorded as one-minute averages for the final three minutes after
switching. A Campbell CR10 data logger was used to collect all of the above data as one minute averages.
Two gas chromatographs using flame ionization detection were used to determine the concentration
of volatile organic hydrocarbons (VOC) during the course of the experiment. One was set up with a
packed column for light hydrocarbons (C1-C4) and the other used a capillary column to provide speciation
of all VOG greater than C4. Each was be equipped with gas sampling valves; samples were injected via
100 ml all glass syringes. Analyses were performed every 45 minutes. Peroxyacetyl nitrate (PAN) was
measured every 15 minutes using a gas chromatograph with an electron capture detector. Formaldehyde
5

was monitored continuously with an automated wet chemical analyzer based on fluorescence detection of
a dye formed with reagents (Carter et al, 1995b,c).
Particulate samples were be collected at the end of each run using a lightweight 47 mm diameter
Teflon membrane filter (Gelman Teflo) operated at a nominal flow rate of 150 L/min. Sampling 10 m3
of air from the chamber allowed a precision of approximately ± 1 µg/m3. Since both the primary and
secondary particulate matter are expected to be less than 10 µm aerodynamic diameter (or even less than
the proposed 2.5 µm standard) no size selective inlet was necessary. Filters were weighed before and after
collection with a microbalance to the nearest microgram at a temperature and humidity similar to those
in the chamber.
Complete number and size distribution measurements for each side of the chamber were obtained
in 60 second intervals using TSI model 3071 cylindrical scanning electrical mobility spectrometers
(SEMS). Each SEMS was equipped with a TSI model 3760 condensation nucleus counter (CNC) to count
transmitted particles. Voltages were ramped from 40 to 8500 volts over a one minute period. The
cylindrical SEMS were operated with sheath and excess flows of 2.5 LPM and inlet and classified aerosol
flows of 0.25 LPM allowing for measurement of particle size distributions in the range of 28 - 850 nm.
Particle losses in the SEMS, SEMS response functions, particle charging efficiencies, and CNC counting
efficiency have been accounted for in the analysis of the aerosol data. In principle, particle wall loss to
the chamber can be accounted for as well, though this turned out not to be the case with most of the data
obtained for this program, for reasons discussed later. A more complete discussion of this system and its
associated data analysis methods is given elsewhere (ref?). This aerosol analysis system is referred to as
the Differential Mobility Analyzer (DMA) in the subsequent discussion.
Dynamometer Operations and Vehicles Employed
A Burke E. Porter Model 3900-3595 2WD Chassis Dynamometer with a Pierburg FLG-2000
driver’s aid and a Pierburg Positive Displacement Pump - Constant Volume Sampler (PDP-CVS) and a
Pierburg AMA-2000 Exhaust Emissions Measuring System was used for all vehicles. An adapter was
fitted to the exhaust pipe in the shape of a ’T’. Sample was directed to the chamber from the side outlet
of the ’T’ through a heated sample line. A variable restrictor plate was installed on the other end of the
T. All vehicles were operated at 40 mph. For each vehicle the restrictor plate was adjusted at this speed
so that the flow rate into the chamber was xx L/min. The heated transfer line to the chamber was
constructed of 4 m of 5/8 inch diameter stainless steel tube wrapped with heating tape and cover with 1/8
inch thick fiberglass tape. The temperature of the tubing was adjusted to 180-190° C by a variable
transformer. A Thermo Systems model 3012 charge neutralizer was installed on the inlet line 50 cm from
the entrance to the chamber.
6

The vehicles used in this study were as follows. All vehicles were precondtioned by driving over
the LA-4 cycle or CFR equivalent, prior to testing.
Gasoline: 1994 Chevrolet Suburban C1500 two-wheel drive with a 5.7 liter engine. This vehiclehad 58,000 miles and was part of the UC Riverside Fleet. It was preconditioned by two sequencesof fuel drain and fill with RFG (to 40% tank capacity).
Spark Ignition CNG: 1991 Ford Ranger pickup with dedicated CNG retrofit. This vehicle had17,800 miles and was part of the UC Riverside Fleet.
Compression Ignition Diesel: 1996 Dodge Ram pickup with 5.9 liter DI diesel. This vehicle had11,900 miles and was owned by a private party.
all vehicles were allowed to equilibrate to room temperature for 24 hours prior to use. For the cold start,
the vehicles were started on the dynamometer and immediately brought to 40 mph with a load simulating
that required for the vehicle to operate at this speed on a roadway. The sampling inlet was then attached
and flow directed into the chamber through the heated transfer line. The length of time the exhaust was
directed into the chamber was adjusted to yield the desired approximate amount of exhaust injection. Once
the injection was completed, the vehicle was allowed to warm up five minutes at which time exhaust was
injected into the other side.
Experimental Procedures
The original strategy was to use our dividable chamber with exhaust from NG injected into one
side and exhaust from traditional fuel (TF) diesel in the other. It turned out that this was not possible
logistically due to the amount time required to remove and install vehicles on the dynamometer. We
instead conducted dual-mode chamber runs in which exhaust from a cold start was injected into one side
and then allowed the vehicle to warm up and injected exhaust from this stabilized mode. For both
injections we continuously measures CO, CO2, NOx and total non-methane hydrocarbons using the
Pierburg gas analyzer system.
Prior to isolation of the chamber sides, the chambers were purged with clean, filtered, humidified
air. The air was purified using an Aadco model 737 Pure Air Generator, and was humidified by splitting
the stream and passing a portion through a thermostated bubbler filled with deionized water followed by
recombining the air flows. Equal amounts of a propene was then injected into each side and allowed to
mix. After closing the valves between the sides, equal volumes of exhaust (cold start and hot stabilized)
were then added to both sides of the chamber. NOx was then injected if needed to raise the NOx to the
concentration required to achieve the desired level of ozone formation from the propene - NOx system.
The chamber remained in the dark until all components were mixed. The background concentrations were
then determined and the light source was turned on to photochemically react until the ozone concentration
peaked.
7

RESULTS AND DISCUSSION
The experiments carried out for this program are summarized on Table 1, and measured
concentration-time plots for ozone, NO, NO2, propene (where applicable), and DMA PM measurements
are shown in various figures which are discussed below. The experiments can be classified as characteriza-
tion experiments to measure light intensity and evaluate major known chamber effects, control experiments
to measure PM formation in the absence of added exhausts, and experiments to determine PM formation
from various types of exhausts. The results of these various types of experiments are summarized below.
Characterization Experiments
Light Characterization
Immediately after the chamber was constructed, the light intensity was measured by carrying out
NO2 actinometry experiments using the quartz tube method of Zafonte et al (1977), modified as discussed
by Carter et al (1995b). These measurements were made prior to placing the Teflon reactors in the
chamber, so they do not take into account the effects of the light passing through the Teflon reactor walls.
However, experiments with other Teflon chambers indicate that the effect of the walls is probably not
much greater than 10%, at least when the Teflon is new. In all experiments, the tube was oriented parallel
to the ground and perpendicular to and centered on the long axis of the chamber. Measurements were
made with the tube oriented near the top, middle, and bottom of the chamber enclosure, in the middle of
where the east and west side reaction bags were to be located, and in the middle of the enclosure between
the reaction bags.
The results are summarized on Table 2. It is seen that good light uniformity is obtained, at least
along the long axis of the chamber. The light intensity may be slightly lower at the bottom of the
enclosure compared to the middle and top, but the difference is less than ~5%, which is comparable to
the precision of the measurement.
The average of all the NO2 photolysis rate measurements is 0.83±0.04 min-1. This is somewhat
higher than ambient conditions; for example, using the actinic fluxes given by Peterson (1976) for his
"best estimate" surface albedos and the NO2 absorption cross sections recommended by IUPAC (Atkinson
et al, 1997), we calculate the NO2 photolysis rate is 0.53 min-1 for direct overhead sun. However, it was
decided that for the purpose of this program it was useful to have a somewhat higher light intensity to
enhance photochemical reaction times. Shorter reactions times is useful for this study because it reduces
the times that the particles are exposed to the walls, thus somewhat reduces wall losses.
8

Run RH Run Side Exhaust Other Reactants Max article Mass (ug/m3)No. Description (%) time Injection (ppm) O3 PM DMA
(hrs) Sec Mode NOx Propene (ppm) Final Max
NO2 actinomerty [a]
1 Ozone Decay [b] 35 - - -
2 Pure Air Irriadiation 10 15 E 0.11 - - -W 0.11 - - -
Mixing tests (see text) - - -
3 Surrogate - NOx [c] ~0 5 E 0.20 0.04 0.78 - - -5 W 0.21 0.04 0.80 - - -
4 Propene + gasoline exhau 10 4.5 E 30 hot 0.15 0.54 0.70 44 - -4.5 W 30 cold 0.84 0.58 1.61 21 35 47
5 Propene - NOx 25 4 E 0.18 0.55 0.84 1 2 24 W 0.19 0.57 0.83 4 1 1
6 Propene + gasoline exhau 15 5 E 10 cold 0.35 0.43 1.01 10 4 25+5 W 120 hot 0.20 0.54 0.78 10 9 10
7 Propene + CNG exhaust 10 4 E 120 cold 0.82 0.56 0.07 4 1 1+4 W 120 hot 0.94 0.53 0.03 5* 1 1
8 Propene + CNG exhaust 10 3.5 E 20 hot 0.20 0.64 0.79 8 3 33.5 W 20 cold 0.20 1.38 0.72 3 2 2
9 Pure air irriadiation 10 2.8 E 0.06 - 1 22.8 W 0.06 - 1 2
10 Propene - NOx Irradiation 15 6 E 0.21 0.61 0.74 156 W ND 0.57 0.65 7* - -
11 Propene + Diesel exhaust 10 3.7 E 10 cold 0.14 0.74 0.59 20 1 23.7 W 10 hot 0.11 0.66 0.46 3 2 2
12 n-Butane - NOx [d] ~0 4 E 0.28 0.05 0.12 - - -4 W 0.30 0.05 0.08 - - -
- No data taken or missing data.* Hole found in filter during reweighing+ Apparently anomalous "spike" in the data not used when deriving the maximum (see Figure)[a] Quartz tube method used in various positions in the chamber. Average NO2 photolysis rate was [b] Initial ozone = 0.8 ppm east side, 1.1 ppm west side. O3 decay rates: east = 0.13 %/hr, west = 0.1[c]
[d] Initial n-Butane = 5.4 ppm, both sides.
Table 1. Summary of conditions and selected results for the experiments carried out for this program.
Surrogate mixture of n-butane, n-octane, ethene, propene, trans-2-butene, toluene, and m-xylene injected to simulate ambient VOCs. Total surrogate concentration = 4.0 ppmC.
9

East Middle West
Top 0.83 0.83
Middle 0.82 0.82 0.84*
Bottom 0.80 0.79
* Average of two points: 0.85 and 0.82 min-1
0.0
0.5
1.0
1.5
2.0
300 350 400 450 500 550 600
Wavelength (nm)
Inte
nsity
(w
/m2 )
Recommended for Modeling(adjusted to give same area)
This work
Table 2. Results of the NO2 actinometry experiments. NO2 photolysis rates are in units of min-1.
Figure 3. Measured spectral distribution of the chamber, compared to standard blacklight spectrum recommended for modeling. (Standard spectrum adjusted to give the same area under the curve from 300-600 nm.)
10

The spectrum of the light in the chamber was taken using a LiCor LI1800 portable spectra-
radiometer, and the results are shown in Figure 3. Also shown is the spectrum recommended by Carter
et al (1995b) for use when modeling data for all chamber experiments with blacklight light sources, which
is derived from various measurements from other chambers using such lights. The spectra can be seen to
be essentially the same, especially after taking into account the fact that the instrument used to measure
the spectrum in this work had lower resolution than those used to derive the recommended spectrum
(Carter et al, 1995b).
Ozone Conditioning
An ozone conditioning experiment was carried out immediately after the reaction bags were
installed. Approximately 1 ppm of ozone was added to each of the chambers that were previously filled
with purified air, the lights were then turned on, and the ozone was monitored for somewhat over 35
hours. Figure 4 shows the ozone concentrations for each chamber during this period, and also shows plots
of ln([O3]initial/[O3]) during this period. The latter quantities should increase linearly if ozone loss is a first
order process during this period, and this is indeed what was observed. As shown on Figure 5, the loss
rates were 0.13 and 0.18 %/hour for the east and west sides, respectively. This can be compared with O3
dark decay rates in the range of 0.5-1 %/hour typically seen in our 2000-5000 liter chambers. The lower
decay rate in this experiment could be due to wall loss being offset by production by photolysis, or to the
lower surface/volume ratio of this larger chamber. In any case, the results indicate that ozone decay due
to background or wall effects should be negligible during typical irradiation experiments.
Mixing Time Determination
An experiment was carried out to determine times for mixing after compounds are injected into
the chamber and times for mixing compounds from one reactor to another. This was a concern in this
chamber because there were no mixing fans inside the individual reactors, only fans for forcing air from
one reactor to the other. To assess this, approximately 0.5 ppm of NO was injected into the west side of
the chamber and monitored with the mixing fans off until the concentration stabilized. The concentrations
of NOx in the reactor stabilized after about 20 minutes. Then the gate valves between the chambers was
opened and the mixing fans forcing the air from one side to the other were turned on. The half life for
mixing was approximately 1.3 hours, with mixing essentially complete in about two hours. The NOx
concentration-time data during the mixing experiment is shown on Figure 5. These mixing times were
taken into account when carrying out the experiments for this program.
Pure Air Irradiations
To assess background effects, two pure air irradiations were carried out during this program, one
(Run 2) when the reactors were newly installed and the second (Run 9) after experiments with both
gasoline and CNG exhaust were carried out. NO and NO2 were below levels which could be reliably
11

0.0
0.2
0.4
0.6
0.8
1.0
1.2
0 300 600 900 1200 1500 1800 2100
Time (min)
Con
cent
ratio
n (p
pm)
East O3
West O3
0.0
0.0
0.0
0.0
0.0
0.1
0.1
0.1
0 300 600 900 1200 1500 1800 2100
Time (min)ln
([O
3]in
itial
/[O3]
)
East
West
Slope= 0.13%/hr
Slope= 0.18%/hr
Figure 4. 3Plots of ozone and ln([O3]initial/[O3]) vs time for the ozone conditioning experiment.
Figure 5. x
0
100
200
300
400
500
600
700
800
900
1000
11:00 12:00 13:00 14:00 15:00
Time of day
NO
x (p
pb)
NOx, East Chamber
NOx, West Chamber
Added 12 ml of NO to thewest chamber at 11:05 hours
Opened gate valves between chambers andturned on mixing fans at 12:16
Concentration - time plots for NOx during the mixing time determination experiment.
12

monitored in both experiments, but measurable ozone formation was observed to occur. The ozone data
obtained are shown on Figure 6, and the final concentrations are given on Table 1. In the first experiment,
which was run for over 15 hours, 48 ppb of O3 was formed after three hours, but the rate of O3 formation
leveled off after about 5 hours, and the final O3 was only ~110 ppb. In the second experiment, 57 ppb was
formed after three hours, only ~20% more than in the first experiment after the same amount of time.
Therefore, the exhaust exposure only slightly increased the levels of background ozone precursors in the
chamber.
These runs were simulated in model calculations to assess whether the methods used to represent
background effects in our smaller (~2000-6000-liter) Teflon bag chambers could successfully represent
the background effects in this chamber. The chamber effects model we use when simulating chamber
experiments are discussed in detail elsewhere (Carter et al, 1995a,b, 1997). Simulations of pure air
experiments are sensitive to a number of background effects, but the most important are the NOx offgasing
rates and the initial NOx levels in the background air. The standard teflon chamber model developed to
fit data on our other chambers uses NOx offgasing rates on the order of 0.015 - 0.02 ppb/min and
background initial NOx levels of 2 ppb or less. This model significantly overprediced O3 formation in these
experiments; the data could only be fit if the NOx offgasing rate was assumed to be ~7 times lower, or
0.0025 ppb/min. Figure 6 shows results of two model simulations using this lower NOx offgasing rate, one
assuming initial NOx of 1 ppb the other assuming initial NOx is 2 ppb. These tend to bracket the results
of the two experiments, though they do not perfectly fit the shape of the O3 formation curve in the longer
duration Run 2. However, these data indicate that the larger chamber has lower background NOx offgasing
rates than the smaller chambers we usually employ.
Particle measurements were also made during these experiments. These data will be discussed
below, in conjunction with the results of the other control experiments where particle data were taken.
N-Butane - NOx Experiment
Another important chamber background effect is the "chamber radical source", which is manifested
by the fact that model calculations cannot simulate results of many types of chamber experiments unless
some sort of chamber-dependent, light-induced continuous radical source is assumed (Carter et al, 1982,
1995b). N-butane - NOx experiments are probably the most useful and sensitive experiment to measure
this effect, and are therefore routinely carried out in our laboratory for this purpose (Carter et al, 1995a-b,
1997). If there were no chamber radical source, essentially no NO oxidation or O3 formation would occur
in these experiments, and any NO oxidation and O3 formation that does occur is primarily a result of this
effect. Therefore, an n-butane - NOx run (Run 12) was carried out in this chamber near the end of this
study. The concentration-time plots for O3, NO, NO2, and propene (added in small amounts so its rate of
consumption can serve as a measure of radical levels) measured during this experiment are shown on
Figure 7.
13

Run 2
Run 9
0.00
0.02
0.04
0.06
0.08
0.10
0.12
0.14
0 100 200 300 400 500 600 700 800 900
Time (min)
Con
cent
ratio
n (p
pm)
East O3
West O3
Model 1
Model 2
Figure 6. Experimental and calculated concentration - time plots for ozone during the pure air irriadiation experiments. Model 1 assumed initial NOx levels were 1 ppb, while Model 2 assumed intial NOx was 2 ppb.
0.00
0.01
0.02
0.03
0.04
0.05
0.06
0 60 120 180
Time (min)
Con
cent
ratio
n (p
pm)
East O3
West O3
Model 1
Model 2
14

Run 12
0.00
0.02
0.04
0.06
0.08
0.10
0.12
0 60 120 180 240
Time (min)
Con
cent
ratio
n (p
pm)
East O3
West O3
Model
0.00
0.05
0.10
0.15
0.20
0.25
0 60 120 180 240
Time (min)
Con
cent
ratio
n (p
pm)
East NO East "NO2"West NO West "NO2"Model
0.03
0.04
0.05
0 60 120 180 240
Time (min)
Con
cent
ratio
n (p
pm)
East Propene
West Propene
Model
Figure 7. Experimental and calculated concentration - time plots for selected species for the n-butane - NOx experiment.
15

Figure 7 shows that non-negligible NO oxidation and O3 formation is occurring, indicating that,
as expected, there is a chamber radical source in this chamber. Since this radical source is believed to be
light dependent, it is measured by the parameter "RS/k1", the OH radical input rate divided by the NO2
photolysis rate. The chamber radical source strength which best fits the n-butane - NOx data in our smaller
chambers varies, but typically correspond to an RS/k1 ~0.1 ppb, which would give a radical input rate of
0.07 ppb/min in this chamber. However, assuming this radical input rate results in the model significantly
overpredicting the NO oxidation and O3 formation rates in this experiment. The data are better fit by
assuming a radical input rate of 0.025 ppb/min, which corresponds to RS/k1≈0.03 ppb, three times lower
than the value which typically fits data in our smaller chambers. Such a low radical input rate is rarely
observed in the smaller chambers, though it is not entirely outside the range of variability. Results of
model simulations of this experiment using this lower radical source rate are shown on Figure 7.
It has been proposed that the radical source and NOx offgasing effects are manifestations of the
same process, which can be represented in the model by the emissions of nitrous acid (HONO) from the
walls. Since HONO photolyzes rapidly to form OH radicals and NO, its input serves as both a radical and
NOx source. This predicts that the radical source and the NOx input rates should be the same, and is
supported by data from our ~2000-6000-liter Teflon chambers, where this is often the case (Carter et al,
1995a-c, 1997). However, in this chamber the results of the n-butane - NOx and pure air irradiations in
this chamber suggest that the radical source rate is approximately an order of magnitude higher then the
NOx input rate, indicating that, at least in this chamber, much of the apparent radical source is caused by
some process not involving simultaneous NOx production.
Surrogate - NOx Conditioning and Control Experiment
Before any experimental runs involving particle measurements were conducted, a irradiation of
NOx and mixture of compounds designed to be a simplified "surrogate" of ROGs present in ambient air
was carried out. The purpose of this run was to condition the chamber to the compounds present in
environmental chambers, to serve as a control with which to compare similar experiments in other
chamber, and to evaluate the equivalency of results in the two reactors in experiments with an
atmospherically realistic mixture. The ROG surrogate consisted of n-butane, n-octane, ethene, propene,
trans-2-butene, toluene, and m-xylene, in relative amounts designed to represent relative amounts of similar
compounds measured in various urban atmospheres (Carter et al, 1995c). The initial ROG levels were ~4
ppmC, which is reasonably representative of the levels that can be present in highly polluted urban
atmospheres, and the NOx levels were determined so that most of the ozone formation would occur before
the run was completed.
Selected results of that experiment are shown in Figure 8. Very high levels of ozone compared
to ambient (~0.8 ppm) were formed, in part because of the relatively high light intensity, with most of
16

Run 3
0.0
0.1
0.2
0.3
0.4
0.5
0.6
0.7
0.8
0.9
0 60 120 180 240
Time (min)
Con
cent
ratio
n (p
pm)
East O3
West O3
Model
0.00
0.05
0.10
0.15
0.20
0.25
0 60 120 180 240
Time (min)
Con
cent
ratio
n (p
pm)
East NO East "NO2"
West NO West "NO2"Model
Figure 8. Experimental and calculated concentration - time plots for monitored species for the surrogate - NOx conditioning and control experiment.
0.00
0.05
0.10
0.15
0.20
0.25
0.30
0.35
0 60 120 180 240
Time (min)
Con
cent
ratio
n (p
pm)
East n-Butane West n-ButaneWest n-Octane West n-OctaneModel
0.00
0.01
0.02
0.03
0.04
0.05
0.06
0 60 120 180 240
Time (min)
Con
cent
ratio
n (p
pm)
East Ethene
West Ethene
Model
0.00
0.02
0.04
0.06
0.08
0.10
0.12
0 60 120 180 240
Time (min)
Con
cent
ratio
n (p
pm)
East m-XyleneWest m-XyleneEast TolueneWest TolueneModel
0.00
0.01
0.02
0.03
0.04
0.05
0 60 120 180 240
Time (min)
Con
cent
ratio
n (p
pm)
East t-2-ButeneWest t-2-ButeneEast PropeneWest PropeneModel
17

the ozone formation occurring within the first two hours of the experiment. The results were essentially
the same on both sides, except that the final "NO2" measurements (which actually measures NO2 + nitric
acid, PAN and various other organic nitrates [Winer et al, 1974]) was somewhat lower on the east side.
In addition, the n-butane consumption rate, which is influenced to a large extent by dilution because it
reacts fairly slowly compared to the other reactants, was somewhat faster on the east side. As discussed
by Carter et al (1995b), the dilution rate in these chamber runs can be derived from relative rates of
consumption of relatively slowly reacting compounds (such as n-butane) with relatively rapidly reacting
ones (such as m-xylene) that react only with OH radicals, if their OH radical rate constants are known.
Based on this analysis, we derive that dilution on the west side is negligible, but that dilution on the east
side is ~1 %/hour. This slight dilution of the east reactor is consistent with the higher "NO2" levels on that
side, though the dilution is probably not enough to explain all the difference in the NO2 data.
Also shown on Figure 8 are results of a model simulation of this experiment, using the chamber
parameters which best fit the characterization runs discussed above, and assuming no dilution in the
chamber. The model gives reasonably good simulations of the data in a qualitative sense, though it
underpredicts the final O3 levels by about 35%. (The difference between the experimental and calculated
NO2 is due to the fact that the model simulation shows NO2 alone, while the measurement has the
interferences from the other species, as indicated above.) Note that the n-butane data, which reflects
primarily dilution, agrees with the model prediction for the west side, but the consumption rate is
underpredicted for the east side since the model assumes no dilution. The ability of the model to simulate
the consumption rates of the more reactive organic compounds is an indicator of how well it predicts OH
radical levels, since that is a major mode of reaction for most of these compounds. This model
performance is similar to what is observed in simulations of surrogate - NOx runs in our other chambers,
though generally the O3 yields are somewhat better simulated (see, for example, Carter et al, 1995c, 1997).
The discrepancy may be due to incomplete characterization of chamber conditions, inaccuracies in
measured initial reactant concentrations, or failure of the mechanism used to simulate the effect of this
relatively high light intensity (which is twice that in most of the experiments used when developing the
mechanism [Carter and Lurmann, 1991; Carter et al, 1995b, 1997]).
In any case, the results of this surrogate - NOx conditioning and control run are sufficiently close
to what was expected that they indicate no anomalous effects in this chamber which might compromise
its utility for use in this program.
Particle Measurement Experiments
The protocol for the PM measurement experiments was changed somewhat from that originally
proposed. In the first place, as discussed above, it was determined not to be feasible to carry out
experiments using different vehicles on the same day, because of the amount of time it takes to prepare
a vehicle for testing. Instead, the procedure was modified to test only a single vehicle in a given
18

experiment, using cold start exhaust added to one side of the chamber, and hot start exhaust added to the
other. Although this procedure did not allow for direct comparison of different vehicles in the same
experiment, it did allow for direct comparison of data from exhaust produced from different modes of the
same vehicle’s operation.
Another change was made to the experimental protocol relative to that proposed because of the
availability of the Differential Mobility Analyzers (DMA) for use in this program. This instrument
continuously measures the particle size and volume distributions, which can be used to determine wall
losses during the experiment. This was considered to be preferable to determining wall losses in the dark
in prior to irradiation, or in separate experiments. Because of this, we did not feel that separate particle
loss experiments were necessary, which allowed additional exhaust runs to be carried out, in part
compensating for the inability to carry out runs with two vehicles at once. Unfortunately, once the data
were obtained it was found that there was too much apparent self-nucleation occurring in most of these
experiments for these estimates to give valid results. This was indicated by negative total particle and
calculated total particle concentrations less than the actual maximum observed particle concentrations
frequently being derived. For that reason, calculated particle growth estimates are not reported, and no
corrections for wall losses could be made. Nevertheless, it was felt that use of this instrument allowed
more accurate measurements of the particulate mass concentrations than filter sampling, though filter
sampling mass still done as a backup.
Many exhausts, especially from "cleaner" vehicles or vehicles with low reactivity fuels such as
CNG will not, by themselves, promote significant ozone formation in chamber experiments because of the
relatively high NOx to ROG ratios (after adjusting for ROG reactivity where applicable). Because ozone,
or the species formed along with ozone, may be involved in some particle formation, it was felt that
conditions promoting ozone formation was important in experiments measuring particle growth. For that
reason, in all the particle measurement experiments propene was added as a simple ambient ROG
surrogate to provide the reactivity necessary to form ozone in experiments with low reactivity or high NOx
exhausts. Propene was preferred over more complex ROG surrogates since it is known not to be a
significant precursor to particle formation in environmental chamber systems(ref?).
The particle mass data from the various experiments in this program are summarized on Table 1,
and concentration-time data from the DMA instrument are shown in various figures for the runs where
such data are available. The column labeled "PM" on Table 1 is the final particle mass derived by filtering
the air at the end of the experiment and weighing the filter, and the columns labeled "DMA Final" and
"DMA max" represent the average final and the maximum particle mass determined by the DMA. The
"DMA final" values are therefore presumably comparable to the "PM" data, provided that the specific
gravity of the aerosol is not greatly different from 1.0 as assumed with the DMA calculations. The figures
with the DMA results show plots of particle number and concentration as a function of time after the start
19

of the experiment (i.e., after the lights are turned on. The "Number" data are the number concentrations
in particles/m3, and the "Concentration" data are the particulate concentrations (in µg/m3) calculated from
the DMA assuming unit density and spherical shape.
Pure Air Experiments
Particle measurements were made using the DMA during the latter part of the second of the pure
air experiments (Run 9) to determine background particle formation in the absence of added gas-phase
reactants. The DMA data taken during this experiment are shown on Figure 9. Note that instrument
problems prevented data from being obtained prior to 115 minutes after the irradiation started. The number
concentration was dropping due to particle losses to the walls while the particulate concentration is low
(1.5 µg/m3) and stable. Similar results were obtained on both sides, though the west side has slightly lower
particle numbers. The total mass formed in this experiment, as derived from the DMA data, is low. No
filter data were available for any of the pure air experiments.
Propene - NOx Control Experiments
Because propene and NOx were present in all the added exhaust runs, two propene - NOx runs
were carried out with particle analysis for control purposes. The gas-phase results of these experiments
are shown on Figure 10, the DMA data for the first experiment are shown on Figure 11, and the particle
mass measurement data are summarized on Table 1. DMA data are not available for the second propene
- NOx run.
Figure 10 shows that the O3 and NOx results are qualitatively similar to those for the surrogate
run shown on Figure 7, with about the same levels of O3 being formed, and most of the O3 occurring in
the first two hours of the experiments. The results are also qualitatively consistent with model predictions,
as also shown on Figure 9. Good side equivalency was observed in Run 5, though again the final "NO2"
levels were lower on the east side. On the other hand, in Run 10 the west side had slightly lower final O3
levels, though the final NO2 levels in both sides were in good agreement. The propene consumption rates
were essentially the same in both sides in both experiments.
The first propene control experiment (Run 5) was carried out following a single added exhaust
run. The particle mass in that run, as determined both by weighing the filters and by DMA, was very low,
being in the 1 and 4 µg/m3 range. The second propene control experiment was carried out after three more
added exhaust runs. In that run, a higher particle mass (7-15 µg/m3) was determined by the filter weighing
method, though useable DMA data were not available.
Figure 11 shows the DMA measurements first propene run (Run 5) where such data are available.
The large rise in the number is due to self-nucleation, which was unexpected since propene is not known
to form aerosols when photooxidized. Note that this increase in number density is occurring around the
20

Run 9
East Side
0.0
0.5
1.0
1.5
2.0
0 60 120 180 240
Time (min)
Con
cent
ratio
n (u
g/m
3 )
0
10,000
20,000
30,000
40,000
Num
ber (
cm-3
)
Conc.
Number
West Side
0.0
0.5
1.0
1.5
2.0
0 60 120 180 240
Time (min)
Con
cent
ratio
n (u
g/m
3 )
0
10,000
20,000
30,000
40,000
Num
ber (
cm-3
)
Figure 9. DMA particulate measurements during the second pure air irradiation experiment.
21

Run 5 Run 10
0.0
0.1
0.2
0.3
0.4
0.5
0.6
0.7
0.8
0.9
0 60 120 180 240
Time (min)
Con
cent
ratio
n (p
pm)
East O3
West O3
Model
0.00
0.05
0.10
0.15
0.20
0.25
0 60 120 180 240
Time (min)
Con
cent
ratio
n (p
pm)
East NO East "NO2"West NO West "NO2"
Model
0.00
0.10
0.20
0.30
0.40
0.50
0.60
0 60 120 180 240
Time (min)
Con
cent
ratio
n (p
pm)
East Propene
West Propene
Model
0.0
0.1
0.2
0.3
0.4
0.5
0.6
0.7
0.8
0 60 120 180 240
Time (min)
Con
cent
ratio
n (p
pm)
East O3
West O3
Model
Only west side wassampled for mostof the experiment.
0.00
0.05
0.10
0.15
0.20
0 60 120 180 240
Time (min)
Con
cent
ratio
n (p
pm)
East NO East "NO2"West NO West "NO2"Model
Only west side wassampled for most of
the experiment.
0.00
0.10
0.20
0.30
0.40
0.50
0.60
0 60 120 180 240
Time (min)
Con
cent
ratio
n (p
pm)
East Propene
West Propene
Model
Figure 10. Experimental and calculated concentration - time plots for selected species for the propene - NOx control experiments.
22

Run 5
East Side
0.0
0.5
1.0
1.5
2.0
2.5
0 60 120 180 240 300 360
Time (min)
Con
cent
ratio
n (u
g/m
3 )
0
10,000
20,000
30,000
40,000
50,000
Num
ber (
cm-3
)
Conc.
Number
West Side
0.0
0.5
1.0
1.5
2.0
2.5
0 60 120 180 240 300 360
Time (min)
Con
cent
ratio
n (u
g/m
3 )
0
10,000
20,000
30,000
40,000
50,000
Num
ber (
cm-3
)
Figure 11. DMA particulate measurements during the first propene - NOx irriadiation.
23

time that NO is consumed, during the period of the most rapid ozone formation. One possible source of
this self-nucleation may be trace impurities passing through the air purification system, such as terpenes
from nearby citrus groves, which may form particles when they react with ozone. These particles then
rapidly are lost to the walls, since coagulation is unimportant at this concentration. Nevertheless, a non-
negligible amount of mass was also formed. The results were similar on both sides, though the DMA
numbers and volumes were slightly lower on the west side, as was observed in the pure air runs.
Gasoline Exhaust Experiments
Two experiments with gasoline exhaust were carried out (Runs 4 and 6), both with cold start
exhaust on one side and hot start exhaust on the other. In the first experiment, the same amount of exhaust
was added to each side. Selected gas phase data for these experiments are shown on Figure 12, the DMA
particulate data are shown on Figure 13, and the particle mass data are summarized in Table 1. As
expected, the cold start produced a higher final ozone concentration due to the higher VOC levels. Ozone
formation on the hot start (east) side was comparable to that observed in the propene - NOx control runs.
In the second gasoline exhaust run higher ozone concentration were again observed with the cold start
injection despite it being only ten seconds compared with 2 minutes for the hot stabilized mode. No
attempt was made to model the gas phase reactions in these and the other added exhaust experiments
because a complete speciated analysis of the gasoline VOCs was not carried out.
Both the DMA and the filter data indicate higher particle masses in the gasoline experiments than
the control runs, though the DMA did not provide useful data for the east (hot) side of Run 4 because of
a sampling problem. As shown on Figure 13, we again see nucleation occurring after ozone formation,
despite the fact that detailed hydrocarbon speciation did not show a significant level of hydrocarbons that
would be expected to show such behavior. While the number of particles formed was similar to the
propene/NOx control run shown on Figure 11, the amount of particulate mass formed was five time
higher. More particle mass and numbers were observed in the cold start side in Run 4 than observed in
either side of Run 6, presumably because of the larger amount of exhaust injected and/or the higher O3
levels formed. The filter data for Run 6 and the filter and east-side DMA data also indicated significant
particle mass formation, though the absolute amounts tended to be somewhat different from those indicated
by the DMA data.
CNG Exhaust Experiments
Two experiments with CNG exhaust were carried out (Runs 7 and 8), using similar procedures
as employed for the gasoline runs. The gas phase data are plotted in Figure 14, the DMA data are shown
on Figure 15, and particle mass measurements are summarized on Table 1. In the first experiment the
exhaust injection was too long (two minutes), resulting in very initial NO levels which suppressed ozone
formation. More O3 formation and faster NO oxidation occurred on the cold start side, indicating higher
ROG levels as well as slightly lower initial NO. Much shorter exhaust injection times were employed
24
Run 4 Run 6
0.0
0.2
0.4
0.6
0.8
1.0
1.2
1.4
1.6
1.8
0 60 120 180 240
Time (min)
Con
cent
ratio
n (p
pm)
East O3 (Hot)
West O3 (Cold)
0.0
0.2
0.4
0.6
0.8
1.0
0 60 120 180 240
Time (min)
Con
cent
ratio
n (p
pm)
East NO East "NO2"
West NO West "NO2"
Apparent instrument problems after hours into run. Data rejected.
0.00
0.10
0.20
0.30
0.40
0.50
0.60
0 60 120 180 240
Time (min)
Con
cent
ratio
n (p
pm)
East Propene
West Propene
0.0
0.2
0.4
0.6
0.8
1.0
1.2
0 60 120 180 240
Time (min)
Con
cent
ratio
n (p
pm)
East O3 (Cold)
West O3 (Hot)
0.00
0.05
0.10
0.15
0.20
0.25
0.30
0.35
0.40
0 60 120 180 240
Time (min)
Con
cent
ratio
n (p
pm)
East NO East "NO2"
West NO West "NO2"
0.00
0.05
0.10
0.15
0.20
0.25
0.30
0.35
0.40
0.45
0.50
0 60 120 180 240
Time (min)
Con
cent
ratio
n (p
pm)
East Propene
West Propene
Figure 12. Experimental concentration - time plots for selected species for the propylene + gasoline exhaust experiments.
25

Run 4 Run 6
East side (Hot Start)
(no valid data)
East Side (Cold Start)
0
5
10
15
20
25
0 60 120 180 240 300 360 420
Time (min)
Con
cent
ratio
n (u
g/m
3 )
0
20,000
40,000
60,000
Num
ber
(cm
-3)
Conc.
Numbe
West Side (Hot Start)
0
5
10
15
20
25
0 60 120 180 240 300 360 420
Time (min)
0
20,000
40,000
60,000
Num
ber
(cm
-3)
Figure 13. DMA particulate measurements during the propene + gasoline exhaust experiments.
West Side (Cold Start)
0
10
20
30
40
50
0 60 120 180 240
Time (min)
Con
cent
ratio
n (u
g/m
3 )
0
50,000
100,000
150,000
200,000
250,000
26

Run 7 Run 8
0.0
0.0
0.0
0.0
0.0
0.1
0.1
0.1
0.1
0 60 120 180 240
Time (min)
Con
cent
ratio
n (p
pm)
East O3 (Cold)
West O3 (Hot)
0.00
0.10
0.20
0.30
0.40
0.50
0.60
0.70
0.80
0.90
1.00
0 60 120 180 240
Time (min)
Con
cent
ratio
n (p
pm)
East NO East "NO2"
West NO West "NO2"
0.00
0.05
0.10
0.15
0.20
0.25
0.30
0.35
0.40
0.45
0 60 120 180 240
Time (min)
Con
cent
ratio
n (p
pm)
East Propene
West Propene
0.0
0.1
0.2
0.3
0.4
0.5
0.6
0.7
0.8
0 60 120 180
Time (min)
Con
cent
ratio
n (p
pm)
East O3 (Hot)
West O3 (Cold)
0.00
0.02
0.04
0.06
0.08
0.10
0.12
0.14
0.16
0.18
0.20
0 60 120 180
Time (min)
Con
cent
ratio
n (p
pm)
East NO East "NO2"
West NO West "NO2"
0.00
0.20
0.40
0.60
0.80
1.00
1.20
1.40
0 60 120 180 240
Time (min)
Con
cent
ratio
n (p
pm)
East Propene
West Propene
Figure 14. Experimental concentration - time plots for selected species for the propylene + CNG exhaust experiments.
27

Run 7 Run 8
East Side (Cold Start)
0.0
1.0
2.0
3.0
4.0
0 60 120 180 240 300 360
Time (min)
Con
cent
ratio
n (u
g/m
3 )
0
10,000
20,000
30,000
40,000Conc.
Numbe
West Side (Hot Start)
0.0
1.0
2.0
3.0
4.0
0 60 120 180 240 300 360
Time (min)
Con
cent
ratio
n (u
g/m
3 )
0
10,000
20,000
30,000
40,000
Figure 15. DMA particulate measurements during the propene + CNG exhaust experiments.
East Side (Hot Start)
0.0
1.0
2.0
3.0
4.0
0 60 120 180 240 300 360 420
Time (min)
0
10,000
20,000
30,000
40,000
Num
ber
(cm
-3)
West Side (Cold Start)
0.0
1.0
2.0
3.0
4.0
0 60 120 180 240 300 360 420
Time (min)
0
10,000
20,000
30,000
40,000
Num
ber
(cm
-3)
28

in the second experiment, and the resulting ozone levels were comparable to those observed in the propene
- NOx control runs. Although (somewhat unexpectedly) the O3 was lower on the cold start side than on
the side with the hot start exhaust, the subsequent propene - NOx control run (Run 10, Figure 9) indicated
that the west side tended to form somewhat lower O3 even with no exhaust added.
Figure 15 shows that self-nucleation was again occurring, with the results of Run 8 being similar
to that of the propene - NOx control run (see Figure 11). The amounts of particle mass formed (as
measured both by DMA and filter weighing) in the CNG exhaust Run 8 was also comparable to those in
the propene control run. The particle numbers and masses were lower in Run 7, perhaps because of the
lower amounts of O3 which was formed due to the higher NOx levels. In any case, the PM concentrations
were significantly lower in these added CNG exhaust experiments than was observed in the experiments
with gasoline exhaust.
Diesel Exhaust Experiment
One experiment was carried out using diesel exhaust, again with cold start exhaust on one side
and hot start on the other, with the same amount of exhaust added in both cases. For this run the exhaust
was injected for only ten seconds because the diesel exhaust was expected to have a PM concentrations
5-10 times higher than spark ignition vehicles. The gas-phase results are shown on figure 16, the DMA
data are shown on Figure 17, and the particle data are summarized on Table 1. The added exhaust did not
have a large effect on O3 formation, with the data looking similar to the propene - NOx control runs. The
cold start side formed somewhat more ozone, though this was also the side that had the higher ozone
levels in control run that preceded it (see Figure 9), though by a lesser amount.
As shown on Figure 17, the particle mass concentrations were relatively high at the start at the
experiment, and either decreased slightly or stayed constant during the course of the experiment. This is
unlike the other propene + exhaust or the propene control experiments. The final and maximum DMA
mass concentration were not significantly different from those observed in the CNG or the control
experiments, indicating relatively little growth in particle mass due to photochemical reactions. As with
the other experiments, significant nucleation forming very small particles was observed when ozone
formation began. The filter results were inconsistent, with the filter from the hot side showing almost no
PM mass, while the other showing PM mass comparable to the runs with gasoline. The latter result
appears to be anomalous.
29

Run 11
0.0
0.1
0.2
0.3
0.4
0.5
0.6
0 60 120 180
Time (min)
Con
cent
ratio
n (p
pm)
East O3 (Cold)
West O3 (Hot)
0.00
0.05
0.10
0.15
0 60 120 180Time (min)
Con
cent
ratio
n (p
pm)
East NO East "NO2"
West NO West "NO2"
0.00
0.10
0.20
0.30
0.40
0.50
0.60
0.70
0 60 120 180 240
Time (min)
Con
cent
ratio
n (p
pm)
East Propene
West Propene
Figure 16. Experimental concentration - time plots for selected species for the propylene + diesel exhaust experiments.
30

Run 11
East Side (Cold Start)
0.0
0.5
1.0
1.5
2.0
0 60 120 180 240 300
Time (min)
Con
cent
ratio
n (u
g/m
3 )
0
5,000
10,000
15,000
20,000
25,000
Num
ber (
cm-3
)
Conc.
Number
West Side (Hot Start)
0.0
0.5
1.0
1.5
2.0
0 60 120 180 240 300
Time (min)
Con
cent
ratio
n (u
g/m
3 )
0
5,000
10,000
15,000
20,000
25,000
Num
ber (
cm-3
)
Figure 17. DMA particulate measurements during the propene + diesel exhaust experiment.
31

CONCLUSIONS
We have shown that a large indoor Teflon environmental chamber system has the potential for
providing useful information about particle formation from motor vehicles and other emissions sources,
though improvements are needed before quantitative data can be obtained. The larger volume chamber was
found to have generally lower background effects which affect gas-phase reactions, and the gas-phase
results were generally consistent with data obtained from other chambers, and with model predictions. In
terms of particle measurements, problems were observed in our chamber due to background small particle
loadings in the chamber after the pure air fill, and nucleation processes caused by apparent reactions with
ozone with unknown background reactants in the chamber. This prevented use of DMA data to estimate
particle formation corrected for wall losses. In future work, steps must be taken to assure that chamber
fill air is free of small particles and does not contain species that cause nucleation when reacting with
ozone. In addition, DMA data should not be relied upon as the only means to correct for particle loss on
the chamber walls; separate particle loss experiments should be not be omitted from the experimental
protocol. Nevertheless, the use of the DMA is preferred to filter sampling because it yields a large number
of data points as a function of time as opposed to a single point at the end of the experiment, and because
it gives information about particle number and size distribution as well as mass. Furthermore, problems
were encountered with the filter sampling due to formation of holes when sampling at the large flow rates
necessary to empty the large chamber. Nevertheless, given exploratory nature of this project and its
relatively limited scope, we feel this program has been successful in demonstrating the potential for use
of a large indoor chamber system for assessing PM formation from vehicle emissions. It has been
particularly useful in demonstrating areas where improvements are most needed for future work.
Although quantitative information was not obtained, this program successful in showing that at
least one CNG powered vehicle has low direct PM emissions rate, and does not cause significant
secondary aerosol formation in the atmosphere. In particular, the particle mass formed from the CNG
vehicle was not significantly different from control experiments not containing vehicle exhaust. On the
other hand, the particle mass formed in experiments with exhausts from a gasoline powered vehicle was
significantly higher than that formed in the control runs. Although a diesel vehicle was also studied, the
results were inconclusive because of an insufficient amount of exhaust added to the chamber. Additional
experiments would be necessary to determine whether these results can be generalized to other vehicles,
and to obtain quantitative information concerning differences in PM forming potentials in vehicle
emissions.
32

REFERENCES
Atkinson, R., D. L. Baulch, R. A. Cox, R. F. Hampson, Jr., J. A. Kerr, M. J. Rossi, and J. Troe (1997):"Evaluated Kinetic, Photochemical and Heterogeneous Data for Atmospheric Chemistry:Supplement V., IUPAC Subcommittee on Gas Kinetic Data Evaluation for AtmosphericChemistry," J. Phys. Chem. Ref. Data, 26, 521-1011.
Carter, W. P. L., Dodd, M. C., Long, W. D. and Atkinson, R. (1984): Outdoor Chamber Study to TestMulti-Day Effects. Volume I: Results and Discussion. Final report, EPA-600/3-84-115.
Carter, W. P. L., R. Atkinson, A. M. Winer, and J. N. Pitts, Jr. (1982): "Experimental Investigation ofChamber-Dependent Radical Sources," Int. J. Chem. Kinet., 14, 1071.
Carter, W. P. L. (1990): "A Detailed Mechanism for the Gas-Phase Atmospheric Reactions of OrganicCompounds," Atmos. Environ., 24A, 481-518.
Carter, W. P. L. (1995): "Computer Modeling of Environmental Chamber Measurements of MaximumIncremental Reactivities of Volatile Organic Compounds," Atmos. Environ., 29, 2513-2517.
Carter, W. P. L. and F. W. Lurmann (1991): "Evaluation of a Detailed Gas-Phase Atmospheric ReactionMechanism using Environmental Chamber Data," Atm. Environ. 25A, 2771-2806.
Carter, W. P. L., J. A. Pierce, I. L. Malkina, D. Luo and W. D. Long (1993): "Environmental ChamberStudies of Maximum Incremental Reactivities of Volatile Organic Compounds," Report toCoordinating Research Council, Project No. ME-9, California Air Resources Board Contract No.A032-0692; South Coast Air Quality Management District Contract No. C91323, United StatesEnvironmental Protection Agency Cooperative Agreement No. CR-814396-01-0, UniversityCorporation for Atmospheric Research Contract No. 59166, and Dow Corning Corporation. April1.
Carter, W. P. L. (1994): "Development of Ozone Reactivity Scales for Volatile Organic Compounds,"J. Air & Waste Manage. Assoc., 44, 881-899.
Carter, W. P. L., D. Luo, I. L. Malkina, and J. A. Pierce (1995a): "Environmental Chamber Studies ofAtmospheric Reactivities of Volatile Organic Compounds. Effects of Varying Chamber and LightSource," Final report to National Renewable Energy Laboratory, Contract XZ-2-12075,Coordinating Research Council, Inc., Project M-9, California Air Resources Board, Contract A032-0692, and South Coast Air Quality Management District, Contract C91323, March 26.
Carter, W. P. L., D. Luo, I. L. Malkina, and D. Fitz (1995b): "The University of California, RiversideEnvironmental Chamber Data Base for Evaluating Oxidant Mechanism. Indoor ChamberExperiments through 1993," Report submitted to the U. S. Environmental Protection Agency,EPA/AREAL, Research Triangle Park, NC., March 20. (This report can be downloaded viahttp://cert.ucr.edu/~carter/bycarter.htm.)
33

Carter, W. P. L., D. Luo, I. L. Malkina, and J. A. Pierce (1995c): "Environmental Chamber Studies ofAtmospheric Reactivities of Volatile Organic Compounds. Effects of Varying ROG Surrogate andNOx," Final report to Coordinating Research Council, Inc., Project ME-9, California Air ResourcesBoard, Contract A032-0692, and South Coast Air Quality Management District, Contract C91323.March 24. (This report can be downloaded via http://cert.ucr.edu/ ~carter/bycarter.htm.)
Carter, W. P. L., D. Luo, and I. L. Malkina (1997): "Environmental Chamber Studies for Developmentof an Updated Photochemical Mechanism for VOC Reactivity Assessment," final report toCalifornia Air Resources Board Contract 92-345, Coordinating Research Council Project M-9, andNational Renewable Energy Laboratory Contract ZF-2-12252-07. November 26. (This report canbe downloaded via http://helium.ucr.edu/~carter/bycarter.htm.)
Carter, W. P. L., J. A. Pierce, D. Luo, and I. L. Malkina (1995): "Environmental Chamber Study ofMaximum Incremental Reactivities of Volatile Organic Compounds," Atmos. Environ. 29, 2499-2511.
Grosjean D. (1984) Photooxidation of 1-heptene. Sci Tot. Envir. 37, 195-211.
Grosjean D. (1992) In situ organic aerosol formation during a smog episode: estimated production andchemical functionality. Atmos. Environ. 26A, 953-963.
Grosjean D. and K. Fung (1984) Hydrocarbons and carbonyls in Los Angeles air. J. Air Poll. Contr.Assoc. 34, 537-543.
Grosjean, D. and J. Seinfeld (1989) Parameterization of the formation potential of secondary organicaerosols. Atmos. Environ 23, 1733-1747.
Kleindienst T.E., D.F. Smith, E.E. Hudgens, R.F. Snow, E. Perry, L.D. Claxton, J.J. Bufalini, F.M. Blackand L.T. Cupitt (1992) The photo-oxidation of automobile emissions: measurements of thetransformation products and their mutagenic activity. Atmos. Environ. 26A, 3039-3053.
Pandis S.N. S.E. Paulson, J.H. Seinfeld and R.C. Flagan (1991) Aerosol formation in the photooxidationof isoprene and ß-pinene. Atmos. Environ. 25A, 997-1008.
Pandis S.N., R.A. Harley, G.R. Cass and J.H. Seinfeld (1992) Secondary organic aerosol formation andtransport. Atmos. Environ. 26A, 2269-2282.
Peterson, J. T. (1976): "Calculated Actinic Fluxes (290 - 700 nm) for Air Pollution PhotochemistryApplications", EPA-600/4-76-025, June.
Schauer J.J., W. Rogge, L.M. Hildemann, M.A. Mazurek and G.R. Cass (1996) Source apportionment ofairborne particulate matter using organic compounds as tracers. Atmos. Environ. 30, 3837-3855.
Stern J.E., R.C. Flagan, D. Grosjean and J.H. Seinfeld (1987) Aerosol formation and growth inatmospheric aromatic hydrocarbon photooxidation. Environ. Sci. technol. 21, 1224-1231.
U.S. Environmental Protection Agency (1987) National air pollutant emissions estimates 1949-1986. EPAdocument EPA-450/4-87-024. Research Triangle Park North Carolina.
34

Wang S.-C., R.C. Flagan and J.H. Seinfeld (1991a) Aerosol formation and growth in atmosphericorganic/NOx Systems- II. aerosol dynamics. Atmos. Environ. 26A, 421-434.
Wang, S.-C., S.E. Paulson, D. Grosjean, R.C. Flagan and J.H. Seinfeld (1991b) Aerosol formation andgrowth in atmospheric organic/NOx Systems- I. outdoor smog chamber studies of C7 - C8hydrocarbons. Atmos. Environ. 26A, 403-420.
Winer, A. M., J. W. Peters, J. P. Smith and J. N. Pitts, Jr. (1974): "Response of Commercial Chemilumin-escent NO-NO2 Analyzers to Other Nitrogen-Containing Compounds," Environ. Sci. Technol., 8,1118.
Zafonte, L., P. L. Rieger, and J. R. Holmes (1977): Nitrogen Dioxide Photolysis in the Los AngelesAtmosphere," Environ. Sci. Technol. 11, 483-487.
35