Evaluation of the Medicare Acute Care Episode
302
Centers for Medicare & Medicaid Services Evaluation of the Medicare Acute Care Episode (ACE) Demonstration Contract Number: HHSM-500-2006-00007I Final Evaluation Report May 31, 2013 Attention: Jesse M. Levy, PhD Centers for Medicare and Medicaid Innovation Submitted by: In collaboration with The Hilltop Institute, University of Maryland, Baltimore County
-
Upload
vuonghuong -
Category
Documents
-
view
217 -
download
1
Transcript of Evaluation of the Medicare Acute Care Episode
Centers for Medicare & Medicaid Services
Evaluation of the Medicare Acute Care Episode (ACE) Demonstration
Contract Number: HHSM-500-2006-00007I
Final Evaluation Report
May 31, 2013
Attention:
Jesse M. Levy, PhD Centers for Medicare and Medicaid Innovation
Submitted by:
In collaboration with The Hilltop Institute,
University of Maryland, Baltimore County

IMPAQ International, LLC Page i Evaluation of Medicare ACE Demonstration May 31, 2013 Final Evaluation Report
AUTHORS AND ACKNOWLEDGEMENTS
Authors:
IMPAQ International, LLC
Oswaldo Urdapilleta, PhD
Daniel Weinberg, PhD
Sarah Pedersen, MPP
Geena Kim, PhD
and
The Hilltop Institute
Stephanie Cannon-Jones, MPP
Jenine Woodward
The research presented in this report was prepared by IMPAQ International, LLC and The Hilltop Institute staff under the direction of Dr. Oswaldo Urdapilleta. The ACE evaluation team would like to give special thanks to Dr. Jesse M. Levy (Contracting Officer’s Representative) for his guidance and support during the 4 years of the evaluation contract. His technical feedback, attention to detail, and insight were invaluable contributions to this final report. We also want to thank other CMS staff: Cynthia Mason, project manager for the ACE demonstration, and Drs. Curt Mueller, Alexandre Laberge and Renee Mentnech for their feedback on the evaluation interim and final report, respectively. We also appreciate the assistance we received from the ACE Implementation contractor, RTI International. We also wish to acknowledge those who contributed to the early versions of this report or provided support for the research: Jasmine Ainetchian, Camellia Bollino, Dr. Donald Nichols, Nancy Svehla, RN, Sirisha Busam, Dharmendra Tirumalasetti, Dr. Cynthia Buddie-Willis, and Min-Young Kim. This report benefited from the excellent editorial review from Del Sweeny.
The content of this report does not represent the views of the Centers for Medicare and Medicaid Services nor of the authors. Any errors or omissions are the responsibility of the authors.

IMPAQ International, LLC Page ii Evaluation of Medicare ACE Demonstration May 31, 2013 Final Evaluation Report
TABLE OF CONTENTS
EXECUTIVE SUMMARY ............................................................................................................... 1
CHAPTER I: INTRODUCTION, DATA, AND METHODS ................................................................ 10
1. ACUTE CARE EPISODE DEMONSTRATION AND SITES............................................................ 11 1.1. The Medicare Acute Care Episode (ACE) Demonstration ....................................................... 11 1.2. ACE Participating Sites .......................................................................................................... 11
1.2.1. Baptist Health System .................................................................................................. 12 1.2.2. Oklahoma Heart Hospital ............................................................................................. 13 1.2.3. Hillcrest Medical Center ............................................................................................... 14 1.2.4. Lovelace Health System ................................................................................................ 16 1.2.5. Exempla St. Joseph Hospital ......................................................................................... 17
1.3 Comparison of ACE Sites Features ......................................................................................... 18
2. METHODS, COMPARISON GROUPS, AND DATA DEVELOPMENT .......................................... 20 2.1. Qualitative Analysis .............................................................................................................. 20
2.1.1. Qualitative Methodology .............................................................................................. 20 2.1.2. Qualitative Research Domains ...................................................................................... 20 2.1.3. Key Informants and Focus Groups ................................................................................ 23 2.1.4. Discussion Guides ......................................................................................................... 23 2.1.5. Initial Site Visits ............................................................................................................ 24 2.1.6. Second-Round Site Visits .............................................................................................. 24 2.1.7. Data Collection ............................................................................................................ 25 2.1.8. Operational Limitations ................................................................................................ 26 2.1.9. Comparative Analysis Methodology.............................................................................. 26
2.2. Quantitative Analysis ............................................................................................................ 27 2.2.1. Methodology ................................................................................................................ 27 2.2.2. Data Preparation .......................................................................................................... 36
CHAPTER II: COMPARATIVE SITE VISITS FINDINGS ................................................................... 43
1. QUALITY AND COORDINATION OF CARE .......................................................................... 44 1.1. Research Objectives .............................................................................................................. 44 1.2. Comparative Analysis ............................................................................................................ 44 1.3. Summary Findings and Example Cases .................................................................................. 49
2. MEDICARE COSTS AND SAVINGS ...................................................................................... 52 2.1. Research Objectives .............................................................................................................. 52 2.2. Comparative Analysis ............................................................................................................ 52 2.3. Summary Findings and Example Cases .................................................................................. 56
3. VOLUME, CONCENTRATION, AND SPILLOVER .................................................................. 58 3.1. Research Objectives .............................................................................................................. 58 3.2. Comparative Analysis ............................................................................................................ 58 3.3. Summary Findings ................................................................................................................ 60

IMPAQ International, LLC Page iii Evaluation of Medicare ACE Demonstration May 31, 2013 Final Evaluation Report
4. INCENTIVES ....................................................................................................................... 62 4.1. Research Objectives .............................................................................................................. 62 4.2. Comparative Analysis ............................................................................................................ 63 4.3. Summary Findings and Example Case.................................................................................... 67
5. INFRASTRUCTURE AND ORGANIZATION........................................................................... 69 5.1. Research Objectives .............................................................................................................. 69 5.2. Comparative Analysis ............................................................................................................ 69 5.3. Summary Findings and Example Case.................................................................................... 73
6. SATISFACTION...................................................................................................................... 76 6.1. Research Objectives .............................................................................................................. 76 6.2. Comparative Analysis ............................................................................................................ 76 6.3. Summary Findings ................................................................................................................ 79
7. COMPARATIVE ANALYSIS CONCLUSIONS ......................................................................... 81
CHAPTER III: CARRIER EXPENDITURES OCCURRING DURING ACE EPISODES AND ASSOCIATED POST-ACUTE CARE COSTS .........................................................................................................84
1. INTRODUCTION ................................................................................................................ 85
2. CARRIER COSTS DURING THE INPATIENT EPISODE ........................................................... 87 2.1. Measure ............................................................................................................................... 87 2.2. Results .................................................................................................................................. 88 2.3. Disaggregation of Carrier Costs During the Inpatient Episode ................................................ 97
3. POST-ACUTE CARE COSTS ANALYSES .............................................................................. 111 3.1. Measures ............................................................................................................................ 111 3.2. Results ................................................................................................................................ 112
4. SUMMARY ...................................................................................................................... 124
CHAPTER IV: QUALITY OF CARE, RESOURCE UTILIZATION, AND CASE MIX ............................ 125
1. INTRODUCTION .............................................................................................................. 126
2. MEASURES ...................................................................................................................... 127 2.1. Research Questions ............................................................................................................ 133 2.2. Data .................................................................................................................................... 133
3. METHODOLOGY .............................................................................................................. 135
4. RESULTS .......................................................................................................................... 153 4.1. Time Trend ......................................................................................................................... 153 4.2. Adjusted DID....................................................................................................................... 160
5. SUMMARY ...................................................................................................................... 171
CHAPTER V: VOLUME, MARKET CONCENTRATION, AND PHYSICIANS’ CHOICE OF PLACE OF SURGERY ................................................................................................................................ 172
1. INTRODUCTION .............................................................................................................. 173
2. VOLUME FINDINGS ......................................................................................................... 174

IMPAQ International, LLC Page iv Evaluation of Medicare ACE Demonstration May 31, 2013 Final Evaluation Report
2.1. Changes in Quarterly Volume ............................................................................................. 174 2.1.1. Research Questions .................................................................................................... 174 2.1.2. Measure ..................................................................................................................... 174 2.1.3. Methodology .............................................................................................................. 174 2.1.4. Results ....................................................................................................................... 178
2.2. Changes in Post-Acute Care Volume ................................................................................... 183 2.2.1. Research Questions .................................................................................................... 183 2.2.2. Measure ..................................................................................................................... 183 2.2.3. Methodology .............................................................................................................. 183 2.2.4. Results ....................................................................................................................... 184
3. MARKET CONCENTRATION AND PHYSICIANS’ CHOICE OF PLACE OF SURGERY .............. 195 3.1. Market Share ...................................................................................................................... 195
3.1.1. Research Question ..................................................................................................... 195 3.1.2. Measure ..................................................................................................................... 195 3.1.3. Methodology .............................................................................................................. 195 3.1.4. Results ....................................................................................................................... 195
3.2. Within-Hospital Distribution of Services .............................................................................. 201 3.2.1. Research Questions .................................................................................................... 202 3.2.2. Measure ..................................................................................................................... 202 3.2.3. Methodology .............................................................................................................. 202 3.2.4. Results ....................................................................................................................... 205
3.3. ACE Physicians’ Choice of Hospitals for Performing ACE Procedures.................................... 209 3.3.1. Research Questions .................................................................................................... 209 3.3.2. Measure ..................................................................................................................... 209 3.3.3. Methodology .............................................................................................................. 210 3.3.4. Results ....................................................................................................................... 210
3.4. Summary ............................................................................................................................ 215
CHAPTER VI: LESSONS FROM ACE IMPLEMENTATION, SUMMARY OF EVALUATION FINDINGS, AND CONCLUSIONS ................................................................................................................ 217
1. IMPLEMENTATION LESSONS LEARNED ........................................................................... 218
2. SUMMARY OF EVALUATION FINDINGS........................................................................... 222
3. CONCLUSIONS ................................................................................................................ 225
APPENDICES ........................................................................................................................... 229
APPENDIX A: LIST OF ACE AND ACE-RELATED MS-DRGS ........................................................ 230
APPENDIX B: PRIMARY AND SECONDARY IMPLEMENTATION ELEMENTS ............................. 235
APPENDIX C: SUMMARY STATISTICS FOR COST ANALYSIS ..................................................... 256
APPENDIX D: ADJUSTED DID ANALYSIS FOR QUALITY OF CARE BY SITE AND PROCEDURE .... 265
APPENDIX E: SUMMARY TRENDS FOR VOLUME ANALYSIS .................................................... 283
APPENDIX F: MEDICARE SAVINGS .......................................................................................... 290

IMPAQ International, LLC Page v Evaluation of Medicare ACE Demonstration May 31, 2013 Final Evaluation Report
TABLE OF EXHIBITS
Exhibit 1: Baptist Health System Quick Facts ......................................................................................... 12 Exhibit 2: Oklahoma Heart Hospital Quick Facts .................................................................................... 14 Exhibit 3: Hillcrest Medical Center Quick Facts ...................................................................................... 15 Exhibit 4: Lovelace Health System Quick Facts ....................................................................................... 16 Exhibit 5: Exempla St. Joseph Hospital Quick Facts ................................................................................ 17 Exhibit 6: Comparison of ACE Site Features ........................................................................................... 19 Exhibit 7: Research Domains and Sample Research Questions with Emphasis on Qualitative Data ......... 22 Exhibit 8: ACE Site Visits by Location, Date, and Data Collection Mechanism ......................................... 25 Exhibit 9: Characteristics of Potential MAC4 True Comparison Group Hospitals/Sites by State and ACE Surgical Procedures ............................................................................................................................... 31 Exhibit 10: Characteristics of Potential Cardiovascular Non-Demonstration Treatment Group Hospitals/Sites by Demonstration Site ................................................................................................... 32 Exhibit 11: Characteristics of Potential Orthopedic Non-Demonstration Treatment Group Hospitals/Sites by Demonstration Site ........................................................................................................................... 33 Exhibit 12: Regression Models Estimated for Each Outcome of Interest in the Volume, Cost, and Quality of Care Analyses .................................................................................................................................... 35 Exhibit 13: Volume of Inpatient Episodes Over Time ............................................................................. 39 Exhibit 14: Summary Statistics for Inpatient Part B Costs ....................................................................... 89 Exhibit 15: Average Inpatient Part B Costs per Episode .......................................................................... 90 Exhibit 16: Global DID Regression Results: Dollar Value of Part B Costs Delivered During the Inpatient Episode ................................................................................................................................................. 95 Exhibit 17: Site-Specific DID Regression Results: Dollar Value of Part B Costs Delivered During the Inpatient Episode .................................................................................................................................. 96 Exhibit 18: BETOS Categories used in the HCPCS/CPT Analysis ............................................................... 99 Exhibit 19: Analysis of Part B Services – Broad HCPCS/CPT Categories ................................................. 100 Exhibit 20: Within-Procedure-Group Distribution of MS-DRGs ............................................................. 105 Exhibit 21: Post-Acute Care Cost Measures ......................................................................................... 112 Exhibit 22: Summary Statistics for Total PAC Costs .............................................................................. 113 Exhibit 23: Average Total PAC Costs per Episode ................................................................................. 114 Exhibit 24: Global DID Regression Results, Total PAC Costs per Episode ............................................... 119 Exhibit 25: Site-Specific DID Regression Results, Total PAC Costs per Episode ...................................... 120 Exhibit 26: Global DID Regression Results by Type of PAC Costs .......................................................... 122 Exhibit 27: ACE Quality of Care, Utilization, and Case Mix Measures.................................................... 128 Exhibit 28: Hypothesized Utilization and Case Mix Responses ............................................................. 131 Exhibit 29: Expected Changes for Utilization and Case Mix Measures .................................................. 131 Exhibit 30: Descriptive Statistics Changes in Quality of Care, Utilization, and Case Mix Measures Pre- and Post-ACE Demonstration ..................................................................................................................... 138 Exhibit 31: Utilization and Case Mix Measures – Summary Statistics for Defibrillator........................... 141 Exhibit 32: Utilization and Case Mix Measures – Summary Statistics for Pacemaker ............................ 143 Exhibit 33: Utilization and Case Mix Measures – Summary Statistics for Valve ..................................... 145 Exhibit 34: Utilization and Case Mix Measures – Summary Statistics for CABG..................................... 147 Exhibit 35: Utilization and Case Mix Measures – Summary Statistics for PCI ........................................ 149 Exhibit 36: Utilization and Case Mix Measures – Summary Statistics for Hip/Knee Replacement/Revision............................................................................................................................................................ 151

IMPAQ International, LLC Page vi Evaluation of Medicare ACE Demonstration May 31, 2013 Final Evaluation Report
Exhibit 37: Results of Time Trend Analysis of CABG Quality Report-Based Quality Measures ............... 155 Exhibit 38: Results of Time Trend Analysis of PCI Quality Report-Based Quality Measures ................... 157 Exhibit 39: Results of Time Trend Analysis of Valve Quality Report-Based Quality Measures ............... 158 Exhibit 40: Results of Time Trend Analysis of Hip/Knee Quality Report Quality Measures .................... 159 Exhibit 41: Summary of Results of Adjusted DID Analysis for Claims-Based Quality Measures .............. 162 Exhibit 42: Results of Adjusted DID Analysis of Defibrillator Claims-Based Quality Measures ............... 165 Exhibit 43: Results of Adjusted DID Analysis of Pacemaker Claims-Based Quality Measures................. 166 Exhibit 44: Results of Adjusted DID Analysis of Valve Claims-Based Quality Measures ......................... 167 Exhibit 45: Results of Adjusted DID Analysis of CABG Claims-Based Quality Measures ......................... 168 Exhibit 46: Results of Adjusted DID Analysis of PCI Claims-Based Quality Measures ............................. 169 Exhibit 47: Results of Adjusted DID Analysis of Hip/Knee Claims-Based Quality Measures ................... 170 Exhibit 48: Summary Statistics for Quarterly Volume ........................................................................... 177 Exhibit 49: Effects of the Demonstration on Quarterly Volume (Global DID Estimates) ........................ 179 Exhibit 50: Effects of the Demonstration on Quarterly Volume (Site-Specific DID Estimates) ............... 181 Exhibit 51: Adjusted DID Estimates for the Quarterly PAC Volume of ACE and ACE-Related Procedure Groups for All Sites .............................................................................................................................. 185 Exhibit 52: Adjusted DID Estimates for the Quarterly PAC Volume of ACE and ACE-Related Procedure Groups for Each Site ............................................................................................................................ 188 Exhibit 53: Market Share by Period for Each Procedure Group (Global) ............................................... 196 Exhibit 54: Market Share by Period for Each Procedure Group (Site-Specific) ...................................... 198 Exhibit 55: Summary Statistics for Within-Hospital Distribution of Services ......................................... 204 Exhibit 56: Effects of the Demonstration on Within-Hospital Distribution of Services (Global DID Estimates) ........................................................................................................................................... 205 Exhibit 57: Effects of the Demonstration on Within-Hospital Distribution of Services (Site-Specific DID Estimates) ........................................................................................................................................... 207 Exhibit 58: Physicians’ Choice of Hospitals for Performing ACE Procedures.......................................... 211

IMPAQ International, LLC Page 1 Evaluation of Medicare ACE Demonstration May 31, 2013 Final Evaluation Report
EXECUTIVE SUMMARY In June 2009, IMPAQ International LLC, with its partner, The Hilltop Institute, University of Maryland, Baltimore County, was awarded a contract to conduct the Evaluation of the Medicare Acute Care Episode Demonstration. This report presents the findings of the evaluation of a bundled payment demonstration for selected cardiovascular and orthopedic procedures, which was implemented at five sites in four states. The Medicare Acute Care Episode (ACE) Demonstration The Medicare ACE Demonstration, a 3-year demonstration project funded by the Centers for Medicare & Medicaid Services (CMS), used a global payment for a single episode of care as an alternative approach to payment for service delivery under traditional Medicare fee-for-service (FFS). The episode of care was defined as the bundle of Part A and Part B services provided to Medicare FFS beneficiaries during an inpatient stay for included Medicare Severity Diagnosis-Related Groups (MS-DRGs), specifically, Cardiac Valve and Other Major Cardiothoracic Valve (valve), Cardiac Defibrillator Implant (defibrillator), Coronary Artery Bypass Graft (CABG), Cardiac Pacemaker Implant or Revision (pacemaker), Percutaneous Coronary Intervention (PCI), and Hip or Knee Replacement or Revision (hip/knee). Among the goals of the demonstration were (1) to improve the quality of care; (2) to increase collaboration among providers and health systems; and (3) to reduce Medicare payments for acute care services by using market mechanisms. One of the most important mechanisms introduced by the demonstration was an innovative payment model and contractual arrangements to provide certain cardiovascular and orthopedic services. During the demonstration, physicians were paid from the ACE bundled payments at 100 percent of the Medicare Part B physician fee schedule although hospitals could have negotiated lower rates. Two other innovative mechanisms for system change were allowing sharing of Medicare savings with beneficiaries, and gainsharing between physicians and facilities. Gainsharing, or provider incentive programs, allow physicians and hospitals to receive a share of the savings that result from implementing and coordinating improvements in efficiency and quality. In addition to these mechanisms, the ACE Demonstration centered on several features: enhanced coordination of care, cost-control incentives, adoption of standardized clinical protocols, and quality improvement activities. ACE Participating Sites Between April 2009 and November 2010, five ACE sites began implementing the demonstration: Baptist Health System (BHS), Oklahoma Heart Hospital (OHH), Hillcrest Medical Center (HMC), Lovelace Health System (LHS), and Exempla Saint Joseph Hospital (ESJH). Each participating site, and, in some instances, each facility within the participating health system, developed individualized innovations that affected how the ACE site provided services, coordinated health care, marketed to physicians and beneficiaries, and distributed savings

IMPAQ International, LLC Page 2 Evaluation of Medicare ACE Demonstration May 31, 2013 Final Evaluation Report
between the hospital and its participating physicians (no other providers, e.g., nurses or referring physicians received gainsharing). A comparison of the features of the ACE sites is presented below.
Exhibit ES-1: Comparison of ACE Site Features
Features BHS OHH HMC LHS ESJH
ACE Physicians Employed by the
Site
Cardiologists; one orthopedic oncologist
Cardiologists; cardiovascular
surgeons
Cardiologists; cardiovascular
surgeons N/A
Cardiologists; cardiovascular
surgeons
Types of ACE Physicians Eligible
for Gainsharing
Orthopedists; cardiologists; cardiothoracic
None
Cardiovascular surgeons;
orthopedic surgeons
Orthopedic surgeons
Cardiovascular surgeons
Percentage Gainsharing
Agreement with Physicians
50% of calculated cost savings,
capped at 25% of Medicare Part B
Allowable
None
50% of calculated cost savings, capped
at 25% of Medicare Part B
Allowable
50% of calculated cost savings,
capped at 25% of Medicare Part B
Allowable
50% of calculated cost savings, capped
at 25% of Medicare Part B
Allowable
Percentage of Eligible Physicians
Who Have Received ACE Gainsharing
Just over 50% of eligible physicians
N/A 100% 91% of eligible
orthopedic surgeons
100%
Part A Discount
Cardiovascular: 8.25%;
orthopedic: 2.5% 0.9% 4.4% 3.0% 5%
Part B Discount
0.0% 1.0% 4.4% 3.3% 0.0%
Estimates to date
ACE Orthopedic Procedures to Date
2,385 (43 months)
N/A 1,343
(44 months) 448
(28 months) N/A
ACE Cardiovascular Procedures to Date
3,394 (43 months)
5,968 (35 months)
2,069 (36 months)
N/A* 20
(10 months)
Site Internal Cost Savings on ACE DRG
Procedures (Cardiovascular)
$4.6 million (43 months)
$0 (35 months)
$996,389 (36 months)
N/A $112,126
(11 months)
Site Internal Cost Savings on ACE DRG
Procedures (Orthopedic)
$6.1 million (43 months)
N/A $818,217
(41 months) $312,079
(22 months) N/A
Note: Site internal cost savings on ACE DRG procedures were self-reported by the sites. Other data were extracted from ACE site applications. *DRG area not part of analysis due to delay in start-up.

IMPAQ International, LLC Page 3 Evaluation of Medicare ACE Demonstration May 31, 2013 Final Evaluation Report
Methods, Comparison Groups, and Data Development
Two types of information were used in the evaluation: qualitative, derived from an analysis of key informant interviews and focus groups during two rounds of site visits, and quantitative, derived from an analysis of Medicare claims data and site-reported quality measures. The qualitative data were derived from interviews and focus groups with the staff implementing ACE (e.g., physicians, nurses, and other ancillary/support staff) and with Medicare beneficiaries who received a qualifying procedure at an ACE-participating hospital. Discussions focused on the decision to participate in the demonstration, expectations of ACE, new or revised initiatives developed for ACE, and the effect of ACE on factors such as quality of care, patient volume, incentives, satisfaction, and Medicare cost savings. The analysis concentrated on the evolution of the demonstration at the ACE sites and the sites’ approaches to resolving challenges and obstacles in the implementation of the demonstration. For the quantitative analyses of the impact of the ACE Demonstration, difference-in-differences (DID) models were used. The specifications for the DID analyses were customized for each specific analysis (i.e., volume and within-hospital volume distribution, Medicare non-durable medical equipment (DME) carrier and post-acute care expenditures, and quality of care) to take full advantage of each type of the available data (inpatient and outpatient claims, for example). The analysis of most quality of care measures used claim-level data and beneficiary-level covariates, whereas the analysis of the effects of the demonstration on quarterly volume employed hospital-by-quarter data and thus did not include person-level or claim-level covariates. In some instances, only a trend analysis was conducted for the selected research questions due to data limitations (lack of pre-demonstration data).
To estimate the impact of the demonstration on the ACE sites, two comparison groups of non-ACE hospitals were identified. Hospitals in the first group, the “true comparison group,” were located outside of the market areas of the demonstration sites (as defined by hospital referral regions), but within Medicare Administrative Contractor Region No. 4 (MAC4). The second comparison group, the “non-demonstration treatment group,” was composed of hospitals that did not participate in ACE, but were located in the same market areas as the demonstration hospitals. These hospitals were used to assess any indirect effects of the demonstration (e.g., changes in the volume of services provided at hospitals surrounding an ACE site). Non-demonstration treatment groups were selected separately for each demonstration site and ACE procedure category. There were two true comparison groups for all demonstration sites in each ACE surgical category (cardiovascular and orthopedic services). Because matching techniques did not produce a sufficient number of comparison hospitals, IMPAQ selected comparison groups based on minimal criteria, namely, that hospitals (1) be located within the MAC4 region, (2) have the ability to perform an ACE surgical procedure, and (3) have performed at least one relevant ACE surgical procedure during FY 2008.

IMPAQ International, LLC Page 4 Evaluation of Medicare ACE Demonstration May 31, 2013 Final Evaluation Report
Comparative Site Visits Findings
The ACE Demonstration sites implemented and refined strategies to achieve cost savings and quality and coordination of care goals throughout the demonstration. Though participating sites were at different stages of cost and quality measurement and reporting prior to the demonstration, the ACE Demonstration served as a catalyst to enhance quality awareness and underlined the importance of monitoring and communicating quality and cost benchmarks across the delivery system. Administrators implemented and in some cases expanded upon strategic initiatives to meet the quality and cost objectives established in the demonstration. Engaging physicians in such initiatives early in the planning process increased physician support and enhanced administrator and physician collaboration throughout the demonstration. Standardization of operating processes and materials significantly enhanced coordination and quality of care across the hospital system at ACE sites. Physicians coordinated with administrators to achieve the standardization of order sets and materials. Of the two service lines, the orthopedic service line experienced more success with standardization than did the cardiovascular line because procedures such as hip and knee replacements are usually prescheduled surgeries, unlike cardiovascular procedures, which are often done in emergency situations. ACE patient navigators—specialized case managers—were hired to help bridge gaps in care coordination. Patient navigators proactively tracked quality measures, allowing physicians and staff to more efficiently monitor and improve patient outcomes. Many sites maintained patient navigators throughout the demonstration; patient navigators eventually focused on orthopedic services, which had higher patient volume and returns in terms of quality and costs. Vendor negotiations on surgical implants, equipment, and materials in both orthopedic and cardiovascular DRGs produced the greatest cost savings for the ACE sites, particularly during the initial phases of the demonstration. The ACE Demonstration served as a catalyst for hospital administrators and physicians to monitor the cost of materials. Orthopedic service lines often benefited more than cardiovascular lines because orthopedic surgeons had more flexibility to modify and standardize equipment and materials and the value of the price reduction was larger than in cardiovascular materials. Data transparency on quality and cost issues improved the level of engagement of physicians and staff and heightened awareness of cost and quality outcomes, encouraging physicians and staff to work together to meet metric goals. Administrators employed monthly physician report cards on cost and quality data to increase the transparency of information. Physician report cards served as a driver for discussions among physicians and between physicians and administrators. In many instances, the report cards allowed a direct connection of the outcome measures to gainsharing, which led to some peer pressure among physicians to achieve quality goals at the physician and facility level (a pre-requisite for gainsharing in some sites).

IMPAQ International, LLC Page 5 Evaluation of Medicare ACE Demonstration May 31, 2013 Final Evaluation Report
Gainsharing strategies implemented as part of the demonstration gave physicians incentives to achieve cost and quality benchmarks and to introduce operational changes. The process for determining eligibility for and distributing gainsharing varied at each site; however, policies that calculated a monthly aggregate for both cost savings and quality measures for each ACE DRG and required administrators to communicate measures on a regular basis appeared to be the most successful in terms of physician compliance and satisfaction. Gainsharing arrangements for independent physicians were most successful in increasing physician involvement in developing and complying with ACE-related initiatives. Physicians and administrators concurred that the cap on gainsharing—which requires that payments to physicians not exceed 25 percent of the amount that is normally paid to them under the fee schedule for such cases—hindered further achievement of cost and quality goals, as did the fact that all participating hospitals chose not to extend incentives to non-physician staff. A common observation during the site visits, across all stakeholders, was that volume and market share were not significantly affected, either positively or negatively, by the demonstration. This was later confirmed by the Medicare claims analysis. Medicare beneficiaries were largely unaware of the demonstration and did not prioritize the ACE Medicare shared savings incentives; instead, referrals from their primary care physician or the reputation of the hospital or the surgeon who had privileges at that hospital influenced their choice of hospital. Some of the successful and easily transferable ACE-inspired policies and initiatives have been influential in enhancing quality and coordination of care and reducing costs in both ACE and non-ACE DRGs. The quality and cost outcomes of initiatives such as standardization of order sets and vendor negotiations influenced other service lines and disciplines to initiate similar strategies.
Quantitative Findings Non-DME Carrier Costs for ACE Episodes and Associated Post-Acute Care (PAC) Costs The effects of the demonstration on the dollars’ worth of non-DME carrier costs provided during inpatient episodes at the ACE hospitals are robust. The demonstration appears to have increased the dollars’ worth of non-DME carrier services provided by more than 20 percent although the dollar estimates range from $325 per defibrillator episode to $1,190 per valve episode. Additional investigation of these results revealed that the increased non-DME carrier services were for CPT/HCPCS codes related to hospital visits and procedures. It is possible that the rules governing the ACE Demonstration incentivized providers to deliver more care because (a) physicians did not experience risk in cases where the costs of care exceeded the bundled payment amount, (b) physicians’ quality of care and protocols of care were scrutinized as part of the demonstration, or (c) physician services may have been substituted for hospital services (e.g., more physicians’ visits leading to shorter lengths of stay and higher patient satisfaction).

IMPAQ International, LLC Page 6 Evaluation of Medicare ACE Demonstration May 31, 2013 Final Evaluation Report
IMPAQ was not able to test these assumptions due to data limitations. However, there was no effect on the provision of physician services for inpatient episodes at non-demonstration treatment group hospitals. IMPAQ also conducted an analysis of PAC costs following inpatient ACE episodes. With the exception of PCI procedures, for which total PAC costs increased by $414 (17 percent of the pre-implementation costs), average total PAC costs did not change. This was an important outcome given the potential for transferring costs from inpatient to PAC settings. The pooled estimates for the ACE sites, however, mask the site-specific findings. For example, they obscure the fact that BHS’ total PAC costs increased by between $283 for orthopedic procedures and $3,463 for valve procedures in response to the demonstration and that LHS’s PAC costs for orthopedic procedures decreased by more than $1,000 per episode. Medicare Savings The report also includes estimates of the Medicare savings from the ACE Demonstration due to the discounted bundled payments to ACE sites and after accounting for Medicare PAC savings or cost increases. Based on the deterministic savings on Medicare inpatient payments (discounts) and the DID estimates from the PAC analysis, Medicare saved an average of $585 per episode from the combined Medicare Part A and B expected payments or a total of $7.3 million across all episodes (12,501 episodes), all ACE MS-DRGs, and four ACE Sites. However, increases in PAC costs reduced these savings by approximately 45 percent, resulting in per-episode savings of $319 and total net savings of approximately $4 million. The Medicare savings vary by MS-DRG and by site with Oklahoma having the smallest per-episode savings ($99 per episode; $422,126 in total net savings) and Hillcrest had the largest total net savings ($814 per episode; $2,457,433 in total net savings). The largest aggregate savings were from orthopedic procedures and the smallest savings per episode was for PCI procedures ($71). The Medicare savings estimates do not take into consideration the ACE Medicare shared savings incentives given back to eligible beneficiaries. Quality of Care, Resource Utilization, and Case Mix Analysis
To estimate the impact of the demonstration on quality of care at the ACE sites and the non-demonstration treatment sites, the evaluation used 22 nationally recognized quality of care, resource utilization, and case mix measures. The measures captured three aspects of quality: the severity of admitted patients, processes, and outcomes. Eight of the measures required information from a medical record/chart. These values were obtained from quarterly quality reports produced by the ACE sites. These data could not be collected for the comparison hospitals nor were they produced by the ACE sites before the demonstration. Medicare claims-based measures (14) were produced for the ACE sites, the non-demonstration treatment sites, and the true comparison sites using Medicare claims (inpatient and outpatient) and denominator files. The claims-based analysis was conducted in a DID regression framework where the patient characteristics were the independent variables (race, gender, age at discharge, and patient health status [HCC community risk score]).

IMPAQ International, LLC Page 7 Evaluation of Medicare ACE Demonstration May 31, 2013 Final Evaluation Report
The findings from the time trend analysis of the medical report based measures suggest no or little evidence of a demonstration effect on most of the process and outcome measures. The measure for the revascularization rates of PCI admitted patients showed considerable changes. However these changes were likely driven mostly by surgery patterns at HMC, which experienced organizational changes such as the opening of the Oklahoma Heart Institute and the hiring of a new cardiovascular physician group. The shifts in quality of care patterns at HMC may have been related in part to some of these non-demonstration factors. A limitation of the interpretation of the trend analysis findings is that they cannot be corrected for the measure trajectories pre-demonstration. The adjusted DID findings suggest that the ACE sites maintained their quality of care levelswithout any systematic or consistent changes in clinical outcomes or in the type of patientsthey admitted (severity measures) in response to the demonstration. Despite the lack of strongquantitative evidence for realized improvements in quality, there is qualitative evidence thathospitals worked to improve processes and outcomes. The lack of effect on severity measuresis an important result because it indicates that the hospitals did not deliberately choose toprovide services to healthier, less financially risky patients.
Volume, Concentration, and Physicians’ Choice of Place of Surgery
Most administrators and physicians at ACE sites anticipated that the demonstration would have a positive effect on patient volume and cited volume increases as a motivation to participate in the demonstration. During interviews and focus groups towards the end of the demonstration, administrators and physicians at the ACE sites generally thought that the demonstration had not increased the volume of ACE procedures. While in some cases individual sites noted increases or decreases in volume during the demonstration, the changes were attributed to circumstances unrelated to the demonstration. The quantitative analysis found that the ACE Demonstration did not have an impact on the ACE inpatient volume of procedures at ACE sites, except for ACE defibrillator procedures (increase) and ACE pacemaker procedures (decrease). Non-demonstration treatment sites were not affected by the demonstration. Regarding the volume for PAC in any settings and skilled nursing facility use, overall the demonstration did not affect the quarterly volume for the ACE or ACE-related procedure groups at the ACE sites or the non-demonstration treatment sites. This is consistent with the lack of effect of the demonstration on the Medicare expenditures for PAC settings following an inpatient stay. For home health use, the pattern of the changes in volume was similar to that of the overall impact of the inpatient volume, but the large increase in home health use for ACE orthopedic procedures may be explained by a push, as a result of the demonstration, for orthopedic services to decrease length of stay. The overall market share of the ACE sites showed a stable pattern for ACE procedures. The analysis of within-hospital distribution of services showed no statistically significant shifting across ACE and ACE-related cardiovascular procedures overall; however, a statistically

IMPAQ International, LLC Page 8 Evaluation of Medicare ACE Demonstration May 31, 2013 Final Evaluation Report
significant shift occurred from ACE-related orthopedic procedures to ACE orthopedic procedures within ACE sites. Based on interviews with staff and administrators, this finding can be explained by the fact that the ACE sites generated the largest savings on orthopedic implants and other materials and equipment used in orthopedic procedures, due to negotiations with vendors. Furthermore, physicians participating in the demonstration, on average, performed more ACE procedures at the ACE sites than at the non-demonstration treatment sites post-demonstration, in all procedure groups. The site-specific analyses revealed that these global impacts masked site-specific heterogeneity in the effects. ACE Implementation Lessons and Recommendations for Future Bundled Payment Initiatives Based on the evidence of the ACE site visits and the quantitative findings, it can be concluded that the factors that facilitated implementation of ACE were (a) involvement of physicians early in the design and implementation of ACE; (b) greater transparency of quality and cost data, particularly through physician report cards; (c) standardized order sets, which were developed in collaborative efforts between administrators and physicians and which enhanced quality of care and increased physician and staff satisfaction; (d) collaborative effort by administrators and physicians to identify quality, cost-effective, implants and devices, which allowed materials managers and physicians to negotiate reduced prices; and (e) use of patient navigators to help bridge gaps in care coordination, particularly in high-volume service areas. There were some positive and adverse unintended consequences of the implementation of ACE. While the evaluators did not anticipate an extension of ACE-related features to non-ACE DRGs and markets, some successful and easily transferable ACE-inspired initiatives (such as vendor negotiations, standardized order sets, and standardized materials and procedures) influenced quality and coordination efforts in ACE-related and other DRGs, as well as other health care markets (such as Medicare Advantage and private insurance). Hospitals, however, did not attract more patients as a result of financial incentives, because patients were mostly unaware of the ACE Demonstration and did not prioritize financial incentives like Medicare shared savings when choosing a hospital. This finding is consistent with past bundled payment demonstrations. There was a negative impact on one of the outcome measures, the use of internal mammary artery (IMA) grafts in patients undergoing CABG surgery. Under the incentive to reduce cost (or operating room time), surgeons may have moved away from a technically more complex approach, but one that has been shown to improve outcomes. However, the evaluation did not find negative effects across the other procedures. Although negotiations with vendors of materials and implants was found to produce the greatest cost savings, the effect of negotiated cost reductions waned over time. Increases in patient volume and reductions in length of stay may help to generate other cost savings. The following recommendations emerged from the ACE Demonstration and may be applicable to future bundled payment initiatives:

IMPAQ International, LLC Page 9 Evaluation of Medicare ACE Demonstration May 31, 2013 Final Evaluation Report
Sites desired more involvement and support from CMS, such as technical assistance and support with marketing efforts, to increase patient volume and market share. CMS may wish to consider additional or alternative strategies to assist sites to market the program to potential beneficiaries, especially through primary care providers.
Administrators and physicians suggested that to increase patient volume, a greater variety of incentives, financial and other types, should be identified. Further, CMS could consider extending incentives to primary care physicians or referring physicians, since they often drive where beneficiaries go to receive health care services.
Non-physician staff expressed a desire to be more engaged in the planning and implementation phases of ACE, as well as eligible to receive incentives for the achievement of cost and quality goals. CMS may wish to examine mechanisms for encouraging sites to extend incentives to non-physician staff.
Stakeholders faced continued challenges with billing and payment procedures as a result of new demonstration processes that required manual processing of claims and thus significant resource use. For future bundled payment demonstrations, CMS could examine how to simplify billing and payment procedures through streamlined electronic processes.

IMPAQ International, LLC Page 10 Evaluation of Medicare ACE Demonstration May 31, 2013 Final Evaluation Report
CHAPTER I: INTRODUCTION, DATA, AND METHODS

IMPAQ International, LLC Page 11 Evaluation of Medicare ACE Demonstration May 31, 2013 Final Evaluation Report
1. ACUTE CARE EPISODE DEMONSTRATION AND SITES
1.1. The Medicare Acute Care Episode (ACE) Demonstration The Medicare ACE Demonstration, a 3-year demonstration project funded by the Centers for Medicare & Medicaid Services (CMS), used a global payment for a single episode of care as an alternative approach to payment for service delivery under traditional Medicare fee-for-service (FFS). The episode of care was defined as the bundle of Part A and Part B services provided to Medicare FFS beneficiaries during an inpatient stay for included Medicare Severity Diagnosis-Related Groups (MS-DRGs), specifically, Cardiac Valve and Other Major Cardiothoracic Valve (valve), Cardiac Defibrillator Implant (defibrillator), Coronary Artery Bypass Graft (CABG), Cardiac Pacemaker Implant or Revision (pacemaker), Percutaneous Coronary Intervention (PCI), and Hip or Knee Replacement or Revision (hip/knee). The specific goals of the demonstration were (1) to improve the quality of care; (2) to increase collaboration among providers and health systems; and (3) to reduce Medicare payments for acute care services by using market mechanisms. Among the market mechanisms employed were an innovative payment model and organizational and contractual arrangements to provide certain cardiovascular and orthopedic services. In addition to the bundled payment for a single episode of care, the implementation and success of the ACE Demonstration centered on several features: enhanced coordination of care, cost-control incentives, adoption of standardized clinical protocols and quality improvement activities, shared savings from Medicare with beneficiaries,1 and gainsharing between physicians and facilities. Gainsharing, or provider incentive programs, allow physicians and hospitals to receive a share of the savings that result from implementing and coordinating improvements in efficiency and quality.2 Between April 2009 and November 2010, five ACE sites began implementing the demonstration: Baptist Health System (BHS), Oklahoma Heart Hospital (OHH), Hillcrest Medical Center (HMC), Lovelace Health System (LHS), and Exempla Saint Joseph Hospital (ESJH). In November 2011, LHS expanded the type of procedures included in its demonstration, by adding cardiovascular services to the orthopedic service line. Each participating site, and, in some instances, each facility within the participating health system, developed individualized innovations that affected how the ACE site provided services, coordinated health care, marketed to physicians and beneficiaries, and distributed savings between the hospital and its physicians.
1.2. ACE Participating Sites The remainder of this chapter profiles the ACE sites, using information gathered from their ACE bid applications, the quarterly site reports prepared by the site liaisons, onsite communications,
1 CMS shared up to 50 percent of the Medicare savings in the form of payments to beneficiaries to offset their Medicare cost-
sharing obligations. Such payments to beneficiaries cannot exceed their annual Part B premium amount. 2 https://www.cms.gov/DemoProjectsEvalRpts/downloads/ACEProviGainsRules.pdf

IMPAQ International, LLC Page 12 Evaluation of Medicare ACE Demonstration May 31, 2013 Final Evaluation Report
site data extract charts, and materials collected during site visits in 2010/2011 and 2012. Each ACE site proposed different strategies and programs in its ACE application. Compiling and comparing the proposed features with the actual characteristics of the site programs allowed for a better assessment of both the qualitative findings from the interviews and focus groups, and the quantitative results from the Medicare claims data. In the following section, we present individual site profiles and then summarize and compare the characteristics of the participating sites.
1.2.1. Baptist Health System
Baptist Health System (BHS), in San Antonio, Texas, consists of five hospitals/facilities and has 48 percent of its market (see Exhibit 1). BHS’s primary service area, from which 60 percent of its inpatient discharges originate, encompasses 27 zip codes, with a population of 913,676. The secondary service area encompasses 48 surrounding zip codes, accounting for another 20 percent of inpatient discharges. According to the 2005 Dartmouth Atlas of Health Care, there are 9 other acute care hospitals within BHS’s hospital service area and 23 other acute care hospitals within its hospital referral region.3
Exhibit 1: Baptist Health System Quick Facts
Demonstration Start Date June 1, 2009
Procedure Types Orthopedic, cardiovascular
Number of ACE Facilities 5
Number of ACE Cases Orthopedic: 2,385; cardiovascular: 3,394 as of 1/31/13
BHS Internal Cost Savings on ACE DRG Procedures
(figures provided by site)*
Orthopedic: $6.1 million; cardiovascular: $4.6 million as of 1/31/13
Relevant Site Organizational Features
Joint Commission accreditation (orthopedic joint replacement)
*Data extract charts were administered to the sites in February 2013, which elicited information on estimated ACE-generated internal cost savings.
Sources: Demonstration site applications (2008), site visits (2012), and data extract charts (2013).
In its ACE application, BHS proposed a 2.5 percent discount on the Part A component of all MS-DRGs included in the demonstration. BHS intended to absorb the entire CMS discount so that physicians would not be inclined to leave BHS for other hospitals. This measure was also intended to encourage physicians to improve efficiency and increase referrals to BHS. BHS proposed that physicians be paid from the CMS ACE bundled payments at 100 percent of the Medicare Part B physician fee schedule (MFS). The BHS central office managed ACE policies and
3 The hospital referral region (HRR) is defined by the Dartmouth Atlas of Health Care as the regional market area for tertiary medical care that contains at least one hospital that performs major cardiovascular procedures and neurosurgery: Dartmouth Atlas of Health Care, 2012. Dartmouth Institute for Health Policy & Clinical Practice. http://www.dartmouthatlas.org/tools/glossary.aspx. Accessed March 1, 2013.

IMPAQ International, LLC Page 13 Evaluation of Medicare ACE Demonstration May 31, 2013 Final Evaluation Report
procedures across the five facilities, with input and involvement from the facility- and system-wide executive teams. BHS involved physicians in the PAACE (Physician’s Alliance for ACE) board, a committee of physicians with privileges at the health system who represented their colleagues. The PAACE board managed ACE-related issues and developed and set policies on physicians’ quality metrics, dispute resolution, and gainsharing. The board also approved all clinical pathways, reviewed and approved the use of medical devices and technology, negotiated vendor agreements, and reviewed performance and financial measures monthly. A small group of physicians played a large role in “championing” and establishing the demonstration at BHS, encouraging physicians’ participation and support. During the demonstration, BHS instituted special case managers, called patient navigators, whose role was to respond to ACE patient needs and to identify ACE-eligible patients for billing purposes. The patient navigators also had administrative responsibilities such as tracking the admissions of patients receiving ACE procedures and verifying whether the patients were eligible to be included in the demonstration. The physicians at BHS practice and perform procedures primarily at one location. None of the physicians are employed by BHS; rather, they are paid according to the Medicare Part B physician fee schedule (MFS). Certain physicians who had performed a high volume of ACE procedures volunteered for positions on the hospital PAACE board and other committees that were developed to discuss and review ACE issues. At BHS, gainsharing was paid only when a facility and the practicing physicians (on a case-by-case basis) met quality standards and cost savings. 1.2.2. Oklahoma Heart Hospital
The Oklahoma Heart Hospital (OHH) is located in Oklahoma City, Oklahoma (see Exhibit 2).More than 60 percent of OHH’s patients are Medicare beneficiaries. Currently, OHH’s hospitalservice area includes 7 other acute care hospitals, and its hospital referral region includes 53other acute care hospitals. The facility’s organizational structure consists of approximately 60cardiovascular physician employees who own the hospital in partnership with the Sisters ofMercy Health System. Seventy-five percent of the physician members are affiliated withOklahoma Cardiovascular Associates, an umbrella physician group that refers patients to thefacility from rural practices. On average, 3,000 to 4,000 cardiovascular procedures areperformed at OHH annually, of which 60 percent are for Medicare patients.

IMPAQ International, LLC Page 14 Evaluation of Medicare ACE Demonstration May 31, 2013 Final Evaluation Report
Exhibit 2: Oklahoma Heart Hospital Quick Facts
Demonstration Start Date January 1, 2010
Procedure Types Cardiovascular
Number of ACE Facilities 1
Number of ACE Cases 5,968 (cardiovascular) as of 11/30/12
OHH Internal Cost Savings on ACE DRG Procedures (figures provided by site)
Not available
Relevant Site Organizational Features
Physicians are employees and owners
Sources: Demonstration site applications (2008), site visits (2012), and data extract charts (2013).
The proposed overall discount to CMS for all ACE cardiovascular MS-DRGs was 0.9 percent for Part A and 1 percent for Part B. OHH suggested that physician ownership of the facility would play a role in physicians’ awareness of efficiency and cost savings. OHH’s goals, as laid out in its demonstration application, included “greater standardization, lower acquisition pricing, and monitoring of appropriate utilization.” OHH also planned to increase its patient volume in a cost-effective manner without loss of quality. Increased volume was to be achieved by aggressively marketing the demonstration and promoting participation. The demonstration leadership team was composed of the hospital chief financial officer, hospital chief operating officer/chief nursing officer, and the physician group chief operating officer. The demonstration served as a catalyst in the creation of new physician leadership positions and physician-staffed committees to manage OHH physicians participating in the demonstration. The leadership positions and committees represented the interests of physicians and provided input into decisions related to the delivery of care as part of the demonstration. Areas addressed by the committees included quality of care, cost and procedural efficiency, and improving the overall experience of patients and physicians. In 2010, soon after the demonstration began, independent physicians practicing at OHH became OHH hospital employees. A core group of 30 to 40 physicians (cardiologists, cardiovascular surgeons, and vascular surgeons) are responsible for the majority of OHH patient admissions. Physicians’ productivity is measured by the relative value unit (RVU) assigned to each procedure code and CMS RVU weights are used. Physicians are salaried but receive RVU credit for the services provided to patients. The hospital receives the Part B payment and then redistributes the RVU credit into the physicians’ salaries. 1.2.3. Hillcrest Medical Center
Hillcrest Medical Center (HMC) is the hub of the Hillcrest Healthcare System (see Exhibit 3). It was the first hospital founded in Tulsa, Oklahoma, and has been in operation for more than 90

IMPAQ International, LLC Page 15 Evaluation of Medicare ACE Demonstration May 31, 2013 Final Evaluation Report
years. More than one million people reside in HMC’s service area. There are 6 other acute care hospitals in HMC’s hospital service area and 34 other acute care hospitals within its hospital referral region.
Exhibit 3: Hillcrest Medical Center Quick Facts
Demonstration Start Date May 1, 2009
Procedure Types Orthopedic, cardiovascular
Number of ACE Facilities 1
Number of ACE Cases Orthopedic: 1,343 as of 12/31/12; cardiovascular: 2,069 as of 4/30/12
HMC Internal Cost Savings on ACE DRG Procedures (figures provided by site)
Orthopedic: $818,217 as of 9/30/12; cardiovascular: $996,389 as of 4/30/12
Relevant Site Organizational Features
Oklahoma Heart Institute (new facility); pursuing Joint Commission accreditation (orthopedic joint replacement); cardiovascular physicians are employees
Sources: Demonstration site applications (2008), site visits (2012), and data extract charts (2013).
Ardent Health Services owns and operates HMC (and another ACE site—Lovelace Health System in Albuquerque). HMC proposed to reimburse physicians at 100 percent of the Part B fee schedule. Both the cardiovascular and orthopedic bids provided a weighted average 4.4 percent discount to CMS. HMC planned to offset the discount by decreased physician use resulting from increased efficiency in the operating room. The proposed gainsharing plan was to pay up to 50 percent of savings to physicians. Staff from Ardent Health Services oversaw a number of ACE administrative activities: financial transactions, billing processes, relationships with physicians, and coordination of ACE strategies and efforts among key executives and leadership staff. Local staff members included the materials manager, the marketing director, and an ACE case manager. The materials manager was instrumental in negotiating with vendors of implants and equipment used in ACE procedures. The marketing director shaped the advertising campaign at HMC and managed the ongoing physician-led seminars, which were an HMC outreach strategy. HMC created a new, dedicated ACE case manager position to identify ACE cases at the start of the patient’s visit. The case manager tracked the admissions of patients receiving ACE procedures and verified their eligibility for inclusion in the demonstration. HMC underwent a major change to its organizational structure just before the first year of the demonstration. The new Oklahoma Heart Institute, which is part of Hillcrest Medical Center, opened in March 2009; HMC’s cardiovascular physicians came under contract with the institute and became employed staff, though some physicians also maintained privileges at other hospitals. The employee status of the cardiovascular physicians at HMC affected certain aspects of the demonstration, such as gainsharing and the hospital-physician relationship. All ACE physicians—including the employed cardiovascular physicians—were reimbursed at 100

IMPAQ International, LLC Page 16 Evaluation of Medicare ACE Demonstration May 31, 2013 Final Evaluation Report
percent of MFS. The cardiovascular physicians’ gainsharing funds were redistributed to the department rather than to individual physicians as was initially proposed. Most of HMC’s ACE orthopedic procedures were performed by one orthopedic surgeon, and orthopedic physicians received individual gainsharing payments on ACE procedures. 1.2.4. Lovelace Health System Lovelace Health System (LHS), in Albuquerque, New Mexico, consists of four facilities that serve the city and much of the state (see Exhibit 4). The HRR extends throughout the state and even into neighboring states, but LHS’s primary service area consists of two counties. One of the LHS facilities is a rehabilitation hospital and was not eligible to participate in ACE. Two-thirds of the general adult medical/surgical beds are located at Lovelace Medical Center; the rest are at Lovelace Women’s Hospital and Lovelace Westside Hospital.
Exhibit 4: Lovelace Health System Quick Facts
Demonstration Start Date November 1, 2010
Procedure Types Orthopedic and cardiovascular DRGs in 2011 (expanded in 2012)
Number of ACE Facilities 3
Number of ACE Cases 448 as of 3/5/13
LHS Internal Cost Savings on ACE DRG Procedures (figures provided by site)
$312,079 as of 9/30/12
Relevant Site Organizational Features
Independent management at facility level
Sources: Demonstration site applications (2008), site visits (2012), and data extract charts (2013).
LHS proposed to meet ACE goals through a capitated pricing model on implants to reduce costs, and a marketing strategy to draw in the expanding Medicare-aged population of New Mexico and surrounding states. LHS anticipated a 25 percent increase in volume for ACE orthopedic DRGs. The overall discount to CMS for all ACE DRGs was 3 percent for Part A and 3.3 percent for Part B. The administration of the demonstration was mostly performed remotely through the Ardent corporate office (the same staff that managed the HMC site). Other management functions were decentralized across the three participating ACE sites at the discretion of the executives and administrators on site. Staff members with significant involvement in ACE included the leadership at each hospital site. Unlike the other ACE site with multiple facilities (BHS), each participating LHS facility created and implemented its own protocols in coordination with local physicians. However, during the second year of the demonstration, the LHS facilities began working together to develop standard protocols and policies.

IMPAQ International, LLC Page 17 Evaluation of Medicare ACE Demonstration May 31, 2013 Final Evaluation Report
LHS’s application emphasized patient education as a method to improve the quality of care. This intention was realized in the development of the Pre-hab program, a presurgery education program for patients to learn about their procedures and requisite rehabilitation prior to surgery. Most ACE orthopedic physicians who perform procedures at LHS facilities belong to one of the two dominant physician practices in Albuquerque, and are not employees of the hospital. At the start of the demonstration, several orthopedic surgeons retired. In addition, a few physicians opted out of receiving gainsharing from their ACE procedures for a variety of reasons. In November 2011, LHS expanded the demonstration to include cardiovascular services. Except for one low-volume cardiovascular physician, ACE cardiovascular physicians who perform procedures at LHS facilities are not employees of the hospital. All physicians at LHS are paid according to the Medicare fee schedule. 1.2.5. Exempla St. Joseph Hospital Exempla St. Joseph Hospital (ESJH), in Denver, Colorado, has a primary service area of seven counties. The hospital service area includes 6 acute care hospitals; the hospital referral region includes 32 other acute care hospitals (see Exhibit 5).
Exhibit 5: Exempla St. Joseph Hospital Quick Facts
Demonstration Start Date November 1, 2010
Procedure Types Cardiovascular
Number of ACE Facilities 1 (part of a 3-hospital system)
Number of ACE Cases 20 cardiovascular as of 9/1/11
ESJH Internal Cost Savings on ACE DRG Procedures (figures provided by site)
$112,126 as of 9/30/11 (across all hospital patients in the DRG)
Relevant Site Organizational Features
Cardiovascular physicians are employees; predominantly managed care hospital
Sources: Demonstration site applications (2008), site visits (2012), and data extract charts (2013).
ESJH proposed a 5 percent discount on Part A fees. ESJH reimbursed physicians at 100 percent of MFS from the ACE bundled payments. Any cost savings from the program first offset the 5 percent discount taken from Part A fees. Physicians received 50 percent of the cost savings in excess of the 5 percent discount from average Part A fees. The ACE manager administered the ACE Demonstration at the Cardiac & Vascular Institute in collaboration with the senior clinical director and the institute’s two medical directors. The ACE manager’s responsibilities included administrative activities such as liaising with the ACE patient

IMPAQ International, LLC Page 18 Evaluation of Medicare ACE Demonstration May 31, 2013 Final Evaluation Report
navigator, maintaining relationships with cardiovascular surgeons and cardiologists, and communicating with the financial and billing teams. In general, physicians and administrative staff were involved in the day-to-day management of ACE; senior-level administrators oversaw the demonstration. Early in the demonstration, ESJH made some changes to its implementation of ACE. In July 2011, less than a year after the start of the demonstration, a new cardiologist group practice was hired to replace the private cardiology practice that was in place at the start of the demonstration. In addition, ESJH employed four cardiovascular surgeons who performed the majority of ACE procedures at the hospital. The cardiovascular surgeons are salaried, in keeping with ESJH’s procedures for paying all employed physicians. In addition to their regular salaries, they were eligible to receive gainsharing. Similar to HMC, cardiovascular surgeons were reimbursed at 100 percent of MFS.
1.3 Comparison of ACE Sites Features Exhibit 6 shows a comparison of site features related to the ACE Demonstration since its inception at each site. BHS has performed the most ACE orthopedic procedures to date (2,385), and OHH has performed the most ACE cardiovascular procedures (3,394). Each of the hospitals participated in a gainsharing offer of 50 percent of calculated cost savings to participating physicians. Following CMS guidelines on savings, payments to physicians at BHS, HMC, and LHS did not exceed 25 percent of the amount that is normally paid to physicians for such cases. BHS, HMC, LHS, and ESJH have paid out gainsharing to participating physicians. The average amount at BHS was about $350 per case. The average at HMC was $320 for cardiovascular procedures and $390 for orthopedic procedures. The average amount at LHS was $303 and the average at ESJH was $597.
Of the cardiovascular demonstration sites, BHS proposed the highest cardiovascular weighted discount. HMC proposed the highest orthopedic weighted discount. The Part A discount at OHH was quite small in comparison with the other four sites. However, at all sites physicians were reimbursed at 100 percent of MFS. The cost savings to date on ACE DRG procedures (as estimated by the sites) differ widely among the sites. This may be due in part to the different lengths of time that the sites have been participating in the demonstration and their initial market for these procedures. The sites with longer participation (BHS, OHH and HMC) and higher volume have had the largest internal savings. In a 2013 questionnaire administered by the research team, BHS estimated that it had savings of $4.6 million from ACE cardiovascular procedures and $6.1 million from orthopedic procedures through January 31, 2013. HMC estimated its savings from cardiovascular procedures as $996,389 and from orthopedic procedures as $818,217. LHS had relatively small cost savings ($312,079) from a relatively small number of orthopedic procedures. ESJH estimated small cost savings ($112,126) on ACE cardiovascular procedures for the first 11 months of the demonstration. The ACE sites indicated that savings were generally the result of negotiations with vendors.

IMPAQ International, LLC Page 19 Evaluation of Medicare ACE Demonstration May 31, 2013 Final Evaluation Report
Exhibit 6: Comparison of ACE Site Features
Features BHS OHH HMC LHS ESJH
ACE Orthopedic Procedures to Date
2,385 (43 months)
N/A 1,343
(44 months) 448
(28 months) N/A
ACE Cardiovascular Procedures to Date
3,394 (43 months)
5,968 (35 months)
2,069 (36 months)
N/A* 20
(10 months)
ACE Physicians Employed by the
Site
Cardiologists; one orthopedic oncologist
Cardiologists; cardiovascular
surgeons
Cardiologists; cardiovascular
surgeons N/A
Cardiologists; cardiovascular
surgeons
Types of ACE Physicians Eligible
for Gainsharing
Orthopedists; cardiologists; cardiothoracic
None
Cardiovascular surgeons;
orthopedic surgeons
Orthopedic surgeons
Cardiovascular surgeons
Percentage Gainsharing
Agreement with Physicians
50% of calculated cost savings,
capped at 25% of Medicare Part B
Allowable
None
50% of calculated cost savings, capped
at 25% of Medicare Part B
Allowable
50% of calculated cost savings, capped
at 25% of Medicare Part B
Allowable
50% of calculated cost savings, capped
at 25% of Medicare Part B
Allowable
Percentage of Eligible Physicians
Who Have Received ACE Gainsharing
Just over 50% of eligible physicians
N/A 100% 91% of eligible
orthopedic surgeons
100%
Average Dollar Amount of Physician
Gainsharing
$1,275/month/ physician
$350/case
N/A
$320/ cardiovascular
case
$390/ orthopedic case
$303/physician $597/physician
Part A Discount
Cardiovascular: 8.25%;
orthopedic: 2.5% 0.9% 4.4% 3.0% 5%
Part B Discount
0.0% 1.0% 4.4% 3.3% 0.0%
Site Internal Cost Savings on ACE DRG
Procedures (Cardiovascular)
$4.6 million (43 months)
$0 (35 months)
$996,389 (36 months)
N/A $112,126
(11 months)
Site Internal Cost Savings on ACE DRG
Procedures (Orthopedic)
$6.1 million (43 months)
N/A $818,217
(41 months) $312,079
(22 months) N/A
Sources: Demonstration site applications (2008), site visits (2012), and site data extract charts (2013). *DRG area not part of analysis due to delay in start-up. Note: LHS adopted ACE cardiovascular procedures in 2012. These LHS procedures were not included for evaluation purposes.

IMPAQ International, LLC Page 20 Evaluation of Medicare ACE Demonstration May 31, 2013 Final Evaluation Report
2. METHODS, COMPARISON GROUPS, AND DATA DEVELOPMENT Two types of information were used in the evaluation: qualitative, derived from an analysis of key informant interviews and focus groups, and quantitative, derived from an analysis of Medicare claims data and quality of care measures.
2.1. Qualitative Analysis 2.1.1. Qualitative Methodology Qualitative data were derived from interviews and focus groups with the staff implementing ACE (e.g., physicians, nurses, and other ancillary/support staff) and Medicare beneficiaries who received a qualifying procedure at an ACE-participating hospital. Discussions focused on the decision to participate in the demonstration, expectations of ACE, new or revised initiatives developed for ACE, and the effect of ACE on factors such as quality of care, patient volume, incentives, satisfaction, and Medicare cost savings. The qualitative evaluation included two rounds of visits to each site: one during the initial stages of the demonstration (in the first year of site implementation) and one during the final stages of the demonstration (in the second or third year). Due to a low volume of ACE-related DRGs throughout the demonstration, only the first site visit was conducted at Exempla Saint Joseph Hospital (ESJH). Coordination and preparation for the visits included (1) selection of interview and staff focus group participants, (2) recruitment of beneficiaries for focus groups, (3) development of the discussion guides, and (4) onsite data collection. ACE site liaisons played a critical role in the site visit logistics and the recruitment of key informants for the interviews and focus groups. 2.1.2. Qualitative Research Domains The purpose of the qualitative evaluation was to explore the opinions, attitudes, and beliefs of individuals who were directly involved in the implementation and management of the ACE Demonstration, or were affected by it. The research questions were developed for the key areas of the demonstration, which included quality of care, cost reductions and savings, influence of financial incentives on beneficiaries and physicians, effects on the volume of demonstration procedures, changes in facility infrastructure and organization, and satisfaction of stakeholders. Responses were meant to assess the impact of the demonstration and to make decisions about the feasibility of future bundled payment efforts for each of the research domains. Quality and Coordination of Care. Questions on quality of care highlighted the types of quality strategies and monitoring and reporting tools devised by each demonstration facility to improve quality throughout the demonstration. In particular, the responses from key stakeholders were compared to the ACE Demonstration’s stated goals to understand how sites

IMPAQ International, LLC Page 21 Evaluation of Medicare ACE Demonstration May 31, 2013 Final Evaluation Report
originally intended to meet—and then met or attempted to meet—these objectives. The respondents were asked if they had observed any changes or improvements in the quality of care and what benchmarks were used in this assessment. Medicare Costs and Savings. Questions focused on the particular types of cost-saving strategies implemented at the sites. These questions were valuable in determining which strategies have potential for future implementation and how administrators have had to adapt to meet demonstration goals. Volume, Concentration, and Spillover Effects. Questions pertaining to volume helped ascertain whether facility administrators anticipated increases in volume and market share, to what extent the demonstration affected the hospital market, and whether volume expectations affected the development of marketing plans. Opinions on observed changes in volume were key to determining whether administrators believed that these changes were directly related to the demonstration. Finally, stakeholders discussed the strategies that were developed to produce the desired outcomes and to address any unintended consequences of changes in volume. Questions pertaining to spillover effects sought to understand the effect of the demonstration on other components of the health care delivery system in the market where the demonstration was implemented, such as other providers and practices, other hospitals, and post-acute care providers. Questions pertaining to market concentration helped ascertain whether the demonstration changed the volume distribution of services for the participating sites between DRGs that were included in the demonstration and those that were not. Incentives. Gainsharing incentives for physicians and shared savings payments for beneficiaries were unique features of the ACE Demonstration. Research questions were targeted to determine how administrators, physicians, non-physician staff, and beneficiaries perceived these incentives, whether there were any implementation challenges, and whether administrators created any new incentives after the first year of the demonstration. Infrastructure and Organization. Questions were targeted to changes to the infrastructure and the organizational structure resulting from the demonstration. Respondents were asked about the implementation of the demonstration, staffing changes, new policies and procedures, and the overall effect of the demonstration on staff roles and responsibilities. In particular, the evaluators wanted to know which procedures were in place prior to the demonstration and how staff were encouraged to comply with new demonstration mandates. These questions also provided insight into whether administrators viewed the demonstration as improving or changing the status quo. The evaluation team also inquired about whether additional staff were hired or new positions created to support changes introduced by the demonstration. Satisfaction. These questions sought to gauge whether administrators, physicians, and non-physician staff were satisfied with the strategies implemented as part of the demonstration, such as changes to infrastructure and the organization, the quality and coordination of care, the

IMPAQ International, LLC Page 22 Evaluation of Medicare ACE Demonstration May 31, 2013 Final Evaluation Report
incentive system, Medicare costs and savings, and volume. These questions also assessed whether beneficiaries were satisfied with the care they received during the demonstration and whether they had seen changes in the standards of care compared with previous hospital interventions. Exhibit 7 lists the research domains and a sample of the questions addressed in the quantitative analyses and the qualitative evaluation. The specific OMB-approved questions asked during the first and second round site visits aligned with the research domains are listed below.
Exhibit 7: Research Domains and Sample Research Questions with Emphasis on Qualitative Data
Research Domain Research Questions
Medicare Cost Savings
Do actual changes in service provision (e.g., length of stay, discharge patterns) affect total service costs and, thus, potential savings from the demonstration? What were the effects on home health, skilled nursing facilities, and other post-acute care facilities?
Did competitive bidding affect sites’ ability to adopt changes, particularly in volume and costs?
Incentives
If there was gainsharing, what proportion of savings was paid to physicians? What proportion was retained by the facility?
Did physicians act in accordance with cost-control incentives? Did beneficiaries act in accordance with their incentives?
Quality of Care What was the impact of the demonstration on the selected quality of care measures?
Volume, Concentration, and
Spillover Effects
Did financial incentives impact beneficiary provider choice and provider referrals?
Infrastructure and Organization
Did the demonstration impact the locus of care in demonstration sites (e.g., proportion of hospital stays in high-intensity care settings, number of diagnostic tests)?
Were there any changes at the site that were designed to facilitate the demonstration, including improving coordination of care (physicians, facility staff, and managers)?
Were there any changes in medical care staff participation in quality and cost-reduction initiatives?
Satisfaction
Were beneficiaries satisfied with the care they received during the demonstration?
Were facility staff, managers, and physicians satisfied with demonstration strategies?
What refinements of the demonstration design and parameters are suggested by the results of the demonstration?

IMPAQ International, LLC Page 23 Evaluation of Medicare ACE Demonstration May 31, 2013 Final Evaluation Report
2.1.3. Key Informants and Focus Groups With the help of the site liaisons, the evaluation team selected participants for in-depth interviews among the following stakeholders: executive staff, including chief financial officers, chief executive officers, and chief medical officers; management staff, such as nurse managers, ACE managers, materials managers, business office managers, and marketing directors; physician-hospital association leaders; and other non-physician staff such as floor nurses and case management staff. At some sites where there were highly active physicians or nurse leaders, the evaluation team asked these professionals to participate in interviews. At sites with multiple facilities, such as BHS and LHS, the evaluators conducted in-depth interviews with staff at both the system and facility levels. In addition to interviews, the evaluator team held focus groups to understand the experiences and perspectives of three target audiences: (1) ACE physicians; (2) non-physician staff such as nurses, physical therapists, and case managers; and (3) Medicare beneficiaries who underwent ACE procedures. To recruit beneficiaries, the evaluation team first obtained from the site liaisons or the ACE implementation contractor a list of beneficiaries who had recently undergone an ACE procedure. From the list, the team selected a sample based on beneficiaries’ proximity to the hospital, excluding those who resided out of state or outside the hospital referral area. Next, the evaluation team sent letters from CMS and IMPAQ to the potential participants approximately one month prior to the site visit. The CMS letter was used to demonstrate authenticity and to encourage beneficiaries to participate in the focus groups. The IMPAQ letter indicated the purpose of the focus groups and provided some logistical details. As beneficiaries agreed to participate, we maintained a profile report spreadsheet of participants for each session. 2.1.4. Discussion Guides The evaluation team created interview and focus group moderator guides to concentrate discussion on the research domains and to address the overarching research questions listed in Exhibit 7. The moderator guides were developed in accordance with Office of Management and Budget (OMB) requirements and approved by CMS and OMB before implementation.4 The guides were customized for each audience to best obtain their unique perspectives and experiences. The topic areas covered in the guides, except for the beneficiary guides, included:
Decision to participate
Expectations of ACE
4 The OMB-approved questions are available at:
http://www.cms.gov/Regulations-and-Guidance/Legislation/PaperworkReductionActof1995/PRA-Listing-Items/CMS1236230.html

IMPAQ International, LLC Page 24 Evaluation of Medicare ACE Demonstration May 31, 2013 Final Evaluation Report
Marketing strategies
New or revised ACE initiatives developed in the areas of infrastructure, cost savings, quality, and coordination of care
Effectiveness of financial incentives
Satisfaction
Effect of ACE implementation. The beneficiaries were asked slightly different questions based on their perspective on the demonstration and their role. The focus group guide centered on ways in which beneficiaries learned about the demonstration, marketing efforts, the effectiveness of financial incentives, and satisfaction with the quality of care at the facility. 2.1.5. Initial Site Visits The focus groups and interviews conducted during the initial site visits emphasized the planning and implementation aspects of the demonstration, changes made in response to the demonstration, perceptions of how the demonstration affected services and care, how incentives operated, and satisfaction. The goal of the first site visit interviews conducted with key administrators was to determine what earlier initiatives may have existed at the facilities, whether those initiatives would affect or interfere with demonstration goals, and the effect they may have had on the decision to participate in the demonstration. In a series of focus groups held in the initial phases of the demonstration, physicians and non-physician staff discussed the early effects of the ACE Demonstration on clinical protocols and guidelines, and changes directly attributable to the demonstration. The evaluation team asked participants to describe changes to the infrastructure and organization of the facility that they attributed to the demonstration, and whether they had observed changes in the volume of demonstration procedures. Physicians who had privileges at other hospitals shared their insights regarding why they chose or declined to perform ACE procedures at the demonstration facility. Physicians provided feedback on gainsharing and other incentive policies. In addition, non-physician staff shared their impressions on how the demonstration had affected the quality of patient care, coordination of care between staff and physicians, length of stay, and services provided. Beneficiary focus groups reflected on their individual acute-care experience. Areas of focus included the effects of marketing the demonstration, the effect of the shared savings payment distributed to Medicare beneficiaries, and beneficiary satisfaction with the quality of care and other services at the facility. 2.1.6. Second-Round Site Visits In the second site visit, the evaluation team sought to understand how the sites had evolved with respect to incentives and incentive structures, provision and coordination of care,

IMPAQ International, LLC Page 25 Evaluation of Medicare ACE Demonstration May 31, 2013 Final Evaluation Report
efficiency and cost-saving strategies, marketing, and changes in patient volume since the last site visit or over the previous 12 months. Focus group participants and interviewees also discussed the extent to which the demonstration met their expectations and how satisfied they were with the experience. They described strategies implemented to achieve demonstration goals, significant avoidable challenges, and assumptions that may not have withstood actual implementation. The physician and non-physician staff focus groups emphasized how the demonstration had evolved and changed regarding incentives and incentive structures, provision and coordination of care, development of algorithms to reduce utilization or length of stay, efficiency and cost-saving strategies, marketing, quality of care, and patient volume. Topics for the focus groups with beneficiaries included the effects of marketing the demonstration, the effects of financial incentives, and beneficiary satisfaction with the quality of care at the facility. 2.1.7. Data Collection
In total, the evaluation team conducted 86 interviews and 37 focus groups (10 with physicians, 12 with non-physician staff, and 15 with beneficiaries) (see Exhibit 8).
Exhibit 8: ACE Site Visits by Location, Date, and Data Collection Mechanism
Site Date Focus Groups Interviews
Hillcrest Medical Center
April 27–28, 2011 5 9
May 29–June 1, 2012 6 9
Baptist Health System April 4–7, 2011 9 18
May 15–17, 2012 6 10
Oklahoma Heart Hospital
April 26, 2011 3 5
August 2–3, 2012 3 6
Lovelace Health System
August 22–24, 2011 3 15
September 13–14, 2012 2 14
Total 37 86
Once on site, an experienced moderator conducted the interview and focus group sessions. The sessions were audio-recorded and a note-taker kept records of the discussions. For each session, participants were made aware of the ground rules, assured that their responses would be kept private, and given the OMB clearance number (0938-1117). The interviews and focus groups took between 60 and 90 minutes. To compensate beneficiaries for their time and travel,

IMPAQ International, LLC Page 26 Evaluation of Medicare ACE Demonstration May 31, 2013 Final Evaluation Report
the evaluation team offered a $25 incentive,5 which was distributed after the focus groups ended. Beneficiary participants signed receipts for financial records. 2.1.8. Operational Limitations
In conducting interviews and focus groups, the quality of the responses depends on the knowledge level of the selected participants. The ACE liaisons at each site were the main recruitment contacts for all of the audiences except the beneficiaries. IMPAQ relied on the liaisons to recruit appropriate administrators and other hospital staff for the focus groups and in-depth interviews. While most of the interviewees participated in their scheduled interviews, a number of physicians failed to attend, perhaps because surgery and other unplanned patient-related issues emerged. IMPAQ conducted an aggressive recruitment effort for beneficiaries. Nonetheless, the evaluation team had low beneficiary response rates in some cases, particularly for patients who were recovering from cardiothoracic surgeries. Recruitment depended on the number of procedures at each hospital and, in some cases, the volume was too small to obtain 8 to 10 participants for each focus group. In general, because they were recovering from surgery, ACE beneficiaries also suffered from limited mobility. Interestingly, orthopedic patients were more likely than other types of patients to participate. 2.1.9. Comparative Analysis Methodology To enable a better understanding of the changes in processes, opinions, and attitudes over the course of the 3-year demonstration, this report compares the findings from the initial site visits conducted in the first year of the demonstration to the second-round site visits conducted in the second or third year of the sites’ implementation schedule. Chapter II of this report presents a comparison of the findings of the initial and second-round site visits for each research domain. The findings reflect feedback obtained from each target audience (administrators, physicians, and non-physician staff, as well as beneficiaries where appropriate); the findings are organized following the OMB-approved structure and questions of the moderator guides and interview protocols. This approach allows for consistency in describing the findings across sites and for each research domain. Following the questions is a summary of the findings for each domain. Where appropriate, we present examples from specific sites to demonstrate best practices and provide insight into their successes and challenges. Note that the findings from individual ACE sites and facilities are not the main focus of this comparative analysis. Although there were variations across sites and exceptions to the summary-level information, this section of the report highlights the main themes and overarching trends from the site visit data.
5 From Supporting Statement Part A of the OMB package: “Beneficiaries will receive a modest incentive of $25 to partially
compensate them for the time spent in the focus group and transportation costs that may have been incurred in their participation.”

IMPAQ International, LLC Page 27 Evaluation of Medicare ACE Demonstration May 31, 2013 Final Evaluation Report
It is also important to note that some sites had implemented some of the initiatives described in this report prior to the demonstration, but often the ACE Demonstration allowed or motivated sites to reinforce or refine these initiatives.
2.2. Quantitative Analysis We conducted quantitative analyses of the impact of the ACE Demonstration using difference-in-differences (DID) models. In some instances, we conducted trend analysis for the different research domains. However, each trend analysis had a specific approach, for example, a regression with time dummy and constant or a plotted quarterly volume trend, which will be described in the corresponding analytical sections. Section 2.2.1 presents the methodology followed, including discussions of the DID model, comparison group selection, and the regressions estimated for each outcome of interest. Section 2.2.2 provides information on data preparation, including information on data received, development of the inpatient analytic file, and an overview of the data handling rules specific to the volume, quality of care, and cost analyses. 2.2.1. Methodology Difference-in-Differences (DID) Methodology Difference-in-differences (DID) is a quasi-experimental policy analysis tool that enables researchers to analyze the impact of a policy intervention that is not implemented as a randomized controlled trial. Using DID, we can estimate the effect of the demonstration on a particular measure using available pre- and post-demonstration measures from the participating (treatment) and comparison group hospitals. By controlling for changes in the dependent variable that would have occurred over time regardless of the implementation of the demonstration, the portion of the actual changes in the dependent variable that are caused by the demonstration can be estimated. DID assumes that changes in (or the trajectory of) the dependent variable would be identical for the treatment and comparison groups if the treatment had never occurred.6 The specifications for the DID analyses used to evaluate the ACE Demonstration were customized for each specific analysis (i.e., volume and within-hospital volume distribution, Part B and post-acute care, and quality of care) to take full advantage of each input data set. For example, the analysis of most quality of care measures used claim-level data and beneficiary-level covariates, whereas the analysis of the effects of the demonstration on quarterly volume employed hospital-by-quarter data and thus did not include person-level or claim-level
6 Differences in the level of the dependent variable (e.g., control hospital A has a higher mortality rate than treatment hospital
B) do not pose a problem for DID. This assumption is discussed in Trivedi, PK and Cameron, AC. Microeconometrics: Methods and Applications. New York: Cambridge University Press, 2005, p. 770.

IMPAQ International, LLC Page 28 Evaluation of Medicare ACE Demonstration May 31, 2013 Final Evaluation Report
covariates. In this section, we present the simplest version of the DID model, a linear specification. However, the analyses that follow use slightly different model specifications. For example:
The quality of care analysis employs linear and logistic models.
The volume analysis uses negative binomial and linear models.
The cost analysis employs linear models. Specific variations on the model including level of analysis, covariates included, and functional form are discussed further in the respective analytical sections. In general, the linear DID model used for this evaluation is:
(Equation 1) The dependent variable is the outcome of interest for individual i,7 who had an episode of care in hospital h (e.g., an ACE site or a true comparison group site) during time period τ (e.g., first quarter of 2009).
On the right-hand side of Equation 1 are the following variables:
A hospital-level fixed-effect, , which controls for unobserved time-invariant heterogeneity across hospitals. The hospital fixed-effects are indicator variables for each hospital. These variables are considered control variables, accounting for hospital-specific unobservables, and do not have useful interpretations in this context. Thus, they are not presented in this report.
A time fixed-effect, . This variable controls for changes in the dependent variable occurring in a particular time period, across hospitals, regardless of the implementation of the demonstration.
The policy indicator, , which indicates whether an inpatient episode is among the “treated” or “control” observations. only if the observation is drawn from a treatment hospital (e.g., ACE or non-demonstration treatment hospitals) during its ACE implementation period. The estimate for captures the effect of the demonstration on the dependent variable. This is the estimate of interest.
Relevant covariates, captured by . The covariates in Equation 1 are expressed at the corresponding unit of analysis (hospital or individual) (i) level. Note that the volume analysis does not include hospital-level covariates, because we did not find considerable variations in the characteristics of the hospitals under study across time in the CMS Medicare Provider of Services Files (POS).
is an error term representing unexplained variation in the dependent variable.
7 In situations where the unit of observation is the hospital (e.g., the analysis of volume), the i subscript is unnecessary and the
is excluded. We include these terms in this discussion because we present here the most general parameterization of the model.

IMPAQ International, LLC Page 29 Evaluation of Medicare ACE Demonstration May 31, 2013 Final Evaluation Report
To account for correlation over time and within hospitals in the error term, , we clustered standard errors by hospital. Difference-in-Differences (DID) Methodology: Unadjusted Version In addition to the DID model given by Equation 1, in some cases we estimated an unadjusted version of the model. The unadjusted DID model is given by Equation 2.
(Equation 2)
On the right-hand side of Equation 2 are the following variables:
A group indicator, , equal to 1 if the observation is drawn from an ACE site and equal to 0 otherwise. This term accounts for differences between the treatment and comparison groups.
A period indicator, , equal to 1 if the observation is drawn from the post-implementation period and equal to 0 otherwise. This variable accounts for differences in the pre- vs. post-implementation period.
The interaction term, , equal to 1 if the observation is drawn from an ACE hospital during its ACE implementation period and equal to 0 otherwise. The estimate for captures the effect of the demonstration on the dependent variable. This is the estimate of interest.
is an error term representing unexplained variation in the dependent variable. The main differences between the unadjusted and adjusted DID equations are that (1) the unadjusted model controls for group differences in treatment vs. control groups while the adjusted model accounts for unobservable hospital-specific differences via hospital fixed-effects; (2) the unadjusted model accounts for pre- vs. post-implementation factors affecting all hospitals, while the adjusted model controls for quarter-specific factors; and (3) the unadjusted model does not control for person- or hospital-level covariates, while the adjusted model does.
Comparison Site Groups
To apply the DID approach, two comparison groups of non-ACE hospitals were identified. Hospitals in the first group, the “true comparison group,” are located outside of the market areas of the demonstration sites (as defined by hospital referral regions), but within the MAC4 region. The second comparison group, the “non-demonstration treatment group,” is composed of hospitals that did not participate in ACE, but were located in the same market areas as the demonstration hospitals. These hospitals were used to assess any indirect effects of the demonstration (e.g., changes in the volume of services provided at hospitals surrounding an ACE site). If there are such indirect effects, they would be experienced by hospitals that are not a part of the demonstration but are located near a demonstration hospital (that is, within its market area). Non-demonstration treatment groups were selected separately for each demonstration site and surgical category combination (including the five types of cardiovascular

IMPAQ International, LLC Page 30 Evaluation of Medicare ACE Demonstration May 31, 2013 Final Evaluation Report
procedures [valve, defibrillator, CABG, pacemaker and PCI] and orthopedic procedures [hip/knee replacement/revision]) since an ACE site’s non-demonstration treatment group hospitals must be located in the same market area as that ACE site. For the true comparison group, however, it was not necessary to distinguish the hospitals by demonstration site since, by definition, they are not located near any demonstration site. If a hospital meets this criterion for one demonstration site, it meets it for all. The true comparison hospital groups are defined, therefore, simply by ACE surgical category. The two true comparison hospital groups (cardiovascular and orthopedic) may overlap, since some hospitals perform both types of ACE procedures.
We compared both the ACE hospitals and the non-demonstration treatment hospitals to the true comparison group to analyze the impact of the ACE Demonstration. The location of the true comparison group hospitals outside of the ACE markets ensured that they would not be affected by the demonstration. Changes over time in the key analysis variables for the true comparison group were used to represent the changes that would have occurred among the ACE hospitals and the non-demonstration treatment hospitals if they had not been involved in the demonstration.
To identify the hospitals for the two comparison groups, hospitals were matched on several characteristics, including state, bed complement, and volume. Unfortunately, direct matching techniques did not produce a sufficient number of true comparison and non-demonstration treatment hospitals. We also considered using propensity score matching, but the group of hospitals capable of performing the ACE procedures was too small to permit this procedure to be carried out. As a consequence, we selected comparison groups based on minimal criteria, intending to control for hospital characteristics in our analyses. In particular, we required that hospitals (1) be located within the MAC4 region, (2) have the ability to perform an ACE surgical procedure,8 and (3) have performed at least one relevant ACE surgical procedure during FY 2008.9
True Comparison Groups
Exhibit 9 provides a description of the MAC4 hospitals that met the criteria for inclusion in the true comparison group. Since these hospitals are not located in the same hospital market as any of the demonstration sites, the same surgically-relevant true comparison group can be used for comparison with any of the demonstration sites. For the cardiovascular demonstration sites, there were 96 true comparison hospitals, most of which were located in Texas. Over half of these hospitals have a bed capacity greater than 300. On average, each performed nearly 160 ACE cardiovascular surgical procedures in FY 2008. The ACE sites have an average bed complement of 664 and an average cardiovascular procedure volume of 470.
8 The Provider of Services file indicates whether cardiovascular and orthopedic surgery services are “not provided,” “provided
by staff,” “provided by arrangement or through agreement,” or “provided by staff and through agreement.” Hospitals in which the procedures were “provided by staff” or “provided by staff and through agreement” were included in the sample. 9 Some hospitals had positive volume in FY 2008 according to the MedPAR file, but did not satisfy criterion 2. These hospitals were therefore excluded from the comparison group.

IMPAQ International, LLC Page 31 Evaluation of Medicare ACE Demonstration May 31, 2013 Final Evaluation Report
For the orthopedic demonstration sites, there were 62 true comparison group hospitals in the MAC4 region. Again, the majority were located in Texas. The distribution by bed complement was more uniform over the size categories than it was for the cardiovascular true comparison group hospitals. The average number of ACE procedures for these hospitals in FY 2008 was 70, and the average number of ACE orthopedic procedures performed by the ACE sites was 333. Exhibit 9: Characteristics of Potential MAC4 True Comparison Group Hospitals/Sites by State
and ACE Surgical Procedures
MAC4 Colorado New Mexico Oklahoma Texas
Cardiovascular
Number of Hospitals 96 10 2 1 83
Bed Complement 396.47 302.8 227 378 412.06
Bed Complement Categories 1–24 beds 25–49 beds 50–99 beds 100–199 beds 200–299 beds 300 or more beds
1.04% [1] 0.00% [0] 5.21% [5]
13.54% [13] 22.92% [22] 57.29% [55]
0.00% [0] 0.00% [0] 0.00% [0]
30.00% [3] 30.00% [3] 40.00% [4]
0.00% [0] 0.00% [0] 0.00% [0]
50.00% [1] 50.00% [1]
0.00% [0]
0.00% [0] 0.00% [0] 0.00% [0] 0.00% [0] 0.00% [0]
100.00% [1]
1.20% [1] 0.00% [0] 6.02% [5]
10.84% [9] 21.69% [18] 60.24% [50]
Volume of ACE Cardiovascular Procedures in FY 2008
158.96 133.10 177.50 185.00 161.31
Orthopedic Number of Hospitals 62 13 4 1 44
Bed Complement 190.95 236.54 163.5 47 183.25
Bed Complement Categories 1–24 beds 25–49 beds 50–99 beds 100–199 beds 200–299 beds 300 or more beds
12.90% [8] 6.45% [4]
25.81% [16] 17.74% [11] 16.13% [10] 20.97% [13]
0.00% [0] 0.00% [0]
23.08% [3] 23.08% [3] 23.08% [3] 30.77% [4]
0.00% [0] 0.00% [0]
25.00% [1] 50.00% [2] 25.00% [1]
0.00% [0]
0.00% [0] 100.00% [1]
0.00% [0] 0.00% [0] 0.00% [0] 0.00% [0]
18.18% [8] 6.82% [3]
27.27% [12] 13.64% [6] 13.64% [6] 20.45% [9]
Average Volume Per Hospital, ACE Orthopedic Procedures in FY 2008
69.53 116.23 49.75 3.00 59.05
Source: 2009 Provider of Services (POS), FY 2008 MedPAR.
Non-Demonstration Treatment Groups Exhibit 10 and Exhibit 11 describe the non-demonstration treatment group hospitals for cardiovascular and orthopedic procedures, respectively. Since the non-demonstration treatment hospitals must be located in the same market as the demonstration hospital site, each ACE site has a unique non-demonstration treatment group.

IMPAQ International, LLC Page 32 Evaluation of Medicare ACE Demonstration May 31, 2013 Final Evaluation Report
Each demonstration site has at least six non-demonstration treatment hospitals. For the orthopedic demonstration sites, the non-demonstration treatment groups had low average numbers of ACE procedures. The reason for this may be that the selected orthopedic demonstration sites were the major providers of these procedures in their markets. Exhibit 10: Characteristics of Potential Cardiovascular Non-Demonstration Treatment Group
Hospitals/Sites by Demonstration Site
Baptist Health System
Exempla St. Joseph Hospital
Hillcrest Medical Center
Oklahoma Heart Hospital
Number of Hospitals 6 9 6 8
Bed Complement 603 439.67 369.67 469.13
Bed Complement Categories 1–24 beds 25–49 beds 50–99 beds 100–199 beds 200–299 beds 300 or more beds
0.00% [0] 0.00% [0]
16.67% [1] 0.00% [0]
16.67% [1] 66.67% [4]
0.00% [0] 0.00% [0] 0.00% [0]
11.11% [1] 0.00% [0]
88.89% [8]
0.00% [0] 0.00% [0]
33.33% [2] 16.67% [1]
0.00% [0] 50.00% [3]
0.00% [0] 0.00% [0] 0.00% [0] 0.00% [0]
12.50% [1] 87.50% [7]
Average Volume Per Hospital, ACE Cardiovascular Procedures in FY 2008
243.67 77.11 163.33 204.63
Source: 2009 Provider of Services (POS), FY 2008 MedPAR.

IMPAQ International, LLC Page 33 Evaluation of Medicare ACE Demonstration May 31, 2013 Final Evaluation Report
Exhibit 11: Characteristics of Potential Orthopedic Non-Demonstration Treatment Group Hospitals/Sites by Demonstration Site
Baptist Health System Hillcrest Medical Center Lovelace Health System
Number of Hospitals 6 6 8
Bed Complement 136.83 79.33 93.5
Bed Complement Categories 1–24 beds 25–49 beds 50–99 beds 100–199 beds 200–299 beds 300 or more beds
16.67% [1] 50.00% [3] 16.67% [1] 0.00% [0] 0.00% [0]
16.67% [1]
0.00% [0] 0.00% [0]
83.33% [5] 16.67% [1] 0.00% [0] 0.00% [0]
25.00% 2] 12.50% [1] 37.50 [3] 0.00% [0]
25.00% [2] 0.00% [0]
Average Volume Per Hospital, ACE Orthopedic Procedures in FY 2008
25.17 14.67 33.75
Source: 2009 Provider of Services (POS), FY 2008 MedPAR.
Level of Analysis: ACE Global and Site-Specific Effects, and Procedure Groups Exhibit 12 summarizes the regression models estimated for each outcome. For each outcome,
, we estimated the “global” effects of the demonstration (i.e., across all relevant treatment hospitals for each procedure group) as well as the “ACE site-specific” effects. The global regressions use data from all ACE or non-demonstration treatment sites plus true comparison group sites, while the ACE site-specific regressions include data for only one ACE site or one ACE site’s non-demonstration treatment group plus the true comparison group sites. For both the global and site-specific effects, we estimated separate models for each of the six procedure groups (valve, defibrillator, CABG, pacemaker, PCI, and hip/knee). For all DID models, the comparison group is the corresponding procedure group (cardiovascular or orthopedic DRGs) for the true comparison group. We excluded ESJH from all analyses because of small sample size: In that hospital, very few ACE procedures were performed under the ACE Demonstration (fewer than 20 per procedure group). This is because ESJH implemented the demonstration relatively late (November 1, 2010)10 and is a preferred Kaiser Permanente hospital. This status means that a large number of its physicians are Kaiser Permanente physicians and did not participate in the ACE Demonstration. Furthermore, there is a strong presence of Medicare Advantage plans in the Denver region, which limits the market for Medicare FFS services.
10 Information collected during the site visits indicated that ACE implementation at LHS and ESJH was delayed because of a lengthy transition to the Medicare Administrative Contractor’s bill processing system. Unlike at LHS, however, late implementation at ESJH largely affected ESJH’s volume of ACE cases. Although ESJH was aware of the upcoming implementation of the demonstration during this delay, the hospital did not begin implementing the demonstration prior to the start date. Nevertheless, ESJH ACE physicians did begin identifying cost-saving initiatives and negotiating with vendors prior to implementation.

IMPAQ International, LLC Page 34 Evaluation of Medicare ACE Demonstration May 31, 2013 Final Evaluation Report
Models 1 through 6 each consolidate data for the ACE hospitals and the appropriate true comparison group to estimate the global impact of the demonstration for each procedure group. Models 7 through 12 are analogous, except that the data included in the model are for the non-demonstration treatment groups associated with each of the ACE sites. Models 13 through 30 estimate ACE site-specific parameters for each procedure group separately, while models 1 through 6 pool data for all ACE sites. In cases where regressions include data from only one ACE site plus hospitals in the true comparison group, such as the case of the quarterly volume analyses, where there are no additional hospital covariates, the hospital-level fixed-effects coefficient in Equation 1 ( ) captures hospital-level time-invariant information for the ACE site and the hospitals in the true comparison group. Models 31 through 48 are analogous to the ACE site-specific models except that the model was run for the non-demonstration treatment groups of a specific ACE site rather than the ACE site itself as in models 13 to 30.

IMPAQ International, LLC Page 35 Evaluation of Medicare ACE Demonstration May 31, 2013 Final Evaluation Report
Exhibit 12: Regression Models Estimated for Each Outcome of Interest in the Volume, Cost, and Quality of Care Analyses
Model Treatment Group Procedure Group
Overall Effect of ACE Demonstration
1 ACE hospitals (HMC, BHS, OHH) Valve
2 ACE hospitals (HMC, BHS, OHH) Defibrillator
3 ACE hospitals (HMC, BHS, OHH) CABG
4 ACE hospitals (HMC, BHS, OHH) Pacemaker
5 ACE hospitals (HMC, BHS, OHH) PCI
6 ACE hospitals (HMC, BHS, LHS) Hip/knee
7 Non-demonstration treatment sites for HMC, BHS, OHH Valve
8 Non-demonstration treatment sites for HMC, BHS, OHH Defibrillator
9 Non-demonstration treatment sites for HMC, BHS, OHH CABG
10 Non-demonstration treatment sites for HMC, BHS, OHH Pacemaker
11 Non-demonstration treatment sites for HMC, BHS, OHH PCI
12 Non-demonstration treatment sites for HMC, BHS, LHS Hip/knee
Site-Specific Effect of ACE Demonstration
13–15 HMC, BHS, OHH Valve
16–18 HMC, BHS, OHH Defibrillator
19–21 HMC, BHS, OHH CABG 22–24 HMC, BHS, OHH Pacemaker
25–27 HMC, BHS, OHH PCI
28–30 HMC, BHS, LHS Hip/knee
31–33 Non-demonstration treatment sites for HMC, BHS, OHH Valve
34–36 Non-demonstration treatment sites for HMC, BHS, OHH Defibrillator
37–39 Non-demonstration treatment sites for HMC, BHS, OHH CABG
40–42 Non-demonstration treatment sites for HMC, BHS, OHH Pacemaker
43–45 Non-demonstration treatment sites for HMC, BHS, OHH PCI
46–48 Non-demonstration treatment sites for HMC, BHS, LHS Hip/knee
Note: The comparison groups for the regressions are the cardiovascular true comparison group for the cardiovascular procedure groups (valve, defibrillator, CABG, pacemaker, and PCI), and the orthopedic true comparison group for the orthopedic procedure group (hip/knee). For the volume analysis, we included an examination of ACE-related procedures as a group for cardiovascular and orthopedic procedures in each relevant model. For example, for models 1–6 and 7–12 for overall effect, this adds a total of 4 regressions (2 ACE-related cardiovascular [1 for ACE sites and 1 for the non-demonstration treatment group] and 2 ACE-related orthopedic [1 for ACE sites and 1 for the non-demonstration treatment group]). In addition, for site-specific effect models, examining ACE-related procedures adds 3 regressions to models 13–27 (1 ACE-related cardiovascular regression each for HMC, BHS, and OHH), 3 regressions to models 28–30 (1 ACE-related orthopedic regression each for HMC, BHS, and LHS), 3 regressions to models 31–45 (1 ACE-related cardiovascular regression each for HMC, BHS, and OHH), and 3 regressions to models 46–48 (1 ACE-related orthopedic regression each for HMC, BHS, and LHS. That is, after including an examination of ACE-related procedures, there are 4 additional regressions to overall effect models and 12 additional regressions to site-specific effect models.
The interpretation of the effect of the demonstration on the dependent variable, the DID estimate , depends on the specific functional form of the estimating equation. For example, in the linear models estimated for the quality of care analysis, the DID estimate is interpreted as follows: “On average, the ACE Demonstration ‘caused’ an increase of points on the quality measure of interest” relative to the comparison group. For the volume analysis, which uses a

IMPAQ International, LLC Page 36 Evaluation of Medicare ACE Demonstration May 31, 2013 Final Evaluation Report
negative binomial model, the interpretation of is: “The ACE Demonstration ‘caused’ a *100 percent increase in the volume of services delivered at the treatment sites relative to the comparison sites.”11 One limitation of the global specifications (models 1 through 12) is that observations from the sites that implemented the ACE Demonstration at a relatively late date were incorporated as true comparison group observations for the early ACE implementers. For example, BHS implemented the demonstration on June 1, 2009, while OHH implemented it on January 1, 2010 and LHS implemented it on November 1, 2010. Thus, all observations drawn from BHS have the policy indicator, , coded as = 1 for all quarters after June 1, 2009, and all observations from OHH and LHS have = 0 for a portion of this period (i.e., for all quarters between June 1, 2009 and January 1, 2010 for OHH, and through November 1, 2010 for LHS). Thus, the parameter estimate that measures the effect of the demonstration on the dependent variable, , was calculated using observations drawn from OHH and LHS as true comparison group observations through January 1, 2010 and November 1, 2010, respectively. As long as there was no change in behavior by late-implementing ACE sites prior to the implementation date, this did not bias the DID estimates. 2.2.2. Data Preparation Raw Data This analysis used data from several files delivered by the CMS Chronic Condition Data Warehouse (CCW) in December 2012. The data were provided for all individuals receiving care during or after 2007 under one of the selected MS-DRGs, in one of the MAC4 states. The list of beneficiary identifiers for these individuals constitutes the finder file used to extract the claims data. The Part A data contained claims with National Claims History (NCH) codes indicating the following claim types: home health (10); non-swing bed skilled nursing facility (SNF) (20); swing bed SNF (30); outpatient (40); hospice (50); and inpatient (60 [inpatient claim], 61 [inpatient full-encounter claim]). The Part B files included claims with NCH-type codes indicating the following claim types: local carrier non-durable medical equipment (non-DME) (71); local carrier durable medical equipment (DME) (72); DME regional carrier non-DME (81); and DME regional carrier DME (82). The HCC file contained information on each beneficiary’s chronic conditions, including HCC community score. The denominator file provided demographic information about each beneficiary, including age, gender, race, date of death, and other characteristics.
11
For the volume measures, the percent increase is the approximate percent increase of the “ACE/true comparison group volume ratio” between the post- and pre-period. Note that the approximation of log to percentage only holds when the difference in the two ratios is small.

IMPAQ International, LLC Page 37 Evaluation of Medicare ACE Demonstration May 31, 2013 Final Evaluation Report
In addition, the ACE implementation contractor provided a list of inpatient episodes (defined by HIC and admission date) identified as having been part of the ACE Demonstration. We used this information to ensure accurate coding of “treated” episodes vs. non-demonstration episodes. The selected MS-DRGs included the ACE MS-DRGs and other MS-DRGs related to the ACE procedures. The non-ACE (but ACE-related) MS-DRGs are alternative procedures that physicians performing ACE procedures might choose if they decided not to perform ACE procedures. These ACE-related MS-DRGs were selected in consultation with IMPAQ’s clinical advisor (the list of all MS-DRGs included in the data request is provided in Appendix A). All of the individuals identified in the finder file were then followed without regard to location of treatment or MS-DRG. That is, we included claims after the initial procedure that might have occurred outside of MAC4 and have been for MS-DRGs other than those used to make the initial selection. This implies that if an individual had more than one claim in 2007 and if one of those claims was in the selected group of ACE and non-ACE MS-DRGs, then the data will contain all claims for that individual in 2007, plus all future claims during the rest of the sample period. This information is important, for example, for the analysis of post-acute care costs. Development of the Inpatient Analytic File To facilitate our analyses, we generated a single inpatient analytic file from the raw CCW data. The inpatient analytic file included most of the inpatient claims information necessary to conduct the analyses.12 To produce the inpatient analytic file, the following steps were executed for the single Part A file provided by CMS in December 2012:
1. The data from CMS had 26,725,173 institutional claim records. All inpatient claims were kept because the ACE Demonstration is based on episodes defined by inpatient stays. Inpatient claims are indicated by claim type codes 60 (inpatient claim), 61 (inpatient full-encounter claim), and 62 (inpatient abbreviated encounter claim). The resulting file had 3,059,422 observations, including inpatient claims for individuals having inpatient stays with ACE and ACE-related MS-DRGs at the ACE sites, the true comparison group hospitals, and the non-demonstration treatment group hospitals.
2. Duplicates having identical values for all variables other than claim ID were removed from the files (174 records [<1%] were deleted).
3. Invalid claims were removed from the files. These included claims with invalid MS-DRG codes such as “000” (29,586 records [<1%] were deleted), provider states (2 records [<1%] were deleted), and discharge dates (1,392 [<1%] were deleted). This evaluation
12
In addition to the information contained in the inpatient analytic file, the cost analysis uses a post-acute care measure, which is partially based on inpatient claims that were excluded from the inpatient analytic file. For example, the post-acute care analysis uses a readmissions measure that includes inpatient stays for any MS-DRG occurring between 1 and 30 days post-discharge at any hospital. Some of these readmissions were excluded from the analytic file because the analytic file retains only inpatient stays at ACE, true comparison, and non-demonstration treatment hospitals.

IMPAQ International, LLC Page 38 Evaluation of Medicare ACE Demonstration May 31, 2013 Final Evaluation Report
required identification of the MS-DRGs included in the demonstration, the location of the hospitals, and the dates during which the episodes occurred.
4. For the small number of inpatient stays composed of more than one claim, we collapsed the multiple claims into inpatient stays. This was necessary to ensure that the analytic file was at the episode level rather than the claim level. We used the following steps to collapse multiple claims into inpatient stays:
a. We observed 3,562 claims that had identical HICs and also perfectly overlapped (had identical admission and discharge dates). We deleted 1,921 observations (<1%) using the following rules:
i. A small group of the perfectly overlapping claims had MS-DRG codes that contradicted one another. We deleted claims that had identical HICs, admission dates, and discharge dates but had contradictory DRG codes, since we had to identify the specific MS-DRG for the inpatient stay. In cases with contradictory DRG codes, it was not clear which was the correct code.
ii. We deleted claims that had provider numbers with an alpha character in the third position. Providers with an alpha character are units (e.g., inpatient rehabilitation) within larger institutions. The ACE Demonstration focuses on the acute care episode, which does not include services delivered under separate billing by distinct hospital units.
iii. We deleted claims with contradictory provider numbers because we had to be able to identify the provider receiving the inpatient DRG payment.
iv. For same day, same provider readmissions that had similar but not identical MS-DRG codes (i.e., same procedure but different comorbidity level), we kept the later claim. ResDAC personnel indicated that the final DRG designation is based on the later claim.
v. In the remaining cases, we retained all of the information from the most recent claim (higher claim ID number) unless the two claims had different claim payment amounts, in which case we summed the payment amounts and retained all other information from the later claim.
b. We identified 26,472 claims where two claims had identical HICs and partially overlapping admission and discharge dates. Overlapping claims must be corrected because inpatient providers cannot bill twice for a single MS-DRG for the same individual. There are four types of partially overlapping claims:
i. Stay B (the later stay) begins during stay A (the earlier stay) and ends after stay A ends.
ii. Stay B (the stay with the later admission date) begins and ends during stay A (the stay with the earlier admission date).

IMPAQ International, LLC Page 39 Evaluation of Medicare ACE Demonstration May 31, 2013 Final Evaluation Report
iii. Stay B (the stay with the later admission date) begins during stay A (the stay with the earlier admission date), and both claims have the same discharge date.
iv. Stay B (the shorter stay) and stay A (the longer stay) have the same admission date, and stay B ends during stay A.
In each of the four cases described above, we deleted stay B. This totaled 13,236 records (<1%).
c. In the case of continuing claims (the discharge date of the first claim is the same as the admission date of the second claim, and HICs, providers, and DRG codes are identical), we combined the two claims by summing the claim payment amounts, using the earlier admission date and the later discharge date, and retaining all other information from the claim with the later discharge date. Using these criteria, we deleted 177 claims (<1%).
5. The rules described above resulted in a file with 3,013,153 inpatient episodes with discharge dates ranging from October 1, 2007 through November 13, 2012.
To determine an appropriate cut-off date for the analyses, we kept only records that contained the ACE MS-DRGs and were from ACE or true comparison hospitals. We then examined the volume of inpatient episodes in each month. Exhibit 13 shows this information graphically. There is a precipitous drop in the number of inpatient episodes beginning in the fourth quarter of 2012, indicating that claims from this period may not be complete. Thus, we used claims data through the end of September 2012 in our analyses and excluded claims from the last 3 months of 2012. Exhibit 13: Volume of Inpatient Episodes Over Time

IMPAQ International, LLC Page 40 Evaluation of Medicare ACE Demonstration May 31, 2013 Final Evaluation Report
The process described above produced an episode-level file containing most of the inpatient claims data information necessary to conduct the cost and volume analyses. Additional data handling rules that we used to prepare the data for specific analyses are discussed in the next section.
Data Handling Rules and Definitions by Type of Analysis
This section describes some of the unique data issues specific to each of the analyses in the evaluation.
Quarterly Volume, PAC Volume, Market Share, Within-Hospital Distribution of Services, and Spillover
In this section, we briefly introduce the volume measures used to perform the analysis described in Chapter 5. To measure whether the demonstration had an impact on volume at the demonstration sites and their surrounding hospitals, we analyzed five volume measures:
Quarterly volume
PAC volume
Market share
Within-hospital distribution of services
Physician spillover.
To create these measures, we used the inpatient analytic file. Note that the inpatient analytic file is an episode-level file, while the first four volume measures (quarterly volume, PAC volume, market share, and within-hospital distribution of services) are at the hospital level and the fifth one (physician spillover) is at the physician level. We reshaped the inpatient analytic file so that the unit of analysis is consistent for each of the volume measures. These measures were produced for the ACE sites, the non-demonstration treatment groups, and the true comparison groups in the pre- and post-demonstration periods.13 Information on how each measure was constructed is presented in Chapter 5.
Quality of Care
To capture whether the demonstration had an impact on the quality of care at the demonstration sites and their surrounding hospitals, we analyzed 22 quality measures selected by CMS. The selected measures focus on the severity of the health status of admitted patients, the processes implemented by providers during the episodes, and the outcomes experienced by the ACE patients.
13 The market share and physician spillover analyses do not consider the true comparison groups, as is explained in the analysis of volume (Chapter 5).
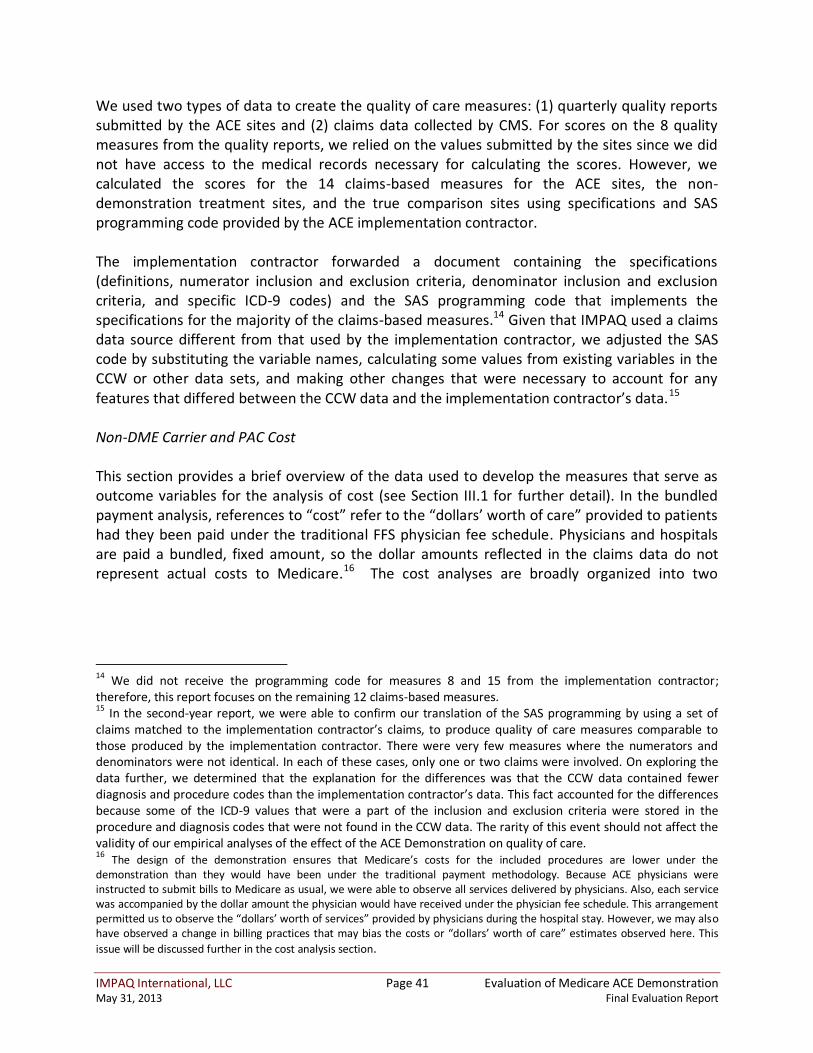
IMPAQ International, LLC Page 41 Evaluation of Medicare ACE Demonstration May 31, 2013 Final Evaluation Report
We used two types of data to create the quality of care measures: (1) quarterly quality reports submitted by the ACE sites and (2) claims data collected by CMS. For scores on the 8 quality measures from the quality reports, we relied on the values submitted by the sites since we did not have access to the medical records necessary for calculating the scores. However, we calculated the scores for the 14 claims-based measures for the ACE sites, the non-demonstration treatment sites, and the true comparison sites using specifications and SAS programming code provided by the ACE implementation contractor. The implementation contractor forwarded a document containing the specifications (definitions, numerator inclusion and exclusion criteria, denominator inclusion and exclusion criteria, and specific ICD-9 codes) and the SAS programming code that implements the specifications for the majority of the claims-based measures.14 Given that IMPAQ used a claims data source different from that used by the implementation contractor, we adjusted the SAS code by substituting the variable names, calculating some values from existing variables in the CCW or other data sets, and making other changes that were necessary to account for any features that differed between the CCW data and the implementation contractor’s data.15 Non-DME Carrier and PAC Cost This section provides a brief overview of the data used to develop the measures that serve as outcome variables for the analysis of cost (see Section III.1 for further detail). In the bundled payment analysis, references to “cost” refer to the “dollars’ worth of care” provided to patients had they been paid under the traditional FFS physician fee schedule. Physicians and hospitals are paid a bundled, fixed amount, so the dollar amounts reflected in the claims data do not represent actual costs to Medicare. 16 The cost analyses are broadly organized into two
14
We did not receive the programming code for measures 8 and 15 from the implementation contractor; therefore, this report focuses on the remaining 12 claims-based measures. 15
In the second-year report, we were able to confirm our translation of the SAS programming by using a set of claims matched to the implementation contractor’s claims, to produce quality of care measures comparable to those produced by the implementation contractor. There were very few measures where the numerators and denominators were not identical. In each of these cases, only one or two claims were involved. On exploring the data further, we determined that the explanation for the differences was that the CCW data contained fewer diagnosis and procedure codes than the implementation contractor’s data. This fact accounted for the differences because some of the ICD-9 values that were a part of the inclusion and exclusion criteria were stored in the procedure and diagnosis codes that were not found in the CCW data. The rarity of this event should not affect the validity of our empirical analyses of the effect of the ACE Demonstration on quality of care. 16 The design of the demonstration ensures that Medicare’s costs for the included procedures are lower under the demonstration than they would have been under the traditional payment methodology. Because ACE physicians were instructed to submit bills to Medicare as usual, we were able to observe all services delivered by physicians. Also, each service was accompanied by the dollar amount the physician would have received under the physician fee schedule. This arrangement permitted us to observe the “dollars’ worth of services” provided by physicians during the hospital stay. However, we may also have observed a change in billing practices that may bias the costs or “dollars’ worth of care” estimates observed here. This
issue will be discussed further in the cost analysis section.

IMPAQ International, LLC Page 42 Evaluation of Medicare ACE Demonstration May 31, 2013 Final Evaluation Report
sections: analysis of non-DME carrier costs during the inpatient stay and analysis of PAC costs.17 The analysis of non-DME carrier costs (also referred to as carrier costs) uses a single measure, equal to the sum of costs reflected in the non-DME carrier file that are part of the bundled payment. Claims included in this measure are for all services listed as having a place of service of inpatient, outpatient, emergency room, or independent laboratory or diagnostic facility provided during the inpatient stay by all hospital-based physicians or other professionals. Sixty-three percent of the claims were from solo practitioners; 35 percent were from multi-specialty clinics; and 2 percent were from clinics, groups, associations, partnerships or other entities. DME is excluded from the bundle specification. The PAC cost analysis uses 10 PAC cost measures. Unlike the carrier cost measure, which captures dollars’ worth of certain types of care documented in the carrier file that were provided during the hospital stay rather than actual costs to Medicare, the PAC cost measures represent the actual costs to Medicare because PAC services are not included in the ACE bundled payment. The PAC cost measures capture all costs (Parts A and B, as applicable) billed during the 30-day post-discharge period for the following types of care:
Total PAC: Sum of all items below
Home health
Skilled nursing facility
Inpatient rehabilitation facility
Comprehensive outpatient rehabilitation facility
Hospice
Readmissions
Physician office
Outpatient
Other18 We produced all measures for the ACE Demonstration, true comparison, and non-demonstration treatment group hospitals. In many cases, this required merging Part B claims at the line item level to inpatient stays. All PAC cost measures were prorated so that claims with claim thru dates exceeding the 30-day post-discharge window were prorated to include only a portion of costs for a 30-day window.
17 For the cost analyses, we did not consider services provided by hospitals during the inpatient stay because, other than the MS-DRG associated with each hospital stay, we did not observe specific services provided during the stay. These specifics are “hidden” by the bundled, fixed nature of the DRG payment system. 18 Other types of care includes inpatient psychiatric care and Part B costs with place of service given as independent laboratory, nursing, assisted living facility, group home, custodial care facility, adult living care facility,

IMPAQ International, LLC Page 43 Evaluation of Medicare ACE Demonstration May 31, 2013 Final Evaluation Report
CHAPTER II: COMPARATIVE SITE VISITS FINDINGS

IMPAQ International, LLC Page 44 Evaluation of Medicare ACE Demonstration May 31, 2013 Final Evaluation Report
1. QUALITY AND COORDINATION OF CARE
1.1. Research Objectives One of the main goals of the ACE Demonstration was to improve the quality of care and enhance coordination of care at ACE sites as a result of the collaboration involved in bundled payments and financial incentives. The hypothesis was that physicians and hospitals would be financially motivated to align objectives and strategies, leading to greater coordination, quality, and efficiency of care. The research questions posed in the quality and coordination of care domain underlined the types of strategies devised by the sites to improve services and enhance CMS-selected quality measures. The questions asked in the interviews and focus groups focused on changes or improvements, as observed by the respondents, in quality and coordination of care, as well as the types of measures each site used to monitor changes. Sites implemented a variety of initiatives to realize the quality and coordination of care objectives over the course of the demonstration. Collaboration among administrators, physicians, and non-physician staff to design and implement quality and coordination of care strategies at participating sites was expected to lead to positive outcomes, including changes in the organizational culture. In this chapter, we summarize stakeholders’ responses to the questions developed for the quality and coordination of care domain and provide a comparative analysis of the two site visits. The findings for each question reflect feedback obtained from target respondents (administrators, physicians, non-physician staff, and beneficiaries) during each of the site visits. The narrative focuses on the strategies and activities that resulted in changes over the course of the demonstration across all sites. Several elements that propelled changes in quality and coordination of care at the demonstration sites are highlighted. Appendix B.2 highlights details of several key components of the demonstration that were drivers of changes in quality of care and coordination of care such as quality improvement initiatives, monitoring and reporting of measures, and coordination of care (standardized protocols).
1.2. Comparative Analysis
Did the demonstration meet your expectations in terms of quality and coordination of care?
Respondents at several sites initially expressed concerns about the demonstration’s potential to improve their organization’s quality and coordination of care. Some asserted that quality of care was already high before the demonstration began. However, as the demonstration progressed, respondents expressed fewer reservations regarding the demonstration’s effect on

IMPAQ International, LLC Page 45 Evaluation of Medicare ACE Demonstration May 31, 2013 Final Evaluation Report
quality and coordination of care and were more willing to attribute improvements to such site-specific strategies as the standardization of surgical order sets. At sites that implemented strategies such as patient navigators and standardized surgical order sets prior to the demonstration, ACE served as a catalyst to revisit and refine these efforts. Respondents generally agreed that the orthopedic service line was more successful than the cardiovascular service line in meeting administrators’ expectations of improved quality and coordination of care. Both sets of site visits revealed variations in staff awareness of and involvement in the demonstration. A common problem identified by most non-physician staff during both site visits was a general lack of awareness by staff of particular ACE-site strategies. This made it difficult to assess whether the demonstration had made strides in the areas of quality improvement and coordination of care and may have resulted in weak follow-through on the strategies. While a majority of non-physician staff reported a continued lack of awareness of ACE goals throughout both site visits, they did emphasize the value of individual strategies, such as standardized surgical order sets and patient navigators, which were widely seen as drivers of significant quality and coordination of care improvement. Overall, stakeholders’ expectations for quality and coordination of care improvements were largely met. During the second site visit, some administrators and physicians referenced a new goal prompted by their work in ACE: to enhance quality standards by including more outcomes-based measures to supplement CMS’ required process-based metrics.
What challenges did you face making changes to improving and monitoring quality?
Most notably, the respondents viewed the production, analysis, and dissemination of timely quality and cost data as extremely labor-intensive; they expressed a strong desire for an easier, more efficient method of extracting data from larger data sets. Because ACE data were monitored on a case-by-case basis and produced manually, administrators expressed frustration about communicating cost and quality data to physicians in a timely manner. This challenge continued throughout the demonstration for most sites; however, one site incorporated an interactive dashboard tool into its monitoring and reporting system between the initial and second site visits; this tool significantly enhanced the site’s ability to produce and disseminate real-time cost and quality data. In response, physicians expressed appreciation for better data transparency and the opportunity to more effectively monitor and compare their data with those of their peers. Some administrators noted problems in motivating physicians to participate and engage in certain aspects of the demonstration. Specifically, they said it was difficult to obtain consensus on the outcome measures and methodology used to measure progress. Moreover, in a few cases, administrators found it difficult to maintain the initial level of physician motivation to improve quality. Some administrators at the sites that offered gainsharing thought the reason for this was the 25 percent cap on the fee schedule amount. However, physicians argued that

IMPAQ International, LLC Page 46 Evaluation of Medicare ACE Demonstration May 31, 2013 Final Evaluation Report
they continued to be involved in the demonstration because of its potential for quality improvement.
How has the demonstration affected provision of services at this hospital?
Respondents did not attribute a significant change in service provision to their site’s participation in the ACE Demonstration; however, some minor differences were noted between the two service lines of the demonstration. Respondents reported that orthopedic services benefited more from the demonstration than cardiovascular services. Administrators and physicians attributed this to the greater ease with which the orthopedic group was able to collaborate on vendor negotiations and establish standardized procedures and protocols. Though standardization and negotiations occurred in both service lines to varying degrees, respondents involved in the orthopedic service line believed they had more success due to in part to relatively smooth implementation and the ease of actively engaging physicians in the process. Because of the nature of the procedures and often emergent situations, cardiovascular procedures tend to be less standardized.
In addition, all respondents mentioned a new emphasis on tracking readmissions rates and causes. This strategy, however, was not seen as a direct result of ACE; it was believed to have been an indirect consequence of the demonstration’s focus on quality improvement initiatives.
How has the implementation of the ACE Demonstration affected your scope of activity at this hospital?
Physicians and administrators noted that, as a result of the ACE Demonstration, they attended regular meetings focused on improving quality. At all sites, ACE boards and quality committees were implemented during the first year of the demonstration to improve communication among stakeholders and to develop ACE-specific quality and coordination goals. These boards and committees were maintained throughout the demonstration and were seen as important tools to facilitate collaboration on quality objectives. During the second site visit, some stakeholders reported changes in their scope of work within the previous year. Some administrators and physicians noted that they spent considerable time reviewing trends in quality data to ensure that the hospital was meeting quality benchmarks and measures. Of those who noted an increase in data monitoring, many attributed it to the demonstration. Other than additional quality meetings and data review, physicians did not report any changes in their scope of activity. At each of the sites, ACE patient navigators were implemented at the beginning of the demonstration to smooth the process from start to finish for all patients during their hospital stays. Some sites hired patient navigators to specifically manage ACE patients, while other sites expanded the role of existing patient navigators to include ACE patients. In addition to assisting patients, patient navigators often communicated data outliers or missed quality measures to physicians and other staff. Though patient navigators were seen as important coordination

IMPAQ International, LLC Page 47 Evaluation of Medicare ACE Demonstration May 31, 2013 Final Evaluation Report
agents at most of the sites, they were reassigned at some sites to orthopedic services or asked to focus exclusively on orthopedics, which tended to have a higher volume of procedures. Non-physician staff did not report any changes in scope during the initial site visit. During the second site visit, however, some respondents mentioned an increase in patient tracking by identifying and following up with ACE patients.
Over the course of the demonstration, have the relationships among physicians, nurses, and other support staff markedly improved or deteriorated as a result of the ACE Demonstration? Respondents noted that it took some time to build trust between physicians and quality-monitoring administrators and staff. However, once established, the relationships were seen as positive. Physicians were very receptive to the demonstration and worked together to monitor each other’s performance. This collaboration tended to differ somewhat by line of service, with orthopedic physicians noting more positive changes in staff relationships than did cardiovascular surgeons. This difference could be due to the larger reorganization in processes for orthopedic procedures. Increased staff interaction and collaboration to improve the quality of patient care was repeatedly noted as a result of the demonstration. The increased number of meetings and procedures related to quality improvements and demonstration features had a positive effect on communication among various members of the staff. In particular, the predictability inherent in the standardization of order sets and procedures promoted greater accountability among all staff. During the second site visit, non-physician staff at some sites cited as a strength the stability of staff, noting that there had been very little turnover among key personnel in the previous 12 months. Though staff were hesitant to attribute this stability directly to the demonstration, they noted that ACE quality initiatives, such as standardized order sets, had improved efficiency of care. This resulted in clearer expectations and responsibilities, thereby improving relationships among physicians, nurses, and support staff over the course of the demonstration.
How do you coordinate with other staff to meet quality benchmarks? Did this evolve over time? To meet quality benchmarks, physicians and hospital administrators implemented regular meetings throughout the demonstration. These meetings, established as a communication tool to discuss quality improvement, were viewed positively by the attendees. Physicians also established small working groups, both formal and informal, to monitor the performance of their peers and establish quality objectives. As a result of these meetings, respondents noted an increase in communication about demonstration goals among physicians and non-physician staff. Respondents also emphasized the use and sharing of data, particularly through physician report cards, as important tools to enable staff coordination to meet quality benchmarks. Physicians

IMPAQ International, LLC Page 48 Evaluation of Medicare ACE Demonstration May 31, 2013 Final Evaluation Report
commented on the value of data tools like Crimson Clinical Advantage,19 which made the data review process more efficient and accurate. With the aid of such tools, physicians and administrators regularly reviewed and analyzed quality indicators to ensure that quality targets were met. Physicians appreciated the data transparency and the opportunity to review cost and quality data in an efficient and timely manner. To further staff understanding of quality metric goals, some sites began sharing periodic quality reports with non-physician staff during the second year of the demonstration. Non-physician staff who received quality and outcomes data appreciated the ability to view and monitor outcomes and felt more included in the overall quality objectives of the hospital. Because quality measures were developed through a collaborative effort that included physicians, administrators, and staff from specialty initiatives such as the Joint Club,20 the measures were maintained and expanded throughout the demonstration. Overall, the availability, analysis, and regular review of quality and outcomes data were seen as significant contributors to the attainment of quality and coordination of care benchmarks.
How have hospital administrators encouraged staff to comply with ACE policies and procedures?
Administrators and physicians had regular meetings and, in addition, often met informally to work on issues of quality, cost, and patient care related to the demonstration and its policies and procedures. Though the frequency of some meetings decreased over the course of the demonstration, most groups continued to meet monthly or quarterly. Administrators and related staff involved physicians and non-physician staff in many ACE meetings, procedures, and decisions. Sharing of data among physicians and staff created “friendly competition” to comply with ACE policies and procedures and meet related goals.
What recommendations would you make if this demonstration were to be implemented on a larger scale?
Respondents recommended that certain features, particularly patient navigators and standardized order sets, be implemented earlier. These features, they explained, made implementation of and compliance with ACE site-specific policies and procedures much easier. At sites where both cardiovascular and orthopedic ACE procedures were offered, administrators mentioned the need to implement a better process to synchronize the changes in the two types of procedures; as some administrators noted, each program achieved different levels of success. Adequate space for specialty programs (Joint Club, Joint Camp, Silver Elite, and similar initiatives) was also recommended, because these strategies were seen as important in improving the quality of care for ACE and non-ACE patients alike.
19
Crimson Clinical Advantage is a hospital-based data dashboard that provides real-time physician performance profiles to monitor quality and cost savings goals. 20 The Joint Club is the Gold Seal of Approval™ from The Joint Commission. Benefits for orthopedic patients include pre-surgery seminars, community activities, group therapy, and group meals.

IMPAQ International, LLC Page 49 Evaluation of Medicare ACE Demonstration May 31, 2013 Final Evaluation Report
For beneficiaries, were you satisfied with the care you received during your hospitalization? What aspects of your experience contributed to your satisfaction?
Overall, beneficiaries were satisfied with the quality of care they received during their hospital stays. During the first site visit, beneficiaries primarily attributed their satisfaction to individual hospital procedures and staff. During the second site visit, beneficiaries were more apt to emphasize the quality and coordination of care and the post-discharge services they received during their hospital stays. During both site visits, beneficiaries did not attribute positive quality-of-care experiences to ACE, because the majority of beneficiaries were unaware that they were part of the demonstration.
1.3. Summary Findings and Example Cases Summary Findings At all ACE sites, respondents cited standardization of processes as the demonstration strategy that had the most impact. Administrators proactively coordinated with engaged physicians to achieve the standardization of order sets. Once physicians came together, they responded positively to the process of comparing their practices with those of their colleagues and to the opportunity to apply best practices and evidence-based protocols at the sites. Over time, standardized order sets became incorporated as standard operating procedure in the culture of ACE sites that previously did not have them. Standardization was achieved particularly smoothly when administrators encouraged physicians to lead the standardization efforts, thereby increasing physician trust and buy-in. Non-physician staff came to appreciate the ease of using the streamlined order sets, which enhanced their work efficiency and clearly delineated their expected job functions in caring for patients. Administrators followed up on physician-driven initiatives regarding standardized orders sets and introducing new quality metrics. A newfound trust between physicians and hospital administrators, combined with the perceived positive effects of the demonstration on quality of care outcomes, made physicians less skeptical of bundled payments and administrators’ behavior and more willing not only to embrace quality measures but also to introduce rigorous, outcomes-based metrics. Though the primary objective of the standardization of order sets was to increase quality of care, the use of these tools enhanced communication and relationships between staff and physicians and among staff. Enhanced communication was a result of the establishment of known, mutual expectations. Improved communication resulted in greater efficiency in coordination of care. Furthermore, as standardized order sets were incorporated into the culture of the affected delivery sites and were improved over time, quality was perceived to have improved. This improvement consequently allowed physicians and staff to focus more intensely on efficiency of care. The physician report cards, which provided detailed cost and quality data, were also significant motivators driving the focus on quality improvement, because physicians responded positively to the opportunity to view their own data. In addition, the report cards and their direct

IMPAQ International, LLC Page 50 Evaluation of Medicare ACE Demonstration May 31, 2013 Final Evaluation Report
connection to gainsharing, at sites that offered gainsharing, led to some peer pressure and competition among physicians to achieve quality goals and improve on “red flag” quality metrics. The report cards and peer review of metrics were tools that led to increased attention to quality improvement. As the demonstration matured, however, some physicians reported that ACE gainsharing policies, such as caps on gainsharing amounts and the exclusion of physicians employed by hospitals, reduced motivation to improve quality and coordination of care, primarily because physicians’ expectations of gainsharing went unmet. The role of patient navigators in coordinating care enhanced communication between physicians and staff and smoothed patients’ hospital stays. As primary coordinators, patient navigators proactively tracked quality measures, allowing physicians and staff to more efficiently monitor and improve patient outcomes. Realizing the value of this role to support coordination efforts and meet quality metrics, many sites maintained patient navigators throughout the demonstration. Others repositioned their patient navigators to focus on orthopedics, which had higher patient volume and returns in terms of quality and costs. Furthermore, though efforts to coordinate care were appreciated at the sites, some staff felt consistent pressure to devise means of coordinating with others to decrease patients’ length of stay and to increase quality of care without adequate staffing to meet these goals. For example, nurses and therapists were constantly pressed for time and resources to manage all the patients on the floor and respond to requests from physicians. Respondents thought some areas needed improvement. For example, quality goals and initiatives were not communicated to non-management staff by administrators, possibly resulting in low awareness and follow-through on these strategies. However, administrators argued that their strategy (no direct messaging) was based on not wanting staff to differentiate between ACE and non-ACE patients. As the demonstration matured and quality strategies became part of the normal job function, lack of communication with staff had less effect. At some sites, communication between management and non-management staff increased. Demonstration sites with more active communication by administrators from the beginning had more engaged, knowledgeable staff who were proactive in pursuing ACE quality goals. Though stakeholders believed that all patients should receive high-quality care regardless of whether the site participated in the demonstration, staff in the focus groups emphasized their desire to be actively engaged in quality initiatives, many of which resulted from ACE or were further developed and supported as a result of the demonstration.

IMPAQ International, LLC Page 51 Evaluation of Medicare ACE Demonstration May 31, 2013 Final Evaluation Report
Example Cases Baptist Health System (BHS): Physician Report Cards At BHS, administrators and physicians designed report cards to measure physician compliance with established protocols and best practices. The BHS report cards were the most developed of all the sites. The score card, which was developed by physicians, contained over 40 aggregate scores on quality measures which represented 10 domains (each domain had three or four measures). Administrators generated score cards at each of the five BHS facilities to establish aggregate costs based on the prior 12-month period, as well as quality benchmarks for each ACE DRG. BHS also utilized some of the CMS ACE quality measures, which differed by facility, since each facility had different outcome measures and cost structures for the same ACE DRGs. BHS then used these benchmarks to evaluate physician and facility performance and determine whether the facility and physicians were eligible for gainsharing. Physicians received their report cards monthly, with detailed information at both the patient and DRG level. Each physician’s scores were compared to the aggregate quality and cost benchmarks to determine eligibility for that month’s gainsharing incentive. To receive gainsharing for a specific month, each individual doctor had to meet or exceed the aggregate benchmark for quality and the aggregate benchmark for cost. Anecdotally, administrators noted that the use of the report card had improved quality and reduced costs as physicians strove to meet the established benchmarks. To increase the transparency of quality and cost data in a timely manner, BHS implemented Crimson Clinical Advantage in the second year of the demonstration, a real-time matrix of quality and cost data that individual physicians could review to understand how they compared to their peers as well as how the organization compared to state or national quality trends. Although the ACE Demonstration was a major driver leading to the implementation of the system, BHS used this tool to report both ACE and non-ACE quality data. This system significantly assisted administrators to communicate quality metrics to physicians and non-physician staff. Hillcrest Medical Center (HMC): Data Tracking and Transparency In the last year of the demonstration, HMC increased its tracking of readmissions for ACE patients to improve quality of care and to reduce costs. In-depth reviews of readmissions at quality meetings and pre-meeting peer reviews identified problem areas with discharge and other metrics. As a result of the positive outcomes from the readmissions meetings, administrators and practitioners dedicated time to review every ACE outlier case to identify and correct quality issues. To help address outlier cases and decrease overall readmission rates, HMC incorporated patient navigators into its orthopedic team to identify potential patient outliers early in their stay.

IMPAQ International, LLC Page 52 Evaluation of Medicare ACE Demonstration May 31, 2013 Final Evaluation Report
2. MEDICARE COSTS AND SAVINGS
2.1. Research Objectives A major goal of the ACE Demonstration was to reduce Medicare-related costs, which through a bundled payment model allows stakeholders to share in cost savings. Administrators, physicians, and non-physician staff worked together to enhance efficiency relative to ACE DRG processes and procedures in order to achieve cost reductions and generate savings. Incentivizing physicians through revenues realized from cost-saving efforts was the major strategy employed by the sites to increase cooperation and efficiency. Questions during the site visits focused on how respondents identified alternative processes or changes in current operations to achieve savings and how such changes resulted in efficiencies and reduced costs at the facility and hospital system levels. The research team also sought to understand how administrators persuaded physicians and non-physician staff to engage and comply with demonstration initiatives to meet cost-reduction goals and other measures. To reduce Medicare costs, the ACE sites monitored the cost of materials used in cardiovascular and orthopedic units. A better understanding of costs would likely provide administrators and physicians with more opportunities to assess potential associations between the implementation of cost-saving efforts and changes in the costs of demonstration-related procedures. In this chapter, we summarize stakeholders’ responses to the questions developed for the Medicare costs and savings domain and provide a comparative analysis of the two site visits. The findings for each question reflect feedback obtained from target audiences (administrators, physicians, and non-physician staff) during each of the site visits. The narrative focuses on the strategies and activities that resulted in changes over the course of the demonstration across all sites. Appendix B.3 highlights details on Medicare costs and savings for several key components of the demonstration: equipment and products, efficiency, and provision of services.
2.2. Comparative Analysis Did the demonstration meet your expectations in terms of cost control? To achieve cost savings, administrators and physicians collaborated on vendor negotiations at the start of the demonstration. Most contract negotiations were for 3 years (the course of the demonstration) with escalator clauses. For example, physicians negotiated a 3 percent increase in the cost of materials over 18 months instead of a year.

IMPAQ International, LLC Page 53 Evaluation of Medicare ACE Demonstration May 31, 2013 Final Evaluation Report
During the initial site visit, respondents’ opinions about the effect of the demonstration on costs varied and were significantly tied both to stakeholders’ initial expectations of savings and to whether they believed it actually reduced costs throughout the demonstration. Some respondents stated that the demonstration’s cost-savings initiatives, such as vendor negotiations, significantly reduced costs and led to overall savings. However, other respondents hesitated to attribute any savings to the demonstration, believing that it had only a minor effect on costs and savings. Some respondents thought that cost savings were better realized on ACE orthopedic DRGs compared to cardiovascular procedures. As respondents emphasized during both site visits, orthopedic procedures seemed to have yielded greater savings because the expense of these procedures is closely linked to the cost of the implants and devices used. During the second round of site visits, greater consensus was observed. Respondents generally agreed that the demonstration met their expectations in terms of cost control. Most reported that the greatest cost savings stemmed from an improved vendor negotiation process. Stakeholders attributed cost savings to the standardization of implants and materials, which allowed materials managers and physicians to negotiate reduced prices. In contrast, cardiovascular surgeons who were employed by a hospital believed negotiations with vendors would have come about naturally without the presence of ACE. Respondents also mentioned other sources of cost savings, such as central supply, decreased length of patient stay, and utilization of physician consultations. They routinely noted the positive effect of physician participation in vendor negotiations and other cost-control procedures. Physician buy-in and engaged participation were key elements in initiating and maintaining strategies to realize cost savings. A positive externality resulting from the demonstration was that cost savings were extended indirectly to populations beyond the original Medicare program recipients: vendor negotiations and the subsequent savings were also applied to the Medicare Advantage and private insurance market. Thus, ACE had a broad effect on cost savings across all ACE DRGs.
What challenges did you face meeting cost-control goals?
Although respondents generally believed that vendor negotiations led to increased cost savings throughout the demonstration, the sites faced some obstacles in realizing those savings. First, physicians tend to develop relationships with and loyalties to vendors and materials, often having been trained in using specific brands. As a result, they often rely on the same product for each surgery, even though one product may be just as effective as another. Some physicians (cardiovascular surgeons much more frequently than orthopedic surgeons) expressed hesitation about changing vendors and products because they did not want any added uncertainty when performing surgeries that, at any moment, could become complicated. In addition, as hospital employees, cardiovascular surgeons at some sites were ineligible for gainsharing, so they had less motivation to participate in the goals of ACE.

IMPAQ International, LLC Page 54 Evaluation of Medicare ACE Demonstration May 31, 2013 Final Evaluation Report
Another barrier to cost savings throughout the demonstration, according to respondents, was the manual collection of cost data and the subsequent data analyses. The manual process required more staff and presented analytical problems; the sites monitored data on a case-by-case basis, which meant they could not implement a systematic approach. One site resolved this challenge by implementing an electronic reporting system, which also helped ameliorate the data lag that existed when data abstraction and analyses were performed manually. Respondents participating in the cardiovascular demonstration also identified a major implementation challenge related to DRG 247, percutaneous cardiovascular procedure with drug-eluting stent without major complication/comorbidity. DRG 247 procedures are subject to prepayment review by the Medicare Administrative Coordinator (MAC). The prepayment review substantiates the medical necessity for the procedure to occur in an inpatient setting. All sites reported having large volumes of inpatient DRG 247 claims denied for lack of medical necessity. In response, some sites contracted with external consultants to assist in reviews and determine the medical necessity of procedures for reimbursement purposes. Not only were these reviews time consuming for the sites, but they also required additional resources and administrative effort. Although this DRG was not intentionally excluded, confusion about submission within the ACE bundle meant that the MAC denied many of these claims as an ineligible inpatient procedure. Some administrators believed that, as a result, there was a loss of potential revenue and cost savings. Some administrators noted that the greatest challenge was identifying other potential opportunities for cost savings. They suggested that, because physicians’ gainsharing was capped at 25 percent of the fee schedule amount, it was difficult to keep some physicians engaged in finding additional cost savings, especially in the third year, when the initial excitement of the demonstration had worn off.
How do you coordinate with staff to control costs? Did this evolve over time?
Physicians and staff at all of the sites attended regular meetings to work together on various aspects of the demonstration, including cost control. Physicians worked in both formal and informal groups to identify areas, functions, and processes where costs could be reduced and procedures made more efficient. These groups were established in the first year and maintained throughout the demonstration. For example, an orthopedic group found that its members were using the same surgical toolkits for both hip and knee replacement surgeries, even though not all hip replacement tools are needed in knee replacement surgeries. Consequently, the hospital was able to realize significant cost savings through the elimination of unnecessary tools for knee replacement procedures. Although respondents saw standardized order sets and evidence-based practices as important features of quality improvement, they also viewed such practices as important tools to control costs. The standardization process required physicians to collaborate to improve care and reduce costs related to potential errors and readmissions. The standardization of order sets

IMPAQ International, LLC Page 55 Evaluation of Medicare ACE Demonstration May 31, 2013 Final Evaluation Report
also streamlined processes for non-physician staff and standardized expectations. Respondents believed these changes led to efficiencies and cost savings during the demonstration.
How have hospitals administrators encouraged physicians to conform to new expectations of increased efficiency and reduced costs?
Hospital administrators began meeting directly with physicians when the demonstration began in 2009. These meetings ensured physician buy-in to the changes and procedures developed as part of the demonstration. During both site visits, administrators noted the importance of involving physicians during the planning and implementation phases of the demonstration. These administrators clearly stated that early physician buy-in was critical to the success of this kind of demonstration, suggesting that physician-led ACE initiatives were more likely than administrator-led activities to motivate other staff and encourage program engagement, particularly in cost-savings strategies. However, they thought that the effect of physician gainsharing to increase efficiency and reduce costs may have worn off as a result of the gainsharing cap. The strategies implemented in previous years may have caused changes (if any) during the last year of the demonstration rather than any continuing motivation for change.
How have hospital administrators encouraged staff to comply with ACE Demonstration policies and procedures?
The demonstration sites had no explicit mechanism to ensure physician compliance. The two factors that encouraged physicians to comply with the changes introduced by the demonstration were the gainsharing requirements, based on quality and cost thresholds, and peer pressure. At all sites, physician performance was monitored through report cards with different levels of sophistication, which indicated each physician’s performance on quality and cost metrics and tracked whether the physician met gainsharing targets. In addition, because report cards showed the performance levels of all physicians, they fostered a degree of competition among physicians.
Increased transparency of data and information sharing with all staff were helpful in encouraging participation in the demonstration. Non-physician staff noted that standardized order sets increased procedural compliance among physicians as well as staff. Physicians and nurses cooperated to devise proactive plans for efficient patient care and discharge procedures. Standardized order sets made compliance easier because processes were documented in a uniform way. As the sites realized cost savings over the course of the demonstration, the willingness of physicians to apply new operational and monitoring procedures increased.

IMPAQ International, LLC Page 56 Evaluation of Medicare ACE Demonstration May 31, 2013 Final Evaluation Report
2.3. Summary Findings and Example Cases Summary Findings The most effective strategy in realizing cost savings was negotiation with vendors on surgical implants, equipment, and materials for orthopedic and cardiovascular DRGs, although primarily for the orthopedic service line. Previously, physicians worked independently with specific vendors to purchase equipment and were not always cognizant of the cost of favored devices and implants. As a result of the demonstration, physicians worked collaboratively to identify high quality, cost-effective implants and devices. At some sites, vendors were required to bid on contracts so that materials managers and physicians could shop for the best prices. Because physicians determine the type of products used, cost savings through vendor negotiation would not have been possible without their support. Administrators and physicians at each site began a series of meetings to identify and address cost-savings issues related to the demonstration, such as materials management, identification of ACE patients, and cost-control metrics. These ongoing meetings evolved as the demonstration matured. Physicians, particularly orthopedic physicians, established working groups to find and refine possible cost-saving elements in the procedures. The involvement of physicians in cost-control efforts proved critical at many sites. Physicians were given the flexibility and independence to make decisions regarding cost-saving measures that applied to surgical procedures and medical equipment. Often, they were able to identify aspects of these procedures and equipment that could be modified or excised to control costs. Gainsharing was one motivating factor in aligning cost-saving goals across stakeholders. It incentivized physicians to meet cost saving and quality metrics. At some sites, cardiovascular surgeons who were hospital employees were not eligible for gainsharing, which may explain why the demonstration was not fully embraced by those physicians. At some sites, administrators found that gainsharing caps limited physicians’ desire to stay engaged in cost and quality initiatives. The use of physician report cards as a tool for gainsharing proved to help control costs and improve quality. Administrators and materials managers regularly reviewed cost data and shared results with physicians. These reviews facilitated collaboration not only between administrators and physicians but also between materials managers and physicians. At some sites, sharing physician scores from the report cards stirred some competition among physicians. The transparency of cost data also contributed to improvements in cost savings. Physicians and administrators were able to compare equipment and materials costs and review products whose higher purchase price had little or no evidence-based justification. Throughout the demonstration, administrators and physicians often discussed the tension of balancing cost savings and the quality of services. Interviewees frequently cited the importance of quality over cost.

IMPAQ International, LLC Page 57 Evaluation of Medicare ACE Demonstration May 31, 2013 Final Evaluation Report
Example Cases Hillcrest Medical Center (HMC): Evidence-Based Protocols Physicians at HMC reviewed evidence-based protocols and were able to reference best practices when standardizing medical equipment and procedures. The standardization of equipment contributed greatly to the site’s ability to negotiate with vendors and obtain a reduction in the cost of equipment. Physicians retained some flexibility if the physician group reached consensus that a variety of equipment was needed, especially where there were (1) multiple physician groups with differing opinions about the best equipment and best practices, (2) patients who received multiple procedures, or (3) different cardiology products for inpatient and outpatient procedures. Standardizing equipment for cardiovascular procedures was difficult in the face of multiple vendors and products, which complicated the vendor negotiation process. With the ending of the demonstration, physicians and administrators at HMC are exploring new cost saving strategies. Administrators have implemented a recent initiative to increase cost savings on materials and products used by floor staff. Non-physician staff across the hospital system are required to electronically document all chargeable items they use according to physicians’ orders. As a result, costs for supplies are captured, and the hospital is able to track material cost trends and make informed decisions about product purchases. Lovelace Health System (LHS): Preference Cards LHS implemented a new strategy to increase cost savings on materials and products using preference cards, which require physicians to prioritize the use of materials and products. Administrators hope to standardize materials and reduce the use of small-quantity items to save on the cost of materials across the system. Realizing the potential for cost savings, LHS has also begun to look at how negotiation strategies, preference cards, and standardization of materials can be utilized in other services lines (such as spine surgery) to achieve costs savings. It is uncertain whether these other services lines will have the surgeons’ full support to undertake this approach.

IMPAQ International, LLC Page 58 Evaluation of Medicare ACE Demonstration May 31, 2013 Final Evaluation Report
3. VOLUME, CONCENTRATION, AND SPILLOVER
3.1. Research Objectives
Most administrators and physicians at ACE sites anticipated that the demonstration would have a positive effect on patient volume and cited volume increases as a motivating factor to participate in the demonstration. As part of the demonstration, sites tracked metrics related to patient and procedure volume and implemented ACE-specific marketing to increase awareness of the demonstration through advertisements and public campaigns. Questions pertaining to volume helped ascertain whether hospital administrators anticipated increases in volume and market share, the extent to which the demonstration affected the hospitals’ market share, and whether volume expectations affected the development of marketing plans. The evaluation team also investigated whether respondents attributed any observed changes in volume to ACE. Stakeholders discussed strategies to increase volume and address any unintended consequences, such as insufficient staff coverage to maintain quality of care as the volume of patients increased rapidly. Changes in patient volume were closely linked to issues of cost and quality of care. For this reason, elements and strategies discussed in those research areas are also included here. In this chapter, the OMB-approved questions in the volume, concentration, and spillover domain are linked to qualitative findings, and a comparative analysis of the two site visits is presented. The findings for each question reflect feedback obtained from each target audience (administrators, physicians, non-physician staff, and beneficiaries) during each of the site visits. We then present summary findings, with a particular focus on the strategies that resulted in changes over the course of the demonstration. Appendix B.4 highlights details on volume, concentration, and spillover effects for key components of the demonstration: provision of services and volume expectations and marketing.
3.2. Comparative Analysis Did the demonstration meet your expectations in terms of changes to patient volume? Initially, all of the sites believed that patient volume would increase as a result of the demonstration. Most also expected that CMS’ marketing would lead to increased Medicare market share for their hospital. However, as respondents described during both site visits, none of the hospitals that expected volume increases realized their expectations. Some respondents noted marginal increases but were reluctant to attribute them to the demonstration; instead, they cited other factors, such as physician reputation and newly opened facilities. In addition, in the first year of the demonstration, a small number of physicians who were unwilling to participate in the demonstration stopped performing procedures at ACE sites. Administrators

IMPAQ International, LLC Page 59 Evaluation of Medicare ACE Demonstration May 31, 2013 Final Evaluation Report
reported that these physicians were skeptical of the demonstration’s ability to increase quality and cost savings and were also hesitant about the structural changes made as part of the demonstration, such as new incentive policies, believing that such changes would significantly disrupt their practices. As a result of the loss of these physicians, patient volume decreased at some ACE sites. There were also external factors affecting volume, such as a significant number of surgeons retiring from practice. During both site visits, administrators reported a lack of awareness of the program among patients as the main barrier to volume increases. Administrators, physicians, and non-physician staff reported other volume constraints during both site visits. Physicians, staff, and beneficiaries reported that the Medicare shared savings check was not a high priority factor for patients in their selection of a hospital when compared to physician referral or hospital reputation.21 In addition, other patients, primarily cardiovascular patients, came to the hospital in emergency medical situations, leaving no option for choice. Thus, even beneficiaries who may have been aware of the ACE Demonstration could not have chosen an ACE site at the moment of the emergency. Beneficiaries confirmed that quality of care, the reputation of the hospital, and the reputation of the surgeon were the most important factors in choosing a hospital, not the Medicare shared savings check. During the focus groups, beneficiaries were largely unaware of the demonstration and the opportunity to receive Medicare shared savings from the participating sites. Some beneficiaries did not believe that they would receive a check, and those who did receive one were confused about the reason for it.
What were your marketing strategies for the demonstration? During the first year of the demonstration, the sites focused primarily on increasing awareness of the demonstration and, at some sites, advertising the Medicare shared savings incentive to beneficiaries through a variety of media such as brochures, radio advertisements, and billboards. As the demonstration progressed, marketing efforts decreased. Many sites refocused their marketing strategies from direct advertising about the ACE Demonstration to emphasizing the quality of the hospitals and the service lines offered. One site implemented physician-led seminars as the primary method to communicate with the public. Although these seminars were not specific to ACE DRGs, materials related to the ACE demonstration were available to seminar attendees.
Across the sites, administrators were disappointed with CMS’ limited marketing efforts. Some site administrators argued that CMS should have distributed targeted advertising to beneficiaries who might require an ACE procedure and that the agency should have supported the hospitals in local media. CMS did create ACE pamphlets, host speaking engagements, and create toll-free numbers for information; however, physicians and other staff at ACE sites expected increased local marketing efforts to be undertaken by the agency.
21
In their proposals to CMS, the sites included a variety of incentives to offer beneficiaries participating in the demonstration. The Medicare shared savings check, however, was the only incentive offered to beneficiaries throughout the demonstration at all the sites.

IMPAQ International, LLC Page 60 Evaluation of Medicare ACE Demonstration May 31, 2013 Final Evaluation Report
Over the course of the demonstration, have you observed any changes in the number and types of procedures performed in your department? During the initial and second site visits, most physicians and non-physician staff did not report any changes in the number and types of procedures performed as a result of the demonstration. At some sites, physicians and non-physician staff noted increases in the overall volume of procedures performed; however, they attributed these changes not to the demonstration, but rather to external factors, for instance, the opening of new facilities and the reputation of high-volume physicians. Sites that reported decreases in volume attributed the changes to factors such as the poor state of the economy and the fact that some physicians discontinued practice at the site because of the demonstration. Although the loss of these physicians caused initial drops in volume, administrators reported in the second site visit that volume had rebounded over the course of the demonstration.
3.3. Summary Findings Despite initial expectations that the ACE Demonstration would increase patient volume and subsequently increase market share, stakeholders did not perceive ACE as influencing volume over the course of the demonstration. Respondents expressed disappointment with CMS regarding the extent of the agency’s marketing efforts. Administrators and physicians also identified insufficient motivation for patients to receive care at ACE sites as a reason that patient volume did not increase as expected. Though many administrators and physicians anticipated that reputation and referral patterns would continue to influence choice, some respondents believed that financial incentives and effective marketing of these incentives would motivate beneficiaries to receive care at participating sites. However, beneficiaries responded that financial factors did not affect their choice of place of surgery. Also, some beneficiaries did not believe that they would receive cost savings on their procedures, and others were concerned that they might be getting lower-quality service. As the demonstration progressed and marketing efforts proved inconsequential, most sites reduced or eliminated their ACE marketing. Some refocused their beneficiary marketing strategies from direct advertisements about ACE incentives to advertisements that emphasized the quality of service lines and physicians. This shift was in response to an acknowledgement that patients’ choice of hospitals is heavily influenced by the referring physician and the reputation of the hospital and the surgeon. Stakeholders attributed the slight increases in volume that did occur at some of the sites to factors outside the ACE Demonstration. These factors included the reputation of the hospital’s physicians and newly opened facilities. The increases helped offset a decrease that some sites experienced in the first year of the demonstration due to the fact a small number of physicians

IMPAQ International, LLC Page 61 Evaluation of Medicare ACE Demonstration May 31, 2013 Final Evaluation Report
discontinued practice at ACE sites because they were unwilling to participate in the demonstration. With regard to concentration, physicians involved in the demonstration stated that they did not change the way in which they practiced in terms of procedures performed or place of practice. Though a potential increase in patient volume was an initial motivator to participate in the demonstration, quality of care was the most important factor to physicians throughout the demonstration; for this reason, they emphasized maintaining and modifying practices to enhance quality rather than changing practices to accommodate potential increases in volume. Most physicians after the first year of the demonstration chose to remain with their original hospital sites because of what they perceived as high-quality care and a positive culture. A specific type of spillover did take place—a spillover of ACE-related policies and initiatives from ACE DRGs to other DRGs and service lines. For instance, administrators at some sites encouraged non-ACE service lines to implement or expand upon standardized order sets as a result of their positive impact for ACE service lines. Thus, ACE was viewed as a catalyst for many processes that were introduced to other service lines within the hospital. Some sites also expanded vendor negotiations to non-ACE service lines as a result of their positive effect on cost savings. In addition, positive changes in communication, data availability, data analysis, and transparency initiated by hospital administrators made a demonstrable positive difference in coordinating care and in staff sensitivity to quality and cost-control strategies throughout the hospitals. As the demonstration progressed, these initiatives produced a change in culture that emphasized communication and transparency. This cultural change was particularly effective for non-physician staff—many of whom worked on multiple floors with both ACE and non-ACE-related patients and procedures—because they could share and expand positive initiatives to other service lines. Initially, administrators and physicians believed that increases in patient volume would lead to more efficient processes as physicians learned what worked best, performed more procedures in less time, and reduced complications and length of stay. These processes would consequently lead to reductions in costs. When respondents observed no ACE-related changes in volume at the start of the demonstration, sites focused their efforts at cost control on more internal strategies, such as vendor negotiations and physician report cards. Many respondents noted that vendor negotiations on implants contributed the overwhelming majority of the cost savings their sites experienced, which may offer some insight into the sites’ de-emphasis of expectations for more efficient processes due to volume. Volume increases were mentioned in cost-control discussions but did not seem to be a significant driver of savings for any of the sites.

IMPAQ International, LLC Page 62 Evaluation of Medicare ACE Demonstration May 31, 2013 Final Evaluation Report
4. INCENTIVES
4.1. Research Objectives
The ACE Demonstration resulted in the implementation of new structures and protocols to incentivize both physicians and patients. For physicians, the goal of gainsharing was to increase participation in the demonstration and influence acceptance of new or revised patterns of practice, quality of care, and patient management. For beneficiaries, Medicare shared savings—a concept that allows ACE beneficiaries to share in a portion of Medicare cost savings—sought to generate awareness of ACE and provide compensation for beneficiaries who chose ACE-participating hospitals for inpatient admission based on quality and cost. Questions asked in the incentives domain addressed policy and procedural changes to physician gainsharing and beneficiary shared savings. The evaluation team sought to understand how gainsharing and beneficiary shared savings contributed to the success of the demonstration. Of particular importance was whether the demonstration’s financial incentives affected physician and beneficiary behavior and, if so, in what ways. To manage gainsharing, a redesign and automation of data systems to monitor and report the data needed for gainsharing occurred at many sites. Administrators established forums of hospital administrators and physicians to communicate data and enhance the transparency of information. Greater transparency of quality and cost-savings metrics aided in garnering physician support of gainsharing policies and quality thresholds. Administrators also increased the review of performance (cost and quality) data to assess when targets required revision to retain physician eligibility for gainsharing participation. In this chapter, stakeholder responses to the questions in the incentives domain on gainsharing and Medicare shared savings issues and a comparative analysis of site visits are presented. Questions were asked to determine whether administrators, physicians, and beneficiaries perceived that incentives contributed to the success of the ACE Demonstration. The evaluation team also asked physicians and administrators about the challenges inherent in implementing the incentive program. Thus, the demonstration was also an opportunity to identify if there were alternative incentive mechanisms for physicians who were employees of the participating facility. The findings reflect the feedback obtained from each target audience (administrators, physicians, non-physician staff, and beneficiaries). Summary findings are presented, which include changes over the course of the demonstration at some sites. Appendix B.5 highlights details on incentives for several key components of the demonstration: volume, quality and coordination of care, and allocation of incentives.

IMPAQ International, LLC Page 63 Evaluation of Medicare ACE Demonstration May 31, 2013 Final Evaluation Report
4.2. Comparative Analysis Have there been changes to the physicians’ cooperation with or resistance to the demonstration overall? How about with demonstration-related hospital policies? How have they changed over time? The majority of administrators agreed that physicians’ cooperation in gainsharing had increased significantly over the course of the demonstration primarily because they had time to adapt to new policy changes and realized the benefits of gainsharing. Administrators and physicians noted that physicians needed time to adapt to the changes resulting from the demonstration, such as aligning their individual practice methods with the standardized protocols and equipment required by the hospital’s unique approach to the demonstration. As physicians started to receive gainsharing payments regularly, their engagement and cooperation generally increased. Initially, some physicians expressed resistance to the gainsharing policies presented by hospital administrators. This resistance was largely due to lack of understanding of the gainsharing methodologies and to physicians’ suspicion of the hospital’s ability to accurately report costs and process gainsharing payments in a timely manner. As the demonstration continued and physicians received their gainsharing checks, physicians at most sites gained trust in the gainsharing process. This trust increased their cooperation and overall satisfaction with the demonstration. Employee physicians in non-physician-owned hospitals, mostly cardiovascular surgeons, did not receive gainsharing; therefore, this benefit was not realized across all sites. In general, administrators faced challenges in engaging these physicians throughout the course of the demonstration. Employee physicians expressed disappointment in the inability to engage in gainsharing efforts themselves. Employee physicians in a physician-owned hospital, again mostly cardiovascular surgeons, did not receive gainsharing directly; instead, all gainsharing was placed into a general fund to be used to improve patient care. However, unlike employee physicians in non-physician-owned hospitals, these physicians were highly engaged with administrators to implement infrastructural and policy changes to meet quality and cost objectives throughout the demonstration. Administrators stated that increased communication and data transparency facilitated cooperation between administrators and physicians, particularly as the demonstration evolved and gainsharing was realized. Administrators at all sites initiated regular meetings with physicians that addressed physicians’ concerns and generated new ideas and policies, especially concerning vendor negotiations. Physicians noted that their participation in the implementation of the demonstration allowed them to have a better understanding of the demonstration as it related to gainsharing. It helped them to trust that they were not being asked to compromise quality of care, because quality and patient satisfaction were their most important goals. The majority of physicians agreed that hospital administrators never asked them to change their practice management in a manner that negatively affected patient care in order to save money.

IMPAQ International, LLC Page 64 Evaluation of Medicare ACE Demonstration May 31, 2013 Final Evaluation Report
Administrators stated that data sharing and in-depth analysis of cost and quality metrics also increased physician buy-in for the new or revised organizational protocols, quality of care processes, and patient management approaches. Administrators monitored performance through report cards that were made public among the participating ACE physicians at the facility. As noted by administrators and physicians in both rounds of site visits, the review of patient- and physician-level quality and cost data encouraged competition among physicians that led to improved quality. As quality and cost-control metrics improved, and as more physicians received gainsharing, physicians showed greater support for the demonstration. Some physicians at a few sites perceived gainsharing to be unethical and were uncomfortable with this aspect of the demonstration. These physicians were concerned that by receiving financial incentives they would be compromising what was best for their patients. At some sites, physicians were able to opt out of gainsharing but continue to practice in the facilities and perform ACE procedures. Although some physicians did not support gainsharing, they agreed with other aspects of the demonstration such as the use of evidence-based medicine.
Were the gainsharing policies modified during the demonstration? Was this in response to the demonstration?
Administrators made some relatively minor changes to the gainsharing policies at some sites over the course of the demonstration; the majority of sites did not introduce new or additional incentives. At two of the sites, physicians participated in or were negotiating co-management agreements with the administration, giving them more input regarding hospital policies and procedures. Co-management agreements are formal agreements between the hospital administration and physicians that allow administrators and physicians to coordinate on short- and long-term system goals and that give physicians the responsibility and authority to meet determined quality targets in order to receive financial incentives. Although not related to ACE, the agreement at one site guaranteed that physicians would receive 1 to 2 percent of the orthopedic service line revenue if quality and cost metric goals were met. A few administrators mentioned that they selected quality measures to align with other national quality-based initiatives such as value-based purchasing. They added these measures to the suite of metrics required for site-specific gainsharing eligibility. How have hospital administrators encouraged physicians to conform to new expectations of increased efficiency and reduced costs? Administrators used both communications and data to encourage physicians to follow the new policies and procedures related to the ACE Demonstration. As hospitals implemented new concurrent systems of data monitoring and reporting, administrators reported that they were able to analyze and disseminate accurate quality and cost data more rapidly throughout the hospital system. The transparency of information led to increased physician support: physicians could monitor their performance and track their use of materials, something they had not done

IMPAQ International, LLC Page 65 Evaluation of Medicare ACE Demonstration May 31, 2013 Final Evaluation Report
previously. The results were an eye-opening experience for many physicians and facilitated their engagement in the demonstration. The initiation of regular meetings between administrators and physicians also increased efficiency. These meetings enabled administrators and physicians to work together to find the best policies for their institutions and the most efficient ways to adhere to these new policies. As reported by administrators and physicians, physicians made clinical operations more efficient through the use of evidence-based clinical practices, while operational policies such as standardized order sets enhanced operational efficiency. These regular communication forums and the involvement of physicians permitted quick identification of barriers to quality and cost savings, as well as a rapid response to address any issues. Physician peer review initiated at some sites aided physicians’ understanding of activities that contributed to efficiency and cost savings and enhanced their adherence to the new policies. Have the hospital’s gainsharing policies influenced you to adjust your practices?
Many physicians asserted that their site’s gainsharing policies did not directly influence their individual practices but instead influenced collaboration and communication among physicians and between administrators and staff. These influences became evident in the peer review and the competition among physicians to achieve cost and quality metric goals. Although service lines adopted the use of new materials and equipment, patient management practices remained generally unchanged. Administrators argued that efficiencies gained as a result of hospital initiatives such as Joint Clubs and standardized order sets contributed to decreased patient lengths of stay at many of the demonstration sites. However, a few physicians believed that their hospitals’ gainsharing policies did influence their individual practices. These physicians often reported that they completed patient rounds earlier each day and that they discharged their own patients. Some physicians attributed aspects of this change to the implementation of standardized order sets. The majority of physicians interviewed agreed that patient satisfaction and quality of care were more important aspects of the demonstration than gainsharing. If the potential for gainsharing compromised quality of care, physicians said they would not be interested. However, some physicians noted that if quality of care was not compromised and gainsharing percentages were higher, they would make more conscious efforts to meet certain measures. Overall, most gainsharing-eligible physicians believed that the hospital’s gainsharing policies were beneficial both to them and to the hospital. They also thought that gainsharing was an effective mechanism for incentivizing physicians, particularly in the initial stages of the demonstration, when incentives helped to bring physicians and administrators together.
Did the demonstration meet your expectations in terms of gainsharing policies?
For the most part, physicians who were eligible to receive gainsharing agreed that they would have liked opportunities to receive higher amounts of gainsharing. Many physicians agreed that, unless they performed many surgeries, gainsharing proceeds were often not significant,

IMPAQ International, LLC Page 66 Evaluation of Medicare ACE Demonstration May 31, 2013 Final Evaluation Report
depending on the gainsharing structure at the facility. Each site executed the gainsharing structure in a different way. At some sites, physicians received gainsharing based on individual performance; at others, physician groups received an equal share based on the entire practice’s performance. Although the structure varied across sites, a 25 percent cap was enforced at all sites. While the cap on gainsharing was not viewed as a problem across all sites, some physicians and administrators expressed a desire to eliminate it, because they perceived it as unnecessarily restricting physician motivation to continue participating in ACE initiatives. Physicians suggested a few areas for improvement. At some sites, gainsharing was initially delayed. Although the payment delay issues had broader systemic sources, better communication between administrators and physicians might have alleviated physician concerns and skepticism about gainsharing. Many physicians mentioned that primary care practitioners played a significant role in the demonstration by referring patients to a particular surgeon or hospital, and they suggested that primary care practitioners should also receive gainsharing, since they drove the supply of patients.
Employee physicians did not receive gainsharing and therefore had no expectations about it.
Are there any hospital incentives for non-physician staff members for being a part of the ACE demonstration?
Administrators did not report incentives for non-physician staff. Some physicians thought, however, that non-physician staff should be able to participate in gainsharing, especially since staff compliance with quality measures can affect physician gainsharing.
For beneficiaries, were you aware of any incentives or benefits offered at this hospital prior to your procedure? Thinking about the benefits that are important to you, would you have had the procedure done here regardless of the benefits listed?
Most beneficiaries were not aware of ACE-related (or non-ACE-related) benefits offered at their hospital prior to their procedure. Some beneficiaries were aware of the availability of Medicare shared savings for their procedures, but the majority of those individuals stated that the financial incentive was not a factor in their choice of hospital. Most beneficiaries stated that their choice of hospital was determined by their physician’s recommendations and referrals, the location of the physician’s practice, and the hospital’s reputation, or just the emergent nature of the event. This response was uniform across all sites. However, some patients said that if all related factors were equal, they would go to the hospital that offered the Medicare shared savings incentive.

IMPAQ International, LLC Page 67 Evaluation of Medicare ACE Demonstration May 31, 2013 Final Evaluation Report
4.3. Summary Findings and Example Case Summary Findings Overall, administrators and independent physicians who were not employed by the hospitals expressed general satisfaction with the incentives implemented at their sites. Although there was some initial physician apprehension about gainsharing, this concern dissipated over the course of the demonstration as communication increased and financial incentives became a reality. Independent physicians agreed that the quality and cost goals and initiatives related to gainsharing changed the overall culture of their hospitals. Standardized order sets and physician report cards were mentioned together with quality and cost goals, since they were tied to gainsharing. During the initial implementation of the demonstration, administrators and physicians reported concerns regarding incentive payment delays. Many of the physician groups suggested that gainsharing should be expanded to primary care physicians and other staff integral to the care of the patient. Also, nearly all independent physicians agreed that gainsharing percentages should be higher. A few physicians opted out of the gainsharing portion of the demonstration or from the ACE sites due to perceived conflicts of interest or disagreement with the materials in the standardized order set. However, this was not widespread. Physicians argued that their behavior was not directly affected by financial incentives. Because physicians, as a rule, prioritize quality of care over financial incentives, they believed that any modifications to behavior resulted from quality initiatives, not from incentive policies. Though quality metrics are directly linked to gainsharing, financial incentives were seen as a secondary element of the demonstration; improved quality was seen as the primary objective. Transparency of information, particularly the quality and cost metrics in the physician report cards, contributed to physician engagement in the demonstration. The report cards not only were a vehicle for estimating gainsharing but also fostered some competition among physicians. The increased availability of data allowed physicians to track their individual metrics and appreciate how their performance contributed to bottom-line expenses and savings. Although quality of care was the main motivating factor for engaging physicians, gainsharing policies contributed to physician engagement in the demonstration because incentives motivated most physicians to perform well on quality and cost metrics. The emphasis on quality was especially evident with employee physicians, who were ineligible for gainsharing. Most sites did not alter their gainsharing policies after the inception of the demonstration. When incentive policies were changed, generally it was to add outcomes-based quality measures to the mostly process-based measures. However, some sites experienced challenges related to gainsharing. For instance, some administrators and physicians believed that caps on

IMPAQ International, LLC Page 68 Evaluation of Medicare ACE Demonstration May 31, 2013 Final Evaluation Report
gainsharing unnecessarily restricted physicians’ desire to be continually engaged in cost and quality initiatives. Patients generally were not aware of the ACE Demonstration prior to choosing the hospital for their procedure. For those who were aware of the demonstration, most appreciated the Medicare shared savings check, but the incentive was not a factor in selecting the hospital for their surgery. The reputation of the physician and the hospital or referrals from their primary care physician drove beneficiaries’ choice of hospital. However, some patients did note that, if all related factors were equal, they would go to the hospital that offered Medicare shared savings. Example Case Baptist Health System (BHS): Electronic Feedback System At BHS, gainsharing was closely tied to physician compliance with quality and cost benchmarks for ACE-related DRGs. Administrators used physician report cards to communicate cost and quality data and determine the incentive amounts. The implementation of Crimson Clinical Advantage during the demonstration significantly enhanced the communication and transparency of cost and quality data. This reporting system allowed BHS administrators to capture and communicate cost and quality data through report cards in real time, thereby engaging physicians in a rapid-cycle manner to address outliers and “red flags” and increase overall savings. Physicians appreciated the ability to actively affect gainsharing amounts by monitoring metrics and addressing problem areas in a timely, cooperative manner. Increased transparency also motivated administrators and physicians to add additional outcomes-based quality targets to their report cards. Adding outcomes-based metrics and therefore gainsharing opportunities further motivated physicians to actively seek ways to increase the quality of their performance.

IMPAQ International, LLC Page 69 Evaluation of Medicare ACE Demonstration May 31, 2013 Final Evaluation Report
5. INFRASTRUCTURE AND ORGANIZATION
5.1. Research Objectives The introduction of bundled payments and organizational arrangements as part of the ACE Demonstration required the sites to reevaluate and, in some instances, revise their policies and infrastructure to align with the demonstration’s goals of better quality of care, improved collaboration among hospital staff and physicians, and cost savings. Questions in the infrastructure and organization domain targeted changes to the infrastructure of the facility and gauged whether and how the sites’ organizational structure affected the demonstration’s success. Of particular importance was how the demonstration affected leadership and staffing roles, billing procedures, and policies. The evaluation team also sought to explore whether stakeholders thought the demonstration was improving or changing the operations at the facility and how administrators sought collaboration with staff and physicians. The sites implemented a variety of new organizational strategies to best respond to site-specific strategies to meet ACE quality and cost goals. One such strategy was the development of new tools to facilitate open communication and transparency. Better communication mechanisms across the hospital delivery system increased collaboration efforts and improved alignment among administrators, physicians, and non-physician staff towards achieving ACE-specific goals and monitoring progress in meeting quality and cost metrics. In this chapter, stakeholder responses to the questions in the infrastructure and organization domain and a comparative analysis of site visits are presented. The findings for each question reflect feedback obtained from the target audiences (administrators, physicians, and non-physician staff) during each of the site visits. The narrative focuses on the strategies and activities that resulted in changes over the course of the demonstration across all sites. Appendix B.6 highlights details on infrastructure and organization for key components of the demonstration: leadership, staffing and scope of activity, and billing and payment procedures.
5.2. Comparative Analysis Are you satisfied with the organizational changes that have taken place at the hospital as a result of the demonstration? Overall, respondents expressed a high level of satisfaction regarding the demonstration’s effect on infrastructure and organization. At some sites, the integration of ACE changes in infrastructure was seamless, so that some staff did not observe any changes as a result of the demonstration. Many respondents highlighted organizational changes that resulted in an increased level of communication among staff members, physicians, and administrators. For example, administrators met regularly with physicians and sometimes with non-physician staff

IMPAQ International, LLC Page 70 Evaluation of Medicare ACE Demonstration May 31, 2013 Final Evaluation Report
in ACE boards and committees to discuss the effect of policies and procedures implemented as part of the demonstration. One initiative that emerged from these communication forums was the standardization of order sets using evidence-based practices. Though some physicians considered these additional meetings a distraction from their primary responsibility to care for patients, most viewed them as a positive change that allowed for improvement in the physician-hospital relationship, administrative transparency, and system coordination and that ultimately helped them to achieve quality and cost-saving goals. Respondents during the second round of site visits repeatedly cited the increased level of communication resulting from the demonstration as a positive outcome. As the demonstration progressed, many administrators and physicians began involving non-physician staff in ACE committee meetings, including, among others, patient navigators, floor nurses, occupational and rehabilitation therapists, and cardiac catheterization lab technicians. These staff members participated in developing additional strategies that helped to achieve greater understanding of the demonstration along the service line and build commitment to its success. Some participants also emphasized that all clinical hospital staff were made increasingly aware of cost and quality data and outcomes as a result of ACE. Sharing of information and involvement of all parties was another factor that contributed to the positive perception of the demonstration among hospital staff. Many participants also thought that, through such communication and transparency, their sites gained team-oriented approaches to care, which they viewed as a positive change. Administrators also introduced some changes in human resources as a result of ACE. At the start of the demonstration, all sites hired full-time patient navigators or created new roles for existing case managers to handle ACE cases. Throughout the demonstration, ACE patient navigators guided patients and families through the hospital system and helped providers to manage and coordinate care. Patient navigators also identified ACE beneficiaries for administrative purposes. A majority of stakeholders viewed the patient navigators as a critical aspect of ACE administration and a resource that enhanced coordination of care. During the second site visit, most stakeholders noted that this role allowed staff to better coordinate across the hospital system. They also reported that the navigators were important to the overall patient experience. A few non-physician staff, however, viewed patient navigators as unnecessary because nurses, caseworkers, and other staff already performed similar interaction and coordination with patients. Many sites maintained patient navigators across all areas of the demonstration. Others repositioned them to focus on higher-volume orthopedic ACE DRGs and on those in which their involvement had larger effects on quality and cost. Physician research on evidence-based practices and devices supported vendor negotiations. As previously noted, vendor negotiations and standardized order sets helped administrators and physicians to standardize materials and successfully negotiate lower prices for implants and surgical implements. Administrators and physicians viewed lower prices as a positive ACE-inspired structural change.

IMPAQ International, LLC Page 71 Evaluation of Medicare ACE Demonstration May 31, 2013 Final Evaluation Report
Administrators perceived that the report cards significantly motivated physicians to support the demonstration and strive to attain quality and cost metrics. They noted that, although obtaining physician support was initially challenging, continuous open communication and collaboration encouraged physicians to acknowledge the value of data sharing. Physicians appreciated the increased data transparency that allowed an objective comparison of their outcomes with those of their peers. During the second round of site visits, administrators noted that the demonstration’s influence on physician collaboration with other stakeholders led to greater physician alignment with hospital goals and inspired administrators at some sites to initiate co-management agreements, at least within the orthopedic service line. These agreements allowed administrators and physicians to coordinate on short- and long-term system goals while requiring physicians to meet certain quality benchmarks in order to receive financial incentives. Administrators noted that physicians were receptive to and enthusiastic about the new co-management agreements and appreciated the opportunity to collaborate with administrators in the joint effort to improve quality of care and reduce costs.
What challenges did you face in making changes to infrastructure?
Some administrators, physicians, and staff perceived administrative difficulties with the patient navigator position. Participants noted that the patient navigators were often unevenly distributed across hospitals, even within a single system; one hospital might have several while another hospital might have none. Some administrators admitted that they struggled to find funding for the patient navigators. Because most stakeholders saw patient navigators as instrumental in preparing the standardized order sets and even directing parts of the administration, they desired to incorporate or expand the navigator role, but resource constraints often created obstacles. Several participants noted that their sites experienced growing pains as the business operations staff implemented policies and procedures related to the notification of admission. Billing and claims processing were significant issues for administrators during both the implementation and maintenance phases of ACE, primarily due to the manual processing22 required for Part B claims. If claims were incomplete or incorrect, staff had difficulty processing these data. At least one site hired an individual specifically to perform quality-control checks on claims data. Two sites used a third-party administrator to process the ACE patient claims, thus smoothing the process and helping to eliminate problems. Patients with comorbidities that required consultations with specialty physicians, for example in internal medicine or urology presented a unique challenge in claims processing. Many of these specialty physicians were not part of the demonstration, so sites struggled to devise methodologies to collect payments from these physicians as well as to collect copayments from beneficiaries.
22 Some sites were forced to develop manual processes for billing that required several work hours each month to complete to ensure that claims were processed properly.

IMPAQ International, LLC Page 72 Evaluation of Medicare ACE Demonstration May 31, 2013 Final Evaluation Report
Denial of payment in many cases of DRG 247 (percutaneous cardiovascular procedure with drug-eluting stent without MCC) by the Medicare Administrative Coordinator also presented a challenge for the ACE sites. The majority of these denials were overturned on appeal, but the lengthy appeals processes delayed payments to frustrated hospital administrators. The situation also created some tension with physicians, since they generally had to wait for Medicare to make the bundled payment to the hospital before the hospital reimbursed them. Respondents also noted some differences between the orthopedic and cardiovascular service lines that made implementation of changes to infrastructure challenging. During both site visits, administrators stated that cardiovascular and orthopedic procedures tended to follow different trajectories. As viewed by respondents, cardiovascular procedures generally had a higher rate of complications and “unknowns”—that is, a physician might begin operating and then find an undiagnosed condition complicating the original surgery. Although this kind of uncertainty is possible in orthopedic cases, it appears to occur less frequently. As noted by cardiovascular physicians in the first site visit, the higher rate of complications and unknowns increased the challenges related to standardization. Some physicians wanted the ability to order a variety of preferred devices and equipment, believing that having various tools on hand would enhance their ability to react to unanticipated surgical findings. Moreover, cardiovascular surgeons felt that, given the risky nature of cardiovascular surgery, they had fewer choices for vendor negotiations, because they did not want to sacrifice optimal outcomes for cost savings. In addition, cardiovascular surgeons worked with many types of physicians more frequently than did orthopedic physicians; this collaboration complicated standardization, because physicians had different opinions about best practices. Also, the cardiovascular surgeons were limited in their ability to prepare patients for surgery, because many cardiovascular patients received surgery in an emergency situation. As discussed in the second site visit, many of these challenges were ameliorated as cardiovascular and orthopedic physicians availed themselves of evidence-based literature, introduced standardization into their routine surgical procedures, and shared best practices at system-wide meetings, both as part of the ACE Demonstration and for other purposes. Staff turnover at some sites also created some challenges as a result of inconsistency, although staff turnover was not attributed to the demonstration. Respondents believed this turnover slowed the implementation process.
Have there been changes to the physicians’ cooperation with or resistance to the demonstration overall?
Physicians tended to cooperate more fully with demonstration policies and procedures as the demonstration progressed. Some had expressed initial resistance with regard to the transparency and availability of quality data and physician report cards, but this resistance diminished over time as a result of open and continuous communication among physicians,

IMPAQ International, LLC Page 73 Evaluation of Medicare ACE Demonstration May 31, 2013 Final Evaluation Report
administrators, and non-physician staff. Administrators and physicians also attributed the decrease in resistance to a culture shift as the demonstration progressed, and in some cases expanded, throughout the hospital system. During the first site visit, many physicians expressed hesitation regarding gainsharing, but this skepticism diminished as the financial returns were realized. Positive patient results further encouraged physicians, particularly with regard to post-operative recovery time and comfort. Administrators noted that physicians generally had subtle differences in surgical practices that, according to the administrators’ review of the literature, added no value to the quality of patient care relative to other surgical practices that had a lower cost. Over time, physician peer pressure led to enhanced standardization and lower costs of care. However, customization was accommodated as needed, with physicians reviewing the need for the divergence in procedures or protocols. Administrators gained support also through the use of physician champions who met directly with groups of physicians to discuss ACE policies and procedures and encouraged peers to develop and adopt ACE-specific initiatives. Physician engagement was important. Physicians formed working groups or steering committees to discuss and implement changes ranging from vendor negotiation processes to the use of standardized order sets. At some sites, with the agreement of hospital administrators, physicians were able to co-manage and assume accountability for outcomes in their particular service lines. These actions further increased cooperation with and enthusiasm for the demonstration. Stakeholders noted that improved relationships between physicians and non-physician staff, particularly nurses, also helped to garner physician support for the demonstration.
5.3. Summary Findings and Example Case
Summary Findings Overall, administrators, physicians, and non-physician staff perceived that the ACE Demonstration had a positive effect on hospital policies, internal structures, and overall organization. The implementation of tools to facilitate communication and transparency across the hospital system fostered improved physician-administrator relationships and overall system coordination, positively affecting the quality and coordination of care. ACE boards and committees facilitated communication between various members of the hospital staff. These communication forums brought administrators, physicians, and, in some cases, non-physician staff together to discuss ACE-specific goals and to develop strategies to meet quality and cost metrics. As the demonstration progressed, the effect of increased communication and transparency efforts initiated by administrators trickled down to non-physician staff. Many non-physician staff members found it easier and more comfortable to address comments to physicians and express concerns after the demonstration was implemented.

IMPAQ International, LLC Page 74 Evaluation of Medicare ACE Demonstration May 31, 2013 Final Evaluation Report
Administrators encouraged physicians to standardize materials across service lines and worked with physicians to negotiate better prices as a result of the standardization and transparency of cost data. Administrative support for physicians to lead vendor negotiation processes improved the physician-administrator relationship; administrators and physicians perceived this support as allowing for an increase in cost savings during the demonstration. Obtaining support from physicians regarding infrastructure changes was an initial challenge for administrators. Physicians at many sites were suspicious of the changes being implemented and hesitated to support them. Once the positive effect of organizational changes became apparent and administrators involved physicians in the implementation of the demonstration, physicians aligned with administrators to meet the goals of cost saving and maintaining or improving quality. At many sites, administrators gained physician support by including physicians in planning and by identifying physician champions to take the lead on initiatives that would support administrator and physician goal alignment and collaboration with staff. Physicians and administrators noted increased communication and transparency, through regular meetings and data sharing, as crucial components not only of the overall success of organizational changes and policies but also of obtaining physician support. A majority of stakeholders viewed patient navigators as a critical aspect of ACE administration and a resource that enhanced coordination of care. Patient navigators allowed staff to better coordinate across the hospital system and were important to the overall patient experience. Sites that lacked staff and organizational mechanisms to engage in significant collaboration across the hospital system prior to the demonstration benefited significantly from having patient navigators. A significant challenge for sites throughout the demonstration was the new ACE billing and payment processes. Sites expended considerable time and resources to develop and implement processes for ACE payments and adjustments related to Medicare Part B. Many sites hired additional staff to oversee the accurate and timely execution of billing and payment processes. Some infrastructure differences between the orthopedic and cardiovascular service lines continued to exist. Orthopedic service lines were often more flexible and receptive to changes, particularly in vendor negotiations, because physicians in this service line had somewhat more freedom to negotiate with vendors and modify the equipment that they used for procedures. Cardiovascular surgeons had to work with many types of physicians much more frequently than did orthopedic physicians, a fact that complicated standardization. Cardiovascular surgeons also felt that, given the risky nature of cardiovascular surgery, they had fewer choices for vendor negotiations, because they did not want to risk a poor outcome simply to achieve cost savings. However, as in the case of physician support for the demonstration, most of these differences and challenges were ameliorated as the sites adapted to organizational changes. Physicians shared information, data, and best practices with their peers, both in their own service line and in other service lines, during physician-administrator meetings, and they increasingly worked collaboratively over the course of the demonstration. This open communication and

IMPAQ International, LLC Page 75 Evaluation of Medicare ACE Demonstration May 31, 2013 Final Evaluation Report
information sharing also encouraged physicians to scrutinize their own practices that affected quality metrics and cost data; these practices also affected gainsharing and patient perception of the inpatient experience. Some sites instituted or were in the process of developing co-management agreements. In some cases, these efforts were influenced by or derived from the demonstration’s goals to increase quality of care while simultaneously decreasing the cost of care by fostering coordination across the hospital system. The demonstration’s emphasis on bringing stakeholders together to collaborate on achieving hospital goals motivated hospital administrators to continue these initiatives through co-management agreements. These agreements allowed administrators and physicians to coordinate on short- and long-term system goals, while giving the physicians the responsibility and authority to meet the determined quality targets in order to receive financial incentives. Though such agreements may be instrumental in achieving long-term quality and cost goals for the demonstration sites, they did not affect the ACE DRGs. Example Case Baptist Health System (BHS): ACE Committee At BHS, hospital physicians implemented the Physician’s Alliance for ACE (PAACE) Board. The role of the PAACE Board was to develop rules of governance for the demonstration, develop and monitor quality measures, and design the physician gainsharing payment structure. The board, which met quarterly, had a diverse mixture of participants, including physicians (such as orthopedic and cardiovascular surgeons), hospital administrative personnel, and community board members. BHS also implemented clinical subcommittees to oversee ACE-inspired quality-related initiatives. Clinical subcommittees staffed by physicians developed and monitored quality metrics and made decisions regarding the medical devices used at BHS. One initiative that resulted from these meetings was the production of standardized order sets, which were believed to have improved the efficiency and quality of care.

IMPAQ International, LLC Page 76 Evaluation of Medicare ACE Demonstration May 31, 2013 Final Evaluation Report
6. SATISFACTION
6.1. Research Objectives Satisfaction with the demonstration on the part of administrators, physicians, non-physician staff, and beneficiaries is a key component of the ACE evaluation and an indicator of success. Respondents discussed their satisfaction with the demonstration and the factors that would have improved their experience. Questions in the satisfaction domain targeted patients’ satisfaction with the level and quality of care they received in the demonstration. Questions also targeted the satisfaction of administrators and physicians with the demonstration’s strategies and initiatives. Physicians, non-physician staff, and administrators were asked to comment on their satisfaction with the policies and procedures involved in the demonstration. The research questions sought to determine which aspects of the demonstration, if any, hospital staff would eliminate or change to increase their level of satisfaction. These questions highlighted trends and identified other notable findings that can be referenced for future bundled payment demonstrations. Each site implemented the demonstration differently in regard to gainsharing, standardization of procedures, and other policies; these differences may have affected the perceived level of satisfaction of the ACE respondents. Stakeholder support is likely to contribute to overall satisfaction, and physician satisfaction is likely to have a critical role in the ease of implementation and success of ACE. In this chapter, stakeholder responses to the questions developed for the satisfaction domain and a comparative analysis of the site visits are presented. Questions were targeted to determine stakeholders were satisfied with the changes introduced by the demonstration and the outcomes resulting from it, which aspects contributed to their satisfaction, and what could be done differently to enhance satisfaction. Findings for each question reflect feedback obtained from each target audience (administrators, physicians, non-physician staff, and beneficiaries) across demonstration sites. Appendix B.7 highlights details on stakeholder satisfaction with several key components of the demonstration: quality of care, infrastructure and organization, costs and savings, and volume.
6.2. Comparative Analysis What is your overall impression of the demonstration? Are you satisfied with the organizational changes that have taken place? What is your level of overall satisfaction?
Administrators expressed a high level of overall satisfaction with the ACE Demonstration. Many administrators reported that their quality and cost metrics improved, and they attributed at least some of this improvement to the demonstration. Some respondents commented that

IMPAQ International, LLC Page 77 Evaluation of Medicare ACE Demonstration May 31, 2013 Final Evaluation Report
they were particularly glad to have the opportunity to “test drive” the bundled payment methodology and as a result had a better idea of how it functions in their hospital setting. Administrators noted that increased and improved communication between administrators and physicians through meeting forums such as ACE boards and quality and cost subcommittees, as well as operational meetings for the purpose of standardizing procedures and reviewing overall hospital and physician-specific quality data, led to greater satisfaction with the new processes and other changes that took place because of the demonstration. During both site visits, many physicians reported satisfaction with the demonstration. Physicians agreed that the perceived increase in quality of care at the sites was the most significant factor influencing their satisfaction with the demonstration. Physicians cited this reason more often than any other initiative or strategy associated with the demonstration, including gainsharing. However, when prompted, the physicians who were not employed by the hospital system in which they practiced (and thus eligible for gainsharing) noted that gainsharing contributed to their satisfaction. Some physicians—most notably physicians who were not actively involved in planning and implementing the demonstration—were indifferent about the demonstration. These physicians stated that they had not seen any significant changes, either positive or negative, at their sites since the beginning of the demonstration. However, when prompted, some acknowledged that quality initiatives such as standardization of processes and materials and data transparency resulted in positive changes. A small number of physicians expressed dissatisfaction with the demonstration. One reason was the lack of gainsharing opportunities for employee physicians in non-physician-owned hospitals. In general, administrators faced continued challenges in engaging these employee physicians throughout the course of the demonstration. Employee physicians practicing in a physician-owned hospital also did not receive gainsharing directly, but they appreciated the opportunity to use the money to invest in hospital resources. These physicians were highly engaged with administrators throughout the demonstration to meet quality and cost objectives. They expressed high satisfaction with the demonstration because it allowed them to improve hospital performance and enhance the alignment of strategies with administrators. In addition, some gainsharing-eligible physicians expressed dissatisfaction with the limited amount of gainsharing—commenting particularly that caps on gainsharing stifled motivation to achieve further cost-reduction and quality improvement targets. Though differences between the orthopedic and cardiovascular service lines were not a direct source of dissatisfaction among administrators, physicians, and non-physician staff, these differences did affect how stakeholders perceived the demonstration’s overall success. Cardiovascular surgeons commented that, although standardization of protocols was desirable, unanticipated procedures were often required when patients needed emergency surgical intervention, so that standardization was not always possible. Some cardiovascular surgeons expressed satisfaction with the ability of cardiovascular surgeons and administrators to work

IMPAQ International, LLC Page 78 Evaluation of Medicare ACE Demonstration May 31, 2013 Final Evaluation Report
together. Better collaboration across disciplines was viewed as a positive step for their hospital’s delivery systems. Consistent with administrators’ perspectives, physicians perceived a lack of or only minimal CMS marketing of the demonstration, a perception that created a sense of dissatisfaction. Many physicians had anticipated that there would be more CMS advertising, which they expected would increase patient volume. Though their awareness or knowledge of the demonstration was often limited, non-physician staff seemed pleased with the demonstration, particularly when prompted about specific changes such as standardized order sets, data sharing, and patient navigators’ roles in coordinating care. They also expressed satisfaction with the increased level of communication, particularly with physicians. However, many non-physician staff felt that they had a limited role in the operation of the demonstration.
Billing personnel expressed dissatisfaction with the manual processing required for Part B claims. Financial management staff expressed dissatisfaction with having to “chase” patients for their copayment for services as a result of the ACE payment process. Prior to the demonstration, this task was the responsibility of physicians’ offices; however, during the demonstration, most sites transitioned this responsibility to the hospital’s billing office. This transition of duties elevated the physicians’ level of satisfaction while adversely affecting satisfaction among the billing staff. Another area of dissatisfaction among business operations staff was changes in the DRG classification once the claim was submitted to the MAC for reimbursement. These changes resulted in hospital billing personnel having to reprocess claims manually, which was time consuming. Finally, the MAC’s denial of claims, mostly in DRG 247 procedures, was uniformly a source of dissatisfaction among administrators and financial operations staff. The appeals process was described as a protracted, arduous, and time-consuming activity that usually resulted in payment to the hospital, but often left unreimbursed claims on their financial sheets for 2 years or longer.
For physicians who have privileges at other hospitals, are there aspects of the demonstration that persuaded you to perform the procedures here? Which aspects of the demonstration did you find particularly attractive? Most physicians stated that the demonstration did not factor, or at least not significantly, into their decision to perform a procedure at an ACE-participating site. Many performed procedures at a particular hospital because they had privileges at that hospital or usually performed surgical procedures at that facility. Many physicians stated that they performed their procedures at a particular hospital because of the quality of care that their patients received; the fact that the hospital was an ACE Demonstration site was coincidental. In some instances, physicians alluded to the idea that their patients were comfortable with or preferred that hospital. However, beneficiaries indicated that they followed their surgeons’ recommendations of the hospital for their surgery. With a few exceptions, physicians said that they did not

IMPAQ International, LLC Page 79 Evaluation of Medicare ACE Demonstration May 31, 2013 Final Evaluation Report
perform procedures at a hospital specifically because of the hospital’s participation in the ACE Demonstration or because of gainsharing.
For beneficiaries, what aspects of your experience contributed to your satisfaction? Most beneficiaries expressed a lack of awareness of the demonstration prior to, during, and often after their procedures. Beneficiary awareness of the program did not increase between the initial site visit and the second site visit. Those who received the Medicare shared savings incentive noted that they were surprised and grateful for the check but that it was not a source of satisfaction with the demonstration. When asked whether their choice of hospital or physician would have changed if they had known before their procedure that they could receive the incentive, a large majority of the beneficiaries said that the check would not have influenced their choice. During both rounds of site visits, beneficiaries expressed satisfaction with their hospital stay and the quality of their care. On a scale of 1 to 4, beneficiaries usually gave ACE sites a score of 3 or 4. However, given their limited awareness of the demonstration, beneficiaries did not attribute their satisfaction to the demonstration. Quality of care and personal attention from physicians and non-physician staff, including patient navigators and floor staff, working both individually and as a team, were often mentioned as the most satisfying factors, as was coordination of care both in the hospital and after discharge. Patients routinely responded positively when asked whether their needs had been met through the quality of care they received, care coordination upon discharge, or orthopedic programs targeted to improve their rehabilitation such as the Joint Club.
6.3. Summary Findings Overall, administrators were satisfied with the operational and clinical strategies undertaken as part of the demonstration, especially initiatives such as vendor negotiations and standardization of processes and materials that helped to realize cost savings. ACE boards and committees and data sharing, which gave administrators tools to engage and collaborate with physicians to achieve shared goals of cost savings and high-quality care, also heightened administrators’ satisfaction with the demonstration. Furthermore, the demonstration allowed administrators to achieve their goal of gaining experience in the bundled payment approach, preparing them for what they believed would be the Medicare payment method in the near future. Having achieved this goal enhanced administrators’ satisfaction across all demonstration sites. Physicians held various opinions regarding their satisfaction with the demonstration’s strategies and its overall effect on hospital goals. Many physicians, particularly those who were involved in planning and implementing the demonstration and whose relationship with hospitals evolved to include co-management agreements, reported a high level of satisfaction. These physicians often noted increased teamwork and communication among fellow physicians, non-physician

IMPAQ International, LLC Page 80 Evaluation of Medicare ACE Demonstration May 31, 2013 Final Evaluation Report
staff, and administrators as integral to their satisfaction. On the other hand, there were a number of physicians who expressed neutrality toward the demonstration. And there were particular cases where employee physicians were dissatisfied with the ACE Demonstration’s limitation on gainsharing opportunities, not the concept of gainsharing itself, because employee physicians were not able to participate. In some cases, caps on gainsharing were seen as stifling physicians’ motivation to participate in achieving further cost and quality gains. Non-physician staff were also generally satisfied with the demonstration, particularly as a result of the standardization of order sets, which smoothed processes and allowed staff to work more efficiently and collaboratively to accomplish tasks. Open communication among non-physician staff and between physicians and non-physician staff as a result of standardization, data transparency, and ACE-related meetings eased collaboration and promoted dialogue among health care providers, thus increasing overall satisfaction. At some sites, the limited involvement of clinical staff in planning and implementing ACE resulted in neutral feelings regarding the demonstration and its effect on daily work responsibilities. Some staff desired more active involvement in the early planning and implementation processes of the demonstration and believed that more involvement would have increased satisfaction and overall success. The business operations staff expressed strong feelings regarding aspects of the demonstration that adversely affected their satisfaction, most notably new work burdens as a result of the manual processing required for Part B claims. Beneficiaries expressed a high degree of satisfaction with the quality of care they received at participating sites, noting that the coordination of care and follow-up were exceptional. Due to their limited awareness of the ACE Demonstration, however, beneficiaries attributed the perceived high quality of care not to the demonstration but to specific physicians and staff and to the hospital system as a whole.

IMPAQ International, LLC Page 81 Evaluation of Medicare ACE Demonstration May 31, 2013 Final Evaluation Report
7. COMPARATIVE ANALYSIS CONCLUSIONS In this summary of the main findings from the comparative analysis of the two site visits made during the ACE Demonstration, we organize the findings by core elements in the implementation of the demonstration. These elements highlight the most significant overarching successes that the sites achieved and the challenges that they faced in implementation. These core elements may be useful in making decisions regarding the feasibility of future bundled payment efforts. The research domains (quality and coordination of care, cost savings, volume, and satisfaction) affected by these implementation elements are noted in [brackets] after the core element (italicized). The ACE Demonstration sites implemented and refined strategies to achieve cost savings and quality and coordination of care goals throughout the demonstration. Though participating sites were at different stages of cost and quality measurement and reporting prior to the demonstration, the ACE Demonstration served as a catalyst to enhance quality awareness and underlined the importance of monitoring and communicating quality and cost benchmarks across the delivery system. Administrators implemented and in some cases expanded upon strategic initiatives to meet the quality and cost objectives established in the demonstration. Engaging physicians in such initiatives early in the planning process increased physician support and enhanced administrator and physician collaboration throughout the demonstration. Venues such as ACE-specific boards and subcommittees [quality and coordination of care, cost savings] fostered stakeholder collaboration and, in many instances, resulted in innovative strategies to achieve quality and cost goals such as standardization of processes and materials and sharing of physician report cards. Standardization of operating processes and materials [quality and coordination of care, cost savings] significantly enhanced coordination and quality of care across the hospital system at ACE sites. Engaged physicians coordinated with administrators to achieve the standardization of order sets and materials. Once physicians came together to meet ACE hospital goals, they responded positively to the process of comparing their practices and cost and quality outcomes with those of their colleagues and to the opportunity to apply evidence-based practices at the sites. Over time, standardized order sets were incorporated as part of the culture of ACE sites that previously did not have them. In locations that had implemented standardized order sets before the demonstration, such as HMC’s cardiovascular service line, the demonstration encouraged stakeholders to look for additional opportunities to streamline care, inspiring further standardization of processes and materials. Standardization was most effective when all affected physicians were invited by administrators to participate in the processes involving changes to their practice protocols early in the standardization process. Of the two service lines, the orthopedic service line experienced more success with standardization than did the cardiovascular line because procedures such as hip and knee replacements are usually prescheduled surgeries. Because cardiovascular procedures

IMPAQ International, LLC Page 82 Evaluation of Medicare ACE Demonstration May 31, 2013 Final Evaluation Report
are often done in emergency situations and are more likely to have unforeseen complications, cardiovascular surgeons were hesitant to standardize their established processes and materials; in cases where standardization was pursued, it was difficult to achieve. ACE patient navigators [quality and coordination of care] helped to bridge gaps in care coordination, particularly in high-volume service areas—mostly orthopedic service lines—and at sites where there were limited resources for coordination. Staff and physicians often did not have the resources to effectively coordinate across the system, but designated patient navigators enhanced coordination efforts, which improved coordination across multiple disciplines. The ACE Demonstration served as a catalyst for hospital administrators to monitor the cost of materials used in cardiovascular and orthopedic units and to monitor trends in these costs over time. A better understanding of costs gave administrators and physicians opportunities to assess potential associations between the implementation of cost-saving efforts and changes in demonstration-related procedure expenses. According to administrators, vendor negotiations [cost savings] on surgical implants, equipment, and materials in both orthopedic and cardiovascular DRGs produced the greatest cost savings for the ACE sites, particularly during the initial phases of the demonstration. Materials managers worked collaboratively with physicians to negotiate reduced prices on standardized implants and materials. As materials managers exhausted opportunities for reduced prices, the effect of vendor negotiations waned. Toward the end of the demonstration, sites looked to alternative strategies, such as reductions in length of stay, for continued cost control. Orthopedic service lines often benefited more than cardiovascular lines from vendor negotiations because physicians in this service line had somewhat more flexibility to modify and standardize equipment and materials and, therefore, to negotiate reduced prices with vendors. Data transparency [cost savings, quality of care] on quality and cost issues improved the level of engagement of physicians and staff and heightened awareness of cost and quality outcomes, encouraging physicians and staff to work together to meet metric goals. Transparency in monitoring and reporting was particularly important. Administrators employed monthly physician report cards [cost savings, quality of care] on cost and quality data to increase the transparency of data. Physician report cards served as a driver for discussions among physicians and between physicians and administrators. The demonstration provided physicians with an increased awareness of the variation in costs of implants and other products; previously they had limited information on material costs and variations across products and vendors. The ease of accessing and analyzing data, in some instances through user-friendly electronic dashboard systems, increased opportunities to communicate about and collaborate on performance measures. Gainsharing strategies [incentives] implemented as part of the demonstration gave physicians incentives to achieve cost and quality benchmarks and to introduce operational changes. The process for determining eligibility for and distributing gainsharing varied at each site; however, policies that calculated a monthly aggregate for both cost savings and quality measures for

IMPAQ International, LLC Page 83 Evaluation of Medicare ACE Demonstration May 31, 2013 Final Evaluation Report
each ACE DRG and required administrators to communicate measures on a regular basis appeared to be the most successful in terms of physician compliance and satisfaction. At BHS, for example, each physician received a report card that provided data on quality and cost by patient, which was compared to aggregate scores for that hospital. Physicians whose scores fell below the aggregate scores did not receive gainsharing that month. Overall, gainsharing was well received by BHS physicians and created friendly competition among the physicians, which increased the quality of care at their facilities. Gainsharing initiatives resulted in different outcomes depending on the type of relationship that physicians had with the hospital. Gainsharing arrangements for independent physicians were most successful in increasing physician involvement in developing and complying with ACE-related initiatives. Among these physicians, orthopedic physicians benefited more from gainsharing than did cardiovascular surgeons because orthopedic practice requires more materials for which reduced prices could be negotiated with vendors. All physicians maintained that the ongoing effort to improve quality in the hospital system, not gainsharing, was the main driver of their participation in the demonstration. Physicians and administrators concurred that the cap on gainsharing—which required that payments to physicians not exceed 25 percent of the amount that is normally paid to them under the fee schedule for such cases—hindered further achievement of cost and quality goals, as did the fact that all participating hospitals chose not to extend incentives to non-physician staff. The ACE Demonstration did not have a significant effect, positive or negative, on patient volume or market share. Beneficiaries were largely unaware of the demonstration. Regardless of their awareness, beneficiaries did not prioritize the ACE Medicare shared savings incentives; instead, referrals from their primary care physician or reputation of the hospital or the surgeon who had privileges at that hospital influenced their choice of hospital. Administrators and physicians recommended expanding incentives to primary care physicians or referring physicians, who often drive where beneficiaries receive care. Some of the successful and easily transferable ACE-inspired policies and initiatives have been influential in enhancing quality and coordination of care and reducing costs in both ACE and non-ACE DRGs. The quality and cost outcomes of initiatives such as standardization of order sets and vendor negotiations influenced other service lines and disciplines to initiate similar strategies. In one instance, an entire hospital system was inspired to move from a silo-based to a collaborative system through standardization of processes across all facilities as a result of the positive outcomes realized by standardization under the ACE Demonstration.

IMPAQ International, LLC Page 84 Evaluation of Medicare ACE Demonstration May 31, 2013 Final Evaluation Report
CHAPTER III: CARRIER EXPENDITURES OCCURRING DURING ACE EPISODES AND
ASSOCIATED POST-ACUTE CARE COSTS

IMPAQ International, LLC Page 85 Evaluation of Medicare ACE Demonstration May 31, 2013 Final Evaluation Report
1. INTRODUCTION To obtain quantitative information about the impact of the ACE Demonstration on hospital costs, we analyzed Medicare claims data. We estimated the demonstration’s impact on two cost categories: non-DME carrier costs occurring during the inpatient episode, and PAC costs occurring during the 30-day post-discharge period. Inpatient hospital claims reflect a MS-DRG payment23 that does not specify the inpatient services delivered to Medicare patients under the MS-DRG payment. In contrast, the Medicare physician billing system (recorded in the carrier claims file) employs granular codes to indicate the specific services provided. Thus, the carrier claims allow us to observe the care provided to inpatients during the hospital stay by physicians and other non-institutional providers (such as physician assistants) as well as technical and laboratory/diagnostic services provided by some facilities (such as independent clinical laboratories). The carrier claims considered in our analyses exclude DME. Also, the majority (63 percent) of the claims were from solo practitioners; 35 percent were from multi-specialty clinics; and 2 percent were from clinics, groups, associations, partnerships or other entities. We refer to the set of non-inpatient claims as non-DME carrier or carrier claims, expenditures, or services. As part of our, we also explored the distribution of carrier services to investigate whether there were any cost trends for specific types of services. For this purpose, we considered the Medicare costs associated with categories of Healthcare Common Procedure Coding System (HCPCS) and Current Procedural Terminology (CPT) codes and reviewed summary statistics for each of the major procedure groups. In addition to analyzing the dollar value of carrier services provided during the hospital stay, we also considered total PAC costs during the 30 days following discharge and disaggregated the PAC analysis into several measures by type of PAC setting. All of the Medicare cost analyses were based on episode-level data and employed difference-in-differences (DID) models, discussed in detail in Chapter 1, Section 2.2.1. In the sections that follow, we present a global ACE estimate and site-specific estimates for each DID model. The models estimated for the cost analyses follow the same specifications as equation 1 in Chapter 1, Section 2.2.1 and use standard errors clustered by hospital to account for correlation among the error terms within hospitals over time and across beneficiaries. The person-level covariates ( in equation 1) included in the model are:
Age expressed in years
Indicator for female gender
Indicator for nonwhite race
Hierarchical condition category (HCC) community score.
23 For ACE sites, the claim payment amount in the inpatient claims data contained the entire bundled payment amount rather than the IPPS payment.

IMPAQ International, LLC Page 86 Evaluation of Medicare ACE Demonstration May 31, 2013 Final Evaluation Report
The coefficients for these covariates and the policy estimate are reported in the global DID models. However, for simplicity, we report only the policy estimate in the site-specific regressions results. The data used in the models reflect inpatient episodes with discharge dates ranging from October 1, 2007 through September 30, 2012 for BHS, OHH, HMC, and LHS. As explained in the Data section (Chapter 1, Section 2.2.2) ESJH was excluded from the analyses because it lacked sufficient case volume for the ACE DRGs. The reasons for the low volume were that it experienced delayed demonstration implementation and had a high proportion of Medicare beneficiaries enrolled in Medicare Advantage in its market area. The ACE and non-demonstration treatment group pre- and post-periods were defined on an ACE site-specific basis. However, because the true comparison groups were identical for all ACE hospitals, we used a single “implementation date” for the true comparison hospitals for the summary statistics tables and the figures comparing the pre- and post-implementation periods. For the true comparison hospitals, the pre-period is specified as October 1, 2007 through May 31, 2009 and the post-period is June 1, 2009 through September 30, 2012. DID regressions, however, do not require us to code observations drawn from the true comparison group hospitals as pre- vs. post-implementation, because the DID models include quarter fixed-effects rather than a pre- vs. post-implementation period dummy.

IMPAQ International, LLC Page 87 Evaluation of Medicare ACE Demonstration May 31, 2013 Final Evaluation Report
2. CARRIER COSTS DURING THE INPATIENT EPISODE Under the ACE Demonstration, participating hospitals received a bundled payment from which hospitals, physicians, and other individuals and entities providing services in certain settings were paid for the services they provided during the hospital stay. As the risk-bearing entities in this arrangement, all ACE sites agreed to continue paying physicians and other providers according to the Medicare fee schedule. Thus, under the bundled payment arrangement, hospitals were expected to seek to generate savings and avoid losses by keeping total hospital plus other provider costs below the total bundled payment amount. This cost saving goal could be achieved by a combination of strategies: reducing internal hospital costs and/or other providers’ billing for services. As discussed previously, we were unable to observe hospitals’ internal cost data, but our qualitative data suggest that hospitals were successful in increasing efficiency through measures such as standardizing order sets, standardizing implants and materials, and negotiating with vendors, and improving coordination of care through the use of patient navigators or ACE case managers. We did, however, observe the dollar value of services delivered by other providers during the inpatient stay by using the carrier claims files. We then explored the hypothesis that the dollars’ worth of carrier services (paid from the bundled payment) decreased in response to the demonstration. However, there are two alternative hypotheses. One posits that hospitals accepted increases in carrier costs to achieve savings in inpatient hospital services. This assumes that some services provided by hospitals and those documented in the carrier claims are substitutes and thus there is a trade-off between capital (hospital) and labor-intensive (e.g., physician) services. For example, perhaps hospitals accept higher costs from additional or longer physician visits if those visits result in earlier discharges. The other hypothesis is that standardized order sets and quality requirements resulted in additional hospital services for which carrier services are complements. For example, additional diagnostic tests ordered as a result of standardization of procedures would increase both internal hospital costs (diagnostic tests performed during the hospital stay are paid from the MS-DRG payment) and physician costs (claims submitted by radiologists interpreting tests would be paid out of the ACE bundle). This argument may be supported by the fact that the ACE sites tied physician gainsharing to quality thresholds and implemented standardized order sets that may have required more physician or other provider services billing through carrier claims.
2.1. Measure To estimate the impact of the ACE Demonstration on physician services provided during the hospital stay, we developed carrier cost measure, equal to the sum of the claim payment amounts for non-inpatient services included in the episode of care. The episode of care includes payments for services provided by physicians or other providers during the inpatient stay with

IMPAQ International, LLC Page 88 Evaluation of Medicare ACE Demonstration May 31, 2013 Final Evaluation Report
place of service equal to inpatient (21), outpatient (22), emergency room (23), or independent laboratory or diagnostic facility (81). 24 To develop the non-DME carrier cost measure, we used the Part B files provided by CMS and kept all claims having one of the four place-of-service codes listed above. This resulted in a file containing only non-DME carrier claim type codes. Among these remaining claims, almost two-thirds (63 percent) were from solo practitioners, 35 percent were from multi-specialty clinics; and 2 percent were from clinics, groups, associations, partnerships or other entities. The relevant carrier claims were then merged to the inpatient analytic file (which lists the inpatient episodes for ACE, non-demonstration treatment, and true comparison hospitals) by patient identifier (HIC) and time period. For each beneficiary appearing in the inpatient analytic file, carrier records having claim from/claim through periods that overlapped with the admission date minus 7 days through discharge plus 7 days were merged to the inpatient analytic file.25 This resulted in multiple rows (charges) per inpatient stay, with each row containing carrier claim payment amount information. These multiple carrier claim payments were aggregated to a single amount for each inpatient episode.
2.2. Results This section provides the results of the cost analyses for physician services. We first present summary descriptive statistics for the carrier cost measure, followed by the DID regression results. Exhibit 14 provides summary statistics (mean, standard deviation, and sample size) for the dollar value of carrier services included in the ACE episode of care. Statistics are presented for the ACE sites, non-demonstration treatment hospitals, and true comparison hospitals and are disaggregated by pre- and post-implementation period and by procedure group. The ACE and non-demonstration treatment group pre- and post-periods are defined on an ACE site-specific basis. However, the true comparison groups are the same for each ACE hospital. As described previously, for the purpose of the summary statistics exhibits, including Exhibit 14, we designate June 1, 2009 as the effective implementation date for the true comparison group. This exhibit indicates that the value of carrier services delivered during the hospital stay increased for all three groups of hospitals across all major DRG groups.
24 McCall N, Dalton K, Cromwell J, Greenwald L, Freeman S, Bernard S. (August 2008). Medicare Acute Care Episode Demonstration: Design, Implementation and Management – Design Report. RTI International under CMS contract no. 500-2008-0029I. 25 ResDAC recommended using pre-admission and post-discharge windows to merge Part B claims to the inpatient analytic file to ensure that all inpatient stays have associated Part B claims. Approximately 5 percent of the inpatient stays had no associated Part B claims; this percentage was similar when we merged Part B claims without the 7-day windows. Inpatient episodes with no associated Part B claims were dropped from the analysis. We discussed this approach with CMS and it was approved.

IMPAQ International, LLC Page 89 Evaluation of Medicare ACE Demonstration May 31, 2013 Final Evaluation Report
Exhibit 14: Summary Statistics for Carrier Costs Occurring during the Inpatient Stay
ACE Sites
Non-Demonstration Treatment Sites
True Comparison Sites
Pre Post Pre Post Pre Post
Valve
Mean $5,142 $6,171 $5,309 $5,785 $6,030 $6,208
SD $2,553 $3,024 $2,620 $2,981 $3,061 $3,145
N 498 635 790 1,227 3,871 8,617
Defibrillator
Mean $1,522 $1,888 $1,707 $1,892 $2,195 $2,412
SD $869 $1,049 $1,183 $1,249 $1,542 $1,708
N 448 565 997 991 2,966 4,103
CABG
Mean $3,966 $5,418 $4,276 $4,701 $4,689 $5,005
SD $1,724 $2,374 $1,886 $1,953 $1,937 $2,179
N 1,081 1,198 1,968 2,482 8,134 13,155
Pacemaker
Mean $1,100 $1,675 $1,202 $1,502 $1,466 $1,672
SD $859 $1,305 $1,025 $1,126 $1,226 $1,328
N 1,223 1,210 2,973 3,251 10,066 15,450
PCI
Mean $1,391 $2,010 $1,447 $1,756 $1,676 $1,944
SD $797 $1,158 $948 $1,085 $1,094 $1,216
N 3,717 3,900 7,153 7,229 20,987 30,438
Hip/Knee
Mean $2,016 $2,524 $1,791 $1,963 $2,016 $2,088
SD $747 $886 $660 $756 $852 $846
N 2,257 3,894 13,724 8,598 36,810 69,973
Exhibit 15 graphically displays the descriptive information for the carrier cost measure. The lines marked by triangles show average carrier costs per episode for the ACE sites, while the broken lines marked by crosses and circles present the same information for the true comparison group and the non-demonstration treatment group, respectively. Least squares lines of best fit are superimposed on each hospital group’s series, and the vertical line marks the data point for the third quarter of 2009, which is the estimated pre- vs. post-period threshold. The least squares lines use the cost measures as the dependent variable and a constant term and quarter as the only independent variables. Consistent with the information presented previously, there was an increase in carrier costs during the inpatient stay for all three groups of hospitals. The increase was particularly strong in pacemaker, PCI, and hip/knee

IMPAQ International, LLC Page 90 Evaluation of Medicare ACE Demonstration May 31, 2013 Final Evaluation Report
episodes for the ACE sites. Although the average post-implementation carrier costs per episode for valve and hip/knee procedures were higher than those of the pre-period, the costs per episode decreased during the post-period. This is in contrast to pacemaker and PCI, which have post-period costs that are higher than the pre-period costs and that increased throughout the post-period. Exhibit 15 also provides evidence that, with the possible exception of hip/knee procedures, for which the ACE sites experienced a higher rate of carrier costs in the pre-period, the DID assumption requiring that pre-treatment period trends for the treatment and comparison groups be similar is satisfied.
Exhibit 15: Average Carrier Costs per Episode

IMPAQ International, LLC Page 91 Evaluation of Medicare ACE Demonstration May 31, 2013 Final Evaluation Report

IMPAQ International, LLC Page 92 Evaluation of Medicare ACE Demonstration May 31, 2013 Final Evaluation Report

IMPAQ International, LLC Page 93 Evaluation of Medicare ACE Demonstration May 31, 2013 Final Evaluation Report
Note: The range of implementation dates for the ACE Demonstration was May 1, 2009–November 1, 2010. The third quarter of 2009 is designated as the approximate division between the pre- and post-periods and is indicated by the vertical line.
The descriptive information suggests three findings. First, carrier costs were increasing across all ACE sites and all ACE DRGs prior to the introduction of the demonstration. Second, carrier costs were higher in the post-period than they were in the pre-period for the ACE, non-demonstration treatment, and true comparison group hospitals, and ACE sites may have experienced larger increases than true comparison group hospitals in the post-implementation period. This information is only descriptive and does not control for important covariates such as hospital-level unobserved heterogeneity, beneficiary characteristics, and patient severity. Exhibit 16 displays the results of the global DID regressions, where the dependent variable was the carrier cost measure, and the estimates were based on data pooled from all ACE sites. All regressions included hospital, quarter, and MS-DRG fixed-effects and the covariates listed in the leftmost column of the exhibit (dummy variable for female gender, dummy variable for nonwhite race, age, and HCC community score). The “DID” row displays the coefficient for the DID policy term (the estimate for δ in equation 1). For brevity, we do not present coefficients for the hospital fixed-effects (over 100 indicator variables), quarter fixed-effects, or MS-DRG fixed-effects because these variables were included for statistical control purposes only and do not have hypothesized signs.

IMPAQ International, LLC Page 94 Evaluation of Medicare ACE Demonstration May 31, 2013 Final Evaluation Report
For all DRG groups, the DID policy term indicates that the carrier costs during the inpatient episodes at the ACE sites increased in response to the demonstration. The increase in the value of services delivered ranges from $325 per defibrillator episode (21 percent of the pre-period mean for ACE sites) to $1,190 per valve episode (23 percent of the pre-period mean for ACE sites). Again, this may be an artifact of the standardized order sets, which require more intensive or more frequent care from physicians during the hospital stay. An increase in carrier costs was not found for the non-demonstration treatment hospitals, as can be seen by the lack of statistical significance of the DID coefficient in the non-demonstration treatment sites columns. This confirms the evidence that although all hospitals saw increases in carrier costs, only the ACE sites (not the non-demonstration treatment hospitals) had increases greater than those of the true comparison group. The coefficients for the female and nonwhite indicators were generally not statistically significant, and the effect of age on costs was mixed for cardiovascular DRGs and positive for orthopedic DRGs. As expected, HCC community score was positively associated with carrier costs during the inpatient stay, indicating that individuals with significant chronic disease burdens tended to require more non-inpatient hospital services during their hospital stays. The R-squared statistics range from .177 to .257, indicating that the regression explains approximately 18 to 26 percent of the variation in the dependent variable. Exhibit 17 displays the ACE site-specific DID regression results for carrier costs during inpatient episodes. In addition to sample size (i.e., the total number of episodes included in the regression; column labeled “N”), Exhibit 17 also provides the number of episodes that the ACE sites and non-demonstration treatment group hospitals contributed to the regression (the columns labeled “Episodes at ACE Sites” and “Episodes at NDT Hospitals”). This provides information on how the ACE sites and their non-demonstration treatment counterparts were weighted when all the sites and non-demonstration treatment hospitals were pooled in the global regressions.26 Consistent with the global results shown in Exhibit 16, the coefficient for the DID policy indicator is statistically significantly positive, confirming that the carrier costs during the inpatient episodes at ACE sites increased in response to the demonstration. The changes range from an increase of $150 per defibrillator episode for OHH to $1,715 per valve episode for BHS. It is also important to note that CABG and valve DRGs saw the largest increases and these changes were largest for BHS and OHH. Furthermore, BHS saw a statistically significant increase in carrier costs across all DRG groups. The results for the other covariates are similar to those presented for the global regressions. The coefficients for the female and nonwhite indicators generally were not statistically significant, the effect of age on carrier cost was mixed, and HCC community score was consistently positively associated with carrier costs during the hospital stay. Similar to the global regressions, R-squared statistics ranged from .171 to .255.
26
Although we did not use a weighting procedure for any of the cost regressions, the data included in the regressions are at the inpatient episode level. Thus, the ACE sites are automatically weighted by their number of episodes.

IMPAQ International, LLC Page 95 Evaluation of Medicare ACE Demonstration May 31, 2013 Final Evaluation Report
Exhibit 16: Global DID Regression Results: Carrier Costs During the Inpatient Episode
ACE Sites Non-Demonstration Treatment Sites
Valve
Defibril-lator
CABG Pacemaker PCI Hip/Knee Valve Defibril-
lator CABG Pacemaker PCI Hip/Knee
DID
β $1,190.47*** 325.74* 983.05*** $362.86*** $397.28*** 399.60*** $297.14 -$49.41 $54.40 -$16.06 -$15.98 -$35.23
SE $190.46 $125.49 $209.41 $42.64 $70.56 $75.78 $167.40 $110.86 $62.29 $37.37 $30.31 $26.72
t 6.25 2.60 4.69 8.51 5.63 5.27 1.78 -0.45 0.87 -0.43 -0.53 -1.32
Female
β -$59.37 $48.44 $39.63 $18.62 $60.12*** -$2.94 -$16.75 $50.97 $33.23 $17.23 59.24*** -$0.45
SE $40.67 $28.39 $24.95 $16.99 $9.73 $7.57 $43.35 $26.14 $23.74 $15.66 $9.38 $7.52
t -1.46 1.71 1.59 1.10 6.18 -0.39 -0.39 1.95 1.40 1.10 6.31 -0.06
Nonwhite
β $105.66 $103.17 $77.80 $50.60 42.31** $0.95 $156.79 $69.15 94.55* $38.57 $28.19 -$2.26
SE $104.53 $54.21 $43.96 $30.32 $14.74 $11.33 $110.92 $50.73 $40.09 $27.20 $14.86 $14.76
t 1.01 1.90 1.77 1.67 2.87 0.08 1.41 1.36 2.36 1.42 1.90 -0.15
Age
β -24.49*** -$0.18 $7.63*** -$8.39 2.01** 4.67*** -21.88*** -$0.33 8.81*** -8.12*** 2.15** 4.22***
SE $4.96 $2.35 $1.81 $1.04 $0.73 $0.70 $4.86 $1.96 $1.48 $1.05 $0.65 $0.66
t -4.93 -0.08 4.22 -8.11 2.77 6.72 -4.50 -0.17 5.94 -7.71 3.29 6.35
HCC β $266.98*** 49.12*** $265.57*** $85.67*** 89.19*** 104.28*** 280.17*** 49.78*** 251.49*** 86.46*** 86.44*** 98.51***
SE $40.38 $14.04 $21.65 $8.50 $8.16 $7.26 $37.23 $12.28 $18.55 $7.50 $7.37 $7.78
t 6.61 3.50 12.27 10.08 10.93 14.36 7.52 4.05 13.56 11.53 11.73 12.66
N
13,477 7,937 23,252 26,789 57,357 42,048 14,379 8,895 25,463 30,214 63,857 41,029
R-squared
0.22 0.21 0.26 0.23 0.18 0.25 0.22 0.20 0.26 0.23 0.17 0.23
Note: All regressions included hospital, MS-DRG, and quarter fixed-effects. Standard errors are clustered by hospital. In addition to the ACE sites and the non-demonstration treatment hospitals, the regressions included the true comparison group hospitals (96 for cardiovascular procedures; 62 for orthopedic procedures). * p<.05, **p<.01, ***p<.001.

IMPAQ International, LLC Page 96 Evaluation of Medicare ACE Demonstration May 31, 2013 Final Evaluation Report
Exhibit 17: Site-Specific DID Regression Results: Carrier Costs During the Inpatient Episode ACE Sites Non-Demonstration Treatment Sites
Treated
Beta SE t-stat N
Episodes at ACE Sites
Treated Beta
SE t-stat N Episodes at
NDT Hospitals
BHS
Valve $1,714.96*** $63.00 27.22 12,585 206 -$82.80 $324.59 -0.26 13,276 897
Defibrillator $560.60*** $42.73 13.12 7,145 195 $146.86 $307.80 0.48 7,513 563
CABG $1,578.16*** $35.76 44.13 21,624 588 -$83.98 $101.56 -0.83 22,922 1,886
Pacemaker $461.88*** $17.32 26.67 25,151 708 $60.50 $75.16 0.80 26,650 2,207
PCI $589.39*** $18.44 31.96 51,820 1,861 -$12.51 $44.17 -0.28 54,924 4,965
Hip/Knee $498.06*** $13.28 37.50 39,867 3,970 -$33.60 $23.10 -1.45 37,622 1,725
HMC
Valve $286.59*** $56.92 5.04 12,552 173 619.45*** $81.16 7.63 12,863 484
Defibrillator $530.08*** $47.92 11.06 7,219 269 -$150.11 $124.16 -1.21 7,664 714
CABG $630.77*** $32.61 19.34 21,287 251 $132.89 $112.52 1.18 22,207 1,171
Pacemaker $301.20*** $21.06 14.30 24,839 396 -129.01** $45.48 -2.84 25,821 1,378
PCI $357.90*** $17.40 20.57 51,320 1,361 -$58.48 $56.78 -1.03 53,386 3,427
Hip/Knee $315.32*** $13.01 24.24 37,290 1,393 -$54.86 $92.56 -0.59 36,614 717
OHH
Valve $1,259.68*** $64.60 19.50 13,098 719 517.84* $212.42 2.44 12,998 619
Defibrillator $149.74*** $39.78 3.76 7,473 523 -$76.49 $89.59 -0.85 7,618 668
CABG $786.63*** $34.83 22.58 22,414 1,378 163.32** $60.29 2.71 22,407 1,371
Pacemaker $322.51*** $19.93 16.18 25,686 1,243 -$25.32 $40.94 -0.62 26,630 2,187
PCI $317.35*** $18.65 17.02 54,136 4,177 $7.75 $45.28 0.17 55,466 5,507
LHS Hip/Knee $25.92 $73.43 0.35 36,685 788 -$31.66 $37.93 -0.83 38,587 2,690
Note: NDT: Non-demonstration treatment. All regressions included hospital, MS-DRG, and quarter fixed-effects. Standard errors are clustered by hospital. In addition to ACE and non-demonstration treatment hospitals, the regressions included true comparison group hospitals (96 for cardiovascular procedures; 62 for orthopedic procedures). * p<.05, **p<.01, ***p<.001.

IMPAQ International, LLC Page 97 Evaluation of Medicare ACE Demonstration May 31, 2013 Final Evaluation Report
2.3. Disaggregation of Carrier Costs During the Inpatient Episode The results presented above suggest that non-acute care hospital services delivered during the hospital stay increased as a result of the demonstration across all ACE DRGs. As discussed earlier, we hypothesized that services delivered would decrease as hospitals and physicians responded to gainsharing incentives and as hospitals increased efficiency and realized economies in care delivery. The carrier cost findings contradicted that hypothesis and prompted a more thorough consideration of the services that were actually delivered. In an exploratory effort, we investigated which time periods and places of service were responsible for the increase carrier claims associated with ACE episodes. We looked at the carrier claims using 7-day windows on either side of the hospital stay and four places of service: inpatient, outpatient, emergency room, and independent laboratory or diagnostic facility. For a sample of MS-DRGs and ACE sites, we further disaggregated carrier costs into the pre-admission, hospital stay, and post-discharge windows. We found that over 90 percent of the increase in the value of carrier claims occurred (a) during the inpatient stay, rather than during the windows on either side of the inpatient episode, and (b) in the inpatient place of service rather than in outpatient, emergency room, or laboratory/diagnostic facilities. This exploratory analysis confirmed that the factors driving the increase in carrier costs were associated with the inpatient stay and the inpatient place of service. We then contacted two ACE sites to get their perspectives on the observed increases in carrier costs. Because the sites had no historical information on claims submitted by other providers during hospital stays, it was not feasible to ask whether the sites had also observed an increase in these costs. Our approach, therefore, was to ascertain whether the services included in our non-DME carrier cost measure were similar to the services in the hospital’s cost and utilization database. This process would assist us in ensuring that the ACE sites and the evaluation team had a common understanding of the services that should be included in the ACE bundled payment and to increase confidence that the increase in Part B carrier costs we observed was not an artifact of the algorithm we used to generate our measure. We had planned to compare carrier claims in the hospital databases to those we observed in the Medicare claims files. However, the databases could not be merged successfully, and we were therefore unable to collaborate with the sites on a full comparison of our carrier cost measure and the claims flagged in the hospitals’ record systems as being part of an ACE bundle. The reason is that for both ACE sites, the unit of observation in the hospital databases was a provider on a particular date of service rather than the inpatient episode, so carrier services could not be matched to inpatient stays. Also, one of the sites used tax identification number (TIN) to identify physicians and other providers delivering services during the bundle. This variable was not available in our data. Because these complications made impossible a large-scale comparison of the carrier claims in our data and those in the ACE sites’ databases, we manually compared a sample of line items from our claims files to those of the hospitals. Although we were able to match many claims and verify that they were included in the hospitals’ reimbursement under ACE, it was impossible to systematically verify for all inpatient episodes whether the services included in

IMPAQ International, LLC Page 98 Evaluation of Medicare ACE Demonstration May 31, 2013 Final Evaluation Report
our carrier cost measure were also reimbursed by the hospital under the ACE bundled payment. Next, we examined the types of services for which the increases occurred in the inpatient setting. We developed a data file that incorporated HCPCS and CPT information from the carrier claims and aggregated all line items within HCPCS/CPT groups by summing claim payment amounts per episode. Observations in the resulting file were at the episode-by-HCPCS/CPT level (i.e., one record provides information on a particular HCPCS/CPT code occurring during a hospital stay; the next record provides information for another HCPCS/CPT code during the same hospital stay), and the file contained 4,917 unique HCPCS/CPT codes. To facilitate the analysis, we used a publicly available data file that crosswalks individual HCPCS/CPT codes to Berenson-Eggers Type of Service (BETOS) categories.27 For presentation and analytical purposes, we selected two levels of granularity of BETOS categories for analysis, as seen in Exhibit 18.
27 The data files are available from http://www.cms.gov/Medicare/Coding/HCPCSReleaseCodeSets/BETOS.html (Accessed February 22, 2013).

IMPAQ International, LLC Page 99 Evaluation of Medicare ACE Demonstration May 31, 2013 Final Evaluation Report
Exhibit 18: BETOS Categories used in the HCPCS/CPT Analysis
Broad Categories Fine Categories
DME DME
E&M
Emergency room visit
Home visit
Hospital visit
Nursing home visit
Office visit
Specialist visit
Imaging
Advanced imaging
Ecography/ultrasonography
Imaging/procedure
Standard imaging
Procedures
Ambulatory procedure
Anesthesia
Dialysis
Endoscopy
Eye procedure
Major procedure
Minor procedure
Oncology
Tests Lab test
Other test
Other/unclassified Other/unclassified
DME: durable medical equipment; E&M: evaluation and management.
Exhibit 19 presents the results of the HCPCS/CPT analyses using the broad service categories listed in Exhibit 18. The vertical axes measure the average dollars per episode spent on each of the service categories, which are listed along the horizontal axis. The vertical bars capture information about the ACE and true comparison groups during the pre- and post-implementation periods. We do not include bars for the non-demonstration treatment group because the focus here is on further investigation of the ACE sites’ increased carrier payment result.

IMPAQ International, LLC Page 100 Evaluation of Medicare ACE Demonstration May 31, 2013 Final Evaluation Report
Exhibit 19: Analysis of Carrier Claims – Broad HCPCS/CPT Categories

IMPAQ International, LLC Page 101 Evaluation of Medicare ACE Demonstration May 31, 2013 Final Evaluation Report

IMPAQ International, LLC Page 102 Evaluation of Medicare ACE Demonstration May 31, 2013 Final Evaluation Report

IMPAQ International, LLC Page 103 Evaluation of Medicare ACE Demonstration May 31, 2013 Final Evaluation Report
Notes: TC: true comparison hospitals. The DME and Other/unclassified categories were excluded because these services account for a very small proportion of average per episode costs. The ACE sites’ pre- and post-periods are defined on an ACE site-specific basis. However, because the true comparison groups are identical for all ACE hospitals, we use a single “implementation date” of June 1, 2009 for all true comparison hospitals.
Exhibit 19 shows that services categorized as evaluation and management (E&M) visits and procedures increased for the ACE sites from the pre- to the post-implementation period, and these increases were generally larger for the ACE sites than for the true comparison group. Results from analyses of the more granular BETOS categories (not shown) are consistent with those findings. ACE sites’ average dollars per episode often increased for the categories of anesthesia, hospital visit, and major procedure (components of the broader E&M and procedure categories), and these increases tended to be greater than those of the true comparison group. Taken together, the analyses suggest that the delivery of additional services documented in the carrier claims files occurred in the inpatient setting and that the services were related to physicians’ visits and procedures performed during the inpatient stay, rather than other categories of services such as tests and imaging. Additional information from our qualitative data collection (interviews and focus groups) provides insight into these results:
1. The qualitative data suggest that the ACE hospitals achieved internal cost savings, which were unobservable to the research team.

IMPAQ International, LLC Page 104 Evaluation of Medicare ACE Demonstration May 31, 2013 Final Evaluation Report
2. As part of the demonstration, hospitals implemented quality improvement measures and required physicians to meet minimum quality thresholds in order to receive gainsharing payments. Tying gainsharing to quality thresholds and implementing standardized order sets to increase quality may have required more inpatient physician or other provider services (Part B claims).
3. Physicians continued to receive payments equal to those they would have received under the traditional Medicare physician fee schedule.
4. Hospitals achieved savings through other mechanisms. These points suggest that physicians may have had incentives to deliver additional in-hospital care in the form of more frequent or longer visits with hospitalized patients. More important is the fact that the ACE physicians were not at risk financially (aside from not receiving gainsharing payments): if total costs associated with delivering care during the episode exceeded the bundled payment amount, it was the hospital, not the physicians, that would experience the losses (item 3). At the same time, the quality of care provided by ACE physicians was being scrutinized, perhaps supplying additional motivation to provide more intensive services (item 2). Finally, even though additional physicians’ services would increase episode costs, it is possible that this care could shorten patients’ length of stay, thus reducing hospital costs by more than the increase in physician payments. However, the quantitative quality of care analysis showed that length of stay did not change in response to the demonstration, and the available qualitative data did not permit us to test this hypothesis. It is possible that the observed increases in procedure costs of the E&M and procedure categories may be the result of an increase in the complexity of patients treated at ACE sites. If this were the case, then we would expect to observe a shift toward MS-DRGs indicating the presence of comorbidities/complications (CC) or major comorbidities/complications (MCC). If there were a shift across MS-DRGs within the procedure groups (valve, defibrillator, CABG, pacemaker, PCI, hip/knee), the total bundled payment amount from which hospitals pay physicians would increase, thus increasing the “ceiling” beyond which ACE hospitals would experience losses. We examined this hypothesis by considering the within-procedure-group distribution of MS-DRGs (see Exhibit 20). The vertical bars provide the percentage of episodes for ACE and true comparison hospitals in each of the MS-DRGs listed along the horizontal axis. We exclude non-demonstration treatment hospitals from the figure because the focus is on investigating shifts among MS-DRGs for ACE sites. The diagrams in Exhibit 20 do not indicate a clear pattern of increasing CC/MCC episodes coupled with decreasing non-CC/MCC episodes within the procedure groups. Furthermore, in cases where more complicated MS-DRGs appear to have increased over time, there were similar changes for the true comparison group, indicating that these changes were likely not the result of the demonstration. The evidence does not support the hypothesis that increases in ACE patients’ acuity were driving the increases in dollars’ worth of carrier claims.

IMPAQ International, LLC Page 105 Evaluation of Medicare ACE Demonstration May 31, 2013 Final Evaluation Report
Exhibit 20: Within-Procedure-Group Distribution of MS-DRGs

IMPAQ International, LLC Page 106 Evaluation of Medicare ACE Demonstration May 31, 2013 Final Evaluation Report

IMPAQ International, LLC Page 107 Evaluation of Medicare ACE Demonstration May 31, 2013 Final Evaluation Report

IMPAQ International, LLC Page 108 Evaluation of Medicare ACE Demonstration May 31, 2013 Final Evaluation Report

IMPAQ International, LLC Page 109 Evaluation of Medicare ACE Demonstration May 31, 2013 Final Evaluation Report

IMPAQ International, LLC Page 110 Evaluation of Medicare ACE Demonstration May 31, 2013 Final Evaluation Report
Notes: TC: true comparison hospitals. The following MS-DRGs were excluded from the figures because they represent a very small proportion of hospital stays within the six DRG groups: Pacemaker – 258, 259, 260, 261, 262; Hip/Knee – 461, 462, 466, 467, 468, 488, 489. The pre- and post-implementation periods are defined on an ACE site-specific basis. However, because the true comparison groups are identical for all ACE hospitals, we use a single “implementation date” of June 1, 2009 for all true comparison hospitals.

IMPAQ International, LLC Page 111 Evaluation of Medicare ACE Demonstration May 31, 2013 Final Evaluation Report
3. POST-ACUTE CARE COSTS ANALYSES
The ACE Demonstration tested a new bundled payment arrangement specifically for the inpatient episode of care, spanning admission through discharge. However, it is possible that the bundled payment methodology could have unintended consequences for PAC. If patients are discharged from the hospital in a shorter period of time following a surgical procedure, they may require more care after discharge compared to similar patients who have spent more time or received more intensive services in the acute care setting. Alternatively, we may observe substitution from less intensive types of PAC (e.g., home health) to more intensive settings (e.g., skilled nursing facility [SNF]). These scenarios would tend to increase PAC costs. However, other features of the demonstration might reduce PAC costs. For example, the gainsharing component of the demonstration was expected to enhance coordination among physicians and hospitals, and through the achievement of quality metrics, patients might leave the hospital in a less fragile state. It might also be the case that we observe substitution toward less intensive PAC settings. These scenarios would results in lower PAC costs.
3.1. Measures To uncover the effect of the demonstration on PAC costs, we generated several PAC cost measures: a global PAC cost measure and nine cost measures by PAC setting. Exhibit 21 explains the components of each measure. All measures focus on the 30-day post-discharge period and combine elements of institutional and non-institutional claims, with the exception of the measure for physician office visits. For example, the home measure sums the institutional provider costs billed by home health agencies and the non-institutional provider costs delivered in the place of service “home.” For the global measure, we calculated total PAC costs, equal to the sum of the other nine measures. To generate these measures, we followed a process similar to that of the inpatient Part B cost measure. We gathered claims information from the institutional and non-institutional files provided by CMS and then merged those claims to the inpatient episodes defined by the inpatient analytic file. We merged the PAC cost information to the inpatient episodes by patient identifier (HIC) and time period so that PAC services delivered during the 30 days post-discharge were associated with inpatient episodes. We first merged all PAC information with “claim from” date occurring during the 30-day post-discharge window. We prorated claims with “claim thru” extending past the thirtieth day post-discharge, so that the PAC cost measures included only the portion of costs occurring during the 30 days post-discharge. Once we merged all PAC cost information to the inpatient analytic file, we aggregated multiple PAC claims by summing the claim payment amount within each inpatient episode.

IMPAQ International, LLC Page 112 Evaluation of Medicare ACE Demonstration May 31, 2013 Final Evaluation Report
Exhibit 21: Post-Acute Care Cost Measures
PAC Measure Type of Claim/Services Included in PAC measure
Total PAC Sum of all PAC services.
Home HH Part A + Part B delivered in POS = Home
SNF SNF Part A + Part B delivered in POS = SNF
IRF Inpatient Part A claim with provider number indicating rehabilitation unit or rehabilitation hospital + Part B delivered in POS = IRF
CORF Outpatient Part A claim with provider number indicating CORF + Part B delivered in POS = CORF
Hospice Hospice Part A + Part B delivered in POS = Hospice
Readmissions Inpatient Part A claim with provider number indicating anything other than inpatient rehabilitation or inpatient psychiatric + Part B delivered in POS = inpatient hospital
Physician Office Visits Part B delivered in POS = office
Outpatient
Outpatient Part A claim with provider number indicating anything other than CORF + Part B delivered in POS = emergency room, urgent care facility, outpatient hospital, ambulatory surgical center, independent clinic, or walk-in retail health clinic
Other
Inpatient psych (Part A inpatient with provider number indicating psych hospital or psych unit) + Part B with POS = independent lab, nursing, assisted living facility, group home, custodial care facility, adult living care facility, and several miscellaneous places of service (e.g., school, homeless shelter, RHC, IHS, substance abuse treatment facility, ESRD facility, psychiatric)
Notes: HH: home health; POS: place of service; SNF: skilled nursing facility; IRF: inpatient rehabilitation facility; CORF: comprehensive outpatient rehabilitation facility; RHC: rural health clinic; IHS: Indian Health Service.
3.2. Results Exhibit 22 provides summary statistics for total PAC costs for the ACE, non-demonstration treatment, and true comparison hospitals, by procedure group, for the pre- and post-implementation periods. This exhibit shows that for most procedure groups, PAC costs increased or remained approximately the same from the pre- to the post-period for all three groups of hospitals. Appendix C provides summary statistics for the other nine PAC measures. It is important to note that PAC costs for orthopedic DRGs decreased, from $7,612 to $7,437, after ACE implementation, while the cardiovascular DRGs showed an increase in PAC costs. This may be a result of changes in hospital processes. For example, the Joint Club and Joint Camp as well as the patient navigators were new services for, or primarily dedicated to, patients undergoing a joint replacement.28
28 As described in Section II, Joint Club and Joint Camp were implemented at BHS and LHS to provide benefits for ACE orthopedic patients, including pre-surgery seminars, community activities, group therapy, and group meals.

IMPAQ International, LLC Page 113 Evaluation of Medicare ACE Demonstration May 31, 2013 Final Evaluation Report
Exhibit 22: Summary Statistics for Total PAC Costs
ACE Sites
Non-Demonstration
Treatment Sites
True ComparisonSites
Pre Post Pre Post Pre Post
Valve
Mean $4,701 $6,299 $6,359 $6,296 $6,077 $7,249
SD $7,308 $11,531 $10,600 $9,553 $8,979 $10,332
N 498 635 790 1,227 3,871 8,617
Defibrillator
Mean $2,169 $2,171 $2,271 $2,677 $3,110 $3,607
SD $4,449 $5,178 $4,807 $6,231 $6,819 $7,732
N 448 565 997 991 2,966 4,103
CABG
Mean $4,073 $5,216 $4,847 $5,271 $5,363 $5,843
SD $7,177 $8,502 $8,515 $8,858 $8,515 $8,930
N 1,081 1,198 1,968 2,482 8,134 13,155
Pacemaker
Mean $2,529 $3,406 $2,808 $3,487 $3,250 $3,902
SD $6,450 $6,374 $5,688 $6,413 $6,328 $7,359
N 1,223 1,210 2,973 3,251 10,066 15,450
PCI
Mean $2,413 $3,255 $2,547 $3,074 $2,831 $3,298
SD $5,660 $6,851 $6,165 $7,147 $6,515 $7,369
N 3,717 3,900 7,153 7,229 20,987 30,438
Hip/Knee
Mean $7,612 $7,437 $7,899 $8,011 $8,015 $8,567
SD $7,584 $7,353 $7,747 $7,487 $7,608 $8,187
N 2,257 3,894 13,724 8,598 36,810 69,973
Note: The ACE and non-demonstration treatment group hospitals pre- and post-periods are defined on an ACE site-specific basis. However, because the true comparison groups are identical for all ACE hospitals, we use a single “implementation date” of June 1, 2009 for all true comparison hospitals.
Information similar to that presented in Exhibit 22 is presented graphically in Exhibit 23, which plots quarterly total PAC cost information by procedure group. The lines marked by triangles show average total PAC costs per episode for ACE sites, while the broken lines marked by crosses and circles present the same information for the true comparison group and the non-demonstration treatment group, respectively. Least squares lines of best fit are superimposed on each site’s series, and the vertical line marks the data point for the third quarter of 2009, which is the estimated pre- vs. post-period threshold. The least squares lines use the cost measures as the dependent variable and a constant term and quarter as the only independent variables. Consistent with the tabular information presented previously, average total PAC costs

IMPAQ International, LLC Page 114 Evaluation of Medicare ACE Demonstration May 31, 2013 Final Evaluation Report
per episode in the post-implementation period were generally higher than or approximately equal to those in the pre- implementation period for all three groups of hospitals. In all cases except for defibrillator, average PAC costs in the post-period had an upward trend. Exhibit 23 also provides evidence that the DID assumption requiring that the pre-treatment period trends for the treatment and comparison groups be similar is satisfied. One possible exception is for valve episodes for non-demonstration treatment hospitals, which had decreasing PAC cost in the pre-period.
Exhibit 23: Average Total PAC Costs per Episode

IMPAQ International, LLC Page 115 Evaluation of Medicare ACE Demonstration May 31, 2013 Final Evaluation Report

IMPAQ International, LLC Page 116 Evaluation of Medicare ACE Demonstration May 31, 2013 Final Evaluation Report

IMPAQ International, LLC Page 117 Evaluation of Medicare ACE Demonstration May 31, 2013 Final Evaluation Report
Note: The implementation dates for the ACE Demonstration ranged from May 1, 2009 through November 1, 2010. The third quarter of 2009 is designated as the approximate pre- vs. post-period threshold and is indicated by the vertical line.
The descriptive information presented in Exhibits 22 and 23 suggests that there was an increase or virtually no change in total PAC costs as a result of the ACE Demonstration. Exhibit 24 presents the results of the DID regressions where the dependent variable was total PAC costs per episode. The global results shown are based on data pooled from all ACE sites (the site-specific results are presented in Exhibit 25). As discussed previously, all regressions included hospital and quarter fixed-effects and the covariates listed in the leftmost column of the table (dummy variable for female gender, dummy variable for nonwhite race, age, and HCC community score). For brevity, we do not present coefficients for the hospital fixed-effects (over 100 indicator variables), quarter fixed-effects, or MS-DRG fixed-effects, because these variables were included for statistical control purposes only and do not have hypothesized signs. The “DID” row displays the coefficients for the DID policy term (the estimate for δ in equation 1). The descriptive information presented previously shows that both the ACE sites and the true comparison group hospitals generally experienced increases in PAC costs. Thus, with one exception, PCI in the ACE sites, none of the policy coefficients were statistically significantly different from zero. PCI showed a positive increase of $414 in PAC costs (17 percent of the costs in the pre-implementation period).

IMPAQ International, LLC Page 118 Evaluation of Medicare ACE Demonstration May 31, 2013 Final Evaluation Report
The coefficients for female indicator, age, and HCC score are consistently positive and are statistically significant, indicating that older female beneficiaries with more chronic conditions tended to have higher PAC costs. The coefficient for the nonwhite indicator is positive and statistically significant one-third of the time, providing some evidence that nonwhite beneficiaries tended to have higher PAC costs than did white beneficiaries. Unlike the Part B cost regression models (Exhibit 16), which generally explain more than 20 percent of the variation in the dependent variable, the PAC models’ R-squared terms range from .05 to .14, with the higher value being for the orthopedic procedures. In general, the PAC cost models have less explanatory power than the Part B cost models. Exhibit 25 displays the site-specific DID regression results for total PAC costs per episode. Shown are the sample size (i.e., the total number of episodes included in the regression; column labeled “N”), and the number of episodes that the ACE sites (“Episodes at Ace Sites”) and non-demonstration treatment group hospitals (“Episodes at NDT Hospitals”) contributed to each regression. These numbers indicate how the ACE and non-demonstration treatment sites are “weighted” when they are pooled in the global regressions (presented in Exhibit 24). Unlike the Part B cost results, where the site-specific results were similar to the global results (i.e., both sets of regressions found that Part B costs increased as a result of the demonstration), the site-specific results for total PAC costs per episode reveal that there is substantial heterogeneity across the ACE sites in the impact of the demonstration on PAC costs. It is notable that BHS had higher PAC costs for all major DRG groups relative to the true comparison group. The demonstration had a negative impact of $1,069 on PAC costs associated with orthopedic procedures for LHS, the only ACE procedure group offered by that site. It is possible that these statistically significant site-specific effects averaged out against the other sites in the global regression analysis, explaining why we do not observe statistically significant results when the data from all ACE sites are pooled. While there were a few statistically significant effects for HMC and OHH, these are not as robust as those for BHS and LHS. Similar to the results for the global regressions, the coefficients for female indicator, age, and HCC score were consistently positive and statistically significant, indicating that older female beneficiaries with more chronic conditions tended to have higher PAC costs. However, in the global regressions, the coefficient for the nonwhite indicator was positive and statistically significant one-third of the time, but the site-specific regressions indicated that the nonwhite indicator was typically not statistically significant. The R-squared terms from the site-specific PAC cost models confirm that the models for orthopedic procedures explain approximately 14 percent of the variation in PAC costs, while the models for the cardiovascular procedures range in their explanatory power from 5 percent to 9 percent.

IMPAQ International, LLC Page 119 Evaluation of Medicare ACE Demonstration May 31, 2013 Final Evaluation Report
Exhibit 24: Global DID Regression Results, Total PAC Costs per Episode
ACE Sites Non-Demonstration Treatment Sites
Valve
Defibril-lator
CABG Pacemaker PCI Hip/Knee Valve Defibril-
lator CABG Pacemaker PCI Hip/Knee
DID
β $744.00 $9.88 $400.76 $258.11 414.28* $24.10 -$722.75 $304.80 $237.64 -$45.26 -$9.58 -$359.37
SE $649.52 $483.22 $544.79 $185.97 $173.04 $225.09 $466.11 $323.50 $266.61 $201.36 $120.78 $352.50
t 1.15 0.02 0.74 1.39 2.39 0.11 -1.55 0.94 0.89 -0.22 -0.08 -1.02
Female
β $1,417.03*** $561.93*** $1,604.74*** $393.28*** $254.60*** $1,481.45*** $1,495.83*** $558.11*** $1,676.93*** $334.54*** $271.45*** $1,489.52***
SE $177.51 $165.08 $142.06 $82.44 $61.87 $73.35 $168.88 $151.99 $125.76 $74.15 $59.27 $68.63
t 7.98 3.40 11.30 4.77 4.12 20.20 8.86 3.67 13.33 4.51 4.58 21.70
Non-white
β $642.81* $430.79 $188.09 -$203.73 $219.83* $417.32* $729.32** $299.90 $257.59 -$139.67 $96.45 $204.53
SE $308.81 $278.02 $174.42 $145.71 $109.40 $205.53 $263.38 $251.42 $164.29 $137.81 $82.04 $175.20
t 2.08 1.55 1.08 -1.40 2.01 2.03 2.77 1.19 1.57 -1.01 1.18 1.17
Age
β $129.35*** $11.88 $111.30*** $59.35*** $23.14*** $206.78*** $131.08*** $12.08 $111.06*** $63.64*** $20.96*** $205.98***
SE $16.24 $12.42 $11.63 $5.86 $3.56 $7.26 $15.52 $10.67 $11.32 $5.33 $3.50 $7.55
t 7.97 0.96 9.57 10.13 6.50 28.50 8.45 1.13 9.81 11.94 6.00 27.27
HCC
β $825.77*** $565.91*** $1,216.54*** $587.22*** $632.52*** $1,326.38*** $804.02*** $550.62*** $1,189.66*** $577.84*** $633.21*** $1,307.75***
SE $116.45 $57.14 $83.48 $37.64 $31.04 $71.20 $107.28 $53.19 $81.27 $37.31 $28.81 $73.41
t 7.09 9.90 14.57 15.60 20.38 18.63 7.49 10.35 14.64 15.49 21.98 17.81
N
13,477 7,937 23,252 26,789 57,357 42,048 14,379 8,895 25,463 30,214 63,857 41,029
R-sq
0.05 0.06 0.09 0.07 0.05 0.14 0.05 0.06 0.09 0.07 0.05 0.13
Note: All regressions included hospital, MS-DRG, and quarter fixed-effects. Standard errors are clustered by hospital. In addition to ACE and non-demonstration treatment hospitals, the regressions included the true comparison group hospitals (96 for cardiovascular procedures; 62 for orthopedic procedures).
* p<.05, **p<.01, ***p<.001.

IMPAQ International, LLC Page 120 Evaluation of Medicare ACE Demonstration May 31, 2013 Final Evaluation Report
Exhibit 25: Site-Specific DID Regression Results, Total PAC Costs per Episode
ACE Sites Non-Demonstration Treatment Sites
DID SE t-stat N Episodes at
ACE Sites DID SE t-stat N
Episodes at NDT Hospitals
BHS
Valve $3,463.27*** $189.54 18.27 12,585 206 -$1,487.65*** $403.99 -3.68 13,276 897
Defibrillator $1,306.48*** $170.24 7.67 7,145 195 $524.22 $737.72 0.71 7,513 563
CABG $2,014.61*** $141.93 14.19 21,624 588 $50.79 $298.66 0.17 22,922 1,886
Pacemaker $676.53*** $95.18 7.11 25,151 708 $12.65 $336.95 0.04 26,650 2,207
PCI $923.47*** $69.27 13.33 51,820 1,861 $48.19 $131.03 0.37 54,924 4,965
Hip/Knee $283.39* $137.39 2.06 39,867 3,970 -$320.80 $352.76 -0.91 37,622 1,725
HMC
Valve -$315.36 $177.72 -1.77 12,552 173 $565.81 $534.45 1.06 12,863 484
Defibrillator $329.24 $172.43 1.91 7,219 269 -$58.84 $397.13 -0.15 7,664 714
CABG -$984.11*** $135.54 -7.26 21,287 251 $164.40 $199.07 0.83 22,207 1,171
Pacemaker -$81.89 $92.76 -0.88 24,839 396 -$512.50 $386.49 -1.33 25,821 1,378
PCI $90.70 $67.81 1.34 51,320 1,361 -$298.52 $154.72 -1.93 53,386 3,427
Hip/Knee -$61.50 $138.76 -0.44 3,729 1,393 -1,141.33* $436.79 -2.61 36,614 717
OHH
Valve $202.23 $178.62 1.13 13,098 719 -$694.95 $770.27 -0.90 12,998 619
Defibrillator -$672.11*** $148.97 -4.51 7,473 523 $514.72 $544.99 0.94 7,618 668
CABG -$67.21 $135.30 -0.50 22,414 1,378 $424.27 $543.03 0.78 22,407 1,371
Pacemaker $108.63 $110.33 0.98 25,686 1,243 $180.12 $318.38 0.57 26,630 2,187
PCI $286.14*** $75.31 3.80 54,136 4,177 $124.09 $185.31 0.67 55,466 5,507
LHS Hip/Knee -$1,069.33*** $242.00 -4.42 36,685 788 -$173.67 $535.90 -0.32 38,587 2,690
Note: NDT: Non-demonstration treatment. All regressions included hospital, MS-DRG, and quarter fixed-effects. Standard errors are clustered by hospital. In addition to ACE and non-demonstration treatment hospitals, the regressions included the true comparison group hospitals (96 for cardiovascular procedures; 62 for orthopedic procedures). *p<0.05, **p<0.01, ***p<0.001.

IMPAQ International, LLC Page 121 Evaluation of Medicare ACE Demonstration May 31, 2013 Final Evaluation Report
Exhibit 26 presents the DID regression results for each of the nine PAC types as well as total PAC costs. For brevity, we do not include results for the covariates, which are similar to those presented in Exhibit 24. There were minor or no impacts (coefficients were not statistically significant) on PAC costs for discharges from ACE sites across all DRGs for home health, SNF, inpatient rehabilitation (IRF), comprehensive outpatient rehabilitation facility (CORF), or readmissions (except for PCI), and there is no evidence to support the hypothesis of substitution among the different types of PAC. In the PAC settings where there were changes, physician office visits had small reductions in PAC costs for valve (ranging from $6.53 to $12.39 per discharge, or approximately 50 percent of the pre-implementation ACE mean) and PCI procedures. The results for hospice were mixed, whereas there was a small increase for valve and a small decrease for PCI. Overall, PCI patients had a larger amount of PAC services compared to all other cardiovascular and orthopedic DRGs. Exhibit 26 shows that the increase in PAC costs for PCI was driven by readmissions to acute care settings ($300) and by outpatient services ($82).29,30 This finding is important given that PCI was one of the largest volume DRGs in the ACE Demonstration. Other effects in combinations of DRG and PAC settings were minor. PAC costs for the non-demonstration treatment group hospitals did not change in response to the ACE Demonstration.
29
As described in Exhibit 22, physician office visits include carrier charges with place of service given as office; other PAC includes claims from inpatient psychiatric hospitals and carrier claims with place of service given as independent laboratory, nursing, assisted living facility, group home, custodial care facility, adult living care facility, and several other miscellaneous places of service (e.g., school, homeless shelter, rural health care, Indian Health Service, substance abuse, ESRD facility, psychiatric); outpatient PAC includes institutional outpatient provider charges other than CORF plus carrier claims with place of service given as emergency room, urgent care facility, outpatient hospital, ambulatory surgical center, independent clinic, or walk-in retail health clinic. 30 Percentage of change is based on the tables in Appendix C, which present procedure-specific summary statistics for each PAC measure.

IMPAQ International, LLC Page 122 Evaluation of Medicare ACE Demonstration May 31, 2013 Final Evaluation Report
Exhibit 26: Global DID Regression Results by Type of PAC Costs
ACE Sites Non-Demonstration Treatment Sites
Valve Defibril-
lator CABG Pacemaker PCI Hip/Knee Valve
Defibril-lator
CABG Pacemaker PCI Hip/Knee
Total
β $744.00 $9.88 $401.47 $257.73 414.01* $24.10 -$722.75 $304.80 $238.30 -$45.75 -$9.80 -$359.37
SE $649.52 $483.22 $544.64 $185.96 $173.07 $225.09 $466.11 $323.50 $266.62 $201.35 $120.76 $352.50
t 1.15 0.02 0.74 1.39 2.39 0.11 -1.55 0.94 0.89 -0.23 -0.08 -1.02
Home Health
β $99.84 -$62.04 $31.10 $29.41 $24.83 $242.48 $84.85 -$41.23 $48.76 -$12.62 -$1.15 -$22.73
SE $74.77 $57.07 $33.75 $39.91 $19.71 $123.83 $55.40 $39.08 $48.96 $24.79 $10.70 $73.03
t 1.34 -1.09 0.92 0.74 1.26 1.96 1.53 -1.06 1.00 -0.51 -0.11 -0.31
SNF
β -$116.55 -$87.88 $58.19 -$30.34 $8.03 -$241.71 $81.07 -$81.92 $122.63 -$99.84 -$2.49 -$117.92
SE $75.66 $87.46 $121.85 $140.11 $34.12 $152.18 $207.14 $68.50 $90.47 $98.14 $34.76 $142.35
t -1.54 -1.00 0.48 -0.22 0.24 -1.59 0.39 -1.20 1.36 -1.02 -0.07 -0.83
IRF
β $326.94 -$70.06 -$70.05 $6.39 $36.45 $208.21 -$528.29 -$63.31 -$106.92 -$47.10 $8.11 -$316.86
SE $241.85 $88.61 $189.84 $115.22 $72.07 $258.88 $275.54 $134.88 $180.00 $69.36 $37.33 $305.28
t 1.35 -0.79 -0.37 0.06 0.51 0.80 -1.92 -0.47 -0.59 -0.68 0.22 -1.04
CORF
β $0.00 $0.00 $0.04 -$0.02 -$0.09 $0.32 $0.00 $0.00 $0.08 -$0.02 -$0.09 0.30*
SE $0.02 $0.00 $0.10 $0.03 $0.06 $0.18 $0.02 $0.00 $0.11 $0.04 $0.06 $0.14
t -0.02 . 0.42 -0.53 -1.44 1.82 -0.04 . 0.71 -0.57 -1.44 2.08
Hospice
β 7.98*** $21.45 $1.93 $0.21 -16.88*** -15.70* $5.52 $7.29 -$1.73 $0.57 -$9.82 $8.20
SE $2.29 $11.43 $2.89 $19.25 $2.72 $7.79 $9.52 $8.96 $6.27 $8.74 $5.99 $5.81
t 3.49 1.88 0.67 0.01 -6.20 -2.02 0.58 0.81 -0.28 0.07 -1.64 1.41
Readmis-sions
β $462.42 $104.70 $407.30 $232.44 300.74** -$119.35 -$345.70 $497.87 $226.60 $66.03 $42.62 $88.21
SE $481.62 $319.10 $242.17 $124.20 $91.47 $60.74 $340.16 $253.99 $199.71 $100.77 $92.96 $152.00
t 0.96 0.33 1.68 1.87 3.29 -1.96 -1.02 1.96 1.13 0.66 0.46 0.58
Physician Office
β -6.53*** -$15.66 -$10.75 -$1.31 -12.39*** -$6.34 -$2.60 -$3.54 -10.47* -$3.97 -$7.44 $2.86
SE $1.74 $11.71 $9.30 $2.64 $1.72 $5.83 $2.12 $4.62 $5.04 $3.01 $4.13 $4.20 t -3.76 -1.34 -1.16 -0.50 -7.20 -1.09 -1.22 -0.77 -2.07 -1.32 -1.80 0.68
Out-patient
β -$3.21 113.74** 34.66** $21.19 82.87** -$24.90 -$25.94 $4.90 -43.13* $58.18 -$41.69 -$7.24
SE $58.68 $35.28 $12.62 $30.67 $26.85 $13.33 $80.03 $45.12 $21.45 $32.45 $33.43 $13.23
t -0.05 3.22 2.75 0.69 3.09 -1.87 -0.32 0.11 -2.01 1.79 -1.25 -0.55

IMPAQ International, LLC Page 123 Evaluation of Medicare ACE Demonstration May 31, 2013 Final Evaluation Report
ACE Sites Non-Demonstration Treatment Sites
Valve Defibril-
lator CABG Pacemaker PCI Hip/Knee Valve
Defibril-lator
CABG Pacemaker PCI Hip/Knee
Other
β -26.90*** $5.62 -50.93** -$0.24 -9.57* -18.92*** $8.35 -$15.27 $2.49 -$6.99 $2.14 $5.81
SE $5.61 $15.51 $17.51 $5.12 $4.58 $5.29 $11.37 $14.29 $7.86 $13.67 $7.94 $17.74
t -4.80 0.36 -2.91 -0.05 -2.09 -3.57 0.73 -1.07 0.32 -0.51 0.27 0.33
Note: All regressions included hospital, MS-DRG, and quarter fixed-effects. Standard errors are clustered by hospital. In addition to ACE and non-demonstration treatment hospitals, the regressions included the true comparison group hospitals (96 for cardiovascular procedures; 62 for orthopedic procedures). * p<.05, **p<.01, ***p<.001.

IMPAQ International, LLC Page 124 Evaluation of Medicare ACE Demonstration May 31, 2013 Final Evaluation Report
4. SUMMARY In this chapter we examined the impact of the ACE Demonstration on the dollars’ worth of non-acute care hospital services (documented in the non-DME carrier claims files) provided during the inpatient stay and on the PAC costs incurred following inpatient episodes for ACE procedures. We first considered descriptive statistics and then applied rigorous quasi-experimental difference-in-differences regression models that longitudinally compared the ACE sites and the non-demonstration treatment hospitals to the true comparison hospitals. The effects of the demonstration on carrier claims costs provided during inpatient episodes at the ACE hospitals are striking and robust. The demonstration appears to have increased carrier charges by more than 20 percent (ranging from $325 per defibrillator episode to $1,190 per valve episode). Additional investigation of these results revealed that the increased services were for CPT/HCPCS codes related to hospital visits and procedures. It is possible that the rules governing the ACE Demonstration incentivized providers to deliver more care because (a) physicians did not experience risk in cases where the costs of care exceeded the bundled payment amount, (b) physicians’ quality of care was scrutinized as part of the demonstration, or (c) physician services may have been substituted for hospital services (e.g., more physicians’ visits leading to shorter lengths of stay). There was no effect on carrier claims for inpatient episodes at non-demonstration treatment group hospitals. We developed several PAC cost measures to examine the costs to Medicare following inpatient ACE episodes. With the exception of PCI procedures, for which total PAC costs increased by $414 (17 percent of the pre-implementation costs), average total PAC costs did not change. The increase in costs following PCI episodes was driven by increased expenditures for readmissions ($300) and outpatient care ($82). The pooled estimates for the ACE sites obscure the fact that BHS’ total PAC costs increased by between $283 for orthopedic procedures and $3,463 for valve procedures in response to the demonstration and that LHS’s PAC costs for orthopedic procedures decreased by more than $1,000 per episode. Across ACE sites, there was some evidence of a decrease in physician office visits and other post-discharge care, and an increase in outpatient costs. Similar to the results for Part B costs, the demonstration had no impact on PAC costs following inpatient episodes at non-demonstration treatment group hospitals.

IMPAQ International, LLC Page 125 Evaluation of Medicare ACE Demonstration May 31, 2013 Final Evaluation Report
CHAPTER IV: QUALITY OF CARE, RESOURCE UTILIZATION, AND CASE MIX

IMPAQ International, LLC Page 126 Evaluation of Medicare ACE Demonstration May 31, 2013 Final Evaluation Report
1. INTRODUCTION An important ACE Demonstration goal was to maintain or improve the quality of care at the ACE sites compared to pre-demonstration levels. The demonstration design included incentives, particularly gainsharing, to create more efficient and effective processes to improve the quality and coordination of care and to lower costs. Standardization of order sets and materials and implants were among the main interventions for changing the way care was delivered at ACE sites. These changes in processes and supplies had the potential to result in higher quality of care. This potential was reinforced because the ACE sites set thresholds for quality of care that physicians had to meet to receive gainsharing. However, since bundled payments are intrinsically lower than the sum of the typical pre-demonstration individual payments, there was also the possibility that facilities and physicians might try to economize on the care provided. Whether the bundled payment, gainsharing, and the ACE interventions affected quality of care is of critical importance in evaluating the demonstration’s success and that of future bundled payment initiatives. To complement the qualitative information presented in Section II of this report, we used quantitative methods to examine the demonstration’s effects on quality of care, utilization, and case mix measures. When feasible, we utilized the DID approach to control for time trends and patient and facility characteristics. In a few instances, where some data were unavailable, we estimated time trends only. As in the other chapters, we focus on global measures of the effect of the ACE Demonstration on the corresponding outcomes. The estimates of the other global measures and all site-specific measures are presented in Appendix D.

IMPAQ International, LLC Page 127 Evaluation of Medicare ACE Demonstration May 31, 2013 Final Evaluation Report
2. MEASURES To estimate the impact of the demonstration on quality of care at the ACE sites and the non-demonstration treatment sites, we used the 22 quality measures that were identified in the Scope of Work for the ACE Demonstration.31 These measures were developed or are recognized by such organizations as the National Quality Forum (NQF), Hospital Compare, and the Agency for Healthcare Research and Quality (AHRQ). The measures capture three aspects of quality: (1) severity of admitted patients, (2) processes, and (3) outcomes. Because not all the quality measures were applicable to all the procedure groups included in the demonstration, the research team analyzed only a subset of measures for each procedure group. Exhibit 27 lists the 22 quality measures, and, for each measure, the type of measure, data source, and relevant procedure groups. Twelve of the measures are outcome measures, six are process measures, and four capture patient severity. The number of quality measures for each procedure group ranges from 11 (defibrillator and pacemaker) to 19 (CABG).
31 These measures were included in the Medicare Acute Care Episode Demonstration: Design, Implementation and Management Report by RTI International (August 2008).

IMPAQ International, LLC Page 128 Evaluation of Medicare ACE Demonstration May 31, 2013 Final Evaluation Report
Exhibit 27: ACE Quality of Care, Utilization, and Case Mix Measures
# Measure Description Category Data
Source Defibril-
lator Pace-maker
Valve CABG PCI Hip/ Knee
1 Prophylactic antibiotic received within 1 hour prior to surgical incision
Process Site
Reports
2 Prophylactic antibiotic selection for surgical patients
Process Site
Reports
3
Prophylactic antibiotics discontinued within 24 hours after surgery end time for hip and knee replacement and 48 hours for CABG and valve procedure groups
Process Site
Reports
4
Surgery patients who received appropriate venous thromboembolism prophylaxis within 24 hours prior to surgery to 24 hours after surgery
Process Site
Reports
10 Anti-platelet medication prescribed at discharge
Process Site
Reports
11 Percent of CABG patients returned to operating room during stay
Outcome Site
Reports
12
Percent of PCI procedures with angiographic success and no death, myocardial infarction, or emergent/salvage CABG
Outcome Site
Reports
13
Revascularization rates by number of vessels separately for PCI and CABG and percent of CABG procedures performed off pump
Severity Site
Reports
5 Postoperative hemorrhage/hematoma
Outcome Claims
6 Postoperative physiologic and metabolic derangement
Outcome Claims
7 Post-operative sepsis Outcome Claims
8 Inpatient mortality rate Outcome Claims
9 Use of internal mammary artery in first time isolated CABG
Process Claims
14 Post-operative stroke Outcome Claims
15
Percent of ACE Demonstration procedure cardiovascular re-dos or orthopedic revisions during the prior six months
Outcome Claims
16 30-day post-surgery mortality rate
Outcome Claims
17 30-day readmission rate Outcome Claims

IMPAQ International, LLC Page 129 Evaluation of Medicare ACE Demonstration May 31, 2013 Final Evaluation Report
# Measure Description Category Data
Source Defibril-
lator Pace-maker
Valve CABG PCI Hip/ Knee
18 Change in mix of MS-DRG assignments
Severity Claims
19 Severity of beneficiaries receiving a total hip or knee replacement/revision
Severity Claims
20 Average length of stay Outcome Claims
21 Percent Medicare outlier patients
Severity Claims
22 Percent discharge destination is acute care hospital transfer or post-acute
Outcome Claims

IMPAQ International, LLC Page 130 Evaluation of Medicare ACE Demonstration May 31, 2013 Final Evaluation Report
It is possible that there may have been some adverse consequences because the demonstration sites may have attempted to reduce the risks associated with receiving bundled payments. To reduce risk, the sites may have admitted patients with lower health status and may have shortened inpatient lengths of stay, thereby possibly increasing transfers and admissions into PAC facilities and shifting the cost/quality burden to those settings. As we observe in the PAC cost analysis, the global measures show that this was not necessarily the case although there were differences across sites. Several factors may mediate the likelihood of adverse outcomes. For example, the employment relationship between the physician and the ACE site may show that physicians who were employed by an ACE site and did not have admitting privileges at other hospitals were less likely to “cream skim” based on the health status of patients under their care. Also, the demonstration had a framework that aligned the payment incentives between hospitals and physicians to encourage the provision of care according to best practices. In addition, all ACE sites made meeting quality targets a prerequisite for receiving a portion of any savings through physician gainsharing. Thus, demonstration sites on average were expected either to improve or maintain pre-demonstration levels of quality. We also expected the non-demonstration treatment facilities to experience some indirect effects from the demonstration. Any changes in the types of patients admitted to ACE sites would change the mix of patients available for admission to the neighboring sites. For example, if patients with less complicated diagnoses were admitted to the ACE sites, there would likely be a corresponding increase in patient severity at the non-demonstration treatment sites, because the latter would admit the residual patients. However, because the payment system at the non-demonstration treatment sites was not affected by the demonstration, we did not expect any behavioral responses in the quality of care provided by these sites. Furthermore, because the process and outcome quality of care responses are adjusted for severity level, we expected the non-demonstration sites to improve or maintain their previous quality levels. The underlying hypotheses of the quality of care responses of the ACE and non-demonstration treatment sites to the ACE Demonstration are presented in Exhibit 28. This exhibit displays the measurement category, the measure numbers of the relevant quality measures, and the hypothesized responses of the ACE sites and the non-demonstration treatment sites.

IMPAQ International, LLC Page 131 Evaluation of Medicare ACE Demonstration May 31, 2013 Final Evaluation Report
Exhibit 28: Hypothesized Utilization and Case Mix Responses
Measurement
Category Measure
Number(s) ACE Sites
Non-Demonstration Treatment Sites
Process 1, 2, 3, 4, 9, 10 Maintenance or improvement in
the quality of services Maintenance of the quality
of services
Outcome 5, 6, 7, 8, 11,
12, 14, 15, 16, 17
Maintenance or improvement in patient outcomes
Maintenance of patient outcomes
Severity 13, 18, 19, 21 Decrease in or maintenance of the severity of ACE-related admissions
Increase in the severity of ACE-related admissions
Length of Stay (Outcome)
20 Decrease in the lengths of stay of
ACE-related admissions
Maintenance of the lengths of stay of ACE-related
admissions
Transfers (Outcome)
22 Increase in the rates of transfers to PAC facilities and other acute care
hospitals
Maintenance of the rates of transfers to PAC facilities and
other acute care hospitals
Exhibit 29 details how the specific quality of care measures for the demonstration and non-demonstration treatment sites were expected to change with the implementation of the ACE Demonstration. For the process and outcome measures, the hypothesized changes include controlling for patient severity. In our estimation models we used hierarchical condition category (HCC) community risk scores to control for patient severity (health status) at admission.
Exhibit 29: Expected Changes for Utilization and Case Mix Measures
Measure ACE Sites Non-Demonstration
Treatment Sites Trend Analysis – Data from Site Reports 1. Prophylactic antibiotic received within 1 hour prior to surgical incision
Same or Improve (Increase)
Same
2. Prophylactic antibiotic selection for surgical patients Same or
Improve (Increase) Same
3. Prophylactic antibiotics discontinued within 24 hours after surgery end time for hip and knee replacement and 48 hours for CABG and valve procedure groups
Same or Improve (Increase)
Same
4. Surgery patients who received appropriate venous thromboembolism prophylaxis within 24 hours prior to surgery to 24 hours after surgery
Same or Improve (Increase)
Same
10. Anti-platelet medication prescribed at discharge Same or
Improve (Increase) Same
11. Percent of CABG patients returned to operating room during stay
Same or Improve (Decrease)
Same

IMPAQ International, LLC Page 132 Evaluation of Medicare ACE Demonstration May 31, 2013 Final Evaluation Report
Measure ACE Sites Non-Demonstration
Treatment Sites 12. Percent of PCI procedures with angiographic success and no death, myocardial infarction (MI) or emergent/salvage CABG
Same or Improve (Increase)
Same
13.1. Revascularization rates by number of vessels for patients with PCI and/or CABG
Single vessel excluding left main Same or Increase Same or Decrease
Left main only Same or Decrease Same or Increase
Double vessel Same or Decrease Same or Increase
More than double vessel Same or Decrease Same or Increase
13.2. Percent of CABG procedures performed off pump for patients receiving CABG or PCI-and-CABG
Same or Decrease Same
DID Analysis – Data from Medicare claims
5. Postoperative hemorrhage/hematoma Same or
Improve (Decrease) Same
6. Postoperative physiologic and metabolic derangement Same or
Improve (Decrease) Same
7. Post-operative sepsis Same or
Improve (Decrease) Same
8. Inpatient mortality rate (annual) Same or
Improve (Decrease) Same
9. Use of internal mammary artery in first-time isolated CABG
Same or Improve (Increase)
Same
14. Post-operative stroke Same or Decrease Same
15. Percent of ACE Demonstration procedure cardiovascular re-dos or orthopedic revisions during the prior six months (semi-annual)
Same or Decrease Same
16. 30-day post-surgery mortality rate Same or Decrease Same
17. 30-day readmission rate Same or Decrease Same
18. Case mix of MS-DRG assignments Same or Decrease Increase
19. Severity of beneficiaries receiving a hip or knee replacement/revision
Over age 75 Same or Decrease Increase
With hip fracture Same or Decrease Increase
With rheumatoid arthritis Same or Decrease Increase
20. Average and median length of stay Decrease Same
21. Percent Medicare outlier patients Decrease Increase
22. Percent discharge destination is acute care hospital transfer or post-acute care facility
Increase Same

IMPAQ International, LLC Page 133 Evaluation of Medicare ACE Demonstration May 31, 2013 Final Evaluation Report
2.1. Research Questions
Based on these hypothesized changes, we posed the following research questions for the quality of care qualitative analysis:
Are the components of the ACE Demonstration effective in encouraging providers to increase or continue (high) adherence to best practices at ACE sites?
Are the components of the ACE Demonstration effective in encouraging improvements in patient outcomes at ACE sites?
Does the ACE Demonstration lead to any “cream skimming” of patients at ACE sites? Similarly, does the severity of patients admitted into non-demonstration treatment sites increase?
Do lengths of stay decrease after the implementation of the demonstration?
Are there increases in the transfer of patients into PAC facilities or other acute hospitals during the ACE Demonstration?
2.2. Data
We used quality of care measure scores from two data sources: (1) Medicare claims data collected by CMS and (2) quarterly quality reports submitted by the ACE sites. Exhibit 27 above, showed the type of data source used to calculate each of the quality measures. We relied on the quality reports for the eight measure scores that require information from a medical record/chart or other specific data to which the providers have primary access. Because the comparison hospitals (non-demonstration treatment hospitals and true comparison group hospitals) were not part of the ACE Demonstration, these measures were not collected for those hospitals and are not included in our comparative analyses. The values for these measures are reported at the site level, on a quarterly basis. We calculated values from the third quarter of CY 2009 through the fourth quarter of CY 2011. No data for 2012 were available to include in the analyses.
We also calculated the measure values for the 14 Medicare claims-based measures for the ACE sites, the non-demonstration treatment sites, and the true comparison sites using Chronic Condition Warehouse (CCW) claims and denominator data files. To calculate these measures, we adopted the measure specifications defined by the ACE implementation contractor. Given lags in claims submission and validation, these quality measures were calculated for patient admissions between October 2007 and October 2012.
The claims-based measure analysis was conducted in a DID regression framework, where the characteristics of the patients admitted to the evaluation sites were the independent variables.
In particular, we considered race, gender, age at discharge, and patient health status (HCC community risk score) as the patient characteristics. The sources of these data elements were denominator and hierarchical condition category (HCC) files. To capture patient health status, we used the patient’s HCC community risk score for the calendar year of the relevant discharge. The CMS HCC model categorizes beneficiaries into groups with similar costs of treatment and

IMPAQ International, LLC Page 134 Evaluation of Medicare ACE Demonstration May 31, 2013 Final Evaluation Report
assigns risk scores to beneficiaries based on demographic and disease characteristics. Higher HCC risk scores indicate greater severity of illness and higher expected expenditures.

IMPAQ International, LLC Page 135 Evaluation of Medicare ACE Demonstration May 31, 2013 Final Evaluation Report
3. METHODOLOGY In estimating the impact of the ACE Demonstration on the quality of care measures, we employed two methodologies: time trend analysis and difference-in-differences (DID). The analysis method used for each quality measure was determined by the data source for the measure. For measures produced by the sites (obtained from the quarterly quality reports), we used time trend analysis. For measures developed using the claims data, we estimated the impact using the adjusted difference-in-differences model described in Chapter 1, Section 2.2.1. The reason for the different treatment of these two categories of measures is that a DID analysis requires scores for the quality measures for both the treatment sites and the comparison sites, before and after implementation of the demonstration. For the measures produced by the ACE sites, we do not have any scores for the comparison sites. For the claims-based measures we have all of the necessary measure scores for the DID analysis. For measures that require medical record/chart review, however, we were not able to obtain values for the non-demonstration treatment and true comparison hospitals, because these sites were not active participants in the demonstration. In addition, for the measures based on the ACE sites’ quality reports, we did not have any measure scores for the period prior to the demonstration. Thus, it was not feasible to perform even a pre-post analysis of the changes in these quality measures. Given the limited availability of observations for the measures based on medical record/chart review (no quarterly observations for the pre-demonstration period and no more than 10 hospital-level observations for the post-demonstration period), we estimated linear time trend models rather than a more complex time trend model for the trend of the post-demonstration period medical record measures, using the following equation:
(Equation 3) These models were estimated using ACE global-level or hospital-level quality measures captured quarterly32 and were weighted by the number of ACE admissions. The time trend coefficient can be interpreted as how much the measure changes, on average, for one quarter increase. Note that the measures based on the quality reports are given as ratios, i.e., the percentage of episodes for a certain condition among all the episodes relevant for the measure. Thus, the time trend coefficient shows changes in the ratio in percentage points. For example, if the coefficient for the revascularization rate is 0.0144, the meaning is that the rate has increased by 1.44 percentage points. We were able to analyze the claims-based measures using DID, a more robust quasi-experimental methodology. Our analysis relied on adjusted DID estimates. The underlying model for this approach was discussed in Chapter 1, Section 2.2.1. However, there are some
32 These measures were reported only by BHS, HMC, and OHH. For BHS and HMC we have quarterly values from CY 2009 Q3 to CY 2010 Q4. For OHH, we have quarterly values from CY 2010 Q1 to CY 2010 Q4.

IMPAQ International, LLC Page 136 Evaluation of Medicare ACE Demonstration May 31, 2013 Final Evaluation Report
variations in the DID model used in the quality of care analysis. The quality of care DID models were estimated at the claim level, using beneficiary-level covariates with site and time fixed-effects. The outcome variables, , in these models capture a claim’s contribution to the numerator of a site’s quality measure score. For all claims-based measures except case mix (measure 18) and length of stay (measure 20), this means that the outcome variable will be binary. Thus, we estimated the demonstration’s effect on quality using a logistic regression model for all measures except measures 18 and 20. For these measures, we used a linear regression model. Exhibit 30 summarizes the direction of the measure changes in the pre- and post-period quality of care summary statistics by type of measure (process [CABG only], severity, and outcome), severity and outcome), procedure, and hospital group. Exhibits 31–36 provide summary statistics by procedure for the pre- to post-ACE implementation periods in the ACE sites, non-demonstration treatment hospitals, and true comparison hospitals. Each cell contains the mean value, the standard deviation (in parentheses), and the number of observations.33 Exhibits 30 – 36 uses data from CY 2007 Q4 to CY 2012 Q3. The use of internal mammary artery in first-time isolated CABG, the only process measure among the claims-based measures, showed a worsening effect in the post-period measure means. This was an unexpected change and required follow-up in the DID analysis. The proportion of procedures using internal mammary arteries decreased by approximately 2 percentage points for ACE sites, while adherence to this process increased in the true comparison group hospitals by over 3 percentage points. This may be suggestive of a decrease in this quality metric for the ACE sites. In terms of the severity measure that was applicable to all procedures, we observed that in two cardiovascular procedures (pacemaker and valve) and the hip/knee procedures there was a reduction in the case mix weight means (measure 18), while the other three cardiovascular procedures (PACE, CABG, PCI) had higher case mix weight means (greater proportion of frail patients). The decrease in case mix weight was expected due to the incentives introduced by ACE. However, a higher case mix of MS-DRG assignments was unexpected. The additional severity measures (measures 19a–19c) for orthopedic procedures show that in most cases, there was a reduction (as expected) in the severity of beneficiaries receiving a hip or knee replacement/revision who were over age 75. However, there was a increase in the severity of beneficiaries receiving a hip or knee replacement/revision with hip fracture or rheumatoid arthritis. Changes in these two measures were unexpected because these patients would have been expected to have more complications and higher (internal) costs; thus, they would be less profitable under the demonstration. For the last severity measure, percentage of Medicare outlier patients, we had expected a decrease in these patients, and our hypothesis was sustained for all but one procedure (PCI). The true comparison sites showed the opposite pattern, with five of the six procedure groups displaying increases in the proportion of outlier
33 The number of observations across measures with a site type varied because of differences in the inclusion and exclusion criteria.

IMPAQ International, LLC Page 137 Evaluation of Medicare ACE Demonstration May 31, 2013 Final Evaluation Report
patients. This is suggestive of a downward shift in the proportion of outlier patients in ACE sites following implementation of the demonstration. Finally, the comparison between the pre- and post-period means of the outcome quality measures indicates that changes in the quality of care measures were mixed for the various procedure groups. Two measures showed consistent changes: 30-day post-surgery mortality (measure 16) and postoperative sepsis (measure 7). The post-surgery mortality measure improved in ACE sites for five of the six procedure groups. PCI, on the other hand, showed a higher mortality rate in the post-ACE period. The postoperative sepsis measure worsened in two of the three procedure groups for which the measure is applicable (valve, CABG, and hip/knee). Valve is the only procedure group where we observed a reduction in these measures, which is consistent with our expectations. It is important to note that the true comparison group hospitals performed similarly on both of these measures, indicating that the demonstration was likely not the cause of these changes. In two cases the true comparison hospitals performed consistently differently from the ACE sites across procedure groups. For example, the true comparison hospitals improved on measure 5 (postoperative hemorrhage/hematoma) for five of the six procedure groups, while only two of the procedures in the ACE sites showed an improvement in this measure. However, the outcome measures for two procedures in ACE sites did not change. Measure 17 (readmissions) for all six procedure groups showed an improvement in the true comparison group, while the results were mixed for the ACE sites. Pre-period to post-period changes in mean length of stay (measure 20) for the ACE sites and the true comparison group were mixed. Discharges to acute care settings (measure 22a) decreased for five of the six procedure types in the ACE sites, while the true comparison group had mixed results. Our hypothesis was that there would be a higher proportion of discharges to acute or post-acute care facilities. The direction of change for the proportion of discharges to post-acute care facilities (measure 22b) was mixed for the ACE sites, although the true comparison hospitals were more likely to discharge to these settings during the post-implementation period than during the pre-implementation period.

IMPAQ International, LLC Page 138 Evaluation of Medicare ACE Demonstration May 31, 2013 Final Evaluation Report
Exhibit 30: Descriptive Statistics Changes in Quality of Care, Utilization, and Case Mix Measures Pre- and Post-ACE Demonstration
Measure Description
Type of Measure
Expected Changes
ACE Sites True Comparison Sites
Defibril-lator
Pace-maker
Valve CABG PCI Hip/ Knee
Defibril-lator
Pace-maker
Valve CABG PCI Hip/ Knee
5. Postoperative hemorrhage/
hematoma Outcome
Same or Decrease in
rates (Improve-ment in care)
Decline in Care
Improve-ment in
Care
Improve-ment in
Care
Decline in Care
Improve-ment in
Care
Improve-ment in
Care
Decline in Care
Improve-ment in
Care
Improve-ment in
Care
Improve-ment in
Care
6. Postoperative physiologic and
metabolic derangement
Outcome
Same or Decrease in
rates (Improve-ment in care)
Decline in Care
Decline in Care
Improve-ment in
Care
Improve-ment in
Care
Improve-ment in
Care
Decline in Care
Decline in Care
Improve-ment in
Care
Improve-ment in
Care
Improve-ment in
Care
7. Postoperative sepsis
Outcome
Same or Decrease in
rates (Improve-ment in care)
N/A N/A Improvement in
Care
Decline in Care
N/A Decline in Care
N/A N/A Decline in Care
Decline in Care
N/A Decline in
Care
9. Use of internal mammary artery
in first-time isolated CABG
Process
Same or Increase in
rates (Improve-ment in care)
N/A N/A N/A Decline in Care
N/A N/A N/A N/A N/A Improvement in
Care N/A N/A
14. Postoperative stroke
Outcome
Same or Decrease in
rates (Improve-ment in care)
Improve-ment in
Care
Improve-ment in
Care
Decline in Care
Decline in Care
Decline in Care
Improve-ment in
Care
Improve-ment in
Care
Improve-ment in
Care
Decline in Care
Decline in Care
Decline in Care
Improve-ment in
Care
16. 30-day post-surgery mortality
Outcome
Same or Decrease in
rates (Improve-ment in care)
Improve-ment in
Care
Improve-ment in
Care
Improve-ment in
Care
Improve-ment in
Care
Decline in Care
Improve-ment in
Care
Improve-ment in
Care
Improve-ment in
Care
Improve-ment in
Care
Improve-ment in
Care
Decline in Care
Improve-ment in
Care
17. 30-day readmission
Outcome
Same or Decrease in
rates (Improvement
in care)
Improve-ment in
Care
Decline in Care
Improve-ment in
Care
Decline in Care
Decline in Care
Improve-ment in
Care
Improve-ment in
Care
Improve-ment in
Care
Improve-ment in
Care
Improve-ment in
Care
Improve-ment in
Care
Improve-ment in
Care
18. Case mix of MS-DRG
assignments Severity
Same or Decrease in
Severity (Adverse
consequence)
Decrease in
Severity
Increase in
Severity
Increase in
Severity
Increase in
Severity
Decrease in
Severity
Increase in
Severity
Increase in
Severity

IMPAQ International, LLC Page 139 Evaluation of Medicare ACE Demonstration May 31, 2013 Final Evaluation Report
Measure Description
Type of Measure
Expected Changes
ACE Sites True Comparison Sites
Defibril-lator
Pace-maker
Valve CABG PCI Hip/ Knee
Defibril-lator
Pace-maker
Valve CABG PCI Hip/ Knee
19a. Severity of beneficiaries
receiving a hip or knee replacement/ revision – over age
75
Severity
Same or Decrease in
rate (severity) (Adverse
consequence)
N/A N/A N/A N/A N/A Decrease
in Severity
N/A N/A N/A N/A N/A Decrease
in Severity
19b. Severity of beneficiaries
receiving a hip or knee replacement/ revision – with hip
fracture
Severity
Same or Decrease in
rate (severity) (Adverse
consequence)
N/A N/A N/A N/A N/A Increase
in Severity
N/A N/A N/A N/A N/A Increase
in Severity
19c. Severity of beneficiaries
receiving a hip or knee replacement/
revision – with rheumatoid
arthritis
Severity
Same or Decrease in
rate (severity) (Adverse
consequence)
N/A N/A N/A N/A N/A Increase
in Severity
N/A N/A N/A N/A N/A Increase
in Severity
20. Average and median length of
stay Outcome
Decrease in LOS
(Adverse consequence
and/or increase in
efficiencies)
Decrease in LOS
Increase in LOS
Increase in LOS
Decrease in LOS
Increase in LOS
Decrease in LOS
Increase in LOS
Decrease in LOS
21. Percent Medicare outlier
patients Severity
Decrease in rate (severity)
(Adverse consequence)
Decrease in
Severity
Decrease in
Severity
Decrease in
Severity
Decrease in
Severity
Increase in
Severity
Decrease in
Severity
Increase in
Severity
Increase in
Severity
Increase in
Severity
Increase in
Severity
Increase in
Severity
Decrease in Severity
22a. Percent discharge
destination is acute care hospital
transfer
Outcome Increase in rate
(Adverse consequence)
Improve-ment in
Care
Improve-ment in
Care
Improve-ment in
Care
Improve-ment in
Care
Improve-ment in
Care
Improve-ment in
Care
Decline in Care
Decline in Care
Decline in Care
Improve-ment in
Care

IMPAQ International, LLC Page 140 Evaluation of Medicare ACE Demonstration May 31, 2013 Final Evaluation Report
Measure Description
Type of Measure
Expected Changes
ACE Sites True Comparison Sites
Defibril-lator
Pace-maker
Valve CABG PCI Hip/ Knee
Defibril-lator
Pace-maker
Valve CABG PCI Hip/ Knee
22b. Percent discharge
destination is post-acute care facility
Outcome Increase in rate
(Adverse consequence)
Improve-ment in
Care
Decline in Care
Decline in Care
Decline in Care
Improve-ment in
Care
Decline in Care
Decline in Care
Decline in Care
Decline in Care
Decline in Care
Improve-ment in
Care
Note: N/A indicates the quality of care measure does not apply to the corresponding procedure group. Empty cells indicate the mean statistics in the pre- and post- ACE period are not statistically different.

IMPAQ International, LLC Page 141 Evaluation of Medicare ACE Demonstration May 31, 2013 Final Evaluation Report
Exhibit 31: Utilization and Case Mix Measures – Summary Statistics for Defibrillator
Measure ACE Sites Non-Demonstration Treatment Sites True Comparison Sites
Pre Post Pre Post Pre Post
5. Postoperative hemorrhage/hematoma
0.00% 0.00% 0.09% 0.18%*** 0.19% 0.15%***
(0.00%) (0.00%) (3.05%) (4.22%) (4.35%) (3.81%)
472 609 1,078 1,124 3,168 4,816
6. Postoperative physiologic and metabolic derangement
0.00% 0.00% 0.16% 0.00%*** 0.06% 0.00%***
(0.00%) (0.00%) (4.02%) (0.00%) (2.54%) (0.00%)
373 502 619 589 1,553 2,146
14. Postoperative stroke
0.21% 0.00%*** 0.19% 0.18%*** 0.41% 0.27%***
(4.6%) (0.00%) (4.31%) (4.22%) (6.39%) (5.18%)
473 610 1,078 1,123 3,167 4,828
16. 30-day post-surgery mortality
1.27% 0.66%*** 1.85% 1.69%*** 2.18% 1.95%***
(11.21%) (8.08%) (13.49%) (12.89%) (14.61%) (13.82%)
472 609 1,079 1,125 3,162 4,825
17. 30-day readmission
7.63% 4.43%*** 7.38% 8.5%*** 10.52% 10.2%***
(26.57%) (20.58%) (26.16%) (27.91%) (30.69%) (30.27%)
472 610 1,070 1,117 3,156 4,793
18. Case mix weight
5.31 5.22* 5.43 5.38 5.44 5.47
(0.67) (0.58) (0.74) (0.71) (0.75) (0.77)
473 610 1,081 1,127 3,176 4,839
20. Length of stay 2.4 2.21 3.7 3.87 4.76 4.99
(2.91) (2.61) (4.73) (4.62) (5.17) (5.25)
473 610 1,081 1,127 3,176 4,839
21. Medicare outlier patients 49.58% 28.08%*** 7.14% 4.89%*** 10.22% 11.32%***
(50.05%) (44.98%) (25.75%) (21.57%) (30.29%) (31.68%)
472 609 1,079 1,125 3,162 4,825
22a. Discharge destination is acute care hospital transfer
0.21% 0.16%*** 0.19% 0.18%*** 0.38% 0.25%***
(4.6%) (4.05%) (4.32%) (4.23%) (6.16%) (5%)
472 610 1,070 1,117 3,154 4,791

IMPAQ International, LLC Page 142 Evaluation of Medicare ACE Demonstration May 31, 2013 Final Evaluation Report
Measure ACE Sites Non-Demonstration Treatment Sites True Comparison Sites
Pre Post Pre Post Pre Post
22b. Discharge destination is post-acute care facility
4.45% 4.1%*** 5.79% 6.45%*** 7.45% 10.04%***
(20.64%) (19.84%) (23.37%) (24.57%) (26.26%) (30.05%)
472 610 1,070 1,117 3,156 4,793
Note: The first, second, and third rows show mean, standard deviation, and number of episodes, respectively. The difference between the pre-period and post-period means is statistically significant at *p<.05, **p<.01, ***p<.001.

IMPAQ International, LLC Page 143 Evaluation of Medicare ACE Demonstration May 31, 2013 Final Evaluation Report
Exhibit 32: Utilization and Case Mix Measures – Summary Statistics for Pacemaker
Measure ACE Sites Non-Demonstration Treatment Sites True Comparison Sites
Pre Post Pre Post Pre Post
5. Postoperative hemorrhage/hematoma
0.00% 0.08%*** 0.00% 0.12%*** 0.09% 0.05%*** (0.00%) (2.83%) (0.00%) (3.39%) (2.99%) (2.32%)
1,221 1,251 2,761 3,478 10,051 16,741
6. Postoperative physiologic and metabolic derangement
0.00% 0.19%*** 0.09% 0.1%*** 0.03% 0.05%***
(0.00%) (4.41%) (2.97%) (3.16%) (1.73%) (2.21%)
678 514 1,133 1,003 3,325 4,104
14. Postoperative stroke
0.82% 0.16%*** 0.58% 0.29%*** 0.67% 0.38%***
(9.01%) (4%) (7.6%) (5.36%) (8.14%) (6.13%)
1,222 1,249 2,755 3,467 10,056 16,713
16. 30-day post-surgery mortality
1.89% 1.59%*** 2.47% 2.16%*** 2.66% 2.09%***
(13.62%) (12.52%) (15.53%) (14.55%) (16.09%) (14.31%)
1,217 1,256 2,750 3,467 10,036 16,737
17. 30-day readmission
6.07% 6.66%*** 7.79% 9.83%*** 9.19% 8.95%***
(23.88%) (24.94%) (26.81%) (29.78%) (28.89%) (28.55%)
1,220 1,247 2,747 3,447 9,987 16,668
18. Case mix weight
2.47 2.59** 2.4 2.5*** 2.47 2.54***
(0.7) (0.72) (0.69) (0.71) (0.71) (0.72)
1,226 1,256 2,765 3,484 10,078 16,804
20. Length of stay
2.97 3.68*** 4.1 4.5** 4.46 4.7***
(3.01) (3.73) (4.69) (4.25) (4.41) (4.22)
1,226 1,256 2,765 3,484 10,078 16,804
21. Medicare outlier patients
5.18% 3.74%*** 3.16% 3.09%*** 3.18% 3.73%***
(22.16%) (18.99%) (17.51%) (17.3%) (17.54%) (18.96%)
1,217 1,256 2,750 3,467 10,036 16,737
22a. Discharge destination is acute care hospital transfer
0.41% 0.00%*** 0.29% 0.44%*** 0.29% 0.29%
(6.4%) (0.00%) (5.4%) (6.59%) (5.38%) (5.36%)
1,216 1,247 2,740 3,445 9,974 16,649

IMPAQ International, LLC Page 144 Evaluation of Medicare ACE Demonstration May 31, 2013 Final Evaluation Report
Measure ACE Sites Non-Demonstration Treatment Sites True Comparison Sites
Pre Post Pre Post Pre Post
22b. Discharge destination is post-acute care facility
9.26% 14.11%*** 12.74% 15.06%*** 14.87% 17.32%***
(29%) (34.83%) (33.35%) (35.77%) (35.58%) (37.84%)
1,220 1,247 2,747 3,447 9,987 16,668
Notes: The first, second, and third rows show mean, standard deviation, and number of episodes, respectively. The difference between the pre-period and post-period means is statistically significant at *p<.05, **p<.01, ***p<.001.

IMPAQ International, LLC Page 145 Evaluation of Medicare ACE Demonstration May 31, 2013 Final Evaluation Report
Exhibit 33: Utilization and Case Mix Measures – Summary Statistics for Valve
Measure ACE Sites Non-Demonstration Treatment Sites True Comparison Sites
Pre Post Pre Post Pre Post
5. Postoperative hemorrhage/hematoma
0.00% 0.00% 0.23% 0.00%*** 0.1% 0.19%***
(0.00%) (0.00%) (4.84%) (0.00%) (3.12%) (4.33%)
510 690 853 1,413 4,098 10,128
6. Postoperative physiologic and metabolic derangement
0.00% 0.37%*** 0.39% 0.46%*** 0.18% 0.34%***
(0.00%) (6.07%) (6.23%) (6.76%) (4.21%) (5.85%)
413 542 514 872 2,817 6,702
7. Postoperative sepsis 3.53% 1.5%*** 2.68% 3.4%*** 2.47% 2.59%***
(18.49%) (12.18%) (16.18%) (18.13%) (15.52%) (15.89%)
368 466 447 736 2,510 5,904
14. Postoperative stroke 3.52% 3.76%*** 2.33% 2.39%*** 2.93% 3.2%***
(18.44%) (19.04%) (15.08%) (15.29%) (16.88%) (17.6%)
512 691 860 1,420 4,123 10,153
16. 30-day post-surgery mortality
10.74% 6.64%*** 11.76% 7.88%*** 8.61% 5.24%***
(31%) (24.91%) (32.23%) (26.95%) (28.06%) (22.28%)
512 693 859 1,421 4,110 10,155
17. 30-day readmission 16.27% 14.4%*** 13.56% 15.16%*** 13.54% 12.1%***
(36.95%) (35.13%) (34.26%) (35.88%) (34.22%) (32.61%)
461 646 767 1,286 3,817 9,597
18. Case mix weight 7.29 7.07 7.05 7.08 7.16 7.19
(1.78) (1.83) (1.98) (2.01) (1.95) (1.91)
512 693 861 1,425 4,128 10,191
20. Length of stay 10.81 9.49* 10.86 11.23 11.76 11.04***
(7.9) (6.87) (7.5) (8.81) (9.72) (7.43)
512 693 861 1,425 4,128 10,191
21. Medicare outlier patients 5.66% 3.9%*** 16.41% 15.34%*** 17.59% 19.74%***
(23.14%) (19.36%) (37.06%) (36.05%) (38.08%) (39.81%)
512 693 859 1,421 4,110 10,155

IMPAQ International, LLC Page 146 Evaluation of Medicare ACE Demonstration May 31, 2013 Final Evaluation Report
Measure ACE Sites Non-Demonstration Treatment Sites True Comparison Sites
Pre Post Pre Post Pre Post
22a. Discharge destination is acute care hospital transfer
0.00% 0.00% 0.13% 0.23%*** 0.26% 0.3%***
(0.00%) (0.00%) (3.61%) (4.83%) (5.12%) (5.49%)
461 646 766 1285 3,809 9,590
22b. Discharge destination is post-acute care facility
22.78% 22.76% 29.07% 30.87%*** 32.01% 35.24%***
(41.98%) (41.96%) (45.44%) (46.21%) (46.66%) (47.77%)
461 646 767 1,286 3,817 9,597
Notes: The first, second, and third rows show mean, standard deviation, and number of episodes, respectively. The difference between the pre-period and post-period means is statistically significant at *p<.05, **p<.01, ***p<.001.

IMPAQ International, LLC Page 147 Evaluation of Medicare ACE Demonstration May 31, 2013 Final Evaluation Report
Exhibit 34: Utilization and Case Mix Measures – Summary Statistics for CABG
Measure ACE Sites Non-Demonstration Treatment Sites True Comparison Sites
Pre Post Pre Post Pre Post
5. Postoperative hemorrhage/hematoma
0.08% 0.00%*** 0.00% 0.07%*** 0.11% 0.07%***
(2.89%) (0.00%) (0.00%) (2.56%) (3.31%) (2.72%)
1,196 1,336 2,279 3,044 9,132 16,214
6. Postoperative physiologic and metabolic derangement
0.12% 0.12% 0.62% 0.2%*** 0.2% 0.17%***
(3.52%) (3.42%) (7.85%) (4.43%) (4.49%) (4.07%)
806 856 1,129 1,524 4,943 8,436
7. Postoperative sepsis 0.56% 1.16%*** 1.38% 1.76%*** 1.04% 1.3%***
(7.49%) (10.71%) (11.65%) (13.14%) (10.14%) (11.32%)
710 777 1,018 1,366 4,431 7,626
9. Use of internal mammary artery in first-time isolated CABG
88.26% 86.4%*** 86.69% 87.63%*** 88.12% 91.35%***
(32.2%) (34.29%) (33.98%) (32.92%) (32.36%) (28.11%)
1,184 1,309 2,246 2,976 9,021 15,741
14. Postoperative stroke 1.25% 1.57%*** 1.75% 1.9%*** 1.92% 1.96%***
(11.12%) (12.42%) (13.13%) (13.66%) (13.73%) (13.87%)
1,199 1,340 2,282 3,049 9,164 16,254
16. 30-day post-surgery mortality
3.34% 3.06%*** 4.52% 3.35%*** 3.56% 2.79%***
(17.99%) (17.22%) (20.78%) (18%) (18.52%) (16.47%)
1,196 1,341 2,279 3,045 9,140 16,237
17. 30-day readmission 11.54% 12.16%*** 11.49% 11.94%*** 12.18% 11.34%***
(31.96%) (32.69%) (31.9%) (32.43%) (32.7%) (31.71%)
1,170 1,308 2,210 2,956 8,926 15,866
18. Case mix weight 4.94 5.08* 5.03 4.99 5.1 5.11
(1.37) (1.37) (1.31) (1.34) (1.32) (1.33)
1,200 1,341 2,285 3,056 9,171 16,282
20. Length of stay 8.72 8.78 9.41 9.36 9.44 9.33
(5.38) (5.04) (5.46) (5.23) (5.42) (5.26)
1,200 1,341 2,285 3,056 9,171 16,282

IMPAQ International, LLC Page 148 Evaluation of Medicare ACE Demonstration May 31, 2013 Final Evaluation Report
Measure ACE Sites Non-Demonstration Treatment Sites True Comparison Sites
Pre Post Pre Post Pre Post
21. Medicare outlier patients
2.34% 1.79%*** 8.38% 7.16%*** 7.96% 10.56%***
(15.13%) (13.26%) (27.72%) (25.79%) (27.08%) (30.74%)
1,196 1,341 2,279 3,045 9,140 16,237
22a. Discharge destination is acute care hospital transfer
0.17% 0.00%*** 0.27% 0.27% 0.17% 0.22%***
(4.14%) (0.00%) (5.2%) (5.2%) (4.1%) (4.69%)
1,168 1,308 2,210 2,953 8,910 15,856
22b. Discharge destination is post-acute care facility
13.85% 18.27%*** 19.19% 20.97%*** 23.69% 26.32%***
(34.55%) (38.66%) (39.38%) (40.72%) (42.52%) (44.04%)
1,170 1,308 2,210 2,956 8,926 15,866
Notes: The first, second, and third rows show mean, standard deviation, and number of episodes, respectively. The difference between the pre-period and post-period means is statistically significant at *p<.05, **p<.01, ***p<.001.

IMPAQ International, LLC Page 149 Evaluation of Medicare ACE Demonstration May 31, 2013 Final Evaluation Report
Exhibit 35: Utilization and Case Mix Measures – Summary Statistics for PCI
Measure ACE Sites Non-Demonstration Treatment Sites True Comparison Sites
Pre Post Pre Post Pre Post
5. Postoperative hemorrhage/hematoma
0.03% 0.00%*** 0.03% 0.04%*** 0.02% 0.01%***
(1.58%) (0.00%) (1.62%) (1.87%) (1.47%) (1.18%)
3,986 4,263 7,638 8,560 23,094 35,869
6. Postoperative physiologic and metabolic derangement
0.05% 0.00%*** 0.00% 0.05%*** 0.06% 0.04%***
(2.19%) (0.00%) (0.00%) (2.17%) (2.47%) (1.87%)
2,078 1,856 2,905 2,128 8,183 8,557
0.23% 0.35%*** 0.38% 0.43%*** 0.47% 0.58%***
14. Postoperative stroke (4.74%) (5.92%) (6.15%) (6.56%) (6.85%) (7.61%)
3,990 4,267 7,643 8,560 23,106 35,867
16. 30-day post-surgery mortality
2.36% 2.57%*** 2.23% 2.34%*** 2.53% 2.56%***
(15.19%) (15.84%) (14.76%) (15.12%) (15.7%) (15.8%)
3,976 4,272 7,628 8,546 23,053 35,844
9.36% 9.79%*** 9.47% 10.16%*** 10.28% 10.08%***
17. 30-day readmission (29.12%) (29.72%) (29.29%) (30.22%) (30.38%) (30.11%)
3,955 4,198 7,558 8,434 22,810 35,343
2.05 2.11*** 2.03 2.11*** 2.07 2.15***
18. Case mix weight (0.55) (0.6) (0.51) (0.56) (0.53) (0.58)
3,994 4,272 7,648 8,577 23,123 35,962
2.33 2.84*** 2.9 3.48*** 3.37 3.78***
20. Length of stay (2.24) (2.89) (3.02) (3.26) (3.42) (3.51)
3,994 4,272 7,648 8,577 23,123 35,962
21. Medicare outlier patients
1.08% 1.64%*** 3.16% 3.6%*** 3.03% 4.29%***
(10.34%) (12.7%) (17.49%) (18.64%) (17.14%) (20.26%)
3,976 4,272 7,628 8,546 23,053 35,844
22a. Discharge destination is acute care hospital transfer
0.35% 0.00%*** 0.21% 0.31%*** 0.24% 0.25%***
(5.94%) (0.00%) (4.6%) (5.55%) (4.86%) (5.04%)
3,951 4,198 7,554 8,429 22,794 35,315

IMPAQ International, LLC Page 150 Evaluation of Medicare ACE Demonstration May 31, 2013 Final Evaluation Report
Measure ACE Sites Non-Demonstration Treatment Sites True Comparison Sites
Pre Post Pre Post Pre Post
22b. Discharge destination is post-acute care facility
3.87% 5.17%*** 3.72% 5.85%*** 4.94% 6.6%***
(19.29%) (22.14%) (18.92%) (23.46%) (21.66%) (24.82%)
3,955 4,198 7,558 8,434 22,810 35,343
Notes: The first, second, and third rows show mean, standard deviation, and number of episodes, respectively. The difference between the pre-period and post-period means is statistically significant at *p<.05, **p<.01, ***p<.001.

IMPAQ International, LLC Page 151 Evaluation of Medicare ACE Demonstration May 31, 2013 Final Evaluation Report
Exhibit 36: Utilization and Case Mix Measures – Summary Statistics for Hip/Knee Replacement/Revision
Measure ACE Sites Non-Demonstration Treatment Sites True Comparison Sites
Pre Post Pre Post Pre Post
5. Postoperative hemorrhage/hematoma
0.00% 0.02%*** 0.00% 0.00% 0.04% 0.03%***
(0.00%) (1.51%) (0.00%) (0.00%) (1.96%) (1.64%)
2,694 4,381 2,754 3,212 13,001 29,820
6. Postoperative physiologic and metabolic derangement
0.04% 0.00%*** 0.00% 0.00% 0.02% 0.00%***
(2.07%) (0.00%) (0.00%) (0.00%) (1.39%) (0.63%)
2,325 3,877 1,935 2,641 10,337 24,850
0.22% 0.85%*** 0.12% 0.13%*** 0.26% 0.56%***
7. Postoperative sepsis (4.72%) (9.17%) (3.4%) (3.67%) (5.09%) (7.49%)
896 944 866 741 3,463 5,676
0.3% 0.21%*** 0.4% 0.06%*** 0.22% 0.18%***
14. Postoperative stroke (5.44%) (4.53%) (6.3%) (2.49%) (4.63%) (4.25%)
2,699 4,385 2,761 3,214 13,012 29,860
16. 30-day post-surgery mortality 2.16% 0.87%*** 1.21% 1%*** 1.28% 0.87%***
(14.52%) (9.27%) (10.92%) (9.96%) (11.22%) (9.28%)
2,691 4,385 2,736 3,196 12,930 29,727
6.25% 5.08%*** 4.95% 4.61%*** 4.93% 4.47%***
17. 30-day readmission (24.21%) (21.96%) (21.7%) (20.98%) (21.66%) (20.67%)
2,687 4,369 2,745 3,207 12,955 29,773
2.19 2.16* 2.14 2.13 2.19 2.19
18. Case mix weight (0.47) (0.43) (0.42) (0.4) (0.48) (0.47)
2,699 4,385 2,761 3,215 13,014 29,872
19a. Beneficiaries receiving a hip or knee replacement/ revision – over age 75
41.02% 34.28%*** 41.22% 37.92%*** 41.62% 38.47%***
(49.2%) (47.47%) (49.23%) (48.53%) (49.29%) (48.65%)
2,699 4,385 2,761 3,215 13,014 29,872
19b. Beneficiaries receiving a hip or knee replacement/ revision-With hip fracture
25.05% 39.14%*** 27.01% 43.86%*** 19.05% 37.13%***
(43.36%) (48.82%) (44.42%) (49.65%) (39.27%) (48.32%)
930 1,349 985 1,010 4,488 10,323

IMPAQ International, LLC Page 152 Evaluation of Medicare ACE Demonstration May 31, 2013 Final Evaluation Report
Measure ACE Sites Non-Demonstration Treatment Sites True Comparison Sites
Pre Post Pre Post Pre Post
19c. Beneficiaries receiving a hip or knee replacement/ revision – with rheumatoid arthritis
1.48% 4.06%*** 1.63% 3.51%*** 1.38% 3.26%***
(12.09%) (19.74%) (12.66%) (18.42%) (11.68%) (17.76%)
2,699 4,385 2,761 3,215 13,014 29,872
4.14 3.58*** 4.23 3.8*** 4.04 3.72***
20. Length of stay (2.41) (2.07) (2.25) (1.86) (2.43) (2.16)
2,699 4,385 2,761 3,215 13,014 29,872
21. Medicare outlier patients 1.3% 0.62%*** 5.67% 4.6%*** 4.51% 3.39%***
(11.33%) (7.82%) (23.12%) (20.95%) (20.75%) (18.1%)
2,691 4,385 2,736 3,196 12,930 29,727
22a. Discharge destination is acute care hospital transfer
0.19% 0.00%*** 0.37% 0.25%*** 0.32% 0.15%***
(4.31%) (0.00%) (6.04%) (5%) (5.63%) (3.85%)
2,684 4,369 2,730 3,196 12,912 29,672
22b. Discharge destination is post-acute care facility
43.92% 39.09%*** 37.12% 40.41%*** 47.14% 46.17%***
(49.64%) (48.8%) (48.32%) (49.08%) (49.92%) (49.85%)
2,687 4,369 2,745 3,207 12,955 29,773
Note: The first, second, and third rows show mean, standard deviation, and number of episodes, respectively. The difference between the pre-period and post-period means is statistically significant at *p<.05, **p<.01, ***p<.001.

IMPAQ International, LLC Page 153 Evaluation of Medicare ACE Demonstration May 31, 2013 Final Evaluation Report
4. RESULTS
4.1. Time Trend Exhibits 37–40 present the results of the overall linear time trend analysis (described above in Section 3) of the quality report measures (measures based on medical record/charts) during the demonstration period (CY 2009 Q3 – CY 2011 Q4). As mentioned in the Methodology section, we did not perform a pre-post analysis of the changes in the measures based on the ACE sites’ quality reports, because we did not have measure scores for quarters prior to the demonstration. Furthermore, given the limited availability of observations for these measures (no quarterly observations for the pre-demonstration period and no more than 10 hospital-level observations for the post-demonstration period), we estimated linear time trend models for the trend of these post-demonstration quality report measures. These results provide no evidence of a demonstration effect on the following process and outcome measures: prophylactic antibiotic selection for surgical patients (measure 2), receipt of venous thromboembolism prophylaxis (measure 4) (applicable only to orthopedic DRGs), and anti-platelet medication at discharge (measure 10) and returns to operating room (measure 11) (both applicable only to CABG). The scores and the time trend results show that the ACE sites had high scores on these measures (a low value for measure 11 and a high value for the other measures) and maintained them during the demonstration. However, the time trend analysis of the revascularization rate (measure 13) suggests that the revascularization rate of PCI admitted patients increased during the demonstration period for the PCI procedures that were on the left main vessel, double vessel, and more than double vessel. However, the size of the time coefficient for the left main vessel proportion (measure 13.a.2) suggests that the change was not sizable. The coefficient estimates for double vessel and more than double vessel procedures (measures 13.a.3 and 13.a.4) were significant at the 1 percent level and indicate a 1.2 and 1.4 percentage point increase, respectively, each quarter. In contrast, the revascularization rate on a single vessel excluding left main decreased post-demonstration by 2.6 percentage points. This change was likely driven mostly by surgery patterns at HMC. At this site, the percentage of PCI procedures that involved a single vessel (not main left) steadily decreased, from 84.29 percent in the third quarter of CY 2009 to 18.75 percent in the fourth quarter of CY 2011. Conversely, the proportion of PCI procedures that involved more than double vessel increased from 2.14 percent to 52.08 percent during the same time period. Concurrently with the ACE Demonstration, there were organizational changes at HMC, for example, the opening of the Oklahoma Heart Institute and the hiring of a new cardiovascular physician group. The shifts in quality of care patterns at HMC may have been related in part to some of these non-demonstration factors. There were no similar changes in the revascularization rates for patients receiving only CABG procedures or patients receiving both CABG and PCI procedures.

IMPAQ International, LLC Page 154 Evaluation of Medicare ACE Demonstration May 31, 2013 Final Evaluation Report
An effect of the demonstration was also observed on the following measures: receipt of prophylactic antibiotic (measure 1) and discontinuation of prophylactic antibiotics (measure 3) for CABG, and angiographic success (measure 12) for PCI. However, the changes were not sizable, in most cases less than 1 percentage point each quarter. For example, receipt of prophylactic antibiotic within 1 hour prior to surgical incision increased by only 0.14 percentage point (CABG).

IMPAQ International, LLC Page 155 Evaluation of Medicare ACE Demonstration May 31, 2013 Final Evaluation Report
Exhibit 37: Results of Time Trend Analysis of CABG Quality Report-Based Quality Measures
Measure
Time Trend Estimate
Standard Error
t-Stat p-Value No. of
Quarters
Summary Statistics
Mean SD No. of
Episodes
1. Prophylactic antibiotic received within 1 hour prior to surgical incision
0.0014* 0.0005 2.72 0.0260 10 1.0000 0.0000 246
2. Prophylactic antibiotic selection for surgical patients The model was not able to estimate a coefficient because all values are "1" for the dependent variable.
3. Prophylactic antibiotics discontinued within 24 hours after surgery end time for hip and knee replacement and 48 hours for CABG and valve procedure groups
0.002* 0.0008 2.65 0.0292 10 0.9912 0.0201 232
10. Anti-platelet medication prescribed at discharge 0.0017 0.0014 1.23 0.2535 10 0.9769 0.0283 259
11. Percent of CABG patients returned to operating room during stay
-0.0001 0.0006 -0.2 0.8450 10 0.0209 0.0218 297
13b.1. Revascularization rates by number of vessels for patients with CABG only
13b.1.1. Single vessel excluding left main 0.0000 0.0056 -0.01 0.9960 10 0.0748 0.0483 292
13b.1.2. Left main only -0.0013 0.0008 -1.62 0.1449 10 0.0056 0.0122 292
13b.1.3. Double vessel 0.0097 0.0064 1.51 0.1685 10 0.3500 0.0870 292
13b.1.4. More than double vessel -0.0085 0.0096 -0.88 0.4030 10 0.5696 0.0625 292
13b.2. Percent of CABG procedures performed off pump for patients receiving CABG
-0.0164 0.0186 -0.88 0.4035 10 0.3083 0.0944 292
13c.1. Revascularization rates by number of vessels for patients with PCI and CABG
IMPAQ International, LLC Page 156 Evaluation of Medicare ACE Demonstration May 31, 2013 Final Evaluation Report
13c.1.1. Single vessel excluding left main -0.0240 0.0509 -0.47 0.6511 10 0.1250 0.3536 11
13c.1.2. Left main only The model was not able to estimate a coefficient because all values are "0" for the dependent variable.
13c.1.3. Double vessel -0.0009 0.0523 -0.02 0.9869 10 0.3125 0.4581 11
13c.1.4. More than double vessel 0.0249 0.0646 0.39 0.7111 10 0.5625 0.4955 11
13c.2. Percent of CABG procedures performed off pump for patients receiving PCI and CABG
-0.1041 0.0456 -2.29 0.0562 10 0.2500 0.4629 11
Notes: *p<0.05, **p<0.01, ***p<0.001. The number of quarters is the number of quarters used in the regression. The mean and standard deviation in the summary statistics are those of the ratio. The number of episodes is the number of episodes relevant for the measure.

IMPAQ International, LLC Page 157 Evaluation of Medicare ACE Demonstration May 31, 2013 Final Evaluation Report
Exhibit 38: Results of Time Trend Analysis of PCI Quality Report-Based Quality Measures
Measure
Time Trend Estimate
Standard Error
t-Statistic
p-Value
No. of Quarters
Summary Statistics
Mean SD No. of
Episodes
12. Percent of PCI procedures with angiographic success and no death, myocardial infarction (MI) or emergent/salvage CABG
-0.0086* 0.0034 -2.51 0.0365 10 0.9326 0.0360 806
13a.1. Revascularization rates by number of vessels for patients with PCI only
13a.1.1. Single vessel excluding left main -0.0262*** 0.0036 -7.19 <.0001 10 0.8230 0.0399 806
13a.1.2. Left main only 0.0021** 0.0006 3.38 0.0097 10 0.0112 0.0091 806
13a.1.3. Double vessel 0.0123** 0.0032 3.88 0.0047 10 0.1600 0.0387 806
13a.1.4. More than double vessel 0.0144*** 0.0012 12.11 <.0001 10 0.0059 0.0126 806
Notes:*p<0.05, **p<0.01, ***p<0.001. The number of quarters is the number of quarters used in the regression. The mean and standard deviation in the summary statistics are those of the ratio. The number of episodes is the number of episodes relevant for the measure.

IMPAQ International, LLC Page 158 Evaluation of Medicare ACE Demonstration May 31, 2013 Final Evaluation Report
Exhibit 39: Results of Time Trend Analysis of Valve Quality Report-Based Quality Measures
Measure
Time Trend Estimate
Standard Error
t-Statistic
p-Value
No. of Quarters
Summary Statistics
Mean SD No. of
Episodes
1. Prophylactic antibiotic received within 1 hour prior to surgical incision
-0.0003 0.0008 -0.34 0.7415 10 1.0000 0.0000 66
2. Prophylactic antibiotic selection for surgical patients -0.0002 0.0010 -0.21 0.8355 10 1.0000 0.0000 67
Notes: *p<0.05, **p<0.01, ***p<0.001. The number of quarters is the number of quarters used in the regression. The mean and standard deviation in the summary statistics are those of the ratio. The number of episodes is the number of episodes relevant for the measure.

IMPAQ International, LLC Page 159 Evaluation of Medicare ACE Demonstration May 31, 2013 Final Evaluation Report
Exhibit 40: Results of Time Trend Analysis of Hip/Knee Quality Report Quality Measures
Measure Time Trend
Estimate Standard
Error t-
Statisticp-
Value No. of
Quarters
Summary Statistics
Mean SD No. of
Episodes
1. Prophylactic antibiotic surgical incision
received within 1 hour prior to 0.0002 0.0003 0.71 0.4994 10 0.9955 0.0046 1846
2. Prophylactic antibiotic selection for surgical patients 0.0006 0.0005 1.27 0.2385 10 0.9961 0.0060 1848
3. Prophylactic antibiotics discontinued within 24 hours after surgery end time for hip and knee replacement and 48 hours for CABG and valve procedure groups
0.0017 0.0011 1.55 0.1607 10 0.9848 0.0148 1799
4. Surgery patients who received appropriate venous thromboembolism prophylaxis within 24 hours prior to surgery to 24 hours after surgery
-0.0008 0.0014 -0.61 0.5564 10 0.9823 0.0140 1322
Notes: *p<0.05, **p<0.01, ***p<0.001. The number of quarters is the number of quarters used in the regression. The mean and standard deviation in the summary statistics are those of the ratio. The number of episodes is the number of episodes relevant for the measure.

IMPAQ International, LLC Page 160 Evaluation of Medicare ACE Demonstration May 31, 2013 Final Evaluation Report
4.2. Adjusted DID The adjusted DID estimates are derived from models that control for age, gender, race, and health status (HCC risk score). Exhibit 41 summarizes the direction of the measure changes in the pre- and post-period quality of care DID estimates by type of quality of care measure (process [CABG only], severity, and outcome), procedure, and hospital group. Exhibit 41 includes data from CY 2007 Q3–CY 2012 Q3. We only discuss measure changes that are statistically significant. Appendix D shows the adjusted DID results by site. Exhibits 42-47 present the DID coefficient estimates and relevant statistics for this analysis period (CY 2007 Q3–CY 2012 Q3). For the measures estimated with logistic regression, we present the odds ratio in addition to the DID coefficient estimates.34 Again, we only report estimates of the parameter of interest that are statistically significant at least at 5 percent. Overall, the ACE Demonstration does not appear to have had an effect on quality of care measures. Very few measures had “treatment” coefficients that were statistically significant. Of the 10 parameters of interest that were statistically different from zero, 6 showed an improvement in terms of quality of care measures. For the process measure, which was applicable only to CABG procedures, one finding suggests decreased quality: there was a significant decrease in the likelihood of use of an internal mammary artery (IMA) (measure 9) among CABG patients. The estimated odds ratio is 0.59, indicating that the odds of using the IMA decreased by 41 percent after the demonstration. There is also a negative finding for this measure for the non-demonstration treatment sites, which indicates that there may have been market-level forces that led to a decrease in the use of IMA in first-time isolated CABG. At the ACE sites there were some significant changes in the severity of patients who were admitted for ACE procedures, but no consistent pattern across procedure groups. Contrary to our hypothesis, the case mix index (measure 18) increased for defibrillator and CABG procedures at ACE sites and was statistically significant; more frail patients were being admitted. There was no evidence of an increase in the severity of patients admitted to the non-demonstration treatment sites as hypothesized. The similar size of the negative coefficients for case mix index for defibrillator admissions at ACE sites and at non-demonstration treatment sites (-0.12 and -0.10, respectively) suggests that there may have been other forces at play in lowering the severity of defibrillator admissions in the ACE sites’ local market areas. Our hypothesis was sustained for two other sets of severity measures: (a) it was less likely that a beneficiary receiving a hip or knee replacement/revision was over age 75 or had a hip
34
The odds ratio is calculated as , where b is the coefficient estimate from the logistic regression. The difference in the likelihood of an event for a claim from an ACE site (or non-demonstration treatment site) versus a true comparison site is
. Thus, the odds ratio of 0.57 shown in Exhibit 41 for measure 16 at the ACE sites indicates that the claims at the ACE sites were 43 percent less likely after the demonstration to have involved a death within 30 days of surgery than prior to the demonstration.

IMPAQ International, LLC Page 161 Evaluation of Medicare ACE Demonstration May 31, 2013 Final Evaluation Report
fracture, and (b) the likelihood of an admitted patient being a patient outlier (measure 21) decreased for defibrillator and CABG patients, but did not change for the other procedure groups. The hypothesized maintenance of the quality outcomes in ACE sites is supported by the adjusted DID estimates. There were only a few statistical changes, and in most instances they were in the expected direction. First, there was a lower likelihood of death within 30 days following surgery (measure 16) for defibrillator admissions. Second, the discharge destination was more likely a post-acute care facility (measure 22b) among pacemaker admissions at ACE sites. For this procedure group, the odds of transfer to post-acute facilities increased by 46 percent for ACE patients compared to true comparison group patients. Finally, there was a shorter average length of stay (measure 20) for orthopedic patients (decrease of 0.25 day). Interestingly, there was a higher length of stay for pacemaker patients. For hip/knee procedures, the effect on length of stay was similar for ACE and non-demonstration treatment hospitals (-0.25 and -0.29, respectively), indicating that market-level factors may have had an effect. In general, our hypotheses about a decrease in length of stay (measure 20) at ACE sites and a greater likelihood of transfers to post-acute care facilities from ACE sites were unfounded.

IMPAQ International, LLC Page 162 Evaluation of Medicare ACE Demonstration May 31, 2013 Final Evaluation Report
Exhibit 41: Summary of Results of Adjusted DID Analysis for Claims-Based Quality Measures
Measure Description
Type of Measure
Expected Changes
ACE Sites True Comparison Sites
Defibril-lator
Pace-maker
Valve CABG PCI Hip/ Knee
Defibril-lator
Pace-maker
Valve CABG PCI Hip/ Knee
5. Postoperative hemorrhage/ hematoma
Outcome
Same or Decrease in
rates (Improve-
ment in care)
6. Postoperative physiologic and metabolic derangement
Outcome
Same or Decrease in
rates (Improve-
ment in care)
7. Postoperative sepsis
Outcome
Same or Decrease in
rates (Improve-
ment in care)
N/A N/A N/A N/A N/A N/A
9. Use of internal mammary artery in first-time isolated CABG
Process
Same or Increase in
rates (Improve-
ment in care)
N/A N/A N/A Decline in Care
N/A N/A N/A N/A N/A Decline in Care
N/A N/A
14. Postoperative stroke
Outcome
Same or Decrease in
rates (Improve-
ment in care)
16. 30-day post-surgery mortality
Outcome
Same or Decrease in
rates (Improve-
ment in care)
Decline in Care
Decline in Care
17. 30-day readmission
Outcome
Same or Decrease in
rates (Improve-
ment in care)

IMPAQ International, LLC Page 163 Evaluation of Medicare ACE Demonstration May 31, 2013 Final Evaluation Report
Measure Description
Type of Measure
Expected Changes
ACE Sites True Comparison Sites
Defibril-lator
Pace-maker
Valve CABG PCI Hip/ Knee
Defibril-lator
Pace-maker
Valve CABG
PCI Hip/ Knee
18. Case mix of MS-DRG assignments
Severity
Same or Decrease in
Severity (Adverse
consequence)
Increase
in Severity
Increase
in Severity
Decrease
in Severity
Decrease
in Severity
19a. Severity of beneficiaries receiving a hip or knee replacement/ revision – over age 75
Severity
Same or Decrease in
rate (severity) (Adverse
consequence)
N/A N/A N/A N/A N/A Decrease
in Severity
N/A N/A N/A N/A N/A
19b. Severity of beneficiaries receiving a hip or knee replacement/ revision – with hip fracture
Severity
Same or Decrease in
rate (severity) (Adverse
consequence)
N/A N/A N/A N/A N/A Decrease
in Severity
N/A N/A N/A N/A N/A
19c. Severity of beneficiaries receiving a hip or knee replacement/ revision —with rheumatoid arthritis
Severity
Same or Decrease in
rate (severity) (Adverse
consequence)
N/A N/A N/A N/A N/A N/A N/A N/A N/A N/A
20. Average and median length of stay
Outcome
Decrease in LOS
(Adverse consequence
and/or increase in
efficiencies)
Increase in LOS
Decrease
in LOS
Decrease in LOS
21. Percent Medicare outlier patients
Severity
Decrease in rate (severity)
(Adverse consequence)
Decrease in Severity
Decrease
in Severity
Decrease
in Severity

IMPAQ International, LLC Page 164 Evaluation of Medicare ACE Demonstration May 31, 2013 Final Evaluation Report
Measure Description
Type of Measure
Expected Changes
ACE Sites True Comparison Sites
Defibril-lator
Pace-maker
Valve CABG PCI Hip/ Knee
Defibril-lator
Pace-maker
Valve CABG PCI Hip/ Knee
22a. Percent discharge destination is acute care hospital transfer
Outcome
Increase in rate
(Adverse consequence)
22b. Percent discharge destination is post-acute care facility
Outcome
Increase in rate
(Adverse consequence)
Decline in
Care
Note: N/A indicates the quality of care measure does not apply to the corresponding procedure group. Empty cells indicate the mean statistics in the pre- and post- ACE period are not statistically different.

IMPAQ International, LLC Page 165 Evaluation of Medicare ACE Demonstration May 31, 2013 Final Evaluation Report
Exhibit 42: Results of Adjusted DID Analysis of Defibrillator Claims-Based Quality Measures
Measure ACE Sites Non-Demonstration Treatment Sites
DID Estimate
Odds Ratio
SE Wald
/t-Stat†p-Value N
DID Estimate
Odds Ratio
SE Wald/ t-Stat†
p-Value N
16. Likelihood of death within 30 days following surgery
-0.56 0.57 0.68
0.66 0.4155 7,716 -0.16 0.85 0.26 0.37 0.5416 8,692
17. Likelihood of readmission within 30 days of discharge
-0.29 0.75 0.30 0.90 0.3438 7,685 0.32 1.38 0.20 2.72 0.0994 8,646
18. Case mix index -0.12* N/A 0.05 -2.49 0.0127 9,073 -0.10** N/A 0.04 -2.69 0.0072 10,195
20. Length of stay -0.19 N/A 0.33 -0.57 0.5682 7,742 -0.25 N/A 0.25 -0.99 0.3222 8,719
21. Likelihood of Medicare outlier patient
-0.47** 0.63 0.18 6.99 0.0082 9,043 -0.07 0.93 0.22 0.10 0.7548 10,163
22a. Likelihood of transfer to acute care hospital
-16.37 <0.001 5173.00 0.00 0.9975 7,682 -0.15 0.86 1.50 0.01 0.9218 8,643
22b. Likelihood of transfer to post-acute care facility
-0.05 0.95 0.34 0.02 0.8751 7,685 -0.18 0.83 0.23 0.67 0.4145 8,646
Note: * p<.05, **p<.01, ***p<.001. † In the models estimated using a linear regression (measures 18 and 20), the exhibit provides the t-statistic. The remaining models were estimated using a logistic regression, and thus the exhibit provides the Wald statistic. Measures in this table are defined slightly different from previous tables because we are estimating individual-level regressions where the estimates are reported as the likelihood of a particular event. In the previous quality of care exhibits, we reported the absolute, actual observations. The regressions include hospital and quarter fixed-effects, age at discharge, gender, an indicator for nonwhite race, community risk score, and a policy indicator variable equal to unity for observations drawn from ACE and non-demonstration treatment group hospitals during the demonstration period.

IMPAQ International, LLC Page 166 Evaluation of Medicare ACE Demonstration May 31, 2013 Final Evaluation Report
Exhibit 43: Results of Adjusted DID Analysis of Pacemaker Claims-Based Quality Measures
Measure ACE Sites Non-Demonstration Treatment Sites
DID Estimate
Odds Ratio
Standard Error
Wald/t-Stat†
p-Value N DID
Estimate Odds Ratio
Standard Error
Wald/t-Stat†
p-Value N
16. Likelihood of death within 30 days following surgery
0.04 1.04 0.32 0.02 0.8949 25,471 0.10 1.11 0.13 0.60 0.4397 28,605
17. Likelihood of readmission within 30 days of discharge
0.01 1.01 0.19 0.00 0.967 25,355 0.17 1.19 0.11 2.33 0.1269 28,476
18. Case mix Index 0.07* N/A 0.03 2.38 0.0173 29,312 0.02 N/A 0.02 0.88 0.3781 33,072
20. Length of stay 0.46* N/A 0.18 2.51 0.012 25,573 0.02 N/A 0.13 0.15 0.8817 28,722
21. Likelihood of Medicare outlier patient
-0.41 0.66 0.21 3.84 0.05 29,195 -0.23 0.80 0.17 1.87 0.1711 32,932
22a. Likelihood of transfer to acute care hospital
-14.07 <0.001 545.70 0.00 0.9794 25,327 0.34 1.40 0.59 0.32 0.5689 28,443
22b. Likelihood of transfer to post-acute care facility
0.30* 1.35 0.14 4.30 0.0382 25,355 -0.06 0.94 0.09 0.44 0.5095 28,476
Note: * p<.05, **p<.01, ***p<.001. † In the models estimated using a linear regression (measures 18 and 20), the exhibit provides the t-statistic. The remaining models were estimated using a logistic regression, and thus the exhibit provides the Wald statistic. Measures in this table are defined slightly different from previous tables because we are estimating individual-level regressions where the estimates are reported as the likelihood of a particular event. In the previous quality of care exhibits, we reported the absolute, actual observations. The regressions include hospital and quarter fixed-effects, age at discharge, gender, an indicator for nonwhite race, community risk score, and a policy indicator variable equal to unity for observations drawn from ACE and non-demonstration treatment group hospitals during the demonstration period.

IMPAQ International, LLC Page 167 Evaluation of Medicare ACE Demonstration May 31, 2013 Final Evaluation Report
Exhibit 44: Results of Adjusted DID Analysis of Valve Claims-Based Quality Measures
Measure ACE Sites Non-Demonstration Treatment Sites
DID Estimate
Odds Ratio
Standard Error
Wald/t-Stat†
p-Value N DID
Estimate Odds Ratio
Standard Error
Wald/t-Stat†
p-Value N
16. Likelihood of death within 30 days following surgery
0.08 1.09 0.23 0.13 0.7162 2,220 0.52*** 1.69 0.11 21.90 <.0001 13,069
17. Likelihood of readmission within 30 days of discharge
0.05 1.05 0.20 0.06 0.8019 11,444 0.26 1.29 0.16 2.65 0.1034 12,189
18. Case mix Index -0.21 N/A 0.11 -1.90 0.0575 15,465 0.08 N/A 0.09 0.88 0.3764 16,535
20. Length of stay -0.53 N/A 0.49 -1.10 0.2729 12,258 0.68 N/A 0.38 1.79 0.0735 13,111
21. Likelihood of Medicare outlier patient
-0.47 0.62 0.28 2.84 0.0919 15,411 0.08 1.09 0.14 0.38 0.5381 16,475
22a. Likelihood of transfer to acute care hospital
‡ ‡ ‡ ‡ ‡ 11,429 0.77 2.16 1.82 0.18 0.6719 12,172
22b. Likelihood of transfer to post-acute care facility
-0.26 0.77 0.18 2.21 0.1368 11,444 0.11 1.12 0.13 0.72 0.3971 12,189
Note: * p<.05, **p<.01, ***p<.001. † In the models estimated using a linear regression (measures 18 and 20), the exhibit provides the t-statistic. The remaining models were estimated using a logistic regression, and thus the exhibit provides the Wald statistic. Measures in this table are defined slightly different from previous tables because we are estimating individual-level regressions where the estimates are reported as the likelihood of a particular event. In the previous quality of care exhibits, we reported the absolute, actual observations. The regressions include hospital and quarter fixed-effects, age at discharge, gender, an indicator for nonwhite race, community risk score, and a policy indicator variable equal to unity for observations drawn from ACE and non-demonstration treatment group hospitals during the demonstration period. ‡ The model was not able to estimate a coefficient because all values of “1” for the dependent variable occurred at only ACE, non-demonstration treatment, or true comparison sites.

IMPAQ International, LLC Page 168 Evaluation of Medicare ACE Demonstration May 31, 2013 Final Evaluation Report
Exhibit 45: Results of Adjusted DID Analysis of CABG Claims-Based Quality Measures
Measure ACE Sites Non-Demonstration Treatment Sites
DID Estimate
Odds Ratio
Standard Error
Wald/t-Stat†
p-Value N DID
Estimate Odds Ratio
Standard Error
Wald/t-Stat†
p-Value N
9. Likelihood of use of Internal Mammary Artery in first time isolated CABG
-0.53* 0.59 0.24 5.02 0.025 22,001 -0.31** 0.73 0.11 8.38 0.0038 24,172
16. Likelihood of death within 30 days following surgery
0.13 1.14 0.25 0.28 0.5938 22,545 0.27* 1.31 0.12 5.56 0.0183 24,760
17. Likelihood of readmission within 30 days of discharge
0.14 1.16 0.15 0.99 0.3205 21,995 0.11 1.12 0.11 1.02 0.3129 24,126
18. Case mix index 0.11* N/A 0.05 1.97 0.0487 27,854 -0.09* N/A 0.04 -2.22 0.0266 30,634
20. Length of stay 0.10 N/A 0.23 0.44 0.6619 22,614 -0.32 N/A 0.17 -1.85 0.0646 24,839
21. Likelihood of Medicare outlier patient
-0.64* 0.53 0.29 4.96 0.0259 27,775 -0.34** 0.71 0.12 7.72 0.0055 30,542
22a. Likelihood of transfer to acute care hospital
-14.32 <0.001 857.00 0.00 0.9867 21,969 -0.44 0.65 0.67 0.43 0.5137 24,100
22b. Likelihood of transfer to post-acute care facility
0.05 1.05 0.13 0.16 0.6938 21,995 -0.05 0.95 0.09 0.28 0.5987 24,126
Note: * p<.05, **p<.01, ***p<.001. † In the models estimated using a linear regression (measures 18 and 20), the exhibit provides the t-statistic. The remaining models were estimated using a logistic regression, and thus the exhibit provides the Wald statistic. Measures in this table are defined slightly different from previous tables because we are estimating individual-level regressions where the estimates are reported as the likelihood of a particular event. In the previous quality of care exhibits, we reported the absolute, actual observations. The regressions include hospital and quarter fixed-effects, age at discharge, gender, an indicator for nonwhite race, community risk score, and a policy indicator variable equal to unity for observations drawn from ACE and non-demonstration treatment group hospitals during the demonstration period.

IMPAQ International, LLC Page 169 Evaluation of Medicare ACE Demonstration May 31, 2013 Final Evaluation Report
Exhibit 46: Results of Adjusted DID Analysis of PCI Claims-Based Quality Measures
Measure ACE Sites Non-Demonstration Treatment Sites
DID Estimate
Odds Ratio
Standard Error
Wald/t-Stat†
p-Value N DID
Estimate Odds Ratio
Standard Error
Wald/t-Stat†
p-Value N
16. Likelihood of death within 30 days following surgery
0.10 1.10 0.16 0.39 0.5316 54,964 -0.04 0.96 0.08 0.28 0.5984 61,381
17. Likelihood of readmission within 30 days of discharge
0.05 1.05 0.09 0.30 0.5842 54,260 0.09 1.10 0.07 1.96 0.1617 60,602
18. Case mix index 0.01 N/A 0.01 1.05 0.2954 67,074 -0.01 N/A 0.01 -1.04 0.2971 75,001
20. Length of stay 0.14 N/A 0.08 1.69 0.0914 55,134 -0.06 N/A 0.06 -0.90 0.3704 61,575
21. Likelihood of Medicare outlier patient
0.18 1.20 0.20 0.83 0.3621 66,869 -0.10 0.90 0.10 1.02 0.3135 74,763
22a. Likelihood of transfer to acute care hospital
-13.90 <0.001 330.40 0.00 0.9664 54,220 0.48 1.62 0.39 1.49 0.2219 60,559
22b. Likelihood of transfer to post-acute care facility
0.07 1.07 0.13 0.31 0.5764 54,260 0.05 1.06 0.10 0.32 0.5719 60,602
Note: * p<.05, **p<.01, ***p<.001. † In the models estimated using a linear regression (measures 18 and 20), the exhibit provides the t-statistic. The remaining models were estimated using a logistic regression, and thus the exhibit provides the Wald statistic. Measures in this table are defined slightly different from previous tables because we are estimating individual-level regressions where the estimates are reported as the likelihood of a particular event. In the previous quality of care exhibits, we reported the absolute, actual observations. The regressions include hospital and quarter fixed-effects, age at discharge, gender, an indicator for nonwhite race, community risk score, and a policy indicator variable equal to unity for observations drawn from ACE and non-demonstration treatment group hospitals during the demonstration period.

IMPAQ International, LLC Page 170 Evaluation of Medicare ACE Demonstration May 31, 2013 Final Evaluation Report
Exhibit 47: Results of Adjusted DID Analysis of Hip/Knee Claims-Based Quality Measures
Measure ACE Sites Non-Demonstration Treatment Sites
DID Estimate
Odds Ratio
Standard Error
Wald/ t-Stat†
p-Value N DID
Estimate Odds Ratio
Standard Error
Wald/ t-Stat†
p-Value N
16. Likelihood of death within 30 days following surgery
-0.47 0.63 0.25 3.63 0.0566 39,935 0.37 1.45 0.29 1.67 0.1962 38,971
17. Likelihood of readmission within 30 days of discharge
-0.24 0.79 0.13 3.39 0.0656 39,983 -0.07 0.93 0.15 0.23 0.6327 39,042
18. Case mix index -0.01 N/A 0.01 -1.11 0.268 49,663 0.00 N/A 0.01 -0.33 0.7432 48,576
19a. Likelihood of over age 75
-0.16** 0.86 0.06 7.75 0.0054 49,663 -0.06 0.94 0.06 1.00 0.3171 48,576
19b. Likelihood of hip fracture
-0.31* 0.73 0.14 5.21 0.0224 17,000 -0.16 0.85 0.14 1.41 0.2351 16,713
19c. Likelihood of rheumatoid arthritis
0.31 1.37 0.20 2.45 0.1178 49,663 0.06 1.07 0.20 0.09 0.7584 48,576
20. Length of stay -0.25*** N/A 0.06 -3.95 <.0001 40,129 -0.29*** N/A 0.07 -4.22 <.0001 39,193
21. Likelihood of Medicare outlier patient
-0.26 0.77 0.27 0.92 0.3364 49,427 -0.05 0.95 0.15 0.10 0.749 48,305
22a. Likelihood of transfer to acute care hospital
-13.77 <0.001 1236.10 0.00 0.9911 39,865 0.29 1.34 0.64 0.21 0.6505 38,906
22b. Likelihood of transfer to post-acute care facility
-0.09 0.91 0.07 1.81 0.1783 39,983 -0.06 0.95 0.08 0.53 0.4664 39,042
Note: * p<.05, **p<.01, ***p<.001. † In the models estimated using a linear regression (measures 18 and 20), the exhibit provides the t-statistic. The remaining models were estimated using a logistic regression, and thus the exhibit provides the Wald statistic. Measures in this table are defined slightly different from previous tables because we are estimating individual-level regressions where the estimates are reported as the likelihood of a particular event. In the previous tables, quality of care exhibits, we reported the absolute, actual observations. The regressions include hospital and quarter fixed-effects, age at discharge, gender, an indicator for nonwhite race, community risk score, and a policy indicator variable equal to unity for observations drawn from ACE and non-demonstration treatment group hospitals during the demonstration period.

IMPAQ International, LLC Page 171 Evaluation of Medicare ACE Demonstration May 31, 2013 Final Evaluation Report
5. SUMMARY The findings from the time trend analysis of the medical report-based measures suggest little or no evidence of a demonstration effect on most of the process and outcome measures. The measure for the revascularization rates of PCI admitted patients showed considerable changes; however these changes were likely driven mostly by surgery patterns at HMC, which experienced organizational changes such as the opening of the Oklahoma Heart Institute and the hiring of a new cardiovascular physician group. The shifts in quality of care patterns at HMC may have been related in part to some of these non-demonstration factors. The adjusted DID findings suggest that the ACE sites maintained their quality of care levels without any systematic or consistent changes in the type of patients they admitted (severity measures) or in clinical outcomes in response to the demonstration. However, it is important to note that the lack of many significant results may reflect the high pre-demonstration quality of care at the ACE sites on many of the CMS-selected quality measures. Despite the lack of strong quantitative evidence for realized improvements in quality, there is qualitative evidence that the demonstration hospitals worked to improve processes and outcomes. For example, there was no significant evidence of a decrease in length of stay. However, during the focus groups at several sites (BHS and LHS), non-physician staff spoke of hospital-wide increased efforts to educate patients about beginning rehabilitation early and speeding up discharge in order to achieve better recoveries following orthopedic surgery.

IMPAQ International, LLC Page 172 Evaluation of Medicare ACE Demonstration May 31, 2013 Final Evaluation Report
CHAPTER V: VOLUME, MARKET CONCENTRATION, AND PHYSICIANS’ CHOICE
OF PLACE OF SURGERY

IMPAQ International, LLC Page 173 Evaluation of Medicare ACE Demonstration May 31, 2013 Final Evaluation Report
1. INTRODUCTION One objective of the quantitative analysis was to examine how the ACE Demonstration affected various aspects of the volume of ACE and ACE-related35 procedures. Sites expected that the demonstration would significantly affect the volume of ACE procedures. In addition to several initial efforts by CMS, site-specific marketing was conducted to disseminate ACE in the local markets. The expectations of the ACE sites were perhaps unfounded given the evidence of previous demonstrations, such as the Heart ByPass Demonstration in the 1980s, where demonstration sites did not observe an increase in volume. If the demonstration did have an effect on the volume of ACE DRGs at ACE sites, it might also have an impact on the volume of ACE and/or ACE-related DRGs at non-demonstration treatment group hospitals. For example, non-demonstration treatment group hospitals might deemphasize ACE procedures and emphasize non-ACE procedures related to ACE (ACE-related procedures) to stay competitive in the corresponding cardiovascular and orthopedic DRG markets. In addition to volume changes, we examined market concentration and spillover post-demonstration. For the volume change analysis, we present two types of pre/post-demonstration analysis: quarterly volume and post-acute care volume. For the market concentration and spillover analysis, we present three types of analysis: market share of ACE sites for ACE procedures, within-hospital distribution of ACE and ACE-related procedures, and physicians’ choice of facilities for performing ACE and ACE-related procedures (spillover). The pre-demonstration period began October 1, 2007,36 and the end point of the post-demonstration period analysis was September 30, 2012—the date of the latest available claims used in this report. As mentioned earlier, ESJH started the demonstration on November 1, 2010 and had a very small number of ACE procedures (fewer than 100 per ACE DRG group both pre- and post-demonstration) for the ACE analysis timeframe. We have therefore excluded ESJH from the analyses reported in this chapter.
35 ACE-related procedures are alternative procedures that physicians performing ACE procedures might choose if they decide not to perform the ACE procedures; the ACE-related procedures were selected in consultation with IMPAQ’s clinical advisor (the list of ACE-related MS-DRGs is provided in Appendix A). 36
As of October 1, 2007, the CMS-DRG system (version 24) was changed to MS-DRG (version 25), with significant refinement of the description of the condition’s complications or comorbidities. The crosswalk from CMS DRG to MS-DRG can be found on the CMS website. However, the crosswalk does not have sufficient information to clearly relate ACE DRGs or ACE-related DRGs to the CMS-DRGs reported in the Medicare claims data with discharge dates before October 1, 2007. For example, CMS-DRG 551 includes both "Permanent cardiac pacemaker implant w MCC" (which is an ACE cardiovascular DRG and is crosswalked to MS-DRG 242) and "AICD lead & generator procedures" (which is not an ACE DRG, but is clinically related to an ACE DRG and is crosswalked to MS-DRG 245). To overcome the gap between the two DRG systems, we set the starting point of our analysis at October 1, 2007.

IMPAQ International, LLC Page 174 Evaluation of Medicare ACE Demonstration May 31, 2013 Final Evaluation Report
2. VOLUME FINDINGS
2.1. Changes in Quarterly Volume We assessed changes in the volume of ACE procedures for the demonstration sites and the non-demonstration treatment sites before and during the demonstration. Changes in volume may occur, for example, if demonstration sites become more efficient and can handle more procedures, if physicians choose to deliver more procedures at the ACE sites because of expected quality of care improvements or because of gainsharing, or if patients are attracted to the ACE facilities because of the advertised higher quality of services or the shared savings payment. In contrast, the volume at ACE sites may decrease if the demonstration establishes additional requirements that affect the practice of physicians performing ACE procedures, and they then prefer performing such procedures at non-demonstration treatment sites. Therefore, examining volume changes is important in measuring the effect of the demonstration. 2.1.1. Research Questions We address two questions:
What is the effect of the demonstration on the volumes of procedures in ACE sites?
What is the effect of the demonstration on the volumes of procedures in non-demonstration treatment sites?
2.1.2. Measure Quarterly volume is the number of episodes that include a particular procedure group delivered by each site in each quarter. The quarterly period was chosen in order to have a non-trivial number of episodes per unit of time and because it offers a sufficient number of data points to detect variation over time. Using the inpatient analytic file described in Chapter 1, Section 2.2.2, we created a data set with observations at the site/quarter level. We first generated quarterly indicators at the site level for each of the three site groups (ACE sites, non-demonstration treatment sites, and true comparison sites) by using the discharge date. For each site and quarter, we then computed the total number of episodes for each of the eight ACE DRGs (procedure groups). These observations were produced at the site/quarter/procedure group level. 2.1.3. Methodology To answer the research questions, we used the DID approach described in Chapter 1, Section 2.2.1. Volume of procedures refers to counts of surgical or medical episodes that belong to a given procedure group. Due to the nature of count data, we applied a non-linear version of the DID approach. Count data are commonly modeled using Poisson-type regressions, which are

IMPAQ International, LLC Page 175 Evaluation of Medicare ACE Demonstration May 31, 2013 Final Evaluation Report
non-linear regressions. Poisson regressions assume that a count variable of interest has a Poisson distribution and models the logarithm of its expected value by a linear combination of explanatory variables and unknown parameters. However, under Poisson regressions, the conditional mean, or the expected value of the count variable conditional on the explanatory variables, is equal to its variance. To relax this strong assumption, we used negative-binomial models, which allow the conditional variance to be greater than the conditional mean. The functional forms of the models are presented here. It should be noted that our volume analysis is reported at the site level,37 which is different from other analyses in this report, where the unit of analysis is the beneficiary or the episode of care. Thus, we define adjusted DID estimates slightly differently than in the previous section. Specifically, we use the adjusted negative binomial DID model to assess the net effect of the demonstration after controlling for hospital-specific unobserved heterogeneity by including hospital fixed-effects. The adjusted negative binomial DID model is characterized by the following conditional mean and variance:
(Equation 4)
where , is a vector of 1 and and is the overdispersion parameter.
The dependent variable is the outcome of interest for hospital h (e.g., an ACE site or a true comparison group site) during time period τ (e.g., first quarter of 2009). The parameters of
and are jointly estimated using maximum likelihood methods.
On the right-hand side of Equation 4 are the following variables:
A hospital-level fixed-effect, , which controls for unobserved time-invariant heterogeneity across hospitals. The hospital fixed-effects are indicator variables for each hospital. These variables account for hospital-specific unobservables and do not have a useful interpretation. Thus, they are not presented in this report.
A time fixed-effect, . This variable controls for changes in the dependent variable that occur during a particular time period, across hospitals, regardless of the implementation of the demonstration.
The policy indicator, , which is equal to 1 for observations drawn from ACE sites during the ACE implementation period. The estimate for captures the effect of the ACE Demonstration on the dependent variable. This is the estimate of interest.
37 Note that there are multiple hospitals per site. In the volume analysis, we treat one site as one observation. For example, Baptist Health System (BHS) consists of five hospitals.

IMPAQ International, LLC Page 176 Evaluation of Medicare ACE Demonstration May 31, 2013 Final Evaluation Report
Exhibit 48 presents summary statistics for the variables in the quarterly volume analysis by procedure group and by period (pre- and post-demonstration periods) from CY 2007 Q4–CY 2012 Q3. It shows the mean, standard deviation, and number of episodes. The average quarterly volume indicates that larger volumes of both ACE and ACE-related procedure groups have been performed at the ACE sites than at either the non-demonstration treatment sites or the true comparison sites. The mean volume by quarter is presented in Appendix E, Exhibit E-1. Given the difference in volume between the ACE sites and the true comparison sites, it is reasonable to consider comparing the ratio of the ACE volume to the volume of the true comparison sites when comparing changes in volume in the two groups. The DID estimate, the policy indicator from the negative binomial yields a difference between the post- and pre- log ratios of the volume of ACE sites to that of the true comparison sites. A difference between the post- and pre-log ratios is the same as the log of the ratio of the post-ratio to the pre-ratio. A ratio in log can be approximated as a percentage change between the numerator (the post-ratio of ACE to true comparison volume) and denominator (the pre-ratio of ACE to true comparison volume), provided that the percentage change is small. Thus, we can interpret the DID estimate as an approximate post-pre percentage change of the ratio of the ACE volume to the volume of the true comparison sites. Therefore, a coefficient of 1 means that the ACE volume relative to the true comparison volume (ratio of ACE volume to true comparison volume) has increased by 1 percent. Note that the exponential of the DID estimate minus one,
, yields the exact percentage change of the ratios that DID estimate presents. In the following exhibits, which show the DID estimates from the negative binomial, we present both the DID estimates and the transformed DID estimates.

IMPAQ International, LLC Page 177 Evaluation of Medicare ACE Demonstration May 31, 2013 Final Evaluation Report
Exhibit 48: Summary Statistics for Quarterly Volume
ACE Sites
Non-Demonstration Treatment Sites
True Comparison Sites
Pre Post Pre Post Pre Post
Valve
Mean 22.95 20.26 5.70 5.67 6.71 7.69
SD 13.23 15.75 6.93 7.12 10.38 13.32
N 502 770 843 1,383 4,241 9,633
Defibrillator
Mean 21.18 17.21 7.06 4.54 5.10 3.57
SD 10.94 8.89 8.22 6.48 5.66 4.47
N 465 650 1,058 1,093 3,239 4,513
CABG Mean 53.23 38.63 14.95 12.17 14.04 12.49
SD 32.20 25.18 14.72 13.87 12.84 12.21
N 1171 1,468 2,242 2,958 9,381 15,270
Pacemaker
Mean 54.86 35.63 18.18 13.84 16.09 12.45
SD 28.30 16.16 17.63 15.30 11.61 9.81
N 1,201 1,357 2,709 3,380 10,251 15,697
PCI Mean 178.50 124.26 50.14 33.88 36.57 26.68
SD 91.03 61.37 46.95 37.94 28.13 21.75
N 3,912 4,725 7,478 8,266 23,378 33,526
ACE-related Cardiovascular
Mean 147.95 121.21 49.16 45.37 53.39 46.22
SD 68.39 55.16 40.39 39.70 42.23 37.14
N 3,208 4,653 7,328 11,058 33,998 58,078
Hip/Knee
Mean 54.47 90.94 16.19 15.02 33.52 34.27
SD 75.62 86.84 16.04 18.66 38.25 42.14
N 2,637 4,679 2,687 3,086 13,370 28,009
ACE-related Orthopedic
Mean 70.90 102.78 23.23 19.80 47.43 44.80
SD 85.70 83.33 23.41 23.06 43.34 39.40
N 3,472 5,251 3,860 4,067 18,960 36,655

IMPAQ International, LLC Page 178 Evaluation of Medicare ACE Demonstration May 31, 2013 Final Evaluation Report
2.1.4. Results In this analysis, we first discuss the global impact of the demonstration on quarterly volume. Global impact refers to the overall impact of the demonstration across all ACE sites or across all non-demonstration treatment sites. For the global impact of a given procedure group, we weighted each hospital by the number of episodes for the procedure group. We used this weight to account for the different sizes of hospitals in the site-level data and to take into account differential effects across sites. To calculate the weight, we first grouped the ACE sites and the true comparison sites. Then, we calculated the share of the number of episodes of a given procedure group of each hospital in the total number of episodes for the procedure group in the ACE site group and in the true comparison site group. We then rounded the value of the calculated shares times 100 as the frequency weight for the negative binomial model.38 After looking at global impact, we examined site-specific impacts. We did not use weights for the site-specific effects. Exhibit 49 shows the adjusted DID estimates for the quarterly volume of ACE and ACE-related procedure groups for all sites. The coefficients in Exhibit 49 show that the demonstration increased the quarterly volume of the ACE defibrillator by 19.2 percent, and decreased the quarterly volume of the ACE pacemaker by 11.7 percent. The demonstration did not affect the quarterly volume of other ACE or ACE-related cardiovascular procedure groups at ACE sites, since none of the adjusted DID estimates were statistically different from zero.39 Non-demonstration treatment sites also were not affected by the demonstration.
38
We used the frequency weight option, which allows only for integers, of the negative binomial model in STATA. 39 Only DID estimates statistically different from zero at the 5 percent significance level were regarded as having effects, negative or positive.

IMPAQ International, LLC Page 179 Evaluation of Medicare ACE Demonstration May 31, 2013 Final Evaluation Report
Exhibit 49: Effects of the Demonstration on Quarterly Volume (Global DID Estimates)
ACE Sites Non-Demonstration Treatment Sites
DID (coef) DID (%) SE t-stat
N of Episodes
DID (coef) DID (%) SE t-stat N of
Episodes
Global
Cardiovascular DRGs (N=1,950) (N=2,283)
ACE Valve -0.0792 -7.6% 0.0761 -1.0403 15,146 -0.1796 -16.4% 0.1169 -1.5362 16,100
ACE Defibrillator 0.1757* 19.2% 0.071 2.4738 8,867 -0.0393 -3.9% 0.0943 -0.4161 9,903
ACE CABG -0.0089 -0.9% 0.0515 -0.1731 27,290 -0.0707 -6.8% 0.116 -0.6095 29,851
ACE Pacemaker -0.1246* -11.7% 0.0615 -2.0259 28,506 -0.0347 -3.4% 0.0965 -0.3596 32,037
ACE PCI 0.0223 2.3% 0.0996 0.2243 65,541 -0.0427 -4.2% 0.0887 -0.4812 72,648
ACE-related Cardiovascular -0.0069 -0.7% 0.0647 -0.107 99,937 0.0298 3.0% 0.0345 0.8643 110,462
Orthopedic DRGs (N=1,317)
(N=1,589)
ACE Hip/Knee -0.0062 -0.6% 0.1053 -0.0585 48,695 0.0754 7.8% 0.096 0.7847 47,152
ACE-related Orthopedic -0.013 -1.3% 0.0749 -0.1732 64,338 0.1384 14.8% 0.0794 1.7421 63,542
Notes:*p<0.05, **p<0.01, ***p<0.001. N is the number of sites/quarter observations for the DID model. For example, there were 1,950 site/quarter observations for the ACE valve DID. The data for the DID had information on 3 ACE sites, 20 quarters for each ACE site, 96 true comparison (TC) sites, and at most 20 quarters for each TC site. Some TC sites had missing quarters. The exponential of the DID estimate minus one, , yields the exact percentage change of the ratios that DID estimate presents.

IMPAQ International, LLC Page 180 Evaluation of Medicare ACE Demonstration May 31, 2013 Final Evaluation Report
During interviews and focus groups with administrators and physicians at the ACE sites, most stakeholders thought that the demonstration had not increased the volume of ACE procedures, which is in keeping with the quantitative findings. While in some cases individual sites noted increases or decreases in volume during the demonstration, the changes, according to the stakeholders interviewed, were attributed to circumstances unrelated to the demonstration. In addition to estimating the global impact, we also estimated site-specific effects, which are displayed in Exhibit 50. We examined effects by site because the global estimates may mask site-specific heterogeneity in the effect. BHS had substantial reductions in all ACE and ACE-related procedures, except ACE defibrillator, which showed no change in volume. HMC, on the other hand, had large increases in volume for most ACE procedures relative to the comparison group. However, at HMC, the increase in volume may have been due not to the ACE demonstration, but, according to some interviewees, to the opening of a new facility, the Oklahoma Heart Institute, around the time the demonstration started. OHH did not show changes in volume, except for ACE pacemaker, which decreased in volume by 10 percent, while ACE-related cardiovascular procedures increased by a similar amount. This finding may give validity to the argument of a shift to procedures outside of the bundled payment DRGs. Interestingly, at OHH the local competitors showed negative volume changes relative to the true comparison group. This is the only instance where the market for an ACE site remained stable while the competition showed a large negative change. At LHS, there were no statistically significant volume changes for either ACE or ACE-related orthopedic procedures in the post-demonstration period. This finding was expected and was perhaps due to the changes in the orthopedic surgeon market, where some physicians retired and LHS has not yet completely replaced them.

IMPAQ International, LLC Page 181 Evaluation of Medicare ACE Demonstration May 31, 2013 Final Evaluation Report
Exhibit 50: Effects of the Demonstration on Quarterly Volume (Site-Specific DID Estimates)
ACE Sites Non-Demonstration Treatment Sites
DID DID (%)
SE t-stat
N of Episodes in
DID Regression
N of Episodes Pre-ACE
DID DID (%)
SE t-stat
N of Episodes in
DID Regression
N of Episodes Pre-ACE
BHS
Cardiovascular DRGs (N=1,910) (N=2,003)
ACE Valve -0.4793*** -38.1% 0.043 -11.1547 14,105 97 0.161 17.5% 0.1627 0.9898 14,880 335
ACE Defibrillator -0.0209 -2.1% 0.053 -0.3952 7,971 95 0.0148 1.5% 0.2081 0.071 8,367 275
ACE CABG -0.2243*** -20.1% 0.0261 -8.6097 25,367 312 0.2104 23.4% 0.128 1.6436 26,896 836
ACE Pacemaker -0.3069*** -26.4% 0.0298 -10.3156 26,706 356 0.1894*** 20.9% 0.0562 3.3699 28,278 861
ACE PCI -0.2673*** -23.5% 0.0419 -6.3719 59,061 1,040 0.2117 23.6% 0.1516 1.3964 62,495 2,309
ACE-related Cardiovascular -0.1104*** -10.5% 0.0225 -4.9061 95,909 1,534 0.0987 10.4% 0.066 1.4948 98,951 2,459
Orthopedic DRGs (N=1,236)
(N=1,332)
ACE Hip/Knee -0.0398 -3.9% 0.0415 -0.9591 45,964 1,559 0.0009 0.1% 0.1044 0.0086 43,314 585
ACE-related Hip/Knee -0.1314*** -12.3% 0.0359 -3.6588 60,255 1,739 -0.0735 -7.1% 0.0892 -0.8236 58,080 866
HMC
Cardiovascular DRGs (N=1,910) (N=2,010)
ACE Valve -0.0309 -3.0% 0.0407 -0.7598 14,100 67 -0.1003 -9.5% 0.1396 -0.7181 14,416 169
ACE Defibrillator 0.7939*** 121.2% 0.0525 15.1099 8,061 73 -0.1869 -17.0% 0.273 -0.6849 8,534 331
ACE CABG 0.5582*** 74.8% 0.0252 22.1181 24,971 78 -0.0307 -3.0% 0.0645 -0.4752 26,031 506
ACE Pacemaker 0.5290*** 69.7% 0.0287 18.409 26,398 119 0.0314 3.2% 0.1218 0.2577 27,406 536
ACE PCI 0.4943*** 63.9% 0.0422 11.7111 58,591 487 -0.0495 -4.8% 0.092 -0.5377 60,796 1,539
ACE-related Cardiovascular 0.0758*** 7.9% 0.0221 3.4216 93,173 383 0.0281 2.8% 0.077 0.3647 97,147 1,726
Orthopedic DRGs (N=1,237)
(N=1,317)
ACE Hip/Knee 0.3538*** 42.4% 0.042 8.4144 43,032 397 -0.1658 -15.3% 0.309 -0.5364 42,194 271
ACE-related Orthopedic 0.0841* 8.8% 0.0363 2.3182 58,158 788 -0.3570* -30.0% 0.1417 -2.5192 56,817 492

IMPAQ International, LLC Page 182 Evaluation of Medicare ACE Demonstration May 31, 2013 Final Evaluation Report
ACE Sites Non-Demonstration Treatment Sites
DID DID (%)
SE t-stat
N of Episodes in
DID Regression
N of Episodes Pre-ACE
DID DID
(%)SE t-stat
N of Episodes in
DID Regression
N of Episodes Pre-ACE
OHH
Cardiovascular DRGs (N=1,910) (N=2,050)
ACE Valve 0.0292 3.0% 0.0461 0.6333 14,683 306 -0.3225* -27.6% 0.1629 -1.9789 14,546 313
ACE Defibrillator 0.0963 10.1% 0.0543 1.7749 8,318 261 -0.3172 -27.2% 0.1704 -1.8612 8,485 402
ACE CABG 0.0348 3.5% 0.0274 1.2678 26,242 702 -0.2919* -25.3% 0.1249 -2.3363 26,214 792
ACE Pacemaker -0.1150*** -10.9% 0.0299 -3.845 27,283 626 -0.2152* -19.4% 0.0842 -2.5561 28,234 1,166
ACE PCI 0.0705 7.3% 0.0401 1.7591 61,628 2,041 -0.2927** -25.4% 0.1027 -2.8488 63,096 3,229
ACE-related Cardiovascular 0.1055*** 11.1% 0.0234 4.4994 94,836 1,132 -0.0585 -5.7% 0.068 -0.8599 98,345 2,808
LHS
Orthopedic DRGs (N=1,277) (N=1,373)
ACE Hip/Knee -0.0463 -4.5% 0.244 -0.1898 42,457 435 0.1695 18.5% 0.1242 1.3642 44,402 1,153
ACE-related Orthopedic -0.1117 -10.6% 0.3223 -0.3465 57,152 598 0.1394 15.0% 0.0838 1.6629 59,872 1,625 Notes: *p<0.05, **p<0.01, ***p<0.001. N is the number of sites/quarter observations for the DID model. For example, there were 1,910 site/quarter observations for the ACE valve DID for BHS. The data for the DID had information on 1 ACE site, 20 quarters for each ACE site, 96 true comparison (TC) sites, and at most 20 quarters for each TC site. Some TC sites had missing quarters. The exponential of the DID estimate minus one, , yields the exact percentage change of the ratios that DID estimate presents.

IMPAQ International, LLC Page 183 Evaluation of Medicare ACE Demonstration May 31, 2013 Final Evaluation Report
In summary, the demonstration did not have a statistically significant global impact on the volume of ACE procedures delivered at ACE or non-demonstration treatment sites. The global estimates mask site-specific heterogeneity, which is evident in the site-specific estimates: the demonstration had a substantive negative effect at BHS, a highly positive effect at HMC, and no effect at OHH and LHS.
2.2. Changes in Post-Acute Care Volume The ACE demonstration may have affected the way patients receive PAC services. Under this demonstration, Medicare made a single payment for both hospital (Part A) and physician (Part B) services furnished during an inpatient stay. To reduce the cost of performing ACE procedures, hospitals or physicians might focus on the main services during an inpatient stay, while rendering other services after discharge. In this case, the PAC services would increase in volume post-demonstration. On the other hand, the PAC volume might decrease if the volume of ACE procedures decreased post-demonstration. Thus, it is worth investigating whether the PAC volume increased post-demonstration and whether the direction of the effect on volume differed between inpatient ACE procedures and post-acute care services. Previously we concentrated on the cost of PAC; here we examine the count of PAC services. 2.2.1. Research Questions We addressed two questions:
What is the effect of the demonstration on the volume of PAC services in ACE and non-demonstration treatment sites?
How does the effect of the demonstration on the PAC volume compare to the effect on the inpatient volume?
2.2.2. Measure PAC volume is the number of episodes whose PAC cost was reported to be non-zero for a particular procedure group delivered by each site in each quarter for each of the following nine subgroups: home health, inpatient rehabilitation facilities (IRF), skilled nursing facilities (SNF), comprehensive outpatient rehabilitation facilities (CORF), outpatient services, hospice, readmission, physician office visit, and other PAC. 2.2.3. Methodology To answer the research questions, we used a non-linear version of the DID approach, which was described above for the quarterly volume analysis (Section 2.1.3.) since the nature of the quarterly inpatient volume measure is the same as that for PAC volume. The interpretation of the DID coefficients is the same as before, i.e., the approximate pre-post percentage change of

IMPAQ International, LLC Page 184 Evaluation of Medicare ACE Demonstration May 31, 2013 Final Evaluation Report
relative ACE PAC volume compared to that of the true comparison sites. As in the quarterly volume analysis, we used weights for the global impact. 2.2.4. Results In this analysis, we first discuss the global impact of the demonstration on quarterly PAC volume. Global impact refers to the overall impact of the demonstration across all ACE sites or across all non-demonstration treatment sites. As in the quarterly volume analysis, we used the weight to account for the different sizes of hospitals in the site-level data and to take into account differential effects across sites for the global impact analysis. The weighted use for each hospital is the number of episodes for the procedure group for a given PAC. After looking at global impact, we examined site-specific impacts. We did not use weights for site-specific effects. Exhibit 51 shows the adjusted DID estimates for the quarterly PAC volume of ACE and ACE-related procedure groups for all sites. We focus on volume for any PAC, home health, and SNF, because the negative binomial regressions did not converge for other forms of PAC for most of the procedure groups, likely due to lack of variation in PAC volume. The DID regression was conducted by procedure group for each of the three PACs (any PAC, home health, and SNF). The coefficients in Exhibit 51 show that the demonstration did not globally affect the quarterly volume of any PAC for the ACE or ACE-related procedure groups at ACE sites and non-demonstration treatment sites if the DID model converged. None of the adjusted DID estimates were statistically different from zero.40 The pattern of the changes in volume for home health is similar to that of the overall impact of the inpatient volume (Section 2.1.4). For example, ACE defibrillator increased by about 20 percent, and ACE pacemaker decreased by about 12 percent at ACE sites; none of the adjusted DID estimates were statistically different from zero. Regarding SNF use, if the DID model converged, no significant change was observed for any procedure group at the ACE sites or the non-demonstration treatment sites.
40 Only DID estimates statistically different from zero at the 5 percent significance level were regarded as having effects, negative or positive.

IMPAQ International, LLC Page 185 Evaluation of Medicare ACE Demonstration May 31, 2013 Final Evaluation Report
Exhibit 51: Adjusted DID Estimates for the Quarterly PAC Volume of ACE and ACE-Related Procedure Groups for All Sites
Any PAC ACE Sites Non-Demonstration Treatment Sites
DID DID (%) SE t-stat N of
Episodes DID DID (%) SE t-stat
N of Episodes
Global
Cardiovascular DRGs (N=1,950) (N=2,283)
ACE Valve -0.0721 -7.0% 0.0706 -1.0216 14,558 -0.1666 -15.3% 0.1089 -1.5298 15,424
ACE Defibrillator ‡ ‡ ‡ ‡ 8,419 -0.0261 -2.6% 0.0828 -0.3147 9,315
ACE CABG ‡ ‡ ‡ ‡ 26,019 -0.0681 -6.6% 0.1219 -0.5584 28,322
ACE Pacemaker ‡ ‡ ‡ ‡ 27,083 -0.0201 -2.0% 0.0959 -0.2094 30,384
ACE PCI 0.0124 1.2% 0.0924 0.1341 61,048 -0.0193 -1.9% 0.0898 -0.215 67,619
ACE-related Cardiovascular 0.0069 0.7% 0.0613 0.1128 94,044 0.0362 3.7% 0.0333 1.0857 103,857
Orthopedic DRGs (N=1,317) (N=1,589)
ACE Hip/Knee 0.0117 1.2% 0.1081 0.1082 47,713 0.0759 7.9% 0.0953 0.7958 46,279
ACE-related Orthopedic -0.0284 -2.8% 0.075 -0.3785 60,829 0.1156 12.3% 0.0743 1.5563 60,182
Home ACE Sites Non-Demonstration Treatment Sites
DID DID (%) SE T N of
Episodes DID DID (%) SE T
N of Episodes
Global
Cardiovascular DRGs (N=1,948) (N=2,281)
ACE Valve -0.073 -7.0% 0.0779 -0.9377 7,109 -0.1982 -18.0% 0.1624 -1.2208 7,492
ACE Defibrillator 0.1852* 20.3% 0.0835 2.2167 2,847 -0.1733 34.4% 0.1087 -1.5942 3,165
ACE CABG 0.0405 4.1% 0.0436 0.9292 13,698 -0.1308 -12.3% 0.1435 -0.9115 14,774
ACE Pacemaker -0.1324* -12.4% 0.0532 -2.4893 9,228 -0.0078 -0.8% 0.1006 -0.0773 10,261
ACE PCI ‡ ‡ ‡ ‡ 15,790 -0.0422 -4.1% 0.1009 -0.4178 17,277
ACE-related Cardiovascular -0.0173 -1.7% 0.0618 -0.2805 38,619 0.0766 8.0% 0.0392 1.9534 42,594

IMPAQ International, LLC Page 186 Evaluation of Medicare ACE Demonstration May 31, 2013 Final Evaluation Report
Home ACE Sites Non-Demonstration Treatment Sites
DID DID (%) SE T N of
Episodes DID DID (%) SE T
N of Episodes
Orthopedic DRGs (N=1,309) (N=1,575)
ACE Hip/Knee 0.1821 20.0% 0.1287 1.4149 31,514 0.1284 13.7% 0.134 0.9582 30,275
ACE-related Orthopedic 0.0048 0.5% 0.0509 0.0945 25,770 0.0668 6.9% 0.0592 1.1276 25,549
SNF ACE Sites Non-Demonstration Treatment Sites
DID (Coef)
DID (%) SE T N of
Episodes DID
(Coef) DID (%) SE T
N of Episodes
Global
Cardiovascular DRGs (N=1,948) (N=2,281)
ACE Valve ‡ ‡ ‡ ‡ 2,556 0.1715 18.7% 0.227 0.7552 2,738
ACE Defibrillator ‡ ‡ ‡ ‡ 611 0.007 0.7% 0.2976 0.0234 668
ACE CABG ‡ ‡ ‡ ‡ 3,392 ‡ ‡ ‡ ‡ 3,605
ACE Pacemaker 0.0682 7.1% 0.0825 0.8258 3,803 ‡ ‡ ‡ ‡ 4,266
ACE PCI 0.0424 4.3% 0.1743 0.2436 3,249 ‡ ‡ ‡ ‡ 3,573
ACE-related Cardiovascular ‡ ‡ ‡ ‡ 14,301 ‡ ‡ ‡ ‡ 15,727
Orthopedic DRGs (N=1,309) (N=1,575)
ACE Hip/Knee ‡ ‡ ‡ ‡ 13,350 -0.0396 -3.9% 0.0814 -0.4868 13,097
ACE-related Orthopedic ‡ ‡ ‡ ‡ 21,623 0.0767 8.0% 0.0897 0.8553 21,478
Notes:*p<0.05, **p<0.01, ***p<0.001. N is the number of sites/quarter observations for the DID model. For example, there were 1,950 site/quarter observations for the ACE valve DID. The data for the DID had information on 3 ACE sites, 20 quarters for each ACE site, 96 true comparison (TC) sites, and at most 20 quarters for each TC site. Some TC sites had missing quarters. The shaded areas with N/A indicate that the DID did not converge for the procedure group. The exponential of the DID estimate minus one, , yields the exact percentage change of the ratios that DID estimate presents. ‡ The shaded areas with N/A indicate that the DID did not converge for the procedure group.

IMPAQ International, LLC Page 187 Evaluation of Medicare ACE Demonstration May 31, 2013 Final Evaluation Report
The global estimates may mask site-specific heterogeneity in the effect. Thus, we also estimated site-specific effects, which are displayed in Exhibit 52. For any PAC setting, each site market shows a pattern and magnitude of change in the inpatient quarterly volume similar to the results shown in Section 2.4.1. This was expected because the PAC volume depends on the inpatient volume. For example, as we saw earlier, BHS had a lower volume of cardiovascular procedures; these BHS procedures also had a lower PAC volume. On the other hand, HMC had higher inpatient volume and higher any PAC volume. The volume of each subgroup of PAC, however, might have changed post-demonstration; for example, some sites may have discharged more patients to home health. Thus, we also examined the volume in different PAC settings. We investigated only home health and skilled nursing facilities due to the convergence issue of the negative binomial model that stemmed from the lack of volume variation for other PAC subgroups.

IMPAQ International, LLC Page 188 Evaluation of Medicare ACE Demonstration May 31, 2013 Final Evaluation Report
Exhibit 52: Adjusted DID Estimates for the Quarterly PAC Volume of ACE and ACE-Related Procedure Groups for Each Site
Any PAC
ACE Sites Non-Demonstration Treatment Sites
DID (Coef) DID (%)
SE t-stat
N of Episodes in
DID Regression
N of Episodes Pre-ACE
DID (Coef) DID (%)
SE t-stat
N of Episodes
in DID Regression
N of Episodes Pre-ACE
BHS
Cardiovascular DRGs (N=1,910) (N=2,003)
ACE Valve -0.4578*** -36.7% 0.0435 -10.5129 13,557 89 0.1419 15.2% 0.1599 0.8873 14,302 320
ACE Defibrillator -0.0283 -2.8% 0.0542 -0.5221 7,551 88 0.0478 4.9% 0.205 0.2331 7,932 255
ACE CABG -0.2044*** -18.5% 0.0273 -7.4905 2,4152 290 0.2044 22.7% 0.1328 1.5391 25,603 788
ACE Pacemaker -0.2994*** -25.9% 0.0311 -9.6271 25,344 327 0.1743** 19.0% 0.0613 2.8452 26,856 817
ACE PCI -0.2682*** -23.5% 0.0429 -6.2492 55,080 940 0.2169 24.2% 0.1577 1.3751 29,888 2142
ACE-related Cardiovascular -0.0951*** -9.1% 0.0233 -4.0741 57,310 1,439 0.0931 9.8% 0.0598 1.5574 57,372 2,330
Orthopedic DRGs (N=1,229)
(N=1,332)
ACE Hip/Knee -0.0384 -3.8% 0.0413 -0.931 45,075 1,507 -0.0162 -1.6% 0.1042 -0.1559 42,492 582
ACE-related Orthopedic -0.1434*** -13.4% 0.0353 -4.0593 57,117 1,657 -0.0795 -7.6% 0.0888 -0.8951 54,997 814
HMC Cardiovascular DRGs (N=1,910) (N=2,010)
ACE Valve -0.0297 -2.9% 0.0413 -0.7195 13,558 63 -0.0581 -5.6% 0.1385 -0.4191 13,829 148
ACE Defibrillator 0.8340*** 130.3% 0.0542 15.3857 7,642 66 -0.1654 -15.2% 0.2215 -0.7466 8,033 290
ACE CABG 0.5537*** 74.0% 0.0263 21.0304 23,783 75 -0.017 -1.7% 0.0574 -0.2963 24,711 446
ACE Pacemaker 0.5022*** 65.2% 0.0302 16.6449 25,065 114 0.0003 0.0% 0.1165 0.0027 25,995 503
ACE PCI 0.4781*** 61.3% 0.0431 11.0811 54,726 463 -0.0481 -4.7% 0.093 -0.5169 56,681 1,395
ACE-related Cardiovascular 0.0696** 7.2% 0.0229 3.0336 57,269 352 0.0328 3.3% 0.0733 0.4469 59,667 1546
Orthopedic DRGs (N=1,237) (N=1,317)
ACE Hip/Knee 0.3195*** 37.6% 0.0415 7.6992 42,886 712 -0.1678 -15.4% 0.3276 -0.5122 41,361 261
ACE-related Orthopedic 0.0747* 7.8% 0.0359 2.0827 53,153 148 -0.3507* -29.6% 0.1417 -2.4755 53,828 467

IMPAQ International, LLC Page 189 Evaluation of Medicare ACE Demonstration May 31, 2013 Final Evaluation Report
Any PAC
ACE Sites Non-Demonstration Treatment Sites
DID (Coef) DID (%)
SE t-stat
N of Episodes in
DID Regression
N of Episodes Pre-ACE
DID (Coef) DID (%)
SE t-stat
N of Episodes
in DID Regression
N of Episodes Pre-ACE
OHH
Cardiovascular DRGs (N=1,910) (N=2,050)
ACE Valve 0.0317 3.2% 0.0461 0.6868 14,123 324 -0.3428* -29.0% 0.1551 -2.21 13,973 319
ACE Defibrillator 0.0858 9.0% 0.0552 1.5549 7,906 294 -0.3207* -27.4% 0.1515 -2.1169 8,030 422
ACE CABG 0.0247 2.5% 0.0287 0.8602 25,022 760 -0.2986* -25.8% 0.132 -2.2625 24,946 847
ACE Pacemaker -0.1292*** -12.1% 0.0306 -4.2186 25,934 706 -0.2052* -18.6% 0.0907 -2.2636 26,793 1,225
ACE PCI 0.0404 4.1% 0.0408 0.9898 57,432 2,200 -0.2789* -24.3% 0.1084 -2.5731 58,775 3,264
ACE-related Cardiovascular 0.1109*** 11.7% 0.0242 4.583 46,073 1,153 -0.0564 -5.5% 0.0666 -0.8473 47,672 2,895
LHS
Orthopedic DRGs (N=1,277) (N=1,373)
ACE Hip/Knee -0.0079 -0.8% 0.2474 -0.0318 41,569 623 0.1608 17.4% 0.1221 1.3177 43,554 1,810
ACE-related Orthopedic -0.0512 -5.0% 0.2785 -0.1838 54,053 839 0.1033 10.9% 0.0784 1.3165 56,684 2,381

IMPAQ International, LLC Page 190 Evaluation of Medicare ACE Demonstration May 31, 2013 Final Evaluation Report
Home Health
ACE Sites Non-Demonstration Treatment Sites
DID (Coef)DID (%)
SE t-stat
N of Episodes in
DID Regression
N of Episodes Pre-ACE
DID (Coef)DID (%)
SE t-stat
N of Episodes in
DID Regression
N of Episodes Pre-ACE
BHS
Cardiovascular DRGs (N=1,908) (N=2,001)
ACE Valve -0.2843*** -24.7% 0.0523 -5.4306 6,584 42 0.2156 24.1% 0.1522 1.4163 6,914 141
ACE Defibrillator 0.3398*** 40.5% 0.0578 5.8803 2,612 23 -0.0008 -0.1% 0.2167 -0.0035 2,732 85
ACE CABG -0.1568*** -14.5% 0.0341 -4.5988 12,667 158 0.1435 15.4% 0.1156 1.2413 13,323 393
ACE Pacemaker -0.1045** -9.9% 0.0361 -2.8925 8,622 103 0.1605** 17.4% 0.0494 3.2464 9,121 271
ACE PCI -0.2305*** -20.6% 0.0459 -5.0172 14,283 248 0.2379 26.9% 0.1602 1.4849 15,034 488
ACE-related Cardiovascular -0.0860** -8.2% 0.0263 -3.2709 23,425 646 0.0612 6.3% 0.0559 1.0948 24,133 959
Orthopedic DRGs (N=1,229) (N=1,319) ACE Hip/Knee 0.1284** 13.7% 0.0479 2.6785 29,343 1,049 0.0797 8.3% 0.1056 0.7548 27,435 436
ACE-related Orthopedic -0.0841* -8.1% 0.0358 -2.3468 24,159 701 -0.0804 -7.7% 0.0699 -1.151 23,202 343
HMC
Cardiovascular DRGs (N=1,908) (N=2,008)
ACE Valve -0.4781*** -38.0% 0.0538 -8.8803 6,550 31 0.1915 21.1% 0.3032 0.6316 66,996 57
ACE Defibrillator 0.5823*** 79.0% 0.0592 9.8446 2,608 18 -0.4947* -39.0% 0.2517 -1.966 2,744 103
ACE CABG -0.0668* -6.5% 0.0325 -2.0577 12,407 41 0.0664 6.9% 0.1648 0.4029 12,897 207
ACE Pacemaker 0.5205*** 68.3% 0.036 14.4636 8,517 38 -0.0825 -7.9% 0.0831 -0.9931 8,777 154
ACE PCI 0.3647*** 44.0% 0.0451 8.0782 14,116 110 -0.2305* -20.6% 0.1175 -1.9611 14,539 339
ACE-related Cardiovascular 0.0373 3.8% 0.0251 1.4901 23,279 108 0.0482 4.9% 0.0925 0.5215 24,354 637
Orthopedic DRGs (N=1,229) (N=1,309)
ACE Hip/Knee 0.3908*** 47.8% 0.0477 8.1882 27,365 337 -0.0143 -1.4% 0.3622 -0.0395 26,543 178
ACE-related Orthopedic 0.1119** 11.8% 0.0362 3.0864 23,214 303 -0.3169** -27.2% 0.1056 -2.9998 22,705 197

IMPAQ International, LLC Page 191 Evaluation of Medicare ACE Demonstration May 31, 2013 Final Evaluation Report
Home Health
ACE Sites Non-Demonstration Treatment Sites
DID (Coef) DID (%)
SE t-stat
N of Episodes in
DID Regression
N of Episodes Pre-ACE
DID (Coef) DID (%)
SE t-stat
N of Episodes in
DID Regression
N of Episodes Pre-ACE
OHH
Cardiovascular DRGs (N=1,908) (N=2,048)
ACE Valve 0.0255 2.6% 0.0537 0.4741 6,919 191 -0.3914* -32.4% 0.1741 -2.2477 6,826 188
ACE Defibrillator -0.0606 -5.9% 0.0564 -1.0733 2,709 92 -0.3591* -30.2% 0.1469 -2.4446 2,771 143
ACE CABG 0.0364 3.7% 0.0342 1.0615 13,216 458 -0.3176 -27.2% 0.1648 -1.9275 13,146 500
ACE Pacemaker -0.1746*** -16.0% 0.0361 -4.8362 8,827 247 -0.1588 -14.7% 0.1326 -1.1976 9,101 394
ACE PCI -0.0335 -3.3% 0.0413 -0.8113 14,863 576 -0.2612* -23.0% 0.123 -2.1239 15,176 807
ACE-related Cardiovascular 0.0771** 8.0% 0.0262 2.9418 18,736 520 -0.0002 0.0% 0.0826 -0.0029 19,415 1,191
LHS
Orthopedic DRGs (N=1,269) (N=1,365)
ACE Hip/Knee 0.0791 8.2% 0.282 0.2804 26,708 467 0.1538 16.6% 0.154 0.9986 28,199 1,400
ACE-related Orthopedic 0.0551 5.7% 0.2851 0.1931 22,799 357 0.0689 7.1% 0.0768 0.8969 24,044 1,118

IMPAQ International, LLC Page 192 Evaluation of Medicare ACE Demonstration May 31, 2013 Final Evaluation Report
SNF
ACE Sites Non-Demonstration Treatment Sites
DID (Coef) DID (%)
SE t-stat
N of Episodes in
DID Regression
N of Episodes Pre-ACE
DID (Coef)DID (%)
SE t-stat
N of Episodes in
DID Regression
N of Episodes Pre-ACE
BHS
Cardiovascular DRGs (N=1,906) (N=1,999)
ACE Valve -0.2569*** -22.7% 0.073 -3.5194 2,462 12 0.3863** 47.2% 0.1407 2.7459 2,601 45
ACE Defibrillator 0.3479*** 41.6% 0.0834 4.1706 585 6 0.1396 15.0% 0.3143 0.4442 607 15
ACE CABG 0.0301 3.1% 0.0567 0.5306 3,218 41 0.4365 54.7% 0.2427 1.7987 3,369 78
ACE Pacemaker 0.009 0.9% 0.0482 0.1869 3,653 40 0.1402 15.1% 0.1818 0.7715 3,854 110
ACE PCI -0.3630*** -30.4% 0.051 -7.1136 3,041 62 0.2214 24.8% 0.1315 1.6833 3,190 96
ACE-related Cardiovascular 0.0194 2.0% 0.0302 0.6417 9,182 227 0.1165 12.4% 0.1359 0.8577 9,489 359
Orthopedic DRGs (N=1,193) (N=1,289) ACE Hip/Knee -0.1773*** -16.2% 0.0426 -4.1583 12,852 500 -0.0247 -2.4% 0.1789 -0.1378 12,253 237
ACE-related Orthopedic -0.2171*** -19.5% 0.0371 -5.8455 20,661 734 -0.1225 -11.5% 0.1149 -1.0664 19,650 321
HMC
Cardiovascular DRGs (N=1,906) (N=2,006)
ACE Valve 0.4502*** 56.9% 0.069 6.5205 2,436 2 0.0371 3.8% 0.2983 0.1244 2,499 20
ACE Defibrillator 0.2486** 28.2% 0.0798 3.1129 ,577 3 -0.1464 -13.6% 0.2409 -0.6077 593 10
ACE CABG -0.0472 -4.6% 0.057 -0.8287 3,121 8 0.3585 43.1% 0.3321 1.0793 3,205 28
ACE Pacemaker 0.5836*** 79.2% 0.0444 13.1573 3,577 8 -0.1462 -13.6% 0.1221 -1.1972 3,709 62
ACE PCI 0.7282*** 107.1% 0.0515 14.1269 2,944 8 -0.3757 -31.3% 0.2285 -1.6445 3,052 62
ACE-related Cardiovascular -0.3116*** -26.8% 0.0311 -10.0081 9,014 34 0.1134 12.0% 0.1583 0.7163 9,369 178
Orthopedic DRGs (N=1,193) (N=1,273) ACE Hip/Knee 0.2759*** 31.8% 0.042 6.5661 11,668 50 -0.548 -42.2% 0.3394 -1.6147 11,701 103
ACE-related Orthopedic 0.0494 5.1% 0.0379 1.3053 19,165 130 -0.4190*** -34.2% 0.1216 -3.4444 19,208 195

IMPAQ International, LLC Page 193 Evaluation of Medicare ACE Demonstration May 31, 2013 Final Evaluation Report
SNF
ACE Sites Non-Demonstration Treatment Sites
DID (Coef) DID (%)
SE t-stat
N of Episodes in
DID Regression
N of Episodes Pre-ACE
DID (Coef) DID (%)
SE t-stat
N of Episodes in
DID Regression
N of Episodes Pre-ACE
OHH
Cardiovascular DRGs (N=1,906) (N=2,046)
ACE Valve -0.2568** -22.6% 0.0801 -3.2044 2508 37 -0.4238 -34.5% 0.4087 -1.0368 2,488 31
ACE Defibrillator -0.1438 -13.4% 0.0915 -1.5707 581 8 ‡ ‡ ‡ ‡ 600 19
ACE CABG 0.1753** 19.2% 0.0566 3.0976 3245 61 -0.3628 -30.4% 0.2243 -1.6176 3,223 69
ACE Pacemaker 0.0683 7.1% 0.0485 1.4084 3661 54 -0.2116 -19.1% 0.1801 -1.1753 3,791 131
ACE PCI 0.2336*** 26.3% 0.0536 4.3629 3064 63 -0.1781 -16.3% 0.1559 -1.1425 3,131 112
ACE-related Cardiovascular 0.1762*** 0.0% 0.0302 5.8312 7316 80 -0.0771 -7.4% 0.0727 -1.0609 7,558 326
LHS
Orthopedic DRGs (N=1,233) (N=1,324)
ACE Hip/Knee 0.1579 17.1% 0.2029 0.7782 11746 167 0.2656 30.4% 0.1565 1.6975 12,059 340
ACE-related Orthopedic 0.0998 10.5% 0.1796 0.5559 19,268 312 0.1685* 18.4% 0.081 2.0788 20,091 782
Notes: *p<0.05, **p<0.01, ***p<0.001. N is the number of sites/quarter observations for the DID model. For example, there were 1,908 site/quarter observations for the ACE valve DID for BHS for any PAC regression. The data for the DID had information on 1 ACE site, 20 quarters for each ACE site, 96 true comparison (TC) sites, and at most 20 quarters for each TC site. Some TC sites had missing quarters. The exponential of the DID estimate minus one, , yields the exact percentage change of the ratios that DID estimate presents. ‡ The shaded areas with N/A indicate that the DID did not converge for the procedure group.
IMPAQ International, LLC Page 194 Evaluation of Medicare ACE Demonstration May 31, 2013 Final Evaluation Report
Interestingly, BHS had an increase of 40.5 percent in home health volume for ACE defibrillator, and an increase of 13.7 percent for ACE orthopedic procedures even though the inpatient quarterly volume for these procedure groups did not change post-demonstration. These increases in home health use for ACE orthopedic procedures compared to inpatient volume may be explained by a huge push (as a result of ACE) to decrease length of stay and to standardize procedures so that physicians and non-physician staff could streamline care to decrease length of stay and improve quality. This was particularly true for the orthopedic service line. Perhaps this resulted in minimal inpatient services, resulting in an increased service load for home health. At HMC, we observed that the use of home health as a PAC setting decreased for valve (close to 38 percent) and CABG (6.5 percent) although the inpatient volume either did not change (valve) or increased (CABG). The patterns in home health volume for OHH and LHS were similar to those for inpatient quarterly volume, shown in Section 2.1.4 above. If there was an increase in inpatient volume, there was also an increase in the use of home health as a PAC setting. At BHS, the use of SNF as a PAC setting for defibrillator patients increased post-demonstration although the inpatient volume did not change. For CABG, pacemaker, and ACE-related cardiovascular procedures, SNF volume did not change, although inpatient volume for these procedures decreased by 20.1 percent, 26.4 percent, and 10.5 percent, respectively. At HMC and OHH, SNF use compared to inpatient volume (relative SNF use) showed mixed results, varying by procedure group. The relative use of SNF decreased for CABG. In contrast, the relative use of SNF increased for valve at HMC. For other procedure groups at HMC, the SNF volume pattern is similar to the inpatient volume pattern. OHH experienced a decrease in relative SNF use for valve and an increase for CABG, pacemaker, and PCI. For example, the SNF use for valve decreased by 22.6 percent, while inpatient volume for the procedure group did not change. The SNF volume increased for CABG (by 19.2 percent) and PCI (by 26.3 percent), while the inpatient volume for these procedure groups did not change post-demonstration. No particular pattern in the relative SNF volume change was observed at LHS.

IMPAQ International, LLC Page 195 Evaluation of Medicare ACE Demonstration May 31, 2013 Final Evaluation Report
3. MARKET CONCENTRATION AND PHYSICIANS’ CHOICE OF PLACE OF SURGERY
3.1. Market Share To complement the analysis of overall total volume effects, we examined the market share of ACE sites in the corresponding site markets for each DRG procedure group. 3.1.1. Research Question We asked the following question: Did changes in volume at ACE sites and non-demonstration treatment sites affect the proportion of procedures delivered among hospitals in the local market? This market share analysis would further our understanding of changes in volume. 3.1.2. Measure We defined the global effect of the market share for a certain DRGs as the number of episodes per major DRG procedure group performed at any of the ACE sites divided by the number of episodes per major DRG procedure group performed at both the ACE sites and the non-demonstration treatment sites, that is all hospitals in the local market area (the HRR), . As defined earlier, a year is measured from a site’s demonstration start date. The observations were produced at the site and market level (HRR) for each of the nine procedure groups and year combinations. By dividing the site-level variable by the market-level variable, we constructed a variable that represented the market share of each site in the corresponding market. 3.1.3. Methodology
For this analysis we used descriptive statistics. We did not use the true comparison group as a counterfactual because, although the true comparison group was selected based on site-level characteristics, it is possible that the hospital markets that contain the ACE sites differ substantially from the markets that contain the true comparison group hospitals. The trend might be too volatile to draw a consistent conclusion due to the small volume in each quarter. 3.1.4. Results Exhibit 53 is a graphical representation of the market share changes in all ACE site markets for each major DRG procedure group. The definition of the pre-post demonstration period for the descriptive statistics cannot be presented using actual dates since each ACE site had a different start date. “T” denotes the time period used for the market share analysis. By examining multiple time periods (2 pre-demonstration years and 3 post-demonstration years), we can determine not only the presence of changes in market share, but also whether the changes were a continuation of changes in market share that were not necessarily related to the

IMPAQ International, LLC Page 196 Evaluation of Medicare ACE Demonstration May 31, 2013 Final Evaluation Report
demonstration. The time periods used in the analysis are shown on the horizontal axis. The market share for each of the procedure groups is displayed on the vertical axis.
Exhibit 53: Market Share by Period for Each Procedure Group (Global)

IMPAQ International, LLC Page 197 Evaluation of Medicare ACE Demonstration May 31, 2013 Final Evaluation Report
Based the aggregate measure for all ACE cardiovascular DRGs combined, the market share of the ACE sites was relatively stable across the 5 years of data, including the period after the implementation of ACE. Specifically, the ACE sites experienced a decrease in pacemaker market share post-implementation, a loss of nearly 5 percentage points. On the other hand, market share for defibrillator and PCI had the largest increases for the ACE sites (approximately 5 percentage points). The increase for ACE sites in PCI market share is important given its relatively large share of the total of procedures across all ACE cardiovascular DRGs. In contrast, ACE sites showed a slight decrease in market share for ACE-related cardiovascular procedures. For orthopedic procedures, there was a substantial spread between the ACE and ACE-related orthopedic DRGs, primarily because of an increase in market share for ACE orthopedic DRGs and a decrease for ACE-related orthopedic DRGs. Exhibit 54 is a graphical representation of the site-specific market shares. Again, we examine the yearly market shares from 2 years prior to the demonstration to 3 years after the demonstration.

IMPAQ International, LLC Page 198 Evaluation of Medicare ACE Demonstration May 31, 2013 Final Evaluation Report
Exhibit 54: Market Share by Period for Each Procedure Group (Site-Specific)

IMPAQ International, LLC Page 199 Evaluation of Medicare ACE Demonstration May 31, 2013 Final Evaluation Report

IMPAQ International, LLC Page 200 Evaluation of Medicare ACE Demonstration May 31, 2013 Final Evaluation Report

IMPAQ International, LLC Page 201 Evaluation of Medicare ACE Demonstration May 31, 2013 Final Evaluation Report
The market share trends for the ACE sites allow us to draw some conclusions. It appears that the demonstration helped BHS minimize or alleviate the prior declining trend in market share, except for pacemaker procedures, where the decline in market share for BHS continued (as it did at the other ACE sites). BHS is the only site where the aggregate measures for both ACE and ACE-related cardiovascular DRGs showed a decline (continuation from previous years) in market share. The market share for orthopedic services remained stable. As mentioned earlier, a physician leader in cardiovascular procedures left BHS after differences with administrators about the demonstration, and this may have been one of the causes for the loss in market share. HMC had a substantial increase in market share for ACE procedures, a continuation of the trend from previous years. This is the only ACE site that saw an increase in the orthopedic market; HMC’s market share in fact doubled in 5 years. Cardiovascular services also showed an increase in market share; after the demonstration, there was an increase in the PCI and defibrillator market shares, again a continuation from previous years. The jump in market share may be attributable to organizational changes unrelated to the demonstration. The Hillcrest Heart Pavilion opened in January 2009, and the Oklahoma Heart Institute opened in April 2008. For OHH, market shares for ACE cardiovascular procedures remained stable after the demonstration started, with minor increases after the implementation of the demonstration except for ACE defibrillator, where there was a mixed trend, and pacemaker, where OHH had a slight reduction in market share. LHS facilities experienced decreasing market share in both ACE and ACE-related orthopedic procedures over time. LHS administrators argued that the market was saturated with Medicare Advantage beneficiaries, who did not qualify for the demonstration. According to one respondent, the share of Medicare Advantage beneficiaries has continued to increase. Regarding the declines in market share in both ACE and ACE-related procedures, the market in this area was described by another respondent as “bi-polar,” with potential patients going predominantly either to LHS or to another local hospital, which competes for the small market of Medicare FFS beneficiaries.
3.2. Within-Hospital Distribution of Services The ACE demonstration introduced incentives for hospitals and physicians who performed a particular set of cardiovascular and orthopedic procedures. These incentives may have had an effect on the volume of DRGs that were not tied to the ACE bundled payment. It is possible that if a procedure was not profitable, the demonstration would shift the distribution of services within each site, from ACE DRGs to procedures closely related to those included in the demonstration (ACE-related procedures). The opposite might be true if the bundled payment and hospital interventions were producing large savings on ACE procedures.

IMPAQ International, LLC Page 202 Evaluation of Medicare ACE Demonstration May 31, 2013 Final Evaluation Report
3.2.1. Research Questions Two important questions concern the effect of the demonstration on DRGs provided within a hospital assuming that ACE DRGs are profitable and thus, a desirable product:
Within ACE-participating facilities, did the ACE Demonstration cause the distribution of DRGs to shift away from services that are closely related to those included in the demonstration?41
Within non-demonstration treatment group hospitals, did the distribution of services shift away from services included in the demonstration and concentrate on related DRGs?
3.2.2. Measure To assess whether sites shifted their volume of ACE-related procedures relative to ACE procedures, we generated a measure for within-hospital distribution of services. Within-hospital distribution of services is defined as the ratio of the volume of specific procedures to that of the volume of all ACE and ACE-related procedures performed at the site.42 The observations were produced at the site/quarter/procedure level. 3.2.3. Methodology We used a difference-in-differences approach to answer the research questions. By definition, this measure is continuous, as opposed to a count, which was used in the previous section on volume. Therefore, for this analysis we applied a traditional linear DID approach, where the DID estimate yields the difference of the post-pre–level changes in the treatment group and the comparison group on the outcomes of interest, a ratio reported as a decimal. 43 Thus, the DID estimate yields the difference of the pre-post changes in the ratio at the ACE site and at the true comparison sites. Since we can treat the ratio of interest as a percentage of a certain DRG procedure in the total of ACE and ACE-related DRGs procedures, the DID estimates the difference between the two percentages and shows the change in percentage points in the ratio of a DRG procedure to all ACE and ACE-related procedures for the ACE sites compared to that ratio for the true comparison sites. Exhibit 55 presents summary statistics for the variables in the within-hospital distribution of DRGs by procedure group and by period (pre- and post-demonstration) from CY 2007 Q4–CY
41
We defined ACE-related procedures as alternative procedures that physicians performing ACE procedures might choose if they decided not to perform ACE procedures. These procedures were selected in consultation with IMPAQ’s clinical advisor (the list of ACE-related MS-DRGs is provided in Appendix A). 42
Within-hospital distribution of services for cardiovascular procedures is defined as the ratio of the volume of the specific cardiovascular procedure group to that of all the ACE and ACE-related cardiovascular procedures performed at the site. Likewise, within-hospital distribution of services for orthopedic procedures is defined as the ratio of the volume of the specific orthopedic procedure group to that of all the ACE and ACE-related orthopedic procedures performed at the site. 43 For example, 0.01 means 1 percent.

IMPAQ International, LLC Page 203 Evaluation of Medicare ACE Demonstration May 31, 2013 Final Evaluation Report
2012 Q4. It shows the mean, standard deviation, and number of episodes for the measure of within-hospital service distribution for each procedure group. For a graphic representation of the overall pattern of the within-hospital service distribution, see Appendix E, Exhibit E-2. The overall share of ACE procedure groups relative to the ACE-related procedures tended to be slightly higher at the ACE sites than at either the non-demonstration treatment sites or the true comparison sites for both cardiovascular and orthopedic procedures. With the exception of the ACE pacemaker and ACE orthopedic DRGs, the ACE sites had a larger concentration of ACE DRGs within their ACE service lines relative to the service lines of both comparison groups. Based on the summary statistics, all ACE cardiovascular DRGs combined slightly decreased across all ACE and non-ACE sites, and there was a small shift towards ACE-related DRGs in non-ACE sites. The effect was reversed for ACE orthopedic DRGs, where there was a large increase from the pre-demonstration period to the post-demonstration period.

IMPAQ International, LLC Page 204 Evaluation of Medicare ACE Demonstration May 31, 2013 Final Evaluation Report
Exhibit 55: Summary Statistics for Within-Hospital Distribution of Services
ACE Sites
Non-Demonstration Treatment Sites
True ComparisonSites
Pre Post Pre Post Pre Post
Valve
Mean 0.05 0.05 0.03 0.04 0.04 0.05
SD 0.02 0.03 0.04 0.04 0.04 0.05
N 502 770 843 1,383 4,241 9,633
Defibrillator
Mean 0.05 0.05 0.04 0.03 0.03 0.03
SD 0.02 0.03 0.03 0.03 0.03 0.03
N 465 650 1,058 1,093 3,239 4,513
CABG
Mean 0.10 0.10 0.09 0.10 0.10 0.10
SD 0.04 0.03 0.05 0.06 0.06 0.07
N 1,171 1,468 2,242 2,958 9,381 15,270
Pacemaker
Mean 0.11 0.10 0.13 0.13 0.13 0.12
SD 0.02 0.02 0.10 0.11 0.06 0.06
N 1,201 1,357 2,709 3,380 10,251 15,697
PCI
Mean 0.37 0.35 0.30 0.26 0.28 0.25
SD 0.06 0.08 0.14 0.14 0.12 0.11
N 3,912 4,725 7,478 8,266 23,378 33,526
All ACE Cardiovascular Combined
Mean 0.67 0.66 0.59 0.55 0.58 0.55
SD 0.10 0.13 0.20 0.18 0.14 0.15
N 7,251 8,970 14,330 17,080 50,490 78,639
ACE-related Cardiovascular
Mean 0.33 0.34 0.41 0.45 0.42 0.45
SD 0.10 0.13 0.20 0.18 0.14 0.15
N 3,208 4,653 7,328 11,058 33,998 58,078
Hip/Knee
Mean 0.25 0.35 0.39 0.38 0.38 0.38
SD 0.21 0.21 0.23 0.24 0.17 0.19
N 2,637 4,679 2,687 3,086 13,370 28,009
ACE-related Orthopedic
Mean 0.75 0.65 0.61 0.62 0.62 0.06
SD 0.21 0.21 0.23 0.24 0.17 0.19
N 3,472 5,251 3,860 4,067 18,960 36,655
Note: The first, second, and third rows show the mean, standard deviation, and number of episodes, respectively.

IMPAQ International, LLC Page 205 Evaluation of Medicare ACE Demonstration May 31, 2013 Final Evaluation Report
3.2.4. Results In this analysis, we first discuss the global impact of the demonstration on within-hospital distribution of services. For the global impact of a given procedure group, we weighted each hospital by the number of episodes for the procedure group. We used this weight to account for the different sizes of hospitals in the site-level data and to take into account differential effects across sites. To calculate the weight, we first grouped the ACE sites and the true comparison sites. Then, we calculated the share of the number of episodes of a given procedure group at each hospital in the total number of episodes for the procedure group in the ACE site group, and that procedure group in the true comparison site group. We used these calculated shares as the frequency weight for the traditional DID model.44 After looking at global impact, we examined site-specific impacts. This approach allowed both a global perspective and specific-site issues to be revealed. We did not use weights for site-specific effects. Exhibit 56 shows the within-hospital distribution of services for each site pre- and post-demonstration.
Exhibit 56: Effects of the Demonstration on Within-Hospital Distribution of Services (Global DID Estimates)
ACE Sites Non-Demonstration Treatment Sites
DID SE t-stat N of
Episodes Mean SE t-stat
N of
Episodes
Global
Cardiovascular DRGs (N=1,945) (N=2,264)
ACE Valve -0.004 0.0065 -0.6093 15,146 -0.0074 0.004 -1.8712 16,100
ACE Defibrillator 0.006 0.0038 1.5886 8,867 -0.0025 0.0033 -0.7498 9,903
ACE CABG -0.0004 0.0035 -0.1161 27,290 -0.0045 0.0059 -0.7541 29,851
ACE Pacemaker -0.008 0.0057 -1.3912 28,506 0.0024 0.0069 0.3469 32,037
ACE PCI -0.0064 0.0108 -0.5901 65,541 -0.0065 0.0134 -0.4849 72,648
All ACE Cardiovascular -0.0127 0.0163 -0.782 145,350 -0.0185 0.0139 -1.3252 160539
Orthopedic DRGs (N=1,303) (N=1,555)
ACE Hip/Knee 0.0347* 0.0171 2.0228 48,695 0.0012 0.0194 0.0602 4,7152
Notes:*p<0.05, **p<0.01, ***p<0.001 N is the number of sites/quarter observations for the DID model. For example, there were 1,945 site/quarter observations for the ACE valve DID. The data for the DID had information on 3 ACE sites, 20 quarters for each ACE site, 96 true comparison (TC) sites, and at most 20 quarters for each TC site. Some TC sites had missing quarters.
44 We used the average weight option, in STATA, of the traditional DID model.

IMPAQ International, LLC Page 206 Evaluation of Medicare ACE Demonstration May 31, 2013 Final Evaluation Report
Globally, we found no statistically significant shift across ACE and ACE-related cardiovascular procedures in the ACE sites relative to the true comparison group. There was a shift toward ACE orthopedic procedures at ACE sites. Exhibit 57 shows the within-hospital distribution of ACE and ACE-related procedures by site. Regarding cardiovascular procedures, BHS had a shift away from ACE to ACE-related cardiovascular procedures, whereas HMC experienced the opposite effect. This pattern of shifting away from or toward ACE cardiovascular procedures is similar to the pattern observed in quarterly volume, where each site showed either a volume reduction or a volume increase in ACE cardiovascular procedures. OHH did not show any shift across ACE- and ACE-related DRGs. A shift toward ACE procedures was observed at HMC and LHS. In the non-demonstration treatment sites, we did not observe shifting across ACE and ACE-related cardiovascular procedures in the overall impact analysis. However, significant changes occurred in the OHH market, where we observed a shift from ACE to ACE-related cardiovascular procedures.

IMPAQ International, LLC Page 207 Evaluation of Medicare ACE Demonstration May 31, 2013 Final Evaluation Report
Exhibit 57: Effects of the Demonstration on Within-Hospital Distribution of Services (Site-Specific DID Estimates)
ACE Sites Non-Demonstration Treatment Sites
DID SE t-stat
N of Episodes in
DID Regression
N of Episodes Pre-ACE
DID SE t-stat
N of Episodes in
DID Regression
N of Episodes Pre-ACE
BHS
Cardiovascular DRGs (N=1,906) (N=1,999)
ACE Valve -0.0109*** 0.0021 -5.1941 14,105 97 -0.0017 0.0157 -0.1075 14,880 335
ACE Defibrillator 0.0045** 0.0016 2.8686 7,971 95 -0.0035 0.0047 -0.7414 8,367 275
ACE CABG -0.0033 0.0032 -1.0372 25,367 312 0.0117 0.0095 1.2279 26,896 836
ACE Pacemaker -0.0091** 0.0028 -3.2651 26,706 356 0.007 0.0055 1.2747 28,278 861
ACE PCI -0.0260*** 0.0067 -3.8705 59,061 1,040 0.0168 0.0174 0.9665 62,495 2,309
All ACE Cardiovascular -0.0447*** 0.0058 -7.6649 133,210 1,900 0.0304 0.0189 1.603 140,916 4,616
Orthopedic DRGs (N=1,234) (N=1,330) ACE Hip/Knee 0.0387** 0.0128 3.011 45,964 1,559 -0.0028 0.0359 -0.0775 43,314 585
HMC Cardiovascular DRGs (N=1,906) (N=1,999)
ACE Valve -0.0151*** 0.0021 -7.249 14,100 67 -0.0035 0.0041 -0.8409 14,416 169
ACE Defibrillator 0.0252*** 0.0016 15.3413 8,061 73 -0.0129 0.0118 -1.0899 8,534 331
ACE CABG 0.0148*** 0.0035 4.2725 24,971 78 0.0027 0.0094 0.2855 26,031 506
ACE Pacemaker 0.0231*** 0.0026 8.9065 26,398 119 0.0294 0.0243 1.2099 27,406 536
ACE PCI 0.0380*** 0.0067 5.6617 58,591 487 0.0216 0.0294 0.7354 60,796 1,539
All ACE Cardiovascular 0.0860*** 0.0056 15.3 132,121 824 0.0373 0.0496 0.7529 13,7183 3,081 Orthopedic DRGs (N=1,235) (N=1,315)
ACE Hip/Knee 0.0790*** 0.0128 6.1487 43,032 397 0.043 0.038 1.1338 42,194 271

IMPAQ International, LLC Page 208 Evaluation of Medicare ACE Demonstration May 31, 2013 Final Evaluation Report
ACE Sites Non-Demonstration Treatment Sites
DID SE t-stat
N of Episodes in
DID Regression
N of Episodes Pre-ACE
DID SE t-stat
N of Episodes in
DID Regression
N of Episodes Pre-ACE
OHH Cardiovascular DRGs (N=1,906) (N=2,046)
ACE Valve 0.0093*** 0.0024 3.8783 14,683 306 -0.0049 0.0052 -0.9425 14,546 313
ACE Defibrillator -0.0005 0.0016 -0.3457 8,318 261 -0.0041 0.0043 -0.9685 8,485 402
ACE CABG -0.0028 0.0027 -1.0089 26,242 702 -0.0057 0.0096 -0.5906 26,214 792
ACE Pacemaker -0.0142*** 0.0026 -5.5319 27,283 626 -0.0036 0.0141 -0.2576 28,234 1,166
ACE PCI 0.0074 0.0062 1.1956 61,628 2,041 -0.0303 0.0165 -1.8419 63,096 3,229
All ACE Cardiovascular -0.0007 0.0057 -0.1265 138,154 3,936 -0.0487*** 0.0123 -3.9495 140,575 5,902
LHS Orthopedic DRGs (N=1275) (N=1371)
ACE Hip/Knee 0.0840** 0.0255 3.2982 42,457 435 0.0138 0.0226 0.6124 44,402 1,153
Notes: *p<0.05, **p<0.01, ***p<0.001. N is the number of sites/quarter observations for the DID model. For example, there were 1,906 site/quarter observations for the ACE valve DID for BHS. The data for the DID had information on 1 ACE site, 20 quarters for each ACE site, 96 true comparison (TC) sites, and at most 20 quarters for each TC site. Some TC sites had missing quarters.

IMPAQ International, LLC Page 209 Evaluation of Medicare ACE Demonstration May 31, 2013 Final Evaluation Report
3.3. ACE Physicians’ Choice of Hospitals for Performing ACE Procedures
As discussed earlier, the ACE Demonstration may have affected physicians’ choice of hospitals for performing ACE procedures. The change in place of surgery might occur even when none of the physician groups faced discounts in their Medicare fee schedule for ACE DRGs. Physicians might still choose to perform ACE procedures at non-demonstration treatment sites because (1) the ACE sites may have increased the number of requirements or protocols (such as standardized order sets and implants) to perform procedures at the ACE facilities; or (2) there may have been an unintended effect to shift away patients with higher severity to minimize the potential detrimental effect on quality of care measures and the variability of cost associated with sicker patients. To determine whether such a change in preferences for place of surgery occurred, we examined the per-physician quarterly average volume of the ACE procedures performed by ACE physicians at ACE sites and at non-demonstration treatment sites. 3.3.1. Research Questions We first asked whether ACE physicians who performed ACE procedures in the pre-demonstration period performed fewer ACE procedures at ACE sites than the same surgeons performed at non-demonstration treatment sites in the post-demonstration period, and how the results compare to the pre-demonstration period. We also examined whether surgeons performing ACE procedures either before or after the start of ACE performed more ACE procedures at ACE sites as a result of the demonstration. The second measure is more comprehensive in that the latter definition of an ACE physician includes physicians who performed procedures after ACE was implemented, while the first only includes physicians who performed procedures prior to implementation of the demonstration. 3.3.2. Measure The ACE physician choice measure is the ratio of per-physician quarterly volume at the ACE site to the corresponding volume at the non-demonstration treatment sites. To generate this measure, we created a file with observations at the level of physician and quarter. We then calculated the per-physician quarterly volume of ACE DRG episodes performed by ACE physicians at each ACE site and at the corresponding non-demonstration treatment sites. The measure for the pre-demonstration period is the total number of episodes performed divided by the total number of ACE physicians and the number of quarters for the period. The measure for the post-demonstration period was calculated similarly. If the ratios differ by timeframe, the difference is likely to be due to new physicians who started performing more ACE procedures at ACE sites. We focused on surgeons who performed a non-trivial number of procedures at ACE sites. To be included in the analysis, a physician had to have performed pre-demonstration at least the median number of procedures. The median volume of procedures that ACE physicians performed pre-demonstration was 7 and 13 for ACE cardiovascular and orthopedic procedures,

IMPAQ International, LLC Page 210 Evaluation of Medicare ACE Demonstration May 31, 2013 Final Evaluation Report
respectively, at BHS. It was 4 and 3.5 for ACE cardiovascular and orthopedic procedures, respectively, at HMC. and . At OHH, it was 20 for ACE cardiovascular procedures, and at LHS, it was 15 for ACE orthopedic procedures. There are two reasons for our interest in this group of surgeons: first, the distribution is substantially skewed to the right, with many physicians having very few procedures, and, second, it is unlikely that physicians with low volumes of ACE procedures would have benefited or been affected by ACE gainsharing/requirements one way or the other. 3.3.3. Methodology We conducted a descriptive analysis of the defined ratios. We did not conduct a DID analysis or a trend analysis, since by definition there are no ACE physicians at the true comparison sites. 3.3.4. Results Exhibit 58 shows the average quarterly volume of ACE and ACE-related procedures performed by ACE physicians at the ACE and non-demonstration treatment sites. It also displays the ACE physician choice ratio.

IMPAQ International, LLC Page 211 Evaluation of Medicare ACE Demonstration May 31, 2013 Final Evaluation Report
Exhibit 58: Physicians’ Choice of Hospitals for Performing ACE Procedures
ACE Cardiovascular DRGs ACE Sites NDT sites
Relative Ratio (ACE: NDT)
Pre Post Pre Post Pre Post
Global
All ACE Cardiovascular (N of ACE physicians of interest = 100)
Quarterly Mean Volume of Procedures per Physician
9.4 7.9 3.1 2.1 3.1:1 3.7:1
N of Procedures 6,372 7,971 2,628 3,820
ACE & ACE-related Cardiovascular (N of ACE physicians of interest = 100)
Quarterly Mean Volume of Procedures per Physician
11.0 9.5 3.6 2.6 3.0:1 3.6:1
N of Procedures 7,340 9,437 3,129 4,699
ACE Orthopedic (N of ACE physicians of interest = 36)
Quarterly Mean Volume of Procedures per Physician
8.8 11.4 0.0 0.0 N/A N/A
N of Procedures 2,478 4,187 17 34
ACE & ACE-related Orthopedic (N of ACE physicians of interest = 36)
Quarterly Mean Volume of Procedures per Physician
13.5 15.2 0.0 0.1 N/A N/A
N of Procedures 3,789 5,615 27 48
BHS
All ACE Cardiovascular (N of ACE physicians of interest = 53)
Quarterly Mean Volume of Procedures per Physician
4.8 2.6 5.7 5.0 0.8:1 0.5:1
N of Procedures 1,786 1,800 2,129 3,476
ACE & ACE-related Cardiovascular (N of ACE physicians of interest = 53)
Quarterly Mean Volume of Procedures per Physician
5.4 3.1 6.7 6.2 0.8:1 0.5:1
N of Procedures 2,004 2,109 2,500 4,260
ACE Orthopedic (N of ACE physicians of interest = 23)
Quarterly Mean Volume of Procedures per Physician
9.1 8.9 0.1 0.1 85.8:1 77.9:1
N of Procedures 1,458 2,650 17 34

IMPAQ International, LLC Page 212 Evaluation of Medicare ACE Demonstration May 31, 2013 Final Evaluation Report
ACE Cardiovascular DRGs ACE Sites NDT sites
Relative Ratio (ACE: NDT)
Pre Post Pre Post Pre Post
ACE & ACE-related Orthopedic (N of ACE physicians of interest = 23)
Quarterly Mean Volume of Procedures per Physician
13.5 11.9 0.2 0.2 80.7:1 74.1:1
N of Procedures 2,180 3,558 27 48
HMC
All ACE Cardiovascular (N of ACE physicians of interest = 14)
Quarterly Mean Volume of Procedures per Physician
9.6 9.7 3.4 0.7 2.8:1 14.7:1
N of Procedures 806 1,893 288 129
ACE & ACE-related Cardiovascular (N of ACE physicians of interest = 14)
Quarterly Mean Volume of Procedures per Physician
12.6 12.3 4.0 0.7 3.1:1 16.6:1
N of Procedures 1,055 2,405 338 145
ACE Orthopedic (N of ACE physicians of interest = 5)
Quarterly Mean Volume of Procedures per Physician
13.0 17.8 0.0 0.0 N/A N/A
N of Procedures 391 1,244
ACE & ACE-related Orthopedic (N of ACE physicians of interest = 5)
Quarterly Mean Volume of Procedures per Physician
18.9 23.0 0.0 0.0 N/A N/A
N of Procedures 568 1,611
OHH
All ACE Cardiovascular (N of ACE physicians of interest = 33)
Quarterly Mean Volume of Procedures per Physician
12.7 11.8 0.7 0.6 17.9:1 19.9:1
N of Procedures 3,780 4,278 211 215
ACE & ACE-related Cardiovascular (N of ACE physicians of interest = 33)
Quarterly Mean Volume of Procedures per Physician
14.4 13.6 1.0 0.8 14.7:1 16.7:1
N of Procedures 4,281 4,923 291 294

IMPAQ International, LLC Page 213 Evaluation of Medicare ACE Demonstration May 31, 2013 Final Evaluation Report
ACE Cardiovascular DRGs ACE Sites NDT sites
Relative Ratio (ACE: NDT)
Pre Post Pre Post Pre Post
LHS
ACE Orthopedic (N of ACE physicians of interest = 8)
Quarterly Mean Volume of Procedures per Physician
6.6 4.6 0.0 0.0 N/A N/A
N of Procedures 629 293
ACE & ACE-related Orthopedic (N of ACE physicians of interest = 8)
Quarterly Mean Volume of Procedures per Physician
10.8 7.0 0.0 0.0 N/A N/A
N of Procedures 1041 446
Notes: NDT: Non-demonstration treatment. ACE physicians of interest: If an ACE physician performed at least the median of distribution of ACE procedures performed during the pre-ACE period, we considered the physician to have performed significant number of ACE procedures. NDT: non-demonstration treatment group.

IMPAQ International, LLC Page 214 Evaluation of Medicare ACE Demonstration May 31, 2013 Final Evaluation Report
Globally, in the post-demonstration period, the ACE physicians performed more ACE procedures at the ACE sites, on average, than at the non-demonstration treatment sites, in all procedure groups. Prior to the demonstration, the ratio of ACE cardiovascular procedures performed at ACE sites to those performed at non-demonstration treatment sites was 3.1, while in the post-demonstration period the ratio increased to 3.7. We do not include the ratio for ACE orthopedic procedures because only BHS had physicians who performed orthopedic procedures at the non-demonstration treatment sites. In addition, the ratios using the broader definition of ACE physicians (including new surgeons after the ACE implementation date) are similar for ACE cardiovascular procedures, implying that there was no sizable addition of new physicians performing ACE cardiovascular procedures at ACE sites. The same statistics for the broader set of physicians, including those who performed procedures post-demonstration, can be found in Appendix E, Exhibit E-3. The global effect described here is the average effect across all ACE local markets. Thus, to understand the global effect, we investigated the factors that might have affected physician behaviors in each site market post-demonstration. In the BHS site market, post-demonstration the ACE physicians performed more ACE procedures at the non-demonstration treatment sites, on average, than at the ACE site. This was expected since one of the most productive cardiovascular physicians left BHS because new ACE protocols required vendor negotiations, which resulted in losing his preferred vendor. The change is clearer in ACE orthopedic procedures. At BHS, for ACE orthopedic procedures, the ratio of ACE procedures performed by ACE physicians at ACE sites to those performed at the non-demonstration treatment sites was 85.8 pre-demonstration and decreased to 77.9 post-demonstration. Physicians at BHS are not employed by BHS and therefore can perform procedures at non-demonstration treatment sites. These findings imply that after the demonstration ACE physicians might have had more incentive to perform these procedures at non-demonstration treatment sites. This information seems to differ from the informant reports, where the most involved surgeons stated that they conducted their business at BHS. It should be kept in mind, however that (a) it is primary care/referring physicians who direct surgeons where the referral surgeries should take place, and (b) the active ACE physicians may be a smaller group within the total number of ACE physicians. There was no sizable addition of new physicians who became very active in performing ACE cardiovascular procedures at the ACE sites. In the HMC site market, the ratio of ACE procedures performed at the ACE site to those performed at non-demonstration treatment sites increased post-demonstration. Prior to the demonstration, HMC’s cardiovascular physicians performed about three times as many ACE cardiovascular procedures at the ACE site as at non-demonstration treatment sites. After the demonstration, they performed about 15 times as many procedures at ACE sites. This result may have been due to organizational changes unrelated to the demonstration. The Hillcrest Heart Pavilion opened in January 2009, and the Oklahoma Heart Institute opened in April 2008. HMC’s cardiovascular physicians came under contract to the institute and became employed staff. If the majority of the newly employed physicians were contractually required to perform procedures at the ACE site, then the ratio would change and the increase in performance of

IMPAQ International, LLC Page 215 Evaluation of Medicare ACE Demonstration May 31, 2013 Final Evaluation Report
ACE procedures at HMC might thus reflect the effect of the ACE demonstration. There was no sizable addition of new physicians who became very active in performing ACE procedures at the ACE site post-demonstration. In the OHH site market, the ACE physicians performed approximately 18 and 20 times as many ACE cardiovascular procedures at the ACE sites as at the neighboring facilities in the pre- and post-demonstration period, respectively. This high ratio may be attributed to the fact that OHH physicians are employees of the hospital and thus have a greater stake in the success of the hospital and hospital-related initiatives such as the ACE Demonstration. In addition, the ratios for physicians having at least the median number of procedures during each of the two timeframes (pre-period and either pre-period or post-period) are different for OHH. The ratios were similar between the pre- and post-demonstration periods in the first timeframe (17.9 and 19.9 respectively), while in the second timeframe the ratio increased from 14.7 (pre-demonstration) to 16.7 (post-demonstration). This increase may be explained by the hiring of new physicians who became very active in performing ACE procedures at the ACE site post-demonstration. As mentioned earlier, the ACE orthopedic physicians at HMC and LHS did not perform any ACE procedures at non-demonstration treatment sites post-demonstration.
3.4. Summary Overall, based on the global analysis, we found that the ACE Demonstration did not have an impact on the ACE inpatient volume of procedures at ACE sites, except for ACE defibrillator (increase) and ACE pacemaker (decrease). Non-demonstration treatment sites also were not affected by the demonstration. Regarding the volume for PAC in any settings and SNF use, the demonstration did not globally affect the quarterly volume of any PAC for the ACE or ACE-related procedure groups at the ACE sites or the non-demonstration treatment sites if the DID model converged. As for home health use, the pattern of the changes in volume is similar to that of the overall changes in inpatient volume. The overall market share of the ACE sites showed a stable pattern for ACE procedures. The within-hospital distribution of services analysis showed no statistically significant shifting across ACE and ACE-related cardiovascular procedures overall; however, we found that a statistically significant shift occurred in the ACE sites, from ACE-related orthopedic procedures to ACE orthopedic procedures. Based on interviews with staff and administrators, this finding can be explained by the fact that the ACE sites generated the largest savings on orthopedic implants and other materials and equipment used in orthopedic procedures, due to negotiations with vendors. Further, ACE physicians, on average, have performed more ACE procedures at the ACE sites than at the non-demonstration treatment sites post-demonstration, in all procedure groups.

IMPAQ International, LLC Page 216 Evaluation of Medicare ACE Demonstration May 31, 2013 Final Evaluation Report
Our site-specific analyses revealed that these global impacts mask site-specific heterogeneity in the effects. BHS showed a reduction in the volume of most of the ACE procedures; HMC’s volume for most ACE procedures increased; and OHH had mixed results for cardiovascular procedures. Non-demonstration treatment hospitals did not seem to be affected by the demonstration, except in the OHH market, where most of the ACE procedures decreased in volume at non-demonstration treatment sites. These site-specific differences were consistently observed in the within-hospital distribution of services and the physician spillover analysis. For example, BHS shifted away from ACE cardiovascular procedures within the site, and the ACE physicians at BHS performed fewer ACE procedures at the ACE site, on average, than at the non-demonstration treatment sites post-demonstration. HMC, unlike BHS, shifted toward ACE procedures from ACE-related procedures, and its ACE physicians performed ACE cardiovascular procedures more frequently at the ACE sites than at the non-demonstration treatment sites post-demonstration. This pattern was also seen in the market share analysis, where BHS experienced a decline and HMC experienced an increase in most of the ACE procedures. Therefore, in terms of volume changes, the demonstration seemed to have affected the demonstration sites differently. This differential effect was also observed in the PAC volume analysis. For example, at BHS, the relative SNF volume compared to inpatient service volume increased, while at HMC and OHH, the relative SNF use showed mixed results, varying by procedure group.

IMPAQ International, LLC Page 217 Evaluation of Medicare ACE Demonstration May 31, 2013 Final Evaluation Report
CHAPTER VI: LESSONS FROM ACE IMPLEMENTATION, SUMMARY OF
EVALUATION FINDINGS, AND CONCLUSIONS

IMPAQ International, LLC Page 218 Evaluation of Medicare ACE Demonstration May 31, 2013 Final Evaluation Report
1. IMPLEMENTATION LESSONS LEARNED
Several lessons can be learned from the experiences of the ACE sites in implementing their versions of the ACE Demonstration and achieving their own goals in addition to those of the demonstration. Below is a description of the participants’ successes and challenges, and some recommendations that may inform future bundled payment efforts. Factors That Facilitated Implementation and Success Based on the evidence of the ACE site visits and the quantitative findings, it was observed that the following factors were important in implementing the ACE Demonstration and successfully achieving its goals:
Involvement of physicians early in the design and implementation processes increased physician buy-in, contributed to administrator and physician collaboration, increased overall satisfaction, and generated process efficiencies and cost reductions. For example, collaboration of hospital administrators and materials managers with surgeons was critical for implementing cost-saving strategies.
Greater transparency of quality and cost data, particularly through physician report cards, improved the level of engagement by physicians and staff and increased stakeholder satisfaction. The report cards drove discussions among physicians and between physicians and administrators, thereby heightening awareness of cost and quality outcomes.
Standardized order sets, which were developed in collaborative efforts between administrators and physicians, were a critical organizational change that enhanced quality of care and increased physician and staff satisfaction. Standardization of order sets was most effective when physicians practicing at a site had been using different surgical protocols and materials.
Prior to the demonstration, physicians worked independently with vendors to purchase equipment and were not always cognizant of the cost of favored devices and implants. As a result of ACE, physicians worked collaboratively to identify high-quality, cost-effective implants and devices. Stakeholders attributed cost savings to the standardization of implants and materials, which allowed materials managers and physicians to negotiate reduced prices.
Encouragement of physicians to spearhead efforts to standardize materials across service lines using cost data and best practices empowered physicians to negotiate better vendor prices. This process resulted in increased cost savings and improved physician-administrator relationships over the course of the demonstration.

IMPAQ International, LLC Page 219 Evaluation of Medicare ACE Demonstration May 31, 2013 Final Evaluation Report
Patient navigators helped bridge gaps in care coordination, particularly in high-volume service areas. They proactively monitored patient progress throughout the hospital stay, served as a resource to coordinate care, and worked with providers to address outliers and barriers to positive outcomes.
Challenges in Implementing the ACE Demonstration The following challenges in implementing the ACE Demonstration were reported by administrators, physicians, and non-physician staff at the ACE sites:
Lags in data collection efforts and reporting were frustrating to administrators and physicians seeking to identify case outliers in a timely fashion. Introducing real-time, interactive electronic dashboard systems allowed administrators and physicians to effectively monitor quality performance and communicate quality metrics. This data feedback system also allowed time for patient-specific correction because it proactively identified potential outliers during the inpatient stay.
A link between incentives and quality improvement existed; however, physicians noted that the cap on ACE gainsharing limited its potential for further quality improvements. CMS could examine modifications on caps and other limitations on gainsharing to encourage continued physician support and achievement of cost and quality objectives.
ACE sites where gainsharing was not offered to all physicians—for instance, sites where physicians were employed by the hospital—were at a disadvantage because they lacked meaningful monetary incentives to encourage physician compliance and cooperation. Although employee physicians did not disagree with gainsharing policies generally, they expressed dissatisfaction with the inability to engage in gainsharing efforts themselves.
The ACE sites faced continued challenges with billing and payment procedures as a result of new ACE processes that required manual processing and therefore significant resources. For future bundled payment initiatives, CMS could examine how to simplify billing and payment procedures through streamlined electronic processes.
Because some physicians were initially skeptical of gainsharing, and several sites experienced long delays in payments, administrators found that the sooner physicians received incentive payments, the more quickly they became engaged. Sites may wish to develop protocols to establish quick and accurate gainsharing procedures as soon as possible.
Non-physician staff, such as nurses, patient navigators, and therapists, felt disengaged from the demonstration. Full participation by non-physician staff in the design and

IMPAQ International, LLC Page 220 Evaluation of Medicare ACE Demonstration May 31, 2013 Final Evaluation Report
implementation processes is important because non-physician staff play critical roles in meeting cost and quality metrics. To increase involvement and satisfaction, non-physician staff could help in planning standardized orders and conducting quality-of-care reviews.
Although non-physician staff contributed to cost savings, they did not receive incentives during the demonstration. Sites may wish to consider establishing gainsharing programs for non-physician staff who play critical roles in meeting cost and quality metrics. CMS may wish to examine mechanisms for encouraging sites to extend incentives to non-physician staff to foster greater involvement in bundled payment initiatives.
Unanticipated Effects and Spillover of ACE-related Features There were some unintended effects resulting from the ACE Demonstration, both positive and negative.
Stakeholders anticipated an increase in volume as a result of ACE marketing strategies and the Medicare shared savings incentive. However, in interviews and focus groups, stakeholders did not see the demonstration as having a significant effect, either positive or negative, on patient volume or, subsequently, on market share. When patient volume did increase, they attributed the growth to site-specific factors, such as the reputation of the surgeons and newly opened facilities. As a result, sites suggested that CMS consider additional or alternative strategies to assist them to market the program to potential beneficiaries, especially through primary care providers.
Hospitals did not attract more patients as a result of financial incentives, because patients did not prioritize financial incentives such as Medicare shared savings when choosing a hospital; instead, they were more likely to choose a hospital or surgeon based on reputation or referral by their primary care physician. Stakeholders suggested extending incentives to primary care physicians or referring physicians—the ones who directly influence where a beneficiary receives health care.
Although negotiations with vendors on materials and implants, a result of increased collaboration between physicians and administrators, were found to produce the greatest cost savings, the effect of negotiated cost reductions waned over time. Increasing patient volume and decreasing the length of stay may help to generate other cost savings.
Stakeholders did not perceive the ACE Demonstration as influencing or affecting the concentration, distribution, or provision of services.
IMPAQ International, LLC Page 221 Evaluation of Medicare ACE Demonstration May 31, 2013 Final Evaluation Report
While the evaluators did not anticipate an extension of ACE-related features to non-ACE DRGs and markets, some successful and easily transferable ACE-inspired initiatives (such as vendor negotiations, standardized order sets, and standardized materials and procedures) influenced quality and coordination efforts in ACE-related and other DRGs, as well as in other health care markets (such as Medicare Advantage and private insurance).
Despite efforts by CMS and hospitals to market ACE to beneficiaries, beneficiaries were mostly unaware of the ACE Demonstration, although they unanimously expressed satisfaction with the quality of care that they received.

IMPAQ International, LLC Page 222 Evaluation of Medicare ACE Demonstration May 31, 2013 Final Evaluation Report
2. SUMMARY OF EVALUATION FINDINGS
Physician Services Expenditures for ACE Episodes and Associated Post-Acute Care Costs The effects of the demonstration on non-acute care hospital costs provided during inpatient episodes at the ACE hospitals are striking and robust. The demonstration appears to have increased non-DME carrier costs by more than 20 percent ranging from $325 per defibrillator episode to $1,190 per valve episode. Additional investigation of these results revealed that the increased services were for CPT/HCPCS codes related to hospital visits and procedures. It is possible that the rules governing the ACE Demonstration incentivized providers to deliver more care because (a) physicians did not experience risk in cases where the costs of care exceeded the bundled payment amount, (b) physicians’ quality of care was scrutinized as part of the demonstration, or (c) physician services may have been substituted for hospital services (e.g., more physicians’ visits leading to shorter lengths of stay). This finding is also supported because the DID analysis did not find an effect on the provision of physician services for inpatient episodes at non-demonstration treatment group hospitals. In contrast with the dollars’ worth of non-DME carrier services, the average total PAC costs did not change with the exception of PCI procedures for which total PAC costs increased by $414 (17 percent of the pre-implementation costs). It should be noted that the pooled estimates for the ACE sites obscure the variation in costs across ACE sites. BHS’ total PAC costs increased by between $283 for orthopedic procedures and $3,463 for valve procedures in response to the demonstration while LHS’s PAC costs for orthopedic procedures decreased by more than $1,000 per episode. In terms of the PAC settings, there was some evidence of a decrease in physician office visits, and an increase in outpatient costs. Similar to the results for carrier costs, the demonstration had no impact on PAC costs following inpatient episodes at non-demonstration treatment group hospitals. Estimates of the Medicare savings from the ACE Demonstration due to the discounted bundled payments to ACE sites and after accounting for Medicare PAC savings or cost increases are reported in Appendix F. Based on the deterministic savings on Medicare inpatient payments (discounts) and the DID estimates from the PAC analysis, Medicare saved an average of $585 per episode from the combined Medicare Part A and B expected payments or a total of $7.3 million across all episodes (12,501 episodes), all ACE MS-DRGs, and four ACE Sites. However, increases in PAC costs reduced these savings by approximately 45 percent, resulting in per-episode savings of $319 and total net savings of approximately $4 million. The Medicare savings vary by MS-DRG and by site with Oklahoma having the smallest per-episode savings ($99 per episode; $422,126 in total net savings) and Hillcrest had the largest total net savings ($814 per episode; $2,457,433 in total net savings). The largest aggregate savings were from orthopedic procedures and the smallest savings per episode was for PCI procedures ($71). The Medicare savings estimates do not take into consideration the ACE Medicare shared savings incentives given back to eligible beneficiaries.

IMPAQ International, LLC Page 223 Evaluation of Medicare ACE Demonstration May 31, 2013 Final Evaluation Report
Quality of Care, Utilization, and Case Mix The basic time trend analysis of the medical chart report-based measures suggest little or no evidence of a demonstration effect on most of the process and outcome measures. The measure for the revascularization rates of PCI admitted patients showed considerable changes; however these changes were likely driven mostly by surgery patterns at one of the sites (HMC), which added a new cardiovascular facility and the acquisition of a new physician group. In general, little can be said of the medical chart report-based measures because of the lack of data on the pre-demonstration period and comparison group data. The rigorous analysis in quality of care measures, the adjusted DID regressions, derived from models that control for age, gender, race, and health status (HCC risk score) suggest that the ACE sites maintained their quality of care levels without any systematic or consistent changes in the type of patients they admitted (severity measures), length of stay, or in clinical in response to the demonstration. When the changes were statistically significant (10 measures), we observed improvements in six measures. For example, there was a lower likelihood of death within 30 days following surgery for defibrillator admissions A negative outcome, and an important one, is a significant decrease in the likelihood of use of an internal mammary artery (IMA) among CABG patients. The estimated odds ratio is 0.59, indicating that the odds of using the IMA decreased by 41 percent after the demonstration. There is also a negative finding for this measure for the non-demonstration treatment sites, which indicates that there may have been market-level forces that led to a decrease in the use of IMA in first-time isolated CABG. Contrary to our hypothesis, the case mix index increased for defibrillator and CABG procedures at ACE sites and was statistically significant; more frail patients were being admitted. Our hypothesis of shifting more frail beneficiaries from ACE sites was sustained for two other sets of severity measures: (a) it was less likely that a beneficiary receiving a hip or knee replacement/revision was over age 75 or had a hip fracture, and (b) the likelihood of an admitted patient being a patient outlier decreased for defibrillator and CABG patients, but did not change for the other procedure groups. Our hypotheses about a decrease in length of stay at ACE sites and a greater likelihood of transfers to post-acute care facilities from ACE sites were unfounded for most procedures. However, we observed a shorter average length of stay (decrease of 0.25 day) for hip/knee procedures although the effect on length of stay was similar for ACE and non-demonstration treatment hospitals indicating that market-level factors may have had an effect. In many instances, it can be argued that the ACE sites had high levels on the pre-demonstration quality of care measures. Despite the lack of strong quantitative evidence for realized improvements in quality, there is qualitative evidence that the demonstration hospitals worked to improve processes and outcomes; this is particularly evident from the findings on hip/knee replacement.

IMPAQ International, LLC Page 224 Evaluation of Medicare ACE Demonstration May 31, 2013 Final Evaluation Report
Volume, Market Concentration, and Physicians’ Choice of Place of Surgery Overall, there was not an impact on the inpatient volume of ACE procedures at ACE sites, except for ACE defibrillator (increase by 19.2 percent) and ACE pacemaker (decrease by 11.7 percent). Similar to the results for Part B and PAC costs, the demonstration had no impact on volume of ACE procedures at non-demonstration treatment group hospitals. Regarding the analysis of volume for PAC in any settings and in SNF use, there was not an impact on the quarterly volume of PAC for the ACE or ACE-related procedure groups at the ACE sites or the non-demonstration treatment sites. As for home health use, the pattern of the changes in volume is similar to that of the overall changes in inpatient volume; where there was an increase in inpatient volume, we observed an increase in the use of Home Health. Other similar analyses, market share and within-hospital distribution of services showed stable market shares and no statistically significant shifting across ACE and ACE-related cardiovascular procedures, respectively. However, we found that a statistically significant shift from ACE-related orthopedic procedures to ACE orthopedic procedures. That is, the proportion of the ACE Orthopedic procedures (Hip/Knee) in the total ACE and ACE-related Orthopedic procedures combined has increased by 3.47 percentage point compared to that of true comparison sites. This finding can be explained by the fact that the ACE sites generated the largest savings and potential larger gainsharing from price reduced orthopedic implants and other materials and equipment used in orthopedic procedures. One aspect of the volume analysis that was significant is that ACE physicians, on average, have performed more ACE procedures at the ACE sites than at the non-demonstration treatment sites post-demonstration, in all procedure groups. The global volume analyses mask site-specific heterogeneity in the volume measures described above. BHS showed a reduction in the volume of most of the ACE procedures; HMC’s volume for most ACE procedures increased; and OHH had mixed results for cardiovascular procedures. Non-demonstration treatment hospitals did not seem to be affected by the demonstration, except in the OHH market, where most of the ACE procedures decreased in volume at non-demonstration treatment sites. These site-specific differences were consistently observed in the within-hospital distribution of services and the physician spillover analysis. This site-specific differential effect was also observed in the PAC volume analysis. For example, at BHS, the relative SNF volume compared to inpatient service volume increased, while at HMC and OHH, the relative SNF use showed mixed results, varying by procedure group.

IMPAQ International, LLC Page 225 Evaluation of Medicare ACE Demonstration May 31, 2013 Final Evaluation Report
3. CONCLUSIONS
In this report, we present the methodologies employed and the findings from the Evaluation of the Acute Care Episode Demonstration. First, we conducted a comparative analysis of the initial and final site visits to the ACE demonstration sites, and, second, we performed rigorous econometric analyses using difference-in-differences regressions. The Centers for Medicare & Medicaid is interested in the following research questions:
What is the impact of the demonstration on the ACE sites in the following domains: Medicare program costs, quality of care outcomes, coordination of care, and volume of services provided?
What is the impact of the demonstration on other components of the health care delivery system (such as non-ACE hospitals and practitioners and post-acute care providers)?
How do impacts differ across sites and over time?
Do financial incentives (shared savings and gainsharing) impact beneficiary provider choice?
Are the beneficiaries who receive services in the demonstration different from those who receive similar services in non-demonstration sites?
Do the results of the evaluation suggest refinements of the demonstration design? The comparative site visit report and appendix B provide detailed information on hospital initiatives to improve quality and introduce cost savings. We report on the challenges faced by the ACE sites, their strategies to overcome these challenges, and whether the sites were successful in implementing the demonstration. The qualitative information, although limited to certain contexts and hospital characteristics, offers a wealth of information for future Medicare bundled payment demonstrations. It is also important to observe that the changes introduced by the ACE sites were not exclusive to the Medicare program but had positive cost-saving and quality improvement effects for other populations and for patients covered by other payers. Furthermore, the changes introduced by the ACE Demonstration have, in some instances, been adapted to other procedure groups and have facilitated the development of the level of trust and collaboration among hospital administration and physicians that were needed to introduce system change. In many instances, the qualitative and quantitative findings are conclusive in terms of the direction and magnitude of the impact of the ACE Demonstration (or lack thereof) on Medicare expenditures, volume, and quality of care. We further investigated those instances where the demonstration’s impacts were contrary to what was expected. Nonetheless, there are several limitations to the findings, particularly related to the quantitative estimates and the potential for generalization of findings:

IMPAQ International, LLC Page 226 Evaluation of Medicare ACE Demonstration May 31, 2013 Final Evaluation Report
Most ACE hospitals are active in markets that have more than two major hospital systems, which implies limited choices for place of surgery.
At two sites, hospital administrators reported that nearly half of the ACE DRG procedures were Medicare managed care cases, which limited the potential for higher volume and cost savings.
Acquisition of physician practices at two ACE sites altered the hospital-physician relationships and the incentives for system change, because it removed gainsharing as an incentive for cost savings.
Some of the expected changes may require more time or more information to be realized.
One site had a very small number of ACE procedures and had to be excluded in most analyses due to sample size issues.
Cardiovascular procedures are not usually planned, and efficiencies are therefore not always realized. In contrast, in orthopedic procedures, planning and preparations often occur and can have a substantive effect on quality of care and internal costs as well as patient satisfaction.
High volume surgeons, usually the champions of the demonstration, led most of the changes in protocols of care. They stood to gain the most from improved quality and gainsharing, and other surgeons followed their lead. Different outcomes might have been observed under a more democratic process.
The qualitative analysis consistently found that each participating site developed individualized innovations that affected how the ACE site coordinated health care, marketed to beneficiaries, and distributed savings between the hospital and physicians. According to hospital administrators, the flexibility of the ACE Demonstration, particularly with regard to financial and organizational arrangements, was critical to the sites’ success in involving physicians and reorganizing operational and quality improvement processes. Change was introduced through revised and standardized orthopedic and cardiovascular protocols of care and standardized surgical order sets. Reductions in internal costs were driven by savings in implants and materials achieved through physician-led vendor negotiations. None of the sites provided gainsharing to non-physician hospital staff or other providers. An important finding is that beneficiaries did not choose a hospital because of the potential for shared savings, but rather because of hospital and physician reputation or the referring physician’s recommendation. Using Medicare inpatient and outpatient claims and beneficiary data from 2007 to 2012, IMPAQ conducted quantitative analyses, including difference-in-differences (DID) regressions to estimate the effect of the demonstration on a broad range of metrics. The evaluation showed that the demonstration increased the dollars’ worth non-acute care hospital services provided during inpatient episodes at ACE hospitals by more than 20 percent compared to the baseline. We did not observe significant changes in the average total PAC costs following inpatient episodes for ACE procedures, except for PCI episodes, where there was a 17 percent increase compared with pre-demonstration costs. The mix of PAC settings (skilled nursing facility vs. home health) and the average costs associated with them also did not change.

IMPAQ International, LLC Page 227 Evaluation of Medicare ACE Demonstration May 31, 2013 Final Evaluation Report
In most of the quality of care outcomes, process, and severity measures, the hypothesis that the ACE sites would maintain their level of care and patient mix were supported. This is an important and reassuring finding, which suggests that the infrastructure and organizational changes introduced because of the demonstration did not have negative consequences and that the safeguards at each site were effective in mitigating the risk to underprovide care that exists in a bundled payment program. It is possible that the relatively short duration of the demonstration may have contributed to the failure to see improvements in quality of care measures; in these cases, it may be a matter of time until the operational changes lead to improved outcomes. In a few instances, we observed improvements in the quality of care provided to the Medicare population, and there were also a few measures for particular procedure groups where we observed negative effects or adverse consequences, as hypothesized, due to the introduction of gainsharing. The findings are consistent with the hypotheses for the participating sites and for the non-demonstration treatment sites—the local market hospitals—thus confirming that the demonstration did not substantially alter local markets in terms of volume and quality of care measures. There was a negative impact on one outcome measure, the use of internal mammary artery (IMA) grafts in patients undergoing CABG surgery. Under the incentive to reduce cost (or operating room time), surgeons may have been moving away from a technically more complex approach, but one that has been shown to improve outcomes. One of the main concerns in the implementation of bundled payments is the introduction of adverse consequences; we had hypothesized that there might be declines in severity measures (patient mix) to obtain larger savings on a less sick population, reductions in length of stay, and higher transfers to post-acute care settings. We did not find pervasive negative effects across all procedures. Similar to previous bundled payment demonstrations, global increases in volume for participating sites were not realized except for defibrillator procedures, and, in fact, there was a decrease in volume for pacemaker procedures. The lack of volume change aligns with CMS’ expectations that the demonstration would not affect the local markets. Physicians did not change their preferences for place of surgery and in most instances they increased their share of procedures in ACE sites. During the physician focus groups, we learned that the physicians recognized that the demonstration’s quality improvements and protocols would provide higher quality care to their patients, and that this was a key factor in their choice of place of surgery beyond the potential for gainsharing. The volume analysis is one of the few instances where the site-specific analyses revealed that the global impacts masked site-specific heterogeneity in the effects. Thus, the ACE Demonstration met its objectives of maintaining or improving quality while allowing hospitals and physicians to introduce new protocols of care that could realize cost savings. Adverse consequences in transferring the burden to PAC settings were not realized nor changes in patient mix.

IMPAQ International, LLC Page 228 Evaluation of Medicare ACE Demonstration May 31, 2013 Final Evaluation Report
ACE sites expanded their strategies to other procedures (spine surgery) through more sophisticated arrangements with physicians (co-management agreements). As mentioned above, the innovations and cost savings from ACE were not exclusive to the Medicare program, but reached out to other payers (Medicare Advantage and private insurance).

IMPAQ International, LLC Page 229 Evaluation of Medicare ACE Demonstration May 31, 2013 Final Evaluation Report
APPENDICES

IMPAQ International, LLC Page 230 Evaluation of Medicare ACE Demonstration May 31, 2013 Final Evaluation Report
APPENDIX A: LIST OF ACE AND ACE-RELATED MS-DRGS
MS-DRG
Description ACE
Procedures
1 HEART TRANSPLANT OR IMPLANT OF HEART ASSIST SYSTEM W MCC
2 HEART TRANSPLANT OR IMPLANT OF HEART ASSIST SYSTEM W/O MCC
7 LUNG TRANSPLANT
163 MAJOR CHEST PROCEDURES W MCC
164 MAJOR CHEST PROCEDURES W CC
165 MAJOR CHEST PROCEDURES W/O CC/MCC
166 OTHER RESP SYSTEM O.R. PROCEDURES W MCC
167 OTHER RESP SYSTEM O.R. PROCEDURES W CC
168 OTHER RESP SYSTEM O.R. PROCEDURES W/O CC/MCC
215 OTHER HEART ASSIST SYSTEM IMPLANT
216 CARDIAC VALVE & OTH MAJ CARDIOTHORACIC PROC W CARD CATH W MCC Valve
217 CARDIAC VALVE & OTH MAJ CARDIOTHORACIC PROC W CARD CATH W CC Valve
218 CARDIAC VALVE & OTH MAJ CARDIOTHORACIC PROC W CARD CATH W/O CC/MCC Valve
219 CARDIAC VALVE & OTH MAJ CARDIOTHORACIC PROC W/O CARD CATH W MCC Valve
220 CARDIAC VALVE & OTH MAJ CARDIOTHORACIC PROC W/O CARD CATH W CC Valve
221 CARDIAC VALVE & OTH MAJ CARDIOTHORACIC PROC W/O CARD CATH W/O CC/MCC Valve
222 CARDIAC DEFIBRILLATOR IMPLANT W CARDIAC CATH W AMI/HF/SHOCK W MCC
223 CARDIAC DEFIBRILLATOR IMPLANT W CARDIAC CATH W AMI/HF/SHOCK W/O MCC
224 CARDIAC DEFIBRILLATOR IMPLANT W CARDIAC CATH W/O AMI/HF/SHOCK W MCC
225 CARDIAC DEFIBRILLATOR IMPLANT W CARDIAC CATH W/O AMI/HF/SHOCK W/O MCC
226 CARDIAC DEFIBRILLATOR IMPLANT W/O CARDIAC CATH W MCC Defibrillator
227 CARDIAC DEFIBRILLATOR IMPLANT W/O CARDIAC CATH W/O MCC Defibrillator
228 OTHER CARDIOTHORACIC PROCEDURES W MCC
229 OTHER CARDIOTHORACIC PROCEDURES W CC
230 OTHER CARDIOTHORACIC PROCEDURES W/O CC/MCC
231 CORONARY BYPASS W PTCA W MCC CABG
232 CORONARY BYPASS W PTCA W/O MCC CABG
233 CORONARY BYPASS W CARDIAC CATH W MCC CABG
234 CORONARY BYPASS W CARDIAC CATH W/O MCC CABG
235 CORONARY BYPASS W/O CARDIAC CATH W MCC CABG
236 CORONARY BYPASS W/O CARDIAC CATH W/O MCC CABG
237 MAJOR CARDIOVASC PROCEDURES W MCC OR THORACIC AORTIC ANEURYSM REPAIR
238 MAJOR CARDIOVASC PROCEDURES W/O MCC
239 AMPUTATION FOR CIRC SYS DISORDERS EXC UPPER LIMB & TOE W MCC

IMPAQ International, LLC Page 231 Evaluation of Medicare ACE Demonstration May 31, 2013 Final Evaluation Report
MS-DRG
Description ACE
Procedures
240 AMPUTATION FOR CIRC SYS DISORDERS EXC UPPER LIMB & TOE W CC
241 AMPUTATION FOR CIRC SYS DISORDERS EXC UPPER LIMB & TOE W/O CC/MCC
242 PERMANENT CARDIAC PACEMAKER IMPLANT W MCC Pacemaker
243 PERMANENT CARDIAC PACEMAKER IMPLANT W CC Pacemaker
244 PERMANENT CARDIAC PACEMAKER IMPLANT W/O CC/MCC Pacemaker
245 AICD GENERATOR PROCEDURES
246 PERC CARDIOVASC PROC W DRUG-ELUTING STENT W MCC OR 4+ VESSELS/STENTS PCI
247 PERC CARDIOVASC PROC W DRUG-ELUTING STENT W/O MCC PCI
248 PERC CARDIOVASC PROC W NON-DRUG-ELUTING STENT W MCC OR 4+ VES/STENTS PCI
249 PERC CARDIOVASC PROC W NON-DRUG-ELUTING STENT W/O MCC PCI
250 PERC CARDIOVASC PROC W/O CORONARY ARTERY STENT W MCC PCI
251 PERC CARDIOVASC PROC W/O CORONARY ARTERY STENT W/O MCC PCI
252 OTHER VASCULAR PROCEDURES W MCC
253 OTHER VASCULAR PROCEDURES W CC
254 OTHER VASCULAR PROCEDURES W/O CC/MCC
255 UPPER LIMB & TOE AMPUTATION FOR CIRC SYSTEM DISORDERS W MCC
256 UPPER LIMB & TOE AMPUTATION FOR CIRC SYSTEM DISORDERS W CC
257 UPPER LIMB & TOE AMPUTATION FOR CIRC SYSTEM DISORDERS W/O CC/MCC
258 CARDIAC PACEMAKER DEVICE REPLACEMENT W MCC Pacemaker
259 CARDIAC PACEMAKER DEVICE REPLACEMENT W/O MCC Pacemaker
260 CARDIAC PACEMAKER REVISION EXCEPT DEVICE REPLACEMENT W MCC Pacemaker
261 CARDIAC PACEMAKER REVISION EXCEPT DEVICE REPLACEMENT W CC Pacemaker
262 CARDIAC PACEMAKER REVISION EXCEPT DEVICE REPLACEMENT W/O CC/MCC Pacemaker
263 VEIN LIGATION & STRIPPING
264 OTHER CIRCULATORY SYSTEM O.R. PROCEDURES
265 AICD LEAD PROCEDURES
453 COMBINED ANTERIOR/POSTERIOR SPINAL FUSION W MCC
454 COMBINED ANTERIOR/POSTERIOR SPINAL FUSION W CC
455 COMBINED ANTERIOR/POSTERIOR SPINAL FUSION W/O CC/MCC
456 SPINAL FUS EXC CERV W SPINAL CURV/MALIG/INFEC OR 9+ FUS W MCC
457 SPINAL FUS EXC CERV W SPINAL CURV/MALIG/INFEC OR 9+ FUS W CC
458 SPINAL FUS EXC CERV W SPINAL CURV/MALIG/INFEC OR 9+ FUS W/O CC/MCC
459 SPINAL FUSION EXCEPT CERVICAL W MCC
460 SPINAL FUSION EXCEPT CERVICAL W/O MCC
461 BILATERAL OR MULTIPLE MAJOR JOINT PROCS OF LOWER EXTREMITY W MCC Orthopedic
462 BILATERAL OR MULTIPLE MAJOR JOINT PROCS OF LOWER EXTREMITY W/O MCC Orthopedic

IMPAQ International, LLC Page 232 Evaluation of Medicare ACE Demonstration May 31, 2013 Final Evaluation Report
MS-DRG
Description ACE
Procedures
463 WND DEBRID & SKN GRFT EXC HAND, FOR MUSCULO-CONN TISS DIS W MCC
464 WND DEBRID & SKN GRFT EXC HAND, FOR MUSCULO-CONN TISS DIS W CC
465 WND DEBRID & SKN GRFT EXC HAND, FOR MUSCULO-CONN TISS DIS W/O CC/MCC
466 REVISION OF HIP OR KNEE REPLACEMENT W MCC Orthopedic
467 REVISION OF HIP OR KNEE REPLACEMENT W CC Orthopedic
468 REVISION OF HIP OR KNEE REPLACEMENT W/O CC/MCC Orthopedic
469 MAJOR JOINT REPLACEMENT OR REATTACHMENT OF LOWER EXTREMITY W MCC Orthopedic
470 MAJOR JOINT REPLACEMENT OR REATTACHMENT OF LOWER EXTREMITY W/O MCC Orthopedic
471 CERVICAL SPINAL FUSION W MCC
472 CERVICAL SPINAL FUSION W CC
473 CERVICAL SPINAL FUSION W/O CC/MCC
474 AMPUTATION FOR MUSCULOSKELETAL SYS & CONN TISSUE DIS W MCC
475 AMPUTATION FOR MUSCULOSKELETAL SYS & CONN TISSUE DIS W CC
476 AMPUTATION FOR MUSCULOSKELETAL SYS & CONN TISSUE DIS W/O CC/MCC
477 BIOPSIES OF MUSCULOSKELETAL SYSTEM & CONNECTIVE TISSUE W MCC
478 BIOPSIES OF MUSCULOSKELETAL SYSTEM & CONNECTIVE TISSUE W CC
479 BIOPSIES OF MUSCULOSKELETAL SYSTEM & CONNECTIVE TISSUE W/O CC/MCC
480 HIP & FEMUR PROCEDURES EXCEPT MAJOR JOINT W MCC
481 HIP & FEMUR PROCEDURES EXCEPT MAJOR JOINT W CC
482 HIP & FEMUR PROCEDURES EXCEPT MAJOR JOINT W/O CC/MCC
483 MAJOR JOINT & LIMB REATTACHMENT PROC OF UPPER EXTREMITY W CC/MCC
484 MAJOR JOINT & LIMB REATTACHMENT PROC OF UPPER EXTREMITY W/O CC/MCC
485 KNEE PROCEDURES W PDX OF INFECTION W MCC
486 KNEE PROCEDURES W PDX OF INFECTION W CC
487 KNEE PROCEDURES W PDX OF INFECTION W/O CC/MCC
488 KNEE PROCEDURES W/O PDX OF INFECTION W CC/MCC Orthopedic
489 KNEE PROCEDURES W/O PDX OF INFECTION W/O CC/MCC Orthopedic
490 BACK & NECK PROC EXC SPINAL FUSION W CC/MCC OR DISC DEVICE/NEUROSTIM
491 BACK & NECK PROC EXC SPINAL FUSION W/O CC/MCC
492 LOWER EXTREM & HUMER PROC EXCEPT HIP,FOOT,FEMUR W MCC
493 LOWER EXTREM & HUMER PROC EXCEPT HIP,FOOT,FEMUR W CC
494 LOWER EXTREM & HUMER PROC EXCEPT HIP,FOOT,FEMUR W/O CC/MCC
495 LOCAL EXCISION & REMOVAL INT FIX DEVICES EXC HIP & FEMUR W MCC
496 LOCAL EXCISION & REMOVAL INT FIX DEVICES EXC HIP & FEMUR W CC
497 LOCAL EXCISION & REMOVAL INT FIX DEVICES EXC HIP & FEMUR W/O CC/MCC
498 LOCAL EXCISION & REMOVAL INT FIX DEVICES OF HIP & FEMUR W CC/MCC

IMPAQ International, LLC Page 233 Evaluation of Medicare ACE Demonstration May 31, 2013 Final Evaluation Report
MS-DRG
Description ACE
Procedures
499 LOCAL EXCISION & REMOVAL INT FIX DEVICES OF HIP & FEMUR W/O CC/MCC
503 FOOT PROCEDURES W MCC
504 FOOT PROCEDURES W CC
505 FOOT PROCEDURES W/O CC/MCC
506 MAJOR THUMB OR JOINT PROCEDURES
507 MAJOR SHOULDER OR ELBOW JOINT PROCEDURES W CC/MCC
508 MAJOR SHOULDER OR ELBOW JOINT PROCEDURES W/O CC/MCC
509 ARTHROSCOPY
510 SHOULDER,ELBOW OR FOREARM PROC,EXC MAJOR JOINT PROC W MCC
511 SHOULDER,ELBOW OR FOREARM PROC,EXC MAJOR JOINT PROC W CC
512 SHOULDER,ELBOW OR FOREARM PROC,EXC MAJOR JOINT PROC W/O CC/MCC
513 HAND OR WRIST PROC, EXCEPT MAJOR THUMB OR JOINT PROC W CC/MCC
514 HAND OR WRIST PROC, EXCEPT MAJOR THUMB OR JOINT PROC W/O CC/MCC
515 OTHER MUSCULOSKELET SYS & CONN TISS O.R. PROC W MCC
516 OTHER MUSCULOSKELET SYS & CONN TISS O.R. PROC W CC
517 OTHER MUSCULOSKELET SYS & CONN TISS O.R. PROC W/O CC/MCC
533 FRACTURES OF FEMUR W MCC
534 FRACTURES OF FEMUR W/O MCC
535 FRACTURES OF HIP & PELVIS W MCC
536 FRACTURES OF HIP & PELVIS W/O MCC
537 SPRAINS, STRAINS, & DISLOCATIONS OF HIP, PELVIS & THIGH W CC/MCC
538 SPRAINS, STRAINS, & DISLOCATIONS OF HIP, PELVIS & THIGH W/O CC/MCC
539 OSTEOMYELITIS W MCC
540 OSTEOMYELITIS W CC
541 OSTEOMYELITIS W/O CC/MCC
542 PATHOLOGICAL FRACTURES & MUSCULOSKELET & CONN TISS MALIG W MCC
543 PATHOLOGICAL FRACTURES & MUSCULOSKELET & CONN TISS MALIG W CC
544 PATHOLOGICAL FRACTURES & MUSCULOSKELET & CONN TISS MALIG W/O CC/MCC
548 SEPTIC ARTHRITIS W MCC
549 SEPTIC ARTHRITIS W CC
550 SEPTIC ARTHRITIS W/O CC/MCC
551 MEDICAL BACK PROBLEMS W MCC
552 MEDICAL BACK PROBLEMS W/O MCC
553 BONE DISEASES & ARTHROPATHIES W MCC
554 BONE DISEASES & ARTHROPATHIES W/O MCC
559 AFTERCARE, MUSCULOSKELETAL SYSTEM & CONNECTIVE TISSUE W MCC

IMPAQ International, LLC Page 234 Evaluation of Medicare ACE Demonstration May 31, 2013 Final Evaluation Report
MS-DRG
Description ACE
Procedures
560 AFTERCARE, MUSCULOSKELETAL SYSTEM & CONNECTIVE TISSUE W CC
561 AFTERCARE, MUSCULOSKELETAL SYSTEM & CONNECTIVE TISSUE W/O CC/MCC
562 FX, SPRN, STRN & DISL EXCEPT FEMUR, HIP, PELVIS & THIGH W MCC
563 FX, SPRN, STRN & DISL EXCEPT FEMUR, HIP, PELVIS & THIGH W/O MCC
564 OTHER MUSCULOSKELETAL SYS & CONNECTIVE TISSUE DIAGNOSES W MCC
565 OTHER MUSCULOSKELETAL SYS & CONNECTIVE TISSUE DIAGNOSES W CC
566 OTHER MUSCULOSKELETAL SYS & CONNECTIVE TISSUE DIAGNOSES W/O CC/MCC

IMPAQ International, LLC Page 235 Evaluation of Medicare ACE Demonstration May 31, 2013 Final Evaluation Report
APPENDIX B: PRIMARY AND SECONDARY IMPLEMENTATION ELEMENTS
1. Primary and Secondary Implementation Elements
A comparative analysis of each research domain uncovered key elements or tools that drove ACE-inspired strategies and aided sites to realize cost savings and quality and coordination of care goals. The core implementation elements can be categorized into primary and secondary elements/tools to demonstrate their association with the research domains. As shown in Exhibit B-1, primary elements are elements that are a direct result of, or were developed directly for, the research domain. Secondary elements are those elements that are an indirect effect or byproduct of the domain. For instance, gainsharing mechanisms were developed as a direct result of the need for physician incentives to encourage participation. Transparency of data, through physician report cards, had an indirect effect or was a complementary but secondary mechanism to generate incentives, because they encouraged physicians to evaluate their quality and cost metrics and to compare them with those of their peers. Several implementation elements/tools were present across the research domains and served as drivers to achieve demonstration goals. Because satisfaction occurred across all domains and was dependent upon personal preference and experience, we excluded it from the matrix.
Exhibit B-1: Research Domains and Demonstration Elements
Quality and Coordination of
Care
Medicare Costs and Savings
Volume Infrastructure and Organization
Incentives
Primary Elements
Standardization of processes and procedures (order sets) Change in staffing (patient navigator) Data transparency (physician report cards, health IT)
Vendor negotiations Data transparency (physician report cards, health IT)
Marketing efforts
ACE boards/committees Change in staffing (patient navigator) Co-management agreements Standardization of processes and procedures (order sets)
Gainsharing Shared savings Co-management agreements
Secondary Elements
Gainsharing ACE boards/committees
Standardization of processes and procedures (order sets) Co-management agreements ACE boards/committees
Vendor negotiations Data transparency (physician report cards, health IT)
Data transparency (physician report cards, health IT) Co-management agreements
Note: Italicized items are examples of corresponding demonstration elements.

IMPAQ International, LLC Page 236 Evaluation of Medicare ACE Demonstration May 31, 2013 Final Evaluation Report
To capture the effects of the primary and secondary elements and to further demonstrate the maturation of the demonstration from its initial implementation phase to the more established maintenance phase, Appendices B.2–B.7 compare the findings of the two site visits using matrices. These matrices categorize qualitative learning by research domain. Each research domain is divided into subtopics that define the major areas of interest. These subtopics guided the development of our research questions. Moreover, we further segment our qualitative findings by respondent: (1) administrators and physicians, (2) non-physician staff, and (3) beneficiaries. For the purposes of this report, we grouped administrators and physicians together because their demonstration strategies, goals, and objectives were similar. Exhibit B-2 provides an example of the comparison matrices found in Appendices B.2–B.7.
Exhibit B-2: Comparison Matrix Example
Audience Site Visit 1 Site Visit 2 Comparison of Site Visits
Administrators and Physicians
- Sites worked toward standardization of order sets or refining them where already implemented.
- Sites implemented and improved upon standardization of order sets.
- Sites attempted to develop and/or implement standardization of surgical procedures in other departments for non-ACE DRGs.
Similarities Between Site Visits - A consistent tool across the sites
was the use and improvement of standardized order sets.
Differences from Site Visit 1 to Site Visit 2 - Some sites expanded or improved
upon standardization in other service lines.

IMPAQ International, LLC Page 237 Evaluation of Medicare ACE Demonstration May 31, 2013 Final Evaluation Report
2. Quality and Coordination of Care
Exhibit B-3: Quality and Coordination of Care Matrices
Audience Site Visit 1 Site Visit 2 Comparison of Site Visits
Quality Improvement Initiatives Administrators and Physicians
- Sites worked toward standardization of order sets or refining them where already implemented.
- Administrators increased quality data transparency; more frequent and open communication regarding quality outcomes with physicians.
- Sites introduced patient navigators across all ACE DRGs.
- Majority of physicians did not expect significant quality improvements; most believed there was little room for improvement at their site.
- Sites implemented administrator and staff committees/meetings to coordinate quality improvement strategies.
- Sites implemented and improved upon standardization of order sets.
- Some physicians developed and/or implemented standardization of surgical procedures in other departments for non-ACE DRGs.
- Administrators faced difficulty in maintaining the initial level of motivation among physicians to improve quality.
- Successes in ACE procedures allowed and motivated sites to concurrently pursue accreditations (such as Center of Excellence and Joint Commission); these were additional factors/ motivators for quality improvement.
- Sites continued committees/meetings.
Similarities Between Site Visits - Standardized order sets remained a constant quality
tool across the sites. - Sites continued administrator and staff ACE
committees/meetings.
Differences from Site Visit 1 to Site Visit 2 - Standardized order sets were expanded or improved
upon in other service lines at some sites. - Administrators faced difficulty in maintaining the
initial level of motivation among physicians to improve quality.
- Physicians felt less hesitation to acknowledge ACE as a facilitator of culture change regarding discussions about and interest in quality.
- Some sites pursued accreditations which served as additional motivators for quality improvement.
Non-Physician Staff
- Most non-management staff were unaware of quality-related ACE strategies.
- Staff connected positive effects of ACE on quality strategies currently/ previously in place.
- Staff believed that quality was already high and that ACE quality initiatives would have little effect.
- Joint Club was seen as an orthopedic quality improvement tool.
- Most non-management staff were unaware of quality-related ACE strategies.
- Staff viewed standardized order sets as the main driver of improvement in quality and service delivery.
- Joint Club (and sufficient space for one) was seen as an orthopedic quality improvement tool.
Similarities Between Site Visits - Non-management staff tended not to know about
specific ACE strategies, possibly resulting in weak follow-through on such strategies.
- Joint Club served as a valuable quality improvement tool.
Differences from Site Visit 1 to Site Visit 2 - Staff placed less emphasis on the positive effects of
ACE initiatives on quality of care. - Staff placed more emphasis on standardized order
sets and their benefits.

IMPAQ International, LLC Page 238 Evaluation of Medicare ACE Demonstration May 31, 2013 Final Evaluation Report
Audience Site Visit 1 Site Visit 2 Comparison of Site Visits
Measures Monitoring and Reporting Administrators and Physicians
- Administrators reported measures to physicians at monthly meetings; growing eagerness among physicians to review data and compare performance information with colleagues.
- Sites with fewer physicians had greater ease tracking, sharing data, and immediately acting on “red flags” with “outlier” physicians and/or cases.
- Cost/quality report cards seemed to drive improvements in quality metrics (incentive to improve was enhanced through gainsharing policies).
- Physicians were motivated to monitor each other’s performance due to some group performance constraints on gainsharing.
- Administrators noted that producing timely quality and cost data was a challenge, because most data were not available in real time and needed to be extracted manually.
- Measures were reported to physicians at formal meetings (monthly at most sites).
- Administrators and physicians were interested in looking beyond ACE measures to outcomes-based measures (ACE measures were mainly process-based).
- Distributing cost/quality report cards was a motivator for improvement for physicians; however some physicians felt less motivated by gainsharing due to caps on gainsharing and other policies.
- Physicians appreciated greater data transparency.
- Physicians monitored each other’s performance as a result of facility and/or system-wide gainsharing criteria.
- ACE quality goals helped propel sites to focus more attention on readmission rates and causes, among other factors.
- Administrators stated that producing timely quality and cost data was a challenge to quality improvement.
Similarities Between Site Visits - Report card incentive system remained the same;
kept physicians informed and accountable. - Physicians monitored each other. - Measures were reported monthly. - Administrators faced difficulty in producing
quality/cost data easily and in real time; many sites had to extract data manually.
Differences from Site Visit 1 to Site Visit 2 - More physicians bought in to quality measures; level
of buy-in differed by site. - Physicians and administrators worked to incorporate
outcomes-based metrics into data reporting and monitoring.
- While report cards were effective, some physicians felt less motivated by gainsharing.
- Physicians expressed increased appreciation for greater data transparency, which allowed them to better monitor and analyze cost and quality of care.
Non-Physician Staff
- Some staff observed improvements in specific metrics, e.g., readmission rates. (Quantitative analysis of quality changes conducted after the first year of the demonstration showed varying results.)
- Staff noted that ACE was in the “maintenance” phase, compared to the “implementation” phase.
- Some staff noted an increased desire and action to apply ACE-specific quality measures to other departments.
- Staff believed that greater data transparency improved awareness and raised priority of quality goals among staff.
Similarities Between Site Visits - Staff tended to focus on specific department/ site
metrics. Differences from Site Visit 1 to Site Visit 2 - Staff possessed new mentality in ACE “maintenance”
phase. - Some staff observed ACE quality goals and strategies
trickling down to other service lines of the sites. - Data transparency played a growing role in
awareness and raised priority of quality goals among staff.

IMPAQ International, LLC Page 239 Evaluation of Medicare ACE Demonstration May 31, 2013 Final Evaluation Report
Audience Site Visit 1 Site Visit 2 Comparison of Site Visits
Coordination of Care Administrators and Physicians
- For administrators, efficiency was not as big a target as focusing on the quality measures.
- At sites where standardization of order sets was new, there was significant emphasis on the benefits of this approach to coordinating care and the potential to increase efficiency.
- Some administrators and physicians linked improved coordination of care to decreases in length of stay; however, some believed this connection was not accurate.
- Administrators and physicians emphasized that all patients, regardless of ACE, should receive the same care.
- Process of care became more efficient due to standardized order sets.
- For orthopedics, Joint Club (or similar) programs were factors in improved coordination of care.
- Physicians noted heightened awareness of non-physician staff following the order sets and meeting quality metrics.
- Some administrators and physicians linked improved coordination of care to decreases in length of stay; however, others believed the connection could not be made.
- Administrators and physicians emphasized that ACE and non-ACE patients should receive the same care.
Similarities Between Site Visits - Some believed that improved coordination of care
could be linked to decreases in length of stay. - Administrators and physicians continued to
emphasize providing the same care to ACE and non-ACE patients.
Differences from Site Visit 1 to Site Visit 2 - Standardized order sets increased efficiency of care,
allowing and motivating physicians to focus on other efficiency strategies such as proactively responding to outliers and working with staff to communicate and monitor quality goals.
Non-Physician Staff
- Sites introduced patient navigators to coordinate each case.
- Staff expressed ambiguity regarding benefit (or role) of patient navigators.
- Staff noted need for stronger administration backing of coordination of care efforts, to be more effective.
- Some staff felt pressured to devise means of coordination without adequate staffing.
- Staff did not know the difference between ACE and non-ACE patients; this was encouraged by administrators.
- Patient navigators smoothed the process from start to finish for each patient; communicated outliers or missed quality measures to physicians and other staff.
- At some sites, patient navigators were refocused to orthopedics (DRGs with larger cost and quality returns).
- Patient navigators were seen as important coordination agents.
- Staff reported improvements in communication with physicians and in staff relationships (varied by site/service line).
- Staff felt continued pressure to devise means of coordination without sufficient staffing.
- Aside from patient navigators, staff were unaware of which patients were ACE beneficiaries.
Similarities Between Site Visits - Patient navigators continued to follow ACE patients
throughout stay. - Staff understanding of patient navigators varied, but
where utilized they were viewed as valuable to patient outcomes.
- Some staff felt pressure to devise means of coordinating to decrease length of stay, without sufficient resources.
- Staff were unaware of which patients were ACE beneficiaries, which was welcomed by administrators.
Differences from Site Visit 1 to Site Visit 2 - Staff emphasized improvements in communication
with physicians and with other staff. - Value of patient navigators was recognized.

IMPAQ International, LLC Page 240 Evaluation of Medicare ACE Demonstration May 31, 2013 Final Evaluation Report
Audience Site Visit 1 Site Visit 2 Comparison of Site Visits Beneficiaries - Beneficiaries were satisfied with quality
of care at the sites; however, they did not recognize coordination efforts.
- Beneficiaries were satisfied with quality of care at the sites; in some cases, beneficiaries observed and commented on excellent coordination of care during their stay.
Similarities Between Site Visits - Beneficiaries tended to be satisfied with quality of
care.
Differences from Site Visit 1 to Site Visit 2 - In some cases, beneficiaries had greater recognition
of coordination of care efforts.

IMPAQ International, LLC Page 241 Evaluation of Medicare ACE Demonstration May 31, 2013 Final Evaluation Report
3. Medicare Cost Savings
Exhibit B-4: Medicare Cost Savings Matrices
Audience Site Visit 1 Site Visit 2 Comparison of Site Visits
Equipment and Products Administrators and Physicians
- ACE facilitated collaboration between administrators and physicians in negotiating with vendors on pricing of implants and other equipment; vendor negotiations were seen as the main driver of cost savings.
- Physicians compared and standardized medical equipment where possible; significant in the success of negotiations with vendors.
- Almost all administrators were enthusiastic about importance of ACE in aligning physician and hospital interests to effectively consolidate their buying power. Physicians became more engaged and interested in reviewing their costs.
- Cost savings tended to be higher for orthopedic procedures due to the greater impact of reduced implant prices on procedure costs.
- Materials managers at most sites were involved in spearheading negotiations and other analyses of equipment costs to achieve savings.
- Materials managers or other administrators regularly reviewed equipment and supplies cost data to find other opportunities to cut costs.
- Physicians noted that while more efficient tools were developed to monitor and communicate costs, strategies to control costs through vendor negotiations slowed.
- Physicians utilized best practices and evidence-based research in their decisions to standardize protocols and equipment.
- Product standardization was more challenging for service lines with multiple physician groups as a result of varying opinions and needs, particularly the cardiology service line, which used many vendors and products.
- Transparency of equipment and product cost data allowed physicians to recognize cost variability, which influenced their negotiation decisions and product use.
- Materials managers at most sites continued to work with physicians to negotiate and conduct analyses of equipment costs in order to achieve savings.
- Partnerships between materials managers and physicians led to multidivisional agreements between vendors and hospitals at some sites.
- Some physicians worked to achieve cost-savings efforts by decreasing length of stay.
- No specific strategies for physicians to communicate/work directly with staff on cost containment.
Similarities Between Site Visits - Vendor negotiations had the most
significant impact on cost savings in both specialty groups.
- Physicians became more involved in the cost-saving and negotiations processes.
- Materials managers and physicians worked in partnership to drive costs down, particularly while negotiating with vendors.
- The standardization of equipment and materials contributed to cost savings.
- Cardiology product standardization was more difficult than orthopedic product standardization.
Differences from Site Visit 1 to Site Visit 2 - Vendor negotiations leveled off; new cost
strategies were needed to achieve the same or greater cost savings.
- Emphasis on new strategies diminished; more focus on maintaining gains made in prior year.
- Greater transparency of data (through more efficient means) increased physician and staff awareness of costs. Some sites placed greater emphasis on length of stay as a determinant of cost.

IMPAQ International, LLC Page 242 Evaluation of Medicare ACE Demonstration May 31, 2013 Final Evaluation Report
Audience Site Visit 1 Site Visit 2 Comparison of Site Visits Non-Physician Staff
- Staff noticed changes in the equipment and products used at the site. Some staff members attributed these changes to ACE and cited ACE as a catalyst for the ability to negotiate vendor contracts.
- At a few sites, non-physician staff were involved in either identifying opportunities to save on equipment and supplies or participated in discussions with physicians and administrators about costs.
- Sites did not report including non-physician staff in cost saving measures related to purchasing.
Similarities Between Site Visits - Non-physician staff believed that ACE has
improved cost-saving efforts, particularly through vendor negotiations.
Differences from Site Visit 1 to Site Visit 2 - Involvement of staff in cost reduction
strategies through purchasing decreased.
Efficiency Administrators and Physicians
- Most sites reported that patient length of stay was not affected by ACE. Two sites indicated an indirect relationship to length of stay although there were differing opinions about the relationship and effect of ACE.
- Physicians employed by hospital system noted a high level of attention to efficiency.
- Physician gainsharing was used to retain physicians at the system/facility and increase efficiency.
- Standardized order sets allowed better coordination and efficiency.
- Administrators noted that they were more efficient at analyzing and communicating quality and cost data to physicians as a result of ACE, especially at sites with electronic data reporting systems.
- Patient length of stay did not change as a direct result of ACE; however ACE was believed to be a catalyst for the decrease in length of stay at some sites due to efficiencies brought about by ACE.
- Physician gainsharing was used to retain physicians at the system/facility and increase efficiency.
Similarities Between Site Visits - Physician employment the by facility was
seen to increase “ownership” of procedures and efficiency.
- Gainsharing had significant effects on physician efficiency.
Differences from Site Visit 1 to Site Visit 2 - Standardized order sets were seen as a
driver of efficiency rather than a cost savings effort.
- ACE was believed to be a catalyst for the decrease in length of stay at some sites due to efficiencies brought about by the demonstration.
Non-Physician Staff
- Patient navigators helped streamline patient experiences.
- Standardized order sets led to better care coordination.
- Patient navigators enhance efficiencies across systems.
- Standardized order sets helped to reduce human error and improve efficiency.
- While strategies at some sites, such as standardized order sets and the evolution of Joint Clubs, were not directly to the result of
Similarities Between Site Visits - Standardized order sets made patient
care more efficient. - Patient navigators helped make
procedures run more smoothly.
Differences from Site Visit 1 to Site Visit 2 - ACE was seen as a catalyst to improve

IMPAQ International, LLC Page 243 Evaluation of Medicare ACE Demonstration May 31, 2013 Final Evaluation Report
Audience Site Visit 1 Site Visit 2 Comparison of Site Visits
ACE, the demonstration improved efficiencies within these processes.
- ACE was a catalyst for staff and physician awareness of the time and cost of surgical procedures.
efficiencies of processes. - More awareness among staff and
physicians of the time and cost of surgical procedures.
Provision of Services Administrators and Physicians
- Both administrators and physicians referred back to quality in discussions about cost and underlined the necessity of prioritizing quality over cost in providing patient care.
- Physicians and administrators believed that the exclusion of several cardiovascular outpatient procedures was an obstacle to achieving greater cost savings in the cardiovascular demonstration (primarily DRG 247: percutaneous cardiovascular procedure with drug-eluting stent without MCC).
- Administrators and physicians expressed that their job was to provide the best quality of care available since they felt that cost often required tradeoffs that undermined the sites’ focus on positive patient outcomes and experience. However, when equivalent quality of care could be provided at lesser cost, the lesser cost route should be taken
- Physicians focused on decreasing length of stay and encouraging discharge to home.
- Transparency with physicians about costs was a major strategy in reinforcing surgical protocol efficiencies and evidence-based practices.
- Physicians and administrators believed that the exclusion of several cardiovascular outpatient procedures was an obstacle to achieving greater cost savings in the cardiovascular demonstration.
Similarities Between Site Visits - Quality over cost was repeatedly
emphasized, perhaps as a shield, but also as a legitimate driver of positive patient experiences.
- Physicians were frustrated that several cardiovascular outpatient procedures were excluded from the demonstration.
Differences from Site Visit 1 to Site Visit 2 - Many physicians began focusing on
decreasing length of stay. - Transparency with physicians about costs
became more important.
Non-Physician Staff
- No specific process existed to encourage staff to control costs related to service utilization.
- No specific process existed to encourage staff to control costs in providing services.
- Cost savings was not a communication focus with staff in the same way that quality and coordination of care were emphasized.
- There was more of an ACE-influenced quality and cost-savings “culture.”
Similarities Between Site Visits - No specific process existed to encourage
staff to control costs related to service utilization.
Differences from Site Visit 1 to Site Visit 2 - There was more of an ACE-influenced
quality and cost-savings “culture.”

IMPAQ International, LLC Page 244 Evaluation of Medicare ACE Demonstration May 31, 2013 Final Evaluation Report
4. Volume, Concentration, and Spillover
Exhibit B-5: Volume, Concentration, and Spillover Matrices
Audience Site Visit 1 Site Visit 2 Comparison of Site Visits
Provision of Services Administrators and Physicians
- Slight increases in patient volume were often attributed not to ACE but rather to physician reputation/referrals, the hospital itself, or other external factors.
- A small number of physicians discontinued practicing at ACE sites due to their unwillingness to participate in ACE; thus, these sites saw slight decreases in volume, at least initially.
- For most physicians, volume remained stable.
- ACE has not driven changes in the number or types of procedures (orthopedic or cardiovascular).
- Any slight increases in patient volume were attributed to physician referrals, the hospital itself, or other external factors.
- ACE has not motivated physicians to perform procedures at ACE sites.
- ACE has not caused physicians to discontinue practicing at ACE sites; therefore, this has not affected volume or provision of services.
Similarities Between Site Visits - ACE did not result in increases in patient
volume. - ACE did not affect the location or the way
in which physicians practice.
Differences from Site Visit 1 to Site Visit 2 - Unlike the first year, volume changes that
occurred at some sites during the second and third years of the demonstration were not attributed to physician attrition as a result of ACE or to ACE itself.
Non-Physician Staff
- Difficult to attribute increased patient volume to ACE because staff could not distinguish which patients were ACE patients.
- Any slight increases in patient volume were attributed to the hospital itself and not ACE.
- No changes in the provision of services. - No changes in the way staff treated and
interacted with patients.
- Any increases in patient volume were not attributed to ACE since staff could not distinguish which patients were ACE patients.
- No changes in the number or types of procedures associated with ACE.
- No changes in the way staff treated and interacted with patients.
Similarities Between Site Visits - Staff were not aware of which patients
were ACE patients. - No changes in the number or types of
procedures associated with ACE. - No changes, as a result of ACE in how staff
treated and interacted with patients. - Increases in patient volume were not
attributed to ACE.
Volume Expectations and Marketing Administrators and Physicians
- Administrators and physicians at all sites expected an increase in patient volume and cited volume as a motivator for participating in ACE.
- None of the participants observed the anticipated increase in patient volume
- Expectations about increases in volume as a result of ACE were not met.
- No expectations for future increases in volume due to ACE (and, therefore, no expectation of increased Medicare market share).
Similarities Between Site Visits - Volume expectations were not met. - Perceived inadequate marketing by CMS
and inadequate motivation for patients are thought to have negatively affected potential for volume increases.

IMPAQ International, LLC Page 245 Evaluation of Medicare ACE Demonstration May 31, 2013 Final Evaluation Report
Audience Site Visit 1 Site Visit 2 Comparison of Site Visits
Provision of Services associated with ACE.
- Administrators reported two main barriers to volume increases: insufficient marketing efforts and inadequate motivation for patients.
- All sites developed ACE marketing campaigns, but disbanded them once it became clear that they were ineffective.
- Many sites attributed a lack of volume increase to CMS not sufficiently marketing ACE as had been expected.
- Some sites expected that marketing of ACE by CMS would lead to increased Medicare market share.
- Administrators mentioned CMS-imposed limitations on marketing language and a limited marketing budget hindered adequate patient education about ACE.
- Administrators noted two barriers to volume increase: inadequate marketing and inadequate motivation for patients.
- Some sites redirected marketing efforts to focus on patient procedure-based seminars.
- Potential volume increases no longer motivated administrators and physicians to continue participation in ACE; quality of care and cost savings were cited as motivating factors.
- Many sites noted that CMS’ lack of ACE marketing and its marketing regulations impeded expected volume increases.
- Belief that lack of volume increases, and therefore lack of increased Medicare market share, was attributable to CMS not sufficiently marketing ACE.
Differences from Site Visit 1 to Site Visit 2 - Marketing efforts at some sites were
redirected to focus on patient procedure-based seminars.
- Sites were no longer motivated by potential volume increases.
Non-Physician Staff
- Non-physician staff were told to expect a large increase in patient volume as a result of ACE; however, the expected increase in volume did not occur.
- Staff reported that few, if any, patients were aware of or asked about ACE.
- Expectations about increase in patient volume as a result of ACE were not met.
- Staff reported limited patient awareness of ACE.
Similarities Between Site Visits - Expected increase in volume as a result of
ACE was not seen. - Few patients were aware of ACE or spoke
with staff about it.
Beneficiaries - Beneficiaries were generally unaware of ACE across all sites.
- Beneficiaries selected a hospital based on quality of care, reputation of the hospital, and reputation of the physician, not because of ACE or the opportunity to receive a shared savings payment.
- Beneficiaries were unaware of ACE prior to, and often after, their procedure.
- ACE was not a factor in choosing the hospital; beneficiaries selected a hospital based on quality of care, reputation of the hospital, and reputation of the physician; emergent situations often dictated location as well.
Similarities Between Site Visits - Beneficiaries were generally unaware of
ACE. - ACE did not influence beneficiaries’
hospital choice; hospital’s quality of care and reputation and physician’s reputation influenced choice of location.

IMPAQ International, LLC Page 246 Evaluation of Medicare ACE Demonstration May 31, 2013 Final Evaluation Report
5. Incentives
Exhibit B-6: Incentives Matrices
Audience Site Visit 1 Site Visit 2 Comparison of Site Visits
Volume Administrators and Physicians
- Administrators noted that neither gainsharing nor the beneficiary shared savings payments drove volume to ACE sites.
- Physicians who did not have high volumes of ACE patients often expressed indifference to gainsharing.
- Administrators stated that neither gainsharing nor the beneficiary shared savings payments drove volume to ACE sites.
- Physicians who did not have high volumes of ACE patients tended to be more indifferent to gainsharing
Similarities Between Site Visits - Neither gainsharing nor the beneficiary
shared savings payments drove volume to ACE sites.
- Physicians who did not have high volumes of ACE patients were generally indifferent to gainsharing.
Beneficiaries - Beneficiaries stated that the Medicare shared savings payment was not a motivating factor in choosing an ACE site for their procedures.
- Beneficiaries stated that there were no in-kind (non-financial) benefits offered to beneficiaries at ACE sites.
- Most beneficiaries did not know about ACE or why they received a Medicare shared savings payment.
- Many beneficiaries did not become aware of ACE until they received the IMPAQ letter inviting them to the focus groups.
- Beneficiaries who received a shared savings check stated that it was not a motivating factor in choosing an ACE site for their procedures.
- Beneficiaries stated that there were no in-kind benefits offered at ACE sites.
- Beneficiaries agreed that even if they had known about the Shared
- Savings payment beforehand, it would not have influenced their choice of hospital.
- Most beneficiaries were not aware of ACE before or during their procedures.
Similarities Between Site Visits - Medicare shared savings checks were not a
motivating factor in choosing an ACE site for beneficiaries.
- No in-kind (non-financial) benefits were offered to beneficiaries at ACE sites.
- Most beneficiaries were not aware of ACE before or during their procedures.
Cost Administrators and Physicians
- Administrators reported that cardiac physicians received little to no gainsharing because they primarily performed outpatient procedures; this was seen as a lost opportunity.
- Physicians who received gainsharing stated that gainsharing had inspired “friendly competition.”
- Cardiac physicians at many of the sites noted that they did not receive gainsharing because they were hospital employees.
- Physicians who received gainsharing stated that gainsharing had inspired “friendly competition.”
- Employed physicians noted that they had little incentive to participate in ACE
Similarities Between Site Visits - Gainsharing inspired “friendly
competition.” - Cardiac physicians at many of the sites did
not receive gainsharing, because they were hospital employees.
Differences from Site Visit 1 to Site Visit 2 - Physicians indicated that they might be
encouraged to meet all quality and cost

IMPAQ International, LLC Page 247 Evaluation of Medicare ACE Demonstration May 31, 2013 Final Evaluation Report
Audience Site Visit 1 Site Visit 2 Comparison of Site Visits because they did not receive gainsharing.
- Physicians who received gainsharing said they might be encouraged to meet all quality and cost metrics if gainsharing percentages were higher.
metrics if gainsharing percentages were higher.
Quality Administrators and Physicians
- Some physicians expressed ethical concerns with gainsharing because they did not feel it was appropriate to receive additional money for performing their regular duties.
- At most sites, gainsharing encouraged physicians to collaborate and agree on standardized order sets/protocols since physicians who did not follow the protocol would not receive gainsharing.
- At many sites, physicians stated that they received a report card with quality and cost metrics. These metrics were often tied to their eligibility to receive gainsharing.
- At most sites, gainsharing encouraged physicians to collaborate and agree on standardized order sets/protocols since physicians who did not follow the protocol would not receive gainsharing.
- At many sites, physicians stated that they received a score card with quality and cost metrics. These metrics were often tied to their eligibility to receive gainsharing. Many physicians found that gainsharing served as a catalyst for increased communication between physicians.
Similarities Between Site Visits - Gainsharing encouraged physicians to
collaborate and agree on standardized order sets/protocols since physicians who did not follow the protocol would not receive gainsharing.
- At many sites, physicians receive a score card with quality and cost metrics, which were often tied to their eligibility to receive gainsharing.
- Physicians found that gainsharing served as a catalyst for increased communication between physicians.
Coordination and Allocation of Incentives
Administrators andPhysicians
- Some administrators and physicians reported difficulty allocating/estimating gainsharing. Implementation issues with the Medicare administrative contractor caused some delays in receiving gainsharing.
- Physicians suggested an increase in the amount of gainsharing that physicians receive (capped at 50% rather than 25% of their Medicare Part B claims).
- Administrators noted that many physicians were ineligible (employed physicians) to receive gainsharing.
- Physicians suggested an increase in the amount of gainsharing that physicians receive (capped at 50% rather than 25% of their Medicare Part B claims).
- Administrators noted that many physicians were ineligible (employed physicians) to received gainsharing, and that there was little incentive for employed physicians to be motivated by ACE since they did not receive gainsharing.
Similarities Between Site Visits - Physicians suggested an increase in the
amount of potential gainsharing, which would increase motivation to achieve quality and cost metrics.
- Physicians who were ineligible (employed physicians) to receive gainsharing had little incentive to be motivated by ACE and were dissatisfied with gainsharing policies.
Differences from Site Visit 1 to Site Visit 2 - Difficulties in allocating/estimating
gainsharing were addressed.
Non-Physician Staff
- Non-physician staff stated that they did not receive financial or other benefits, though one site proposed gainsharing for non-
- Non-physician staff stated that they did not receive financial or other benefits.
Similarities Between Site Visits - Non-physician staff did not receive
financial or other benefits.

IMPAQ International, LLC Page 248 Evaluation of Medicare ACE Demonstration May 31, 2013 Final Evaluation Report
Audience Site Visit 1 Site Visit 2 Comparison of Site Visits physician staff.
- Many staff noted that they would welcome a mechanism to share savings in the form of training or education.
Differences from Site Visit 1 to Site Visit 2 - Non-physician staff did not mention desire
to receive incentives.
Beneficiaries - Some beneficiaries noted that they experienced long delays between their procedure date and receiving an incentive check.
- Most had received a Medicare shared savings payment; however most were unaware that they would receive the check.
- Some beneficiaries noted that they experienced long delays between their procedure date and receiving an incentive check.
- Most beneficiaries had received a Medicare shared savings payment; however most were unaware that they would receive the check.
Similarities Between Site Visits - Some beneficiaries experienced long
delays between their procedure date and receiving an incentive check.
- Most beneficiaries who received a shared savings payment were unaware that they would receive the check.

IMPAQ International, LLC Page 249 Evaluation of Medicare ACE Demonstration May 31, 2013 Final Evaluation Report
6. Infrastructure and Organization
Exhibit B-7: Infrastructure and Organization Matrices
Audience Site Visit 1 Site Visit 2 Comparison of Site Visits
Leadership Administrators and Physicians
- Many administrators and physicians noted improvement in communication and collaboration between physicians and administrators as a result of ACE.
- Most sites provided trainings and education about ACE to physicians.
- Securing physician support was a high priority for administrators at all sites.
- Committees and other meetings were implemented to support collaboration between administrators, physicians, and, in some cases, non-physician staff.
- Some sites were characterized by a high-volume ACE physician who championed the demonstration and encouraged adherence to the demonstration goals.
- Administrators noted the difficulties involved in communicating about ACE to stakeholders; the complexity of the program made it challenging to provide adequate training and education.
- All sites had an ACE liaison or manager who communicated with CMS and various stakeholders at the site about ACE.
- Many administrators and physicians noted improved communication as a result of ACE.
- Demonstration was said to have reached maintenance phase (compared to implementation phase).
- With physician support secured, administrators allowed physicians to drive quality and cost goals.
- Committees were maintained, but the frequency of meetings decreased.
- A chief medical officer or other high-level administrator at some sites was key for involvement in quality reviews and physician peer review activities.
- Physicians who championed the demonstration and encouraged adherence to goals were seen as important factors in maintaining staff support and improving policies and procedures to meet ACE goals.
- ACE liaison or manager communicated with CMS and various stakeholders.
Similarities Between Site Visits - In some instances, ACE drove improved
communication between physicians and administrators.
- Physician champions served as important leaders.
- Committees at all levels were maintained, but meetings were less frequent.
- ACE liaison managed all communication with CMS and various stakeholders.
Differences from Site Visit 1 to Site Visit 2 - Sites shifted from implementation to
maintenance of ACE. - Administrators were less focused on
educating/training stakeholders on ACE. - Administrators refocused efforts from
securing physician participation to supporting physician leadership during the demonstration.
- Frequency of meetings decreased. - At some sites, a chief medical officer or
other high-level administrator was important to quality reviews/follow-up with physicians.
Non-Physician Staff
- Staff at several sites wished that there had been more education/training on ACE. This resulted in varying levels of knowledge, with some reporting that they did not feel comfortable informing patients about ACE.
- Staff reported varying levels of knowledge about ACE, and some wished that they had been included in the planning and implementation process.
Similarities Between Site Visits - Staff possessed varying levels of knowledge
about ACE. - Staff desired to be more involved in
planning and implementation.

IMPAQ International, LLC Page 250 Evaluation of Medicare ACE Demonstration May 31, 2013 Final Evaluation Report
Audience Site Visit 1 Site Visit 2 Comparison of Site Visits
Staffing and Scope of Activity Administrators and Physicians
- Staffing and/or changes in roles occurred across sites as a result of ACE. Two sites hired a billing specialist to process the new ACE claims. Other sites expanded staff responsibilities to include ACE specific billing procedures.
- Physician administrative and leadership responsibilities increased because of ACE, particularly with the introduction of collaborative vendor negotiations and development of standardized order sets.
- Staff were retained to manually address billing and data reporting issues.
- Role of ACE manager remained constant; some managers noted that ACE had significantly increased their workload as a result of constant coordination of physicians, staff, and quality efforts.
- Physicians continued to engage in negotiations and other structural changes to enhance cost savings and quality of care, at most sites.
- Time allocated to ACE by administrators decreased.
Similarities Between Site Visits - Staff designated for billing were retained. - ACE manager role remained constant;
required significant time to coordinate among physicians and staff.
- Physician administrative and leadership responsibilities increased as a result of ACE.
Differences from Site Visit 1 to Site Visit 2 - Maintenance phase requires less time
allocated to demonstration by administrators.
Non-Physician Staff
- Some sites added an additional position (patient navigator) to manage ACE patients. These new staff members identified and/or counseled beneficiaries.
- Some staff mentioned frustration with insufficient staffing, which negatively affected coordination between departments.
- Patient navigators identified and/or counseled beneficiaries and were seen as a critical element in coordination.
- Some noted that ACE patient navigators helped to improve communication, resulting in better coordination of care.
- Some staff noted difficulty with insufficient staffing, which negatively affected coordination between departments.
Similarities Between Site Visits - Patient navigators continued to identify
and/or counsel ACE patients. - At some sites, staff noted continued
difficulty with coordination as a result of insufficient staffing.
Differences from Site Visit 1 to Site Visit 2 - Coordination, as a result of patient
navigators, improved at some sites.
Billing and Payment Procedures Administrators and Physicians
- Administrators across sites reported difficulties implementing the billing process required for ACE.
- Secondary payers were not aware of the new billing process and educating them was a big part of the process.
- Issues with DRG 247 claims for many sites posed challenges for administrators.
- Billing staff developed (mostly manual) mechanisms for identifying ACE patients
- Many administrators reported difficulties implementing and maintaining the billing process required for ACE, but noted that many processes became easier over time.
- Part B billing was completed manually, therefore demanding significant time and resources by billing staff.
- Issues with DRG claims, especially DRG 247, were cited as an ongoing issue.
Similarities Between Site Visits - Difficulties implementing and maintaining
the ACE billing process were ongoing. - Part B billing continued to be completed
manually and required significant time and resources.
- Sites believed that DRG 247 claims should have been covered under the demonstration.

IMPAQ International, LLC Page 251 Evaluation of Medicare ACE Demonstration May 31, 2013 Final Evaluation Report
Audience Site Visit 1 Site Visit 2 Comparison of Site Visits during their stays.
- One hospital outsourced ACE billing to a billing specialist. This was the only hospital that reported no additional burden or difficulty with ACE billing procedures.
Differences from Site Visit 1 to Site Visit 2 - Educating secondary payers was no longer
required; however some sites experienced continued challenges to working efficiently with secondary payers because the new billing process was often complicated and confusing.
- Many difficulties with billing processes were smoothed out over time.
Non-Physician Staff
- Staff did not report any noticeable changes to billing procedures or changes in how they identified or managed ACE patients.
- At some sites, to improve efficiency of billing procedures, patient navigators worked with admissions and billing staff to identify ACE patients during pre-operative period.
- Staff did not report any changes to billing procedures or changes in how they identified or managed ACE patients.
- At some sites, patient navigators continued to work with admissions and billing staff to identify ACE patients during pre-operative period.
Similarities Between Site Visits - Most staff were unaware of the billing and
payment procedures implemented for the demonstration.
- To improve efficiency, some sites required patient navigators to work with admissions and billing staff to identify ACE patients during pre-operative period.

IMPAQ International, LLC Page 252 Evaluation of Medicare ACE Demonstration May 31, 2013 Final Evaluation Report
7. Satisfaction
Exhibit B-8: Satisfaction Matrices
Audience Site Visit 1 Site Visit 2 Comparison of Site Visits
Quality of Care Administrators and Physicians
- Most administrators and physicians felt that their site was a high quality hospital; for this reason, some were hesitant to express satisfaction with ACE quality improvement or quality goals.
- Some administrators and physicians expressed satisfaction with improvements in quality, coordination, and ACE-related clinical protocols and procedures.
- Administrators and physicians indicated satisfaction with the improved relationships and increased collaboration between physicians and administrators.
- Administrators and physicians were satisfied with improvements in quality performance, such as improved HCAHPS scores, which some attributed to ACE.
- Administrators and physicians were satisfied with improvements in quality, coordination, and ACE-related clinical protocols and procedures.
- Administrators and physicians were satisfied with care coordination due to improved relationships, increased communication, and patient navigators.
Similarities Between Site Visits - Administrators and physicians were satisfied with
improvements in quality performance and ACE-related clinical protocols.
- Administrators and physicians were satisfied with care coordination due to improved relationships, increased communication, and patient navigators.
Differences from Site Visit 1 to Site Visit 2 - Administrators and physicians were more apt to
express satisfaction with ACE quality goals and improvements.
- Satisfaction with ACE-related quality goals, strategies, and improvements increased.
Non-Physician Staff
- At most sites, non-physician staff believed that the patient discharge process had been streamlined due to the use of standardized order sets.
- Addition of patient navigators was controversial and not always understood or given much importance by some non-physician staff.
- Non-physician staff noted satisfaction with standardization of procedures and care to enhance coordination and improve outcomes, primarily through standardized order sets.
- Most non-physician staff recognized patient navigators as important elements to coordination of care.
- A few non-physician staff noted indifference to or confusion about the role of patient navigators.
Similarities Between Site Visits - Non-physician staff were satisfied with the
standardization of procedures and materials, particularly through standardized order sets.
Differences from Site Visit 1 to Site Visit 2 - While a few expressed indifference to or confusion
about patient navigators, most non-physician staff appreciated their important contribution to coordination of care.
Beneficiaries - Beneficiaries were satisfied with the quality of their care during their hospitalizations.
- Beneficiaries attributed their satisfaction to individual hospital
- Beneficiaries at all sites were satisfied with the quality of inpatient care they received.
- Satisfaction was significantly related to individual hospital procedures, staff, and
Similarities Between Site Visits - Beneficiaries were satisfied with the quality of care
they received. - Satisfaction was not attributed to ACE, because
most beneficiaries were not aware of the

IMPAQ International, LLC Page 253 Evaluation of Medicare ACE Demonstration May 31, 2013 Final Evaluation Report
Audience Site Visit 1 Site Visit 2 Comparison of Site Visits procedures and staff and not directly to ACE, because most beneficiaries were not aware of the demonstration.
overall experience; satisfaction was not attributed directly to ACE, because many beneficiaries were not aware of the demonstration.
demonstration, but to individual hospital procedures, staff, and the overall experience.
Infrastructure/Organization Administrators and Physicians
- Administrators and physicians were satisfied with the ACE infrastructural changes made to increase collaboration, such as ACE boards and committees, physician report cards, and vendor negotiations.
- Administrators and physicians expressed satisfaction with new or altered policies and procedures that enhanced coordination of care and cost savings through transparency of data and standardization.
- Administrators and physicians were dissatisfied with the lack of communication and technical assistance from CMS.
- Employed physicians, who were restricted from receiving gainsharing, were dissatisfied with their inability to receive gainsharing incentives.
- Administrators and physicians expressed satisfaction with ACE infrastructural changes implemented to increase collaboration, such as ACE boards and committees, physician report cards, and vendor negotiations.
- Administrators and physicians expressed satisfaction with new or altered policies and procedures that enhanced coordination of care and cost savings, such as transparency of data and standardized order sets.
- Administrators and physicians noted dissatisfaction with lack of communication and technical assistance from CMS.
- Employed physicians, who were restricted from receiving gainsharing, were dissatisfied with their inability to fully participate.
Similarities Between Site Visits - Administrators and physicians were satisfied with
ACE infrastructural changes implemented to increase collaboration, such as ACE boards and committees, physician report cards, and vendor negotiations.
- Administrators and physicians were satisfied with new or altered policies and procedures to enhance coordination of care and cost savings through transparency of data and standardization.
- Administrators and physicians were dissatisfied with lack of communication and technical assistance from CMS throughout the demonstration.
- Employed physicians were dissatisfied with their inability to receive gainsharing incentives.
Non-Physician Staff
- Patient navigators tended to be more satisfied with ACE, primarily due to their active involvement in the demonstration.
- Most non-physician staff did not feel involved in ACE and were either neutral or dissatisfied.
- Some staff wanted to see more staff and patient education about ACE.
- Non-physician staff noted satisfaction with standardized order sets, which resulted in a more efficient and effective patient treatment process.
- Many non-physician staff cited dissatisfaction with lack of communication to staff about ACE, resulting in little knowledge of ACE and its specific objectives.
- Staff felt satisfied about better
Similarities Between Site Visits - Many non-physician staff were dissatisfied with
lack of communication from the administration and physicians about ACE.
Differences from Site Visit 1 to Site Visit 2 - Non-physician staff expressed satisfaction with
standardized order sets, which resulted in a more efficient patient treatment process.
- Non-physician staff felt satisfied with better communication between staff and physicians as a

IMPAQ International, LLC Page 254 Evaluation of Medicare ACE Demonstration May 31, 2013 Final Evaluation Report
Audience Site Visit 1 Site Visit 2 Comparison of Site Visits communication between staff and physicians as a result of ACE.
result of ACE.
Costs and Savings Administrators and Physicians
- Administrators and physicians were satisfied with physicians’ ability and willingness to coordinate on product use and negotiate better prices.
- Many administrators were satisfied with the cost savings that were achieved through ACE.
- High-volume physicians who received gainsharing tended to be most satisfied with ACE.
- Administrators and physicians were satisfied with coordination on product use and negotiation processes.
- Many administrators and physicians were satisfied with the cost savings that were achieved through ACE.
Similarities Between Site Visits - Administrators and physicians were satisfied with
coordination efforts to standardize materials and negotiate prices.
- Many administrators and physicians were satisfied with the cost savings that were achieved through ACE.
Differences from Site Visit 1 to Site Visit 2 - Satisfaction was not related to physician type or
experience, but was generally felt by all physicians.
Non-Physician Staff
- Some non-physician staff noted dissatisfaction with pressure placed on them to quickly discharge patients without sufficient guidance and resources.
- Some non-physician staff felt dissatisfied with pressure placed on them to quickly discharge patients without sufficient guidance and resources, such as additional staff.
Similarities Between Site Visits - Some non-physician staff felt dissatisfied with
pressure to decrease length of stay without sufficient guidance and resources, such as additional staff.
Volume Administrators and Physicians
- Administrators and physicians noted that they did not see the increase in volume they expected.
- Many administrators and physicians were dissatisfied with the perceived lack of marketing on the part of CMS on the demonstration; it was believed that this adversely affected patient volume and the ability to increase market share.
- Administrators mentioned that CMS-imposed limitations on marketing language and a tight marketing budget hindered adequate patient education about ACE.
- Administrators and physicians were dissatisfied that the increase in patient volume expected as a result of ACE did not occur.
- Lack of increase in patient volume was cited by administrators as limiting the expected and desired negotiating power of physicians, since they did not receive the volume that would allow for better prices.
- Administrators and physicians noted dissatisfaction with CMS’s marketing strategies; they believed that beneficiaries were not adequately targeted through their primary care physicians.
Similarities Between Site Visits - Administrators and physicians were dissatisfied
that the increase in patient volume expected as a result of ACE did not occur.
- Many administrators and physicians were dissatisfied with the perceived lack of marketing of the demonstration on the part of CMS, which was believed to have limited patient volume and the ability to increase market share.
- Administrators and physicians were dissatisfied with CMS’s marketing limitations and strategies, which hindered adequate patient education about ACE, particularly through primary care physicians.

IMPAQ International, LLC Page 255 Evaluation of Medicare ACE Demonstration May 31, 2013 Final Evaluation Report
Audience Site Visit 1 Site Visit 2 Comparison of Site Visits Non-Physician Staff
- A few non-physician staff noted dissatisfaction with the ACE marketing support and technical assistance provided by CMS, which limited volume growth.
- Some non-physician staff were dissatisfied with pressures to handle high volume on nursing floors (high patient volume was not attributed to ACE).
- A few non-physician staff noted dissatisfaction with the ACE marketing support and technical assistance provided by CMS.
- Some non-physician staff were dissatisfied with pressures to handle high volume on nursing floors (high patient volume was not attributed to ACE).
Similarities Between Site Visits - A few non-physician staff noted dissatisfaction
with the ACE marketing support and technical assistance provided by CMS, which was believed to have limited volume growth.
- Some non-physician staff were dissatisfied with pressures to handle high volume on nursing floors, although high patient volume was not attributed to ACE.

IMPAQ International, LLC Page 256 Evaluation of Medicare ACE Demonstration May 31, 2013 Final Evaluation Report
APPENDIX C: SUMMARY STATISTICS FOR COST ANALYSIS
Exhibit C-1: Summary Statistics for Home Health PAC Costs
ACE Sites Non-Demonstration
Sites True Comparison
Sites
Pre Post Pre Post Pre Post
Valve
Mean $654 $708 $600 $596 $668 $637
SD $851 $1,007 $936 $887 $1,012 $985
N 498 635 790 1,227 3,871 8,617
Defibrillator
Mean $208 $160 $218 $229 $264 $320
SD $564 $498 $532 $655 $689 $883
N 448 565 997 991 2,966 4,103
CABG
Mean $706 $715 $665 $668 $687 $678
SD $891 $979 $941 $986 $991 $986
N 1,081 1,198 1,968 2,482 8,134 13,155
Pacemaker
Mean $296 $363 $307 $314 $298 $338
SD $671 $730 $1,313 $691 $719 $772
N 1,223 1,210 2,973 3,251 10,066 15,450
PCI
Mean $144 $196 $139 $174 $174 $210
SD $457 $587 $456 $548 $657 $725
N 3,717 3,900 7,153 7,229 20,987 30,438
Orthopedic
Mean $1,585 $1,834 $1,452 $1,526 $1,373 $1,393
SD $1,885 $1,408 $1,397 $1,784 $1,485 $1,515
N 2,257 3,894 13,724 8,598 36,810 69,973 Note: The ACE and non-demonstration treatment group pre- and post-periods are defined on an ACE site-specific basis. However, because the true comparison groups are identical for all ACE hospitals, we use a single “implementation date” of June 1, 2009 for all true comparison hospitals.

IMPAQ International, LLC Page 257 Evaluation of Medicare ACE Demonstration May 31, 2013 Final Evaluation Report
Exhibit C-2: Summary Statistics for SNF PAC Costs
ACE Sites Non-Demonstration
Sites True Comparison
Sites
Pre Post Pre Post Pre Post
Valve
Mean $648 $886 $803 $1,137 $1,080 $1,373
SD $2,300 $6,438 $2,997 $3,799 $3,013 $3,540
N 498 635 790 1,227 3,871 8,617
Defibrillator
Mean $239 $299 $279 $311 $418 $622
SD $1,374 $1,655 $1,455 $1,502 $1,866 $2,530
N 448 565 997 991 2,966 4,103
CABG
Mean $681 $1,031 $481 $824 $751 $964
SD $2,559 $3,839 $1,971 $2,867 $2,702 $2,963
N 1,081 1,198 1,968 2,482 8,134 13,155
Pacemaker
Mean $694 $908 $738 $1,022 $932 $1,209
SD $4,224 $3,033 $2,431 $3,105 $2,859 $3,413
N 1,223 1,210 2,973 3,251 10,066 15,450
PCI
Mean $224 $341 $224 $360 $311 $443
SD $1,378 $1,811 $1,329 $1,782 $1,897 $2,103
N 3,717 3,900 7,153 7,229 20,987 30,438
Orthopedic
Mean $2,144 $2,213 $1,919 $2,746 $2,050 $2,534
SD $3,963 $4,465 $3,984 $4,470 $4,101 $5,034
N 2,257 3,894 13,724 8,598 36,810 69,973 Note: The ACE and non-demonstration treatment group pre- and post-periods are defined on an ACE site-specific basis. However, because the true comparison groups are identical for all ACE hospitals, we use a single “implementation date” of June 1, 2009 for all true comparison hospitals.

IMPAQ International, LLC Page 258 Evaluation of Medicare ACE Demonstration May 31, 2013 Final Evaluation Report
Exhibit C-3: Summary Statistics for IRF PAC Costs
ACE Sites Non-Demonstration
Sites True Comparison
Sites
Pre Post Pre Post Pre Post
Valve
Mean $1,219 $1,946 $2,156 $1,783 $1,823 $2,343 SD $4,328 $6,035 $6,140 $5,257 $5,293 $5,985
N 498 635 790 1,227 3,871 8,617
Defibrillator
Mean $141 $122 $226 $226 $388 $459 SD $1,403 $1,531 $1,788 $1,936 $2,684 $2,818
N 448 565 997 991 2,966 4,103
CABG
Mean $794 $1,099 $1,650 $1,597 $1,620 $1,911
SD $3,899 $4,154 $5,177 $5,188 $4,984 $5,496 N 1,081 1,198 1,968 2,482 8,134 13,155
Pacemaker
Mean $301 $363 $309 $370 $424 $541
SD $2,302 $2,555 $2,089 $2,531 $2,660 $3,077 N 1,223 1,210 2,973 3,251 10,066 15,450
PCI
Mean $107 $196 $129 $199 $201 $275
SD $1,323 $1,833 $1,459 $1,783 $1,889 $2,204 N 3,717 3,900 7,153 7,229 20,987 30,438
Orthopedic
Mean $2,628 $2,349 $3,338 $2,633 $3,409 $3,373 SD $5,671 $5,377 $6,071 $5,746 $6,076 $6,180
N 2,257 3,894 13,724 8,598 36,810 69,973 Note: The ACE and non-demonstration treatment group pre- and post-periods are defined on an ACE site-specific basis. However, because the true comparison groups are identical for all ACE hospitals, we use a single “implementation date” of June 1, 2009 for all true comparison hospitals.

IMPAQ International, LLC Page 259 Evaluation of Medicare ACE Demonstration May 31, 2013 Final Evaluation Report
Exhibit C-4: Summary Statistics for CORF PAC Costs
ACE Sites Non-Demonstration
Sites True Comparison
Sites
Pre Post Pre Post Pre Post
Valve
Mean $0 $0 $0 $0 $0 $0
SD $0 $0 $0 $0 $1 $1
N 498 635 790 1,227 3,871 8,617
Defibrillator
Mean $0 $0 $0 $0 $0 $0
SD $0 $0 $0 $0 $0 $0
N 448 565 997 991 2,966 4,103
CABG
Mean $0 $0 $0 $0 $0 $0
SD $0 $0 $0 $0 $9 $6
N 1,081 1,198 1,968 2,482 8,134 13,155
Pacemaker
Mean $0 $0 $0 $0 $0 $0
SD $0 $0 $0 $0 $3 $4
N 1,223 1,210 2,973 3,251 10,066 15,450
PCI
Mean $0 $0 $0 $0 $0 $0
SD $0 $0 $0 $0 $6 $7
N 3,717 3,900 7,153 7,229 20,987 30,438
Orthopedic
Mean $0 $0 $0 $0 $1 $1
SD $0 $0 $2 $4 $21 $24
N 2,257 3,894 13,724 8,598 36,810 69,973 Note: The ACE and non-demonstration treatment group pre- and post-periods are defined on an ACE site-specific basis. However, because the true comparison groups are identical for all ACE hospitals, we use a single “implementation date” of June 1, 2009 for all true comparison hospitals.

IMPAQ International, LLC Page 260 Evaluation of Medicare ACE Demonstration May 31, 2013 Final Evaluation Report
Exhibit C-5: Summary Statistics for Hospice PAC Costs
ACE Sites Non-Demonstration
Sites True Comparison
Sites
Pre Post Pre Post Pre Post
Valve
Mean $1 $15 $7 $13 $6 $12
SD $32 $221 $92 $208 $118 $208
N 498 635 790 1,227 3,871 8,617
Defibrillator
Mean $0 $27 $12 $25 $18 $25
SD $0 $292 $167 $286 $238 $309
N 448 565 997 991 2,966 4,103
CABG
Mean $1 $7 $10 $10 $7 $10
SD $18 $105 $200 $219 $140 $194
N 1,081 1,198 1,968 2,482 8,134 13,155
Pacemaker
Mean $45 $41 $35 $50 $30 $36
SD $368 $435 $348 $478 $328 $418
N 1,223 1,210 2,973 3,251 10,066 15,450
PCI
Mean $23 $15 $15 $20 $18 $30
SD $287 $212 $228 $232 $285 $363
N 3,717 3,900 7,153 7,229 20,987 30,438
Orthopedic
Mean $44 $22 $27 $33 $25 $29
SD $411 $312 $316 $359 $330 $354
N 2,257 3,894 13,724 8,598 36,810 69,973 Note: The ACE and non-demonstration treatment group pre- and post-periods are defined on an ACE site-specific basis. However, because the true comparison groups are identical for all ACE hospitals, we use a single “implementation date” of June 1, 2009 for all true comparison hospitals.

IMPAQ International, LLC Page 261 Evaluation of Medicare ACE Demonstration May 31, 2013 Final Evaluation Report
Exhibit C-6: Summary Statistics for Readmissions PAC Costs
ACE Sites Non-Demonstration
Sites True Comparison
Sites
Pre Post Pre Post Pre Post
Valve
Mean $1,861 $2,404 $2,506 $2,413 $2,208 $2,516
SD $4,710 $7,136 $7,721 $6,780 $6,195 $7,608
N 498 635 790 1,227 3,871 8,617
Defibrillator
Mean $1,310 $1,167 $1,207 $1,542 $1,686 $1,772
SD $3,600 $4,304 $3,739 $4,966 $5,463 $6,266
N 448 565 997 991 2,966 4,103
CABG
Mean $1,540 $1,977 $1,746 $1,850 $1,989 $1,897
SD $4,776 $5,724 $5,850 $5,975 $5,951 $6,030
N 1,081 1,198 1,968 2,482 8,134 13,155
Pacemaker
Mean $901 $1,357 $1,136 $1,335 $1,262 $1,409
SD $3,630 $4,495 $3,949 $4,465 $4,464 $5,207
N 1,223 1,210 2,973 3,251 10,066 15,450
PCI
Mean $1,536 $1,958 $1,646 $1,814 $1,679 $1,762
SD $4,852 $5,770 $5,382 $6,156 $5,425 $6,083
N 3,717 3,900 7,153 7,229 20,987 30,438
Orthopedic
Mean $1,014 $842 $959 $853 $924 $974
SD $3,977 $3,626 $3,819 $3,744 $3,860 $4,125
N 2,257 3,894 13,724 8,598 36,810 69,973 Note: The ACE and non-demonstration treatment group pre- and post-periods are defined on an ACE site-specific basis. However, because the true comparison groups are identical for all ACE hospitals, we use a single “implementation date” of June 1, 2009 for all true comparison hospitals.

IMPAQ International, LLC Page 262 Evaluation of Medicare ACE Demonstration May 31, 2013 Final Evaluation Report
Exhibit C-7: Summary Statistics for Physician Office Visits PAC Costs
ACE Sites Non-Demonstration
Sites True Comparison
Sites
Pre Post Pre Post Pre Post
Valve
Mean $27 $21 $30 $30 $32 $30
SD $64 $64 $64 $71 $84 $93
N 498 635 790 1,227 3,871 8,617
Defibrillator
Mean $49 $38 $38 $43 $39 $43
SD $127 $161 $123 $100 $98 $129
N 448 565 997 991 2,966 4,103
CABG
Mean $31 $23 $38 $32 $32 $32
SD $146 $83 $163 $88 $89 $98
N 1,081 1,198 1,968 2,482 8,134 13,155
Pacemaker
Mean $38 $40 $40 $41 $39 $40
SD $121 $149 $162 $122 $129 $136
N 1,223 1,210 2,973 3,251 10,066 15,450
PCI
Mean $50 $39 $49 $49 $47 $49
SD $160 $115 $164 $165 $149 $166
N 3,717 3,900 7,153 7,229 20,987 30,438
Orthopedic
Mean $34 $28 $24 $25 $25 $27
SD $207 $145 $92 $90 $93 $106
N 2,257 3,894 13,724 8,598 36,810 69,973 Note: The ACE and non-demonstration treatment group pre- and post-periods are defined on an ACE site-specific basis. However, because the true comparison groups are identical for all ACE hospitals, we use a single “implementation date” of June 1, 2009 for all true comparison hospitals.

IMPAQ International, LLC Page 263 Evaluation of Medicare ACE Demonstration May 31, 2013 Final Evaluation Report
Exhibit C-8: Summary Statistics for Outpatient PAC Costs
ACE Sites Non-Demonstration
Sites True Comparison
Sites
Pre Post Pre Post Pre Post
Valve
Mean $251 $286 $236 $271 $232 $288
SD $768 $503 $1,497 $670 $627 $782
N 498 635 790 1,227 3,871 8,617
Defibrillator
Mean $212 $315 $257 $261 $272 $323
SD $637 $724 $858 $763 $1,033 $996
N 448 565 997 991 2,966 4,103
CABG
Mean $236 $326 $229 $250 $244 $307
SD $594 $792 $720 $575 $730 $872
N 1,081 1,198 1,968 2,482 8,134 13,155
Pacemaker
Mean $206 $278 $198 $297 $230 $282
SD $610 $738 $669 $1,098 $967 $1,098
N 1,223 1,210 2,973 3,251 10,066 15,450
PCI
Mean $277 $457 $315 $410 $366 $479
SD $880 $1,255 $1,194 $1,244 $1,390 $1,578
N 3,717 3,900 $,153 7,229 20,987 30,438
Orthopedic
Mean $120 $120 $147 $145 $180 $200
SD $324 $349 $408 $468 $447 $522
N 2,257 3,894 13,724 8,598 36,810 69,973 Note: The ACE and non-demonstration treatment group pre- and post-periods are defined on an ACE site-specific basis. However, because the true comparison groups are identical for all ACE hospitals, we use a single “implementation date” of June 1, 2009 for all true comparison hospitals.

IMPAQ International, LLC Page 264 Evaluation of Medicare ACE Demonstration May 31, 2013 Final Evaluation Report
Exhibit C-9: Summary Statistics for Other PAC Costs
ACE Sites Non-Demonstration
Sites True Comparison
Sites
Pre Post Pre Post Pre Post
Valve
Mean $39 $33 $20 $54 $28 $50
SD $331 $244 $111 $412 $132 $309
N 498 635 790 1,227 3,871 8,617
Defibrillator
Mean $10 $43 $34 $40 $26 $44
SD $51 $432 $341 $352 $175 $322
N 448 565 997 991 2,966 4,103
CABG
Mean $83 $39 $28 $41 $33 $43
SD $681 $226 $214 $244 $250 $332
N 1,081 1,198 1,968 2,482 8,134 13,155
Pacemaker
Mean $48 $55 $44 $57 $36 $48
SD $460 $372 $531 $469 $330 $383
N 1,223 1,210 2,973 3,251 10,066 15,450
PCI
Mean $52 $54 $30 $49 $36 $49
SD $449 $413 $281 $349 $372 $445
N 3,717 3,900 7,153 7,229 20,987 30,438
Orthopedic
Mean $44 $29 $34 $51 $28 $37
SD $228 $239 $338 $390 $263 $265
N 2,257 3,894 13,724 8,598 36,810 69,973 Note: The ACE and non-demonstration treatment group pre- and post-periods are defined on an ACE site-specific basis. However, because the true comparison groups are identical for all ACE hospitals, we use a single “implementation date” of June 1, 2009 for all true comparison hospitals.

IMPAQ International, LLC Page 265 Evaluation of Medicare ACE Demonstration May 31, 2013 Final Evaluation Report
APPENDIX D: ADJUSTED DID ANALYSIS FOR QUALITY OF CARE BY SITE AND PROCEDURE
Exhibit D-1: Hillcrest Medical Center: Adjusted DID Analysis of Defibrillator Claims-Based Quality Measures (CY 2007 Q3 – CY 2011 Q1)
Measure ACE Sites Non-Demonstration Treatment Sites
DID Estimate
Odds Ratio
SE Wald/ t-Stat†
p-Value N DID
Estimate Odds Ratio
SE Wald/ t-Stat†
p-Value N
5. Postoperative hemorrhage/hematoma
6. Postoperative physiologic and metabolic derangement
14. Post-operative stroke
16. 30-day post-surgery mortality rate
17. 30-day readmission rate
18. Case mix index -0.13* N/A 0.06 -2.19 0.0283 7,529
20. Length of stay
21. Medicare outlier patients
22a. Transfer to acute care hospital
22b. Transfer to post-acute care facility
*p<0.05, **p<0.01, ***p<0.001 † In the models estimated using a linear regression (measures 18 and 20), the exhibit provides the t-statistic. The remaining models were estimated using a logistic regression, thus the exhibit provides the Wald statistic. The regressions include hospital and quarter fixed-effects, age at discharge, gender, an indicator for nonwhite race, community risk score, and a policy indicator variable equal to unity for observations drawn from ACE and non-demonstration treatment group hospitals during the demonstration period.

IMPAQ International, LLC Page 266 Evaluation of Medicare ACE Demonstration May 31, 2013 Final Evaluation Report
Exhibit D-2: Hillcrest Medical Center: Adjusted DID Analysis of Pacemaker Claims-Based Quality Measures (CY 2007 Q3 – CY 2011 Q1)
Measure
ACE Sites Non-Demonstration Treatment Sites
DID Estimate
Odds Ratio
SE Wald/ t-Stat†
p-Value N DID
Estimate Odds Ratio
SE Wald/ t-Stat†
p-Value N
5. Postoperative hemorrhage/hematoma
6. Postoperative physiologic and metabolic derangement
14. Post-operative stroke
16. 30-day post-surgery mortality rate
17. 30-day readmission rate
18. Case mix index
20. Length of stay
21. Medicare outlier patients
22a. Transfer to acute care hospital
22b. Transfer to post-acute care facility
*p<0.05, **p<0.01, ***p<0.001 † In the models estimated using a linear regression (measures 18 and 20), the exhibit provides the t-statistic. The remaining models were estimated using a logistic regression, thus the exhibit provides the Wald statistic. The regressions include hospital and quarter fixed-effects, age at discharge, gender, an indicator for nonwhite race, community risk score, and a policy indicator variable equal to unity for observations drawn from ACE and non-demonstration treatment group hospitals during the demonstration period.

IMPAQ International, LLC Page 267 Evaluation of Medicare ACE Demonstration May 31, 2013 Final Evaluation Report
Exhibit D-3: Hillcrest Medical Center: Adjusted DID Analysis of Valve Claims-Based Quality Measures (CY 2007 Q3 – CY 2011 Q1)
Measure
ACE Sites Non-Demonstration Treatment Sites
DID Estimate
Odds Ratio
SE Wald/ t-Stat†
p-Value N DID
Estimate Odds Ratio
SE Wald/ t-Stat†
p-Value N
5. Postoperative hemorrhage/hematoma
6. Postoperative physiologic and metabolic derangement
7. Post-operative sepsis
14. Post-operative Stroke
16. 30-day post-surgery mortality rate
17. 30-day readmission rate
18. Case mix index
20. Length of stay
21. Medicare outlier patients
22a. Transfer to acute care hospital
22b. Transfer to post-acute care facility
*p<0.05, **p<0.01, ***p<0.001 † In the models estimated using a linear regression (measures 18 and 20), the exhibit provides the t-statistic. The remaining models were estimated using a logistic regression, thus the exhibit provides the Wald statistic. The regressions include hospital and quarter fixed-effects, age at discharge, gender, an indicator for nonwhite race, community risk score, and a policy indicator variable equal to unity for observations drawn from ACE and non-demonstration treatment group hospitals during the demonstration period.

IMPAQ International, LLC Page 268 Evaluation of Medicare ACE Demonstration May 31, 2013 Final Evaluation Report
Exhibit D-4: Hillcrest Medical Center: Adjusted DID Analysis of CABG Claims-Based Quality Measures (CY 2007 Q3 – CY 2011 Q1)
Measure
ACE Sites Non-Demonstration Treatment Sites
DID Estimate
Odds Ratio
SE Wald/ t-Stat†
p-Value
N DID
Estimate Odds Ratio
SE Wald/ t-Stat†
p-Value
N
5. Postoperative hemorrhage/hematoma
6. Postoperative physiologic and metabolic derangement
7. Post-operative sepsis
9. Use of internal mammary artery in first time isolated CABG
14. Post-operative stroke
16. 30-day post-surgery mortality rate
0.47* 1.61 0.20 5.85 0.0156 20,24
7
17. 30-day readmission rate
18. Case mix index
20. Length of stay
21. Medicare outlier patients
22a. Transfer to acute care hospital -0.89* 0.41 0.42 4.64 0.0313 18,956
22b. Transfer to post-acute care facility
*p<0.05, **p<0.01, ***p<0.001 † In the models estimated using a linear regression (measures 18 and 20), the exhibit provides the t-statistic. The remaining models were estimated using a logistic regression, thus the exhibit provides the Wald statistic. The regressions include hospital and quarter fixed-effects, age at discharge, gender, an indicator for nonwhite race, community risk score, and a policy indicator variable equal to unity for observations drawn from ACE and non-demonstration treatment group hospitals during the demonstration period.

IMPAQ International, LLC Page 269 Evaluation of Medicare ACE Demonstration May 31, 2013 Final Evaluation Report
Exhibit D-5: Hillcrest Medical Center: Adjusted DID Analysis of PCI Claims-Based Quality Measures (CY 2007 Q3 – CY 2011 Q1)
Measure
ACE Sites Non-Demonstration Treatment Sites
DID Estimate
Odds Ratio
SE Wald/ t-Stat†
p-Value N DID
Estimate Odds Ratio
SE Wald/ t-Stat†
p-Value N
5. Postoperative hemorrhage/hematoma
6. Postoperative physiologic and metabolic derangement
14. Post-operative stroke
16. 30-day post-surgery mortality rate
17. 30-day readmission rate
18. Case mix index -0.05* N/A 0.02 -2.50 0.0123 51,431
20. Length of stay -0.34** N/A 0.12 -2.72 0.0064 48,061
21. Medicare outlier patients
-0.57* 0.57 0.25 5.10 0.0239 51,275
22a. Transfer to acute care hospital
22b. Transfer to post-acute care facility
*p<0.05, **p<0.01, ***p<0.001 † In the models estimated using a linear regression (measures 18 and 20), the exhibit provides the t-statistic. The remaining models were estimated using a logistic regression, thus the exhibit provides the Wald statistic. The regressions include hospital and quarter fixed-effects, age at discharge, gender, an indicator for nonwhite race, community risk score, and a policy indicator variable equal to unity for observations drawn from ACE and non-demonstration treatment group hospitals during the demonstration period.

IMPAQ International, LLC Page 270 Evaluation of Medicare ACE Demonstration May 31, 2013 Final Evaluation Report
Exhibit D-6: Hillcrest Medical Center: Adjusted DID Analysis of Hip/Knee Claims-Based Quality Measures (CY 2007 Q3 – CY 2011 Q1)
Measure ACE Sites Non-Demonstration Treatment Sites
DID Estimate
Odds Ratio
SE Wald/ t-Stat†
p-Value
N DID
Estimate Odds Ratio
SE Wald/ t-Stat†
p-Value
N
5. Postoperative hemorrhage/hematoma
6. Postoperative physiologic and metabolic derangement
7. Post-operative sepsis
14. Post-operative stroke
16. 30-day post-surgery mortality rate
17. 30-day readmission rate
-0.75* 0.47 0.30 6.10 0.0135 32,467
18. Case mix index
19a. Over age 75 -0.38** 0.69 0.13 8.34 0.0039 35,335
19b. With hip fracture
19c. With rheumatoid arthritis
20. Length of stay
21. Medicare outlier patients
22a. Transfer to acute care hospital
22b. Transfer to post-acute care facility
-0.83*** 0.43 0.20 17.61 <.0001 32,467
*p<0.05, **p<0.01, ***p<0.001 † In the models estimated using a linear regression (measures 18 and 20), the exhibit provides the t-statistic. The remaining models were estimated using a logistic regression, thus the exhibit provides the Wald statistic. The regressions include hospital and quarter fixed-effects, age at discharge, gender, an indicator for nonwhite race, community risk score, and a policy indicator variable equal to unity for observations drawn from ACE and non-demonstration treatment group hospitals during the demonstration period.

IMPAQ International, LLC Page 271 Evaluation of Medicare ACE Demonstration May 31, 2013 Final Evaluation Report
Exhibit D-7: Baptist Health System: Adjusted DID Analysis of Defibrillator Claims-Based Quality Measures (CY 2007 Q3 – CY 2011 Q1)
Measure
ACE Sites Non-Demonstration Treatment Sites
DID Estimate
Odds Ratio
SE Wald/ t-Stat†
p-Value N DID
Estimate Odds Ratio
SE Wald/ t-Stat†
p-Value N
5. Postoperative Hemorrhage/Hematoma
6. Postoperative Physiologic and Metabolic Derangement
14. Post-operative Stroke
16. 30-Day Post-Surgery Mortality Rate
17. 30-Day Readmission Rate
18. Case Mix Index -0.24* N/A 0.10 -2.33 0.02 8,210 -0.22*** N/A 0.06 -3.45 0.0006 8,629
20. Length of Stay
21. Medicare Outlier Patients
0.82* 2.28 0.41 3.97 0.0463 8,182 -1.15** 0.32 0.44 7.01 0.0081 8,601
22a. Transfer to acute care hospital
22b. Transfer to post-acute care facility
*p<0.05, **p<0.01, ***p<0.001 † In the models estimated using a linear regression (measures 18 and 20), the exhibit provides the t-statistic. The remaining models were estimated using a logistic regression, thus the exhibit provides the Wald statistic. The regressions include hospital and quarter fixed-effects, age at discharge, gender, an indicator for nonwhite race, community risk score, and a policy indicator variable equal to unity for observations drawn from ACE and non-demonstration treatment group hospitals during the demonstration period.

IMPAQ International, LLC Page 272 Evaluation of Medicare ACE Demonstration May 31, 2013 Final Evaluation Report
Exhibit D-8: Baptist Health System: Adjusted DID Analysis of Pacemaker Claims-Based Quality Measures
(CY 2007 Q3 – CY 2011 Q1)
Measure
ACE Sites Non-Demonstration Treatment Sites
DID Estimate
Odds Ratio
StandardError
Wald/ t-Stat†
p-Value
N DID
Estimate Odds Ratio
Standard Error
Wald/ t-Stat†
p-Value
N
5. Postoperative hemorrhage/hematoma
6. Postoperative physiologic and metabolic derangement
14. Post-operative stroke
16. 30-day post-surgery mortality rate
17. 30-day readmission rate
18. Case mix index
20. Length of stay
21. Medicare outlier patients
-0.71** 0.49 0.24 8.81 0.003 29,112
22a. Transfer to acute care hospital
22b. Transfer to post-acute care facility
*p<0.05, **p<0.01, ***p<0.001 † In the models estimated using a linear regression (measures 18 and 20), the exhibit provides the t-statistic. The remaining models were estimated using a logistic regression, thus the exhibit provides the Wald statistic. The regressions include hospital and quarter fixed-effects, age at discharge, gender, an indicator for nonwhite race, community risk score, and a policy indicator variable equal to unity for observations drawn from ACE and non-demonstration treatment group hospitals during the demonstration period.

IMPAQ International, LLC Page 273 Evaluation of Medicare ACE Demonstration May 31, 2013 Final Evaluation Report
Exhibit D-9: Baptist Health System: Adjusted DID Analysis of Claims-Based Quality Measures (CY 2007 Q3 – CY 2011 Q1)
Measure ACE Sites Non-Demonstration Treatment Sites
DID Estimate
Odds Ratio
Standard Error
Wald/ t-Stat†
p-Value
N DID
Estimate Odds Ratio
StandardError
Wald/ t-Stat†
p-Value N
5. Postoperative hemorrhage/hematoma
6. Postoperative physiologic and metabolic derangement
7. Post-operative sepsis
14. Post-operative stroke
16. 30-day post-surgery mortality rate
0.42** 1.52 0.16 7.21 0.0073 12,061
17. 30-day readmission rate
18. Case mix index
20. Length of stay
21. Medicare outlier patients
-0.48* 0.62 0.21 5.07 0.0244 15,234
22a. Transfer to acute care hospital
22b. Transfer to post-acute care facility
*p<0.05, **p<0.01, ***p<0.001 † In the models estimated using a linear regression (measures 18 and 20), the exhibit provides the t-statistic. The remaining models were estimated using a logistic regression, thus the exhibit provides the Wald statistic. The regressions include hospital and quarter fixed-effects, age at discharge, gender, an indicator for nonwhite race, community risk score, and a policy indicator variable equal to unity for observations drawn from ACE and non-demonstration treatment group hospitals during the demonstration period.

IMPAQ International, LLC Page 274 Evaluation of Medicare ACE Demonstration May 31, 2013 Final Evaluation Report
Exhibit D-10: Baptist Health System: Adjusted DID Analysis of CABG-Based Quality Measures (CY 2007 Q3 – CY 2011 Q1)
Measure
ACE Sites Non-Demonstration Treatment Sites
DID Estimate
Odds Ratio
Standard Error
Wald/ t-Stat†
p-Value
N DID
Estimate Odds Ratio
Standard Error
Wald/ t-Stat†
p-Value
N
5. Postoperative hemorrhage/hematoma
6. Postoperative physiologic and metabolic derangement
7. Post-operative sepsis
9. Use of internal mammary artery in first time isolated CABG
-0.35* 0.70 0.15 5.74 0.0166 21,777
14. Post-operative stroke
16. 30-day post-surgery mortality rate
17. 30-day readmissionrate
18. Case mix index -0.17** N/A 0.06 -2.87 0.0041 27,628
20. Length of stay -0.62* N/A 0.25 -2.49 0.0129 22,381
21. Medicare outlier patients
-0.78*** 0.46 0.18 18.33 <.0001 27,545
22a. Transfer to acute care hospital
-0.78*** 1.79 0.22 7.09 0.0077 20,501
22b. Transfer to post-acute care facility
*p<0.05, **p<0.01, ***p<0.001 † In the models estimated using a linear regression (measures 18 and 20), the exhibit provides the t-statistic. The remaining models were estimated using a logistic regression, thus the exhibit provides the Wald statistic. The regressions include hospital and quarter fixed-effects, age at discharge, gender, an indicator for nonwhite race, community risk score, and a policy indicator variable equal to unity for observations drawn from ACE and non-demonstration treatment group hospitals during the demonstration period.

IMPAQ International, LLC Page 275 Evaluation of Medicare ACE Demonstration May 31, 2013 Final Evaluation Report
Exhibit D-11: Baptist Health System: Adjusted DID Analysis of PCI-Based Quality Measures (CY 2007 Q3 – CY 2011 Q1)
Measure
ACE Sites Non-Demonstration Treatment Sites
DID Estimate
Odds Ratio
Standard Error
Wald/ t-Stat†
p-Value
N DID
Estimate Odds Ratio
Standard Error
Wald/ t-Stat†
p-Value
N
5. Postoperative hemorrhage/hematoma
6. Postoperative physiologic and metabolic derangement
14. Post-operative stroke
-1.00* 0.37 0.48 4.32 0.0376 52,889
16. 30-day post-surgery mortality rate
17. 30-day readmission rate
18. Case mix index -0.06*** N/A 0.02 -3.66 0.0003 64,616
20. Length of stay 0.52** N/A 0.16 3.22 0.0013 49,968 -0.35*** N/A 0.10 -3.45 0.0006 52,980
21. Medicare outlier patients
0.72* 0.00 0.33 4.75 0.0293 60,747
22a. Transfer to acute care hospital
22b. Transfer to post-acute care facility
*p<0.05, **p<0.01, ***p<0.001 † In the models estimated using a linear regression (measures 18 and 20), the exhibit provides the t-statistic. The remaining models were estimated using a logistic regression, thus the exhibit provides the Wald statistic. The regressions include hospital and quarter fixed-effects, age at discharge, gender, an indicator for nonwhite race, community risk score, and a policy indicator variable equal to unity for observations drawn from ACE and non-demonstration treatment group hospitals during the demonstration period.

IMPAQ International, LLC Page 276 Evaluation of Medicare ACE Demonstration May 31, 2013 Final Evaluation Report
Exhibit D-12: Baptist Health System: Adjusted DID Analysis of Hip/Knee-Based Quality Measures (CY 2007 Q3 – CY 2011 Q1)
Measure
ACE Sites Non-Demonstration Treatment Sites
DID Estimate
Odds Ratio
Standard Error
Wald/ t-Stat†
p-Value
N DID
Estimate Odds Ratio
Standard Error
Wald/ t-Stat†
p-Value
N
5. Postoperative hemorrhage/hematoma
6. Postoperative physiologic and metabolic derangement
7. Post-operative sepsis
14. Post-operative stroke
16. 30-day post-surgery mortality rate
17. 30-day readmission rate
18. Case mix index
19a. Over age 75
19b. With hip fracture -0.21* 0.81 0.10 3.95 0.047 44,619
19c. With rheumatoid arthritis
0.55* 1.73 0.27 4.20 0.0404 47,076
20. Length of stay -0.23** N/A 0.07 -3.05 0.0023 38,060 -0.47*** N/A 0.11 -4.11 <.0001 36,031
21. Medicare outlier patients
-0.47*** 4.23 0.45 10.19 0.0014 44,375
22a. Transfer to acute care hospital
22b. Transfer to post-acute care facility
*p<0.05, **p<0.01, ***p<0.001 † In the models estimated using a linear regression (measures 18 and 20), the exhibit provides the t-statistic. The remaining models were estimated using a logistic regression, thus the exhibit provides the Wald statistic. The regressions include hospital and quarter fixed-effects, age at discharge, gender, an indicator for nonwhite race, community risk score, and a policy indicator variable equal to unity for observations drawn from ACE and non-demonstration treatment group hospitals during the demonstration period.

IMPAQ International, LLC Page 277 Evaluation of Medicare ACE Demonstration May 31, 2013 Final Evaluation Report
Exhibit D-13: Oklahoma Heart Hospital: Adjusted DID Analysis of Defibrillator-Based Quality Measures (CY 2007 Q3 – CY 2011 Q1)
Measure
ACE Sites Non-Demonstration Treatment Sites
DID Estimate
Odds Ratio
SE Wald/ t-Stat†
p-Value N DID
Estimate Odds Ratio
SE Wald/ t-Stat†
p-Value N
5. Postoperative hemorrhage/hematoma
6. Postoperative physiologic and metabolic derangement
14. Post-operative stroke
16. 30-day post-surgery mortality rate
17. 30-day readmission rate
-1.05* 0.35 0.51 4.16 0.0415 7,237
18. Case mix index
20. Length of stay
21. Medicare outlier patients
-0.77*** 0.46 0.20 14.66 0.0001 8,532 0.79* 2.20 0.39 4.10 0.043 8,721
22a. Transfer to acute care hospital
22b. Transfer to post-acute care facility
*p<0.05, **p<0.01, ***p<0.001 † In the models estimated using a linear regression (measures 18 and 20), the exhibit provides the t-statistic. The remaining models were estimated using a logistic regression, thus the exhibit provides the Wald statistic. The regressions include hospital and quarter fixed-effects, age at discharge, gender, an indicator for nonwhite race, community risk score, and a policy indicator variable equal to unity for observations drawn from ACE and non-demonstration treatment group hospitals during the demonstration period.

IMPAQ International, LLC Page 278 Evaluation of Medicare ACE Demonstration May 31, 2013 Final Evaluation Report
Exhibit D-14: Oklahoma Heart Hospital: Adjusted DID Analysis of Valve-Based Quality Measures
(CY 2007 Q3 – CY 2011 Q1)
Measure
ACE Sites Non-Demonstration Treatment Sites
DID Estimate
Odds Ratio
SE Wald/ t-Stat†
p-Value N DID
Estimate Odds Ratio
SE Wald/ t-Stat†
p-Value N
5. Postoperative hemorrhage/hematoma
6. Postoperative physiologic and metabolic derangement
7. Post-operative sepsis
14. Post-operative stroke
16. 30-day post-surgery mortality rate
0.83*** 2.30 0.20 17.75 <.0001 11,823
17. 30-day readmission rate
18. Case mix index 0.32* N/A 0.15 2.14 0.0321 14,952
20. Length of stay 1.31* N/A 0.65 2.02 0.0431 11,861
21. Medicare outlier patients
22a. Transfer to acute care hospital
22b. Transfer to post-acute care facility
*p<0.05, **p<0.01, ***p<0.001 † In the models estimated using a linear regression (measures 18 and 20), the exhibit provides the t-statistic. The remaining models were estimated using a logistic regression, thus the exhibit provides the Wald statistic. The regressions include hospital and quarter fixed-effects, age at discharge, gender, an indicator for nonwhite race, community risk score, and a policy indicator variable equal to unity for observations drawn from ACE and non-demonstration treatment group hospitals during the demonstration period.

IMPAQ International, LLC Page 279 Evaluation of Medicare ACE Demonstration May 31, 2013 Final Evaluation Report
Exhibit D-15: Oklahoma Heart Hospital: Adjusted DID Analysis of Pacemaker-Based Quality Measures
(CY 2007 Q3 – CY 2011 Q1)
Measure ACE Sites Non-Demonstration Treatment Sites
DID Estimate
Odds Ratio
SE Wald/ t-Stat†
p-Value N DID
Estimate Odds Ratio
SE Wald/ t-Stat†
p-Value N
5. Postoperative hemorrhage/hematoma
6. Postoperative physiologic and metabolic derangement
7. Post-operative Sepsis
14. Post-operative stroke
16. 30-day post-surgery mortality rate
17. 30-day readmission rate
18. Case mix index 0.08** N/A 0.03 2.59 0.0095 29,174
20. Length of stay 0.42* N/A 0.20 2.12 0.0341 25,373
21. Medicare outlier patients
22a. Transfer to acute care hospital
22b. Transfer to post-acute care facility
*p<0.05, **p<0.01, ***p<0.001 † In the models estimated using a linear regression (measures 18 and 20), the exhibit provides the t-statistic. The remaining models were estimated using a logistic regression, thus the exhibit provides the Wald statistic. The regressions include hospital and quarter fixed-effects, age at discharge, gender, an indicator for nonwhite race, community risk score, and a policy indicator variable equal to unity for observations drawn from ACE and non-demonstration treatment group hospitals during the demonstration period.

IMPAQ International, LLC Page 280 Evaluation of Medicare ACE Demonstration May 31, 2013 Final Evaluation Report
Exhibit D-16: Oklahoma Heart Hospital: Adjusted DID Analysis of CABG-Based Quality Measures (CY 2007 Q3 – CY 2011 Q1)
Measure
ACE Sites Non-Demonstration Treatment Sites
DID Estimate
Odds Ratio
SE Wald/ t-Stat†
p-Value N DID
Estimate Odds Ratio
SE Wald/ t-Stat†
p-Value N
5. Postoperative hemorrhage/hematoma
6. Postoperative physiologic and metabolic derangement
7. Post-operative sepsis
9. Use of internal mammary artery in first time isolated CABG
14. Post-operative stroke
16. 30-day post-surgery mortality rate
0.52* 1.68 0.22 5.82 0.0158 21,777
17. 30-day readmission rate
18. Case mix index
20. Length of stay
21. Medicare outlier patients
-1.64** 0.19 0.56 8.52 0.0035 26,795
22a. Transfer to acute care hospital
22b. Transfer to post-acute care facility
*p<0.05, **p<0.01, ***p<0.001 † In the models estimated using a linear regression (measures 18 and 20), the exhibit provides the t-statistic. The remaining models were estimated using a logistic regression, thus the exhibit provides the Wald statistic. The regressions include hospital and quarter fixed-effects, age at discharge, gender, an indicator for nonwhite race, community risk score, and a policy indicator variable equal to unity for observations drawn from ACE and non-demonstration treatment group hospitals during the demonstration period.

IMPAQ International, LLC Page 281 Evaluation of Medicare ACE Demonstration May 31, 2013 Final Evaluation Report
Exhibit D-17: Oklahoma Heart Hospital: Adjusted DID Analysis of PCI-Based Quality Measures (CY 2007 Q3 – CY 2011 Q1)
Measure
ACE Sites Non-Demonstration Treatment Sites
DID Estimate
Odds Ratio
SE Wald/ t-Stat†
p-Value N DID
Estimate Odds Ratio
SE Wald/ t-Stat†
p-Value N
5. Postoperative hemorrhage/hematoma
6. Postoperative physiologic and metabolic derangement
14. Post-operative stroke
16. 30-day post-surgery mortality rate
17. 30-day readmission rate
18. Case mix index 0.05*** N/A 0.01 3.70 0.0002 65,193
20. Length of stay 0.37*** N/A 0.10 3.73 0.0002 53,524
21. Medicare outlier patients
22a. Transfer to acute care hospital
22b. Transfer to post-acute care facility
*p<0.05, **p<0.01, ***p<0.001 † In the models estimated using a linear regression (measures 18 and 20), the exhibit provides the t-statistic. The remaining models were estimated using a logistic regression, thus the exhibit provides the Wald statistic. The regressions include hospital and quarter fixed-effects, age at discharge, gender, an indicator for nonwhite race, community risk score, and a policy indicator variable equal to unity for observations drawn from ACE and non-demonstration treatment group hospitals during the demonstration period.

IMPAQ International, LLC Page 282 Evaluation of Medicare ACE Demonstration May 31, 2013 Final Evaluation Report
Exhibit D-18: Lovelace Health System: Adjusted DID Analysis of Hip/Knee-Based Quality Measures (CY 2007 Q3 – CY 2011 Q1)
Measure
ACE Sites Non-Demonstration Treatment Sites
DID Estimate
Odds Ratio
SE Wald/ t-Stat†
p-Value
N DID
Estimate Odds Ratio
SE Wald/ t-Stat†
p-Value
N
5. Postoperative hemorrhage/hematoma
6. Postoperative physiologic and metabolic derangement
7. Post-operative sepsis
14. Post-operative stroke
16. 30-day post-surgery mortality rate
17. 30-day readmission rate
18. Case mix index
19a. Over age 75
19b. With hip fracture -1.02*** 0.36 0.35 8.65 0.0033 11,990
19c. With rheumatoid arthritis
20. Length of stay -0.70*** N/A 0.18 -3.91 <.0001 32,668 -0.32*** N/A 0.10 -3.30 0.001 34,318
21. Medicare outlier patients
22a. Transfer to acute care hospital
22b. Transfer to post-acute care facility
*p<0.05, **p<0.01, ***p<0.001 † In the models estimated using a linear regression (measures 18 and 20), the exhibit provides the t-statistic. The remaining models were estimated using a logistic regression, thus the exhibit provides the Wald statistic. The regressions include hospital and quarter fixed-effects, age at discharge, gender, an indicator for nonwhite race, community risk score, and a policy indicator variable equal to unity for observations drawn from ACE and non-demonstration treatment group hospitals during the demonstration period.

IMPAQ International, LLC Page 283 Evaluation of Medicare ACE Demonstration May 31, 2013 Final Evaluation Report
APPENDIX E: SUMMARY TRENDS FOR VOLUME ANALYSIS
Exhibit E-1: Global Average Quarterly Volume For Each Procedure

IMPAQ International, LLC Page 284 Evaluation of Medicare ACE Demonstration May 31, 2013 Final Evaluation Report

IMPAQ International, LLC Page 285 Evaluation of Medicare ACE Demonstration May 31, 2013 Final Evaluation Report

IMPAQ International, LLC Page 286 Evaluation of Medicare ACE Demonstration May 31, 2013 Final Evaluation Report

IMPAQ International, LLC Page 287 Evaluation of Medicare ACE Demonstration May 31, 2013 Final Evaluation Report
Exhibit E-2: Quarterly Pattern (Global: Within-Hospital Service Distribution)

IMPAQ International, LLC Page 288 Evaluation of Medicare ACE Demonstration May 31, 2013 Final Evaluation Report
Exhibit E-3: Physicians’ Choice of Hospitals for Performing ACE Procedures- Physicians Who Performed Procedures in Either Pre- or Post-period
ACE Cardiac DRGs ACE Sites
Non-Demonstration
sites
Relative Ratio (ACE: Non-
demonstration)
Pre Post Pre Post Pre Post Global
All ACE Card (N of ACE physicians of interest = 120)
Quarterly Mean Volume of Procedures per Physician
8.1 7.2 2.9 1.9 2.8:1 3.8:1
N of Procedures 6432 8726 3187 4171
ACE & ACE-related Card (N of ACE physicians of interest = 120)
Quarterly Mean Volume of Procedures per Physician
9.5 8.6 3.5 2.4 2.7:1 3.7:1
N of Procedures 7378 10350 3851 5172
ACE Orthopedic (N of ACE physicians of interest = 49)
Quarterly Mean Volume of Procedures per Physician
6.5 8.7 0.0 0.0 N/A N/A
N of Procedures 2507 4531 17 34
ACE & ACE-related Orthopedic (N of ACE physicians of interest= 49)
Quarterly Mean Volume of Procedures per Physician
10.2 12.2 0.0 0.0 N/A N/A
N of Procedures 3882 6384 27 48
Baptist
All ACE Card (N of ACE physicians of interest = 66)
Quarterly Mean Volume of Procedures per Physician
3.9 2.5 5.7 4.4 0.7:1 0.6:1
N of Procedures 1810 2114 2612 3773
ACE & ACE-related Card (N of ACE physicians of interest = 66)
Quarterly Mean Volume of Procedures per Physician
4.3 2.9 6.7 5.4 0.6:1 0.5:1
N of Procedures 2004 2529 3115 4651
ACE Orthopedic (N of ACE physicians of interest = 31)
Quarterly Mean Volume of Procedures per Physician
6.8 7.3 0.1 0.1 86.5:1 86.2:1
N of Procedures 1470 2930 17 34
ACE & ACE-related Orthopedic (N of ACE physicians of interest = 31)
Quarterly Mean Volume of Procedures per Physician
10.2 10.3 0.1 0.1 82.0:1 86.7:1
N of Procedures 2215 4160 27 48
Hillcrest
All ACE Card (N of ACE physicians of interest = 19)
Quarterly Mean Volume of Procedures per Physician
7.1 8.2 2.5 0.5 2.8:1 15.1:1
N of Procedures 809 2194 288 145
ACE & ACE-related Card (N of ACE physicians of interest = 19)
Quarterly Mean Volume of Procedures per Physician
9.3 10.3 3.0 0.6 3.1:1 16.5:1
N of Procedures 1058 2736 338 166
ACE Orthopedic (N of ACE physicians of interest = 7)
Quarterly Mean Volume of Procedures per Physician
9.3 12.8 0.0 0.0 N/A N/A
N of Procedures 392 1252
ACE & ACE-related Orthopedic (N of ACE physicians of interest = 7)
Quarterly Mean Volume of Procedures per Physician
14.1 17.6 0.0 0.0 N/A N/A

IMPAQ International, LLC Page 289 Evaluation of Medicare ACE Demonstration May 31, 2013 Final Evaluation Report
ACE Cardiac DRGs ACE Sites
Non-Demonstration
sites
Relative Ratio (ACE: Non-
demonstration)
Pre Post Pre Post Pre Post
N of Procedures 592 1721
OHH
All ACE Card
(N of ACE physicians of interest = 35)
Quarterly Mean Volume of Procedures per Physician
12.1 11.5 0.9 0.7 13.3:1 17.5:1
N of Procedures 3813 4418 287 253
ACE & ACE-related Card
(N of ACE physicians of interest = 35)
Quarterly Mean Volume of Procedures per Physician
13.7 13.2 1.3 0.9 10.8:1 14.3:1
N of Procedures 4316 5085 398 355
Lovelace-All 3
ACE Ortho
(N of ACE physicians of interest = 11)
Quarterly Mean Volume of Procedures per Physician
4.9 4.0 0.0 0.0 N/A N/A
N of Procedures 645 349
ACE & ACE-related Ortho
(N of ACE physicians of interest = 11)
Quarterly Mean Volume of Procedures per Physician
8.1 5.7 0.0 0.0 N/A N/A
N of Procedures 1075 503
Notes. 1. ACE Physicians of interest. In this analysis, we examine the behaviors of ACE physicians who performed significant anount of ACE procedures at the ACE sites in either the pre- or post-demonstration period. If an ACE physician performed at least the median of distribution of ACE procedures performed in either the pre- or post-demonstration period, we consider the physician performed significant amount of ACE procedures.

APPENDIX F: MEDICARE SAVINGS This appendix F provides an estimate of Medicare savings resulting from bundled payments due to the ACE Demonstration. We used the following equations to calculate Medicare savings for each episode of care: Medicare Bundled Savings = Pt. A plus Pt. B fee schedule – ACE Site’s Bundled Bid (1) Medicare Pt. A and Pt. B Fee Schedule = ACE Site’s Bid /(1 – [Pt. A and Pt. B Fee Schedule
Discount Amount]) (2) Medicare Bundled and PAC Savings = Medicare Bundled Savings – Effect of ACE on PAC Cost (3) where
Bid is the dollar amount of the bid from the ACE applications, adjusted for the IPPS annual payment update (APU). The APU adjustment is discussed in the note below. The bid amounts were extracted from each site’s ACE application.
Bundled discount amount is the percent discount proposed by the ACE sites on the expected amount Part A plus Part B payments in the absence of the demonstration. The discount amounts were derived from each site’s ACE application.
Effect of ACE on PAC cost is the per-episode effect of the demonstration on post-acute care costs. This estimate is based on the coefficients from the difference-in-differences (DID) regressions.
Note: Because the bundled payment bid and the Part A and Part B fee schedule amounts are expressed in FY 2008 dollars, we adjusted these figures for subsequent years using the IPPS APU amounts converted to an “APU index.” We multiplied the bundled payment bid and the Part A and Part B cost dollar figures by the APU index to “project forward” the FY 2008 figures to the appropriate year’s dollars. We did not make any adjustment for changes in the Part B payment. Exhibit F-1 presents the APU amounts and the APU index.
IMPAQ International, LLC Page 290 Evaluation of Medicare ACE Demonstration May 31, 2013 Final Evaluation Report

Exhibit F-1: APU Amounts and APU Index Used to Adjust FY 2008 Dollar Amounts
Year of Discharge Annual Payment
Updatea APU Index Values
FY 2008 N/A 1
FY 2009 3.60 1.0360
FY 2010 2.10 1.0578
FY 2011 2.35 1.0826
FY 2012 1.90 1.1032 a APU amounts were gathered from the IPPS Final Rules, available from: FY 2009: http://edocket.access.gpo.gov/2008/pdf/E8-17914.pdf FY 2010: http://edocket.access.gpo.gov/2009/pdf/E9-18663.pdf FY 2011: http://edocket.access.gpo.gov/2010/pdf/2010-19092.pdf FY 2012: http://www.gpo.gov/fdsys/pkg/FR-2011-08-18/pdf/2011-19719.pdf
Exhibit F-2 provides aggregate information about Medicare savings from the ACE Demonstration. As a result of the discounted bundled payments to ACE sites, Medicare saved an average of $585 per episode from the combined Medicare Part A and B expected payments. This is the estimated average dollar savings across all episodes, all ACE MS-DRGs, and all ACE sites. CMS is also interested in the total effect of the ACE demonstration on inpatient and post-acute care costs. We produced estimates of PAC costs for each ACE episode. The DID analyses indicated that PAC costs increased by an average of $266 per episode. After taking this increase into account, Medicare saved an average of $319 per episode as a result of the ACE Demonstration. Multiplying by the number of ACE episodes (12,501) gives Medicare a total savings of $3,991,078.
Exhibit F-2: Medicare Cost Savings from the ACE Demonstration
Savings Per Episode
Savings (Cost Increase)
Total Savings (Cost Increase)
Part A and Part B Episode (Bundled) $585 $7,313,760
Effect of ACE on PAC Costa ($266) ($3,322,681)
Net Savings to Medicare $319 $3,991,078 a
In cases where the post-acute care cost estimate parameter was not statistically significant from zero at p<.05, we set the PAC effect equal to zero. The PAC amount shown here is averaged over all sites and procedures. Exhibit 5 shows the results for each procedure group by site and contains zeroes for the effect on PAC cost as appropriate. Exempla St. Joseph Hospital was excluded from the estimates due to small sample numbers. Total number of ACE episodes = 12,501.
IMPAQ International, LLC Page 291 Evaluation of Medicare ACE Demonstration May 31, 2013 Final Evaluation Report

Exhibits F-3 through F-5 disaggregate the Medicare cost calculations in different ways. Exhibit F-3 provides this information by procedure group. Per-episode savings ranged from $71 per episode for PCI procedures ($303,767 in total net savings after accounting for PAC costs/savings) to $1,077 per episode for defibrillator procedures ($655,674 in total net savings). The largest aggregate savings were from orthopedic (hip/knee) procedures. Even though per-episode savings were the second smallest ($265 per episode), the large volume of orthopedic procedures resulted in total net savings of over $1.1 million. Using a weighted average by the number of episodes, each procedure group except defibrillator showed an increase in PAC costs as a result of the demonstration and, thus, reduced savings.
Exhibit F-3: Medicare Savings from the ACE Demonstration, by Procedure Group
Per Episode Savings
(Cost Increase) Total Savings
(Cost Increase)
Bundled Payment
Effect of ACE on PAC Costa
Net Savings to
Medicare
Bundled Payment
Net Savings to Medicare
Number of Episodes
CABG $1,114 ($411) $703 $1,494,082 $943,298 1,341
Defibrillator $1,045 $32 $1,077 $636,245 $655,674 609
Hip/Knee $377 ($112) $265 $1,645,561 $1,155,891 4,363
PCI $445 ($374) $71 $1,898,874 $303,767 4,267
Pacemaker $590 ($211) $379 $725,092 $465,304 1,229
Valve $1,321 ($646) $675 $913,906 $467,144 692 a In regressions where the post-acute care cost estimate parameter was not statistically significant from zero at p<.05, we set the PAC effect equal to zero. The effects shown here are averaged over sites and are thus non-zero. Exempla St, Joseph Hospital was excluded from the estimates due to small sample numbers.
Exhibit F-4 provides cost savings information by ACE site. Savings were smallest for Oklahoma Heart Hospital (OHH), both in per-episode terms and in total ($99 per episode; $422,126 in total net savings). Lovelace Medical System (LMS) had the largest per-episode savings ($1,501 per episode; $456,257 in total net savings), and Hillcrest Medical Center (HMC) had the largest total net savings ($814 per episode; $2,457,433 in total net savings). The ACE Demonstration decreased PAC costs for HMC and LMS, but increased PAC costs for Baptist Medical System (BMS) and OHH.
IMPAQ International, LLC Page 292 Evaluation of Medicare ACE Demonstration May 31, 2013 Final Evaluation Report

IMPAQ International, LLC Page 293 Evaluation of Medicare ACE Demonstration May 31, 2013 Final Evaluation Report
Exhibit F-4: Medicare Savings from the ACE Demonstration, by ACE Site
Per Episode Savings
(Cost Increase) Total Savings
(Cost Increase)
ACE Site Bundled Payment
Effect of ACE on
PAC Costa
Net Savings to Medicare
Bundled Payment
Net Savings to Medicare
Number of
Episodes
Baptist Health System (BHS) $823 ($690) $133 $4,057,760 $655,262 4,931
Hillcrest Medical Center (HMC) $746 $68 $814 $2,252,738 $2,457,433 3,020 Lovelace Medical System (LMS) $432 $1,069 $1,501 $131,181 $456,257 304
Oklahoma Heart Hospital (OHH)
$205 ($106) $99 $872,081 $422,126 4,246
a In cases where the post-acute care cost estimate parameter was not statistically significant from zero at p<.05, we set the PAC effect equal to zero. The effects shown here are the weighted (number of episodes) averages over procedure groups and are thus non-zero.
Exhibit F-5 provides additional detail on cost savings, disaggregating the figures by ACE site and procedure group. HMC’s CABG procedures generated the highest per-episode savings ($2,463 per episode; $512,350 in total net savings) while OHH’s PCI episodes were the only procedures to produce cost increases ($156 per episode; $343,953 in total cost increases). HMC’s orthopedic procedures generated the largest total net savings ($696,614). At BHS, PAC costs increased as a result of the demonstration, regardless of procedure group. PAC costs decreased for CABG procedures at HMC while the other five procedure groups at that hospital experienced no statistically significant change in PAC costs. PAC costs also decreased for LMS’s orthopedic procedures. At OHH, the demonstration resulted in a decrease in PAC costs for defibrillator procedures, an increase for PCI procedures, and no change for CABG, pacemaker, or valve procedures.

Exhibit F-5: Medicare Savings from the ACE Demonstration, by ACE Site and Procedure Group
CABG Defibrillator Hip/Knee PCI Pacemaker Valve
Baptist Health System (BHS)
Savings per Episode Bundled Payment $2,549 $2,337 $284 $1,000 $1,219 $3,750
Effect of ACE on PAC Cost Per Episodea ($2,015) ($1,306) ($283) ($923) ($677) ($3,463)
Savings per Episode: Bundled Payment and PAC $535 $1,030 $1 $76 $542 $287
Total Savings: Bundled Payment $955,930 $287,424 $817,767 $1,044,961 $467,942 $483,735
Total Savings: Bundled Payment and PAC $200,452 $126,727 $3,020 $79,935 $208,154 $36,973
Number of Episodes 375 123 2,875 1,045 384 129
Hillcrest Medical Center (HMC)
Savings per Episode Bundled Payment $1,479 $1,273 $588 $557 $639 $1,902
Effect of ACE on PAC Cost Per Episodea $984 $0 $0 $0 $0 $0
Savings per Episode: Bundled Payment and PAC $2,463 $1,273 $588 $557 $639 $1,902
Total Savings: Bundled Payment $307,655 $277,488 $696,614 $567,785 $171,131 $232,065
Total Savings: Bundled Payment and PAC $512,350 $277,488 $696,614 $567,785 $171,131 $232,065
Number of Episodes 208 218 1,184 1,020 268 122
Lovelace Medical System (LMS)
Savings per Episode Bundled Payment $432
Effect of ACE on PAC Cost Per Episodea $1,069
Savings per Episode: Bundled Payment and PAC $1,501
Total Savings: Bundled Payment $131,181
Total Savings: Bundled Payment and PAC $456,257
Number of Episodes 304
Oklahoma Heart Hospital (OHH)
Savings per Episode Bundled Payment $304 $266 $130 $149 $449
Effect of ACE on PAC Cost Per Episodea $0 $672 ($286) $0 $0
Savings per Episode: Bundled Payment and PAC $304 $938 -$156 $149 $449
Total Savings: Bundled Payment $230,496 $71,333 $286,128 $86,019 $198,105
Total Savings: Bundled Payment and PAC $230,496 $251,459 -$343,953 $86,019 $198,105
Number of Episodes 758 268 2,202 577 441 a
In cases where the post-acute care cost estimate parameter was not statistically significant from zero at p<.05, we set the PAC effect equal to zero. Exempla St. Joseph Hospital was excluded from the estimates due to small sample numbers.
IMPAQ International, LLC Page 294 Evaluation of Medicare ACE Demonstration May 31, 2013 Final Evaluation Report

IMPAQ International, LLC Page 295 Evaluation of Medicare ACE Demonstration May 31, 2013 Final Evaluation Report
Medicare savings are based on the sites’ bundled payment bids, the discount to expected payments that those bids represented, the annual payment update amounts from the IPPS Final Rules, and estimates of the impact of the demonstration on post-acute care costs. Overall, the discounted bundled payments generated savings of $585 per episode, or a total of $7.3 million. However, increases in PAC costs reduced these savings by approximately 45 percent, resulting in per-episode savings of $319 and total net savings of approximately $4 million.