Evaluation of the Lateral Performance of Roof Truss-to .../media/Files... · below. Particularly,...
44
Forest Product Labo Na Evaluation of Roof Truss-to Fram Prepared for oratory, Forest Service, U.S. Department of Agricultu ational Association of Home Builders Prepared by NAHB Research Center, Inc. 400 Prince George’s Boulevard Upper Marlboro, MD 20774 August 8, 2011 f the Lateral Performan o-Wall Connections in me Wood Systems ure nce of Light -
Transcript of Evaluation of the Lateral Performance of Roof Truss-to .../media/Files... · below. Particularly,...

Forest Product Laboratory, Forest Service, U.S. Department of Agriculture
National Association of Home Builders
Evaluation of
Roof Truss-to
Frame Wood Systems
Prepared for
Forest Product Laboratory, Forest Service, U.S. Department of Agriculture
National Association of Home Builders
Prepared by
NAHB Research Center, Inc.
400 Prince George’s Boulevard
Upper Marlboro, MD 20774
August 8, 2011
Evaluation of the Lateral Performance of
to-Wall Connections in Light
Frame Wood Systems
Forest Product Laboratory, Forest Service, U.S. Department of Agriculture
the Lateral Performance of
in Light-

Acknowledgements
This research was supported in part by funds provided by the Forest Products Laboratory, Forest
Service, USDA.
This research was supported in part by
Disclaimer
Neither the NAHB Research Center, Inc., nor any person acting in its behalf, makes any warranty,
express or implied, with respect to the use of any information,
in this publication or that such use may not infringe privately owned rights, or assumes any liabilities
with respect to the use of, or for damages resulting from the use of, any information, apparatus,
method, or process disclosed in this publication, or is responsible for statements made or opinions
expressed by individual authors.
This research was supported in part by funds provided by the Forest Products Laboratory, Forest
This research was supported in part by funds provided by the National Association of Home Builders.
Neither the NAHB Research Center, Inc., nor any person acting in its behalf, makes any warranty,
express or implied, with respect to the use of any information, apparatus, method, or process disclosed
in this publication or that such use may not infringe privately owned rights, or assumes any liabilities
with respect to the use of, or for damages resulting from the use of, any information, apparatus,
ocess disclosed in this publication, or is responsible for statements made or opinions
This research was supported in part by funds provided by the Forest Products Laboratory, Forest
funds provided by the National Association of Home Builders.
Neither the NAHB Research Center, Inc., nor any person acting in its behalf, makes any warranty,
apparatus, method, or process disclosed
in this publication or that such use may not infringe privately owned rights, or assumes any liabilities
with respect to the use of, or for damages resulting from the use of, any information, apparatus,
ocess disclosed in this publication, or is responsible for statements made or opinions

NAHB Research Center, Inc. August 8, 2011 i
Table of Contents
INTRODUCTION ............................................................................................................................................. 1
OBJECTIVES ................................................................................................................................................... 1
CODE REQUIREMENTS .................................................................................................................................. 1
LOADING CONSIDERATIONS ......................................................................................................................... 3
Wind Considerations ................................................................................................................................. 4
Seismic Considerations ............................................................................................................................. 7
METHODS AND MATERIALS .......................................................................................................................... 7
General ...................................................................................................................................................... 7
Specimen Construction ........................................................................................................................... 12
Test Setup and Protocol .......................................................................................................................... 18
RESULTS ...................................................................................................................................................... 20
SUMMARY AND CONCLUSIONS .................................................................................................................. 31
REFERENCES ................................................................................................................................................ 34
APPENDIX A ................................................................................................................................................. 35
APPENDIX B ................................................................................................................................................. 36

August 8, 2011 NAHB Research Center, Inc. ii
List of Tables
Table 1 – 2012 IRC Provisions for Roof-to-Wall Attachment ........................................................................ 2
Table 2 – Test Matrix .................................................................................................................................... 9
Table 3 – Specimen Materials and Construction ........................................................................................ 13
Table 4 – Truss Blocking Construction ........................................................................................................ 14
Table 5 – Test Results .................................................................................................................................. 21
Table 6 – Roof Connection Performance Relative to Typical Design Wind Loads ...................................... 31
List of Figures
Figure 1 – Prescriptive detailing options in IRC ............................................................................................ 3
Figure 2 – Wind and seismic loading in the parallel to wind direction ......................................................... 4
Figure 3 – ASCE 7 wind loading profile ......................................................................................................... 5
Figure 4 – Tributary area of wind loads ........................................................................................................ 5
Figure 5 – Specimen construction ............................................................................................................... 15
Figure 6 – Truss blocking details ................................................................................................................. 16
Figure 7 – Test set-up and instrumentation ............................................................................................... 19
Figure 8 – Photo of test setup ..................................................................................................................... 20
Figure 9 – Comparison of peak capacities per truss connection ................................................................ 23
Figure 10 – Load vs. displacement curves (measured at peak of the roof) ................................................ 23
Figure 11 – Gypsum fastener tear-through (Specimen A) .......................................................................... 24
Figure 12 – Complete failure of gypsum fasteners (Specimen A) ............................................................... 24
Figure 13 – Rotation of hurricane clip at failure (Specimen A) ................................................................... 24
Figure 14 – Truss member displacement at heel metal plate (Specimen A) .............................................. 24
Figure 15 – Buckling of hurricane clip (Specimen C) ................................................................................... 26
Figure 16 – Specimen C heel rotation at failure ......................................................................................... 26
Figure 17 – Comparison of rotation at Truss 5 (Specimen D) ..................................................................... 27
Figure 18 – Truss rotation of Specimen E at failure (Truss 5) ..................................................................... 27
Figure 19 – Comparison of truss heel rotation (Specimen F) ..................................................................... 28
Figure 20 – Rotation of truss heel at blocking location (Specimen G) ........................................................ 29

Evaluation of High Heel Truss-to-Wall Connections
NAHB Research Center, Inc. August 8, 2011 1
INTRODUCTION
The 2009 International Residential Code (IRC) includes new requirements for roof-to-wall connections
(Section R602.10.6) at braced wall panels. These new requirements were introduced in a related effort to
the work of the ICC Ad Hoc Committee on Wall Bracing1 with the intent to clarify or, where appropriate,
reinforce the lateral load path between the roof and the braced wall panels of the supporting walls
below. Particularly, significant changes were introduced for homes with high-heel trusses or deep rafters
and for homes located in high hazard areas (wind speeds of 100 mph or higher or Seismic Design
Category D0, D1, or D2). The requirements include provisions for additional fastening, blocking, knee
walls, sheathing, or a combination of those elements. These requirements were further clarified and
refined for the 2012 IRC.
The new requirements are labor intensive and have implications on the cost and time of construction,
particularly as high-heel roof configurations become more common as a solution for meeting increasing
energy efficiency standards. The proposed testing program is designed to benchmark the performance of
traditional roof systems and incrementally-improved roof-to-wall systems with the goal of developing
connection solutions that are optimized for performance and constructability.
OBJECTIVES
With the general focus on the lateral capacity of the roof-to-wall connections in the direction parallel to
ridge, the specific objectives of this test study are to:
1) Establish performance-based limitations on traditional low-heel roof-to-wall connections using
hurricane ties and without blocking, with specific intent to:
a) Benchmark the capacities of the unblocked roof diaphragm and unblocked ceiling diaphragms
tested as part of a roof assembly
b) Benchmark the rotational response of the unblocked roof-to-wall connections
c) Understand the system response of the overall roof assembly including the interaction between
roof and ceiling diaphragms
2) Establish performance-based limitations for unblocked high-heel roof trusses attached with hurricane
ties
3) Measure the performance of high-heel truss systems with intermittent blocking
4) Measure the performance of high-heel truss systems braced against rotation with wood structural
panel sheathing attached to the vertical heel member of the truss
CODE REQUIREMENTS
The new IRC provisions are intended to increase the capacity of the heel joint in (1) resisting lateral forces
between the roof and the wall and (2) resisting local rotation of the roof members at supports. Table 1
1 The Ad Hoc Committee on Wall Bracing was established by the International Code Council (ICC) to review the
provisions of the International Residential Code (IRC) related to wall bracing.

Evaluation of High Heel Truss-to-Wall Connections
August 8, 2011 NAHB Research Center, Inc. 2
summarizes the 2012 IRC provisions for attachment of roof to walls. Figure 1 illustrates the IRC
prescriptive detailing options. The special detailing requirements are triggered based on the following:
• Wind speed of 100 mph or greater; • Seismic design category D0 and higher, and, • Heel heights of 9¼” and 15¼”.
Table 1 – 2012 IRC Provisions for Roof-to-Wall Attachment
Triggers Minimum Requirements Notes
Wind/Seismic Roof Configuration
Wind less than 100
mph and SDC A, B, C
Rafter or truss heel
joint 9¼ or less
Nailed connection per IRC Table R602.3(1) At each heel joint
along the length of the
entire wall
Rafter heel joint
height 9¼”—15¼”
Nailed connection per IRC Table R602.3(1)
AND
Partial height blocking nailed to wall top
plate
Blocking is only at the
braced wall panel
Truss heel joint height
9¼”—15¼”
Trusses attached per IRC Sections R802.10
and R802.11
AND
Partial height blocking nailed to wall top
plate
Wind 100 mph or
greater and SDC D0,
D1, D2
Rafter or truss heel
joint height up to
15¼”
Nailed connection per IRC Table R602.3(1)
AND
Partial height blocking nailed to wall top
plate
All wind speeds and all
SDCs
Rafter or truss heel
joint exceeds 15¼”
Options:
(1) Blocking at overhang and at top plate
per Figure R602.10.6.2(2)
(2) Partial height blocking with wall panels
per Figure R602.10.6.2(3)
(3) Engineered full-height blocking panels
nailed to roof sheathing (blocked
diaphragm)
(4) Other engineered methods
In the 2012 IRC, blocking is the primary method to increase the lateral capacity of the heel joint. The
blocking members transfer shear load to the top plate of the wall below through face nailing or toe-
nailing and restrict local rotation of the roof framing members caused by the eccentricity of the heel
joint. The load from the roof diaphragm is transferred into the blocking either through end bearing or, if
constructed as a blocked diaphragm with the roof sheathing nails penetrating the blocking, through the
sheathing fasteners.

Evaluation of High Heel Truss-to-Wall Connections
NAHB Research Center, Inc. August 8, 2011 3
(a) Partial Height Solid Blocking (b) Eave Bracing
(c) Blocking Panels
Figure 1 – Prescriptive detailing options in IRC
LOADING CONSIDERATIONS
The heel joint at the roof-to-wall interface is subject to wind and seismic forces including:
• Lateral forces (wind or seismic); • Uplift forces (wind; roof uplift forces due to vertical seismic accelerations are not considered in
residential design), and,
• Rotational (overturning) forces (secondary forces due to eccentricity of lateral force).
The scope of this project is limited to investigating the lateral load path and the connections and detailing
in the IRC for resisting lateral forces in the direction perpendicular to the roof framing members (i.e.,

Evaluation of High Heel Truss-to-Wall Connections
August 8, 2011 NAHB Research Center, Inc. 4
parallel to the ridge of the roof). Figure 2 shows the loads and the forces in the direction of interest of
this study (note that uplift and orthogonal components are not shown intentionally for clarity). The
perpendicular to ridge direction is not included as it does not contribute to the lateral load or overturning
moment in the direction perpendicular to the trusses.
The impact of the uplift component on the response of roof systems with toe nails or hurricane ties
under combined loading has been extensively studied by others (Riley & Sadek 2003, Scoville 2005, Kopp
2010, and Simpson Strong-Tie 2010) and, therefore, is not included in this testing program. In addition,
the wind uplift forces do not have direct effect on the unblocked diaphragm action, cross-grain bending
of roof members, truss rotation, and blocking performance -- the primary areas of this study.
Furthermore, significant spatial variations of wind uplift pressure exist across the roof surface and the
wind profiles developed specifically for design purposes (i.e. ASCE 7) may not be directly applicable to
full-scale roof testing for combined loading applications. Their effects should be captured more
accurately through full-size wind tunnel testing.
Figure 2 – Wind and seismic loading in the parallel to wind direction
(Uplift and orthogonal components are not shown for clarity)
Lateral forces from wind and seismic events are generated through two different mechanisms and
imposed on the structure in two different manners. Therefore, the loading type has implications on the
selection of appropriate testing procedures. Wind pressures act on the building surfaces whereas seismic
forces act at the location of the masses of the building elements. The discussion below identifies the
unique features of each loading type with respect to the forces acting at the roof-to-wall connections.
Wind Considerations
The ASCE 7 lateral wind load profile in the direction parallel to the ridge is shown in Figure 3 with wind
pressures acting on both the windward wall surface (positive pressure) and leeward wall surface
(negative pressure – suction) of the building. For a typical residential floor aspect ratio, the windward
pressure is about twice the leeward pressure. These pressures have the same vector direction and their

Evaluation of High Heel Truss-to-Wall Connections
NAHB Research Center, Inc. August 8, 2011 5
actions are superimposed to develop the total lateral force acting on the building. The wind pressures on
the wall surface are transferred through the vertical framing members to roof, ceiling and floor
diaphragms and from there to shear walls. This discussion is focused on the forces transferred from the
gable end walls into the roof assembly and into the walls below the roof assembly. The forces from gable
end wall wind pressures are resisted by the roof sheathing diaphragm and the ceiling diaphragm. Figure 4
shows the tributary wind areas associated with each diaphragm. The applicable forces from the top story
wall are transferred into the ceiling diaphragm. Typical bracing details at the gable end wall are intended
to redistribute the load into the diaphragms and may to some degree affect the distribution of forces
between the roof sheathing diaphragm and the ceiling diaphragm. This bracing may also impart some
amount of rotational restraint to the roof members near the gable ends. Conversely, this restraint
contribution would be minimal at the interior roof sections.
(a) Directional Procedure (b) Envelope Procedure
Figure 3 – ASCE 7 wind loading profile
Figure 4 – Tributary area of wind loads
Eccentricity at the connection depends on the ratio of load delivered to the truss heel through the ceiling
to the load delivered through the roof diaphragms, with a higher ratio indicating that there is less load
transferred through the roof sheathing and therefore less overturning load at the truss heel. Each
Trib. Load to
Roof Diaphragm
Trib. Load to
Ceiling Diaphragm
Tributary Load to
Roof Diaphragm
Tributary Load to
Ceiling Diaphragm

Evaluation of High Heel Truss-to-Wall Connections
August 8, 2011 NAHB Research Center, Inc. 6
diaphragm resists a part of the total load and the ratio of the loads between the two diaphragms varies
depending upon the roof configuration and location of the gable end wind load resultant. Example 1 is
provided below to calculate the ratio of load to the two diaphragms for a typical house configuration. For
a house with a 5/12 roof pitch and a roof span of 32 feet, the resultant loading ratio of ceiling diaphragm
load to roof diaphragm load is 3.2 to 1, i.e., the force transferred through the ceiling diaphragm is 3.2
time greater than the force transferred through the roof diaphragm. For a roof pitch of 7/12 for the same
house configuration, the loading ratio is 2.5 to 1.
Example 1 – Calculation of the ratio of wind load to roof diaphragms
Building Configuration:
Building plan: 32 feet by 50 feet
Two stories
Story height: 9 feet
Roof pitch: 5:12
Mean roof height: 25 feet
Gable end roof
Wind parallel to ridge
Overhang: 2 feet
Basic Wind Speed: 140 mph (ASCE 7-10)
Exposure: B
Wind pressure: 30 psf (rounded for simplicity of calculations)
Gable end wall forces:
Total gable end area:
(Dist. from top of wall to ridge) x (Roof width) x 0.5
[((32’/2)+2’)(5/12)] x (32’+4’) x (0.5) = 135 ft2
Force into each diaphragm from gable end:
(Simply-supported, vertical framing members spanning between two diaphragms)
(135 ft2) x (30 psf) x (0.5) = 2,025 lb
2nd
Story wall forces:
Tributary wall area of the top story:
(Building width) x (Wall height) x 0.5
(32’) x (9’) x (0.5) = 144 ft2
Force into ceiling diaphragm from top story wall:
(144 ft2) x (30 psf) = 4,320 lb
Ratio of roof diaphragm load to ceiling diaphragm load:
1 : 3.2
The same example for a roof pitch of 7/12 results in:
1 : 2.5

Evaluation of High Heel Truss-to-Wall Connections
NAHB Research Center, Inc. August 8, 2011 7
Seismic Considerations
Unlike wind pressures that are imposed on the outside shell of the structure, seismic load is distributed
throughout the building based on the mass of the elements. The eccentricity at the truss heel connection
is still governed, however, by the ratio of loading between the two diaphragms. The total force resisted
by the roof-to-wall connections is associated with (1) the mass of the roof diaphragm, (2) the mass of the
ceiling diaphragm and (3) the mass of half the height of the top story walls below the roof gable end. The
walls supporting the roof eave do not directly contribute to the overturning forces at the roof heel.
The distribution of the weight between the two diaphragms is close to symmetric with the weight of the
sheathing materials (OSB and gypsum) and the primary framing members being located around the
perimeter of the roof triangle. The weight of the shingles is attributed to the top chords, and the weight
of insulation, eaves, overhangs, any mechanical equipment is attributed to the bottom of the roof
assembly. Example 2 below shows that the top story walls contribute only 10% to the total lateral force
resisted by the ceiling diaphragm and that contribution is ignored for the purposes of this study.
Therefore, the resultant loading ratio of ceiling diaphragm load to roof diaphragm load is about 1 to 1,
i.e., half of the total force is transferred through the ceiling diaphragm and half through the roof
sheathing diaphragm.
METHODS AND MATERIALS
General
Testing was conducted at the NAHB Research Center Laboratory Facility located in Upper Marlboro, MD.
All specimens were constructed in the laboratory and all construction materials were purchased from
local suppliers.
Example 2 – Calculation of the eccentricity of seismic load
Building Configuration:
Building plan: 32 feet by 50 feet
Two stories
Story height: 9 feet
Roof pitch: 5:12
Mean roof height: 25 feet
Gable end roof
Acceleration parallel to ridge
Overhang: 2 feet
Roof dead load: 15 psf
Wall dead load: 9 psf
Roof weight: (15 psf) x (32’+2’) x (50’) = 25,500 lb (half overhang is used at 15 psf dead load)
Wall weight: (9 psf) x (32’) x (9’/2) x (2 walls) = 2,592 lb
Ratio of roof diaphragm load to ceiling diaphragm load:
1 : 1

Evaluation of High Heel Truss-to-Wall Connections
August 8, 2011 NAHB Research Center, Inc. 8
Table 2 provides a test matrix summarizing specimen configurations including connections, truss heel
height, and blocking. A purpose statement with explanation is provided for each configuration. A total of
nine (9) full size roof systems were tested with various levels and types of heel detailing to measure the
lateral performance of the roof-to-wall interface.

Evaluation of High Heel Truss-to-Wall Connections
NAHB Research Center, Inc. August 8, 2011 9
Table 2 – Test Matrix
Configuration Diagram Truss / Heel
Height Roof-to-Wall
Attachment
Blocking/Bracing
at Heel Purpose Notes
A –Low-heel truss
Low-heel truss
at 24” oc
H=9¼”
H2.5T hurricane
clip at each truss
None
- Benchmark performance of typical
low-heel trusses
- Benchmark performance of
unblocked roof and ceiling
diaphragms
This configuration will
allow establishing
performance limits on the
conventional low-heel
roof system with
hurricane clip connections
B – High-heel
truss without
blocking
High-heel truss
at 24” oc
H=15¼”
H2.5T hurricane
clip at each truss
None
Investigate the impact of a high heel
truss through comparison to
Configuration A
This configuration will
allow establishing limits
on high-heel conditions
constructed w/o
blocking/bracing
C – High-heel
truss without
blocking
with low (3/12)
roof pitch
High-heel truss
at 24” oc
H=15¼”
H2.5T hurricane
clip at each truss
None
Through comparison to configuration
B, the impact of low roof slope
(presumed decreased rotational
restraint from the roof sheathing)
will be investigated
This configuration will
demonstrate whether
roof slope has a
measurable impact on
contribution of roof
sheathing to overturning
resistance of the roof heel
D – High-heel
truss braced with
OSB sheathing
High-heel truss
at 24” oc
H=15¼”
H2.5T hurricane
clip at each truss
Truss heel is
braced with OSB
sheathing (OSB is
not extended over
wall top plate)
Evaluate the effectiveness of
continuous OSB sheathing nailed to
the truss heel in restraining truss
overturning
This configuration
represents an alternative
to the blocking details in
the 2012 IRC
Evaluation of High Heel Truss-to-Wall Connections
August 8, 2011 NAHB Research Center, Inc. 10
Configuration Diagram Truss / Heel
Height Roof-to-Wall
Attachment
Blocking/Bracing
at Heel Purpose Notes
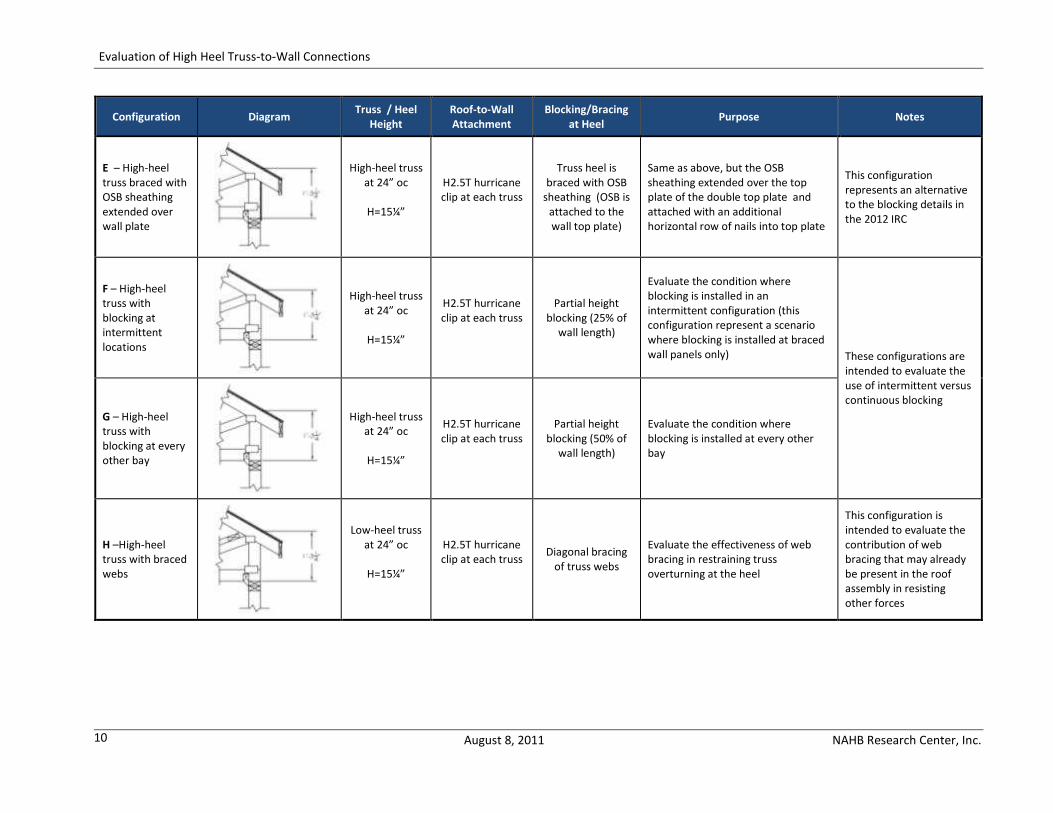
E – High-heel
truss braced with
OSB sheathing
extended over
wall plate
High-heel truss
at 24” oc
H=15¼”
H2.5T hurricane
clip at each truss
Truss heel is
braced with OSB
sheathing (OSB is
attached to the
wall top plate)
Same as above, but the OSB
sheathing extended over the top
plate of the double top plate and
attached with an additional
horizontal row of nails into top plate
This configuration
represents an alternative
to the blocking details in
the 2012 IRC
F – High-heel
truss with
blocking at
intermittent
locations
High-heel truss
at 24” oc
H=15¼”
H2.5T hurricane
clip at each truss
Partial height
blocking (25% of
wall length)
Evaluate the condition where
blocking is installed in an
intermittent configuration (this
configuration represent a scenario
where blocking is installed at braced
wall panels only) These configurations are
intended to evaluate the
use of intermittent versus
continuous blocking
G – High-heel
truss with
blocking at every
other bay
High-heel truss
at 24” oc
H=15¼”
H2.5T hurricane
clip at each truss
Partial height
blocking (50% of
wall length)
Evaluate the condition where
blocking is installed at every other
bay
H –High-heel
truss with braced
webs
Low-heel truss
at 24” oc
H=15¼”
H2.5T hurricane
clip at each truss
Diagonal bracing
of truss webs
Evaluate the effectiveness of web
bracing in restraining truss
overturning at the heel
This configuration is
intended to evaluate the
contribution of web
bracing that may already
be present in the roof
assembly in resisting
other forces

Evaluation of High Heel Truss-to-Wall Connections
NAHB Research Center, Inc. August 8, 2011 11
Configuration Diagram Truss / Heel
Height Roof-to-Wall
Attachment
Blocking/Bracing
at Heel Purpose Notes
I – High-heel
truss braced with
OSB sheathing
and a reinforced
ceiling diaphragm
High-heel truss
at 24” oc
H=15¼”
H2.5T hurricane
clip at each truss
Sheathing
extended down to
capture top plate
Evaluate performance of
Configuration E blocking method
with reinforced gypsum diaphragm
The ceiling diaphragm is
reinforced in an attempt
to force failure at the
truss heel connection
instead of the gypsum
diaphragm. This test is
intended to validate the
performance of OSB
bracing detail at higher
diaphragm capacities (i.e.,
higher overturning force
at the heel).

Evaluation of High Heel Truss-to-Wall Connections
August 8, 2011 NAHB Research Center, Inc. 12
Specimen Construction
Table 3 provides a summary of materials and methods used in construction of the specimens and Table
4 provides details of the various blocking/bracing methods.
Each specimen was constructed with five (5) 24-foot span wood trusses spaced at 24 inches on center,
with the overall size of the full roof system at 24 feet wide by 8 feet deep with additional 16-inch long
overhangs on each side (Figure 5). Trusses were supported at the heel by 4-foot high light-frame knee
walls anchored to the lab’s strong floor. The strength and stiffness of the knee walls was sufficiently
higher than that of the roof system to prevent any significant deformations in the supporting structure.
The roof trusses were attached to the double top plate of the knee wall in accordance with fastening
schedules specified in Tables 3 and 4. The double top plate was attached to the knee wall framing with
bolts and was replaced after each test.
For all tests, the truss bottom chords were connected to the top plates of the supporting knee walls
using H2.5T hurricane clips. The clips on both ends of a truss were installed on the same face of that
truss; the installation face was alternated between adjacent trusses (Figure 5) to eliminate any
directional bias in the resistance behavior of the clips. A continuous 1x6 nominal fascia board was
installed on both sides of the specimens.
The roof sheathing was installed perpendicular to the truss top chord members with a staggered panel
layout. Metal sheathing clips were installed on the unblocked edges of each panel at 24 inches on center
between the framing members. A 2-inch wide roof vent was provided at the ridge (one inch each side of
the ridge) such that bearing of panel edges did not occur during testing.
The ceiling gypsum panels were installed perpendicular to the truss bottom chord members and the first
row of fasteners was located approximately 8 inches from each knee wall (i.e., floating edges) in
accordance with the Gypsum Association’s Application and Finishing of Gypsum Panel Products (GA-216-
2010). All interior gypsum panel joints were taped and mudded, no finishing was done at the interface
of the ceiling and the knee walls. The ceiling diaphragm of Specimen I was reinforced at the front and
back trusses with a double top plate boundary member and 2x nailing member (Figure 6(f)). The
fastener spacing of the ceiling diaphragm in Specimen I was also reduced from 12 to 8 inches on center
to increase the diaphragm’s capacity. (Specimens A through H were constructed without these
additional boundary/chord members.)
Evaluation of High Heel Truss-to-Wall Connections
NAHB Research Center, Inc. August 8, 2011 13
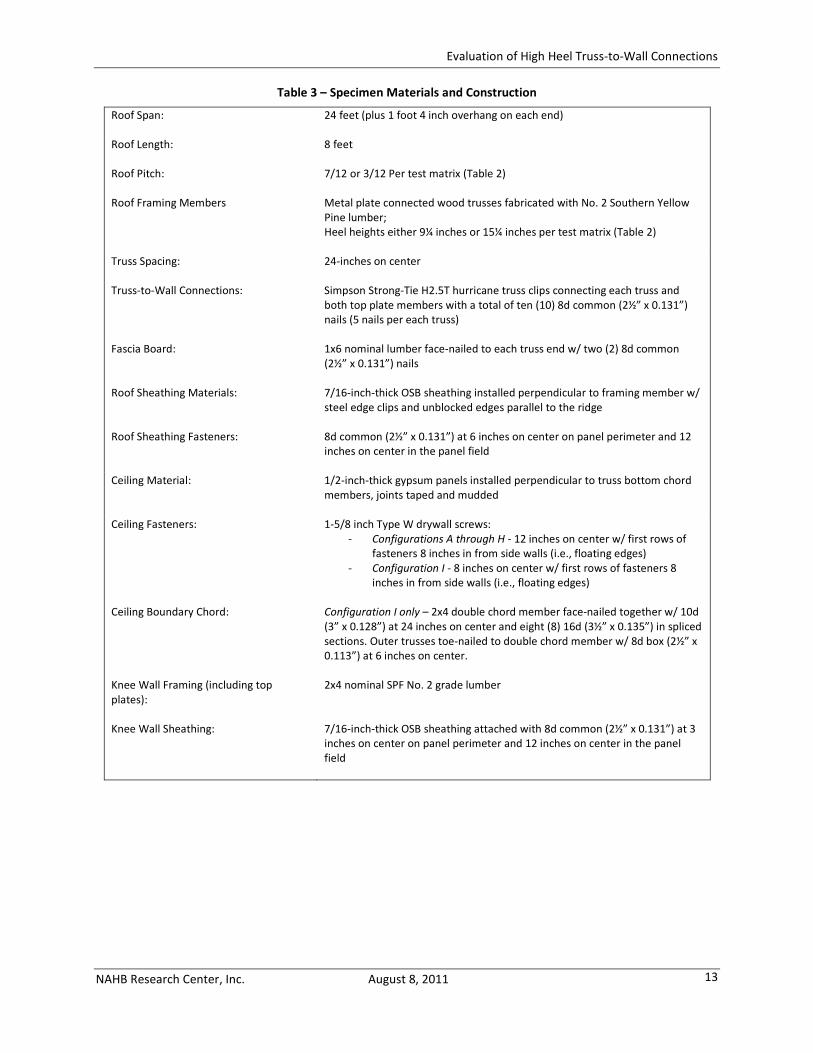
Table 3 – Specimen Materials and Construction
Roof Span: 24 feet (plus 1 foot 4 inch overhang on each end)
Roof Length: 8 feet
Roof Pitch: 7/12 or 3/12 Per test matrix (Table 2)
Roof Framing Members Metal plate connected wood trusses fabricated with No. 2 Southern Yellow
Pine lumber;
Heel heights either 9¼ inches or 15¼ inches per test matrix (Table 2)
Truss Spacing: 24-inches on center
Truss-to-Wall Connections: Simpson Strong-Tie H2.5T hurricane truss clips connecting each truss and
both top plate members with a total of ten (10) 8d common (2½” x 0.131”)
nails (5 nails per each truss)
Fascia Board: 1x6 nominal lumber face-nailed to each truss end w/ two (2) 8d common
(2½” x 0.131”) nails
Roof Sheathing Materials: 7/16-inch-thick OSB sheathing installed perpendicular to framing member w/
steel edge clips and unblocked edges parallel to the ridge
Roof Sheathing Fasteners: 8d common (2½” x 0.131”) at 6 inches on center on panel perimeter and 12
inches on center in the panel field
Ceiling Material: 1/2-inch-thick gypsum panels installed perpendicular to truss bottom chord
members, joints taped and mudded
Ceiling Fasteners: 1-5/8 inch Type W drywall screws:
- Configurations A through H - 12 inches on center w/ first rows of
fasteners 8 inches in from side walls (i.e., floating edges)
- Configuration I - 8 inches on center w/ first rows of fasteners 8
inches in from side walls (i.e., floating edges)
Ceiling Boundary Chord: Configuration I only – 2x4 double chord member face-nailed together w/ 10d
(3” x 0.128”) at 24 inches on center and eight (8) 16d (3½” x 0.135”) in spliced
sections. Outer trusses toe-nailed to double chord member w/ 8d box (2½” x
0.113”) at 6 inches on center.
Knee Wall Framing (including top
plates):
2x4 nominal SPF No. 2 grade lumber
Knee Wall Sheathing: 7/16-inch-thick OSB sheathing attached with 8d common (2½” x 0.131”) at 3
inches on center on panel perimeter and 12 inches on center in the panel
field

Evaluation of High Heel Truss-to-Wall Connections
August 8, 2011 NAHB Research Center, Inc. 14
Table 4 – Truss Blocking/Bracing Construction Details
Configuration Blocking/Blocking Connection
High Heel braced w/
OSB
7/16 inch OSB, 10½
inches wide by 8 feet
long
Face-nailed to each truss heel with
three (3) 8d common (2½” x 0.131”)
High Heel braced w/
OSB attached to Top
Plate
7/16 inch OSB, 11½
inches wide by 8 feet
long
Face-nailed to each truss heel w/ three
(3) 8d common (2½” x 0.131”);
Face-nailed to top member of double
top plate w/ 8d common (2½” x 0.131”)
at 6 inches on center
High Heel w/ 25%
Blocking 1-1/8–inch-thick by
14inch-high iLevel Rim
Board contact fit
between trusses
End-nailed to trusses w/ two (2) 16d box
(3½” x 0.135”);
Toe-nailed to top plate w/ five (5) 8d
box (2-3/8” x 0.113”) at 6 inches on
center
High Heel w/ 50%
Blocking
High Heel w/ Diagonal
Web Bracing
2x4 SPF No.2 Grade
lumber
Face-nailed to truss web w/ two (2) 8d
common (2½” x 0.131”)
Figure 6 provides details of the various blocking methods evaluated in this testing program. All blocking
methods were in addition to the typical roof specimen described above.

Evaluation of High Heel Truss-to-Wall Connections
NAHB Research Center, Inc. August 8, 2011 15
Figure 5 – Specimen construction

Evaluation of High Heel Truss-to-Wall Connections
August 8, 2011 NAHB Research Center, Inc. 16
(a) High Heel w/ OSB (b) High Heel w/ OSB to Plate
(c) High Heel w/ 25% Blocking (d) High Heel w/ 50% Blocking
Figure 6 – Truss blocking details

Evaluation of High Heel Truss-to-Wall Connections
NAHB Research Center, Inc. August 8, 2011 17
(e) High Heel w/ Diagonal Web Bracing
(f) High Heel w/ OSB to Plate and Reinforced Ceiling Diaphragm
(OSB not shown for clarity)
Figure 6 (cont) – Truss blocking details

Evaluation of High Heel Truss-to-Wall Connections
August 8, 2011 NAHB Research Center, Inc. 18
Test Setup and Protocol
Figure 7 shows the test set-up including the specimen, loading brace, and instrumentation. Figure 8
provides a photograph of the test set-up, reaction frame, and data acquisition system.
Load was applied to the specimen through permanent truss bracing (2x6 nominal Southern Pine, No. 2
Grade lumber) attached at mid-height of the center vertical web member of each truss. The intent of
using a pair of typical permanent truss braces was to minimize the restraints imposed on the specimen
by the loading apparatus by applying the load through members that are typically present in truss roof
assemblies. Load was applied at a mid-height permanent bracing location that yielded a 1:1 roof
diaphragm to ceiling diaphragm loading ratio (i.e., the loading ratio caused by a seismic loading
scenario). This loading condition results in the highest eccentricity at the heel such that observations on
the effectiveness of the tested heel blocking/bracing options are appropriate for a broad range of
applications.
Each center vertical truss web member was reinforced with a double 2x8 vertical member to prevent
weak-axis bending failure of the web. Each permanent bracing member was attached to the vertical
reinforcing member with a single 4½-inch by ½-inch lag bolt to provide sufficient load transfer with
minimal rotational restraint.
The loading brace members were loaded in tension using a computer controlled hydraulic cylinder
mounted to a steel reaction frame. The reaction frame was attached to the laboratory structural floor.
Load was applied monotonically in tension at a constant displacement rate of 0.06 inches per minute to
allow for sufficient visual observations throughout the test and was measured using an electronic load
cell installed between the cylinder and the loading bracket. Displacement was continued until failure,
defined as a 20% drop in load from the peak.
Displacements of the roof system relative to either the supporting knee walls or the laboratory
structural floor were measured using electronic Linear Motion Position Transducers (LMPT’s) at several
locations, including:
• The ceiling diaphragm at mid-span of the roof/truss assembly; • The top and bottom of the heel on the first/front truss at both ends; • The top and bottom of the heel on the fourth truss at both ends (Specimen F & G only), and, • The bottom of the heel on the fifth/rearmost truss.
Displacement of the top of the supporting knee walls was also measured relative to the structural floor
using LMPT’s. Finally, displacement at the peak of the roof/truss assembly was measured relative to the
steel reaction frame using a string potentiometer. Uplift at the rear of the specimen was not measured;
initial tests showed that uplift was minimal due to the vertical restraint provided by the hurricane clip
connections.
All load and displacement measurements were recorded using an electronic data acquisition system.

Evaluation of High Heel Truss-to-Wall Connections
NAHB Research Center, Inc. August 8, 2011 19
Figure 7 – Test set-up and instrumentation

Evaluation of High Heel Truss-to-Wall Connections
August 8, 2011 NAHB Research Center, Inc. 20
Figure 8 – Photo of test setup
RESULTS
The results of the testing are summarized in Table 5 including the peak load reached by the roof
assembly and the unit peak capacity of the truss-to-wall connections. Table 5 also includes initial
stiffness values for each specimen determined from the displacement at the top of the truss heel (TOH)
measured relative to the top plate. The initial stiffness was calculated at a 760 lb load level, selected as
an approximate representation of the linear range for performance comparison between systems tested
in this study. Figures 9 and 10 provide visual comparisons of peak capacity and stiffness, respectively, for
the various specimens tested. (Note: Figure 10 shows specimen load versus displacement curves where
displacement was measured at the peak of the specimen, not at the top of the truss heel). See Appendix
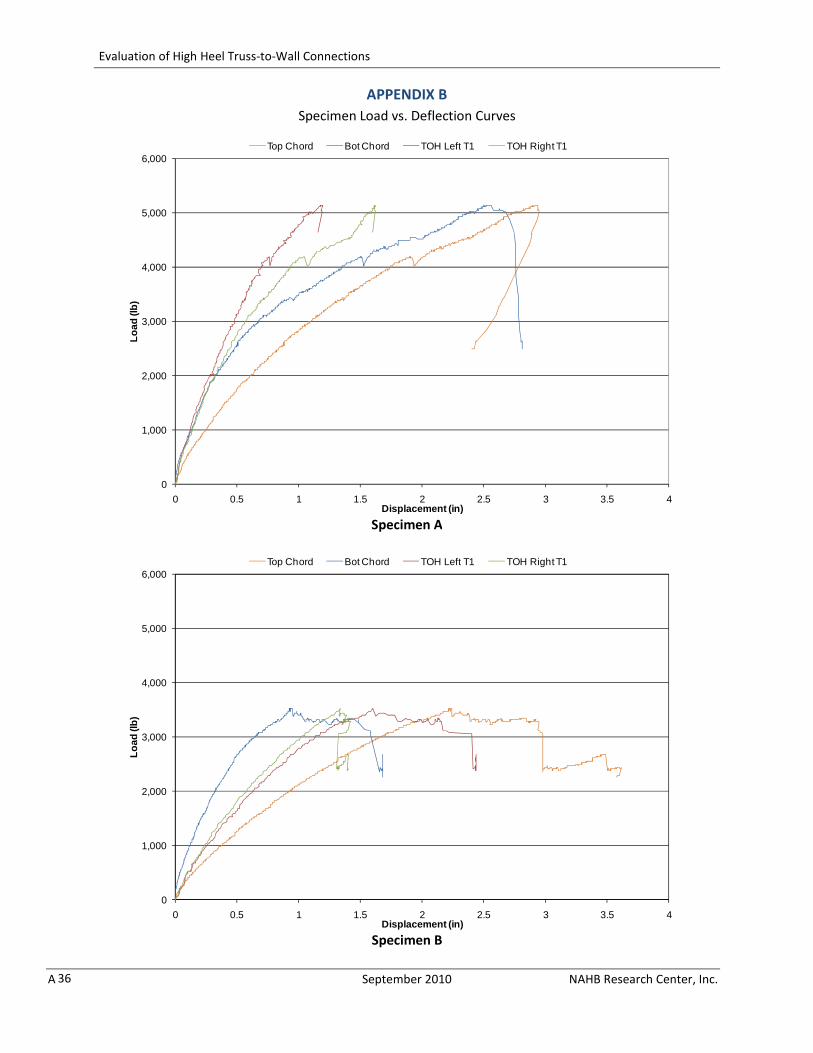
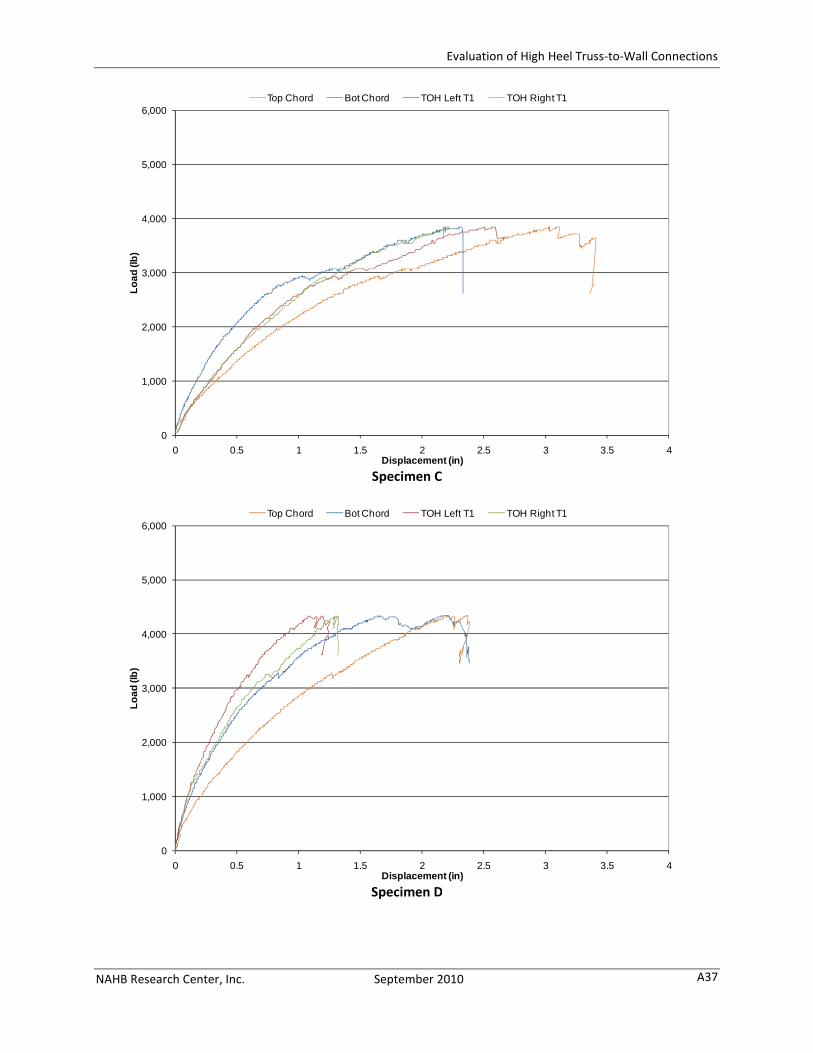
A for summary figures of load versus displacement curves measured at the TOH location. Appendix B
provides several load versus displacement curves for each individual specimen, measured at various
locations on the specimen including the midpoint of both the top and bottom chords of Truss 1, the left
and right TOH of Truss 1 and where applicable, the left and right TOH of Truss 4.
A discussion of each of the individual tests is provided in this section, including discussion of peak
capacities and initial stiffnesses relative to baselines (where applicable) and observed governing failure
modes. Visual observations regarding rotation of the trusses are noted as part of the failure mode
discussion. Additional analysis of the rotation/displacement of the truss heels, as well as comparisons of
peak capacities to typical design loads, is summarized and presented at the end of this section.

Evaluation of High Heel Truss-to-Wall Connections
NAHB Research Center, Inc. August 8, 2011 21
Table 5 – Test Results
Configuration Diagram Peak
Load (lb)
Peak Load
per Truss
Connection
(lb)
Unit Peak
Capacity
(lb/ft)1
Initial
Stiffness
(lb/in)2
A – Low-heel truss
5,140 514 255 8,828
B – High-heel truss without
blocking
3,525 352 175 4,432
C – High-heel truss without
blocking with low (3/12) roof
pitch
3,780 378 190 3,950
D – High-heel truss braced with
OSB sheathing
4,344 434 215 10,395
E – High-heel truss braced with
OSB sheathing extended over
wall plate
4,755 475 240 32,224
F – High-heel truss with blocking
at intermittent locations
3,988 399 200 23,548
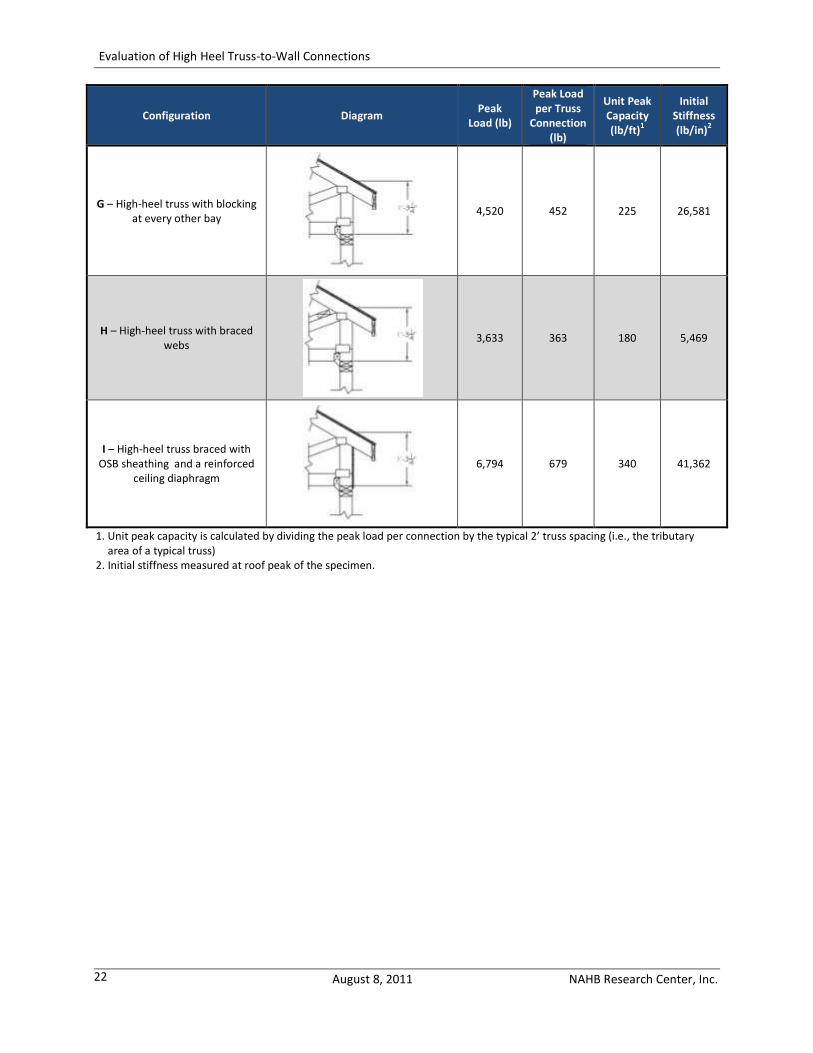
Evaluation of High Heel Truss-to-Wall Connections
August 8, 2011 NAHB Research Center, Inc. 22
Configuration Diagram Peak
Load (lb)
Peak Load
per Truss
Connection
(lb)
Unit Peak
Capacity
(lb/ft)1
Initial
Stiffness
(lb/in)2
G – High-heel truss with blocking
at every other bay
4,520 452 225 26,581
H – High-heel truss with braced
webs
3,633 363 180 5,469
I – High-heel truss braced with
OSB sheathing and a reinforced
ceiling diaphragm
6,794 679 340 41,362
1. Unit peak capacity is calculated by dividing the peak load per connection by the typical 2’ truss spacing (i.e., the tributary
area of a typical truss)
2. Initial stiffness measured at roof peak of the specimen.

Evaluation of High Heel Truss-to-Wall Connections
NAHB Research Center, Inc. August 8, 2011 23
Figure 9 – Comparison of peak capacities per truss connection
Figure 10 – Load vs. displacement curves (measured at peak of the roof)
0
1,000
2,000
3,000
4,000
5,000
6,000
7,000
0 1 2 3 4 5
Lo
ad (l
b)
Displacement (in)
A - Low Heel w/o Blocking B - High Heel w/o Blocking C -High Heel w/ Low Slope
D - High Heel w/ OSB E - High Heel w/ OSB to Plate F - High Heel w/ 25% Blocking
G - High Heel w/ 50% Blocking H - High Heel w/ Truss Bracing I - High Heel w/ OSB & Reinforced Gyp

Evaluation of High Heel Truss-to-Wall Connections
August 8, 2011 NAHB Research Center, Inc. 24
Specimens A through C were intended to establish baseline capacities and performance characteristics
for low- and high-heel roof systems without blocking or bracing the truss heel. The low-heel truss
configuration (Specimen A) represents the highest allowable heel height by code that does not require
blocking. Specimen A achieved a peak load of 5,140 lb (peak unit capacity of 255 lb/ft) and initial
stiffness of 8,828 lb/in. Failure of Specimen A included initial fastener tear-through at the outer ends of
the ceiling diaphragm near the knee walls followed by complete failure of the fasteners in the center
gypsum panel (see Figures 11 & 12). Only minor rotation of the truss heels was observed during testing
as well as minor rotation and buckling of the hurricane clips (Figure 13). Minor displacement of the truss
top chord relative to the bottom chord at the heel joint was also observed; along with slight
deformation of the metal connector plate at the heel joint (Figure 14).
Figure 11 – Gypsum fastener tear-through
(Specimen A)
Figure 12 – Complete failure of gypsum fasteners
(Specimen A)
Figure 13 – Rotation of hurricane clip at failure
(Specimen A)
Figure 14 – Truss member displacement and metal
connector plate deformation at heel joint (Specimen
A)
Specimen B represents the second trigger height specified by code (see Table 1). Trusses with heel
heights between the 9¼-inch height of Specimen A and the 15¼ -inch height of Specimen B are currently
Evaluation of High Heel Truss-to-Wall Connections
NAHB Research Center, Inc. August 8, 2011 25
required to have solid blocking between each truss when framed over top of a braced wall panel.
Specimen B omitted this blocking in order to compare the effect of the higher heel height on roof
system capacity with the Specimen A results, as well as to establish a baseline performance benchmark
against which the various blocking / bracing details evaluated in this study could be measured. Specimen
B reached a peak load of 3,525 lb (peak unit capacity of 175 lb/ft) and initial stiffness of 4,432 lb/in. This
is a 33% drop in capacity and a 50% drop in initial stiffness from the results of Specimen A, illustrating
the effect of an increased heel height on the global response for a system without blocking. The primary
failure mode was again tear-through of the gypsum panel fasteners at both ends of the specimen near
the knee walls. All of the gypsum panels, however, remained intact and attached to the framing
members throughout the test. Significant rotation of the trusses at the heel connections as well as
minor buckling of the hurricane clips was also observed.
Specimen C was designed to evaluate the effect of a lower roof slope on the performance of the truss-
to-wall connections. Specimen C was similar in construction to Specimen B and reached a peak capacity
of 3,780 lb (peak unit capacity of 190 lb/ft) and initial stiffness of 3,950 lb/in. Specimen C exhibited
similar damage and failure modes as Specimen B (i.e., gypsum fastener tear-through, significant rotation
observed at truss heel). Additional damage was also observed in the form of buckled hurricane clips
(Figure 15) and member separation at the heel joint metal plate connectors. Comparisons of both peak
capacity and initial stiffness values between Specimen B (7:12 roof slope) and Specimen C (3:12 roof
slope) yields a less than 10% difference in strength and stiffness performance between the two
specimens, indicating that the degree of roof slope has a minimal effect on heel connection
performance. Figure 16 provides a photo of the truss rotation observed in Specimen C at failure.

Evaluation of High Heel Truss-to-Wall Connections
August 8, 2011 NAHB Research Center, Inc. 26
Figure 15 – Buckling of hurricane clip (Specimen C)
Figure 16 – Specimen C heel rotation at failure
Specimens D and E were designed to investigate the contribution of OSB sheathing installed on the
exterior face of the truss heel. The OSB sheathing in Specimen D was not attached to the top plates of
the supporting knee walls and only provided rotational restraint to the truss heel. The OSB strip in
Specimen E was extended down and nailed to the upper member of the wall double top plate, and as
such provided both a rotational restraint for the trusses as well as an additional load transfer
mechanism from the trusses to the supporting wall. Specimen D reached a peak capacity of 4,340 lb
(peak unit capacity of 220 lb/ft) and an initial stiffness of 10,395 lb/in. This peak capacity is a 26%
increase over the capacity of Specimen B and only 16% less than the peak capacity of the low heel
configuration. The increase in performance due to the OSB bracing strip is also evident when comparing
initial stiffness values; the addition of the OSB bracing strip increased the initial stiffness by 18% over the
low-heel baseline specimen and by a factor of 2.3 over the unblocked high-heel baseline specimen. The
primary failure mode was again fastener failure in the gypsum panels. Some fastener tear-through

Evaluation of High Heel Truss-to-Wall Connections
NAHB Research Center, Inc. August 8, 2011 27
occurred at the edges of the OSB bracing strip. The bracing of heel joints with OSB was also effective in
controlling rotation of the truss. See Figure 17 for a comparison of the truss heel position prior to testing
and after gypsum failure. Specimen E exhibited the same failure modes as Specimen D while achieving a
peak capacity of 4,760 lb (or a peak unit capacity of 240 lb/ft) and initial stiffness of 32,224 lb/in. While
this peak capacity from Specimen E is 7% less than the peak capacity of the low-heel configuration
(Specimen A), the additional nailing of the OSB bracing strip to the supporting wall below in Specimen E
increased the initial stiffness of the specimen threefold over both the OSB bracing strip without top
plate nailing and the benchmark low-heel specimen (3.1 times and 3.6 times greater, respectively).
(a) Before test (b) Post testing
Figure 17 – Comparison of rotation at Truss 5 (Specimen D)
Figure 18 – Truss rotation of Specimen E at failure (Truss 5)
Specimens F and G were designed to evaluate the performance of code compliant blocking details.
Specimen F included a solid blocking panel installed in a single truss bay on each side (i.e., 25% of the
specimen wall length). Specimen G was constructed with alternating blocked and unblocked bays,
resulting in blocking of two (2) of the bays per side (i.e., 50% of the specimen wall length). The 25%
blocking specimen (Specimen F) reached a peak load of 3,988 lb (unit peak capacity of 200 lb/ft) and an
initial stiffness of 23,548 lb/in and exhibited gypsum fastener failure as its primary failure mode as was

Evaluation of High Heel Truss-to-Wall Connections
28
observed and described for previous specimens.
front two trusses (where blocking was installed) and
visual observation was confirmed through displacement measurements
the single blocked bay provides rotational restraint to the entire specimen
blocking is not localized). Figure 19
(a) Truss 1
Figure 19 –
The 50% blocked specimen (Specimen G) reached a peak load of
lb/ft) and an initial stiffness of 26,581 lb/in
the primary failure mode of gypsum fastener tear
blocking panels was also observed, as shown in Figure
capacities of Specimens A and B, the 50% blocked specimen exhibited a 28% increase in capacity over
the unblocked high-heel specimen and showed a 12%
low-heel specimen. Interestingly, the addition of
increase in stiffness over the 25%-blocked specimen
exceeded the low-heel baseline configuration by more than a factor of 2
Comparison between peak capacities and
the use of an OSB bracing strip attached to the face of the truss heel and tied to the supporting wall
below yields slightly greater performance than both the 25% and 50% blocking
Wall Connections
August 8, 2011 NAHB Research Center, Inc.
observed and described for previous specimens. The same moderate rotation was observed
(where blocking was installed) and the fourth (where no blocking was insta
visual observation was confirmed through displacement measurements at both locations
single blocked bay provides rotational restraint to the entire specimen (i.e., the effect of the
shows a comparison of the rotation of the first and
(b) Truss 5
– Comparison of truss heel rotation (Specimen F)
The 50% blocked specimen (Specimen G) reached a peak load of 4,520 lb (unit peak capacity of 225
581 lb/in and exhibited similar failure modes as Specimen F, including
gypsum fastener tear-through. Some rotation of the trusses relative to the
blocking panels was also observed, as shown in Figure 20. When compared to the tested
capacities of Specimens A and B, the 50% blocked specimen exhibited a 28% increase in capacity over
heel specimen and showed a 12% decrease in capacity compared to
Interestingly, the addition of the second blocking panel only resulted in a 12%
blocked specimen (Specimen F). Both blocked specimens, however,
heel baseline configuration by more than a factor of 2.5.
ies and initial stiffness values of Specimens E through G shows that
the use of an OSB bracing strip attached to the face of the truss heel and tied to the supporting wall
below yields slightly greater performance than both the 25% and 50% blocking options
NAHB Research Center, Inc.
moderate rotation was observed at both the
(where no blocking was installed). This
at both locations indicating that
(i.e., the effect of the
the rotation of the first and last trusses.
lb (unit peak capacity of 225
and exhibited similar failure modes as Specimen F, including
through. Some rotation of the trusses relative to the
the tested benchmark
capacities of Specimens A and B, the 50% blocked specimen exhibited a 28% increase in capacity over
compared to the unblocked
the second blocking panel only resulted in a 12%
. Both blocked specimens, however,
stiffness values of Specimens E through G shows that
the use of an OSB bracing strip attached to the face of the truss heel and tied to the supporting wall
options.

Evaluation of High Heel Truss-to-Wall Connections
NAHB Research Center, Inc. August 8, 2011 29
Figure 20 – Rotation of truss heel at blocking location (Specimen G)
The purpose of Specimen H was to evaluate the effect of diagonal truss web bracing on the performance
of the high-heel connection, particularly with regard to rotation. The diagonal bracing specimen reached
a peak load of 3,633 lb (unit peak capacity of 180 lb/ft). There were no observed differences in response
and failure mode compared to Configurations B and C (high heel without blocking or bracing) indicating
that web bracing does not provide a mechanism for resisting the rotation of high-heel trusses.
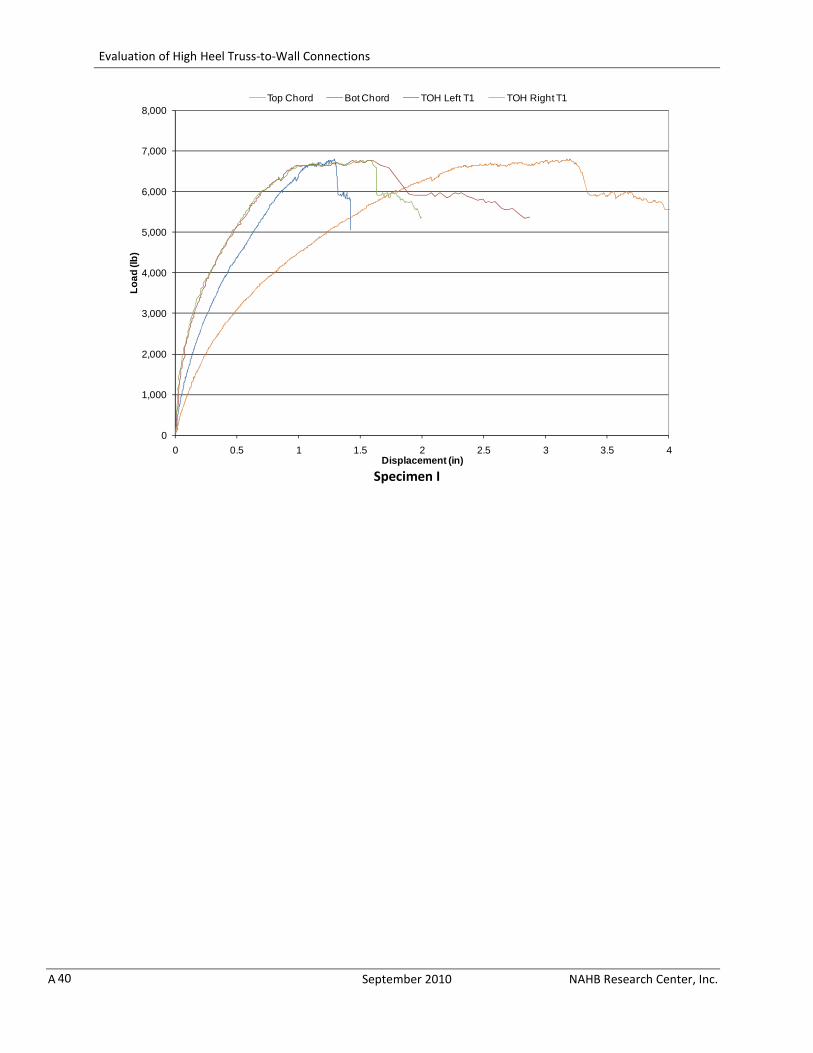
Specimen I was designed to further evaluate the OSB blocking method by testing it in conjunction with a
reinforced ceiling diaphragm. The intent was to validate the effectiveness of the OSB bracing option in
applications with a stronger gypsum diaphragm, while also attempting to force failure in the truss heel
joint and truss-to-wall connections. Testing of Specimen I yielded a peak load of 6,794 lb (unit peak
capacity of 340 lb/ft). Tear-out failure of the OSB-to-heel fasteners, cross grain bending failure of a
bottom chord, and failure of the metal plates (causing displacement of the heel relative to the bottom
chord) were all observed. Tear-through failure of the gypsum fasteners was also observed at all four
corners of the diaphragm. Observation of the overall system response indicates that Configuration I was
a balanced system such that further improvements to individual parts of the system likely would not
lead to significant improvements of the system’s performance without implementing improvements for
all parts. The reinforced ceiling diaphragm only served to strengthen the entire roof system and did not
have an adverse effect on the performance of the heel connections.
Table 6 compares the measured lateral capacities of the roof-to-wall connections to several typical
design wind load scenarios. The wind loads were determined using Table 2.5B of the Wood Frame
Construction Manual (WFCM) for One- and Two-Family Dwellings – 2001 Edition (AFPA 2007) for a 36-
foot-wide by 40-foot-long house built in Exposure Category B, with a mean roof height of 30 feet, a 7:12
roof pitch and the trusses spanning in the short direction. Table 6 also provides an alternative

Evaluation of High Heel Truss-to-Wall Connections
August 8, 2011 NAHB Research Center, Inc. 30
summarization of specimen rotational stiffness performance by normalizing the TOH (top of heel)
displacements used to calculate initial stiffness by the specimen heel height.

Evaluation of High Heel Truss-to-Wall Connections
NAHB Research Center, Inc. August 8, 2011 31
Table 6 – Ratios of Lateral Roof Connection Capacity Relative to Typical Design Wind Loads1
Configuration
Factor of Safety TOH
Displacement
as % of heel
height3
90 mph, Exp. B
(39 lb/ft)
110 mph, Exp.
B (57 lb/ft)
130 mph, Exp.
B (89 lb/ft)2
A –Low-heel truss 6.6 4.5 2.9 1.0%
B – High-heel truss without blocking 4.5 3.1 2.0 1.2%
C – High-heel truss without blocking
with low (3/12) roof pitch 4.8 3.3 2.1 1.3%
D – High-heel truss braced with OSB
sheathing 5.6 3.8 2.4 0.5%
E – High-heel truss braced with OSB
sheathing extended over wall plate 6.1 4.2 2.7 0.2%
F – High-heel truss with blocking at
intermittent locations 5.1 3.5 2.2 0.3%
G – High-heel truss with blocking at
every other bay 5.8 4.0 2.5 0.3%
H –High-heel truss with braced webs 4.7 3.2 2.0 1.0%
I – High-heel truss braced with OSB
sheathing and a reinforced ceiling
diaphragm
8.7 6.0 3.8 0.1%
1. Typical design wind loads calculated for a 36-foot-wide by 40-foot-long house built in Exposure Category B, with a
mean roof height of 30 feet, a 7:12 roof pitch and the trusses spanning in the short direction.
2. Design wind loading at 130 mph and exposure B is equivalent to the 110 mph and Exposure C design criteria that is
the upper limit used in the 2012 IRC structural provisions.
3. TOH displacement measured at same load level as initial stiffness calculations (i.e., 760 lb)
Analysis presented in Table 6 shows that all tested specimens, including the unblocked benchmark
specimens exhibited significant strength capacity over design wind loads in both 90 mph and 110 mph
wind zones, with factors of safety ranging from 3.1 for the unblocked high heel specimen up to 6.0 for
the OSB braced specimen with a reinforced ceiling diaphragm. The results are more moderately
conservative when compared to the 130 mph design wind speed, but still meet or exceed a factor of
safety of 2.0 in all cases. The analysis in Table 6 shows again the increased stiffness performance of the
OSB sheathed and partially blocked specimens over the benchmark low-heel specimens. It is worth
noting that the disparity in stiffness performance between the various unblocked specimens decreases
when the results are normalized for heel height, indicating that even an unblocked high-heel condition
yields stiffness performance characteristics that are comparable to the currently code accepted low-heel
condition.
SUMMARY AND CONCLUSIONS
This testing program was designed to benchmark the performance of traditional roof systems and
incrementally-improved roof-to-wall systems with the goal of developing connection solutions that are
optimized for performance and constructability. The results of this study are expected to provide
guidance towards determining appropriate trigger levels for continuous blocking between high-heel
trusses as well as viable alternative blocking solutions to those currently required by code. The following
is a summary of the results of this testing program:

Evaluation of High Heel Truss-to-Wall Connections
August 8, 2011 NAHB Research Center, Inc. 32
1) The benchmark code-allowed low heel (9¼ inch) roof system with no blocking and hurricane
truss clip connections reached a peak unit capacity of 255 lb/ft.
2) The benchmark high heel (15¼ inch) roof system without blocking achieved a peak unit capacity
of 175 lb/ft. This is a 33% decrease in capacity compared to the low heel configuration. The
initial stiffness of the high heel specimen was approximately half that of the low-heel specimen,
indicating that heel height significantly affects truss rotation where no blocking is not installed.
3) Comparison of performance results for high-heel trusses with two different roof slopes (7/12 vs.
3/12) indicates no measurable effect of roof slope on the truss rotation at the heel.
4) The high-heel roof specimen with OSB sheathing used for heel bracing (Specimen D) exhibited a
26% increase in capacity over the benchmark high-heel test (220 lb/ft versus 175 lb/ft) and only
an 18% decrease in capacity compared to the benchmark low-heel test (220 lb/ft versus 245
lb/ft). The addition of the OSB sheathing also increased the specimen’s initial stiffness by 18%
over the low-heel specimen (10,395 lb/in versus 8,828 lb/in). This increase in stiffness, along
with the reserve strength capacity over typical design wind loads, indicates that using OSB
sheathing as bracing in the high-heel condition is comparable to the currently code allowed
unblocked, low-heel truss condition.
5) Nailing the OSB sheathing to the supporting top plate (Specimen E) increased the capacity to
240 lb/ft. This is only 7% less than the low heel configuration (Specimen B) and 7% higher than
the intermittent blocking configuration (Specimen G). The attachment to the wall top plate also
significantly increased the rotational stiffness of the heel joint exceeding that for the low-heel
specimen (32,224 lb/in versus 8,828 lb/in).
6) High heel systems with intermittent blocking amounts of 25% (Specimen F) and 50% (Specimen
G) achieved peak unit capacities of 200 lb/ft and 225 lb/ft, respectively. Comparison of TOH
displacements at both blocked and unblocked locations within Specimen F indicates that a single
blocked bay provides rotational restraint to the entire specimen length (i.e., the rotational
restraint is not localized). Comparison of initial stiffness between Specimen F and Specimen G
indicates that the addition of a second blocking panel provides only 12% greater rotational
restraint to the specimen.
7) Comparison of Specimen E (OSB sheathing also nailed to the top plate) performance to that of
the 50% intermittently blocked specimen (Specimen G) shows that the Specimen E exceeded
Specimen G in both peak load capacity (240 lb/ft versus 225 lb/ft) and initial stiffness (32,224
lb/in versus 26,581 lb/in).
8) The addition of diagonal truss web bracing to a high heel truss without any additional blocking
provides no measurable improvement over the benchmark high heel configuration in either
peak unit capacity or rotational restraint.
Several conclusions can be drawn based on the results of this testing program. It can be seen through
comparison between the performances of Specimen A and Specimen D that the OSB sheathed high-heel
truss detail yields comparable (and in terms of stiffness, superior) performance to that of the un-
blocked, low-heel truss configuration that is currently allowed by code (see Table 1 and Figure 1). This
performance, along with the reserve strength capacity over typical design wind loads, indicates that
using OSB sheathing as bracing (without any additional blocking in the heel) can be considered as an

Evaluation of High Heel Truss-to-Wall Connections
NAHB Research Center, Inc. August 8, 2011 33
adequate bracing option in high heel conditions where the intent is to provide structural performance
comparable to that of an un-blocked, low-heel truss condition.
Further comparison between Specimen E and Specimen F shows that extending the OSB sheathing down
and including additional nailing to the top plate of the wall below provides superior strength and
stiffness performance to that of the solid, intermittent blocking that is currently required in high-wind
regions, and should be considered a viable truss-heel bracing solution to said intermittent blocking.
Evaluation of High Heel Truss-to-Wall Connections
August 8, 2011 NAHB Research Center, Inc. 34
REFERENCES
American Forest and Paper Association. 2007. Woodframe Construction Manual for One and Two Family
Dwellings (including 2007 Errata/Addendum). American Wood Council, Leesburg, VA.
Gypsum Association. 2010. Application and Finishing of Gypsum Panel Products (GA-216-2010). Gypsum
Association, Hyattsville, MD.
International Code Council. 2009. International Residential Code for One and Two Family Dwellings. ICC,
Country Club Hills, IL.
Kopp, G. 2010. Wind Loading on Low-Rise Buildings. Presentation at an Expert Meeting on IRC Wind Wall
Bracing: Combined Uplift and Shear Load Path. Leesburg, VA.
Martin, F. 2010. Is Roof Eave Blocking Required to Transmit Wind/Seismic Forces? Structure Magazine.
http://www.structuremag.org/article.aspx?articleID=1106.
Riley, M. & Sadek, F. 2003. Experimental Testing of Roof-to-Wall Connections in Wood Frame Houses
(NISTIR 6938). Building and Fire Laboratory, National Institute of Standards and Technology.
Gaithersburg, MD.
Scoville, E., 2005. Investigation of the Response of Low-Rise Wood-Frame Roof-Wall Systems Under
Combined Uplift and In-Plane Shear Loads. Clemson University. Clemson, SC.
Simpson Strong-Tie. 2010. Truss Anchorage for Multiple Loading. PowerPoint Presentation of Testing
Conducted at Clemson University, Randy Shackelford of Simpson Strong-Tie, Personal
Communications.
U.S. Department of Housing and Urban Development (HUD). 2002. Roof Framing Connections in
Conventional Residential Construction – Task 2. Prepared by the NAHB Research Center, Upper
Marlboro, MD.

Evaluation of High Heel Truss-to-Wall Connections
NAHB Research Center, Inc. September 2010 A35
APPENDIX A
Summary Load vs. Displacement Curves
Load vs. TOH Displacement (Measured at left end of Truss 1)
Load vs. TOH Displacement (Measured at right end of Truss 1)
0
1,000
2,000
3,000
4,000
5,000
6,000
7,000
0 0.5 1 1.5 2 2.5
Lo
ad (l
b)
Displacement (in)
Low Heel w/o Blocking High Heel w/o Blocking High Heel w/ OSB
High Heel w/ OSB to Plate High Heel w/ 50% Blocking High Heel w/ 25% Blocking
High Heel w/ Truss Bracing High Heel w/ Low Slope High Heel w/ OSB & Reinforced Gyp
Evaluation of High Heel Truss-to-Wall Connections
A September 2010 NAHB Research Center, Inc. 36
APPENDIX B
Specimen Load vs. Deflection Curves
Specimen A
Specimen B
0
1,000
2,000
3,000
4,000
5,000
6,000
0 0.5 1 1.5 2 2.5 3 3.5 4
Lo
ad (l
b)
Displacement (in)
Top Chord Bot Chord TOH Left T1 TOH Right T1
0
1,000
2,000
3,000
4,000
5,000
6,000
0 0.5 1 1.5 2 2.5 3 3.5 4
Lo
ad (l
b)
Displacement (in)
Top Chord Bot Chord TOH Left T1 TOH Right T1
Evaluation of High Heel Truss-to-Wall Connections
NAHB Research Center, Inc. September 2010 A37
Specimen C
Specimen D
0
1,000
2,000
3,000
4,000
5,000
6,000
0 0.5 1 1.5 2 2.5 3 3.5 4
Lo
ad (l
b)
Displacement (in)
Top Chord Bot Chord TOH Left T1 TOH Right T1
0
1,000
2,000
3,000
4,000
5,000
6,000
0 0.5 1 1.5 2 2.5 3 3.5 4
Lo
ad (l
b)
Displacement (in)
Top Chord Bot Chord TOH Left T1 TOH Right T1

Evaluation of High Heel Truss-to-Wall Connections
A September 2010 NAHB Research Center, Inc. 38
Specimen E
Specimen F
0
1,000
2,000
3,000
4,000
5,000
6,000
0 0.5 1 1.5 2 2.5 3 3.5 4
Lo
ad (l
b)
Displacement (in)
Top Chord Bot Chord TOH Left T1 TOH Right T1
0
1,000
2,000
3,000
4,000
5,000
6,000
0 0.5 1 1.5 2 2.5 3 3.5 4
Lo
ad (l
b)
Displacement (in)
Top Chord Bot Chord TOH Left T1 TOH Left T4 TOH Right T1 TOH Right T4

Evaluation of High Heel Truss-to-Wall Connections
NAHB Research Center, Inc. September 2010 A39
Specimen G
Specimen H
0
1,000
2,000
3,000
4,000
5,000
6,000
0 0.5 1 1.5 2 2.5 3 3.5 4
Load
(lb)
Displacement (in)
Top Chord Bot Chord TOH Left T1 TOH Left T4 TOH Right T1 TOH Right T4
0
1,000
2,000
3,000
4,000
5,000
6,000
0 0.5 1 1.5 2 2.5 3 3.5 4
Lo
ad (l
b)
Displacement (in)
Top Chord Bot Chord TOH Left T1 TOH Right T1
Evaluation of High Heel Truss-to-Wall Connections
A September 2010 NAHB Research Center, Inc. 40
Specimen I
0
1,000
2,000
3,000
4,000
5,000
6,000
7,000
8,000
0 0.5 1 1.5 2 2.5 3 3.5 4
Lo
ad (l
b)
Displacement (in)
Top Chord Bot Chord TOH Left T1 TOH Right T1