EVALUATION OF THE INTERNAL ANGLE OF … OF THE INTERNAL ANGLE OF GYRATION OF SUPERPAVE GYRATORY...
54
NCAT Report 03-04 EVALUATION OF THE INTERNAL ANGLE OF GYRATION OF SUPERPAVE GYRATORY COMPACTORS IN ALABAMA By Brian D. Prowell E. Ray Brown Mike Huner Mike Huner December 2003 277 Technology Parkway Auburn, AL 36830
Transcript of EVALUATION OF THE INTERNAL ANGLE OF … OF THE INTERNAL ANGLE OF GYRATION OF SUPERPAVE GYRATORY...

NCAT Report 03-04
EVALUATION OF THE INTERNAL ANGLE OF GYRATION OF SUPERPAVE GYRATORY COMPACTORS IN ALABAMA By Brian D. Prowell E. Ray Brown Mike Huner
Mike Huner December 2003
277 Technology Parkway Auburn, AL 36830

EVALUATION OF THE INTERNAL ANGLE OF GYRATION OF
SUPERPAVE GYRATORY COMPACTORS IN ALABAMA
By
Brian D. Prowell Assistant Director
National Center for Asphalt Technology Auburn University, Alabama
E. Ray Brown
Director National Center for Asphalt Technology
Auburn University, Alabama
Mike Huner District Engineer Asphalt Institute
Franklin, Tennessee (Formerly National Center for Asphalt Technology)
Sponsored by
Alabama Department of Transportation Montgomery, Alabama
NCAT Report 03-04
December 2003

- i -
DISCLAIMER
The contents of this report reflect the views of the authors who are responsible for the facts and accuracy of the data presented herein. The contents do not necessarily reflect the official views or policies of the Alabama Department of Transportation, Federal Highway Administration or the National Center for Asphalt Technology. This report does not constitute a standard, specification, or regulation.

- ii -
TABLE OF CONTENTS Introduction....................................................................................................1 Background..............................................................................................1 Purpose and Scope ...................................................................................4 Methodology............................................................................................4 Internal Angle of Gyration.................................................................4 Superpave Gyratory Compactors.......................................................6 Results and Discussion ..................................................................................7 Preliminary Experiments .........................................................................7 Extrapolation Experiment ..................................................................7 Effect of Mix Type on Internal Angle Measurements .......................11 Field Evaluation of Internal Angle of Gyration.......................................13 Precision of Density Results ....................................................................26 Effect of Mold Wear ................................................................................29 Conclusions....................................................................................................32 Recommendations..........................................................................................33 Acknowledgements........................................................................................33 References ......................................................................................................33 Appendix A – Sample Density Results..........................................................36 Appendix B – Dynamic Internal Angle Measurements by Compactor .........41

- iii -
ABSTRACT The application of a compaction effort that will produce similar densities from one Superpave Gyratory Compactor (SGC) to another is crucial to the proper design, production control, and acceptance of HMA mixes. Currently in Alabama, differences in air voids for the average of 3 compacted samples of up to 0.8 percent may be expected between samples compacted in different brands of SGCs. The difference could be as high as 2.3 percent air voids between any two compactors. It is expected that these differences are typical of variations between SGCs across the United States.
The angle of gyration is an important factor affecting the compaction effort. This study evaluated the relationship between the internal angle of gyration measured by the Dynamic Angle Validation Kit (DAVK) versus the resulting compacted sample density for a wide range of SGCs. The DAVK device was used to measure the angle of gyration of all of the SGCs used in the state of Alabama; by the contractors, mix designers, and the Alabama Department of Transportation (ALDOT). Each of the compactors should have been set at an angle of gyration, under load, that is within the specification values (1.23 to 1.27 degrees) provided in AASHTO T312. AASHTO T312 measures an angle of gyration that is external to the mold while the DAVK measures an internal angle of gyration. Following the measurements with the DAVK, three replicate samples of a standard mix were compacted to evaluate the sample density produced by the compactor. This procedure was conducted on 112 SGCs throughout the state of Alabama. Based on the data collected, there is an evident trend between internal angle of gyration and SGC type (Brand and Model). The average internal angle of gyration by compactor type covered a wider range from 0.98 degrees for the Interlaken SGCs to 1.19 degrees for the Pine AFG1A SGCs. The Troxler 4141 SGCs have the next lowest average internal angle of 1.02 degrees. There is an evident trend between internal angle of gyration and sample density. On average there is a strong trend, but this trend does not seem to hold true for the Interlaken and Rainhart compactors. However, there is a trend between the measured internal angle and density for the Interlaken compactors, but the trend is different than from the other compactors. Based on the averages by brand and model of SGC (excluding the Interlaken and Rainhart SGCs) a change in 0.1 degrees of internal angle will result in a change of 0.010 in Gmb or a difference in air voids of 0.4 percent. Precision analysis indicates a target dynamic internal angle of gyration of 1.16 ± 0.03 degrees should reduce the bias between SGCs but only slightly improves the precision of compacted sample densities. Based on the density data collected during the study, the difference in the Gmb of three properly compacted samples by two different laboratories would not be expected to exceed 0.032 (approximately 1.26 percent air voids) 95 percent of the time. If a target DIA of 1.16 ± 0.03 degrees were adopted, these differences would be expected to be 0.026 Gmb (1.02 percent air voids).

Prowell, Brown, & Huner
1
EVALUATION OF THE INTERNAL ANGLE OF GYRATION OF SUPERPAVE GYRATORY COMPACTORS IN ALABAMA
Brian D. Prowell, E. Ray Brown, and Mike Huner
INTRODUCTION Background The Superpave gyratory compactor (SGC) was developed during the Strategic Highway Research Program as part of the Superpave mix design system to better simulate the field compaction of hot mix asphalt (HMA) mixes (1). All SGCs are required to meet the specification criteria found in AASHTO T312 section 4.1: · “The axis of the ram shall be perpendicular to the platen of the compactor.” · “The ram shall apply and maintain a pressure of 600 ± 18 kPa perpendicular to the cylindrical axis of the specimen during compaction.” · “The compactor shall tilt the specimen molds to an angle of 22 ± 0.35 mrad (1.25 ± 0.02°).” · “and gyrate the specimen molds at a rate of 30.0 ± 0.5 gyrations per minute throughout compaction.” (2) In 1994, two models of SGCs were initially approved as meeting these specifications by the Federal Highway Administration (FHWA) in a pooled fund purchase for state departments of transportation: the Pine Instruments Company (Pine) model number AFGC125X and the Troxler Electronic Laboratories, Inc. (Troxler) model number 4140 (3,4). A study conducted by the Asphalt Institute (5) compared these two compactors with the modified Texas gyratory compactor used to develop the Superpave criteria during the Strategic Highway Research Program and a prototype Rainhart Compactor. Three samples of each of six blends were compacted in each compactor at optimum asphalt content. At Ndesign, the Pine compactor produced similar results to the Modified Texas compactor and the Troxler compactor produced results similar to the Rainhart Compactor. The Pine Model AFGC125X produced significantly higher densities than the Troxler Model 4140 in five of six comparisons. After the completion of this study, modifications were made to both the Pine and Troxler SGCs. Subsequently, both the Pine Model AFGC125X and Troxler 4140 SGCs were included in a ruggedness study to evaluate AASHTO TP4 (AASHTO T312) (6). The ruggedness study was conducted according to ASTM C1067. As specified, seven factors were evaluated as part of the ruggedness study: angle of gyration, mold loading procedure, compaction pressure, precompaction, compaction temperature, specimen height, and aging period. A high and low level was selected for each of these factors. Due to the difficulty in obtaining exact external angles of gyration and exact specimen heights, some tolerance was allowed for both of these parameters. The low range for external angle of gyration varied from 1.22 to 1.24 degrees and the high angle varied from 1.26 to 1.28 degrees. Fixed batch masses of 4500 and 5000 g were used to produce sample heights of approximately 110 and 120 mm. Four 19.0 mm NMAS mixes

Prowell, Brown, & Huner
2
representing two aggregate types (crushed limestone and crushed river gravel) and two gradations (coarse and fine) were used in the experiment. The range for compaction pressure, then specified as ± 3 percent or ± 18.0 kPa, caused significant differences in three of five laboratories for one or more mixes (4 cases, total). Marginally significant differences were found in seven of twenty cases for the height extremes. Additional analysis of the data indicated that the actual differences (approximately 12 mm) exceeded the 10 mm target difference. The 12 mm difference caused marginally significant differences for the fine graded mixes. Therefore, it was recommended that the existing tolerance on sample height in AASHTO TP4 (AASHTO T312) be relaxed from ± 1 mm to ± 5 mm (6). The two ranges for external angle of gyration only resulted in a significant difference in one in twenty cases. As anticipated, higher angles did produce denser specimens, but regression analysis indicated that only one percent of the difference in sample density was explained by the change in angle and the relationship was not significant (6). Both compactor types responded similarly to all seven of the main effects. However, additional analyses indicated differences in sample density between the laboratories that used the Pine AFGC125X compactor and the laboratories that used the Troxler 4140 compactor. Paired comparisons using a t-distribution grouped the three labs using the Pine compactor together and the two labs using the Troxler compactors together for three of the four mixes with the Pine compactors producing higher sample densities. There were three groupings for the fourth mix, but once again the Troxler compactors grouped together (6). As the use of the SGC became widespread across the United States, several additional manufacturers have developed SGCs. In addition, both Pine and Troxler have developed new models of SGCs. This led to the need to develop a means of evaluating the new SGCs to ensure that they would produce results similar to the Pine AFGC125X and Troxler 4140. AASHTO TP4 (AASHTO T312) does not contain a precision statement (2). Therefore, it is not clear what the acceptable difference between various SGCs should be. An on-going study, National Cooperative Highway Research Program Project 9-26, “Precision Statement for AASHTO T 312,” was tasked with this goal (7). The AASHTO Materials Reference Laboratory (AMRL) is conducting this study. The multilaboratory standard deviation for 12 AMRL proficiency samples at Ndesign ranges from 0.69 to 1.40 percent density (0.020 to 0.034 bulk specific gravity) (8). Thus, the acceptable difference between two properly conducted tests by two different laboratories ranges from 1.96 to 3.95 percent density (8). This variability represents the mix design case, which is the worst-case scenario, since each lab batches, mixes, compacts and determines the density of their samples. To address potential differences between compactors, FHWA developed a standard protocol to compare compactors, which was approved by the FHWA Superpave Mixtures Expert Task Group, and is designated AASHTO PP35, “Standard Practice for Evaluation of Superpave Gyratory Compactors (SGCs)” (3,4,9). AASHTO PP35 consists of a comparison between a single unit of the new compactor versus one of the two original pooled fund compactors (Pine AFGC125X or Troxler 4140). The comparison consists of compacting six replicate samples for each of four mixes in both compactors. The mixes specified include: a 12.5 mm nominal maximum aggregate size (NMAS) mix, two 19.0 mm NMAS mixes (one coarse and one fine

Prowell, Brown, & Huner
3
graded) and a 25.0 mm NMAS mix. The comparison is to be performed at one of the five Superpave Regional Centers (3). When evaluating new models, both Pine and Troxler performed the AASHTO PP35 comparisons against their respective original compactor (4, 10). Many agencies, throughout the country, have reported significant differences in the bulk specific gravity of compacted samples from different SGCs, which have been properly calibrated. Buchanan and Brown (11) discussed the importance of different makes and models of gyratory compactors producing similar results:
One point of major concern is the degree of reproducibility between laboratories having different brands of approved SGCs. For example, suppose a contractor uses a brand “A” to design and control an HMA mix; can he be reasonably assured that the State Department of Transportation (DOT), using brand “B,” will get the same mixture results? Many times this scenario occurs with the contractor and a DOT representative each compacting specimens from the same production sample simultaneously at the same location, but using different gyratory compactors.
Iowa Department of Transportation (12) completed a study to address this very concern. They evaluated four brands of SGCs: Pine AFGC125X, Troxler 4140, Test Quip Brovold and Interlaken Model 1. Four 19.0 mm nominal maximum aggregate size mixes, three coarse-graded mixes and one fine-graded mix were used in the study. All of the compactors were calibrated according to the manufacturer’s recommendations prior to testing. The Troxler compactor was found to produce consistently higher densities at Ninitial. This was believed to be related to the manner in which the angle is induced. The Pine SGC consistently produced the highest density and the Interlaken SGC produced the lowest density at Ndesign. The Interlaken SGC produced the largest differences from the average density of all of the compactors. The sensitivity of the density of SGC compacted samples to the angle of gyration was identified during the Strategic Highway Research Program (1). The internal angle of gyration is defined as the angle of the interior of the mold wall relative to the top and bottom plates or platens. The platens are assumed to be parallel to one another. The gyration angle (internal and external) changes (generally decreases) with all types of compactors during compaction, primarily due to flexing of the SGC frame, but can be significant with some compactors. One source of compliance is believed to be the ram used to apply vertical pressure on the samples. One of the platens is generally attached to the ram. When the ram flexes during compaction, the platen supported by the ram may not remain parallel to the opposite platen. For these reasons, the gyration angle must be determined during compaction, preferably with a full-height HMA sample, not in the un-loaded (mold empty) condition. The angle of gyration is measured differently for each brand and many models (within a brand) of gyratory compactors. The Pine Model AFGC125X uses dial gauges and can measure the static (not gyrating) angle in both the loaded (with a full-height HMA sample) and unloaded condition. The Troxler 4140 uses a digital gauge to dynamically (while the compactor is gyrating) measure the offset of the turntable used to apply the angle in the loaded condition. No means for measuring the angle of gyration was supplied for the Rainhart compactors. All of the other compactors, Test Quip (Gilson or Pine AFGB1A), Interlaken, Pine Model AFG1A and Troxler 4141, use internal linear voltage displacement transducers (LVDT) to measure and

Prowell, Brown, & Huner
4
display the external angle of gyration during compaction based on one to three points. The numerous methods of measuring the external angle of gyration result in a lack of uniformity from one SGC to another. The Federal Highway Administration (FHWA) in cooperation with Test Quip Inc. developed an independent device to measure the internal angle of gyration. The device is referred to as the Dynamic Angle Validation Kit (DAVK). The DAVK is placed inside the SGC mold with hot mix asphalt sample. A data acquisition system within the DAVK dynamically records the internal angle of gyration during compaction (13). A draft procedure (9) for evaluating the dynamic internal angle of gyration “Evaluation of the Superpave Gyratory Compactor’s (SGCs) Angle of Gyration Using the FHWA SGC Angle Validation Kit” has been developed by FHWA. Purpose and Scope
The application of a compaction effort that will produce similar densities from one SGC to another is crucial to the proper design, production control, and acceptance of HMA mixes. The angle of gyration is believed to be an important factor affecting the compaction effort. The objective of this study was to evaluate the relationship between the internal angle of gyration measured by the DAVK versus the resulting sample density for a wide range of SGCs and to verify that all of the SGCs used in the state of Alabama; by the contractors, mix designers, and the Alabama Department of Transportation (ALDOT); were compacting with an angle of gyration, under load, that was within the specification values (1.23 to 1.27 degrees) provided in AASHTO T312. Testing was conducted on a total of 112 SGCs throughout the state of Alabama. Initially, it was planned to have the respective manufacturer’s adjust the angle of gyration to bring the internal angle of gyration into compliance with AASHTO T312 for any machine found to be out of tolerance. However, so many machines were found to be out of tolerance that adjustments were postponed until a specification target for the internal angle of gyration was identified. Methodology Internal Angle of Gyration The DAVK unit is shown in Figure 1 with its accompanying NIST traceable calibration standard. The DAVK consists of a machined body designed to fit inside a SGC mold. Two probes connected to a single LVDT protrude through the body and rest against the mold wall. The base of the unit rests against the top or bottom mold plate. During compaction, the base of the DAVK is held tightly against the top or bottom mold plate and acts as a reference plane from which the internal angle of gyration is measured using the LVDTs. The DAVK body contains a data acquisition system and power source. The data acquisition system is programmed and the data downloaded to a notebook computer using software provided by the manufacturer. The DAVK is designed to measure the internal angle of gyration along with a full height (115 mm) tall hot mix asphalt (HMA) sample (13). Figure 2 illustrates the possible measurements of angle of gyration. The external angle of gyration is defined as α. The internal angles of gyration are defined as δT (top) and δB (bottom) for the angle measured when the DAVK is placed above the HMA samples or below the HMA sample, respectively. Previous work (14, 15) indicates that the measured internal angle of gyration is different when the DAVK is placed at the top or

Prowell, Brown, & Huner
5
Figure 1. DAVK and Calibration Block
Figure 2. Definition of Internal and External Angle of Gyration
bottom of the mold. Dalton states,
Discrepancies between the external and internal angles arise from the differing amounts of end plate deflection at the top and the bottom of the mold. One end of the specimen is compacted against a rigid part of the compactor while the other end is compacted against the ram. On most SGC models, the end plate supported by the ram is subject to more deflection than the other end plate. As a result, the DAVK typically detects a lower internal angle of gyration against the ram (14).
Previous work (13,14,15) with the DAVK suggests that δT and δB should be averaged to determine an effective internal angle of gyration (δAVG).

Prowell, Brown, & Huner
6
The DAVK unit is approximately 77 mm tall. Certain SGC molds cannot accommodate the DAVK and a 115 mm tall (final height) HMA sample. The manufacturer of the DAVK (13) recommends two potential methods to handle this problem: precompaction and extrapolation. To measure the internal angle of gyration using precompaction, the DAVK and a portion of the mix necessary to produce a full height gyratory sample is added to the mold. Typically, 40 gyrations or a number of gyrations that provides sufficient room to add the remainder of the mixture would be applied to a portion of the mix and the DAVK. At this point compaction is stopped, the mold is removed from the compactor and the remaining HMA necessary to produce a 115 mm tall sample is added to the mold. Finally, compaction is resumed. During data analysis, only the portion of the collected data for which the mold contained all of the HMA is used. To determine the internal angle of gyration by extrapolation, a series HMA masses necessary to produce varying height samples are utilized. Typically, three sample masses are used (to produce three different height samples) for the extrapolation for which two replicates of each sample mass are compacted with the DAVK against the upper platen and two replicates with the DAVK against the lower platens. Previous work (15, 16) indicates an excellent linear relationship between sample height and internal angle of gyration with the DAVK at both the top and the bottom of the mold. Extrapolations to 115 mm are performed separately to determine δT and δB. δT and δB are then averaged to produce δAVG. The extrapolation method was used to measure the internal angle of gyration of compactors that could not accommodate the DAVK and a full height HMA sample. Preliminary experiments were performed with a compactor that could use full height samples to verify this procedure and will be discussed later in the paper. Superpave Gyratory Compactors Five brands of SGCs representing 9 models of SGCs were being used in the state of Alabama at the time the study was conducted. Some of these models were not capable of holding a full height uncompacted HMA sample along with the DAVK. Table 1 summarizes the brands, models, numbers of compactors tested and maximum sample height tested. The Brovold model BGC-1, Gilson model HM-293 and Pine model AFGB1A compactors are essentially the same. They are referred to as Brovold compactors in the paper although the majority are the Gilson model HM-293 compactors. For the compactors with maximum sample heights tested of 115 mm, two replicates were compacted with the DAVK against the top platen and two against the bottom platen. The exception was the Pine Model AFG1A, for which four samples were compacted with the DAVK against the upper platen, two with the LVDTs facing forward and two with the LVDTs rotated 90 degrees. Additionally, two samples were compacted with the DAVK against the bottom platen. This was done because the Pine AFG1A gyrates in an elliptical orbit. By measuring δT at two points perpendicular to one another, an average δT was determined. For the SGCs that could not accommodate a full height HMA sample and the DAVK, extrapolation was performed at three sample heights. Two replicate samples were compacted with the DAVK against the top platens and two replicate samples were compacted with the DAVK against the bottom platen at each sample height.

Prowell, Brown, & Huner
7
Table 1. Superpave Gyratory Compactors Evaluated Brand Model Number
Evaluated Maximum Sample Height
Tested, mm Brovold/Gilson/Pine HM-293 13 100 Interlaken GYR-001 14 100 Pine AFG1A 47 115 Pine AFGC125X 15 115 Rainhart 144 2 115 Troxler 4140 16 75 Troxler 4141 5 100
RESULTS AND DISCUSSION Preliminary Experiments Preliminary experiments were conducted to answer three issues: Does the NMAS or gradation of the HMA compacted with the DAVK affect the measured internal angle of gyration? Does the extrapolation technique determine an internal angle of gyration that is the same as if the angle was actually measured with a 115 mm HMA sample? If two DAVKs were used in the study, would they measure the same internal angle of gyration? It takes the DAVK approximately 30 minutes to cool to 40C between samples. In order to expedite testing at the field locations, it was desired to use two DAVKs, which would be rotated in sequence. Two mix designs were used in the preliminary experiments, a fine-graded 9.5 mm NMAS Superpave mix and a coarse-graded 19.0 mm NMAS mixture. Both mixtures were produced with a granite aggregate. Marble dust was used for material passing the 0.075 mm sieve. The target gradations are shown in Table 2. Extrapolation Experiment The Pine model AFGC125X can compact a full height (115 mm) HMA sample along with the DAVK. Therefore, samples could be compacted at HMA sample heights less than 115 mm and the internal angle extrapolated, and then full height HMA samples could be compacted with the DAVK. This would allow a direct comparison of the extrapolated internal angle of gyration and that measured using a full height sample. Two DAVKs were utilized in the experiment. The manufacturer (13) recommends allowing the DAVK to cool in front of a fan until it reaches a temperature of 40C. This typically takes 25 to 30 minutes. In order to expedite testing, it was desirable to alternate two DAVKs during the field-testing program. The serial numbers of the two DAVKs used were 104 and 106.

Prowell, Brown, & Huner
8
Table 2. Preliminary Experiment Mixture Gradations Sieve Size, mm 9.5 mm NMAS ARZ 19.0 mm NMAS BRZ
25.0 100 100 19.0 100 95 12.5 100 76 9.5 93 64 4.75 72 37 2.36 55 25 1.18 40 19 0.6 30 14 0.3 20 10 0.15 10 7 0.075 5.3 5
Asphalt Content, % 6.0 4.6 Two replicate samples were compacted with each DAVK against both the top and bottom plates for each sample mass. Four samples masses: 2000, 2500, 3000 and 4600g were used to produce sample heights approximately equal to: 54, 65, 76 and 115 mm, respectively. In total, 32 measurements of the internal angle of gyration were made using the 19.0 mm NMAS mix. An analysis of variance (ANOVA) was performed using Minitab statistical software to determine which factors significantly affected the measured internal angle of gyration. Internal angle of gyration was used as the response variable, DAVK serial number, sample mass and position in the mold (top or bottom) were used as factors. The results of the analysis are shown in Table 3. Figure 3 demonstrates the interaction between the factors. The kit is not significant at the 95 percent confidence level. Interactions between the kit and the other factors are also not significant at the 95 percent confidence level. This means that the two kits could be alternated in order to measure the internal angle of gyration more quickly. Based on the calculated F-value, the location of the DAVK in the SGC mold, top or bottom, is the most significant factor affecting the measured angle of gyration for the Pine AFGC125X. As shown in Figure 3, the measured internal angle of gyration is smaller when the DAVK is against the upper platen. This matches expectations as the Pine AFGC125X ram loads from the top of the sample. The sample mass, which was used to vary the sample height, was also significant as was the interaction between the location of the DAVK and sample mass. The measured internal angle of gyration decreases with increasing sample mass (height). This matches the findings of previous research (15, 16). As seen in Figure 3, sample mass has a lesser effect on δB than on δT for the Pine AFGC125X. This may be because the ram in the Pine AFGC125X loads the sample from the top and the bottom platen rests against the rotating base.

Prowell, Brown, & Huner
9
Table 3. ANOVA for Pine Extrapolation Experiment Source (Factor) Degrees of
Freedom F-value p-value Significant
Kit 1 3.44 0.082 No Location 1 1832.39 0.000 Yes Sample Mass 3 118.65 0.000 Yes Kit * Location 1 2.72 0.119 No Kit * Mass 3 0.28 0.837 No Location * Mass 3 159.66 0.000 Yes Kit*Location*Mass 3 1.70 0.207 No Error 16 Total 31
Bottom
Top
2000
2500
3000
4600
1.0
1.1
1.2
1.0
1.1
1.2Kit
Location
Mass
104
106
Bottom
Top
Figure 3. Interaction Plot for Pine AFGC125X Extrapolation Experiment
The extrapolations and measured internal angles of gyration at 115 mm are shown in Figure 4 and 5 for DAVKs 104 and 106, respectively. The extrapolated internal angle of gyration for DAVK 104 was 1.139 degrees while the average measured internal angle of gyration at 115 mm was 1.112 degrees. The extrapolated internal angle of gyration for DAVK 106 was 1.141 degrees while the average measured internal angle of gyration at 115 mm was 1.112 degrees. In both cases, there appears to be a difference of 0.03 degrees between the extrapolated and measured angle of gyration at 115 mm. Previous work by FHWA has also indicated that the measured internal angle of gyration is linearly related to sample height with a modified Troxler model 4140 SGC (16). Thus, it was decided to use the extrapolation procedure to measure the internal angle of gyration on those compactors that could not accommodate a full height (115 mm) HMA sample when the DAVK was placed in the mold.

Prowell, Brown, & Huner
10
Pine AFG125X Kit 104: 19.0mm NMAS Coarse-Graded
y = -0.0025x + 1.2991R2 = 0.8415
y = 0.0009x + 1.1692R2 = 0.5243
y = -0.0008x + 1.2312R2 = 0.5105
Angle at 115 mm =1.139 deg.
0.8000.8500.9000.9501.0001.0501.1001.1501.2001.2501.3001.3501.400
40.0 50.0 60.0 70.0 80.0 90.0 100.0 110.0 120.0 130.0
Height (mm)
AVK
Inte
rnal
Ang
le (d
egre
es)
Kit on Top Kit on Bottom AveragesTop @ 115mm Bottom @ 115mm Average @ 115mm
Figure 4. DAVK 104 Extrapolated Internal Angle of Gyration versus Sample Height
Pine AFG125X Kit 106: 19.0mm NMAS Coarse-Graded
y = -0.0018x + 1.2409R2 = 0.7747
y = 0.0002x + 1.2121R2 = 0.0217
y = -0.0007x + 1.2213R2 = 0.7709
Angle at 115 mm =1.141 deg.
0.8000.8500.9000.9501.0001.0501.1001.1501.2001.2501.3001.3501.400
40.0 50.0 60.0 70.0 80.0 90.0 100.0 110.0 120.0 130.0 140.0
Height (mm)
Inte
rnal
Ang
le (d
egre
es)
Kit on Top Kit on Bottom AveragesTop @ 115mm Bottom @ 115mm Average @ 115mm
Figure 5. DAVK 106 Extrapolated Internal Angle of Gyration versus Sample Height

Prowell, Brown, & Huner
11
Effect of Mix Type on Internal Angle Measurements Two mixes were tested in the Troxler 4140, the 9.5 mm and the 19.0 mm NMAS granite mixtures shown in Table 2. Both mixtures were tested at four samples masses: 1500, 2000, 2500, and 3000 g. Two replicate samples were tested with the DAVK against the top plates and two replicate samples were tested with the DAVK against the bottom platen for each sample mass. An example of the Troxler 4140 extrapolations is shown in Figure 6. The extrapolation fits for the Troxler 4140 are better than those for the Pine AFGC125X. Finally the testing was repeated with the external angle of gyration set at two levels, 1.167 and 1.267 degrees with the manufacturer’s calibration kit. The initial internal angle of the compactor was 1.167 degrees. The external angle was increased 0.1 degrees for comparison. In total, 64 dynamic internal angle (DIA) of gyration measurements were made with the DAVK.
Troxler 4140 (Manufacturer's Angle @ 1.167)Kit 106: 19.0mm NMAS Coarse-Graded
y = -0.0028x + 1.2805R2 = 0.912
y = -0.0018x + 1.2538R2 = 0.9585
y = -0.0023x + 1.2679R2 = 0.9845
0.8000.8500.9000.9501.0001.0501.1001.1501.2001.2501.3001.3501.400
30.0 40.0 50.0 60.0 70.0 80.0 90.0 100.0 110.0 120.0
Height (mm)
AV
K In
tern
al A
ngle
(deg
rees
)
Bottom Angle Top Angle AverageLinear (Top Angle) Linear (Bottom Angle) Linear (Average)
Figure 6. Example Extrapolation for Troxler Model 4140 SGC ANOVA was performed to statistically evaluate which factors and interactions were significant. Measured internal angle of gyration was used as a response with sample mass, location (top or bottom), mix type (9.5 or 19.0 mm) and external angle of gyration as factors. The results are shown in Table 4. Sample mass, location of the DAVK and external angle of gyration were all significant factors. As expected, the external angle of gyration was the most significant factor based on an F-value (6076.18) almost ten times the next highest factor, sample mass (687.82). For the Troxler 4140, sample mass had a higher F-value (687.82) and therefore greater effect than location of the DAVK (334.11). Mix type was not a significant factor in the measured internal angle of gyration. Only three interactions between factors were significant: mass*location, mass*mix and mass*external angle of gyration. Since the real variable of interest was sample height, the interactions between mass and mix and mass and external angle of

Prowell, Brown, & Huner
12
gyration make sense. The 9.5 mm NMAS mix produced different sample heights at the same mass than the 19.0 mm NMAS mix. The same is true with external angle of gyration, a higher external angle of gyration would tend to provide more compaction and therefore shorter samples for the same sample mass. The interaction between sample mass and location was also found significant in the Pine experiment (Table 4).
Table 4. ANOVA for Troxler Mix Type and External Angle of
Gyration Experiment Source Degrees
of Freedom
F-value p-value
Significance
Mass 3 687.82 0.000 Yes Location 1 334.11 0.000 Yes Mix 1 0.17 0.683 No External Angle 1 6076.18 0.000 Yes Mass*Location 3 59.97 0.000 Yes Mass*Mix 3 9.48 0.000 Yes Mass*External 3 0.18 0.910 No Location*Mix 1 1.75 0.195 No Location*External 1 0.51 0.479 No Mix* External 1 22.14 0.000 Yes Mass*Location*Mix 3 2.80 0.056 No Mass*Location*External 3 1.17 0.335 No Mass*Mix*External 3 1.13 0.351 No Location*Mix*External 1 0.64 0.428 No Four way (all factors) 3 1.09 0.368 No Error 32 Total 63
Based on the extrapolations to full sample height, for the 9.5 mm NMAS mix, a difference in external angle of gyration of 0.10 degree (as measured using the manufacturer’s calibration equipment) produced a difference in internal angle of gyration of 0.09 degrees. For the 19.0 mm NMAS mix, a difference in external angle of gyration of 0.10 degrees produced a difference in internal angle of gyration of 0.13 degrees. Thus the average difference in the measured internal angle of gyration for the two mixes was 0.11 degrees. Dalton (17) reported that four compactors, adjusted to the same internal angle of gyration, compared favorably for nine of ten mixes representing a wide range of NMAS according to the criteria established for AASHTO PP35 (3,9). Two of the four compactors allowed full height HMA samples to be compacted with the DAVK, one used precompaction and one used extrapolation. The results of this experiment indicated that the measured internal angle of gyration was independent of mix type. Further, the experiment indicated that the extrapolated internal angle of gyration responded to the external angle of gyration set with the manufacturer’s calibration equipment for NCAT’s Troxler Model 4140.

Prowell, Brown, & Huner
13
Field Evaluation of Internal Angle of Gyration The 19.0 mm NMAS granite mixture, shown in Table 2, was selected for the field evaluation. Initially, the mix was produced with 4.6 percent asphalt, which equated to four percent air voids during design. However, after testing 29 compactors the average air voids of the full height samples compacted without the DAVK in the mold to determine sample density was 3.4 percent. Therefore, the optimum asphalt content was reduced to 4.4 percent for the remainder of the study. The design asphalt content was determined with NCAT’s Pine model AFGC125X compactor. It is believed that mold wear, to be discussed later, contributed to the high asphalt content. When evaluating SGCs that would allow a full height HMA sample along with the DAVK, seven samples were tested: two 4600 g samples with the DAVK on top, two 4600 g samples with the DAVK on the bottom and three samples for density determination without the DAVK in the mold. For the compactors shown in Table 1 for which full height samples could not be used, samples were compacted using four sample masses. Three sample masses were used with the DAVK with two replicate samples compacted with the DAVK on both the top and bottom of the mold and three 4600g sample were compacted for density determination. Thus for the SGCs requiring extrapolation, a total of 15 samples were required. Based on these requirements, a minimum of 784 HMA samples were required for the 112 compactors evaluated. There was some concern about controlling the gradation of 784 laboratory-produced samples. Therefore 18 samples (approximately 2.3 percent) were randomly selected prior to mixing. Washed gradations were performed on these samples to determine gradation control. The results (Table 5) indicate very good control of the samples with a maximum standard deviation of 1.5 percent. The sample gradations did deviate from target for the coarse sieves.
Table 5. Random Gradations from Field Samples Sieve Size, mm Target
19.0 mm Gradation Average 19.0 mm
Gradation Standard Deviation
25.0 100 100.0 0.0 19.0 95 95.2 0.5 12.5 76 81.0 1.3 9.5 64 69.1 1.5 4.75 37 40.5 0.5 2.36 25 25.9 0.1 1.18 19 20.3 0.5 0.6 14 15.0 0.3 0.3 10 11.3 0.4 0.15 7 7.4 0.2 0.075 5 5.4 0.1
However, the deviation appears to be consistent and the deviation from the target should not affect the measured internal angles of gyration or sample densities.

Prowell, Brown, & Huner
14
Prior to determining the internal angle of gyration, the calibration of the SGC at a given site was verified according to the manufacturer’s recommendations. The external angle was measured, but not adjusted if the compactor was out of tolerance. Figure 7 shows the average external angle of gyration (measured with the SGC manufacturer’s calibration equipment) by compactor type. The error bars represent ± one standard deviation of the mean. The dashed lines represent the angle range, 1.25 ±0.02 degrees, specified by AASHTO T312. There was not equipment available to verify the external angle of gyration for the two Rainhart SGCs evaluated in the study. The external angle of gyration for the Interlaken compactors is displayed during compaction, based on an LVDT measurement by the machine. The external angles, displayed by two of the Interlaken Compactors, are not included. The angles for these two compactors, 0.43 and –0.048 degrees are considered to be erroneous data. The Troxler 4141 indicates the most consistent external angle of gyration. However, the Troxler 4141 data set only includes five compactors.
1.050
1.100
1.150
1.200
1.250
1.300
1.350
Brovold
Interl
aken
Pine A
FG1A
Pine A
FGC125X
Rainha
rt
Troxler
4140
Troxler
4141
Mfg
. Ext
erna
l Ang
le
MinimumAverageMaximum
Error bars = +/- one standard deviation
Figure 7. Average External Angle of Gyration
The average, minimum, maximum and standard deviation of the internal angle of gyration are shown by compactor type in Figure 8. The standard deviation is not shown for the Rainhart compactors as only two units were evaluated. The Interlaken and Rainhart compactors indicate the widest variation in measured internal angles of gyration (minimum to maximum). The Pine AFG1A and Pine AFGC125X indicate the least variability in measured internal angle of gyration. For comparison, the averages and standard deviations for both the internal and external angles of gyration are reported in Table 6. In some cases, the external angle of gyration could not be obtained.

Prowell, Brown, & Huner
15
0.550
0.650
0.750
0.850
0.950
1.050
1.150
1.250
1.350
Brovold
Interl
aken
Pine A
FG1A
Pine A
FGC125X
Rainha
rt
Troxler
4140
Troxler
4141
Dyn
amic
Inte
rnal
Ang
le
MinimumAverageMaximum
Error bars = +/- one standard deviation
Figure 8. Average Internal Angle of Gyration by Compactor Type
Table 6. Averages and Standard Deviations for Internal and External Angles of Gyration
Internal Angle, Degrees External Angle, Degrees SGC Avg. STD. N Avg. STD. N
Brovold 1.156 0.0586 12 1.271 0.0266 10 Interlaken 0.977 0.1341 15 1.231 0.0311 111
Pine AFG1A 1.194 0.0337 47 1.254 0.0072 39 Pine AFGC125X 1.187 0.0381 15 1.229 0.0367 13 Rainhart 1.027 NA 2 NA NA NA Troxler 4140 1.080 0.0829 17 1.263 0.0253 15 Troxler 4141 1.016 0.0745 5 1.239 0.0017 3
1Does not include two compactors that displayed angles of 0.43 and –0.048 degrees. The average internal angle of gyration is always less than the average external angle of gyration. This reflects the compliance inherent in every SGC. The variability (standard deviation) of the measurements of the internal angle of gyration were greater than the external measurements. The Interlaken and Troxler compactors appear to have the greatest difference between the external and internal angles of gyration. The average internal angle of gyration for the Interlaken compactors was 0.21 degrees less than the external angle of gyration for the 11 compactors for which both measurements were made. The average internal angles of gyration for the Troxler compactors were 0.18 and 0.22 degrees less than the external angles of gyration respectively, for the models 4140 and 4141. It is interesting to note that the average external angle of gyration is within the tolerances (rounded to two decimal places) established in AASHTO T312 for all of the compactors (Rainhart SGCs were not evaluated for external angle of gyration). The

Prowell, Brown, & Huner
16
relationship between external and internal angle of gyration by compactor type is shown in Figure 9. On average, there is no trend between the internal and external angles of gyration. This finding was not unexpected since all of the compactors were supposed to be set an external angle of gyration equal to 1.25 ± 0.02 degrees. Instead, Figure 9 shows the average variability in internal angle of gyration between machines. The preliminary experiments and previous work (15) indicate that changing the external angle of gyration will change the internal angle of gyration for a given compactor.
R2 = 0.1256
0.80
0.85
0.90
0.95
1.00
1.05
1.10
1.15
1.20
1.25
1.30
0.80 0.85 0.90 0.95 1.00 1.05 1.10 1.15 1.20 1.25 1.30
Dynamic Internal Angle, degrees
Mfg
. Ext
erna
l Ang
le, d
egre
es
No Rainhart data shown
Figure 9. Relationship Between Average External and Internal Angle of Gyration
Following the determination of the internal angle of gyration, three replicate full height (115 mm [4600 g]) samples were compacted on each SGC evaluated. The samples were cooled and returned to NCAT for determination of bulk specific gravity (Gmb). The original mix design, conducted on NCAT’s Pine model AFGC125X, indicated a design asphalt content of 4.6 percent. However after testing 28 compactors, the average air void content of the samples compacted without the DAVK for density determination was 3.4 percent. This is believed to be related to a mold wear problem with NCAT’s Pine model AFGC125X, that will be discussed later in the paper. Since the average air voids were less than 4 percent, the asphalt content (AC) for the AVK density evaluation mix was reduced to 4.4 percent for the 86 remaining compactors. It was believed that using a mixture that averages less than 4.0 percent air voids would tend to mask the differences between compactors. A constant maximum specific gravity of 2.530 or 2.538 was used to determine all of the sample air void contents for the 4.6 and 4.4 percent AC samples, respectively. Figures 10 and 11 show the averages, minimums, maximums and standard deviations by compactor type for the density samples air void contents produced at 4.6% and 4.4% AC, respectively. Table 7 shows a summary of the data presented in Figures 10 and 11.

Prowell, Brown, & Huner
17
0
1
2
3
4
5
6
Brovold Interlaken Pine AFG1A PineAFGC125X
Rainhart Troxler 4140 Troxler 4141
Air
Void
s, %
Minimum Average Maximum
Error Bars = +/- One Standard Deviation
Figure 10. Average Sample Air Voids by SGC Type for 4.6% AC Samples
The Rainhart compactors produced the lowest sample air voids. The Rainhart compactors produced sample air voids that were on average 1.8 percent lower than the average of the other brands and models of SGC. On average, the two models of Troxler SGC produce higher air voids than the Brovold, Interlaken or Pine models. For the 4.6 percent AC samples, the Pine model AFGC125X and AFG1A compactors both produced average air voids of 3.42 and 3.26 percent, respectively while the Troxler 4140 compactors produced average sample air voids of 3.83 percent. Thus on average, a difference of between 0.4 and 0.6 percent air voids could be expected between the Pine model AFGC125X and AFG1A and Troxler model 4140 compactors. For the 4.4 percent asphalt content samples, the Pine model AFGC125X and AFG1A compactors both produced average air voids of 4.1 percent while the Troxler models 4140 and 4141 produced average sample air voids of 4.6 and 4.9 percent respectively. This indicates that a difference of between 0.5 and 0.8 percent air voids could be expected between Pine and Troxler compactors.

Prowell, Brown, & Huner
18
0
1
2
3
4
5
6
Brovold Interlaken Pine AFG1A PineAFGC125X
Rainhart Troxler 4140 Troxler 4141
Air
Void
s, %
Minimum Average Maximum
Error Bars = +/- One Standard Deviation
Figure 11. Average Sample Air Voids by SGC Type for 4.4% AC Samples
Table 7. Average Sample Air Voids by SGC Type Air Voids, percent
Compactor Model Average Minimum Maximum
Standard Deviation N Avg. DIA
Compactors Evaluated using 4.6 percent AC Samples Brovold 3.42 3.41 3.43 0.009 2 1.185 Interlaken 3.30 2.69 4.16 0.644 4 1.040 Pine AFG1A 3.26 2.81 3.75 0.274 10 1.192 Pine AFGC125X 3.42 3.19 3.68 0.210 5 1.160 Troxler 4140 3.83 3.33 4.24 0.291 7 1.120 All Compactors 3.45 2.69 4.24 0.390 28 1.146 Compactors Evaluated using 4.4 percent AC Samples Brovold 4.28 3.24 5.54 0.585 11 1.154 Interlaken 4.35 3.57 5.48 0.671 11 0.954 Pine AFG1A 4.11 3.35 5.46 0.486 37 1.195 Pine AFGC125X 4.12 3.64 4.67 0.392 10 1.200 Rainhart 2.43 1.68 3.17 1.054 2 1.027 Troxler 4140 4.64 3.96 5.56 0.554 9 1.052 Troxler 4141 4.86 4.25 5.56 0.489 5 1.016 All Compactors 4.23 1.68 5.56 0.628 85 1.129

Prowell, Brown, & Huner
19
The results from one Troxler 4140 compactor were excluded. The three density samples produced air voids of 11.2, 4.9 and 10.7 percent for an average of 8.9 percent. Due to the variability of these results, it was assumed that there was a malfunction during compaction. At 4.4 percent asphalt content, the air voids of samples compacted in the Brovold and Interlaken compactors fell between the Pine and Troxler with average air voids of 4.3 and 4.4 percent, respectively. The air voids for all of the samples tested are shown in Appendix A, allowing comparisons to be made between individual compactors by serial number. Figure 12 shows the relationship between the external angle of gyration and Gmb excluding the Rainhart and Interlaken data. Regression analysis indicates that approximately 5 and 2 percent of the variation in Gmb is explained by the variation in the external angle of gyration measured using the manufacturer’s calibration equipment, respectively, for the density samples produced at 4.6 and 4.4 percent asphalt content (AC). Statistically, neither the relationship for the 4.6 or 4.4 percent asphalt content samples are significant at the 95 percent confidence level (p-values = 0.343 for 4.6 percent AC and 0.256 for 4.4 percent AC). This indicates that there is no relationship between external angle of gyration and Gmb. Again, this result is not unexpected as all of the compactors evaluated should have had external angles of gyration equal to 1.25 ± 0.02 degrees. No correlation would be expected over this small of an angle range.
4.4% AC R2 = 0.0189
4.6% AC R2 = 0.0481
2.380
2.400
2.420
2.440
2.460
2.480
2.500
2.520
1.14 1.16 1.18 1.2 1.22 1.24 1.26 1.28 1.3 1.32 1.34
Mfg. External Angle of Gyration, degrees
Gm
b
4.4% AC 4.6% AC Figure 12. External Angle of Gyration versus Gmb
Figure 13 shows the relationship between dynamic internal angle (DIA) of gyration, measured with the DAVK and Gmb for all of the SGCs evaluated using the 19.0 mm NMAS mix at 4.6 percent AC. Figure 14 shows the relationship for all of the SGCs evaluated using the 19.0 mm mix at 4.4 percent AC. The symbols in the figure represent the different compactor types. A

Prowell, Brown, & Huner
20
linear regression was performed using internal angle of gyration as a predictor variable for Gmb. For the SGCs evaluated using the mixture at 4.6 percent AC, the R2 value of 0.15 indicates that 15 percent of the variation in Gmb is explained by the internal angle of gyration. Further, the ANOVA performed as part of the regression analysis (shown in the figure) indicates that the relationship is significant at the 95 percent confidence level (p-value = 0.046). For the SGCs evaluated using the mixture at 4.4 percent AC, the R2 value of 0.08 indicates that 8 percent of the variation in Gmb is explained by the internal angle of gyration. The ANOVA performed as part of the regression analysis (shown in the figure) indicates that the relationship is also significant at the 95 percent confidence level (p-value = 0.046). The complete density and DIA data are shown in Appendix A and B, respectively.
y = 0.0363x + 2.3897R2 = 0.081
2.380
2.400
2.420
2.440
2.460
2.480
2.500
0.600 0.700 0.800 0.900 1.000 1.100 1.200 1.300 1.400
Dynamic Internal Angle, degrees
Gm
b
Brovold Interlaken Pine AFG1A Pine AFGC125X Rainhart Troxler 4140 Troxler 4141
Analysis of Variance for RegressionSource DF SS MS F P
Regression 1 0.00037559 0.00037559 4.39 0.046Residual Error 26 0.00222312 0.00008550Total 27 0.00259871
Trendline represents best fit for all compactors
Figure 13. Internal Angle of Gyration versus Gmb for SGCs tested with 19.0 mm NMAS at
4.6 Percent AC The grouping of the data points in Figures 13 and 14 also suggests the Rainhart and Interlaken compactors may represent different populations in the relationship between DIA and Gmb as opposed to the other SGCs. Examination of Figures 7, 8, 10, and 11 suggests that both the Interlaken and Rainhart compactors produced lower internal angles of gyration, compared to the remaining compactors but also lower air void contents. Further the R2 value (0.08) for the 4.4 percent AC samples that included 2 Rainhart and 11 Interlaken SGCs is poorer than the R2 value (0.15) for the 4.6 percent AC samples that only includes 4 Interlaken compactors.

Prowell, Brown, & Huner
21
y = 0.0587x + 2.3755R2 = 0.1455
2.410
2.420
2.430
2.440
2.450
2.460
2.470
2.480
2.490
2.500
0.600 0.700 0.800 0.900 1.000 1.100 1.200 1.300 1.400
Dynamic Internal Angle, degrees
Gm
b
Brovold Interlaken Pine AFG1A Pine AFGC125X Troxler 4140 Linear (All)
Analysis of Variance for RegressionSource DF SS MS F P
Regression 1 0.00037559 0.00037559 4.39 0.046Residual Error 26 0.00222312 0.00008550Total 27 0.00259871
Trendline represents best fit for all compactors
Figure 14. Internal Angle of Gyration versus Gmb for SGCs tested with 19.0 mm NMAS at
4.4 Percent AC The DIA data for the Interlaken and Rainhart compactors were examined to see if there were any indications as to why they behaved differently than the remaining SGCs. As shown in Table 8, examination of the extrapolations used to predict the internal angles of gyration for the Interlaken compactors suggest that the difference between the internal angle of gyration measurements with the DAVK against the upper and lower platens was almost five times larger for the Interlaken compactor than for the other compactors. It is possible that the difference between the internal angle when the DAVK is on the top or bottom of the mold is so great that the δAVG concept is
Table 8. Average Top and Bottom DIA by SGC
Compactor
Average Top DIA, degrees
Standard Deviation Top DIA
Average Bottom DIA,
degrees
Standard Deviation
Bottom DIA
Average Difference
(Top – Bot.) DIA, degrees
Number Evaluated
Brovold1 1.11 0.063 1.20 0.055 -0.091 13 Interlaken1 0.85 0.191 1.11 0.199 -0.256 14 Pine AFG1A 1.21 0.034 1.18 0.045 0.023 47 Pine AFGC125X1 1.17 0.054 1.21 0.025 -0.042 15 Rainhart 1.07 0.454 1.00 0.424 0.070 2 Troxler 41401 1.06 0.095 1.10 0.084 -0.037 16 Troxler 4141 1.06 0.086 0.97 0.102 0.081 5 1Ram loads from the top of the compactor.

Prowell, Brown, & Huner
22
Not valid. Table 8 also reconfirms the concept that the DIA is smaller when the DAVK is against the SGC ram. The complete DIA data is shown in Appendix B by compactor model. Figure 15 shows the internal angle of gyration versus Gmb excluding the Interlaken and Rainhart data. Regression analyses for all of the compactors except the Interlaken and Rainhart compactors produce R2 value of 0.38 and 0.37, respectively for the 19.0 mm NMAS mix prepared with 4.6 and 4.4 percent AC. This indicates that approximately 37 percent of the variation in Gmb is explained by the variation in internal angle of gyration. As shown in Table 9, ANOVA indicates that the relationships are significant at the 95 percent confidence level.
y = 0.1259x + 2.2956R2 = 0.3757
y = 0.1017x + 2.3121R2 = 0.3678
2.390
2.400
2.410
2.420
2.430
2.440
2.450
2.460
2.470
0.800 0.850 0.900 0.950 1.000 1.050 1.100 1.150 1.200 1.250 1.300
Average DIA, degrees
Gm
b
4.4% AC 4.6% AC Figure 15. Internal Angle of Gyration versus Gmb Excluding Interlaken and Rainhart
Compactors The two Rainhart SGCs had vastly different internal angles of gyration (0.72 and 1.35 degrees). Since two compactors did not allow meaningful comparisons to be made and since there was no way to measure their external angle of gyration, further analysis of the Rainhart data was not completed.

Prowell, Brown, & Huner
23
Table 9. ANOVA Results for Regression Relating DIA versus Gmb excluding the Rainhart and Interlaken Compactors
4.6% AC Source DF SS MS F P
Regression 1 0.000664 0.0006640 13.41 0.001 Residual Error 22 0.001089 0.0000495 Total 23 0.001753
4.4% AC Source DF SS MS F P
Regression 1 0.004951 0.0049510 40.52 0.000 Residual Error 70 0.008554 0.0001222 Total 71 0.013505
Interlaken y = 0.074x + 2.357
R2 = 0.4013
All Others Except Rainharty = 0.1017x + 2.3121
R2 = 0.3678
2.390
2.400
2.410
2.420
2.430
2.440
2.450
2.460
0.600 0.700 0.800 0.900 1.000 1.100 1.200 1.300 1.400
DIA, degrees
Gm
b
All Other SGCs except Rainhart Interlaken Figure 16. Internal Angle of Gyration versus Gmb Excluding Rainhart Compactors
The Interlaken data is shown separately from the other SGCs in Figure 16 for the 19.0 mm NMAS mix produced at 4.6 percent AC. The Rainhart data is not shown in the figure. The Interlaken data at 4.4 percent AC is not shown since only four compactors were evaluated. The regression line for the Interlaken data produced an R2 value of 0.40. It is interesting that the Interlaken SGCs produced higher sample densities with lower internal angles than the remaining compactors. The difference in the intercepts for the two regression lines is 0.045, with the Interlaken compactors having the larger intercept. The shaft of the Interlaken loading ram is flexible and can be moved from side to side with light hand pressure. It is believed that this flexibility may invalidate the extrapolation of the internal angle of gyration based on the average of the angle with the DAVK at the top and bottom of the mold.

Prowell, Brown, & Huner
24
Figure 17 shows the average internal angle of gyration versus the average Gmb values by compactor type for the 19.0 mm NMAS mix at 4.4 percent AC. A simple linear regression was performed with internal angle of gyration as a predictor for Gmb excluding the Interlaken and Rainhart data. The R2 = 0.99 indicates on average an excellent relationship between average internal angle of gyration and average sample bulk density. This indicates that though the external angles of gyration for the different brands and models of SGCs are approximately the same (Figure 7) and meet the AASHTO T312 specifications, the compliance of each brand/model of SGC produces a unique difference between the external and internal angle of gyration. Though Figure 17 shows a strong relationship between the average internal angle for each SGC type and the resulting density of samples compacted in that compactor type, Figures 13 and 14 clearly show that the internal angle of gyration does not explain all of the variation in density from one SGC to another. The scatter in the data shown in Figures 13 and 14 is probably due to a myriad of factors including: materials variation, variance in mix handling, machine wear, variance in sample height and variance in pressure. Mold wear may also affect the results. It is expected that if an experiment were designed to vary DIA with a group of compactors that a better correlation between DIA and Gmb would be determined. The relationship shown in Figure 17 indicates that on average a change in 0.1 degrees of internal angle will result in a change of 0.010 Gmb units or a difference in air voids of approximately 0.4 percent. Therefore, a change of ±0.02 degrees as allowed by
y = 0.0999x + 2.314R2 = 0.99
2.41
2.42
2.43
2.44
2.45
2.46
2.47
2.48
0.80 0.85 0.90 0.95 1.00 1.05 1.10 1.15 1.20 1.25
DIA, degrees
Ave
rage
Gm
b
Rainhart
Interlaken
Troxler 4141
Troxler 4140
BrovoldPine AFGC125X
Pine AFG1A
On average, a 0.02 degree change in DIA results in a 0.002 in Gmb or 0.08% Air Voids
Figure 17. Gmb versus Average Internal Angle of Gyration

Prowell, Brown, & Huner
25
AASHTO T312 could produce a difference in air voids of approximately 0.08 percent or based on Superpave’s rule of thumb (all things being equal, a 0.4% change in AC% results in a 1.0% change in air voids) approximately a 0.03 percent difference in design asphalt content. However, it should be noted than based on Figure 10, average differences of approximately one percent air voids exist between various models of SGCs used in Alabama. This would lead to differences of approximately 0.4 percent in design asphalt content. By comparison, Dalton (14) indicated that a 0.1 degree change in internal angle resulted in a change of 0.014 Gmb units. Precision of Density Results The density test results from the AVK study were analyzed for precision in accordance with ASTM C 802 and ASTM E 691 (18). These standards are recommended practices to determine the between- and the within-laboratory estimates of a test method. The within-laboratory precision, or repeatability, provides an expectation of the difference in test results between replicate measurements on the same material in the same laboratory by one operator using the same equipment. The between-laboratory precision, or reproducibility, provides an expectation of the difference in test results between measurements made on the same material in two different laboratories. Analyses were performed on Gmb by mix type and gyration level. Since only one material (mix design) was tested in each compactor, the results do not formally meet the requirements of an ASTM C802 round-robin, but the results are still indicative of the precision of density results in Alabama. ASTM E 691 (18) uses two statistics to analyze the data for consistency: h and k. The h statistic is an indicator of how one laboratory’s average for a material compares with the average of other laboratories. The h statistic is based on a two-tailed Student’s t test. The average of the replicates for a given material and laboratory is referred to as a cell average. The cell average for a given laboratory is compared to the average of that same material when combining results from the remaining laboratories. A negative h statistic indicates a given laboratory’s cell value that is less than the combined average for all of the other laboratories, whereas a positive h statistic indicates a given laboratory’s cell average is greater than the combined average of the other laboratories. The k statistic is an indicator of how one laboratory’s variability for a given cell compares to the pooled variability of the remaining laboratories. The k statistic is based on the F-ratio from a one-way analysis of variance. Values of k larger than 1.0 indicate greater within-lab variability for a given laboratory than the average, or pooled, variability of the other laboratories. The h and k statistics were calculated using the ASTM E691 software (19). The Gmb precision statistics for the 19.0 mm NMAS mix produced at both 4.6 and 4.4 percent AC are shown in Table 10. Results from National Cooperative Highway Research Program Project 9-26, “Precision Statement for AASHTO T 312,” (20) are shown for comparison. The precision results from the two NCHRP 9-26 mixes and AMRL proficiency sample 9 and 10 are expected to be greater than the ALDOT AVK results since all of the ALDOT AVK samples were prepared, compacted and bulked by NCAT staff while the NCHRP 9-26 samples were bulked by the laboratory that compacted the samples. Only two models of SGCs, the Pine AFGC125X and the Troxler 4140 were used to test the NCHRP 9-26 mixes. The 19.0 mm NMAS NCHRP 9-26 mix compares well with the ALDOT AVK precision results. The precision results from the

Prowell, Brown, & Huner
26
Table 10. Precision Estimates for Gmb Description N Within Lab
(Repeatability) Sr
Between Lab (Reproducibility)
SR
Within Lab D2s
Between Lab D2s
ALDOT AVK at 4.6% AC
28 0.012 0.014 0.033 0.039
ALDOT AVK at 4.4% AC1
87 0.015 0.020 0.041 0.056
NCHRP 9-26 12.5 mm (20)
25 0.008 0.015 0.022 0.043
NCHRP 9-26 19.0 mm (20)
25 0.013 0.014 0.035 0.040
AMRL Proficiency Samples 9 and 10 12.5 mm (20)
239 0.013 0.025 0.037 0.070
1Results from one Troxler 4140 SGC removed as outliers as discussed previously AMRL proficiency samples would be expected to be more variable since each participating laboratory batched and mixed its own samples. This case would be closer to the expected precision during mix design while the remaining cases would more closely represent field samples. FHWA conducted a study to determine the target and tolerance for the DIA. Al-Khateeb et al (20) determined a target DIA of 1.16 degrees. The target was based on setting single articles of the original pooled-fund purchase SGCs, the Pine AFGC125X and Troxler 4140, to an external angle of gyration (using the manufacturer’s calibration equipment) of 1.25 degrees as specified in AASHTO T312, and measuring the DIA using the AVK. Using a 12.5 mm NMAS Superpave mix, the average DIA was determined to be 1.176 and 1.140 degrees, respectively for the Pine AFGC125X and Troxler 4140 SGCs. Thus, set at an external angle of 1.25 degrees, the original pooled fund SGCs produced an average DIA of 1.16 degrees. This target has been adopted by Maryland Department of Transportation (21). The tolerance was determined to allow a maximum variability of approximately 0.10 percent design asphalt content or 0.25 percent air voids (20). Using the relationship developed between DIA and Gmb and a target change in air voids of 0.25 percent, the tolerance for DIA was determined to be ±0.03 degrees (20). An examination of the data in Table 7 indicates that the average DIA for the Pine AFGC125X and Troxler 4140 was 1.140 degrees at 4.6 percent AC and 1.126 degrees at 4.4 percent AC. These averages are based on 12 compactors (5 Pine and 7 Troxler) at 4.6 percent AC and 19 compactors (10 Pine and 9 Troxler) at 4.4 percent AC. Further, the overall average DIA for all of the compactors tested was 1.46 degrees and 4.6 percent AC and 1.129 degrees at 4.4 percent AC. Therefore, the average DIA’s observed in the Alabama study were lower than those reported by Al-Khateeb et al (20). The database of DIAs from ALDOT AVK study was analyzed to determine which SGCs met the proposed DIA target of 1.16 ± 0.03 degrees (1.13 to 1.19 degrees). Twenty-five compactors evaluated using the 19.0 mm NMAS mix at 4.4 percent AC met the proposed criteria. The density results from these compactors were analyzed using the ASTM E691 software (19) to determine what improvement in precision, if any could be expected from the adoption of the 1.16

Prowell, Brown, & Huner
27
± 0.03 degrees DIA target. The results of the analysis are shown in Table 11. The precision statistics were calculated in terms of air voids using a constant Gmm of 2.538. The precision of all of the data for the 19.0 mm NMAS mix at 4.4 percent AC is shown for comparison. Table 11. Precision Estimates for Air Voids for 19.0 mm NMAS samples at 4.4 Percent AC Description N Within Lab
(Repeatability) Sr
Between Lab (Reproducibility)
SR
Within Lab D2s
Between Lab D2s
All data1 87 0.58 0.78 1.63 2.19 DIA = 1.13 to 1.19 26 0.76 0.76 2.14 2.14 DIA = 1.13 to 1.19, k outliers removed
26 0.48 0.74 1.34 2.08
DIA = 1.13 to 1.19, k and h outliers removed
25 0.49 0.63 1.37 1.78 1Results from one Troxler 4140 SGC removed as outliers as discussed previously. Currently, in Alabama (considering the entire 4.4 percent AC data set), the air void content of two properly compacted samples by two different laboratories could differ by approximately 2.19 percent and still not be statistically different. The average of three samples compacted by two different laboratories could differ by approximately 1.26 percent and not be statistically different. This difference could result in a difference of approximately 0.5 percent in design asphalt content. These estimates may be low as a single Gmm value was used for the calculations and all of the samples were tested for Gmb by a single laboratory (NCAT). Considering the compactors with DIAs of 1.13 to 1.19 degrees, the between laboratory precision improves by an insignificant amount (0.76 compared to 0.78). However, the within and between laboratory standard deviations are equal. Thus, the expected variability between samples in a given laboratory is the same as the expected variability between two different laboratories. This does indicate that a reasonable tolerance for DIA reduces the bias between labs. Removing the k (within lab variability) and h (between lab variability) outliers further improves the precision such that two samples, properly compacted by two different laboratories could have a difference of approximately 1.78 percent air voids or the average of three samples compacted by two different laboratories could differ by approximately 1.02 percent with out being statistically different (with 95 percent confidence). Therefore, the precision analysis indicates that though specifying a DIA of 1.16 ± 0.03 degrees will reduce bias between compactors, it does not significantly improve the precision of SGC compaction. Other potential sources of variability must be considered to improve precision. Table 12 shows the average air voids of the 4.4 percent AC samples compacted for density analysis without the DAVK for the SGCs having a DIA of 1.16 ± 0.03 degrees. Five models of compactors had DIAs in this range: Brovold, Interlaken, Pine AFG1A, Pine AFGC125X and Troxler 4140. The average air voids for the 25 SGCs in this range was 4.34 percent compared to 4.23 percent for the entire 4.4 percent air voids data set (85 compactors). The standard deviation of the average air voids (three samples) was 0.358 compared to 0.628 for the entire 4.4 percent air voids data set. The minimum and maximum average air voids, 3.67 and 5.46 percent, respectively, both came from Pine AFG1A compactors.

Prowell, Brown, & Huner
28
Comparisons with Table 7 indicate the improvement in average air voids by compactor type. For the compactors represented in Table 12, the range of average air voids in Table 7 ranged from 4.11 (Pine AFG1A) to 4.64 (Troxler 4140) percent, whereas the range in Table 11 is from 4.12 (Interlaken) to 4.43 (Pine AFG1A) percent. The lowest average air voids by compactor type was for a single Interlaken SGC (4.12 percent). The Interlaken compactors were previously shown to have a different relationship with Gmb, producing lower voids for a given DIA than the other compactors. Excluding the Interlaken SGC, the difference between the maximum and minimum average air voids by compactor type decreases from 0.53 (Troxler 4140 minus Pine AFG1A) to 0.16 (Brovold minus Pine AFG1A) percent when comparing the whole data set with the compactors having DIAs of 1.16 ± 0.03 degrees. The variability of the air void data for the compactors with DIAs of 1.16 ± 0.03 degrees exceeds the target of ± 0.25 percent proposed by FHWA (20).
Table 12. Compacted Sample Air Voids for SGCs having a DIA of 1.16 ± 0.03 Degrees DIAs of 1.16 ± 0.03 degrees All 4.4% AC Results
SGC Average, % N Standard Deviation Average, % N
Standard Deviation
Brovold 4.27 8 0.320 4.28 11 0.585 Interlaken 4.12 1 NA 4.35 11 0.671 Pine AFG1A 4.43 11 0.500 4.11 37 0.486 Pine AFGC125X 4.32 2 NA 4.12 10 0.392 Troxler 4140 4.32 3 0.475 4.64 9 0.554 Effect of Mold Wear During the course of the study, an additional potential source of variability was observed. NCAT used both a Pine AFGC125X and Troxler 4140 as a quality control check on the samples produced for the study. It was observed that NCAT’s Pine AFGC125X was producing lower than expected sample densities, with air void contents as high as 5.8 percent while the average air void content of the other compacters tested in the study was 3.4 percent (4.6 percent AC). The DIA of NCAT’s Pine AFGC125X was 1.15 degrees. An examination of NCAT’s molds for the Pine AFGC125X indicated visually observable wear in the compaction area of the mold. Due to the mold geometry, this area is not normally measured during calibration. NCAT only owned two molds for the Pine AFGC125X and had logged over 500 hours of testing with the compactor. NCAT’s Pine AFGC125X was shipped back to Pine for evaluation and service. A series of experiments were conducted by Pine Instrument Company (22) to explore the effects on sample density resulting from mold wear indicated that the lower sample densities were caused by “unusually high end plate movement permitted by the additional clearance around the end plates.” Pine’s service report (22) included comparisons with their “reference” Pine AFGC125X as shown in Table 13. Each density result shown in Table 13 is the average of six samples. The data indicates the dramatic effect mold wear can have on sample density ranging from differences of 0.027 to 0.028 Gmb units for a given compactor.

Prowell, Brown, & Huner
29
Table 13. Average Sample Gmb Comparisons Using NCAT and New Molds (22)
Description NCAT Pine AFGC125X SN 40 Pine Reference AFGC125X Original Molds 2.344 2.384 Molds Swapped 2.371 2.356 New Molds 2.3891 2.389 1NCAT Pine AFGC125X serviced. Pine concluded (22) that it was not so much the actual diameter of the mold or the end plates that mattered but the difference between the two diameters or end plate clearance (2c), as shown in Figure 18. Currently, AASHTO T312 specifies that the inside diameter of the mold range from 149.90 to 150.00 mm and that the diameter of the end plates range from 149.50 to 149.75 mm. This produces an end plate clearance range of 0.15 to 0.50 mm. Pines testing indicated that the critical wear area was not the top of the mold, which is typically measured with dial calipers to meet AASHTO’s specification, but the area of the mold wear compaction occurs. There are a number of measurement devices available to measure the inside diameter of molds. One device for measuring the inside diameters of molds, a three point digital bore gauge, used by Florida Department of Transportation, NCAT and others is shown in Figure 19.
Figure 18. End Plate Clearance

Prowell, Brown, & Huner
30
Figure 19. Three Point Digital Bore Gauge
Table 14 compares measurements made on NCAT’s original Pine model AFGC125X molds using conventional digital calipers and the three point digital bore gauge. Based on the bore gauge measurements, the end plate clearances for mold A and B were 1.25 and 1.19 mm, respectively. Conventional measurements with digital calipers would suggest that the molds meet AASHTO T312 specifications.
Table 14. Mold Wear Measurements for NCAT’s Original Pine AFGC125X Molds Mold Inside Diameter
Measured with Digital Calipers (top of mold),
mm
Inside Diameter Measured with
Digital Bore Gauge (resting
on bottom plate), mm
Bottom Plate Diameter, mm
End Plate Clearance (2c),
mm
A 149.93 150.798 149.55 1.248 B 149.91 150.716 149.53 1.186
Additional research was conducted by Dalton (23) using specially machined over size molds and/or undersize end plates. For the Pine model AGFC125X, each additional millimeter end plate clearance reduces Gmb by 0.027. Similarly, for the Pine model AFG1, each additional millimeter of end plate clearance reduces Gmb by 0.021 (23). By comparison, a 0.1 degree change in DIA resulted in a 0.010 change in Gmb. Based on these measurements, the current maximum end plate clearance allowed by AASHTO T312, 0.5 mm, appears to be justified. It is interesting to note that both ASTM D 3387, the standard for the Corps of Engineers Gyratory

Prowell, Brown, & Huner
31
Testing Machine and the European standard prEN 12697-31 for the French Gyratory Testing Machine both note the importance of end plate clearance (24). CONCLUSIONS • In Alabama at the time this study was conducted in 2001 and 2002, differences in air voids
for the average of 3 compacted samples of up to 0.8 percent could be expected between samples compacted in different brands of SGCs (Troxler 4141 to Pine AFG1A). The difference could be as high as 2.32 percent air voids between any two compactors. These estimates excluded the Rainhart SGCs for which the differences could be greater.
• There is a trend between external angle of gyration and sample density for a single compactor. The average external angle of gyration by compactor type ranged from 1.23 degrees for the Pine AFGC125X to 1.27 degrees for the Brovold SGCs. The external angle of gyration does not explain differences in sample density from one compactor to another. The lack of correlation between external angle of gyration and sample density was not unexpected since all of the SGCs were supposed to have external angles of 1.25 ± 0.02 degrees.
• Different brands/models of SGCs tend to have different internal angles of gyration, likely resulting from differing degrees of machine compliance, even though all of the external angles of gyration are similar. The average internal angle of gyration by SGC type ranged from 0.98 degrees for the Interlaken SGCs to 1.19 degrees for the Pine AFG1A SGCs. The Troxler 4141 SGCs had the next lowest average DIA of 1.02 degrees.
• There was a statistically significant trend between internal angle of gyration and sample density for all of the compactor types included in this study. Excluding the Interlaken and Rainhart compactors, the internal angle of gyration explains 37 percent of the variation in sample density. It is expected that this trend would be stronger if a specific experiment were design to vary DIA. There was a similar, but shifted trend for the Interlaken compactors. The shift is believed to be related to the compliance of the Interlaken SGC’s ram and the resulting difference between the internal angle of gyration when the DAVK is on the top and bottom of the mold. There were insufficient Rainhart compactor data evaluated to draw firm conclusions.
• Based on the averages by brand and model of SGC (excluding the Interlaken and Rainhart SGCs) a change in 0.1 degrees of internal angle will result in a change of 0.010 Gmb units or a difference in air voids of 0.4 percent.
• Setting a target DIA of 1.16 ± 0.03 degrees appears to remove the bias between compactors. The maximum difference in average air voids by compactor type decreased from 0.53 percent (Troxler 4140 minus Pine AFG1A) to 0.16 percent (Pine AFG1A minus Brovold) for 25 compactors with DIAs of 1.16 ± 0.03 degrees (excluding the results from a single Interlaken SGC). However, this tolerance does not greatly improve the precision of gyratory compaction. Internal angles of gyration of 1.16 ± 0.03 degrees were measured for only 37 of the 112 SGCs tested.
• Based on the density data collected during the study, the difference in the Gmb of two properly compacted samples by two different laboratories would not be expected to exceed 0.056 (approximately 2.19 percent air voids) 95 percent of the time. The average Gmb of three samples each compacted in two different laboratories would not be expected to exceed 0.032 (approximately 1.26 percent air voids). If a target DIA of 1.16 ± 0.03 degrees were adopted,

Prowell, Brown, & Huner
32
these differences would be expected to be 0.045 and 0.026 Gmb (1.78 and 1.02 percent air voids), respectively.
• Mold wear appears to be a significant factor affecting the density of samples compacted with an SGC. Internal diameter measurements in the area of compaction better indicate mold wear. Testing by Dalton (23) indicates that AASHTO T312’s allowance of a maximum end plate clearance of 0.5 mm is justified.
RECOMMENDATIONS
• Alabama Department of Transportation should adopt the use of the AVK to reduce the bias
between SGCs with a target DIA of 1.16 ± 0.03 degrees. This may have an affect on the appropriate Ndesign gyrations for a given traffic level. Gyratory owners should contact their respective manufacturers regarding adjustments to the angle of gyration. Some machines may need to be adjusted by the manufacturer.
• Alabama Department of Transportation should curtail their use of Rainhart compactors until the internal angle measurement problem is resolved for this SGC type.
• Additional research should be conducted to measure a DIA for Interlaken compactors comparable to other compactors.
• Additional research should be conducted to evaluate the effect of mold wear, establish proper measurement techniques and tolerances.
ACKNOWLEDGEMENTS
The authors thank the Alabama Department of Transportation for their support in sponsoring this study. The authors thank the contractor, consultant and agency personnel for their cooperation in completing the testing. The authors thank Graham Hurley, Robert James, Jason Moore, Chris NeSmith, Kevin Williams and Vicki Adams for their hard work in completing this testing. The authors also thank Shane Buchanan for his assistance in the early research performed with the DAVK prior to the initiation of this project.
REFERENCES 1. Cominsky, R., R. B. Leahy, and E. T. Harrigan, “Level One Mixture Design: Materials
Selection, Compaction and Conditioning.” (SHRP-A-408). Strategic Highway Research Program, National Research Council, Washington, DC, 1994.
2. American Association of State Highway and Transportation Officials, “Standard Specifications for Transportation Materials and Methods of Sampling and Testing,” ed. 21, Washington, DC, 2001.
3. American Association of State Highway and Transportation Officials, AASHTO Provisional Standards. Washington, DC, 2001.
4. Yildirim, Y., M. Solaimanian, R. B. McGennis, and T. W. Kennedy. “Comparative Analysis of Volumetric Properties for Superpave Gyratory Compactors.” In Transportation Research Record 1712, TRB, National Research Council, Washington, DC. 2000.
5. McGennis, R. B., R. M. Anderson, D. Perdomo and P. Turner. “Issues Pertaining to Use of Superpave Gyratory Compactor.” In Transportation Research Record 1543, TRB, National Research Council, Washington, DC. 1996. Pp. 139-144.

Prowell, Brown, & Huner
33
6. McGennis, R. B., D. Perdomo, T. W. Kennedy, and M. Solaimanian. “Ruggedness Evaluation of AASHTO TP4: The Superpave Gyratory Compactor, Journal of the Association of Asphalt Paving Technologists, Vol. 66, 1997, pp.277-311
7. “National Cooperative Research Program Project 9-26” (n.d.), Retrieved January 7, 2003 from http://www4.trb.org/trb/crp.nsf/All+Projects/NCHRP+9-26
8. “Compilation of Statistics – Hot Mix Asphalt Gyratory” (n.d.), Retrieved January 7, 2003 from http://patapsco.nist.gov/amrl/psp/sect4c.asp
9. American Association of State Highway and Transportation Officials, AASHTO Provisional Standards. Washington, DC, 2002.
10. “Application Brief Investigating Measurable Gmb Differences Among Gyratory Compacted Specimens A Round Robin Study.” Troxler Electronic Laboratories, Research Triangle Park, NC, 2001.
11. Buchanan, M. S., and E. R. Brown, “Effect of Superpave Gyratory Compactor Type on Compacted Hot Mix Asphalt (HMA) Density.” In Transportation Research Record 1761, TRB, National Research Council, Washington, DC. 2001. Pp. 50-60.
12. Hinrichsen, J., “Comparison of Four Brands of Superpave Gyratory Compactors.” In Transportation Research Record 1767, TRB, National Research Council, Washington, DC. 2001. Pp. 167-172.
13. “Operating Instructions for the Dynamic Angle Validation Kit (DAV) for Superpave Gyratory Compactors.” Test Quip Corporation, New Brighton, MN. 2001.
14. Dalton, F. “Observations of SGC End Plate Deflection Using the FHWA Angle Validation Kit.” Report 2000-02 Revision C. Pine Instrument Company, PA. 2000.
15. Dalton, F. “Investigation of Pine Superpave Gyratory Compactors Using the FHWA Angle Validation Kit” Report 2000-03 Revision A. Pine Instrument Company, PA. 2000.
16. Harman, T. “Dynamic Internal Angle (DIA) Measurement in the Troxler Superpave Gyratory Compactor – Linearity Study.” Turner-Fairbank Highway Research Center, Federal Highway Administration. McLean, VA. 2001.
17. Dalton, F. “Application of Internal Angle Verification to Obtain Equivalent Results from Various SGC Models” Report 2001-01 Revision A. Pine Instrument Company, PA. 2001.
18. American Society for Testing and Materials. ASTM Standards on Precision and Bias for Various Applications, ed 4. Philadelphia, 1992.
19. American Society for Testing and Materials. Interlaboratory Data Analysis Software: E 691 User’s Guide. Philadelphia, 1990.
20. Al-Khaateeb, G., C. Paugh, K. Stuart, T. Harman, and J. D’Angelo. “Target and Tolerance for the Angle of Gyration Used in the Superpave Gyratory Compactor (SGC).” In Transportation Research Record 1789, TRB, National Research Council, Washington, DC. 2002. Pp. 208-215.
21. Personal communication with Larry Michaels, June 5, 2003. 22. Pine AFGC125X Gyratory Compactor Service Estimate (SN 040 National Center for
Asphalt Technology). Pine Instrument Company. May 7, 2002. Author. 23. Dalton, F. “Influence of Mold End Plate Clearance on Volumetric Properties of Gyratory
Compacted Specimens” Report 2002-01 Revision A. Pine Instrument Company, PA 2002. 24. Personal communication with Frank Dalton.

Prowell, Brown, & Huner
34
Appendix A
Sample Density Results

Prowell, Brown, & Huner
35
ALDOT Div. Brand Model SN AC%
Gmb 1
Gmb 2
Gmb 3 Gmm
VTM 1
VTM 2
VTM 3
Avg. Gmb
Avg. VTM
Avg. DIA
1 Troxler 4140 385 4.6 2.416 2.426 2.454 2.530 4.51 4.11 3.00 2.432 3.87 1.1361 Troxler 4140 802 4.6 2.445 2.420 2.433 2.530 3.36 4.35 3.83 2.433 3.85 1.1221 Pine AFG1A 1033 4.6 2.438 2.456 2.455 2.530 3.64 2.92 2.96 2.450 3.18 1.2301 Pine AFG1A 1071 4.4 2.420 2.433 2.445 2.538 4.66 4.13 3.68 2.432 4.16 1.1961 Pine AFG1A 1244 4.6 2.434 2.458 2.451 2.530 3.79 2.85 3.12 2.448 3.25 1.1701 Pine AFG1A 1434 4.6 2.438 2.460 2.451 2.530 3.64 2.77 3.12 2.450 3.18 1.2201 Pine AFG1A 1247 4.6 2.430 2.442 2.433 2.530 3.95 3.48 3.83 2.435 3.75 1.2001 Pine AFG1A 1493 4.6 2.436 2.443 2.433 2.530 3.72 3.44 3.83 2.437 3.66 1.1301 Pine AFGC125X 123 4.6 2.443 2.446 2.447 2.530 3.44 3.32 3.28 2.445 3.35 1.1601 Pine AFGC125X 419 4.6 2.456 2.440 2.444 2.530 2.92 3.56 3.40 2.447 3.29 1.2201 Pine AFGC125X 510 4.6 2.442 2.439 2.435 2.530 3.48 3.60 3.75 2.439 3.61 1.1101 Pine AFGC125X 63 4.6 2.431 2.440 2.440 2.530 3.91 3.56 3.56 2.437 3.68 1.1701 Interlaken GYR-001 CCJ 4.6 2.458 2.458 2.449 2.530 2.85 2.85 3.20 2.455 2.96 1.1311 Brovold HM-293 069915 4.6 2.444 2.442 2.444 2.530 3.40 3.48 3.40 2.443 3.43 1.1752 Troxler 4141 118 4.4 2.425 2.396 2.440 2.538 4.45 5.59 3.84 2.421 4.63 1.0072 Pine AFG1A 1110 4.4 2.419 2.438 2.436 2.538 4.71 3.93 4.01 2.431 4.22 1.2162 Pine AFG1A 1111 4.4 2.413 2.444 2.422 2.538 4.93 3.72 4.56 2.426 4.40 1.2272 Pine AFG1A 1239 4.4 2.433 2.427 2.426 2.538 4.12 4.39 4.42 2.429 4.31 1.1982 Pine AFG1A 1240 4.4 2.444 2.436 2.437 2.538 3.71 4.03 3.98 2.439 3.91 1.1172 Pine AFG1A 1300 4.4 2.415 2.416 2.421 2.538 4.85 4.83 4.61 2.417 4.76 1.1432 Pine AFG1A 1355 4.4 2.449 2.445 2.441 2.538 3.50 3.68 3.83 2.445 3.67 1.2072 Pine AFGC125X 423 4.4 2.439 2.447 2.432 2.538 3.89 3.60 4.18 2.439 3.89 1.2082 Interlaken GYR-001 CBU 4.4 2.447 2.472 2.423 2.538 3.59 2.59 4.53 2.447 3.57 1.0472 Interlaken GYR-001 CCQ 4.6 2.464 2.468 2.454 2.530 2.61 2.45 3.00 2.462 2.69 1.0572 Brovold HM 293 69912 4.4 2.441 2.428 2.456 2.538 3.83 4.33 3.24 2.442 3.80 1.1833 Pine AFG1A 1236 4.4 2.453 2.459 2.447 2.538 3.36 3.10 3.60 2.453 3.35 1.2153 Pine AFG1A 1249 4.4 2.423 2.430 2.409 2.538 4.53 4.26 5.09 2.421 4.63 1.1643 Pine AFG1A 1253 4.4 2.424 2.417 2.426 2.538 4.51 4.79 4.39 2.422 4.56 1.2323 Pine AFG1A 1279 4.4 2.441 2.463 2.443 2.538 3.84 2.95 3.74 2.449 3.51 1.2033 Pine AFG1A 1354 4.4 2.437 2.447 2.416 2.538 3.98 3.59 4.81 2.433 4.12 1.2413 Pine AFG1A 1456 4.4 2.429 2.419 2.434 2.538 4.28 4.69 4.08 2.428 4.35 1.2263 Pine AFG1A 1457 4.4 2.434 2.449 2.449 2.538 4.10 3.49 3.52 2.444 3.70 1.2113 Pine AFGC125X 18 4.4 2.435 2.446 2.436 2.538 4.08 3.63 4.00 2.439 3.90 1.2173 Pine AFGC125X 119 4.6 2.428 2.450 2.470 2.530 4.03 3.16 2.37 2.449 3.19 1.140

Prowell, Brown, & Huner
36
ALDOT Div. Brand Model SN AC%
Gmb 1
Gmb 2
Gmb 3 Gmm
VTM 1
VTM 2
VTM 3
Avg. Gmb
Avg. VTM
Avg. DIA
3 Pine AFGC125X 126 4.4 2.423 2.412 2.423 2.538 4.53 4.95 4.54 2.419 4.67 1.1363 Pine AFGC125X 278 4.4 2.424 2.427 2.420 2.538 4.51 4.39 4.64 2.423 4.51 1.2073 Pine AFGC125X 313 4.4 2.416 2.431 2.422 2.538 4.82 4.23 4.57 2.423 4.54 1.1983 Pine AFGC125X 444 4.4 2.423 2.435 2.415 2.538 4.52 4.07 4.86 2.424 4.48 1.2503 Interlaken GYR-001 CAO 4.6 2.408 2.420 2.446 2.530 4.82 4.35 3.32 2.425 4.16 0.9503 Interlaken GYR-001 CCE 4.6 2.443 2.438 2.451 2.530 3.44 3.64 3.12 2.444 3.40 1.0233 Brovold HM 293 59910 4.4 2.414 2.428 2.423 2.538 4.88 4.34 4.51 2.422 4.58 1.1814 Troxler 4140 101 4.4 2.378 2.496 2.370 2.538 6.32 1.65 6.60 2.415 4.86 1.1464 Troxler 4140 406 4.4 2.386 2.394 2.428 2.538 5.99 5.69 4.33 2.403 5.34 1.0344 Pine AFG1A 1122 4.4 2.398 2.420 2.427 2.538 5.50 4.66 4.39 2.415 4.85 1.2204 Pine AFG1A 1193 4.4 2.444 2.440 2.452 2.538 3.69 3.88 3.39 2.445 3.65 1.2334 Pine AFG1A 1242 4.4 2.427 2.444 2.437 2.538 4.38 3.69 3.96 2.436 4.01 1.2164 Pine AFG1A 1246 4.4 2.419 2.391 2.439 2.538 4.68 5.80 3.91 2.416 4.80 1.1474 Pine AFG1A 1312 4.4 2.385 2.398 2.415 2.538 6.02 5.51 4.86 2.399 5.46 1.1294 Pine AFG1A 1409 4.4 2.444 2.446 2.454 2.538 3.70 3.64 3.32 2.448 3.55 1.2074 Brovold AFGB1A 5054 4.4 2.448 2.463 2.456 2.538 3.53 2.97 3.22 2.456 3.24 1.2674 Pine AFGC125X 40 4.4 2.441 2.423 2.456 2.538 3.84 4.52 3.23 2.440 3.86 1.2144 Pine AFGC125X 122 4.4 2.428 2.447 2.437 2.538 4.35 3.59 3.98 2.437 3.97 1.1664 Pine AFGC125X 236 4.4 2.433 2.446 2.455 2.538 4.15 3.61 3.28 2.445 3.68 1.2034 Pine AFGC125X 425 4.4 2.427 2.424 2.485 2.538 4.35 4.51 2.07 2.446 3.64 1.2034 Brovold BGC-1 39804 4.4 2.421 2.419 2.429 2.538 4.62 4.68 4.30 2.423 4.53 1.1314 Interlaken GYR-001 CCS 4.4 2.397 2.423 2.384 2.538 5.54 4.55 6.06 2.401 5.38 0.9004 Brovold HM 293 59916 4.4 2.439 2.439 2.439 2.538 3.90 3.91 3.89 2.439 3.90 1.1705 Troxler 4140 306 4.6 2.442 2.429 2.429 2.530 3.48 3.99 3.99 2.433 3.82 1.1335 Troxler 4140 418 4.6 2.433 2.440 2.440 2.530 3.83 3.56 3.56 2.438 3.65 1.1155 Troxler 4141 188 4.4 2.399 2.391 2.402 2.538 5.49 5.81 5.37 2.397 5.56 1.0725 Pine AFG1A 1241 4.6 2.460 2.448 2.449 2.530 2.77 3.24 3.20 2.452 3.07 1.2005 Pine AFG1A 1243 4.4 2.421 2.429 2.407 2.538 4.62 4.30 5.16 2.419 4.70 1.2305 Pine AFG1A 1430 4.6 2.466 2.441 2.435 2.530 2.53 3.52 3.75 2.447 3.27 1.2205 Interlaken GYR-001 CCT 4.4 2.442 2.435 2.423 2.538 3.77 4.05 4.53 2.434 4.12 1.1315 Brovold HM 293 69904 4.4 2.433 2.419 2.420 2.538 4.15 4.68 4.65 2.424 4.49 1.1696 Troxler 4140 270 4.6 2.442 2.422 2.417 2.530 3.48 4.27 4.47 2.427 4.07 1.1006 Troxler 4140 420 4.4 2.454 2.430 2.422 2.538 3.33 4.24 4.55 2.435 4.04 1.0386 Troxler 4140 610 4.4 2.438 2.428 2.446 2.538 3.93 4.33 3.62 2.438 3.96 1.129

Prowell, Brown, & Huner
37
ALDOT Div. Brand Model SN AC%
Gmb 1
Gmb 2
Gmb 3 Gmm
VTM 1
VTM 2
VTM 3
Avg. Gmb
Avg. VTM
Avg. DIA
6 Troxler 4140 658 4.4 2.409 2.435 2.422 2.538 5.07 4.04 4.58 2.422 4.57 1.0446 Troxler 4141 109 4.4 2.420 2.432 2.439 2.538 4.66 4.18 3.91 2.430 4.25 1.0996 Troxler 4141 158 4.4 2.393 2.391 2.445 2.538 5.71 5.80 3.68 2.409 5.06 0.9096 Pine AFG1A 1237 4.4 2.443 2.429 2.457 2.538 3.74 4.29 3.21 2.443 3.74 1.2096 Pine AFG1A 1254 4.4 2.426 2.470 2.437 2.538 4.40 2.66 3.96 2.445 3.67 1.1436 Pine AFG1A 1284 4.6 2.457 2.453 2.467 2.530 2.89 3.04 2.49 2.459 2.81 1.1806 Pine AFG1A 1375 4.4 2.463 2.444 2.444 2.538 2.96 3.70 3.69 2.450 3.45 1.2136 Pine AFG1A 1468 4.4 2.433 2.430 2.445 2.538 4.13 4.25 3.66 2.436 4.01 1.2056 Pine AFG1A 1470 4.6 2.454 2.447 2.443 2.530 3.00 3.28 3.44 2.448 3.24 1.2306 Pine AFG1A 1581 4.4 2.451 2.457 2.438 2.538 3.43 3.20 3.92 2.449 3.52 1.2086 Interlaken GYR-001 CCU 4.4 2.396 2.396 2.405 2.538 5.59 5.61 5.24 2.399 5.48 0.6296 Interlaken GYR-001 CCW 4.4 2.439 2.428 2.452 2.538 3.90 4.33 3.39 2.440 3.88 0.9267 Rainhart 144 106 4.4 2.466 2.465 2.441 2.538 2.84 2.87 3.81 2.457 3.17 1.3427 Rainhart 144 107 4.4 2.490 2.499 2.496 2.538 1.88 1.52 1.65 2.495 1.68 0.7137 Troxler 4140 3 4.4 2.412 2.422 2.422 2.538 4.95 4.56 4.56 2.419 4.69 0.9887 Troxler 4140 99 4.4 2.430 2.428 2.441 2.538 4.25 4.35 3.83 2.433 4.14 1.1917 Troxler 4140 244 4.6 2.441 2.438 2.389 2.530 3.52 3.64 5.57 2.423 4.24 1.1117 Troxler 4140 705 4.4 2.412 2.426 2.425 2.538 4.96 4.40 4.45 2.421 4.60 1.0297 Troxler 4141 164 4.4 2.414 2.418 2.415 2.538 4.87 4.71 4.86 2.416 4.81 0.9917 Pine AFG1A 1238 4.4 2.441 2.431 2.436 2.538 3.81 4.22 4.02 2.436 4.02 1.1647 Pine AFG1A 1250 4.4 2.451 2.437 2.427 2.538 3.41 3.99 4.39 2.438 3.93 1.1817 Pine AFG1A 1453 4.4 2.449 2.432 2.443 2.538 3.50 4.17 3.74 2.441 3.80 1.2337 Pine AFG1A 1518 4.4 2.452 2.445 2.446 2.538 3.39 3.67 3.61 2.448 3.56 1.2227 Interlaken GYR-001 CBM 4.4 2.441 2.430 2.465 2.538 3.84 4.24 2.87 2.445 3.65 1.0007 Interlaken GYR-001 CCA 4.4 2.441 2.441 2.428 2.538 3.84 3.84 4.34 2.436 4.01 1.0927 Brovold HM 293 69909 4.4 2.409 2.447 2.438 2.538 5.07 3.60 3.94 2.431 4.20 1.1898 Troxler 4140 307 4.6 2.461 2.445 2.431 2.530 2.73 3.36 3.91 2.446 3.33 1.1218 Troxler 4140 427 4.4 2.403 2.388 2.400 2.538 5.30 5.92 5.45 2.397 5.56 0.8308 Troxler 4140 524 4.4 2.253 2.414 2.267 2.538 11.22 4.89 10.67 2.311 8.93 1.0938 Pine AFG1A 1044 4.4 2.430 2.436 2.423 2.538 4.26 4.00 4.54 2.430 4.27 1.1848 Pine AFG1A 1245 4.4 2.436 2.434 2.427 2.538 4.03 4.12 4.37 2.432 4.17 1.1588 Pine AFG1A 1248 4.4 2.426 2.427 2.439 2.538 4.43 4.38 3.90 2.431 4.23 1.1358 Pine AFG1A 1469 4.4 2.414 2.423 2.425 2.538 4.88 4.51 4.44 2.421 4.61 1.2138 Brovold HM 293 69910 4.4 2.433 2.433 2.538 4.12 4.15 2.433 4.13 1.107

Prowell, Brown, & Huner
38
ALDOT Div. Brand Model SN AC%
Gmb 1
Gmb 2
Gmb 3 Gmm
VTM 1
VTM 2
VTM 3
Avg. Gmb
Avg. VTM
Avg. DIA
9 Pine AFG1A 1051 4.4 2.410 2.412 2.434 2.538 5.03 4.95 4.11 2.419 4.69 1.1729 Pine AFG1A 1251 4.6 2.444 2.456 2.451 2.530 3.40 2.92 3.12 2.450 3.15 1.1409 Pine AFG1A 1252 4.4 2.441 2.441 2.430 2.538 3.84 3.81 4.27 2.437 3.97 1.1769 Pine AFG1A 1369 4.4 2.442 2.445 2.445 2.538 3.79 3.65 3.68 2.444 3.71 1.2109 Interlaken GYR-001 CAQ 4.4 2.417 2.427 2.430 2.538 4.78 4.38 4.26 2.425 4.47 0.7709 Interlaken GYR-001 CCV 4.4 2.441 2.437 2.445 2.538 3.81 3.97 3.65 2.441 3.81 0.9959 Interlaken GYR-001 CDU 4.4 2.397 2.432 2.538 5.56 4.19 2.414 4.88 0.9659 Interlaken GYR-001 CDW 4.4 2.443 2.430 2.388 2.538 3.74 4.24 5.91 2.421 4.63 1.0359 Brovold HM 293 59904 4.4 2.461 2.426 2.417 2.538 3.03 4.41 4.78 2.435 4.08 1.1299 Brovold HM 293 69913 4.4 2.430 2.398 2.437 2.538 4.27 5.51 3.99 2.421 4.59 1.1519 Brovold HM-293 049814G 4.4 2.416 2.357 2.419 2.538 4.81 7.14 4.68 2.397 5.54 1.020

Prowell, Brown, & Huner
39
Appendix B Dynamic Internal Angle Measurements by Compactor
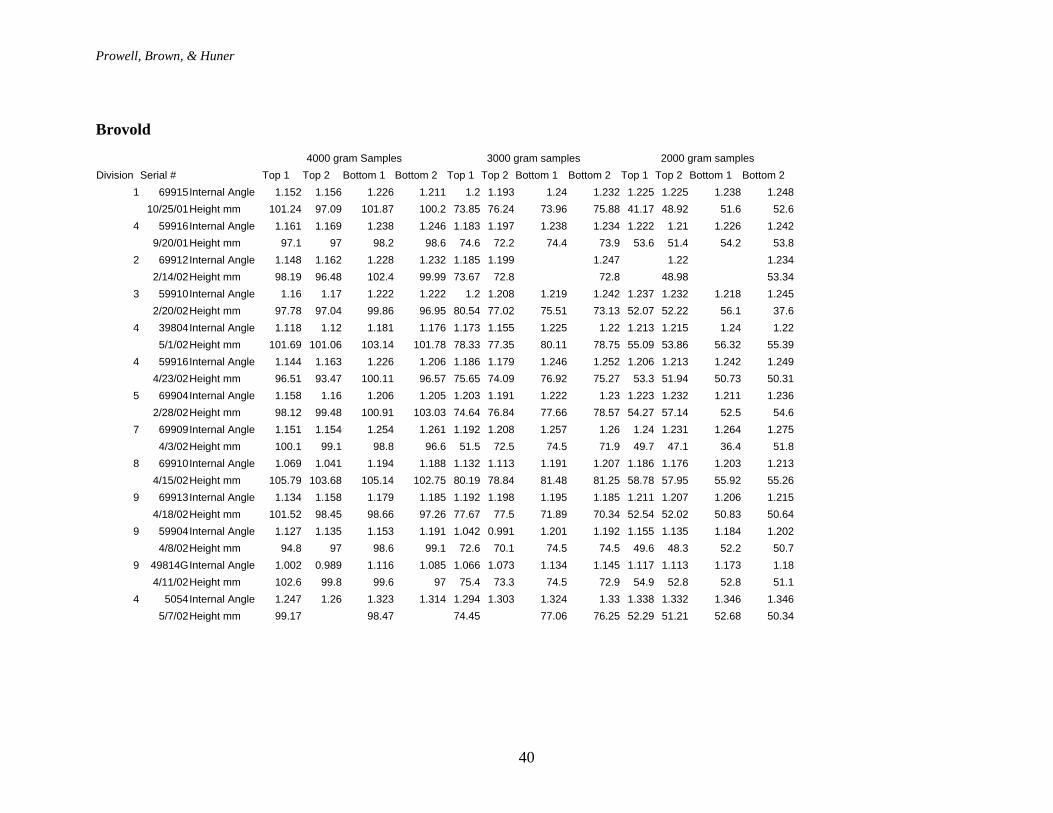
Prowell, Brown, & Huner
40
Brovold
4000 gram Samples 3000 gram samples 2000 gram samples Division Serial # Top 1 Top 2 Bottom 1 Bottom 2 Top 1 Top 2 Bottom 1 Bottom 2 Top 1 Top 2 Bottom 1 Bottom 2
1 69915 Internal Angle 1.152 1.156 1.226 1.211 1.2 1.193 1.24 1.232 1.225 1.225 1.238 1.248 10/25/01 Height mm 101.24 97.09 101.87 100.2 73.85 76.24 73.96 75.88 41.17 48.92 51.6 52.6
4 59916 Internal Angle 1.161 1.169 1.238 1.246 1.183 1.197 1.238 1.234 1.222 1.21 1.226 1.242 9/20/01 Height mm 97.1 97 98.2 98.6 74.6 72.2 74.4 73.9 53.6 51.4 54.2 53.8
2 69912 Internal Angle 1.148 1.162 1.228 1.232 1.185 1.199 1.247 1.22 1.234 2/14/02 Height mm 98.19 96.48 102.4 99.99 73.67 72.8 72.8 48.98 53.34
3 59910 Internal Angle 1.16 1.17 1.222 1.222 1.2 1.208 1.219 1.242 1.237 1.232 1.218 1.245 2/20/02 Height mm 97.78 97.04 99.86 96.95 80.54 77.02 75.51 73.13 52.07 52.22 56.1 37.6
4 39804 Internal Angle 1.118 1.12 1.181 1.176 1.173 1.155 1.225 1.22 1.213 1.215 1.24 1.22 5/1/02 Height mm 101.69 101.06 103.14 101.78 78.33 77.35 80.11 78.75 55.09 53.86 56.32 55.39
4 59916 Internal Angle 1.144 1.163 1.226 1.206 1.186 1.179 1.246 1.252 1.206 1.213 1.242 1.249 4/23/02 Height mm 96.51 93.47 100.11 96.57 75.65 74.09 76.92 75.27 53.3 51.94 50.73 50.31
5 69904 Internal Angle 1.158 1.16 1.206 1.205 1.203 1.191 1.222 1.23 1.223 1.232 1.211 1.236 2/28/02 Height mm 98.12 99.48 100.91 103.03 74.64 76.84 77.66 78.57 54.27 57.14 52.5 54.6
7 69909 Internal Angle 1.151 1.154 1.254 1.261 1.192 1.208 1.257 1.26 1.24 1.231 1.264 1.275 4/3/02 Height mm 100.1 99.1 98.8 96.6 51.5 72.5 74.5 71.9 49.7 47.1 36.4 51.8
8 69910 Internal Angle 1.069 1.041 1.194 1.188 1.132 1.113 1.191 1.207 1.186 1.176 1.203 1.213 4/15/02 Height mm 105.79 103.68 105.14 102.75 80.19 78.84 81.48 81.25 58.78 57.95 55.92 55.26
9 69913 Internal Angle 1.134 1.158 1.179 1.185 1.192 1.198 1.195 1.185 1.211 1.207 1.206 1.215 4/18/02 Height mm 101.52 98.45 98.66 97.26 77.67 77.5 71.89 70.34 52.54 52.02 50.83 50.64
9 59904 Internal Angle 1.127 1.135 1.153 1.191 1.042 0.991 1.201 1.192 1.155 1.135 1.184 1.202 4/8/02 Height mm 94.8 97 98.6 99.1 72.6 70.1 74.5 74.5 49.6 48.3 52.2 50.7
9 49814G Internal Angle 1.002 0.989 1.116 1.085 1.066 1.073 1.134 1.145 1.117 1.113 1.173 1.18 4/11/02 Height mm 102.6 99.8 99.6 97 75.4 73.3 74.5 72.9 54.9 52.8 52.8 51.1
4 5054 Internal Angle 1.247 1.26 1.323 1.314 1.294 1.303 1.324 1.33 1.338 1.332 1.346 1.346 5/7/02 Height mm 99.17 98.47 74.45 77.06 76.25 52.29 51.21 52.68 50.34

Prowell, Brown, & Huner
41
Brovold
4000 3000 2000 Extrapolated Top 4000 3000 2000 Extrapolated Bottom Avg. DIA Division Serial # Top Avg Top Avg Top Avg DIA @ 115 Fit Bot. Avg Bot. Avg Bot. Avg DIA @ 115 Fit
1 69915 1.154 1.1965 1.225 1.137 0.969 1.2185 1.236 1.243 1.213 0.959 1.175 10/25/01 99.165 75.045 45.045 101.035 74.92 52.1
4 59916 1.165 1.19 1.216 1.144 0.998 1.242 1.236 1.234 1.245 0.949 1.194 9/20/01 97.05 73.4 52.5 98.4 74.15 54
2 69912 1.155 1.192 1.22 1.133 0.993 1.23 1.247 1.234 1.232 0.108 1.183 2/14/02 97.335 73.235 48.98 101.195 72.8 53.34
3 59910 1.165 1.204 1.2345 1.142 0.971 1.222 1.2305 1.2315 1.220 0.798 1.181 2/20/02 97.41 78.78 52.145 98.405 74.32 46.85
4 39804 1.119 1.164 1.214 1.091 0.999 1.1785 1.2225 1.23 1.171 0.852 1.131 5/1/02 101.375 77.84 54.475 102.46 79.43 55.855
4 59916 1.1535 1.1825 1.2095 1.128 0.998 1.216 1.249 1.2455 1.213 0.624 1.170 4/23/02 94.99 74.87 52.62 98.34 76.095 50.52
5 69904 1.159 1.197 1.2275 1.134 0.999 1.2055 1.226 1.2235 1.205 0.639 1.169 2/28/02 98.8 75.74 55.705 101.97 78.115 53.55
7 69909 1.1525 1.2 1.2355 1.126 0.968 1.2575 1.2585 1.2695 1.252 0.849 1.189 4/3/02 99.6 62 48.4 97.7 73.2 44.1
8 69910 1.055 1.1225 1.181 1.027 1.000 1.191 1.199 1.208 1.187 1.000 1.107 4/15/02 104.735 79.515 58.365 103.945 81.365 55.59
9 69913 1.146 1.195 1.209 1.133 0.885 1.182 1.19 1.2105 1.170 0.897 1.151 4/18/02 99.985 77.585 52.28 97.96 71.115 50.735
9 59904 1.131 1.0165 1.145 1.088 0.005 1.172 1.1965 1.193 1.169 0.643 1.129 4/8/02 95.9 71.35 48.95 98.85 74.5 51.45
9 49814G 0.9955 1.0695 1.115 0.962 0.996 1.1005 1.1395 1.1765 1.073 1.000 1.018 4/11/02 101.2 74.35 53.85 98.3 73.7 51.95
4 5054 1.2535 1.2985 1.335 1.227 0.999 1.3185 1.327 1.346 1.307 0.969 1.267 5/7/02 99.17 74.45 51.75 98.47 76.655 51.51

Prowell, Brown, & Huner
42
Interlaken
Division 4000 gram Samples 3000 gram samples 2000 gram samples
Serial # Top 1 Top 2 Bottom 1 Bottom 2 Top 1 Top 2 Bottom 1 Bottom 2 Top 1 Top 2 Bottom 1 Bottom 2 1CCJ Internal Angle 1.106 1.079 1.281 1.29 1.199 1.217 1.344 1.314 1.318 1.313 1.376
9/24/01Height mm 97.9 97.5 97.2 96.9 73.9 73.8 74.6 73.7 51 50 51.52CCQ Internal Angle 1.002 1.017 1.233 1.266 1.166 1.179 1.332 1.306 1.308 1.285 1.39
9/25/01Height mm 97.6 99.8 97.7 99 74.7 74.5 72 74.9 48.4 53.5 53.63CCE Internal Angle 0.984 0.968 1.17 1.17 1.129 1.134 1.243 1.242 1.205 1.212 1.295
10/10/01Height mm 100.1 98.5 100.4 98.1 75.3 73.6 75.1 73.7 49.7 51.3 49.72CBU Internal Angle 1.052 0.928 1.273 1.289 1.186 1.213 1.363 1.383 1.334 1.318 1.442
2/13/02Height mm 98.7 100.2 94.1 92.9 75.6 74 77.3 74.2 52.4 50.4 524CCS Internal Angle 0.705 0.722 0.785 0.901 1.047 1.045 1.146 1.157 1.3 1.285 1.355
3/8/02Height mm 128.3 125.5 125.5 119 100.3 99.7 102.4 99 76.3 77.4 78.6 5CCT Internal Angle 1.062 1.087 1.276 1.296 1.179 1.179 1.335 1.331 1.262 1.277 1.391
3/1/02Height mm 98.2 98.6 100.2 100.5 74.4 75.4 75.1 75.9 50.6 51.8 51.46CCU Internal Angle 0.708 0.741 0.788 0.813 0.937 0.959 1.06 1.076 1.198 1.181 1.274
3/12/02Height mm 102.4 98 101.4 101 75.1 74.4 77.3 76.1 52.4 52.2 50.76CCW Internal Angle 1.273 1.273 0.791 0.972 0.897 1.337 1.324 1.259 1.228 1.358
3/25/02Height mm 99.9 98.7 97.7 73 73.3 74.5 74.1 49.5 51.3 50.37CBM Internal Angle 0.935 0.958 1.223 1.193 1.065 1.089 1.289 1.274 1.256 1.368
4/1/02Height mm 100.5 100.2 98.7 97.6 73.9 72.6 75.4 74.4 50.1 51.97CCA Internal Angle 1.042 1.008 1.297 1.298 1.171 1.163 1.321 1.344 1.252 1.246 1.409
4/4/02Height mm 98.8 94.3 96.9 94.7 75.2 70.3 74 72.2 53.2 51.9 52.79CCV Internal Angle 0.933 0.953 1.272 1.244 1.071 1.098 1.275 1.288 1.295 1.319
4/25/02Height mm 98.8 91.2 98.9 96.4 75.2 70.8 77.2 53.4 50.19CDU Internal Angle 0.961 0.71 1.286 1.292 1.143 1.126 1.332 1.28 1.263 1.238 1.399
4/8/02Height mm 97.6 97.7 96.4 96.3 75.7 73.2 73.9 72.3 54.1 52.6 52.49CAQ Internal Angle 0.6 0.601 1.214 1.216 0.858 0.828 1.237 1.223 1.164 1.163
4/9/02Height mm 102.1 100.1 96.7 92.9 74.8 71 74 73.1 52.1 51.6 9CDW Internal Angle 0.984 0.968 1.233 1.206 1.041 1.016 1.311 1.178 1.18 1.367
4/11/02Height mm 99 97.1 102.2 100.6 76 75.6 76.7 51.3 50.9 53.5

Prowell, Brown, & Huner
43
Interlaken
Division 4000 3000 2000Extrapolated Top 4000 3000 2000Extrapolated Bottom Avg. DIA Serial # Top Avg Top Avg Top Avg DIA @ 115 Fit Bot. Avg Bot. Avg Bot. Avg DIA @ 115 Fit
1 CCJ 1.0925 1.208 1.3155 1.011687 0.999787 1.2855 1.329 1.3755 1.249619 0.99958 1.131 9/24/01 97.7 73.85 50.5 97.05 74.15 51.35
2 CCQ 1.0095 1.1725 1.2965 0.917482 0.994702 1.2495 1.319 1.391 1.196334 0.996734 1.057 9/25/01 98.7 74.6 50.95 98.35 73.45 52.3
3 CCE 0.976 1.1315 1.2085 0.913192 0.967286 1.17 1.2425 1.295 1.133188 0.992375 1.023 10/10/01 99.3 74.45 50.5 99.25 74.4 49.95
2 CBU 0.99 1.1995 1.326 0.893107 0.984046 1.281 1.373 1.4475 1.200369 0.9829 1.047 2/13/02 99.45 74.8 51.4 93.5 75.75 53.05
4 CCS 0.7135 1.046 1.2925 0.857976 0.998211 0.843 1.1515 1.355 0.946771 0.984425 0.902 3/8/02 126.9 100 76.85 122.25 100.7 78.6
5 CCT 1.0745 1.179 1.2695 1.008408 0.998076 1.286 1.333 1.387 1.254246 0.997438 1.131 3/1/02 98.4 74.9 51.2 100.35 75.5 51.55
6 CCU 0.7245 0.948 1.1895 0.573777 0.996583 0.8005 1.068 1.2735 0.684272 0.991537 0.629 3/12/02 100.2 74.75 52.3 101.2 76.7 50.75
6 CCW 1.273 0.9345 1.2435 1.187332 0.014064 0.791 1.3305 1.3745 0.665109 0.79896 0.926 3/25/02 99.3 73.15 50.4 97.7 74.3 50.15
7 CBM 0.9465 1.077 1.256 0.845662 0.98173 1.208 1.2815 1.361 1.151983 0.999618 0.999 4/1/02 100.35 73.25 50.1 98.15 74.9 51.4
7 CCA 1.025 1.167 1.249 0.93696 0.988758 1.2975 1.3325 1.4005 1.24749 0.962863 1.092 4/4/02 96.55 72.75 52.55 95.8 73.1 51.25
9 CCV 0.943 1.0845 1.2915 0.762813 0.980143 1.258 1.275 1.3265 1.227274 0.955752 0.995 4/25/02 95 73 53.4 97.65 77.2 51
9 CDU 0.8355 1.1345 1.2505 0.697868 0.951549 1.289 1.306 1.3975 1.231977 0.852612 0.965 4/8/02 97.65 74.45 53.35 96.35 73.1 51.15
9 CAQ 0.6005 0.843 1.1635 0.42117 0.973524 1.215 1.23 1.356 1.133889 0.85975 0.778 4/9/02 101.1 72.9 51.85 94.8 73.55 48.9
9 CDW 0.976 1.0285 1.179 0.88685 0.942708 1.2195 1.311 1.367 1.182514 0.985671 1.035 4/11/02 98.05 75.8 51.1 101.4 76.7 53.5

Prowell, Brown, & Huner
44
Pine AFG1A
Division SN #
Angle Top
Front 1
Angle Top
Front 2Top
Side 1Top
Side 2Top Avg.
Bottom 1
Bottom 2
Bottom Avg.
Avg. DIA
1 1033 1.237 1.259 1.203 1.204 1.226 1.221 1.228 1.225 1.2258 1044 1.196 1.191 1.194 1.187 1.192 1.195 1.155 1.175 1.1849 1051 1.254 1.244 1.174 1.209 1.220 1.135 1.113 1.124 1.1721 1071 1.184 1.2 1.21 1.195 1.197 1.165 1.225 1.195 1.1962 1110 1.211 1.188 1.244 1.227 1.218 1.205 1.222 1.214 1.2162 1111 1.257 1.274 1.224 1.211 1.242 1.21 1.214 1.212 1.2274 1122 1.277 1.278 1.198 1.198 1.238 1.195 1.21 1.203 1.2204 1193 1.261 1.26 1.206 1.183 1.228 1.234 1.242 1.238 1.2333 1236 1.247 1.211 1.199 1.158 1.204 1.228 1.223 1.226 1.2156 1237 1.24 1.248 1.207 1.209 1.226 1.21 1.174 1.192 1.2097 1238 1.165 1.163 1.182 1.170 1.157 1.157 1.1642 1239 1.224 1.231 1.183 1.198 1.209 1.18 1.194 1.187 1.1982 1240 1.086 1.085 1.143 1.149 1.116 1.13 1.108 1.119 1.1175 1241 1.217 1.168 1.202 1.218 1.201 1.198 1.219 1.209 1.2054 1242 1.244 1.258 1.199 1.199 1.225 1.204 1.211 1.208 1.2165 1243 1.248 1.251 1.228 1.222 1.237 1.212 1.234 1.223 1.2301 1244 1.205 1.182 1.138 1.147 1.168 1.154 1.174 1.164 1.1668 1245 1.172 1.176 1.156 1.168 1.148 1.148 1.1584 1246 1.232 1.254 1.203 1.209 1.225 1.05 1.09 1.070 1.1471 1247 1.187 1.212 1.177 1.197 1.193 1.203 1.208 1.206 1.1998 1248 1.148 1.165 1.115 1.143 1.124 1.131 1.128 1.1353 1249 1.223 1.217 1.137 1.16 1.184 1.143 1.144 1.144 1.1649 1251 1.15 1.126 1.165 1.169 1.153 1.115 1.147 1.131 1.1429 1252 1.243 1.241 1.221 1.207 1.228 1.12 1.128 1.124 1.1763 1253 1.239 1.257 1.224 1.225 1.236 1.224 1.225 1.225 1.2306 1254 1.144 1.158 1.151 1.135 1.135 1.1436 1468 1.247 1.243 1.202 1.213 1.226 1.201 1.166 1.184 1.2053 1279 1.174 1.256 1.174 1.206 1.203 1.192 1.214 1.203 1.2036 1284 1.142 1.112 1.186 1.181 1.155 1.208 1.184 1.196 1.1762 1300 1.124 1.122 1.131 1.134 1.128 1.163 1.152 1.158 1.1434 1312 1.245 1.249 1.211 1.201 1.227 1.041 1.02 1.031 1.1293 1354 1.269 1.243 1.225 1.225 1.241 1.24 1.242 1.241 1.2412 1355 1.263 1.244 1.201 1.205 1.228 1.197 1.174 1.186 1.2079 1369 1.241 1.242 1.215 1.207 1.226 1.206 1.181 1.194 1.2106 1375 1.248 1.243 1.201 1.209 1.225 1.202 1.2 1.201 1.2134 1409 1.207 1.261 1.211 1.213 1.223 1.194 1.189 1.192 1.2075 1430 1.247 1.252 1.208 1.22 1.232 1.203 1.214 1.209 1.2201 1434 1.246 1.231 1.203 1.202 1.221 1.206 1.202 1.204 1.2127 1453 1.239 1.245 1.226 1.22 1.233 1.24 1.228 1.234 1.2333 1456 1.233 1.219 1.204 1.207 1.216 1.234 1.237 1.236 1.2263 1457 1.238 1.26 1.215 1.218 1.233 1.175 1.204 1.190 1.2116 1468 1.247 1.243 1.202 1.213 1.226 1.201 1.166 1.184 1.2058 1469 1.228 1.237 1.205 1.215 1.221 1.207 1.202 1.205 1.2136 1470 1.259 1.239 1.217 1.201 1.229 1.235 1.228 1.232 1.2301 1493 1.106 1.069 1.163 1.185 1.131 1.123 1.124 1.124 1.1277 1518 1.237 1.212 1.207 1.201 1.214 1.216 1.245 1.231 1.2226 1581 1.251 1.253 1.205 1.21 1.230 1.167 1.206 1.187 1.208

Prowell, Brown, & Huner
45
Pine AFGC125X
Division SN #
Angle Top
Front 1
Angle Top
Front 2 Bottom
1 Bottom
2 Avg. Top
Avg. Bottom
Avg. DIA
1 123 1.149 1.14 1.181 1.181 1.145 1.181 1.163 1 63 1.147 1.153 1.186 1.150 1.186 1.168 1 419 1.196 1.21 1.23 1.225 1.203 1.228 1.215 1 510 1.029 1.017 1.208 1.200 1.023 1.204 1.114 2 423 1.204 1.191 1.216 1.222 1.198 1.219 1.208 3 119 1.11 1.124 1.168 1.172 1.117 1.170 1.144 3 126 1.11 1.092 1.171 1.171 1.101 1.171 1.136 3 313 1.196 1.167 1.228 1.201 1.182 1.215 1.198 3 278 1.197 1.199 1.203 1.229 1.198 1.216 1.207 3 18 1.208 1.208 1.233 1.22 1.208 1.227 1.217 3 444 1.236 1.24 1.266 1.258 1.238 1.262 1.250 4 122 1.158 1.134 1.186 1.187 1.146 1.187 1.166 4 236 1.195 1.187 1.212 1.217 1.191 1.215 1.203 4 425 1.211 1.186 1.22 1.195 1.199 1.208 1.203 4 40 1.206 1.186 1.24 1.223 1.196 1.232 1.214

Prowell, Brown, & Huner
46
Rainhart
Division SN #
Angle Top
Front 1
Angle Top
Front 2 Bottom
1 Bottom
2 Bottom
3 Avg. Top
Avg. Bottom
Avg. DIA
7 106 1.397 1.393 1.297 1.312 1.395 1.3045 1.3507 107 0.748 0.759 0.46 0.669 0.986 0.7535 0.705 0.659

Prowell, Brown, & Huner
47
Troxler 4140
3000 gram Samples 2000 gram samples 1000 gram samples Division Serial # Top 1 Top 2 Bottom 1 Bottom 2 Top 1 Top 2 Bottom 1 Bottom 2 Top 1 Top 2 Bottom 1 Bottom 2
1 385Internal Angle 1.226 1.224 1.216 1.177 1.279 1.254 1.297 1.297 1.299 1.284 1.326 1.321 10/23/01Height mm 74.5 76 74.1 51.7 49.8 51.1 49.5 28.2 26.3 27.8 25.9
1 802Internal Angle 1.173 1.176 1.227 1.195 1.232 1.23 1.258 1.257 1.272 1.268 1.287 1.283 10/23/01Height mm 74.6 74 73.5 51.5 50.3 52.5 49.7 26.2 26.1 28.3 28.2
5 306Internal Angle 1.193 1.18 1.218 1.203 1.296 1.293 1.296 1.274 1.288 1.276 1.312 1.307 10/9/01Height mm 76 76.3 75.8 76.6 51.3 52.1 52.9 51.3 27.8 27.4 29.1 28.4
5 418Internal Angle 1.184 1.177 1.222 1.211 1.236 1.234 1.249 1.259 1.271 1.304 1.306 1.292 10/8/01Height mm 74.3 73.6 74.9 74.2 50.5 51.2 51.4 51 28.1 26.8 27.9 27.6
7 244Internal Angle 1.189 1.176 1.2 1.184 1.238 1.239 1.247 1.218 1.278 1.293 1.271 1.264 9/11/01Height mm 74.5 73.6 75.3 74.2 50.7 51.4 50.9 51.4 27 28.3 27.1 27.7
8 307Internal Angle 1.167 1.192 1.203 1.236 1.231 1.259 1.262 1.272 1.274 1.286 1.288 9/28/01Height mm 77.3 73.3 75 50.4 50.7 50.6 50.9 27 27.1 26.7 27.5
6 420Internal Angle 1.163 1.168 1.214 1.222 1.212 1.218 1.274 1.275 1.384 1.38 1.323 1.317 3/11/02Height mm 72.9 73.9 76.3 72.9 53 49.3 51.7 52.5 28.3 29.3 29.5 26.6
6 610Internal Angle 1.187 1.193 1.231 1.227 1.229 1.235 1.265 1.274 1.288 1.296 1.305 1.302 3/13/02Height mm 76 72.8 73.4 71.9 50.8 50.1 53.8 52.8 28.1 28 30.5 27.6
6 658Internal Angle 1.155 1.145 1.138 1.163 1.193 1.177 1.185 1.216 1.28 1.268 1.286 1.249 3/25/02Height mm 74.9 74.9 76.3 75.5 51.5 50.9 53.2 52.8 26.8 26.8 29.3 28.4
7 99Internal Angle 1.217 1.214 1.263 1.288 1.278 1.266 1.329 1.307 1.315 1.306 1.31 1.331 2/13/02Height mm 76.5 75.3 73.7 73.9 53.5 52.2 51.2 50.7 29.3 29 27.2 27.8
7 705Internal Angle 1.131 1.14 1.113 1.134 1.21 1.197 1.199 1.203 1.24 1.259 1.229 1.244 4/3/02Height mm 72.7 70.8 74.2 72.7 49.4 48.8 50.2 50.6 26.5 26.4 28 27.5
7 3Internal Angle 1.053 1.038 1.142 1.125 1.122 1.141 1.195 1.187 1.174 1.18 1.229 1.251 7/23/01Height mm 74.6 73.7 75.2 74.5 51.1 50.7 52 52.5 27.5 26.5 31.1 30.3
8 427Internal Angle 1.038 1.041 1.071 1.059 1.12 1.106 1.159 1.151 1.272 1.281 1.264 1.261 4/16/02Height mm 73 72.3 76 74.4 51.1 50.6 52.7 51.6 28 26.6 30.3 29.5
8 524Internal Angle 1.21 1.213 1.159 1.147 1.243 1.26 1.231 1.207 1.297 1.293 1.264 1.289 4/17/02Height mm 72.8 73.9 73.8 74.7 50.7 50 52.2 52.1 25.9 26.2 27.1 28.1
4 406Internal Angle 1.173 1.159 1.14 1.153 1.207 1.195 1.273 1.27 1.276 1.292 1.304 1.33 5/15/02Height mm 74.3 73.7 76.1 75.4 52.5 52.5 54.8 53.8 27.4 27.7 31.1 30.1
4 101Internal Angle 1.2 1.194 1.246 1.232 1.235 1.239 1.275 1.281 1.299 1.294 1.308 1.323 5/9/02Height mm 77.1 76.1 78.4 77.8 52.4 52.6 54.6 54.4 28.7 28.1 31.4 32.5

Prowell, Brown, & Huner
48
Troxler 4140
4000 3000 2000 Extrapolated Top 4000 3000 2000 Extrapolated Bottom Avg. DIADivision Serial # Top Avg Top Avg Top Avg DIA @ 115 Fit Bot. Avg Bot. Avg Bot. Avg DIA @ 115 Fit
1 385 1.225 1.2665 1.2915 1.170653 0.98074 1.1965 1.297 1.3235 1.1021542 0.90755 1.136 10/23/01 74.5 50.75 27.25 75.05 50.3 26.85
1 802 1.1745 1.231 1.27 1.097392 0.98529 1.211 1.2575 1.285 1.1465145 0.9768 1.122 10/23/01 74.3 50.9 26.15 73.5 51.1 28.25
5 306 1.1865 1.2945 1.282 1.129674 0.65725 1.2105 1.285 1.3095 1.137283 0.92647 1.133 10/9/01 76.15 51.7 27.6 76.2 52.1 28.75
5 418 1.1805 1.235 1.2875 1.086497 0.99979 1.2165 1.254 1.299 1.1439662 0.99738 1.115 10/8/01 73.95 50.85 27.45 74.55 51.2 27.75
7 244 1.183 1.239 1.286 1.093 0.997 1.192 1.233 1.2675 1.129 0.998 1.111 9/11/01 74.050 51.050 27.650 74.75 51.15 27.4
8 307 1.180 1.234 1.273 1.104 0.994 1.203 1.261 1.287 1.138 0.959 1.121 9/28/01 75.300 50.550 27.050 75 50.75 27.1
6 420 1.166 1.215 1.382 0.944 0.911 1.218 1.275 1.32 1.132 0.993 1.038 3/11/02 73.400 51.150 28.800 74.6 52.1 28.05
6 610 1.190 1.232 1.292 1.097 0.985 1.229 1.270 1.3035 1.160 0.987 1.129 3/13/02 74.400 50.450 28.050 72.65 53.3 29.05
6 658 1.150 1.185 1.274 1.038 0.944 1.1505 1.201 1.2675 1.051 0.995 1.044 3/25/02 74.900 51.200 26.800 75.9 53 28.85
7 99 1.216 1.272 1.311 1.139 0.986 1.2755 1.318 1.3205 1.242 0.785 1.191 2/13/02 75.900 52.850 29.150 73.8 50.95 27.5
7 705 1.136 1.204 1.250 1.030 0.988 1.1235 1.201 1.2365 1.027 0.958 1.029 4/3/02 71.750 49.100 26.450 73.45 50.4 27.75
7 3 1.046 1.132 1.177 0.939 0.967 1.1335 1.191 1.24 1.038 0.999 0.988 7/23/01 74.150 50.900 27.000 74.85 52.25 30.7
8 427 1.040 1.113 1.277 0.803 0.963 1.065 1.155 1.2625 0.888 0.996 0.846 4/16/02 72.650 50.850 27.300 75.2 52.15 29.9
8 524 1.212 1.252 1.295 1.138 1.000 1.153 1.219 1.2765 1.048 0.995 1.093 4/17/02 73.350 50.350 26.050 74.25 52.15 27.6
4 406 1.166 1.201 1.284 1.054 0.965 1.1465 1.272 1.317 1.015 0.917 1.034 5/15/02 74.000 52.500 27.550 75.75 54.3 30.6
4 101 1.197 1.237 1.297 1.114 0.987 1.239 1.278 1.3155 1.178 1.000 1.146 5/9/02 76.600 52.500 28.400 78.1 54.5 31.95

Prowell, Brown, & Huner
49
Troxler 4141
4000 gram Samples 3000 gram samples 2000 gram samples Division Serial # Top 1 Top 2 Bottom 1 Bottom 2 Top 1 Top 2 Bottom 1 Bottom 2 Top 1 Top 2 Bottom 1 Bottom 2
2 118Internal Angle 0.991 0.997 1.105 1.095 1.063 1.102 1.162 1.186 1.132 1.16 1.218 1.234 2/11/02Height mm 100.3 100.4 100.1 98.1 76.6 76 78.1 77.6 51.1 51 54.5 53.2
5 188Internal Angle 1.137 1.139 1.095 1.087 1.19 1.184 1.132 1.13 1.221 1.223 1.238 1.218 2/28/02Height mm 96.7 97.9 99.3 100.8 75 76.4 78.7 76.3 52.5 56.3 53.3 51.9
6 109Internal Angle 1.18 1.182 1.108 1.1 1.257 1.262 1.186 1.185 1.299 1.288 1.266 1.277 3/12/02Height mm 99.8 99.8 98.4 96.8 76.7 74.7 75.5 73.5 50.3 50.3 51.5 48.7
6 158Internal Angle 1.064 1.083 0.917 0.923 1.14 1.13 1.041 1.053 1.207 1.171 1.135 1.149 3/27/03Height mm 81.6 75.8 100.9 97.2 54.1 54.7 74.1 77.4 35 33.1 55.3 57.1
9 164Internal Angle 1.141 1.116 0.974 0.98 1.155 1.155 1.087 1.072 1.222 1.217 1.208 1.179 4/18/02Height mm 97.7 98.3 99.7 95.7 75.5 73 75.5 74.8 51.8 51.9 52.9 51.8
4000 3000 2000 Extrapolated Top 4000 3000 2000 Extrapolated Bottom Avg. DIA
Division Serial
# Top Avg Top Avg Top Avg DIA @ 115 Fit Bot. Avg Bot. Avg Bot. Avg DIA @ 115 Fit 2 118 0.994 1.0825 1.146 0.954 0.988 1.1 1.174 1.226 1.061174 0.981741 1.007
2/11/02 100.35 76.3 51.05 99.1 77.85 53.85 5 188 1.138 1.187 1.222 1.106 0.992 1.091 1.131 1.228 1.038798 0.957696 1.072
2/28/02 97.3 75.7 54.4 100.05 77.5 52.6 6 109 1.181 1.2595 1.2935 1.155 0.944 1.104 1.1855 1.2715 1.042657 1 1.099
3/12/02 99.8 75.7 50.3 97.6 74.5 50.1 6 158 1.0735 1.135 1.189 0.979 1.000 0.92 1.047 1.142 0.839136 0.998941 0.909
3/27/03 78.7 54.4 34.05 99.05 75.75 56.2 9 164 1.1285 1.155 1.2195 1.089 0.937 0.977 1.0795 1.1935 0.892676 0.999245 0.991
4/18/02 98 74.25 51.85 97.7 75.15 52.35