Evaluation of the Integrated Care and Support Pioneers ... key informant survey report.pdf · Bob...
42
1 Evaluation of the Integrated Care and Support Pioneers Programme (2015-2020) Results from the first survey (spring 2016) of Pioneer key informants Bob Erens, Gerald Wistow, Mary Alison Durand, Sandra Mounier-Jack, Tommaso Manacorda, Nick Douglas, Ties Hoomans, Nicholas Mays April 2017
Transcript of Evaluation of the Integrated Care and Support Pioneers ... key informant survey report.pdf · Bob...
1
Evaluation of the Integrated Care and Support
Pioneers Programme (2015-2020)
Results from the first survey (spring 2016)
of Pioneer key informants
Bob Erens, Gerald Wistow, Mary Alison Durand, Sandra Mounier-Jack, Tommaso Manacorda, Nick Douglas, Ties Hoomans, Nicholas Mays
April 2017

2
Acknowledgements The research team would like to thank the members of staff in the Wave 1 and Wave 2 Pioneer sites who gave up their time to complete the key informant survey questionnaire. This work was funded by the Policy Research Programme of the Department of Health for England. This is an independent report commissioned and funded by the Department of Health. The views expressed are not necessarily those of the Department or its partners. The findings contained within this report have not been subject to independent peer review.
3
Summary The Integrated Care Pioneer programme was initiated by the Government to improve the quality, effectiveness and cost-effectiveness of care for people whose needs are best met when the different parts of the health and social care system work in an integrated way. The 14 Wave 1 (W1) Pioneers which were announced in November 2013 were joined by a further 11 Wave 2 (W2) Pioneers in January 2015. Following an 18-month early evaluation of the W1 Pioneers, in July 2015 PIRU began a longer-term evaluation to assess the extent to which all 25 Pioneers are successful in providing coordinated care, including improved patient experience and outcomes, in a cost-effective way. The evaluation consists of a number of strands, one of which is to carry out surveys over time with a panel of key informants from the Pioneers in order to capture their perceptions of the factors helping or hindering their pursuit of integrated care, progress over time, and whether their objectives and outcomes are being achieved. The first panel survey was carried out between April to June 2016. Overall, 98 key informants from the 25 sites completed the survey, split between CCGs (n=26), Local Authorities (n=24), NHS providers (n=23) and ‘Other’ organisations such as the voluntary sector or Healthwatch (n=25). There were 61 informants from W1 Pioneer sites and 37 from W2 sites. A number of very significant barriers to integration were identified. The most commonly mentioned included: financial constraints in the local health and social care economy (58%); local IT systems being incompatible for sharing patient/service user information (46%); conflicting central government policies (40%); lack of additional funding to try out innovative services (39%); difficulty sharing information due to information governance regulations (35%); competing demands for time and resources (34%); shortages of frontline staff with the right skills (33%); and increased demand for services (32%). Most of these barriers are largely out of the control of local actors, whereas barriers that were mentioned less often tend to be more amenable to resolution at a local level (e.g. leadership of the local programme). Consistent with this was the identification of items that can be influenced by local Pioneer actors as very important facilitators of integration, such as: having strong local leadership (76%); actively involving local providers and voluntary organisations in integrated care activities (66% and 61% respectively); building good working relationships between key local partners (60%); having local champions (58%); involving patients/service users in the co-design of local initiatives (55%); and having a bottom-up approach with local staff driving change (52%). However, it appears that the persistence of those barriers which are outside of local control are proving to be substantial impediments to achieving progress at the scale and pace originally hoped for from the Pioneers. While nearly everyone reported ‘some’ progress had been made towards achieving the 15 outcomes asked about in the survey, there were few reports of ‘substantial’ progress being delivered, including in the W1 sites which had been in operation for over 2 years. Reports of achievements to date for the W1 Pioneers typically focused on the process of setting up or implementing integrated initiatives rather than on the outcomes expected from them: e.g. 39% of W1 respondents reported improved working relationships between health and social care as an achievement, but only 6% reported improved quality of care and only 5% reported a reduction in hospital admissions. Future rounds of the survey will continue to monitor progress of the Pioneers over the next three years and the extent to which they are achieving their objectives.
4
1. Background
The lack of connectedness within and between the various elements of the health and social care services throughout England is a common complaint, and leads to services that are judged to be inefficient and provide poor value for money, as well as leading to poorer patient experiences and outcomes. (Goodwin et al 2012, Audit Commission 2011, Audit Commission 2009, Alltimes and Varnam 2012) There have been many attempts over the past several decades to integrate health and social care services, and the twin pressures of an ageing population and financial austerity are widely seen to have increased this priority still further. (NHS England and Partners 2014, National Collaboration for Integrated Care and Support 2013) Integrated care is integral to the goal of meeting the ‘Triple Aim’ identified by the Institute for Healthcare Improvement (2014) of improved patient experiences and outcomes while delivering more cost-effective services. The Government called for expressions of interest from the ‘most ambitious and visionary’ local areas to become Integrated Care Pioneers which would be capable of driving change ‘at scale and pace, from which the rest of the country can benefit’. (Department of Health May 2013) Each Pioneer was expected to: deliver improved patient experiences and outcomes; realise financial efficiencies; encompass whole system integration involving health, social care, public health and potentially other public services and the voluntary sector; and, importantly, make central to their plans the Narrative on patient-centred care developed by National Voices and Think Local Act Personal’s Making It Real. (Department of Health May 2013) Following recommendations from an expert panel, 14 Wave 1 Pioneer sites were announced in November 2013. (Department of Health November 2013) A second wave of 11 more Pioneers (the Wave 2 Pioneers) was announced in January 2015. (Department of Health 2015) The Pioneers were to be given access to expertise, support and constructive challenge from a range of national and international experts, but only very limited additional funding (£20,000 initially, later supplemented with a further £90,000). Following an early evaluation of the Wave 1 Pioneers (January 2014 to July 2015) (Erens et al 2016), the longer-term evaluation aims to assess the extent to which all Pioneers, in the context of new funding arrangements, are successful in providing ‘person-centred coordinated care’, including improved outcomes and quality of care, in a cost-effective way. The evaluation consists of a number of interdependent elements, one of which is to understand the experiences of those implementing service change in Pioneers, in particular, to identify facilitators and barriers to integrating services and how barriers are overcome. One method for achieving this aim is to collect data over time by carrying out surveys among a panel of key informants (initially, Pioneer staff and other local stakeholders) in order to capture their perceptions of: the factors helping/hindering their pursuit of integrated care, including national policy such as the Better Care Fund (BCF); the extent to which barriers have been overcome; and whether or not their original goals have been achieved. The first panel survey took place between mid-April and mid-June 2016. The second survey is planned for spring 2017.
5
2. The survey design We aimed to include on the survey panel a spread of key informants within each Pioneer, including at least one person from participating CCGs and one from participating local authorities (LAs), as well as one person from other important local partners (e.g. local acute hospital, community health service provider, voluntary sector). Our main contacts in each Pioneer were asked to provide names and email addresses for these key people. We also asked our main contacts to provide the names and contact details of every member of the Pioneer ‘board’ or committee or, where there was not such a board/committee, the members of the group that was responsible for steering integration activities covering the Pioneer area. This list of names pertaining to an integration board/committee was provided by some Pioneers, but not all, and partly explains the wide disparity in the number of survey invitations sent out per Pioneer (which varied from 3 in Staffordshire and Stoke to 36 in Blackpool and Fylde Coast). Where a list of board/committee members was provided, it may have included some individuals who were only marginally involved in Pioneer activities, which should be borne in mind when interpreting the response rate. The survey involved an online questionnaire, which included sections on: respondent characteristics; what the term ‘Pioneer’ meant locally; extent and nature of local health and social care services working together; barriers and facilitators to integration; involvement of different types of organisation in the design of integration activities; progress to date; and priorities over the next 12 months. The vast majority of the questions were pre-coded, with a few open-ended questions requiring respondents to type in their answers. The questionnaire was designed to take about 25 minutes on average to complete. A copy of the questionnaire and the code frames for the open questions are provided in the Appendix. After an initial email invitation was sent to all 360 individuals on the sample frame, three further reminders were sent over the course of the 2-month fieldwork period. Overall, we obtained 98 completed questionnaires. This gives a response rate of 27.2%. However, 23 panel members opted out or told us the questionnaire was being coordinated on behalf of more than one panel member. Removing these cases, gives an ‘eligible’ base of 337, which yields the slightly higher response rate of 29.1%. The achieved survey sample of 98 key informants includes a good range of people across Pioneer
sites in terms of the two separate waves of Pioneers, the partner organisations involved in Pioneer
activities, and level of staff seniority, given that we only included managers within the current survey
(aside from Healthwatch or patient representatives on Pioneer boards/committees). The sample
does not provide ‘complete’ coverage of all key individuals involved in the 25 Pioneers (and no such
sample list could ever be definitive given the difficulties in delineating the precise organisational
boundaries of individual Pioneers and their integrated care initiatives). This factor, together with the
varying notional population sizes of the Pioneers themselves and the differing numbers of
participants who completed the questionnaire in each site, make it difficult to interpret results
which are based on all 98 responses. While the tables in this report show results for all participants
in order to provide a comprehensive picture, we generally limit our textual descriptions to more
meaningful sub-groups, such as comparing responses between Wave 1 and Wave 2 Pioneers or
between CCGs and LAs.
6
3. Characteristics of the key informant sample
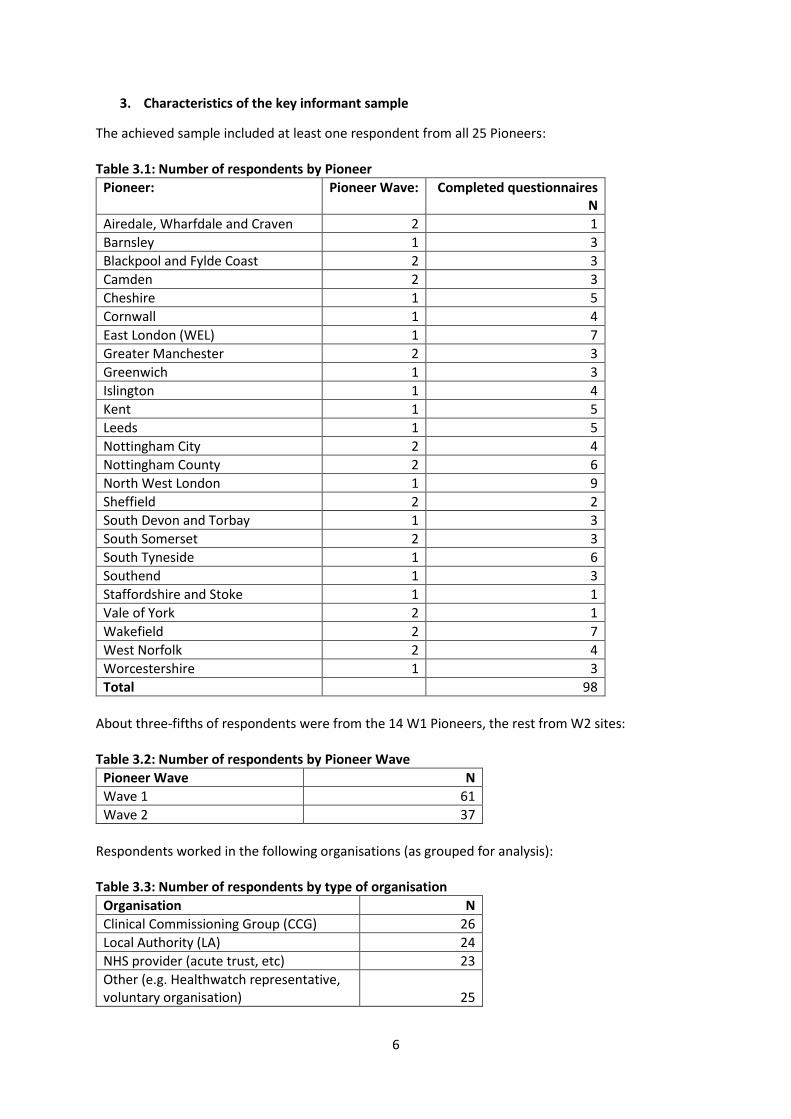
The achieved sample included at least one respondent from all 25 Pioneers: Table 3.1: Number of respondents by Pioneer
Pioneer: Pioneer Wave: Completed questionnaires N
Airedale, Wharfdale and Craven 2 1
Barnsley 1 3
Blackpool and Fylde Coast 2 3
Camden 2 3
Cheshire 1 5
Cornwall 1 4
East London (WEL) 1 7
Greater Manchester 2 3
Greenwich 1 3
Islington 1 4
Kent 1 5
Leeds 1 5
Nottingham City 2 4
Nottingham County 2 6
North West London 1 9
Sheffield 2 2
South Devon and Torbay 1 3
South Somerset 2 3
South Tyneside 1 6
Southend 1 3
Staffordshire and Stoke 1 1
Vale of York 2 1
Wakefield 2 7
West Norfolk 2 4
Worcestershire 1 3
Total 98
About three-fifths of respondents were from the 14 W1 Pioneers, the rest from W2 sites: Table 3.2: Number of respondents by Pioneer Wave
Pioneer Wave N
Wave 1 61
Wave 2 37
Respondents worked in the following organisations (as grouped for analysis): Table 3.3: Number of respondents by type of organisation
Organisation N
Clinical Commissioning Group (CCG) 26
Local Authority (LA) 24
NHS provider (acute trust, etc) 23
Other (e.g. Healthwatch representative, voluntary organisation)
25

7
The ‘NHS Provider’ category includes respondents from primary care, acute/community/mental health trusts and integrated care organisations. The ‘Other’ category includes a mix of respondents, mainly from Healthwatch or other patient/service user representatives, but also includes a few respondents from other types of voluntary/community organisations and from private providers. The diversity of these two categories is far from ideal for the purposes of analysis, but were combined in this way because of the very small numbers of each type of organisation included within them. Because of this diversity within these two categories, the descriptions in the report mainly refer to comparisons between the two more homogeneous categories of CCG and LAs (with base sizes of 26 and 24 respectively). Key informants were generally senior managers, but also included some practising health professionals involved in some way in leading or governing the Pioneer: Table 3.4: Number of respondents by job title
Job title N
Pioneer lead/coordinator 22
Chief Executive1 17
Director/Assistant director 29
Locality manager 4
Commissioning officer 1
Other senior manager 16
Health care professional (clinical) 5
Health care professional (non-clinical) 1
Other (including lay representatives) 3 1 The majority of Chief Executives were from voluntary/community organisations. Most were in a strategic role, or combined strategic/operational role: Table 3.5: Number of respondents by role/responsibilities of current post
Job title N
Strategic 60
Combined strategic/operational 30
Operational/service delivery/other 8
About half (47%) of respondents had been with their current employer for at least four years, but only one in four (23%) had been in their current post for that long, with two in five (42%) saying they had been in their current post for less than two years. However, 70% had been working in the Pioneer area for at least three years, and 60% for at least four years. So despite the evident movement between posts, it appears there were opportunities for respondents to develop considerable knowledge about, and contacts within, their Pioneer areas. Table 3.6: Number of respondents by years worked a) in Pioneer area, b) for current employer and c) in current post
Years a) Working in Pioneer area (N)
b) Working for current employer (N)1
c) Working in current post (N)
Less than 1 year 7 8 18
1 to less than 2 years 9 11 24
2 to less than 3 years 12 13 18
3 to less than 4 years 10 16 15
4 years or more 60 47 23 1 3 missing responses.
8
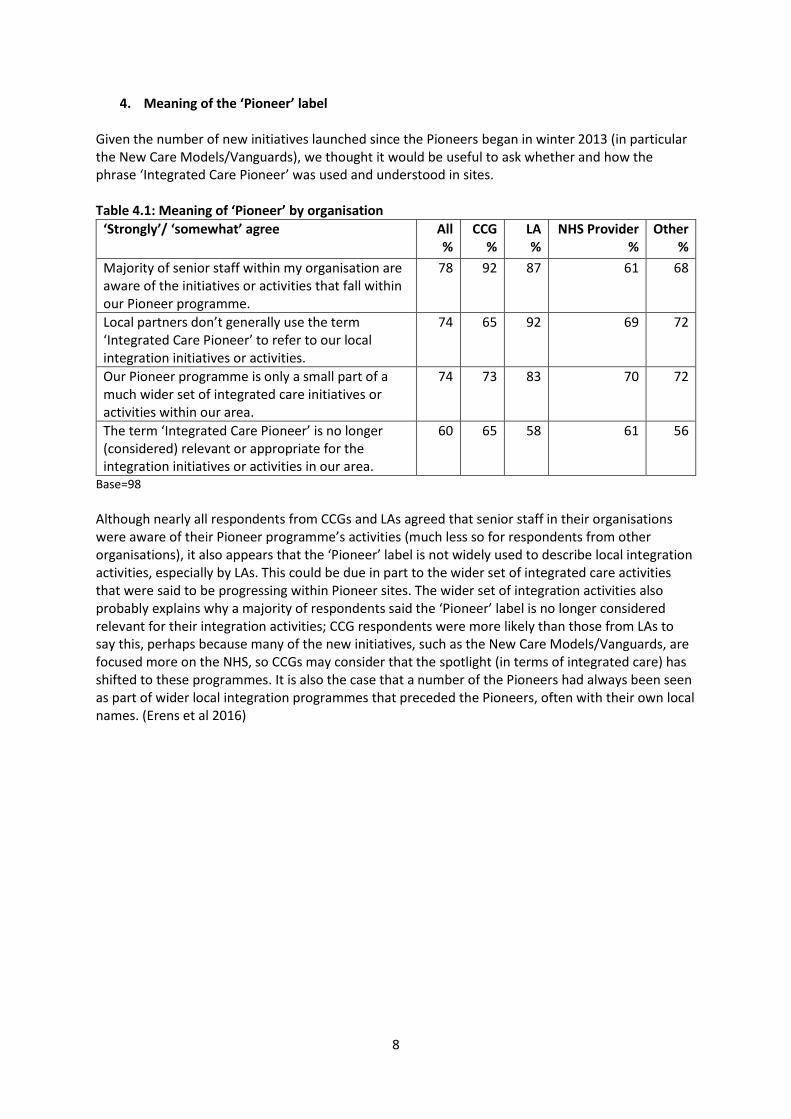
4. Meaning of the ‘Pioneer’ label Given the number of new initiatives launched since the Pioneers began in winter 2013 (in particular the New Care Models/Vanguards), we thought it would be useful to ask whether and how the phrase ‘Integrated Care Pioneer’ was used and understood in sites. Table 4.1: Meaning of ‘Pioneer’ by organisation
‘Strongly’/ ‘somewhat’ agree
All %
CCG %
LA %
NHS Provider %
Other %
Majority of senior staff within my organisation are aware of the initiatives or activities that fall within our Pioneer programme.
78 92 87 61 68
Local partners don’t generally use the term ‘Integrated Care Pioneer’ to refer to our local integration initiatives or activities.
74 65 92 69 72
Our Pioneer programme is only a small part of a much wider set of integrated care initiatives or activities within our area.
74 73 83 70 72
The term ‘Integrated Care Pioneer’ is no longer (considered) relevant or appropriate for the integration initiatives or activities in our area.
60 65 58 61 56
Base=98
Although nearly all respondents from CCGs and LAs agreed that senior staff in their organisations were aware of their Pioneer programme’s activities (much less so for respondents from other organisations), it also appears that the ‘Pioneer’ label is not widely used to describe local integration activities, especially by LAs. This could be due in part to the wider set of integrated care activities that were said to be progressing within Pioneer sites. The wider set of integration activities also probably explains why a majority of respondents said the ‘Pioneer’ label is no longer considered relevant for their integration activities; CCG respondents were more likely than those from LAs to say this, perhaps because many of the new initiatives, such as the New Care Models/Vanguards, are focused more on the NHS, so CCGs may consider that the spotlight (in terms of integrated care) has shifted to these programmes. It is also the case that a number of the Pioneers had always been seen as part of wider local integration programmes that preceded the Pioneers, often with their own local names. (Erens et al 2016)

9
5. Involvement in design of Pioneer programme We asked how involved (relevant) CCGs, LAs and other partners were in the design of the Pioneer programme. Perhaps unsurprisingly, views on levels of involvement varied according to the type of organisation the respondent worked for. CCG respondents ranked CCGs as the most likely to be ‘very’ involved, while LA respondents gave the highest ranking to LA involvement (Table 5.1). Table 5.1: ‘Very’ involved in Pioneer programme design by organisation
Partners that are ‘very’ involved All %
CCG %
LA %
NHS Provider %
Other %
CCG 71 83 73 59 71
LA adult social care providers 59 63 78 32 63
LA social services (commissioners) 53 58 74 33 46
Community health trusts 49 46 57 45 46
Acute trusts 43 46 39 41 46
GPs/primary care 39 42 48 32 33
LA public health 36 50 35 23 35
Mental health trusts 35 33 30 32 46
User representative organisations 26 42 26 18 17
Individual service users 24 50 17 23 4
Voluntary sector providers 23 25 17 27 21
Frontline staff 20 21 22 32 8
Individual carers 18 33 13 23 4
Local councillors 17 29 30 5 4
Local population direct involvement 14 33 9 14 0
Other local professional bodies 3 8 0 5 0
Local Medical Committee 3 4 4 5 0
Private sector providers 1 0 4 0 0 Bases vary from 91 to 93 per partner.
The table shows that respondents perceived a relatively low level of involvement in integration activities of NHS trusts, frontline staff and GPs/primary care. This last is significant, and somewhat surprising, given that the emphasis of many Pioneer activities is around GP-led care coordination activities. (Erens et al 2016) It also shows that CCG respondents were much more likely than LA respondents to say that individual service users and carers, the local population and user representative organisations were ‘very’ involved in the design of integration activities. Of particular note here is the divergence between CCGs and the ‘Other’ category (which is largely made up of respondents from voluntary/community/user representative organisations), with ‘Other’ respondents being much less likely to report the involvement of users and their representatives in Pioneer programme design (e.g. individual service users being ‘very’ involved was reported by 50% of CCG respondents but only by 4% of ‘Other’ respondents). These points are worth exploring in the next key informant survey and/or in other elements of the evaluation. A number of respondents used the box provided in the questionnaire to type in the names of other services involved in the design of the Pioneer programme, of which the most commonly mentioned were housing and ambulance services. However, the numbers mentioning other services were very small, aside from 17% citing ambulance services, and these services were more likely to be rated as ‘somewhat’ rather than ‘very’ involved. In response to a question on whether their Pioneer programme ‘is fully consistent with the local strategy for health and social care’, nearly all respondents (92% CCGs, 96% LAs) agreed that it was.
10
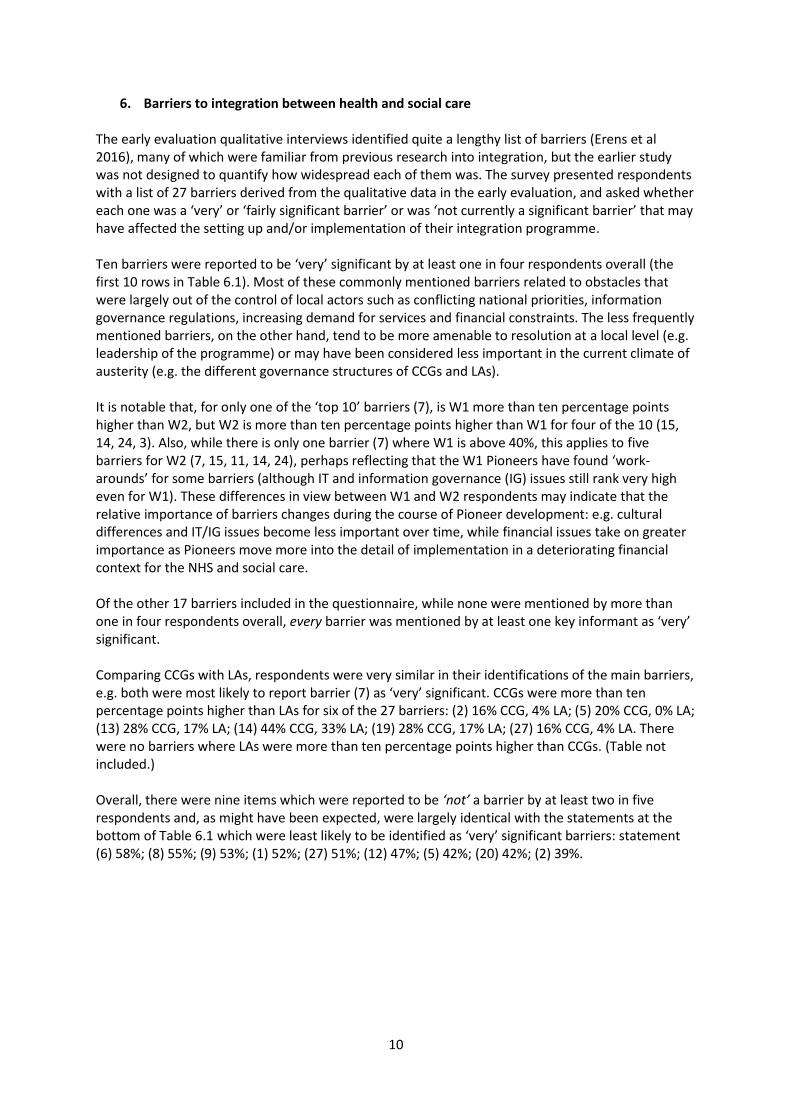
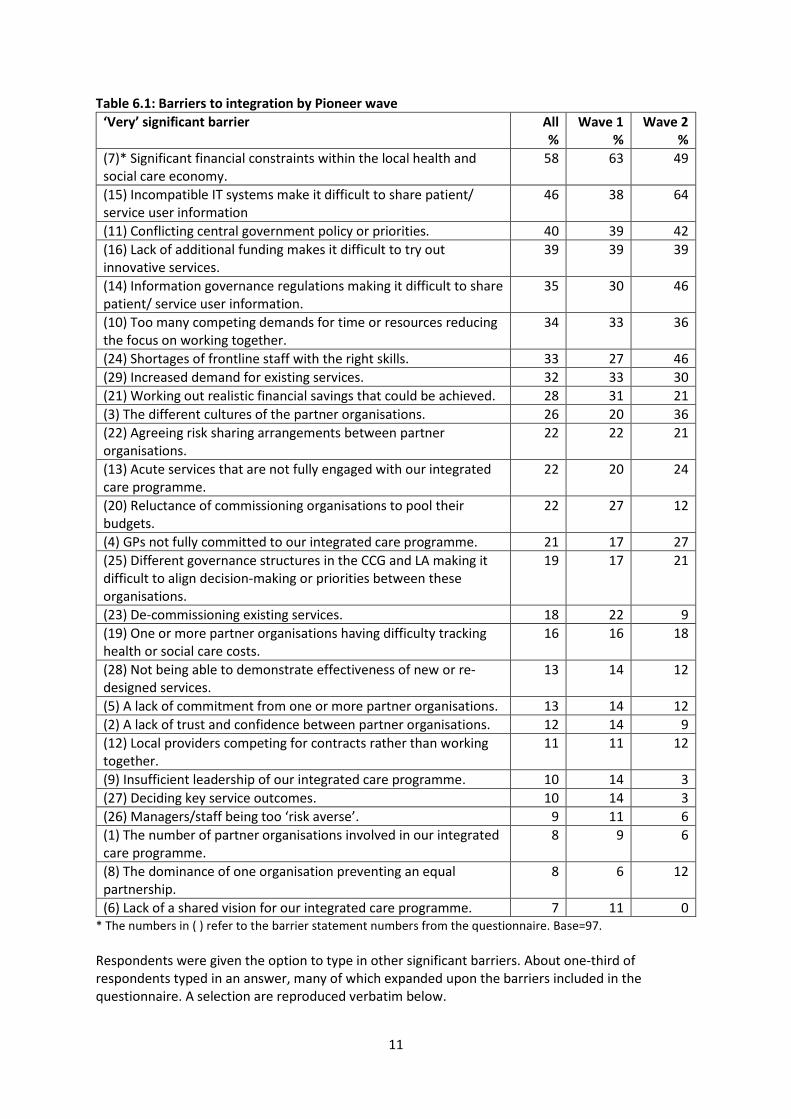
6. Barriers to integration between health and social care The early evaluation qualitative interviews identified quite a lengthy list of barriers (Erens et al 2016), many of which were familiar from previous research into integration, but the earlier study was not designed to quantify how widespread each of them was. The survey presented respondents with a list of 27 barriers derived from the qualitative data in the early evaluation, and asked whether each one was a ‘very’ or ‘fairly significant barrier’ or was ‘not currently a significant barrier’ that may have affected the setting up and/or implementation of their integration programme. Ten barriers were reported to be ‘very’ significant by at least one in four respondents overall (the first 10 rows in Table 6.1). Most of these commonly mentioned barriers related to obstacles that were largely out of the control of local actors such as conflicting national priorities, information governance regulations, increasing demand for services and financial constraints. The less frequently mentioned barriers, on the other hand, tend to be more amenable to resolution at a local level (e.g. leadership of the programme) or may have been considered less important in the current climate of austerity (e.g. the different governance structures of CCGs and LAs). It is notable that, for only one of the ‘top 10’ barriers (7), is W1 more than ten percentage points higher than W2, but W2 is more than ten percentage points higher than W1 for four of the 10 (15, 14, 24, 3). Also, while there is only one barrier (7) where W1 is above 40%, this applies to five barriers for W2 (7, 15, 11, 14, 24), perhaps reflecting that the W1 Pioneers have found ‘work-arounds’ for some barriers (although IT and information governance (IG) issues still rank very high even for W1). These differences in view between W1 and W2 respondents may indicate that the relative importance of barriers changes during the course of Pioneer development: e.g. cultural differences and IT/IG issues become less important over time, while financial issues take on greater importance as Pioneers move more into the detail of implementation in a deteriorating financial context for the NHS and social care. Of the other 17 barriers included in the questionnaire, while none were mentioned by more than one in four respondents overall, every barrier was mentioned by at least one key informant as ‘very’ significant. Comparing CCGs with LAs, respondents were very similar in their identifications of the main barriers, e.g. both were most likely to report barrier (7) as ‘very’ significant. CCGs were more than ten percentage points higher than LAs for six of the 27 barriers: (2) 16% CCG, 4% LA; (5) 20% CCG, 0% LA; (13) 28% CCG, 17% LA; (14) 44% CCG, 33% LA; (19) 28% CCG, 17% LA; (27) 16% CCG, 4% LA. There were no barriers where LAs were more than ten percentage points higher than CCGs. (Table not included.) Overall, there were nine items which were reported to be ‘not’ a barrier by at least two in five respondents and, as might have been expected, were largely identical with the statements at the bottom of Table 6.1 which were least likely to be identified as ‘very’ significant barriers: statement (6) 58%; (8) 55%; (9) 53%; (1) 52%; (27) 51%; (12) 47%; (5) 42%; (20) 42%; (2) 39%.
11
Table 6.1: Barriers to integration by Pioneer wave
‘Very’ significant barrier All %
Wave 1 %
Wave 2 %
(7)* Significant financial constraints within the local health and social care economy.
58 63 49
(15) Incompatible IT systems make it difficult to share patient/ service user information
46 38 64
(11) Conflicting central government policy or priorities. 40 39 42
(16) Lack of additional funding makes it difficult to try out innovative services.
39 39 39
(14) Information governance regulations making it difficult to share patient/ service user information.
35 30 46
(10) Too many competing demands for time or resources reducing the focus on working together.
34 33 36
(24) Shortages of frontline staff with the right skills. 33 27 46
(29) Increased demand for existing services. 32 33 30
(21) Working out realistic financial savings that could be achieved. 28 31 21
(3) The different cultures of the partner organisations. 26 20 36
(22) Agreeing risk sharing arrangements between partner organisations.
22 22 21
(13) Acute services that are not fully engaged with our integrated care programme.
22 20 24
(20) Reluctance of commissioning organisations to pool their budgets.
22 27 12
(4) GPs not fully committed to our integrated care programme. 21 17 27
(25) Different governance structures in the CCG and LA making it difficult to align decision-making or priorities between these organisations.
19 17 21
(23) De-commissioning existing services. 18 22 9
(19) One or more partner organisations having difficulty tracking health or social care costs.
16 16 18
(28) Not being able to demonstrate effectiveness of new or re-designed services.
13 14 12
(5) A lack of commitment from one or more partner organisations. 13 14 12
(2) A lack of trust and confidence between partner organisations. 12 14 9
(12) Local providers competing for contracts rather than working together.
11 11 12
(9) Insufficient leadership of our integrated care programme. 10 14 3
(27) Deciding key service outcomes. 10 14 3
(26) Managers/staff being too ‘risk averse’. 9 11 6
(1) The number of partner organisations involved in our integrated care programme.
8 9 6
(8) The dominance of one organisation preventing an equal partnership.
8 6 12
(6) Lack of a shared vision for our integrated care programme. 7 11 0 * The numbers in ( ) refer to the barrier statement numbers from the questionnaire. Base=97.
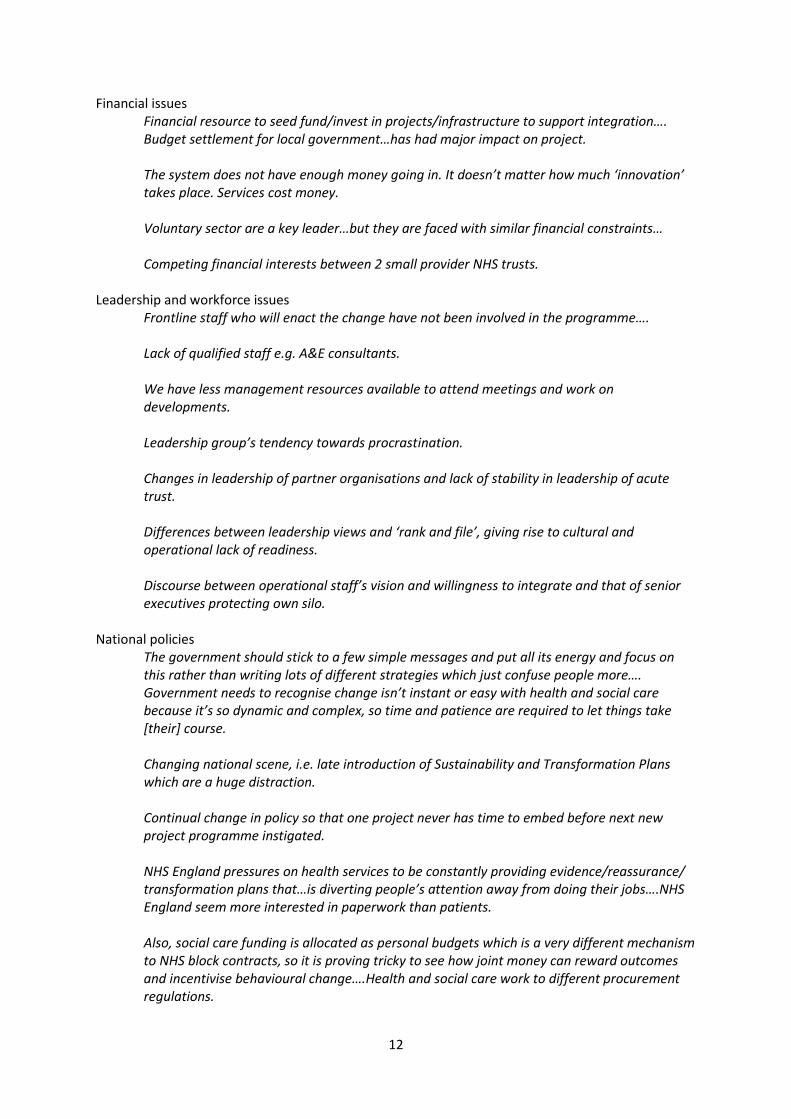
Respondents were given the option to type in other significant barriers. About one-third of respondents typed in an answer, many of which expanded upon the barriers included in the questionnaire. A selection are reproduced verbatim below.
12
Financial issues Financial resource to seed fund/invest in projects/infrastructure to support integration….
Budget settlement for local government…has had major impact on project. The system does not have enough money going in. It doesn’t matter how much ‘innovation’
takes place. Services cost money. Voluntary sector are a key leader…but they are faced with similar financial constraints… Competing financial interests between 2 small provider NHS trusts. Leadership and workforce issues Frontline staff who will enact the change have not been involved in the programme…. Lack of qualified staff e.g. A&E consultants. We have less management resources available to attend meetings and work on
developments. Leadership group’s tendency towards procrastination. Changes in leadership of partner organisations and lack of stability in leadership of acute
trust. Differences between leadership views and ‘rank and file’, giving rise to cultural and
operational lack of readiness. Discourse between operational staff’s vision and willingness to integrate and that of senior
executives protecting own silo. National policies The government should stick to a few simple messages and put all its energy and focus on
this rather than writing lots of different strategies which just confuse people more…. Government needs to recognise change isn’t instant or easy with health and social care because it’s so dynamic and complex, so time and patience are required to let things take [their] course.
Changing national scene, i.e. late introduction of Sustainability and Transformation Plans
which are a huge distraction. Continual change in policy so that one project never has time to embed before next new
project programme instigated. NHS England pressures on health services to be constantly providing evidence/reassurance/
transformation plans that…is diverting people’s attention away from doing their jobs….NHS England seem more interested in paperwork than patients.
Also, social care funding is allocated as personal budgets which is a very different mechanism
to NHS block contracts, so it is proving tricky to see how joint money can reward outcomes and incentivise behavioural change….Health and social care work to different procurement regulations.

13
7. Facilitators supporting the implementation of health and social care integration The survey also asked about the experience in each Pioneer of 16 facilitators that had been identified in the early evaluation as potentially supporting the setting up and/or implementation of their local integrated care programme. These are shown in Table 7.1, ranked by the overall percentage saying the facilitator was ‘very’ important. Table 7.1: Facilitators of health and social care integration by Pioneer wave
‘Very’ important All %
Wave 1 %
Wave 2 %
(7)* Having strong leadership at local level. 76 75 78
(12) Having local providers actively involved in integrated care initiatives/activities.
66 64 72
(13) Having key local voluntary organisations actively involved in integrated care initiatives/activities.
61 63 59
(4) Building, maintaining and reinforcing good working relationships between key local partners.
60 55 72
(8) Having local champions to progress work locally or convince others of the benefits.
58 59 56
(9) Involving patients/service users/carers in co-design of the interventions/activities.
55 53 59
(14) Having a ‘bottom up’ approach, with staff driving change/developing the framework.
52 55 47
(15) The ‘I Statements’ helping key local partners look at service provision from a patient/service user perspective.
49 52 44
(11) Having integrated IT systems. 49 45 56
(10) Having a relatively simple health and social care economy (e.g. one local authority and one CCG with co-terminus boundaries).
49 47 53
(5) Creating a shared culture across different professional groups.
46 38 63
(1) Being an ‘Integrated Care Pioneer’ helping bring together key local partner.
32 36 25
(3) The Better Care Fund helping bring together commissioners from the LA and the CCG.
26 22 34
(2) Being an ‘Integrated Care Pioneer’ keeping our work in the national spotlight.
19 22 12
(16) Support/expertise/advise provided by national partners (e.g. Monitor, NHS England, LGA).
18 19 16
(6) Integrating the health and social care workforce into a single management structure.
17 14 22
* Note: The numbers in ( ) refer to the facilitator statement numbers from the questionnaire. Base=96.
Overall, eleven facilitators were mentioned by around half or more of respondents as ‘very’ important. In the main, the facilitators identified as ‘very’ important are consistent with the barriers listed in Table 6.1. Thus, the importance of strong local leadership and involving local stakeholders (including local partners, service users and staff) are ‘very’ important facilitators and tended not to be identified as ‘very’ significant barriers (i.e. they were low down Table 6.1). This also aligns with the findings of the early evaluation which found that most facilitators were factors that could be influenced by local Pioneer actors. (Erens et al 2016)
14
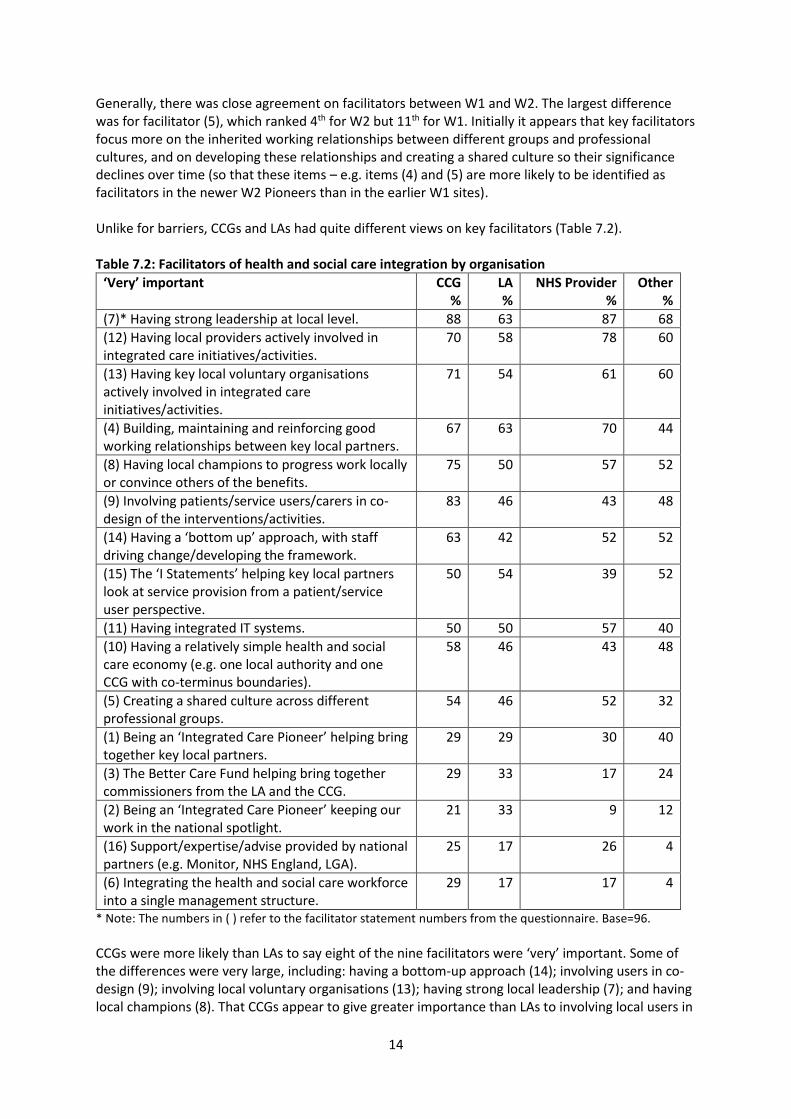
Generally, there was close agreement on facilitators between W1 and W2. The largest difference was for facilitator (5), which ranked 4th for W2 but 11th for W1. Initially it appears that key facilitators focus more on the inherited working relationships between different groups and professional cultures, and on developing these relationships and creating a shared culture so their significance declines over time (so that these items – e.g. items (4) and (5) are more likely to be identified as facilitators in the newer W2 Pioneers than in the earlier W1 sites). Unlike for barriers, CCGs and LAs had quite different views on key facilitators (Table 7.2). Table 7.2: Facilitators of health and social care integration by organisation
‘Very’ important CCG %
LA %
NHS Provider %
Other %
(7)* Having strong leadership at local level. 88 63 87 68
(12) Having local providers actively involved in integrated care initiatives/activities.
70 58 78 60
(13) Having key local voluntary organisations actively involved in integrated care initiatives/activities.
71 54 61 60
(4) Building, maintaining and reinforcing good working relationships between key local partners.
67 63 70 44
(8) Having local champions to progress work locally or convince others of the benefits.
75 50 57 52
(9) Involving patients/service users/carers in co-design of the interventions/activities.
83 46 43 48
(14) Having a ‘bottom up’ approach, with staff driving change/developing the framework.
63 42 52 52
(15) The ‘I Statements’ helping key local partners look at service provision from a patient/service user perspective.
50 54 39 52
(11) Having integrated IT systems. 50 50 57 40
(10) Having a relatively simple health and social care economy (e.g. one local authority and one CCG with co-terminus boundaries).
58 46 43 48
(5) Creating a shared culture across different professional groups.
54 46 52 32
(1) Being an ‘Integrated Care Pioneer’ helping bring together key local partners.
29 29 30 40
(3) The Better Care Fund helping bring together commissioners from the LA and the CCG.
29 33 17 24
(2) Being an ‘Integrated Care Pioneer’ keeping our work in the national spotlight.
21 33 9 12
(16) Support/expertise/advise provided by national partners (e.g. Monitor, NHS England, LGA).
25 17 26 4
(6) Integrating the health and social care workforce into a single management structure.
29 17 17 4
* Note: The numbers in ( ) refer to the facilitator statement numbers from the questionnaire. Base=96.
CCGs were more likely than LAs to say eight of the nine facilitators were ‘very’ important. Some of the differences were very large, including: having a bottom-up approach (14); involving users in co-design (9); involving local voluntary organisations (13); having strong local leadership (7); and having local champions (8). That CCGs appear to give greater importance than LAs to involving local users in

15
the co-design of integration activities is in line with the finding in section 4 that CCGs were more likely to say that local users etc. had been ‘very’ involved in the design of the Pioneer programme. One facilitator more commonly mentioned by LAs than CCGs was the contribution of Pioneer status to keeping their work in the national spotlight (2), which aligns with the view that LAs are less involved in other new integration initiatives like the Vanguards. In the same way as for barriers, respondents were given the option to type in other facilitators that supported the setting up and/or implementation of their Pioneer programme. About one-fifth of respondents typed in answers, which tended to be shorter than those given for barriers. A few of the open-ended responses are reproduced below. National drivers for integration in legislation e.g. Care Act and national planning guidance.
We use these to stress the importance of this work…. Good will and patience. Involvement of GPs has been crucial. Involving local people in the co-design and co-production of new integrated services. Freedom from QOF to allow focus on new agenda. Funding to support GP engagement.
Strong and accepted case for change. IG and data sharing protocols.
16
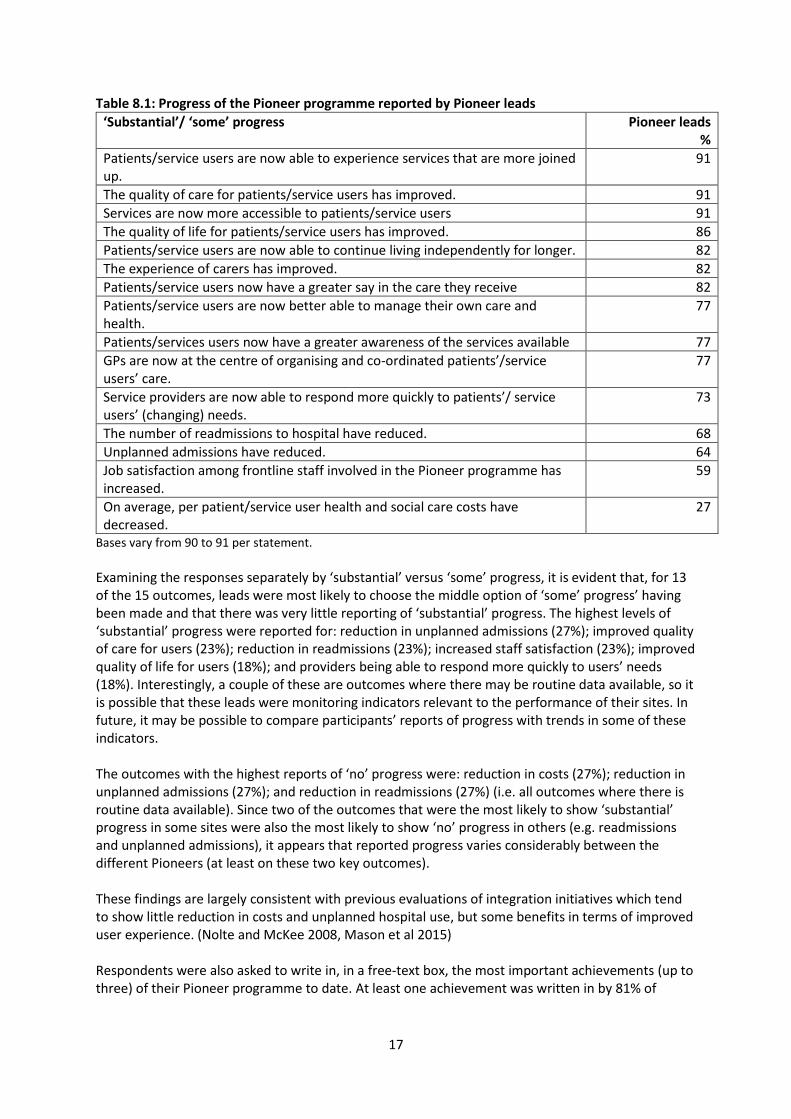
8. Progress of the Pioneer programme Respondents were asked whether working together between local health and social care organisations had already been substantially achieved prior to becoming a Pioneer. Just over half (56%) of respondents agreed with this statement, but most agreed somewhat (44%) rather than strongly (12%). There was little difference between CCGs (69%) and LAs (67%), but W2 was more likely to ‘agree’ than W1 (68% compared with 50%). Pioneer programmes were perceived as having strengthened working relationships between local health and social care organisations: overall 78% of respondents agreed (52% somewhat and 26% strongly). There was little difference between W1 (77%) and W2 (79%) or between CCGs (81%) and LAs (79%). The early evaluation found that W1 Pioneer activities in most areas were progressing, albeit at a slower pace than originally intended, and that there was only limited evidence of change in service delivery after the first 18 months despite the expectation that they would be able to get into delivery mode quickly. (Erens et al 2016) The survey aimed to provide initial quantitative data on this issue by asking respondents how much progress there had been to date with respect to 15 objectives or outcomes. For nearly all the statements, a substantial percentage of respondents said they did not know (DK) the degree of progress (ranging from 9% to 54%) and, for nearly all the statements, the percentage of DKs was higher for LAs than for CCGs. This large percentage of DKs is potentially a problem for sites, as not knowing the extent of progress was identified in the early evaluation as a barrier to progress, since one way of motivating staff to adopt a new initiative is to be able to demonstrate that it is having an effect. It is also a potential problem for evaluation. In the early evaluation, the research team spent a considerable amount of time attempting to obtain clarity from interviewees concerning the plans and initiatives of each Pioneer in order to be able to characterise different Pioneers. Because of the high percentage of DKs, in Table 8.1 we look at reported progress only for the 22 respondents completing the survey who described themselves as Pioneer leads, on the assumption that they would be the most likely to be aware of overall progress. (While there were still some DKs among the leads, the level was lower than for the full sample; it was highest for the objective of costs having decreased, at 46%.) Table 8.1 shows the 15 objectives/outcomes ranked in order of the most progress to date, as reported by leads. Overall, some progress was reported by at least half of leads for all outcomes except for cost reduction (only 27%), and by three-quarters of leads for 11 of the 15 outcomes. Leads report that Pioneers are making some progress in two of the three broad areas they are focusing on, i.e. improved user experience and improved quality of care, but not in the third area of reduced costs. What is noticeable is that leads are less likely to report progress for outcomes where routine data are available (e.g. for readmissions or unplanned admissions), and that the outcomes showing the most progress would appear to lack such ‘hard’ evidence/data (e.g. more accessible services, improved patient experience), although we do not know the extent to which the views expressed are based on evidence from local evaluations which may be collecting data on user experience.
17
Table 8.1: Progress of the Pioneer programme reported by Pioneer leads
‘Substantial’/ ‘some’ progress Pioneer leads %
Patients/service users are now able to experience services that are more joined up.
91
The quality of care for patients/service users has improved. 91
Services are now more accessible to patients/service users 91
The quality of life for patients/service users has improved. 86
Patients/service users are now able to continue living independently for longer. 82
The experience of carers has improved. 82
Patients/service users now have a greater say in the care they receive 82
Patients/service users are now better able to manage their own care and health.
77
Patients/services users now have a greater awareness of the services available 77
GPs are now at the centre of organising and co-ordinated patients’/service users’ care.
77
Service providers are now able to respond more quickly to patients’/ service users’ (changing) needs.
73
The number of readmissions to hospital have reduced. 68
Unplanned admissions have reduced. 64
Job satisfaction among frontline staff involved in the Pioneer programme has increased.
59
On average, per patient/service user health and social care costs have decreased.
27
Bases vary from 90 to 91 per statement.
Examining the responses separately by ‘substantial’ versus ‘some’ progress, it is evident that, for 13 of the 15 outcomes, leads were most likely to choose the middle option of ‘some’ progress’ having been made and that there was very little reporting of ‘substantial’ progress. The highest levels of ‘substantial’ progress were reported for: reduction in unplanned admissions (27%); improved quality of care for users (23%); reduction in readmissions (23%); increased staff satisfaction (23%); improved quality of life for users (18%); and providers being able to respond more quickly to users’ needs (18%). Interestingly, a couple of these are outcomes where there may be routine data available, so it is possible that these leads were monitoring indicators relevant to the performance of their sites. In future, it may be possible to compare participants’ reports of progress with trends in some of these indicators. The outcomes with the highest reports of ‘no’ progress were: reduction in costs (27%); reduction in unplanned admissions (27%); and reduction in readmissions (27%) (i.e. all outcomes where there is routine data available). Since two of the outcomes that were the most likely to show ‘substantial’ progress in some sites were also the most likely to show ‘no’ progress in others (e.g. readmissions and unplanned admissions), it appears that reported progress varies considerably between the different Pioneers (at least on these two key outcomes). These findings are largely consistent with previous evaluations of integration initiatives which tend to show little reduction in costs and unplanned hospital use, but some benefits in terms of improved user experience. (Nolte and McKee 2008, Mason et al 2015) Respondents were also asked to write in, in a free-text box, the most important achievements (up to three) of their Pioneer programme to date. At least one achievement was written in by 81% of
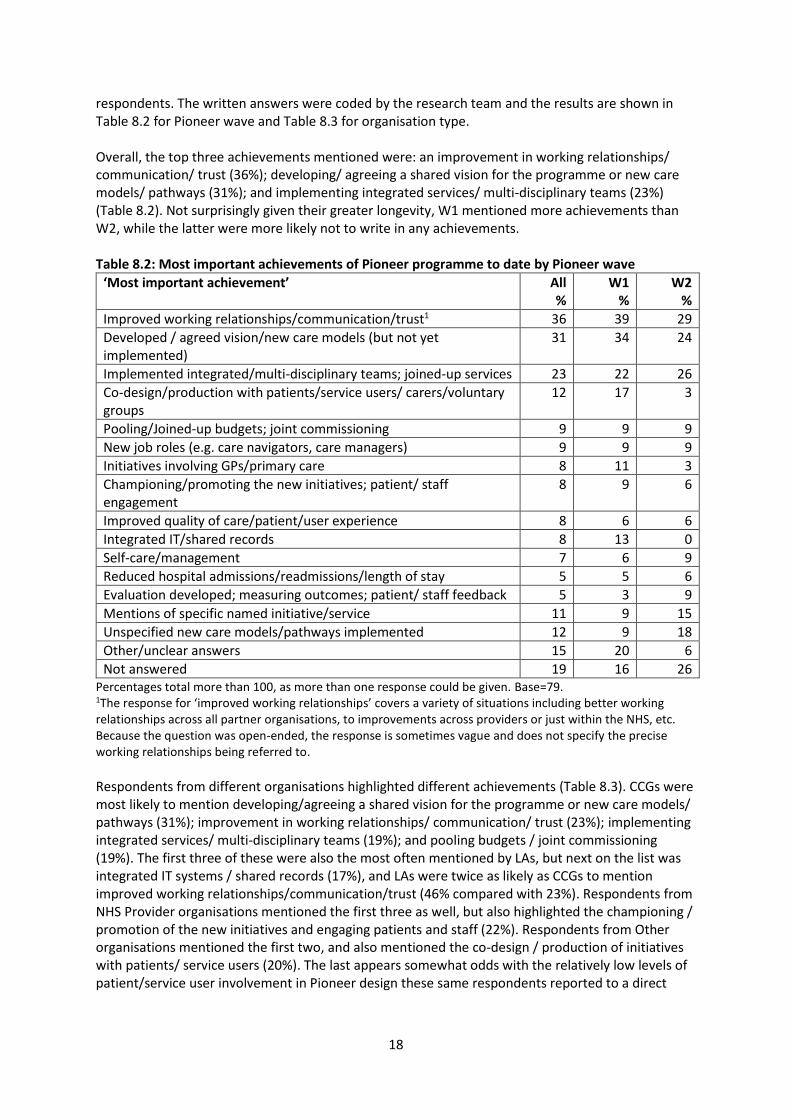
18
respondents. The written answers were coded by the research team and the results are shown in Table 8.2 for Pioneer wave and Table 8.3 for organisation type. Overall, the top three achievements mentioned were: an improvement in working relationships/ communication/ trust (36%); developing/ agreeing a shared vision for the programme or new care models/ pathways (31%); and implementing integrated services/ multi-disciplinary teams (23%) (Table 8.2). Not surprisingly given their greater longevity, W1 mentioned more achievements than W2, while the latter were more likely not to write in any achievements. Table 8.2: Most important achievements of Pioneer programme to date by Pioneer wave
‘Most important achievement’ All %
W1 %
W2 %
Improved working relationships/communication/trust1 36 39 29
Developed / agreed vision/new care models (but not yet implemented)
31 34 24
Implemented integrated/multi-disciplinary teams; joined-up services 23 22 26
Co-design/production with patients/service users/ carers/voluntary groups
12 17 3
Pooling/Joined-up budgets; joint commissioning 9 9 9
New job roles (e.g. care navigators, care managers) 9 9 9
Initiatives involving GPs/primary care 8 11 3
Championing/promoting the new initiatives; patient/ staff engagement
8 9 6
Improved quality of care/patient/user experience 8 6 6
Integrated IT/shared records 8 13 0
Self-care/management 7 6 9
Reduced hospital admissions/readmissions/length of stay 5 5 6
Evaluation developed; measuring outcomes; patient/ staff feedback 5 3 9
Mentions of specific named initiative/service 11 9 15
Unspecified new care models/pathways implemented 12 9 18
Other/unclear answers 15 20 6
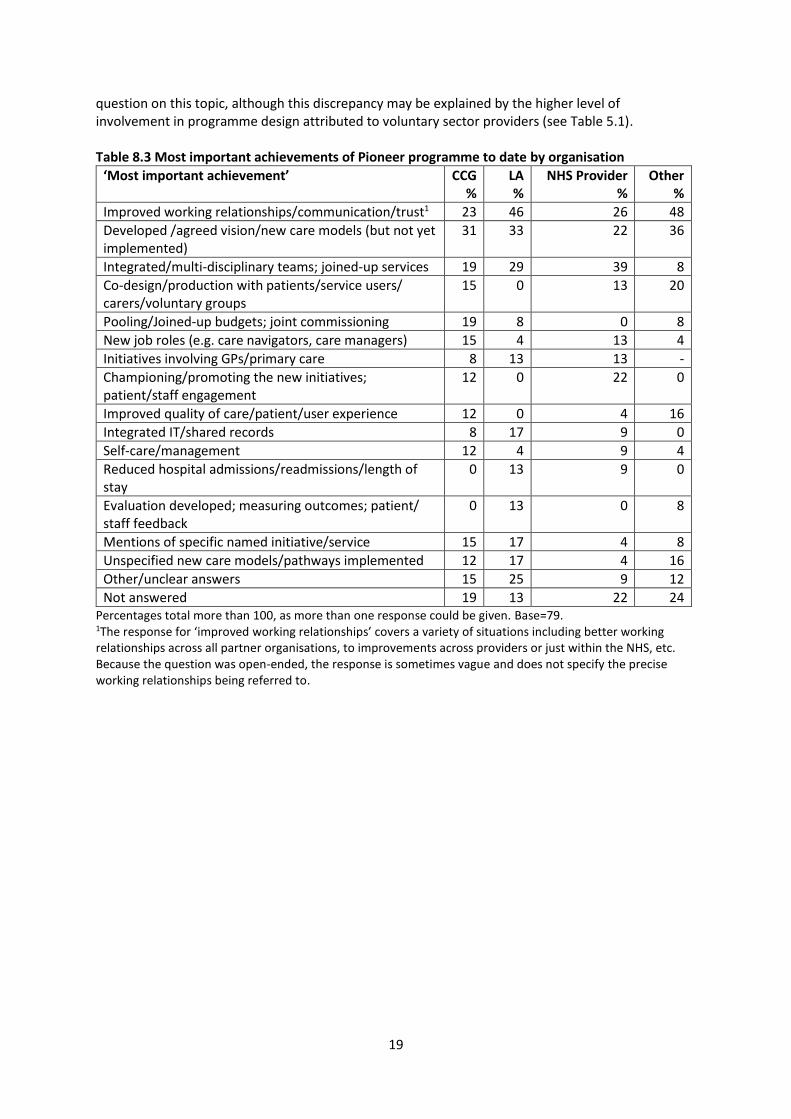
Not answered 19 16 26 Percentages total more than 100, as more than one response could be given. Base=79. 1The response for ‘improved working relationships’ covers a variety of situations including better working relationships across all partner organisations, to improvements across providers or just within the NHS, etc. Because the question was open-ended, the response is sometimes vague and does not specify the precise working relationships being referred to. Respondents from different organisations highlighted different achievements (Table 8.3). CCGs were most likely to mention developing/agreeing a shared vision for the programme or new care models/ pathways (31%); improvement in working relationships/ communication/ trust (23%); implementing integrated services/ multi-disciplinary teams (19%); and pooling budgets / joint commissioning (19%). The first three of these were also the most often mentioned by LAs, but next on the list was integrated IT systems / shared records (17%), and LAs were twice as likely as CCGs to mention improved working relationships/communication/trust (46% compared with 23%). Respondents from NHS Provider organisations mentioned the first three as well, but also highlighted the championing / promotion of the new initiatives and engaging patients and staff (22%). Respondents from Other organisations mentioned the first two, and also mentioned the co-design / production of initiatives with patients/ service users (20%). The last appears somewhat odds with the relatively low levels of patient/service user involvement in Pioneer design these same respondents reported to a direct
19
question on this topic, although this discrepancy may be explained by the higher level of involvement in programme design attributed to voluntary sector providers (see Table 5.1). Table 8.3 Most important achievements of Pioneer programme to date by organisation
‘Most important achievement’ CCG %
LA %
NHS Provider %
Other %
Improved working relationships/communication/trust1 23 46 26 48
Developed /agreed vision/new care models (but not yet implemented)
31 33 22 36
Integrated/multi-disciplinary teams; joined-up services 19 29 39 8
Co-design/production with patients/service users/ carers/voluntary groups
15 0 13 20
Pooling/Joined-up budgets; joint commissioning 19 8 0 8
New job roles (e.g. care navigators, care managers) 15 4 13 4
Initiatives involving GPs/primary care 8 13 13 -
Championing/promoting the new initiatives; patient/staff engagement
12 0 22 0
Improved quality of care/patient/user experience 12 0 4 16
Integrated IT/shared records 8 17 9 0
Self-care/management 12 4 9 4
Reduced hospital admissions/readmissions/length of stay
0 13 9 0
Evaluation developed; measuring outcomes; patient/ staff feedback
0 13 0 8
Mentions of specific named initiative/service 15 17 4 8
Unspecified new care models/pathways implemented 12 17 4 16
Other/unclear answers 15 25 9 12
Not answered 19 13 22 24 Percentages total more than 100, as more than one response could be given. Base=79. 1The response for ‘improved working relationships’ covers a variety of situations including better working relationships across all partner organisations, to improvements across providers or just within the NHS, etc. Because the question was open-ended, the response is sometimes vague and does not specify the precise working relationships being referred to.

20
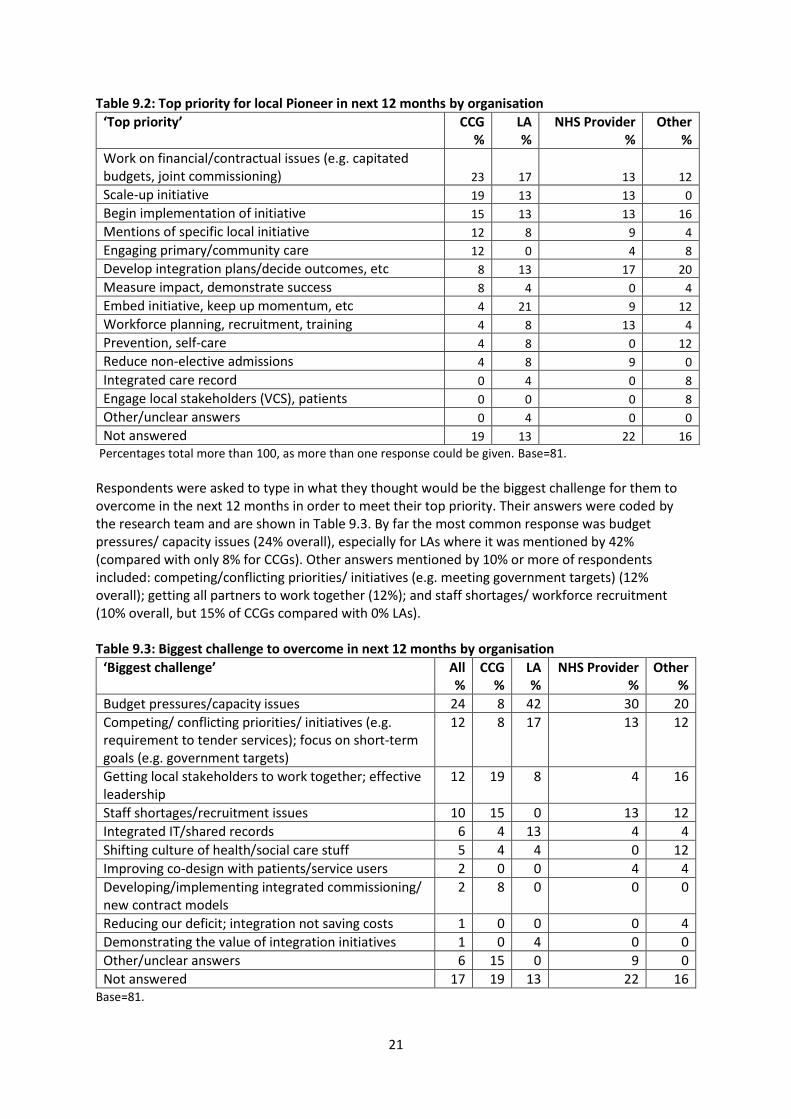
9. The next 12 months We asked all respondents what their own top priority would be over the next 12 months, how confident they were they would meet their priority, what would be the biggest challenge over the next year to meet this priority and whether they thought working together between local health and social care organisations would become more or less difficult during this period. Top priorities over the next year were typed in by respondents in free text boxes and coded by the research team. Overall, there were few differences between W1 and W2 respondents (Table 9.1), or between those from CCGs and LAs (Table 9.2). For W1 Pioneers, the priority mentioned most often (20%) was around financial/ commissioning issues (e.g. ‘capitation’, ‘pooled budgets’, ‘joint commissioning’). This was closely followed by keeping-up momentum on initiatives already started (16%), beginning implementation of new initiatives (14%) and further planning around integration (14%). These latter two categories were mentioned most often by W2 respondents, along with scaling-up initiatives that had already begun (15% for each of these three categories). LAs were more likely to mention embedding initiatives already begun (21% compared with 4% for CCGs), whereas CCGs were more likely to mention engaging primary or community care as a priority (12% compared with 0% for LAs). Perhaps an indication of the length of time that is needed to establish integration initiatives is the extent to which the priorities highlighted by respondents are largely to do with planning and implementation activities, and that very few identified their priority as measuring impact (overall 4%) or reducing non-elective admissions (overall 5%) (although this could be an artefact of the question wording which asked about their ‘own’ top priority rather than the priority for the Pioneer programme overall). Table 9.1: Top priority for local Pioneer in next 12 months by Pioneer wave
‘Top priority’ All %
W1 %
W2 %
Work on financial/contractual issues (e.g. capitated budgets, pooled budgets, joint commissioning)
16 20 9
Develop integration plans/decide outcomes, etc 14 14 15
Begin implementation of initiative 14 14 15
Embed initiative, keep up momentum, etc 11 16 3
Scale-up initiative 11 9 15
Mentions of specific local initiative 8 9 6
Workforce planning, recruitment, training 7 6 9
Engaging primary/community care 6 6 6
Prevention, self-care 6 6 6
Reduce non-elective admissions 5 6 3
Measure impact, demonstrate success 4 5 3
Integrated care record 3 2 6
Engage local stakeholders (VCS), patients 2 2 3
Other/unclear answers 1 2 0
Not answered 17 17 18 Percentages total more than 100, as more than one response could be given. Base=81.
In terms of being confident about meeting their top priority over the next year, 64% of all respondents (67% of Pioneer leads) said they were ‘very’ or ‘fairly’ confident, but this was considerably higher for W2 (76%) than W1 (57%). LAs were somewhat more confident than CCGs (81% and 73% respectively).
21
Table 9.2: Top priority for local Pioneer in next 12 months by organisation
‘Top priority’ CCG %
LA %
NHS Provider %
Other %
Work on financial/contractual issues (e.g. capitated budgets, joint commissioning) 23 17 13 12
Scale-up initiative 19 13 13 0
Begin implementation of initiative 15 13 13 16
Mentions of specific local initiative 12 8 9 4
Engaging primary/community care 12 0 4 8
Develop integration plans/decide outcomes, etc 8 13 17 20
Measure impact, demonstrate success 8 4 0 4
Embed initiative, keep up momentum, etc 4 21 9 12
Workforce planning, recruitment, training 4 8 13 4
Prevention, self-care 4 8 0 12
Reduce non-elective admissions 4 8 9 0
Integrated care record 0 4 0 8
Engage local stakeholders (VCS), patients 0 0 0 8
Other/unclear answers 0 4 0 0
Not answered 19 13 22 16
Percentages total more than 100, as more than one response could be given. Base=81.
Respondents were asked to type in what they thought would be the biggest challenge for them to overcome in the next 12 months in order to meet their top priority. Their answers were coded by the research team and are shown in Table 9.3. By far the most common response was budget pressures/ capacity issues (24% overall), especially for LAs where it was mentioned by 42% (compared with only 8% for CCGs). Other answers mentioned by 10% or more of respondents included: competing/conflicting priorities/ initiatives (e.g. meeting government targets) (12% overall); getting all partners to work together (12%); and staff shortages/ workforce recruitment (10% overall, but 15% of CCGs compared with 0% LAs). Table 9.3: Biggest challenge to overcome in next 12 months by organisation
‘Biggest challenge’ All %
CCG %
LA %
NHS Provider %
Other %
Budget pressures/capacity issues 24 8 42 30 20
Competing/ conflicting priorities/ initiatives (e.g. requirement to tender services); focus on short-term goals (e.g. government targets)
12 8 17 13 12
Getting local stakeholders to work together; effective leadership
12 19 8 4 16
Staff shortages/recruitment issues 10 15 0 13 12
Integrated IT/shared records 6 4 13 4 4
Shifting culture of health/social care stuff 5 4 4 0 12
Improving co-design with patients/service users 2 0 0 4 4
Developing/implementing integrated commissioning/ new contract models
2 8 0 0 0
Reducing our deficit; integration not saving costs 1 0 0 0 4
Demonstrating the value of integration initiatives 1 0 4 0 0
Other/unclear answers 6 15 0 9 0
Not answered 17 19 13 22 16 Base=81.
22
Below we provide a selection of the free text responses (n=81) that were provided in order to illustrate the types of challenges that are being faced on the ground. Examples of the most common response to do with budget pressures include: Funding is a major issue, with the CCG and local hospital trust in serious financial deficit
[and] with significant cuts to council budgets. Dealing with effects of social care cuts – hard to maintain a really comprehensive approach
when the council is losing so much money. The money! Examples of competing priorities/ initiatives include: Partners remaining focused and not distracted by meeting government targets…. The delivery of several key and possibly conflicting system demands: devolution … / System
Transformational Plans [sic]/…Keogh Review. Aligning our Integrated Care Pioneer programme with other local, regional and national
initiatives and policies. The range of the challenges of getting local stakeholders to work together is illustrated by the following: Effective leadership and involvement of all partners (at the right level and to the necessary
extent) to ensure effective and efficient implementation. Continuous joint working as equal partner between health and social care. For organisations to stop looking at the programme as a means to protecting their own
organisation…. GPs are not engaged in [AREA]… and whilst they have in theory completed care plans for the
integrated cohort of patients, this has clearly been a tick box exercise for them to receive payment.
Overall, 30% of respondents thought that working together would become more difficult over the next year, 36% said less difficult, and 33% said it would be the same as now. W1 respondents were twice as likely to be pessimistic as W2 respondents with 36% and 18%, respectively, saying that working together would become more difficult. Similarly, LAs were twice as pessimistic as CCGs, with 46% and 23%, respectively, saying that working together would become more difficult. This may well be a reflection of the worse financial position of LAs compared with CCGs.

23
10. Potential of national policies and national partners to help/support Pioneer activities We asked respondents whether each of eight national policies would be very/fairly helpful or very/ fairly unhelpful for delivering their integrated care programme. Ranked by order of helpfulness overall, these eight policies were: Table 10.1: Helpfulness of national policies for delivering integrated care programme by organisation
‘Very’/‘fairly’ helpful All %
CCG %
LA %
NHS Provider %
Other %
Vanguards/New Models of Care/Five Year Forward View
74 83 86 67 62
Better Care Fund (BCF) 61 65 64 48 67
Integrated Personal Commissioning (IPC) Programme
44 48 68 29 33
Devolution of powers to LAs 39 43 55 33 25
Government commitment to NHS 7-day working 37 35 73 19 21
Proactive Care Programme 33 35 41 29 29
Hospital ‘payment by results’ funding system 16 13 23 10 17
Purchaser-provider split in the NHS 13 13 23 0 17 Base=90.
Overall, only two of the policies were recognised by half or more respondents as being helpful to local integration activities (Vanguards/New Models of Care and the BCF). This was also the case for respondents from CCGs. However, more than half of LA respondents also cited three other policies as being helpful: NHS 7-day working (73%); IPC programme (68%) and LA devolution (55%). Generally, respondents from CCGs and LAs had similar views about these national policies being helpful, with two exceptions, both of which were more likely to be reported as helpful by LA respondents (IPC programme and NHS 7-day working). The 73% of LA respondents mentioning NHS 7-day working was over twice as high as for CCGs (35%) and about four times as high as respondents in the ‘NHS Provider’ category. The reason why LA respondents expressed such a positive view of NHS 7-day working is not self-evident to the evaluation team and may be explored further in the next stages of the evaluation. It is also interesting that 16% of respondents stated that hospital ‘payment by results’, normally regarded as a barrier to integrated working, was helpful to the furtherance of integrated care activities. This was especially so for LA respondents (23%). It is also unclear why the NHS purchaser-provider split should be seen as helpful by 23% of LA respondents. Respondents were asked to type in whether there were other national policies that were helpful or unhelpful to integrated care. Policies mentioned by more than one respondent as being helpful included the Care Act, and Sustainability and Transformation Plans (STPs). On the other hand, these two policies were also mentioned as being unhelpful by a number of respondents, along with funding cuts, and policies that restrict information sharing. Respondents were asked to type in what support they would like from national partners over the next 12 months. The answers were coded by the research team and are shown in Table 10.2. There was quite a spread of responses, ranging from the general (‘continue with the message of need to change’) to more specific requests (e.g. ‘straighten out IG rules’, ‘support nationally in recruitment’, ‘support work on payments, contracting and procurement’). Most commonly asked for, especially by LAs (33%) was to share evidence on what works (‘case studies about what has worked for others’, ‘examples of best practice’). Another common request among both CCGs and LAs was to provide
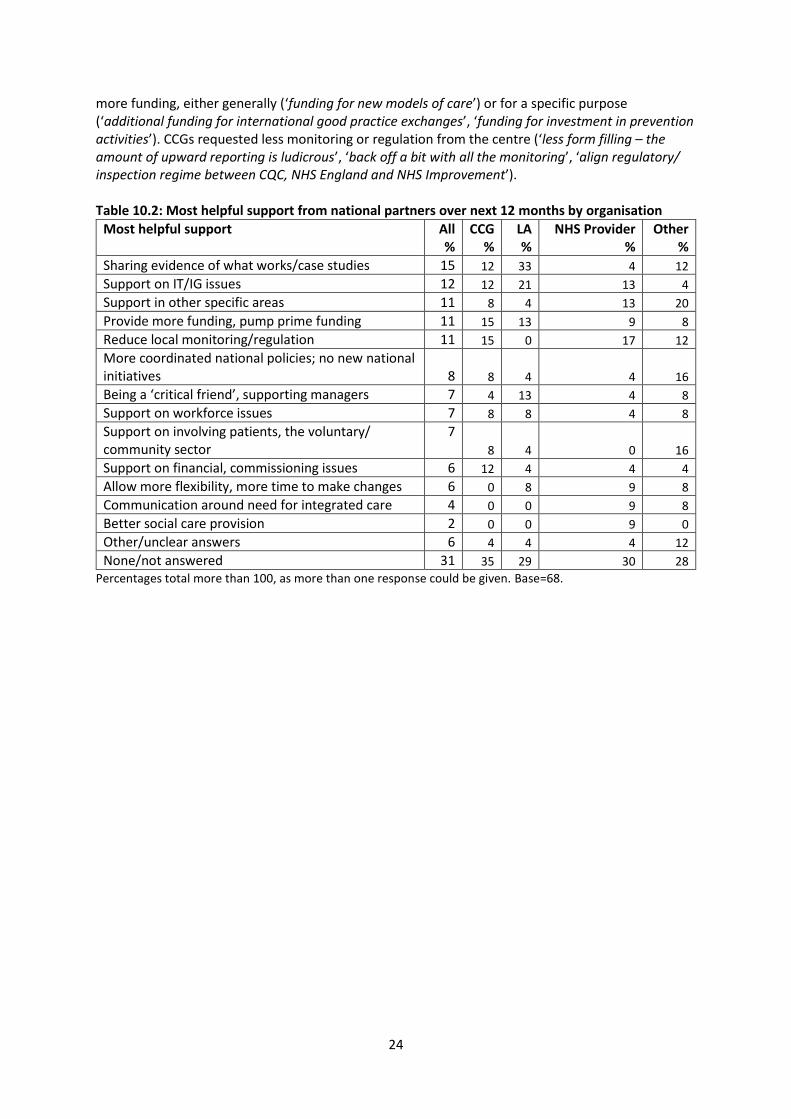
24
more funding, either generally (‘funding for new models of care’) or for a specific purpose (‘additional funding for international good practice exchanges’, ‘funding for investment in prevention activities’). CCGs requested less monitoring or regulation from the centre (‘less form filling – the amount of upward reporting is ludicrous’, ‘back off a bit with all the monitoring’, ‘align regulatory/ inspection regime between CQC, NHS England and NHS Improvement’). Table 10.2: Most helpful support from national partners over next 12 months by organisation
Most helpful support All %
CCG %
LA %
NHS Provider %
Other %
Sharing evidence of what works/case studies 15 12 33 4 12
Support on IT/IG issues 12 12 21 13 4
Support in other specific areas 11 8 4 13 20
Provide more funding, pump prime funding 11 15 13 9 8
Reduce local monitoring/regulation 11 15 0 17 12
More coordinated national policies; no new national initiatives
8 8 4 4 16
Being a ‘critical friend’, supporting managers 7 4 13 4 8
Support on workforce issues 7 8 8 4 8
Support on involving patients, the voluntary/ community sector
7
8 4 0 16
Support on financial, commissioning issues 6 12 4 4 4
Allow more flexibility, more time to make changes 6 0 8 9 8
Communication around need for integrated care 4 0 0 9 8
Better social care provision 2 0 0 9 0
Other/unclear answers 6 4 4 4 12
None/not answered 31 35 29 30 28
Percentages total more than 100, as more than one response could be given. Base=68.

25
11. Conclusions PIRU has now carried out four stages of data collection as part of its evaluation of the Integrated Care Pioneers:
1) In spring-summer 2014, 140 semi-structured interviews were carried out with all 14 W1 Pioneers;
2) In spring 2015, 57 semi-structured interviews were carried out with the 14 W1 Pioneers (mainly with people who were also interviewed in 2014, but with some new interviewees as well);
3) Over winter 2015-16, another stage of semi-structured interviews were carried out with Pioneer leads and other key stakeholders, involving 22 individuals from W1 sites and 31 from W2 sites.
4) In spring 2016, a structured questionnaire was completed by 98 key informants from all 25 W1 and W2 Pioneers (many of the W1 key informants were also part of the earlier stages of data collection). The plan is to repeat this key informant survey on a regular basis for the next three years).
Despite the differences in approach between the semi-structured interviews carried out between spring 2014 and early 2016 and the key informant survey in spring 2016, there was considerable overlap in the topics covered at all these stages, so we are able to look at the progress of the W1 Pioneers over their first two years and to provide some sense of scale of the various issues raised during the first two stages – for example, we identified a large number of barriers and facilitators to integrated care arising from the earlier semi-structured interviews, but were not in a position to quantify how common they were until the survey was carried out in 2016 (bearing in mind the provisos mentioned in Section 2 with regard to interpretation of the survey results). Below we summarise a few key points based on a look back over these two years of data collection for the W1 Pioneers, focusing mainly on barriers, facilitators and progress of integrated care initiatives during this period. (Full results from the early stages of the evaluation among the W1 Pioneers is found in Erens et al 2016.) We previously reported that by summer 2015, the W1 Pioneers were very much in the early stages of implementing their integration plans, and the results of our survey one year later suggest that, while further progress had been made, there is little evidence that progress has been significant. For example, as described in Section 8, Pioneer ‘leads’ (covering both W1 and W2 sites) reported ‘some’ progress for 13 of the 15 outcomes asked about, but gave few reports of ‘substantial’ progress being delivered. This message is reinforced by the identification of their most important achievements to date, of items to do with ‘process’ and implementation, such as planning/ agreeing vision for integration or new care models (34% of W1 respondents), or improved working relationships (39%). By contrast, very few respondents identified as achievements items to do with outcomes, such as reduced hospital admissions (5% of W1) or improved quality of care or user experience (6% of W1). Even two years after becoming a Pioneer, it appears that there was still a lot of work to be done in terms of embedding, or even initially implementing in some areas, integration initiatives. Moreover, the outlook over the coming year is not exactly encouraging, as it seems the longer the time spent trying to integrate services, the more pessimistic staff become: thus, W1 respondents were both more pessimistic than those from W2 about meeting their top priority over the coming year, and more likely to express the view that working together between local health and social care would become more difficult during this period. Part of the explanation for the slow progress is due to the persistence of quite a large number of barriers to integration, the majority of which are outside the control of Pioneers. For example, over
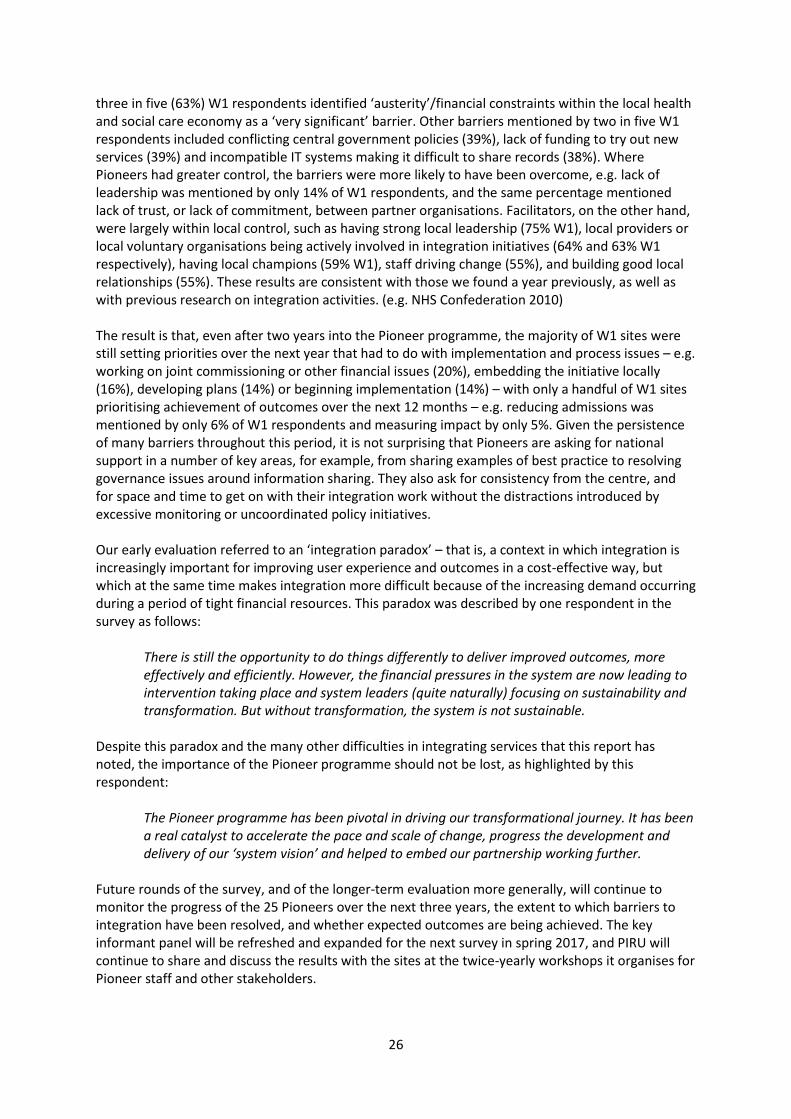
26
three in five (63%) W1 respondents identified ‘austerity’/financial constraints within the local health and social care economy as a ‘very significant’ barrier. Other barriers mentioned by two in five W1 respondents included conflicting central government policies (39%), lack of funding to try out new services (39%) and incompatible IT systems making it difficult to share records (38%). Where Pioneers had greater control, the barriers were more likely to have been overcome, e.g. lack of leadership was mentioned by only 14% of W1 respondents, and the same percentage mentioned lack of trust, or lack of commitment, between partner organisations. Facilitators, on the other hand, were largely within local control, such as having strong local leadership (75% W1), local providers or local voluntary organisations being actively involved in integration initiatives (64% and 63% W1 respectively), having local champions (59% W1), staff driving change (55%), and building good local relationships (55%). These results are consistent with those we found a year previously, as well as with previous research on integration activities. (e.g. NHS Confederation 2010) The result is that, even after two years into the Pioneer programme, the majority of W1 sites were still setting priorities over the next year that had to do with implementation and process issues – e.g. working on joint commissioning or other financial issues (20%), embedding the initiative locally (16%), developing plans (14%) or beginning implementation (14%) – with only a handful of W1 sites prioritising achievement of outcomes over the next 12 months – e.g. reducing admissions was mentioned by only 6% of W1 respondents and measuring impact by only 5%. Given the persistence of many barriers throughout this period, it is not surprising that Pioneers are asking for national support in a number of key areas, for example, from sharing examples of best practice to resolving governance issues around information sharing. They also ask for consistency from the centre, and for space and time to get on with their integration work without the distractions introduced by excessive monitoring or uncoordinated policy initiatives. Our early evaluation referred to an ‘integration paradox’ – that is, a context in which integration is increasingly important for improving user experience and outcomes in a cost-effective way, but which at the same time makes integration more difficult because of the increasing demand occurring during a period of tight financial resources. This paradox was described by one respondent in the survey as follows: There is still the opportunity to do things differently to deliver improved outcomes, more
effectively and efficiently. However, the financial pressures in the system are now leading to intervention taking place and system leaders (quite naturally) focusing on sustainability and transformation. But without transformation, the system is not sustainable.
Despite this paradox and the many other difficulties in integrating services that this report has noted, the importance of the Pioneer programme should not be lost, as highlighted by this respondent: The Pioneer programme has been pivotal in driving our transformational journey. It has been
a real catalyst to accelerate the pace and scale of change, progress the development and delivery of our ‘system vision’ and helped to embed our partnership working further.
Future rounds of the survey, and of the longer-term evaluation more generally, will continue to monitor the progress of the 25 Pioneers over the next three years, the extent to which barriers to integration have been resolved, and whether expected outcomes are being achieved. The key informant panel will be refreshed and expanded for the next survey in spring 2017, and PIRU will continue to share and discuss the results with the sites at the twice-yearly workshops it organises for Pioneer staff and other stakeholders.

27
Since the Pioneers were launched at the end of 2013, there have been a number of other initiatives which aim to integrate health and social care, most notably the New Care Model Vanguards and the Sustainability and Transformation Plans, which are due to begin implementation within the next few months. Moreover, every part of England has been asked to draw up a plan in 2017 to integrate health and social care by 2020. (HM Treasury 2015) Since the Pioneers are the forerunners, and most advanced, of these more recent initiatives, our continuing evaluation provides an opportunity for learning that can be utilised not just by the Pioneers themselves, but also by the health and social care sector as a whole as the move towards greater integration throughout the country gathers pace.
28
References
Alltimes G, Varnam R. (2012) Integration: a report from the NHS Future Forum. London: Department of Health. https://www.gov.uk/government/uploads/system/uploads/attachment_data/file/216425/dh_132023.pdf Audit Commission. (2011) Joining up health and social care: improving value for money across the interface. London: Audit Commission. http://archive.audit-commission.gov.uk/auditcommission/sitecollectiondocuments/Downloads/vfmhscinterface.pdf Audit Commission. (2009) Means to an end: joint financing across health and social care. London: Audit Commission. http://archive.auditcommission.gov.uk/auditcommission/SiteCollectionDocuments/AuditCommissionReports/NationalStudies/meanstoanend291009repv2.pdf Department of Health. (2013, May) Letter inviting expressions of interest for health and social care integration ‘pioneers’. https://www.gov.uk/government/publications/social-care-integration-pioneers Department of Health. (2013, November) Integration pioneers leading the way for health and care reform, Press Release. https://www.gov.uk/government/news/integration-pioneers-leading-the-way-for-health-and-care-reform--2 Department of Health. (2015) Integrated health and social care programme expanded. https://www.gov.uk/government/news/integrated-health-and-social-care-programme-expanded
Erens B, Wistow G, Mounier-Jack S, Douglas N, Jones L, Manacorda T, Mays N. (2016) Early evaluation of the Integrated Care and Support Pioneers programme. Final Report. London: Policy Innovation Research Unit. http://www.piru.ac.uk/assets/files/Early_evaluation_of_IC_Pioneers_Final_Report.pdf Goodwin N, Smith, J, Davies A, Perry C, Rosen R, Dixon A, Dixon J, Ham C. (2012) Integrated care for patients and populations: improving outcomes by working together. London: The King’s Fund and the Nuffield Trust. http://www.kingsfund.org.uk/sites/files/kf/integrated-care-patients-populations-paper-nuffield-trust-kings-fund-january-2012.pdf HM Treasury. (2015) Spending review and autumn statement 2015. https://www.gov.uk/government/publications/spending-review-and-autumn-statement-2015-documents/spending-review-and-autumn-statement-2015 Institute for Health Care Improvement. (2014) IHI Triple Aim Initiative. http://www.ihi.org/Engage/Initiatives/TripleAim/pages/default.aspx Mason A, et al (2015) Integrating funds for health and social care: an evidence review, J Health Serv Res Policy, published online 16 January, 2015. NHS Confederation. (2010) Where next for health and social care integration? Discussion Paper 8. London: NHS Confederation. http://www.nhsconfed.org/resources/2010/06/where-next-for-health-and-social-care-integration

29
NHS England and Partners. (2014) Five year forward view. London: NHS England, Public Health England, Monitor, Health Education England, the Care Quality Commission and the NHS Trust Development Authority. www.england.nhs.uk/wp-content/uploads/2014/10/5yfv-web.pdf National Collaboration for Integrated Care and Support (2013, May). Integrated care and support: our shared commitment. https://www.gov.uk/government/uploads/system/uploads/attachment_data/file/198748/DEFINITIVE_FINAL_VERSION_Integrated_Care_and_Support_-_Our_Shared_Commitment_2013-05-13.pdf Nolte E, McKee M. (2008) Integration and chronic care: a review. In Nolte E, McKee M. (eds) Caring for people with chronic conditions: a health system perspective. World Health Organisation.

30
Appendix A: First key informant survey questionnaire Evaluation of the Integrated Care & Support Pioneers: Survey of Key Informants (This is an edited version and does not represent how the questions appear on a computer screen.)
Q1 The Policy Innovation Research Unit (PIRU) at the London School of Hygiene & Tropical Medicine (LSHTM) is undertaking this survey as part of its evaluation of integration activities within the 25 sites selected as Integrated Care & Support Pioneers. We are approaching key managers, professionals and others involved in each Integrated Care Pioneer in order to obtain their views on how health and social care integration is progressing in their area so that we may better understand what facilitates and hinders progress. This is your chance to contribute to the evidence base for integration and to have your say about integration activities in your area and how they are affected by national policies. Responses to the survey are strictly confidential. No-one outside the research team will be able to see your completed questionnaire or to identify your individual responses. No individual, organisation or Pioneer will be identified when we report on the survey results. If you have any questions or comments about the survey, please contact …. The survey should take about 20-25 minutes to complete. If you can't complete it in one sitting, it will save your answers so you can return to it at another time. Completing the survey is entirely voluntary and you may withdraw at any stage. Thank you for your help with this important survey. To continue with the survey, please click 'I agree to take part in the survey' below. I agree to take part in the survey (1)

31
Q2 What type of organisation do you work for or represent? Please select one only. Clinical Commissioning Group (CCG) (1) Local Authority - Social Services (2) Local Authority - Public Health (3) Local Authority - Other (4) Joint appointment between CCG and Local Authority (5) NHS or Foundation Trust (acute) (6) Mental Health Trust (7) Community Health Trust (8) Care Trust (9) Voluntary or Community Organisation (10) General Practice / Primary Care (11) Private provider (please type in below) (12) ____________________ Patient / service user / carer/ citizen (that is, not employed by any of the above organisations)
(for example, Healthwatch member) (13) Other (please type in) (14) ____________________ Q3 Which of the following job titles best describes your own situation within this organisation? Select more than one if appropriate. Pioneer Lead / Coordinator (1) Chief Executive / Accountable Officer (2) Director / Assistant Director (3) Locality Manager (4) Commissioning Officer (5) Finance Officer (6) Other Senior Manager (7) Health Care Professional (Clinical) (8) Health or Social Care Professional (Non-clinical) (9) Other (please type in) (10) ____________________ Q4 Which statement below best describes the responsibilities of your post? Please select one only. Strategic, if you have responsibilities for planning and development of services, such as change
management, commissioning, strategic development (1) Operational, if you have prime responsibility for service delivery (2) Combination of strategic and operational responsibilities (3) Direct / 'frontline' delivery of care or services to patients / service users (4) Other (please type in) (5) ____________________

32
Q5 How long have you been in your current post? Please type in years and months. Q6 How long have you been working with your current employer? Please type in years and months. Q7 Which Integrated Care Pioneer is your employer part of? Please select one only Airdale, Wharfdale and Craven (1) Barnsley (2) Blackpool and Fylde Coast (3) Camden (4) Cheshire ("Connecting Care Across Cheshire") (5) Cornwall ("Living Well") (6) East London (WEL) (7) Greater Manchester (8) Greenwich ("Royal Greenwich Coordinated Care") (9) Islington (10) Kent (11) Leeds (12) Nottingham City (13) Nottingham County (14) North West London ("Whole Systems Integrated Care") (15) Sheffield (Integrated Commissioning Programme) (16) South Devon and Torbay (17) South Somerset ("Symphony Project") (18) South Tyneside (19) Southend (20) Staffordshire & Stoke ("Transforming Cancer and End of Life Care") (21) Vale of York (22) Wakefield ("Connecting Care") (23) West Norfolk (24) Worcestershire ("Well Connected") (25) Q8 And how long have you been working in the geographical area covered by the (NAME) Integrated Care Pioneer? Please type in years and months.

33
Q9 The following questions relate to the Integrated Care & Support Pioneer programme in your area. Below are a number of statements about how the phrase "Integrated Care Pioneer" is used and understood within different areas. Please say whether you agree or disagree with each statement in terms of your Pioneer area. (Codes: Strongly agree (1); Somewhat agree (2); Neither agree or disagree (3); Somewhat disagree (4); Strongly disagree (5); Don’t know(6)) (1) The majority of senior staff within my organisation are aware of the initiatives or activities that fall within our Pioneer programme. (2) Local partners don't generally use the term "Integrated Care Pioneer" to refer to our local integration initiatives or activities. (3) Our Pioneer programme is only a small part of a much wider set of integrated care initiatives or activities within our area. (4) The term "Integrated Care Pioneer" is no longer (considered) relevant or appropriate for the integration initiatives or activities in our area. Working together Q10 Prior to becoming an Integrated Care Pioneer in (NAME), would you agree that working together effectively had already been substantially achieved between local health and social care organisations? Strongly agree (1) Somewhat agree (2) Neither agree nor disagree (3) Somewhat disagree (4) Strongly disagree (5) Don't know (6) Q11 Thinking of the working arrangements within your Integrated Care Pioneer programme, would you agree that working together between local health and social care organisations has been strengthened by the Pioneer programme? Strongly agree (1) Somewhat agree (2) Neither agree nor disagree (3) Somewhat disagree (4) Strongly disagree (5) Don't know (6) Q12 Over the next year, do you expect working together between local health and social care organisations to become more difficult, less difficult, or to be about the same as now? Much more difficult (1) Somewhat more difficult (2) Somewhat less difficult (3) Much less difficult (4) Same as now (5) Don't know (6)

34
Barriers and facilitators Q13 The following may be potential barriers to health and social care services working together effectively. For each statement, please indicate the extent to which these barriers or challenges may have affected the setting up and/or implementation of your integrated health and social care programme. (Codes: Very significant barrier (1); Fairly significant barrier (2); Not current a significant barrier (3); Don’t know (4)) (1) A lack of trust and confidence between partner organisations. (2) The number of partner organisations involved in our integrated care programme. (3) The different cultures of the partner organisations. (4) GPs not fully committed to our integrated care programme. (5) A lack of commitment from one or more partner organisations. (6) Lack of a shared vision for our integrated care programme. (7) Significant financial constraints within the local health and social care economy. (8) The dominance of one organisation preventing an equal partnership. (9) Insufficient leadership of our integrated care programme. (10) Too many competing demands for time or resources reducing the focus on working together. (11) Local providers competing for contracts rather than working together. (12) Acute services that are not fully engaged with our integrated care programme. (13) Information governance regulations making it difficult to share patient / service user information. (14) Incompatible IT systems making it difficult to share patient / service user information. (15) Lack of additional funding makes it difficult to try out innovative services. (16) One or more partner organisations having difficulty tracking health or social care costs. (17) Reluctance of commissioning organisations to pool their budgets. (18) Working out realistic financial savings that could be achieved. (19) Agreeing risk sharing arrangements between partner organisations. (20) De-commissioning existing services. (21) Shortages of frontline staff with the right skills. (22) Different governance structures in the CCG and the Local Authority making it difficult to align decision-making or priorities between these organisations. (23) Managers / staff being too 'risk averse'. (24) Deciding key service outcomes. (25) Not being able to demonstrate effectiveness of new or re-designed services. (26) Increased demand for existing services. (27) Conflicting central government policy or priorities. Q14 Please type in any other significant barriers or challenges that have affected the setting-up and/or implementation of your integrated health and social care programme that were not mentioned in the list above.

35
Q15 To date, how important have the following enablers / facilitators been in supporting the setting up and/or implementation of your integrated health and social care programme? (Codes: Very important (1); Fairly important (2); Not very important (3); Not at all important (4); Don’t know (5)) (1) Being an 'Integrated Care Pioneer' helping bring together key local partners. (2) Being an 'Integrated Care Pioneer' keeping our work in the national spotlight. (3) The Better Care Fund (BCF) helping bring together commissioners from the Local Authority and the CCG. (4) Building, maintaining and reinforcing good working relationships between key local partners. (5) Creating a shared culture across different professional groups. (6) Integrating the health and social care workforce into a single management structure. (7) Having strong leadership at local level. (8) Having local champions to progress work locally or convince others of the benefits. (9) Involving patients / service users / carers in co-design of the interventions / activities. (10) Having a relatively simple health and social care economy (for example, one Local Authority and one CCG with co-terminous boundaries). (11) Having integrated IT systems. (12) Having local providers actively involved in integrated care initiatives / activities. (13) Having key local voluntary organisations actively involved in integrated care initiatives / activities. (14) Having a 'bottom up' approach, with staff driving change/ developing the framework. (15) The 'I Statements' helping key local partners look at service provision from a patient / service user perspective. (16) Support / expertise / advice provided by national partners (for example, Monitor, NHS England, Local Government Association, etc). Q16 Please type in any other enablers / facilitators that have been important in supporting the setting up and/or implementation of your integrated health and care programme that were not mentioned in the list above.
36
Design and progress of Pioneer Q17 How involved have (relevant) local commissioners been in the design of your Integrated Care Pioneer programme to date? (Codes: Very involved (1); Somewhat involved (2); Not at all involved (3); Not applicable (4); Don’t know (5)) CCG? Local authority - social services? Local authority - public health? Local authority - other (such as housing, education, etc)? (please type in) Q18 How involved have (relevant) local providers been in the design of your Integrated Care Pioneer programme to date? (Codes: Very involved (1); Somewhat involved (2); Not at all involved (3); Not applicable (4); Don’t know (5)) General practice / primary care? Acute trusts? Mental health trusts? Community health trusts? Local authority - adult social care provider? Voluntary and community sector providers? Private sector providers? Other local provider (such as ambulance trusts)? (please type in) Q19 How involved have the groups below been in the design of your Integrated Care Pioneer programme to date? (Codes: Very involved (1); Somewhat involved (2); Not at all involved (3); Not applicable (4); Don’t know (5)) Voluntary and community organisations representing patients / service users / carers / local population? Individual patients / service users? Individual carers? Direct involvement of the local population? Elected members / local councillors? Local Medical Committee? Other local professional bodies? Frontline staff? Q20 Do you agree or disagree with the following statement: Our Integrated Care Pioneer programme is fully consistent with the local strategy for health and social care. Strongly agree (1) Somewhat agree (2) Neither agree nor disagree (3) Somewhat disagree (4) Strongly disagree (5) Don't know (6)

37
Q21 The following statements are about the progress of your Integrated Care Pioneer programme. For each statement, please indicate how much progress to date there has been. Since becoming an Integrated Care Pioneer in (NAME) ... (Codes: Substantial progress (1); Some progress (2); No progress (3); Don’t know(4)) (1) ...patients / service users now have greater awareness of the services available. (2) ...services are now more accessible to patients / service users. (3) ...patients / service users now have a greater say in the care they receive. (4) ...patients / service users are now better able to manage their own care and health. (5) ...patients / service users are now able to continue living independently for longer. (6) ...the quality of life for patients / service users has improved. (7) ...the quality of care for patients / service users has improved. (8) ...the experience of carers has improved. (9) ...job satisfaction among frontline staff involved in the Pioneer programme has increased. (10) ...service providers are now able to respond more quickly to patients' / service users' (changing) needs. (11) ...unplanned admissions have reduced. (12) ...the number of readmissions to hospital have reduced. (13) ...on average, per patient / service user health and social care costs have decreased. (14) ...GPs are now at the centre of organising and co-ordinating patients' / service users' care. (15) ...patients / service users are now able to experience services that are more 'joined up'. Q22 What have been the most important achievements of your Integrated Care Pioneer to date? Please type in up to 3 achievements.
Most important (1)_________________ Second most important (2)__________ Third most important (3)____________
38
Q23 Other policies and initiatives Do you think the following national policies will be helpful or unhelpful for delivering your integrated health and social care programme? (Codes: Very helpful (1); Fairly helpful (2); Neither (3); Fairly unhelpful (4); Very unhelpful (5); Don’t know (6)) (1) Better Care Fund. (2) Vanguards / New models of care / Five year forward view. (3) Hospital 'payment by results' funding system. (4) The purchaser - provider split in the NHS. (5) Proactive Care Programme (6) Integrated Personal Commissioning Programme (7) Devolution of powers to Local Authorities (e.g. DevoManc, Cornwall, etc.) (8) Government commitment to NHS 7-day working? Q24 If there are other national policies that may have a helpful or unhelpful impact on your integrated health and social care programme, please type them in here.
Helpful impact (1) Unhelpful impact (2)
The next 12 months Q25 What do you consider the top priority for your Integrated Care Pioneer programme over the next 12 months? Please type in Q26 How confident are you that your Integrated Care Pioneer programme will meet this priority over the next 12 months? Very confident (1) Fairly confident (2) Not very confident (3) Not at all confident (4) Don't know (5) Q27 What will be the biggest challenge to overcome in the next 12 months in order to meet this priority? Please type in Q28 What support from the national partners would be most helpful to you over the next 12 months? Please type in Q29 Please type in any other comments you would like to make about your Integrated Care Pioneer programme.

39
Appendix B: Code frames for open ended questions Q22 Most important achievements (Code up to 3 answers)
1 Improved working relationships/communication; greater commitment/engagement of staff; partners/staff working together; provider alliance; increased trust
2 Planning/developing/agreed vision/strategy/new care models/pathways/framework/ outcomes – this refers to planning/agreeing an approach, but not yet implementing it
3 Integrated teams/care/partners/MDTs (i.e. include specific mentions of ‘integration’
here); joined-up services; integrated health and social care; co-location of teams (except integration to do with financial matters which is code 5)
4 Integration initiatives that specifically mention GPs/primary care
5 Joined-up/pooling budgets/commissioning; joint commissioning; alliance contracting; understanding service costs
6 Co-design/co-production with patients; involving community/patients/carers/voluntary groups
7 Introduction/piloting of new roles (e.g. care navigators, care managers, care delivery groups, community support workers)
8 Championing/promoting/sharing the new approach/initiatives/leadership; engaging staff/patients
9 Reduced hospital admissions/length of stay/readmissions/transfers of care
10 Improved quality of care/patient experience; improved response times; improved care planning; culture of patient centred care
11 Integrated IT/shared care records/data sets
12 Self-care/management/prevention/greater independence for patients
13 Blank – code not used
14 Evaluation plans/strategy developed; obtaining patient/staff feedback; measuring outcomes
15 Mentions of specific named programmes/services
16 New care models/pathways piloted/implemented (but not specific enough to use codes above)
17 Other/unclear answers not coded above 99 Not answered
40
Q25 Top priority over next 12 months (Code up to 2 answers)
1 Increase awareness/understanding of integration plans or of health and social care system change; develop plans for integration/new models of care; agreeing outcomes/risk sharing arrangements
2 Move from planning to implementation/delivery of initiatives; incorporate other
initiatives within pioneer
3 Support/embed implementation/initiatives; keep focus/faith; keep momentum going; involve providers/wider stakeholders
4 Scale-up/roll out integration initiatives (which have been implemented/piloted)
5 Demonstrate success of new models of care/initiatives; measure impact/ outcomes/patient experience/cost benefits/staff experience
6 Financial/budget priorities; capitated budgets; financial challenges/budget cuts; budget sharing; joint commissioning; contracting issues
7 Integrated care record; IT/IG issues
8 Engage GPs/primary care/community care
9 Engage local actors/ partners, including patients/voluntary organisations (not GPs which is code 8)
10 Workforce issues, e.g. improve skills/morale; workforce planning/recruitment; staff morale; leadership development
11 Prevention/self-care/patient independence
12 Reduction on non-elective admissions/managing demand; improve patient discharge/admissions processes
13 Mentions of specific (named) programmes/services
14 Other/unclear answers not coded above
99 Not answered
41
Q27 Biggest challenge to top priority in next 12 months (Code 1 answer only)
1 Budget/capacity issues: Reduced local funding; budget pressures/deficits; pressure in the system; performance pressures; demand outstripping capacity (except workplace shortages, which is code 5)
2 Competing priorities/initiatives/conflicting demands (e.g. from Vanguards, STPs,
devolution); focus on short-term goals/government targets; alignment with STP; over-regulation/reporting; requirement to tender services (note that challenges to do with developing or commissioning is code 9)
3 Demonstrating the value of integration initiatives
4 Getting commitment of all local stakeholders (including GPs); effective leadership/communication to ensure implementation; getting everyone on board; getting all partners to coordinate/work together/risk share
5 Workforce planning/recruitment; shortages of staff
6 BLANK
7 Improving co-production with patients/carers
8 Integrated IT; shared records/data sets
9 Developing/implementing integrated commissioning/budget pooling/new contract models
10 Shifting culture of health or social care staff; changing practice/mind-sets
11 Reducing our deficit/Integration not saving money
12 Other/unclear answers not coded above
(Note: Some respondents typed in more than one challenge. Only one answer was included on the SPSS data set, i.e., the first “codeable” one typed in was used.)
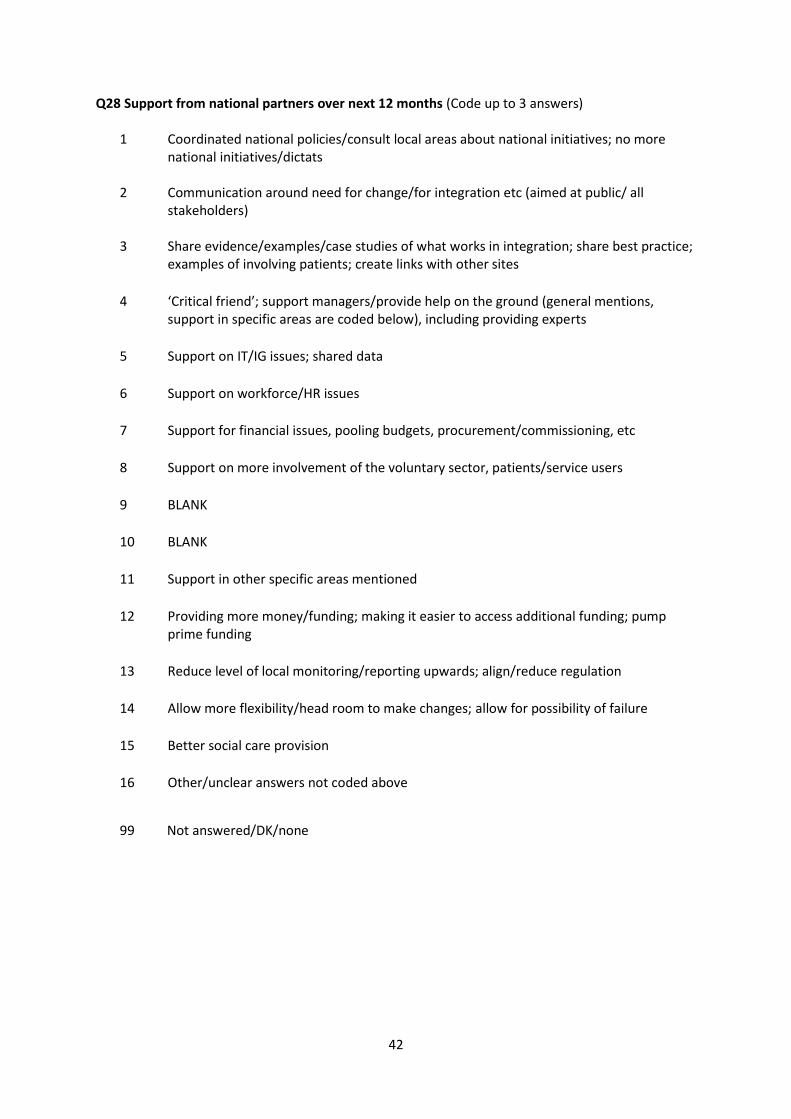
42
Q28 Support from national partners over next 12 months (Code up to 3 answers)
1 Coordinated national policies/consult local areas about national initiatives; no more national initiatives/dictats
2 Communication around need for change/for integration etc (aimed at public/ all
stakeholders)
3 Share evidence/examples/case studies of what works in integration; share best practice; examples of involving patients; create links with other sites
4 ‘Critical friend’; support managers/provide help on the ground (general mentions, support in specific areas are coded below), including providing experts
5 Support on IT/IG issues; shared data
6 Support on workforce/HR issues
7 Support for financial issues, pooling budgets, procurement/commissioning, etc
8 Support on more involvement of the voluntary sector, patients/service users
9 BLANK
10 BLANK
11 Support in other specific areas mentioned
12 Providing more money/funding; making it easier to access additional funding; pump prime funding
13 Reduce level of local monitoring/reporting upwards; align/reduce regulation
14 Allow more flexibility/head room to make changes; allow for possibility of failure
15 Better social care provision
16 Other/unclear answers not coded above
99 Not answered/DK/none