
Evaluation of the Florida Department of Children … of the Florida Department of Children and...
122
Evaluation of the Florida Department of Children and Families Community-Based Care Initiative Prepared by: Robert I. Paulson, Ph.D. Mary Armstrong, Ph.D. Janet Fitzpatrick, Ph.D. Neil Jordan, Ph.D. Mary Ann Kershaw, B.S. Frank Reyes, A.A. Amy C. Vargo, M.A. Svetlana Yampolskaya, Ph.D. Submitted to the Florida Department of Children and Families June 16, 2003
Transcript of Evaluation of the Florida Department of Children … of the Florida Department of Children and...

Evaluation of theFlorida Department of Children and
Families Community-Based CareInitiative
Prepared by:Robert I. Paulson, Ph.D.Mary Armstrong, Ph.D.Janet Fitzpatrick, Ph.D.
Neil Jordan, Ph.D.Mary Ann Kershaw, B.S.
Frank Reyes, A.A.Amy C. Vargo, M.A.
Svetlana Yampolskaya, Ph.D.
Submitted to theFlorida Department of Children and Families
June 16, 2003

ii
Evaluation conducted by the Louis de la Parte Florida MentalHealth Institute during FY2002-2003
Report submitted to the Florida Department of Children andFamilies on:
June 16, 2003
Final edition complete: September 25, 2003
Available at:http://www5.myflorida.com/cf_web/myflorida2/healthhuman/publications/pubs.html#cbc

iii
ACKNOWLEDGEMENTSThe authors gratefully acknowledge the assistance provided by:
Debbie AndrewsKaren ArdntChuck BatesGary BembryAnn BernardJohn BilbreyPam BlumenthalLinda BriggsMarsha Lewis BrownChris CardSusan ChaseGladys CherryPam ChesserLouise ConnorLynne DavisJudge EssrigDavid FairbanksLori FehrMargaret FenderRoxanne FixsenLiz GrassoVirginia Streeter GriffithMario HernandezAllison HillPeter HowardMike IdoniLee JohnsonChristy KaneDonna KrauserCapt. Craig LatimerTeresa LeslieBecky LyonsJohn LyonsSylvia MatthewsKaren MaziarzEd McBrideElwood McElhaneyMaureen McGillDonna MimsSusan Miranchuk
Christie MooreBill NavasCharlie NelsonRoaya NooriDavid OverstreetChris PanzarinoJudge John ParnhamKeith PerlmanSusan PowellJeff RaineyFrank ReyesJeff RichardLyn RichardLee RileyDave RobinsonMary RuizMarvin RumseyTerri SaundersLesa SimsRon & RoseAnn SlayClaudia StegallDavid StoutMargaret TaylorGerard VenemanBeverly WhiddonLisa WhiteSandy WilsonKathy WintersWalt WootenColeman Zuber
Research Assistants:J. Jill JonesA. Rebecca Whitlock
Page Layout and Design:Bill Leader

iv
TABLE OF CONTENTSACKNOWLEDGEMENTS ........................................................................................ iiiLIST OF FIGURES .................................................................................................. viiLIST OF TABLES................................................................................................... viiiHIGHLIGHTS ........................................................................................................... ixSECTION ONE: INTRODUCTION…......................................................................... 1
BACKGROUND.............................................................................................. 1ORGANIZATION OF REPORT....................................................................... 7
SECTION TWO: METHOD........................................................................................ 8CBC CONCEPTUAL MODEL......................................................................... 8RESEARCH AND EVALUATION QUESTIONS ........................................... 10
SECTION THREE: FINDINGS................................................................................. 13 STUDY OF THE IMPLEMENTATION OF COMMUNITY-BASED CARE..... 13 Rationale ........................................................................................... 13
Progress on FY01-02 Recommendations....................................... 15FY02-03 Findings.............................................................................. 16 Lead Agency Organizational Characteristics ................................. 16 Models of Community-Based-Care: Four Unique Approaches .. 18 Sarasota YMCA .........................................................................18 Family Continuity Program................................................. 19 Hillsborough Kids, Inc........................................................ 19 FamiliesFirst Network ........................................................ 22 Quality Assurance: Partnership Model vs. FFN’s Approach ...... 25 Cultural Differences Between Rural and Non-Rural Areas ........ 25
Feasibility of Awarding Lead Agency Contract to New Organization ........................................................................... 26 Staff Recruitment and Retention ............................................... 26 Innovations................................................................................ 27 Work Culture ............................................................................. 27 Roles of DCF Central Office and District/Region Office ................. 28 Reorganization Challenges ........................................................ 28 Technical Assistance ................................................................. 29 Need for a Review of Requirements of Lead Agencies.............. 30 Environmental Factors That Affected Implementation.................... 30
Rilya Wilson Incident/Governor’s Blue-Ribbon Panel on Child Protection ..................................................................... 30
Inadequate and Inequitable Funding Levels ............................. 30 Federal Fiscal Requirements .................................................... 31 Role of Community Alliances ..................................................... 31 QUALITATIVE STUDY OF THE SERVICES PROVIDED UNDER COMMUNITY-BASED CARE...................................................................... 32
Rationale ........................................................................................... 32 Staffing Observations/ Interviews ................................................. 32 Family Member Interviews............................................................ 38 Community Partners Survey......................................................... 39 Site Visit Observations ................................................................. 41

v
Quality Conclusions......................................................................... 43 PROGRAMMATIC OUTCOMES .................................................................. 46
Sources of Data ................................................................................ 46 Methodology..................................................................................... 47 Limitations ........................................................................................ 47 Proportion of Children Who Exited Out-of-Home Care ................ 48
Description of the Indicator ...................................................... 48 Results .................................................................................... 49 Reentry into Out-of-Home Care.................................................... 50 Description of the Indicator ...................................................... 50 Results .................................................................................... 50
Proportion of Children with Recurrence of Maltreatment .............. 51 Description of the Indicator ...................................................... 51 Results .................................................................................... 51
Proportion of Children Returned to Parents or Legal Guardians and Custodial Placement with Relatives After Exiting Out-of- Home Care ................................................................................. 52
Description of the Indicator ..................................................... 52 Results ................................................................................... 53
Children Returned to Parents of Removal Home Caregivers After Exiting Out-of-Home Care ................ 53 Children Who Had Custodial Placement With Relatives After Exiting Out-of-Home Care................................. 53
Children With Adoption Finalized After Exiting Out-of-Home Care ............................................................................................. 60
Description of the Indicator ..................................................... 60 Results ................................................................................... 60Summary ........................................................................................... 60
ANALYSIS OF EXPENDITURES ................................................................. 62 Analysis of Direct Child Protective Services Expenditures .......... 62
Evaluation Questions.................................................................... 62 Methodology ................................................................................. 62 Findings ........................................................................................ 64 Conclusions & Limitations ............................................................ 70Analysis of Child Welfare Administrative Expenditures ............... 72 Evaluation Questions.................................................................... 72 Methodology ................................................................................. 73 Findings ........................................................................................ 74 Conclusions & Limitations ............................................................ 78
SECTION FOUR: DISCUSSION AND POLICY RECOMMENDATIONS ................ 80PROGRAMMATIC OUTCOMES .................................................................. 80QUALITY ...................................................................................................... 80COST ........................................................................................................... 81IMPLEMENTATION...................................................................................... 81
Areas of Progress............................................................................. 82

vi
New Findings .................................................................................... 82POLICY RECOMMENDATIONS .................................................................. 83
REFERENCES……………………………………………………………………….… ... 85APPENDIX 1:HIGHLIGHTS FROM THE 2001-02 STATEWIDE EVALUATION
OF COMMUNITY-BASED CARE....................................................................... 88APPENDIX 2: STAFFING OBSERVATION FORM................................................. 92APPENDIX 3: CAREGIVER INTERVIEW ............................................................... 99APPENDIX 4: DIRECT SERVICES AND OCAs BY SERVICE CATEGORY
(FY01-02) ......................................................................................................... 101APPENDIX 5: TOTAL EXPENDITURES FOR DISTRICT SPECIFIC PROJECTSBY DISTRICT AND FISCAL YEAR....................................................................... 105APPENDIX 6: PROPORTION OF EACH STUDY YEAR DATA WERE ALLOCATED TO CBC STATUS, BY CBC SITE ............................................ 106APPENDIX 7: AUTHOR INFORMATION.............................................................. 107

vii
LIST OF FIGURESFigure 1. Community-Based Care: Implementation Timeline .................................... 5Figure 2. Conceptual Model of Community-Based Care ........................................... 9Figure 3. Status of CBC Implementation as of September 2003............................. 17Figure 4. Hillsborough Kids, Inc. (HKI) Organizational Structure ........................... 21Figure 5. FamiliesFirst Network (FFN) Organizational Structure............................ 24Figure 6. DeSoto and Rest-of-State ....................................................................... 54Figure 7. Flagler and Rest-of-State ........................................................................ 54Figure 8. Hillsborough and Rest-of-State ............................................................... 55Figure 9. Okaloosa and Rest-of-State .................................................................... 55Figure 10. Pasco and Rest-of-State ....................................................................... 56Figure 11. Pinellas and Rest-of-State .................................................................... 56Figure 12. Santa Rosa and Rest-of-State .............................................................. 57Figure 13. Sarasota and Rest-of-State ................................................................... 57Figure 14. Manatee and Rest-of-State ................................................................... 58Figure 15. Volusia and Rest-of-State ..................................................................... 58Figure 16. Walton and Rest-of-State ...................................................................... 59Figure 17. Escambia and Rest-of-State ................................................................. 59Figure 18. Average Expenditures For Direct Child Protective Services Per ChildServed: CBC Sites vs. Non-CBC Sites .................................................................... 65Figure 19. Average Expenditures For Direct Child Protective Services Per ChildDay in System: CBC Sites vs. Non-CBC Sites ........................................................ 66Figure 20. Average Expenditures For Direct Child Protective Services PerCapita: CBC Sites vs. Non-CBC Sites ..................................................................... 67Figure 21. Average Expenditures For Direct Child Protective Services PerInvestigative Report: CBC Sites vs. Non-CBC Sites ................................................ 67Figure 22. Direct Child Protective Services Expenditures by Type of Service(FY01-02)-- Non-CBC Sites ..................................................................................... 69Figure 23. Direct Child Protective Services Expenditures by Type of Service(FY01-02)-- CBC Sites ............................................................................................ 69Figure 24. Administrative Expenditures as a Percentage of Total Expenditures,by District/Region, When Statewide Administrative Expenditures Were DividedAccording to Child Population (FY01-02) ................................................................. 77Figure 25. Administrative Expenditures as a Percentage of Total Expenditures,by District/Region, When Statewide Administrative Expenditures Were DividedAccording to Number of Investigative Reports (FY01-02)........................................ 78

viii
LIST OF TABLESTable 1. Community-Based Care Evaluation Summary .................................. 7Table 2. Research and Evaluation Questions ................................................10Table 3. Summary of Staffing Observations and Interviews ...........................33Table 4. Identification of Community Resources ............................................33Table 5. Individualization of Service Plan ......................................................34Table 6. Sensitivity to Family Needs...............................................................34Table 7. Interagency Collaboration.................................................................35Table 8. Measurable Outcomes .....................................................................36Table 9. Management of the Staffing..............................................................36Table 10. Assessment of the Staffing Facilitator ............................................37Table 11. Overall Ratings on the Community Partners Survey ......................41Table 12. Summary of Quality Analysis Methods ...........................................44Table 13. Proportion of Children Who Entered Out-of-Home Care in FY01-02and Exited Within 12 Months: CBC Counties and Rest-of-State (FY01-02)....49Table 14. Comparison of CBC Counties and Rest-of-State on Proportion ofChildren Reentering Out-of-Home Care..........................................................51Table 15. Recurrence of Maltreatment ...........................................................52Table 16. Changes in Statewide Denominator Data vs. Changes inStatewide Numerator Data, FY99-00 thru FY01-02 ........................................71Table 17. Total Child Welfare Administrative Expenditures by District/Region, Adjusted for Child Population (FY01-02) ...........................................74Table 18. Total Child Welfare Administrative Expenditures by District/Region, Adjusted for Investigative Reports (FY01-02) ..................75Table 19. Comparison of Methods for Dividing Share of Statewide ChildWelfare Administrative Expenditures by District/Region, (FY01-02)………….76

ix
HIGHLIGHTS FROM THE 2002-2003 STATEWIDE EVALUATION OFCOMMUNITY-BASED CARE
• One of Florida’s responses to ensuring the safety and well being ofchildren in its child welfare system is Community-Based Care (CBC). Thepurpose of CBC is to: 1) improve the safety and well being of children; 2)create community ownership around child welfare issues; 3) shift theresponsibility for direct service delivery in child welfare from DCF to newly-created lead agencies; 4) create a more integrated and comprehensivechild protective service system, and 5) more flexibly manage availableresources.
• In 2001-02, the Florida Department of Children and Families (DCF)contracted with the University of South Florida Louis de la Parte FloridaMental Health Institute (FMHI) to conduct an evaluation of the fourcounties in which Community-Based Care (CBC) was operational in FY00-01: Sarasota, Manatee, Pinellas, and Pasco Counties. The Departmentcontracted with FMHI again in 2002-03, and expanded the evaluation toinclude all counties that began implementing CBC in FY01-02. The currentreport includes information on Sarasota, Manatee, Pinellas, Pasco,Flagler, DeSoto, Hillsborough, Santa Rosa, Escambia, Walton, Okaloosa,and Volusia Counties. More detailed analysis is provided for two leadagencies: Hillsborough Kids Inc. (HKI) and FamiliesFirst Network (FFN), inorder to provide an in-depth picture of their implementation process andidentify emerging issues.
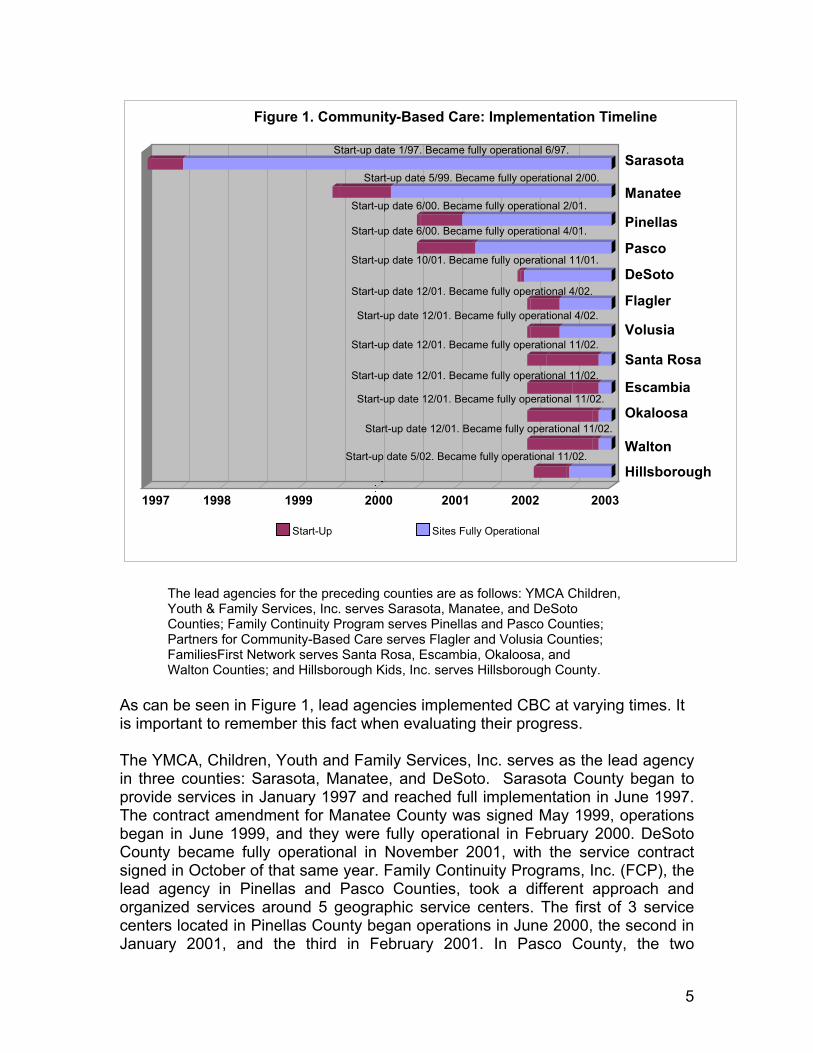
• As shown in Figure 1, Sarasota County, whose lead agency was theSarasota YMCA Children, Youth and Family Services, Inc., was the first toprovide services in Florida. Manatee County came under the SarasotaYMCA in 2000. Family Continuity Programs, Inc. (FCP), the lead agencyin Pinellas and Pasco Counties, began implementation of CBC in 2000and completed their effort in 2001. Desoto County began implementing in2001 and became fully operational later that year. Flagler and VolusiaCounties began implementing CBC in 2001, and became fully operationalin 2002. Implementation also began in 2001 for FamiliesFirst Network ofLakeview Center, Inc., the lead agency for Santa Rosa, Escambia,Okaloosa, and Walton Counties, and in 2002 they became fullyoperational. Hillsborough County, whose lead agency was HKI, beganimplementation in 2002 and became fully operational that year.

x
Figure 1. Community-Based Care: Implementation Timeline
Start-up date 1/97. Became fully operational 6/97.
Start-up date 5/99. Became fully operational 2/00.
Start-up date 6/00. Became fully operational 2/01.
Start-up date 6/00. Became fully operational 4/01.
Start-up date 10/01. Became fully operational 11/01.
Sarasota
Manatee
Pinellas
Pasco
DeSoto
Flagler
Volusia
Santa Rosa
Escambia
Okaloosa
Walton
Hillsborough
Start-up date 12/01. Became fully operational 4/02.
Start-up date 12/01. Became fully operational 4/02.
Start-up date 12/01. Became fully operational 11/02.
Start-up date 12/01. Became fully operational 11/02.
Start-up date 12/01. Became fully operational 11/02.
Start-up date 12/01. Became fully operational 11/02.
Start-up date 5/02. Became fully operational 11/02.
1997 1998 1999 2000 2001 2002 2003
Start-Up Sites Fully Operational
Status of CBC Implementation for Family Continuity Programs, FamiliesFirst Network, Hillsborough Kids, Inc., and Sarasota YMCA Children, Youth,and Family Services, Inc.
• All four lead agencies have been successful in making the transition toCommunity-Based Care. Each developed different organizational modelsadapted to their local circumstances.
• The readiness assessment process, adequate start-up funds, and aplanning year followed by a planned phase-in of services were critical tolead agency success.
• Establishing true partnerships between DCF (at both Central Office andDistrict/Region levels) and the lead agency and between the lead agencyand its provider network was a key element to successful implementation.
• To varying degrees, lead agencies and their provider networks evolved a“checks and balances” approach that was used for budget management,operations, review of performance indicators and service utilization, qualityassurance and quality improvement. Regular reviews of budgetary and

xi
performance information were used to identify and solve problems on anongoing basis.
• Many lead agencies struggled with urban-rural differences that reflectcultural and ethnic diversity, imbalances in power over resources, anddifficulties providing services across large distances in sparsely populatedareas. Special attention needs to be paid to the problems associated withcombining urban and rural areas within the structure of one lead agency.
• A much more substantial amount of time has been needed to fullyaccomplish systems change than was initially believed. One of thegreatest challenges has been to change actual practice at the servicedelivery level.
• Three areas have continued to emerge as problematic: 1) in the sitesvisited, the role of community alliances was still unclear to manystakeholders, and in the sites visited, the community alliance had nottaken a leadership role in developing local ownership of the child welfaresystem; 2) From the perspective of foster parents, the provision ofadequate support for foster parents was a challenge during early CBCimplementation; and 3) Involving parents and foster parents in treatmentplanning was a challenge for lead agencies.
• Lead agencies showed the capacity to develop important innovations,such as the Dependency Court Facilitation Program, the Children FirstResponse Team, and care teams with shared responsibility for a group offamilies.
Quality• Family participation was a critical and sometimes lacking factor in
permanency planning and should be emphasized in lead agencies’ qualityimprovement activities.
• Staffings of families in both sites focused on the safety of children andfamilies, and provided a mechanism for care coordination.
• There is general agreement that the biggest impact on quality will bemade by addressing reduction of caseload size and introducingcompetency-based skills development at the supervisory and directpractice levels.
Programmatic Outcomes
• The performance of CBC lead agencies in Florida was assessed on theAdoption and Safe Families Act (ASFA) required objectives (i.e., child

xii
safety, permanency, and well-being). Six quantitative indicators wereselected to measure child safety, permanency, and well-being: (a) theproportion of children exiting out-of-home care, (b) rates of reentry intoout-of-home care, (c) rates of recurrence of maltreatment, (d) rates ofreunification with parents, (e) rates of custodial placement with relatives,and (f) the proportion of children with finalized adoption. CBC countieswere compared with each other and with the Rest-of-State on eachindicator in order to develop a baseline performance level.
• Findings should be interpreted with caution, primarily because of theswitch in data source from CIS to HomeSafenet (HSn). As developers andusers refine HSn, more complex analyses of programmatic outcomes willoccur in future evaluation studies.
Cost
• The overall conclusion about the difference in average costs per child wasmixed. CBC and non-CBC sites experienced similar average costs perchild for every year studied except FY00-01 and FY01-02. During thoseyears, non-CBC sites experienced 29% and 16% higher average costs percapita for direct child protective services, respectively, than CBC sites.Findings for other per-child cost indicators should be interpreted withcaution due to apparent undercounting by CIS and HSn of children whoreceived child welfare services during FY00-01 and FY01-02.
• Approximately 4.5% of DCF’s child welfare expenditures were foradministrative expenses. The proportion of total expenditures used foradministration ranged from 2.0% to 7.6% across the districts, and theseadministrative rates varied depending upon the method used for allocatingCentral Office administrative expenditures to the districts. The effect ofCBC on administrative costs cannot be assessed from the data in thisanalysis, and conclusions cannot be made about the overall cost of CBCwithout considering the impact of administrative spending.
Policy Recommendations
• The Department of Children and Families should continue to encourageand support flexibility in how community stakeholders structure their CBClead agencies. As noted earlier, the fit between the design of the leadagency, local resources, and context is a crucial factor in their success.
• The Department should encourage CBC organizational arrangements witha distribution and balance of control and accountability for budget

xiii
management, review of performance indicators, and continuous qualityimprovement processes.
• The Department should continue the practice developed over the pastyear of using technical assistance teams to support districts in theirdevelopment of Community-Based Care.
• The partnership between DCF, the Professional Development Centers,and the lead agencies should prioritize skill development and competencytraining at the supervisory and case manager levels in evidence-basedpractices (e.g. family group conferencing, individualized care, andstrengths based approaches).
• The role of the Community Alliances in some parts of the State needs tobe resolved. Increased communication and role clarification betweenCommunity Alliances and lead agencies will benefit all parties.
• DCF and the lead agencies should continue to address and resolveseveral issues related to funding, such as appropriate levels of funding,inequities in funding levels across lead agencies, risk sharing, andadministrative costs of lead agencies.
• A review should be conducted of laws and policies that assume that only“agents” of the State can carry out a function. For those functions thathave been transferred to CBC, modifications are needed in statute oradministrative code to allow the lead agencies to perform them.
• If a crisis similar to Rilya Wilson should unfortunately occur, it may not beappropriate or beneficial to apply uniform mandates statewide. Leadagencies should be allowed to provide evidence that they have practiceddue diligence and be able to negotiate any additional actions that havebeen mandated in response to the crisis. If new tasks are required,additional resources should be allocated.

1
SECTION ONE: INTRODUCTION
In fiscal year (FY) 2001-02, the Department of Children and Families (DCF)contracted with the University of South Florida Louis de la Parte Florida MentalHealth Institute (FMHI) to conduct an evaluation of the four counties in whichCommunity-Based Care (CBC) was operational in FY00-01: Sarasota, Manatee,Pinellas, and Pasco Counties1. The Department contracted with FMHI again inFY02-03, expanding the evaluation to include all counties that beganimplementing CBC in FY01-02: Hillsborough, DeSoto, Okaloosa, Escambia,Santa Rosa, and Walton Counties.
The CBC Evaluation Plan has been designed in keeping with the legislativeintent for CBC (s. 409.1671, F.S.), which is to assess quality of service,programmatic outcomes, and cost-efficiency of the CBC sites. Previousexperience with the implementation of privatization and lead agencies in otherparts of the nation has been inconsistent. In some cases the implementationswere successful, while in others they have failed. Likewise, someimplementations have achieved the promised benefits of privatization such asincreased flexibility or reduced cost, and some have not, depending on localconditions and the implementation strategies used. However, a consistent findingis that in most cases, implementation took longer than expected (Gibelman &Demone, 1998). Because Florida’s CBC initiative is still quite new in mostcounties, it is too soon to conclude whether the reform has succeeded or failed.Consequently, this evaluation focuses on preliminary outcomes and theadvantages and disadvantages of privatization as it has been implemented inFlorida thus far. This report’s goal is to provide policymakers with concreteinformation and recommendations about next steps and mid-course corrections.
BACKGROUNDEnsuring the safety and well-being of children in the child welfare system hasproven to be a long-term and complicated national problem, as noted in a recentnational report by the Urban Institute (Malm, Bess, Leos-Urbel, Geen, &Markowitz, 2001). Ongoing issues identified in the report included: (1) escalatingcosts; (2) more families coming under care with more severe problems (e.g.,substance abuse, family violence, and an increased severity of abuse andneglect); (3) increased public scrutiny of child welfare agencies; and (4) litigationagainst the system. Fragmented and uncoordinated services with littleaccountability to the state and the local community were also commonplace, aswell as a chronic under funding of most state systems.
One proposed method for achieving more effective and efficient services hasbeen privatization, known in Florida as Community-Based Care (CBC). The use
1 For more information regarding the findings from the 2001-02 evaluation, refer to Appendix 1:Highlights from the 2001-02 Statewide Evaluation of Community-Based Care.

2
of privatization has steadily accelerated and can no longer be seen as a passingfad but rather as standard government practice (Daley, 1996; Freundlich &Gerstenzang, 2003; Greene, 1996). However, Community-Based Careencompasses more than just privatization. It was intended that CBC would: (1)create community ownership over child welfare issues; (2) improve the safetyand well-being of children; (3) shift the responsibility for child welfare services tonewly created lead agencies; (4) create a more integrated and comprehensivechild protective service system, and (5) achieve cost efficiencies and moreflexible management of resources.
The literature, however, tends to focus on the privatization issues rather thanother characteristics of the CBC initiative (e.g., the use of a lead agency or localownership of child welfare problems and services). The potential benefits ofprivatization are considered to be: (1) increased flexibility, particularly withrespect to “red tape” and personnel matters; (2) greater competition andenhanced consumer participation; (3) better quality and more effective service;(4) enhanced coordination with other local agencies leading to greater continuityof care; (5) increased cost-effectiveness and administrative efficiency; (6)increased professionalism; (7) the promotion of innovation; (8) greater ability toalter or terminate programs; and (9) local investment in the governance process,which results in a better adaptation of the service system to local circumstancesand increased local accountability (Gibelman & Demone, 1998; Paulson, 1988).
The privatization efforts that have taken place over the past 30 years have alsorevealed possible disadvantages to privatization that mirror the advantages. Theyhave included such experiences as: (1) decreased public accountability andcontrol; (2) difficulties in establishing, maintaining and monitoring performancestandards and contractual obligations; (3) unrealized cost savings (partiallycaused by greater monitoring and contracting costs); (4) declines in servicequality and the “skimming” of clients so that the most difficult and needy clientsdo not receive services; (5) unreliable and ineffective contractors; (6) thesubjection of private agencies to public policy shifts and budget cuts thatthreaten the viability and stability of the agency; and (7) dramatic price increasesas government loses the ability to provide the service itself (Fixler & Poole, 1987;Gibelman & Demone, 1998; Paulson, 1988).
The history of privatization efforts includes both major successes and majorfailures (Gibelman & Demone, 1998). While there has been an ongoingbroadening of the kinds of services being privatized, the privatization of humanservices represents a relatively small percentage of all privatization efforts buthas proven to be highly problematic. Unfortunately, there have been very fewempirical examinations of these privatization efforts, which makes the evaluationof such programs even more important (Gibelman & Demone, 1998).Furthermore, a recent study of child welfare privatization activities by the ChildWelfare League of America showed that privatization did not always lead to lowercosts (CWLA, 2000). Part of the reason for this may be that child welfare

3
systems in general are chronically under-funded so there is little if any room forcost savings. Local circumstances and the implementation processes (the issuesdetailed in the policy framework described below) have been key factors in thesuccess and failure of such efforts.
As part of this trend towards privatization and CBC, states and localities areincreasingly turning to a model where a single agency is charged withcoordinating and providing all services. The intent of this model is to reduce theneed for families to negotiate a maze of individual agencies, improve thelikelihood that there is a match between needs and services, increase access toservices, and assume that families will be more accepting and trusting of localcommunity agencies than services run by the state (McCullough & Schmitt, 2000;U.S. Government Accounting Office, 2000). This lead agency design has beenthe most common approach of state governments in the field of child welfare(McCullough & Schmitt, 2000).
In Florida, the 1996 Legislature mandated child welfare privatization and a leadagency design. The intent of the statute was to strengthen the support andcommitment of local communities to the “reunification of families and care ofchildren and their families,” and increase the efficiency and accountability ofservices. The responsibilities of lead agencies, as defined by the original statute,were to:
• “Coordinate, integrate, and manage all child protective services in thecommunity while cooperating with child protective investigations,
• ensure continuity of care from entry to exit for all children referred,• provide directly or through contract with a network of providers all child
protective services,• accept accountability for achieving the federal and state outcome and
performance standards for child protective services,• have the capability to serve all children referred to it from protective
investigations and court systems, and• be willing to ensure that staff providing child protective services receive
the training required by the Department of Children and Families”(s. 409.1671, F.S.).
In 1997, the move to Community-Based Care was impacted by the passage ofthe federal Adoption and Safe Families Act (ASFA), which amended Title IV-B(child welfare) and Title IV-E (out-of-home care and adoption assistance)programs of the Social Security Act. It was the first major child welfare legislationto be changed since 1980. ASFA stressed that child safety was paramount overreunification or placement issues and that there should be a focus on reducingthe time children are in out-of-home care. In addition, ASFA established and setguidelines for child permanency hearings through which it must be determined ina timely manner whether reunification is a viable option. Services that a child andfamily need must be available right away to meet strict time guidelines. ASFA

4
also required extensive coordination and communication between childprotection and court systems. It expanded Title IV-E waivers for innovative childwelfare services, and it required an annual report to Congress on how each statewas meeting the ASFA standards. The seven major outcome goals that ASFAseeks to achieve in all states are:
• “Reduce the reoccurrence of child abuse and/or neglect,• reduce the incidence of child abuse and neglect in out-of-home care,• increase permanency for children in out-of-home care,• reduce time in out-of-home care to reunification without increasing reentry
to out-of-home care,• reduce time in out-of-home care to adoption,• increase placement stability, and• reduce placements of young children in group homes or institutions”
(U.S. Department of Health and Human Services, 1998).
In 1999, the Florida Legislature brought the State into compliance with ASFA byrevising Chapter 39 and amending the original CBC bill, which expanded CBCstatewide. The Community-Based Care Implementation Plan, issued in July 1999by DCF, embraced the ASFA goals and the move to local community-basedsystems of care.
In most privatization arrangements across the country, lead agencies have beenfinanced through capitation or case rate payments that reflect the actual numberof people the agency is serving or likely to serve. Florida is the only state using aglobal budget transfer (see s. 409.1671, F.S.), that is, giving a fixed amount ofmoney to the lead agency and making it responsible for providing all servicesneeded to all children who enter the child welfare system (CWLA, 2000). Since alead agency cannot unilaterally control, but can impact the number of childrenentering the system, it is at financial risk. This means that the financial stabilityand viability of the lead agencies and their provider networks must be evaluatedas well. There have been reported instances where agency financial viabilitybecame problematic (Gibelman, 1998). DCF has recognized this possibility andworked with the lead agencies around issues such as sudden increases inenrollment and has taken steps to mitigate the potential financial risks under thepurview of Senate Bill 632. This bill directs DCF, collaboratively with leadagencies, to develop a proposal regarding the long-term use and structure of astatewide, shared earnings program that addresses the financial risk resultingfrom unanticipated caseload growth or from significant changes in client mixes orservices eligible for federal reimbursement.
5
Figure 1. Community-Based Care: Implementation Timeline
Start-up date 1/97. Became fully operational 6/97.
Start-up date 5/99. Became fully operational 2/00.
Start-up date 6/00. Became fully operational 2/01.
Start-up date 6/00. Became fully operational 4/01.
Start-up date 10/01. Became fully operational 11/01.
Sarasota
Manatee
Pinellas
Pasco
DeSoto
Flagler
Volusia
Santa Rosa
Escambia
Okaloosa
Walton
Hillsborough
Start-up date 12/01. Became fully operational 4/02.
Start-up date 12/01. Became fully operational 4/02.
Start-up date 12/01. Became fully operational 11/02.
Start-up date 12/01. Became fully operational 11/02.
Start-up date 12/01. Became fully operational 11/02.
Start-up date 12/01. Became fully operational 11/02.
Start-up date 5/02. Became fully operational 11/02.
1997 1998 1999 2000 2001 2002 2003
Start-Up Sites Fully Operational
The lead agencies for the preceding counties are as follows: YMCA Children,Youth & Family Services, Inc. serves Sarasota, Manatee, and DeSotoCounties; Family Continuity Program serves Pinellas and Pasco Counties;Partners for Community-Based Care serves Flagler and Volusia Counties;FamiliesFirst Network serves Santa Rosa, Escambia, Okaloosa, andWalton Counties; and Hillsborough Kids, Inc. serves Hillsborough County.
As can be seen in Figure 1, lead agencies implemented CBC at varying times. Itis important to remember this fact when evaluating their progress.
The YMCA, Children, Youth and Family Services, Inc. serves as the lead agencyin three counties: Sarasota, Manatee, and DeSoto. Sarasota County began toprovide services in January 1997 and reached full implementation in June 1997.The contract amendment for Manatee County was signed May 1999, operationsbegan in June 1999, and they were fully operational in February 2000. DeSotoCounty became fully operational in November 2001, with the service contractsigned in October of that same year. Family Continuity Programs, Inc. (FCP), thelead agency in Pinellas and Pasco Counties, took a different approach andorganized services around 5 geographic service centers. The first of 3 servicecenters located in Pinellas County began operations in June 2000, the second inJanuary 2001, and the third in February 2001. In Pasco County, the two

6
remaining service centers began operations in April 2001. The contract for bothcounties was effective on June 30, 2000.
Partners for Community-Based Care (PCBC), the lead agency in Flagler andVolusia Counties, signed a service contract in December of 2001. They beganoperating that same month and then became fully operational in April 2002.
Lakeview Center, Inc., which serves as lead agency for all four counties inDistrict One (i.e., Escambia, Santa Rosa, Okaloosa, and Walton Counties) wasawarded a start-up contract in April 2001, and signed the services contract inDecember 2001. The process of transitioning to CBC was staged toaccommodate the multi-county coverage of the contract. Santa Rosa Countywas transitioned in March 2002, Escambia in July 2002, and finally Okaloosa andWalton Counties in October 2002. All four counties became fully operational inNovember 2002. FamiliesFirst Network is the Lakeview Center subsidiaryorganization that has day-to-day lead agency responsibility.
Hillsborough Kids, Inc. (HKI) was selected as the lead agency in HillsboroughCounty in March 2001, and signed a transition contract in May of that same year.The service contract was signed in May 2002, and HKI became fully operationalin November 2002.

7
ORGANIZATION OF REPORTBased on the framework described in the CBC Conceptual Model (see Figure 2,page 9), the evaluation used a mixed-method approach to investigate all of thedomains of the conceptual framework. There were four major components to theevaluation (see Table 1), which together provided an integrated evaluation of theCBC initiative: (1) an implementation study examined the issues around CBCimplementation and monitoring of CBC sites; (2) the study of quality of servicesprovided under CBC; (3) an outcome analysis that used existing administrativechild protection data; and (4) a cost analysis component.
Table 1. Community-Based Care Evaluation Summary
ResearchEvaluationComponent
Key Methodologies General Purpose
ImplementationAnalysis
Stakeholder interviewsand review of keydocuments
Examined issues around CBCimplementation and monitoring frommultiple perspectives
QualityAnalysis
Semi-structuredinterviews andobservations
Examined quality of services frommultiple perspectives in the site visitlocations
OutcomeAnalysis
Analysis of existingadministrative childprotection data
Obtained baseline data andexamined programmatic outcomes inCBC counties
Cost Analysis Analysis of expendituredata
Examined differences in cost-efficiency and administrative costsbetween CBC and non-CBC counties
The conceptual model guiding the evaluation will be explained in the followingsection. The report is presented in four sections. The current section includes areview of pertinent issues and literature regarding the privatization of childwelfare. The second section explains the conceptual model guiding theevaluation. This section also describes the overall research questions, theevaluation questions, and the indicators based on the CBC Conceptual Model.The next section presents the results of the evaluation and is divided into the fourmajor evaluation components: (1) the implementation study, (2) the study ofquality of care, (3) programmatic outcomes, and (3) the analysis of expenditures.The final section of the report includes a discussion of the findings, policyimplications and recommendations.

8
SECTION TWO: METHOD
CBC CONCEPTUAL MODEL
Figure 2 depicts the conceptual model used for this evaluation. The left side ofthe model highlights the conditions existing before CBC implementation and thejustification for the legislation establishing Community-Based Care. Theseconditions summarize the issues facing child welfare agencies discussed in thebackground section of this report. The CBC implementation strategies depict theprocesses expected to lead to enhanced quality performance as well as the basicindicators of performance quality. This part of the model is based on the priordiscussion of the potential advantages of privatization and the evolving publicpolicy expectations for child welfare services as expressed in ASFA and theFlorida statutes. Finally, the expected results of the privatization initiative areoutlined on the right side of the model. This model provides the theoreticalunderpinning for the evaluation, which is designed to address most of theelements in the latter two stages of the model.
The evaluation used qualitative and quantitative study methods to enable asmuch triangulation (i.e., to compare the consistency of results across methods)as possible in answering the research and evaluation questions. Theimplementation component explored system relationships, local direction, andcommunity involvement aspects of the conceptual model. The quality componentattempted to assess the quality of service planning, parent satisfaction withsystem, and well-being of children. The programmatic outcomes component, inconjunction with the quality and the implementation pieces, was responsible forevaluating the effectiveness of the child protection system, the permanency ofplacements, and child well-being. The cost analysis component evaluated thecost-effectiveness and cost-efficiency of the CBC model. Each componentaddressed various research questions (see Table 2, Page 11). Again, theimplementation study provides the context in which to interpret the findings of theindividual components and to integrate them into a coherent whole.

9
Figure 2. Conceptual Model of Community-Based Care

10
RESEARCH AND EVALUATION QUESTIONS
The following table (Table 2) details the research questions in this evaluation, theevaluation questions related to these research questions, the indicators that wereused to answer these questions, and the main source of data for the indicators.
Table 2. Research and Evaluation QuestionsResearchQuestion Evaluation Question Indicator Source
How do total expenditures forchild protective services(CPS) in the CBC sites pre-and post-CBC compare withexpenditures in the non-CBCcounties?
• Total direct servicesexpenditures for childprotective services
• Total administrativeexpenditures for childprotective services
• Total expenditures for childprotective services
ExpenditureData
Are there cost-efficiencydifferences between the CBCand non-CBC sites?
• Average expenditures perchild served
• Average expenditures perchild day
• Average expenditures percapita
ExpenditureData
Has the implementation ofCBC facilitated a moreeffective child protectivesystem compared to thestate-run system?
• Quality of relationshipsbetween state,District/Region, and CBC
• Client and partnersatisfaction with CBC
• Improved serviceaccessibility
Implementation& Quality Data
Has CBC effectivelyestablished accountabilityand contracting functions?Do the lead agencies andprovider network membershave sufficient financialstability and viability?
• Appropriate contractingand quality assurancesystems are in place
• Changes in funding andservice priorities
• Change in ratio ofexpenditures to income
Implementation& ExpenditureData
IsCommunity-Based Carean effective
childprotectivesystem?
What have been thebarriers/facilitators tosuccessful implementation?How is CBC organized withrespect to the lead agency,District/Region Office, andProvider Network? Is there afit between CBC localcontext, system design, andorganization/systemstructure?
• Failure/success in meetingcontract requirements
• Reported implementationissues/successes ininterviews
• CBC organizationalstructure congruent withservice delivery strategy
ImplementationData

11
Table 2. Research and Evaluation Questions (cont.)ResearchQuestion Evaluation Question Indicator Source
Are child and family serviceplans comprehensive?
Service plans address:• the issues that brought
the family to DCF,• the underlying causes of
concern,• continuing safety risks,
and• desired functional
outcomes.
Quality Data
Are needed servicesprovided to children andtheir families in acoordinated manner?
• Services are provided tochildren and families in away that is coordinatedacross disciplines andchild serving agencies.
Quality Data
DoesCommunity-Based Careidentify and
meet theneeds of
children andfamilies?
Are local communityresources being developedto meet identified needs?
• New and/or innovativeservices are beingdesigned by leadagencies in conjunctionwith community partners.
Implementation& Quality Data

12
Table 2. Research and Evaluation Questions (cont.)ResearchQuestion Evaluation Question Indicator Source
What is the proportion ofchildren exiting out-of-homecare during first 12 monthsafter entry?
• Proportion of children whoexited out-of-home care.
ProgrammaticOutcomeData
What is the proportion ofchildren reentering out-of-home care within 12 monthsafter exiting their firstepisode in out-of-homecare?
• Proportion of childrenreentering out-of-homecare.
ProgrammaticOutcomeData
What is the proportion ofchildren with recurrence ofmaltreatment within 12months of their first episodeof maltreatment?
• Proportion of children whohad recurrence ofmaltreatment.
ProgrammaticOutcomeData
What is the percentage ofchildren who were returnedto parents?
• Percentage of childrenreturned to parents.
ProgrammaticOutcomeData
What is the percentage ofchildren who were placedwith relatives for long-termcare?
• Percentage of childrenplaced with relatives forlong-term care.
ProgrammaticOutcomeData
What is the percentage ofchildren with finalizedadoptions?
• Percentage of children withfinalized adoptions.
ProgrammaticOutcomeData
Are children safe frommanageable risk?
• Children are living insettings in which they arefree from imminent risk ofabuse and/or neglect.
ProgrammaticOutcome &Quality DataStudy
DoesCommunity-Based Careensure thesafety and
well-being ofchildren?
Are children residing instable and permanentplacements?
• Children are living in stableplacements with adequatesupports to maintain theplacement.
Quality DataStudy

13
SECTION THREE: FINDINGS
STUDY OF THE IMPLEMENTATION OFCOMMUNITY-BASED CARE
RationaleThis component of the evaluation relates primarily to the research question “IsCommunity-Based Care an effective child protective system?” and theimplementation strategies portion of the CBC Conceptual Model. Although threeadditional counties are addressed in the Programmatic Outcomes section of thisreport (DeSoto, Flagler and Volusia), this component is limited to the countieswhere the evaluation team has conducted either stakeholder interviews and/orsite visits (Manatee, Pasco, Pinellas, Sarasota, Hillsborough, Escambia, SantaRosa, Okaloosa and Walton Counties).
The American system of government is characterized by both checks andbalances, and multiple jurisdictions, which make the implementation of inter-governmental programs extremely complex. A landmark study of programimplementation demonstrated that the implementation of complex programs isextremely difficult and time consuming even under the best of circumstances(Pressman & Wildavsky, 1979). Consequently, even when programs are wellconceived, have sufficient resources, and have political and administrativesupport at multiple levels they are still likely to face substantial implementationproblems because of the complexities of system change. This is particularly truewhen dealing with difficult problems like child protective services. System changetakes a long time even under the best of circumstances (Pressman & Wildavsky,1979). For example in Sarasota County, the oldest CBC site, the Department’sreorganization and subsequent creation of the SunCoast Region added newchallenges to their implementation of Community-Based Care.
It is important, therefore, not just to evaluate whether CBC is working but also tounderstand the implementation issues and the context in which the lead agencyis operating and services are being provided. Looking at outcome data inisolation can lead to a distorted picture of reality, as there may be multipleinterpretations of the same results. The implementation component, thereforeprovides the context within which quality, cost and programmatic outcomes canbe interpreted. For example, if costs increase, there may be multiple causes: thelead agency was less efficient; the contracting, monitoring and data managementcosts were greater than anticipated; or, it could be that a higher level of serviceswere being provided to individuals who did not have prior access to suchservices. Similarly, lower costs to the State may be a function of multiple causes:the lead agency found ways to increase local or federal revenues, or the leadagency shifted costs to other systems (either through enhanced cooperation orby referring to another agency). In other words, understanding the contextual
14
issues is crucial to interpreting the data in ways that enable policymakers to drawvalid and meaningful conclusions. Additionally, since the implementation processinvolves multiple stakeholders with different agendas, the process is difficult toinvestigate. The best approach for studying these implementation issues is aqualitative methodology involving semi-structured, theory-driven interviews withstakeholders at multiple levels within the system (Yin, 1994).
This component of the evaluation used a general framework for looking atimplementation policy (Elmore, 1980; Paulson, 1981, 1987; Pressman &Widavsky, 1979; Van Meter & Van Horn, 1975; Williams, 1976)2. The frameworkis comprised of five different areas, each relating to a separate set ofimplementation issues:
1. Policy2. Characteristics and capacity of the implementing agencies3. Leadership and commitment of the implementing agencies4. Competing or conflicting priorities, programs, policies, or procedures
which impeded implementation5. Interorganizational relationships across multiple jurisdictions,
particularly with respect to communication, authority, governance, andpower
Additional questions relevant to understanding the overall history and context ofCBC implementation were included.
Site visits were conducted at Hillsborough Kids, Inc. and FamiliesFirst Network inApril 2003. Prior to each site visit, a designated team leader reviewed relevantdocuments and prepared a background report to familiarize team members withthe agency. Activities included review of pertinent documents; interviews with keystakeholders from the lead agency, its partner agencies, district/regional staff andcommunity stakeholders; observations of regularly scheduled meetings;observations of child staffings; focus groups with foster parents, and interviewswith parents being served by the lead agency. A semi-structured interviewprotocol was used for the interviews with key stakeholders and parents, and TheTeam Observation Form3 was used for the staffing observations. All interviewswere audio taped and conducted by two team members.
After the site visit, team members submitted written notes to the team leader andaudiotapes were transcribed. A content analysis of the transcriptions and writtennotes was conducted. The responses of the stakeholders were analyzed to
2 The study of policy and program implementation was a robust field with substantial publications for a short period oftime. A literature search turned up no new refereed publications and all materials examined turned out to be unpublishedsmall scale evaluations of specific programs or studies of the implementation of specific treatment interventions such asthe literature on fidelity scales.3 The Team Observation Form was developed by Dr. Michael Epstein at the University of Nebraska-Lincoln. It wasdesigned to assess the degree to which evidence that behaviors observed throughout family case planning meetingsreflect system of care and Wraparound principles. Trained observers attend meetings in which families are engaged byfamily counselors and other providers in identifying their needs and planning services, and record their observations.

15
identify critical issues and common themes, as well as the similarities anddifferences across each of the major perspectives.
Upon consultation with DCF Central Office, central office employees were notinterviewed for this evaluation report. However, last year’s report as well asfuture studies will include more viewpoints from this level. Therefore, a limitationof this report is that it reflects the perspectives of regional, district, and leadagency staff more so than central office staff.
Progress on FY01-02 Recommendations
Last year’s evaluation identified four major issues that needed to be resolved:
1. The nature of the relationship between DCF and the lead agency andits provider network
2. The role of the Regional/District office3. The program monitoring and auditing process4. The management information system, data collection, and reporting
processes
Fortunately, there has been some progress in all of these areas. The nature ofthe relationship between DCF and lead agencies is still challenging and steadilyevolving. However, now that more lead agencies have received contracts, thereis increased need for a forum to raise these issues and to work towardresolution. It is important to note that the lead agencies are sharing informationamong themselves and with DCF and continuing in good faith to attempt toresolve critical issues. DCF holds regularly scheduled leadership forums with thelead agency executive directors where these issues can be discussed. Aspreviously noted, the role of district, Regional and the DCF Central Offices iscurrently under examination, including the distribution of functions across thedifferent levels, the number of staff, and the nature of their functions as CBCimplementation progresses.
Substantial progress has been made with respect to program monitoring andauditing. A number of audits have been combined, and in some casesaccreditation visits have been scheduled to coincide with State monitoring. Thenumber of audits and monitoring visits has therefore been reduced. However,this is still a work in progress. Again, the important trend to note is that moredialogue is occurring and there have been a number of attempts to make themonitoring and auditing process more efficient and useful.
While no one would say that HomeSafenet (Florida’s name for its statewideautomated child welfare information system) is without problems, respondentsreported that Secretary Regier has been more flexible about how informationmay be entered and how the system is used. There now appears to be a greaterdialogue between programmers and end users. Progress has been made in

16
getting reports out of the system, and HKI has in fact developed programs toextract data that the lead agency can use in its operations. There were still majorconcerns expressed by some interviews that HSn was not user friendly and wasparticularly cumbersome for use by case managers. The backing off of the policyby the new Secretary that case managers had to enter all the data was viewedas beneficial by the lead agencies.
FY02-03 Findings
Lead Agency Organizational Characteristics
When comparing the results of the previous evaluation (June 2002) to the currentone, it is important to remember that the pace of implementing CBC hasaccelerated dramatically. As illustrated in Figure 3 below, every district is nowinvolved in some phase of the CBC implementation process. This creates a verydifferent environment in which policy and jurisdictional issues need to beaddressed, compared to prior years when only a few lead agencies wereoperational.
Three of the lead agencies (Sarasota YMCA, FCP, and HKI) are located in theSunCoast Region. The Region Office was able to learn from the experience of itssuccessive implementations. In addition, the current CEO of HKI had previouslybeen the CEO of the Sarasota CBC and was able to bring to HKI what had beensuccessful in Sarasota (e.g., shared vision for agency mission, unified team forchildren and families, partnership among agencies). Furthermore, District Onewas the first to implement CBC entirely under the new Invitation to Negotiate(ITN) framework. The ITN process is designed to allow for the flexibility inherentin lead agency approaches, more so than the traditional request for proposal(RFP) process.

17
Figure 3. Status of CBC Implementation as of September 2003
In the June 2002 evaluation report, it was noted that change doesn’t occur in avacuum and that other major systems changes were occurring along with theimplementation of CBC. This was also true for HKI and FFN. Both sites wereprofoundly affected by systems changes prompted by the Rilya Wilson case andthe Governor’s Blue-Ribbon Panel on Child Protection, as will be described later.There was also a major leadership change at DCF, a circumstance thatcommonly results in a period of uncertainty and transition. In District One, CBCwas only one of three ongoing major system innovations involving many of thesame agencies at the same time. The other two were Senate Bill 1258, whichcalled for a financing and contracting redesign strategy for mental health andsubstance abuse services, and the Prepaid Mental Health Plan, a Medicaidmanaged care strategy. Both initiatives also demanded considerable time, talent,and resources.
1
Taylor
Madison
Jeffe
rson
W akulla
Leon
Franklin
Liberty
GadsdenJackson
Calhoun
Gulf
BayW
ashingto
nHolmes 2
Flagler
Volusia 12
DuvalBaker
Nassau
Clay St.Johns
4
LakeCitrus
M arion
Sum terHernando13
Palm Beach
Broward
Hendry
GladesCharlotte
Lee
Collier8Dade
Monroe
Hardee
Polk
Highlands
147Orange
Osceola
Brevard
Seminole
Martin
Okeechobee
Indian River
St.Lucie
Escambia W alton
OkaloosaSantaRosa
15
910
11
3
Putnam
Colu
mbi
a
AlachuaDixieGilchrist
Lafayette Bradford
Levy
Suwannee
Union
Ham ilton
M anatee
Pasco
Pinellas
De SotoSarasota
Hillsborough
SunCoastRegion
Service ContractsSunCoast RegionDistrict 01District 12Duval CountyDistrict 10 (Phasing in services)
Start-Up Contracts District 15 BrevardDistrict 14 Orange/Osceola CountiesDistrict 9 District 3District 2a St. Johns CountySeminole County Nassau CountyDistrict 8 Clay/Baker CountiesDistrict 13 District 11District 2B
18
Even though more CBC sites were in various phases of operation during FY01-02 and were seen as very important by DCF, they were still, nevertheless, only asmall part of the agency’s overall operation. Consequently, policies, procedures,and structures evolved as the need arose through a negotiated process ratherthan as a more organized “roll-out” that might be required in a statewide effort.This created a considerable added burden on DCF policymakers who had toconsider every policy from two perspectives – that of DCF operations and that ofthe lead agencies. As a greater proportion of DCF operations fall under CBC, thisdual role will become even more stressful and complex and will require majoradjustments to the way in which DCF organizes and conducts its business. It isimportant to recognize that DCF is not only providing services to a vulnerablepopulation in a highly-volatile political environment, but is also simultaneouslymaking enormous changes to the structure and culture in which it operates.These organizational issues are further complicated by the fact that child welfareis only one of DCF’s functions.
Models of Community-Based Care: Four Unique ApproachesThe lead agencies included in this evaluation represent different models andstrategies based on different sets of circumstances, and can serve as prototypesfor future implementation. The following is a brief discussion regarding the sitesincluded in the previous evaluation (Sarasota, Manatee, Pinellas, and PascoCounties) followed by a more detailed description of the two new sites(Hillsborough County and District One). Some of the advantages anddisadvantages of these different models will be presented, and the variety ofquestions new agencies have to answer (e.g., whether to contract for or provideservices, how quickly to start operations, whether to centralize or decentralizecertain functions) will be considered. Partners for Community-Based Care,PCBC, were not site-visited and therefore, we do not yet have detailedinformation on PCBC’s implementation approach.
Sarasota YMCA: The Sarasota YMCA is a large agency with a well-developedinfrastructure but with no prior experience in delivering child welfare services.Sarasota YMCA sees its role as being a leader and advocate, and contracts outall case management and intervention services in the three counties it serves.The intent was to deviate from the existing system where all the services wereprovided by one agency. They believe that having multiple sub-contractorsprovides a built-in system of checks and balances that doesn’t exist when oneagency has a monopoly on all services. Over time, the existence of these checksand balances, in which agencies are accountable to each other for theircomponents of the service system, has been validated and identified as one ofthe strengths of the system. The lead agency has provided the administrativeinfrastructure (e.g., maintenance of all case records), and reports budgetary andprogrammatic information on a regular basis to its major committees. Thisapproach assures that everyone shares responsibility for functions such astracking trends and identifying problems. Since this lead agency has been

19
operating the longest, they are operating at full capacity and manyimplementation challenges have been resolved.
Family Continuity Programs: Unlike the Sarasota YMCA, FCP was a smallmental health and substance abuse service provider with a less well-equippedinfrastructure for such a major undertaking, forcing them to concentrate much oftheir initial effort on strengthening their infrastructure. The community in Pinellasand Pasco had been planning for CBC for several years and their top priority wasintegrated services. Because integrated service teams operating out of separateservice centers would be a major cultural shift for all of the providers, FCPdecided to maintain leadership over the integration by providing the casemanagement function. FCP views case management as the “glue” for the serviceteams, although they plan to eventually subcontract case management services.
FCP decided to take a staged approach and opened their service centers one ata time. This approach enabled FCP to learn from each service center start-up sothey could refine the model, rather than rush and try to implement them all atonce, which might have stretched their administrative resources beyond theircapabilities. However, because of the time involved in recruiting and trainingworkers for the service teams as described above, and case worker turnover,FCP is only now approaching complete staffing (i.e., all staff have full caseloads).One disadvantage in bringing the centers online in stages was that, for arelatively extended transition period, there were areas that were understaffed andservice teams that were under development.
Hillsborough Kids, Inc.: In Hillsborough County, planning for the transition toCBC started in May of 1998 under the sponsorship of the Hillsborough CountyChildren’s Board. The planning process included an Executive OversightCommittee, a number of subcommittees, as well as provider agencies,community leaders, and advocates. In the summer of 2000, the HillsboroughCounty Comprehensive Plan for CBC was released. There were a number oflarge provider agencies in the county, many of which wanted to be the leadagency. Rather than choose an existing agency, it was decided instead to createa new agency, Hillsborough Kids, Inc. (HKI) as an Administrative ServiceOrganization (ASO). An ASO is a contractual arrangement whereby anorganization provides only the administrative services required by a payer andsubcontracts the service provision function. The CBC ITN was released inNovember 2000 and in March 2001, HKI was selected. HKI was created in acommunity that had a strong commitment to: (1) developing its own vision of asystem of care, and (2) considerable local ownership. CBC was seen as an idealvehicle for accomplishing this vision.
The Department of Children and Families and HKI signed a start-up contract inMay 2001, a services contract in January 2002, and a lead agency contract inMay 2002. HKI performs administrative services including financial management,data services and communication, and quality assurance. Child protection

20
services are performed by a network of local community-based agencies,including five partner agencies that share financial risk with HKI. Three partneragencies (Children’s Home, Inc., Children’s Home Society of Florida, andNorthside Mental Health Center, Inc.) each operate a care center withgeographic responsibility for child protection services (see Figure 4, HKIOrganizational Structure).

21
Figure 4. Hillsborough Kids, Inc. (HKI) Organizational Structure
Families and Children
Family Intervention& Reunification
Specialists
Service ContractProviders
Adoptive &Foster Parents
CrisisInterventionSpecialists
CareManagers
CamelotCare
Center
MentalHealthCare
Children’sHomeInc.
Children’sHome
Society
NorthsideMentalHealth
HKI Staff/Operations
LeadershipCouncil
HKIBoardCollaborative
CouncilDCF
CommunityCourt
Children’s BoardMedia
Private FoundationsEducation
Local GovernmentLaw Enforcement
CommunityAlliance

22
Each care center has a director, an operations manager, and six supervisors(two from each partner agency). A supervisor is responsible for five care teams,and the supervisor’s teams are hired by his/her partner agency. Each teamconsists of a coordinator and two care managers, and is responsible forapproximately 50 children. One team member has primary responsibility for eachchild, but each team member is familiar with all the children on the team. Thefive teams also use the services of a family support specialist.
A fourth partner, Camelot Community Care, Inc., has organized the Foster Homeand Adoption Network (FHAN), a network of seven agencies responsible forrecruitment, licensure, and training of foster and adoptive families. This networkhas created and employs Family Development Specialists whose role is tosupport foster and adoptive parents in caring for their children.
Mental Health Care, Inc., the fifth partner, operates the Children First ResponseTeam, designed to respond immediately to crisis situations and prevent the needfor a family to enter the formal system. The team works with child protectiveinvestigators and provides 6-9 weeks of early intervention services to prevententry into the out-of-home care system.
FamiliesFirst Network: In contrast, District One presented an entirely different setof circumstances. The lead agency governs a predominantly rural, four-countydistrict covering a large geographic area with many resources concentrated inEscambia County. Community leadership, particularly in Escambia County, isvery stable. Those in leadership positions have worked together on numerousprojects and have longstanding personal relationships with one another, creatingan atmosphere of trust commonly found in a rural area. Although the DistrictAdministration initially felt that privatization was bad public policy, they agreed toimplement CBC when it became clear that it would remain State policy.
Planning for the transition to CBC in District One began in 2000. The planningprocess initially included a steering committee in the District Office. The Districthad a very strong human services board. Before the board was abolished, it heldcommunity forums in each county and a district-wide forum in which serviceproviders, judges, foster parents, and other community stakeholders were invitedto discuss CBC. The forum participants expressed a desire for an agency withbreadth and depth and the capacity to manage the large amount of moneyinvolved; they did not want a virtual agency, nor did they want to create a newagency. Given the relatively scarce resources available in the area, it madesense to rely on an organization that already had the capacities needed tooperate as a lead agency. However, this approach greatly limited the availableoptions for a lead agency, and made some respondents feel as if it “was a donedeal”. The ITN was released in the summer of 2000 and the response submittedin September 2000. Lakeview Center, Inc. was selected, and Lakeview createda new division called FamiliesFirst Network (FFN) to operate as the lead agency.Lakeview Center, Inc., is a non-profit behavioral health care center that has been

23
operational since 1954. Five years ago it became affiliated with Baptist HealthCare, the largest health care provider in District One. The Lakeview CenterBoard of Directors governs FFN. DCF has continued to provide child protectioninvestigation and legal services.
FFN performs administrative services including financial management, dataservices and communication, and quality assurance. In contrast to the other leadagencies, FFN provides nearly all services directly through six service centers inthe four counties (although there are some subcontracts with other serviceproviders).
As shown in the organizational chart in Figure 5, FFN has three team leaders:one supervising the two centers in Okaloosa and Walton Counties, oneoverseeing the Escambia County center, and one supervising the two servicecenters in Santa Rosa County. DCF protective investigation staff are co-locatedat each center. Each center has different numbers and types of workers.
In addition to the service centers, FFN has four distinct components. The fosterhome development program has district-wide responsibility for recruiting, training,conducting home studies, and making recommendations for licensure and re-licensure of foster homes. The District placement team makes all foster homeand shelter placements and provides foster parent support services. TheDependency Court Resource Facilitation program has liaisons assigned to eachof the dependency courts in the district and provides case coordination throughthe judicial process. FFN employs approximately 250 staff.

24
Figure 5. FamiliesFirst Network (FFN) Organizational Structure
Lakeview CEO
Board of Directors CommunityAlliance
Director, Specialty Courts
Court Resource Facilitators
Director, Clinical and Court Services
Recruitment SpecialistsLicensing Coordinators
Director, Foster Home Development
Community FacilitatorDistrict Placement TeamSubcontract Management
Director, Resource Management
Director of Network Supports
Acting Foster CareProtective Services AdoptionsDeFuniak SpringsFoster Care/Protective ServicesCrestviewFoster Care/Protective Services
Team Manager, Okaloosa/Walton
Foster Care 1Foster Care 2Out of Home Care 1Out of Home Care 2Protective Services 1Protective Services 2 Adoptions
Team Manager, Escambia
Protective ServicesOut of Home CareFoster CareNavarre Services
Team Manager, Santa Rosa
Team Support Manager,Director of Case Mgmt
Quality Assurance Manager
Policy DevelopmentMgr./In-home Case Coordinator
Staff Assistant
Out-of-Home Case Coordinator
Training Coordinator
Independent Living Coordinator
Independent Living Coordinator
Administrative Support/Independent Living Coordinator
Homefinder
Adoption Coordinator
Director of Family Supports
Client Relations Specialist
Administrative Assistant
FFNProgram Director
Community Liaison

25
Quality Assurance: Partnership Model vs. FFN’s Approach
While all the models are a reasonable fit for their local context, several themesemerged that could be instructive for future lead agencies. First, every leadagency except FFN relied on a provider partnership for quality assurance. In thepartnership model, monthly meetings were held with the CEOs of each partnerand provider organization where information on budget, staffing, performanceindicators, and service utilization were reviewed. Issues and problemsexperienced by everyone were openly shared. There were also joint operationsand quality assurance meetings. Two significant benefits of the partnershipmodel emerged from stakeholder interviews throughout the sites. The first benefitis that there was full disclosure of all information about each agency (i.e.,budgets, staff, performance measures, etc.). Over time, the partnering agenciesmoved from a “me perspective” to a “we perspective”. This resulted in thesecond benefit - shared ownership of the system of care and a commitment tocontinuous quality improvement. One provider agency, for example, volunteeredfunds to help out another agency. Greater creativity, flexibility, and energyseemed to result from the partnership model.
On the other hand, Lakeview Center is accredited by the Joint Commission onAccreditation of Healthcare Organizations (JCAHO) and uses JCAHO’s qualityassurance standards. FFN adopted these JCAHO criteria. While FFN’sapproach lacked the same system of checks and balances found in thepartnership model, the accreditation process provided an external check on theirquality assurance process. Without these additional checks and balances, thereis a danger of complacency (such as found in a monopoly), where there is lessurgency in identifying emerging issues and a potential lack of innovation insolving problems.
As noted below, the Community Alliances had not served in a quality assurancerole at three of the four sites. They had instead become a forum for majorfunders and other stakeholders to share information, plan, identify and resolveemerging community problems. In District One, the Alliance focused mainly onchild welfare and had a greater quality control function. FFN regularly providedthe Community Alliance with plans, outcomes, monitoring results, and programissues.
Cultural Differences Between Rural and Non-Rural Areas
A second theme is the challenge of equitably allocating resources and managingservice provision when the service area is primarily rural. For example, in DistrictOne, some respondents from Okaloosa, Santa Rosa, and Walton Counties saidthere was a clear feeling in these rural counties that all of the resources werecontrolled by Lakeview Center, which is located in Escambia County.
26
It appeared that the culture in the rural counties differed from Escambia, as wasobserved when the rural parts of Pasco County were compared to PinellasCounty. For example, in rural areas the work culture was based primarily onpersonal relationships. Most people tended to be from the area andprofessionals in particular were likely to have long standing relationships witheach other in a variety of roles. Since there was relatively little turnovercompared to urban areas, people established trust and felt free to simply pick upthe phone and discuss a problem directly. There was also a tendency to viewoutsiders (especially those from urban areas) with some distrust and, until provenotherwise, a feeling that they did not understand their situation. It was evidentthat rurality had a significant impact on culture and other issues related to childwelfare, and should be considered when creating alignments for lead agencies insuch locations. Geographic contiguity does not necessarily mean cultural or eveneconomic consistency (e.g., people may shop in another area). To achieve localownership, it is important that there be a shared identity among key stakeholders.
Feasibility of Awarding Lead Agency Contract to New Organization
A third theme is that HKI has shown that it is feasible to award a lead agencycontract to a new organization. In urban settings where there are multiple strongagencies, awarding the contract to one agency can have major politicalconsequences and create strong antagonism between the lead agency andthose who weren’t chosen. This would make creating partnerships difficult andcould result in the other agencies providing less than enthusiastic participation.HKI, in contrast, reportedly had been successful in creating a true collaborativepartnership. This finding is based on interviews with all of the key partners anddirect observation of several different types of meetings involving persons atvarious organizational levels. When the CEO was hired, he expanded thenumber of partners and became more inclusive rather than exclusive.Observations at a number of meetings also demonstrated that, even in the shorttime the lead agency had been operating, individuals acted as HKI participants,rather than as representatives of their respective partner agency. It was clearthat there was a sense of joint ownership of both problems and solutions, with noenergy lost to placing blame.
Staff Recruitment and Retention
There are a number of ongoing common issues for the lead agencies. Recruitingand retaining initial staff during the transition was still a problem despiteconsiderable efforts by the Region and District Offices to directly support thetransition. The fact that both HKI and FFN started at the same time as the RilyaWilson incident further complicated their recruitment and retention efforts.Human resources issues presented special challenges to HKI where each of themajor partners’ personnel policies had different pay scales and benefit packagesso that issues of equity among them and between existing workers and newworkers brought on by DCF were particularly sensitive.

27
Innovations
Even though both lead agencies had only been operating for a short time, HKIand FFN had shown their capacity to establish important innovations. HKIcreated a Crises Response Team, which intervened immediately if theinvestigator felt that there was no immediate danger to the child and that servicesmight prevent the family from becoming formally involved with the child protectivesystem. The Crises Response Team provided intensive home services and hada reported 85% success rate in keeping their participants from being placedunder DCF supervision. FFN has established Youth Transition Coordinators towork with adolescents in obtaining emancipation and transitioning into adulthood.This program was in its early stages but was an important response to a group offamilies who frequently fall between the cracks. In addition, FFN’s CourtFacilitation Program was a major innovation that forged a new partnershipbetween the courts and the lead agency, which ultimately should lead to betterassessments, interventions, and permanency decisions within the ASFAtimelines. The program was developed out of concern that the court was notgetting timely information in order to make decisions about the child’s status andto meet ASFA standards for permanency. The facilitator’s job was to identifyproblems in the system and to facilitate caseworkers in getting the informationand preparing the reports for the court in a timely manner and in a format thatwould be most helpful to the court. The facilitator, therefore, was both a resourceto the FFN case workers and to the courts. There were five Dependency Courtjudges in District One with a facilitator assigned to each judge. These innovationshave the potential to improve performance at the child and family level.
Work Culture
It became clear during this evaluation that one of the most dauntingimplementation tasks is producing changes in actual practice, which is essentialfor improvements in the quality of care. There are several dimensions to thischallenge that became more apparent during this stage in the evaluation.
The first is the dilemma of needing the experience and expertise of former DCFstaff but also needing changes in the ways these staff have practiced for somany years. Many interviews noted that they could not have made the transitionwithout the experienced DCF staff. However, they also reported that changingdirect practice was harder for these staff than anyone anticipated. Consideringthat most of the staff hired were from DCF, it would be unreasonable to expectthat they would change their practice patterns simply because the organizationalauspices had changed. This is not unique to CBC, and has been welldocumented in similar human service reforms (Hoagwood, Burns and Weisz,2002). Furthermore, it is considered “common knowledge” that it is easier to getan inexperienced worker to adopt new paradigms than someone who has beentrained and practiced for a significant time under a different paradigm.

28
Innovations such as FFN’s Dependency Court Resource Facilitation Programand having sufficient stability to implement practices such as family conferencinghave potential to bring about these cultural changes, enhance the quality ofpractice and improve outcomes for children and families.
Second, the importance of the supervisors in bringing about such change and askey drivers in implementing CBC became very clear. More training, support, andsharing of experiences among supervisors needs to take place.
Roles of DCF Central Office and District/Region Office
Reorganization Challenges
Stakeholders also conveyed that DCF needed to reconsider how it was going toorganize itself for its future role as purchaser of services and guarantor of quality.At this point, DCF is beginning to systematically look at its staffing patterns atboth the central and regional level to determine what is needed for variousfunctions at different levels. This is a positive step. The previous reportdiscussed the dilemma faced by DCF in organizing itself for CBCimplementation. The Department had chosen to separate out the CBC office togive it greater visibility and access to leadership as well as to assure it couldconcentrate on the initial implementation issues. Concerns had been raised,however, about the negative consequences of separating it from the FamilySafety Program Office. Under the recent reorganization, the CBC office wasplaced under the Family Safety Program Office. This is a logical progressiongiven that several lead agencies are operational and many of the most significanttransitional problems have been worked out.
As countless implementation studies have shown, the support of leaders andconstituents is key for successful program implementation. It is important tounderstand the nature of the commitment and leadership skills of theimplementing officials at all levels (e.g., DCF, District/ Region, and lead agency).With the initial two sites, the CBC Office was able to devote considerable time tothe transitions. As shown above, the Central Office is now involved in transitionactivities all across the State without any increase in staff. In addition, it was theperception of a few lead agency and district/regional office respondents thatthere was a less than optimal commitment on the part of a number of otherdivisions in the DCF Central Office and ambivalence in some quarters about thechange to CBC. This perception was tied to the lack of responsiveness of somespecialty offices and lower level staff for whom CBC was a minor part of theirresponsibilities.
On the other hand there were highly positive statements about DCF’s leadershipchange this year with the change in administration. Respondents felt that therehad been a positive change in policies and that they were seeing more flexibilityand recognition of the special issues of CBC. For example, DCF is currently

29
addressing the lead agencies’ need for an equitable level of funds foradministrative costs. In addition, the leadership forum (consisting of leadagencies and DCF) is working to identify and resolve other policy and fiscalissues.
Even though participation in CBC required a major shift in priorities and businessprocedures of participating agencies, it was felt that such shifts had generallytaken place. In addition to the systems just mentioned, the two kinds ofparticipants for whom such shifts have been most difficult were the traditionalproviders who had to change their service delivery model, funding, and reportingrelationships as well as DCF, who had to change roles and responsibilities andmanage service delivery in a different way. The major issue in this domain wasthe fact that DCF did have another major priority - the ongoing operation of childprotective services in the remainder of the State. While respondentsacknowledged this was not a problem in their interactions with DCF’s CBCleadership staff, some respondents reported difficulties this past year in theirinteractions with DCF personnel (e.g., legal, contracting, and budget office staff)not primarily involved with CBC.
Technical Assistance
The second issue related to the role of DCF was raised in District One. Theperception of a few stakeholders in this community was that some individuals inDCF Central Office were still operating as if CBC and FFN didn’t exist and thatmany policy arenas needed attention. There were examples provided thatinvolved legal issues because current law and policies were written with theassumption that the workers would be state employees and thus “agents” of thestate. For instance, as employees of FFN the case managers could not getaccess to information such as background checks. Another example was that ittook six months to transfer vehicles used by Protective Services from the Districtto FFN after the transition had occurred.
Consequently, many of the policies had to be created by the District and/or FFN.There were numerous examples of extensive manuals such as “Chapter Two”,which discusses the transition of cases from DCF Protective Investigations to theFFN case managers. It was felt that DCF Central Office should have beeninvolved in reformulating these issues for statewide implementation.
The concerns expressed about lack of technical assistance and support wereraised by District One and FFN stakeholders. It bears repeating that unlike HKIwho had Regional personnel and a CEO with extensive experience in CBC,District One did not have administrative or management staff with previousexperience in managing a CBC transition process. Interviewees alsoacknowledged that the central CBC Office was as helpful as feasible given staffrestrictions and the additional lead agencies under development.

30
Need for a Review of Requirements of Lead Agencies
One respondent noted that much of what accrued in the DCF operated childprotection system was not necessarily based in legislative mandate oradministrative regulations. Instead, practices had evolved over time without anyclear case for their current relevance. It was suggested that a ground up reviewbe conducted to eliminate policies and procedures that no longer were effective.A rules review process is underway to address these problems.
Environmental Factors That Affected Implementation
Rilya Wilson Incident/ Governor’s Blue-Ribbon Panel on Child Protection
There was agreement among lead agency, provider agency and district/regionaloffice respondents across sites that the Rilya Wilson incident, the Governor’sBlue-Ribbon Panel on Child Protection, and DCF’s response imposedunreasonable timelines to implement new standardized policies. Some felt thatthe lead agencies were special cases, and as long as they demonstrated thatthey could account for the children under their care, the lead agencies should nothave to comply in the same way and under the same timetable as was requiredfor Miami. There was no disagreement about the monthly face-to-face in-homevisits by the child’s primary caseworker as all the lead agencies embraced thatas simply a standard of good practice under any circumstance. However, theimmediate counting, fingerprinting and picture taking of children in care wereviewed by many interviewees as un-funded mandates, which had major impactson the fiscal circumstances and operations of all of the sites. This example alsoillustrates the complexity of the nature of the relationship between the leadagencies and DCF. The lead agencies were expected to respond exactly as adistrict office and were not treated as a separate entity within a definedcontractual relationship. While there were differences of opinion among theinterviewees about the ethical implications of fingerprinting, its questionableutility, and potential negative impact on children, there was agreement that thereshould have been negotiation as to the manner and timetable in which thesewere accomplished.
Inadequate and Inequitable Funding Levels
In contrast to last year’s findings, none of the four lead agencies believed theyhad sufficient funds to operate and develop the system of care the way they hadenvisioned. In addition, interviewees perceived inequalities in the funding levelsacross CBC sites. FFN reportedly received the lowest per capita funding of anysite and FCP had half the funds as Broward County for only 100 less children.There is currently a Family Safety Allocation Workgroup with representation fromlead agencies, which has developed an equity formula to address this issue. Theattempts by this work group to come up with an equity formula were seen as a

31
positive first step. This 90-10 equity formula recommends that for a particulardistrict the funding it would receive would be based on its population multiplied by90% plus its percentage of all the State’s direct service dollars spent under thefull equity formula. However, in addition to regional inequities, the perception ofmany stakeholders was that the overall funding level for CBC was inadequate.
Federal Fiscal Requirements
Last year’s evaluation report identified challenges in the lead agencies’ capacityto understand the complex financing of child welfare services and in thelimitations imposed by these systems. While this is no longer a problem for theoriginal lead agencies, it is still a major learning curve for the new sites. Inaddition, some lead agency and district respondents reported frustration aboutthe lack of information about projected annual budgets for lead agencies. Andfinally, many lead agency respondents felt that the degree of flexibility they hadhoped for was not present due to many of the federal requirements. In someinstances the CBCs’ allocation between different federal revenue sources wasproblematic (e.g., IV-E) because the CBC has drawn down all the funds in onecategory but cannot spend all the money in another category. This issue is aresult of federal regulations and statutes. While a more flexible system ofmatching a CBC’s needs with the purpose of the fund or trading between siteswould be extremely helpful, the state’s options are limited because of the federalrequirements. The DCF Family Safety Allocation Workgroup is addressing thisissue as well.
According to respondents, the problems of cash flow reported last year havebeen resolved. A mechanism has been developed in which three months ofoperating expenses is provided up front. There was concern expressed that theState might not be able to maintain this procedure as more lead agenciesbecame operational.
Role of Community Alliances
In all of the sites except District One, there were strong stakeholder groups inexistence when the Community Alliances were created by the Legislature. Thisinitially caused some confusion but over time there has been a somewhatconsistent evolution. Although there were variations in each county, theCommunity Alliances have generally become functioning groups of funders andstakeholders who meet to share information about each other’s operations, andto identify and solve community-wide problems. In most CBC counties, theAlliances have not, nor were they mandated to, focus specifically on child welfare(see s. 409.1671, F.S.). FFN regularly provides the Alliances with plans,outcomes, monitoring results, and program issues. In Hillsborough County thereis discussion underway to merge the Community Alliance with the PurchasingAlliance, another leadership group with similar governance functions andmembers.

32
QUALITATIVE STUDY OF THE SERVICES PROVIDED UNDERCOMMUNITY-BASED CARE
Rationale
This component of the evaluation relates primarily to the quality performanceportion of the Conceptual Model of CBC and the research question, “DoesCommunity-Based Care identify and meet the needs of children and families?”The site visits served dual purposes: the examination of implementation and theexamination of quality.
A general guideline throughout the assessment of quality of services is thatvarious perspectives were included, relying on direct communication with usersas well as providers of the system. The implementation component of thisanalysis sought input from various stakeholders, including: (1) familymembers/consumers, (2) relative caregivers (3) juvenile court judges independency sections, (4) Guardians ad Litem (GALs), and (5) child protectiveinvestigators (CPIs). Each of these groups has a high stake in the success ofCBC within their communities, and is included in this component of theevaluation.
There are three evaluation activities under the “quality” heading: (1) staffingobservations and family member interviews, (2) Community Partners Survey ofkey constituency groups, and (3) general observations made during site visitsand during stakeholder interviews (e.g., Judges, foster parents, etc.). Each of theevaluation activities is presented followed by findings.
Staffing Observations/InterviewsThe examination of quality at each of the sites consisted of observation ofpractice and interviews with family members and caregivers (see Table 3). Forboth site visits, the plan was to observe case staffings and interview familymembers after the meeting. The evaluation team’s assumption was that familymembers would be present at case staffings. This assumption is based on a bestpractice standard that children and their families should be involved as partnersin the planning and delivery of services. As part of their inclusion, children andtheir families should be encouraged and assisted to identify their own strengths,needs, and goals and services needed to meet those goals.
At FFN, however, family members were not present at any of the 18 casestaffings observed. The nine staffings in Santa Rosa County were Early ServiceIntervention (ESI) staffings and the nine in Escambia County were permanencystaffings. It was explained that parents are not invited to ESI staffings because“they bring their attorneys”, requiring FFN the additional expense of bringing theirattorneys. While the case may be made that the circumstances surrounding theinitial staffing of removals may result in lower attendance by parents, it is difficult

33
to explain why permanency staffings would be occurring so regularly withoutparent involvement. It was explained in one of the FFN Service Centers thatpermanency staffings occur every three months, but the focus is typically on theout-of-home caregivers. Family members are typically invited around the ninthmonth to address permanency. When asked how parents are invited, it wasexplained that parents are notified by letter stating the date, time and location ofthe staffings approximately one week prior to the meeting. This is not sufficientnotice to allow for attendance by caregivers who may need to arrange time awayfrom work, transportation, or childcare.
Table 3. Summary of Staffing Observations and Interviews
Staffing Observations InterviewsWith Families
Hillsborough County (HKI) 9 6*Santa Rosa County (FFN) 9 0Escambia County (FFN) 9 0
*Six interviews were conducted, representing five of the cases observed
The Team Observation Form (see Appendix 2) was used for the observations ofstaffings. This form was created by Dr. Michael Epstein at the University ofNebraska-Lincoln for the quantification of Wraparound practices. “Wraparound” isa term commonly used in children’s mental health service delivery and it refers toa flexible process within a system of care that individualizes services for children,youth, and families having multi-system needs. This concept matches both thepractice philosophy explicitly stated by HKI and the system of care plan designedby FFN as part of their original proposal. The Team Observation Form addressesseven domains determined to be of value in successful practice and meetingfacilitation: (1) identification of community resources, (2) individualization ofservice plan, (3) sensitivity to family needs, (4) interagency collaboration, (5)desired outcomes, (6) management of the staffing, and (7) assessment of thestaffing facilitator. A summary of findings is presented in Tables 4 through 10.Throughout review of the findings it is important to keep in mind that many of theitems were answered “NA” due to lack of family attendance at the meeting or thenature of the staffing (e.g., adoptions or Early Service Intervention (ESI)staffings). As such, the quantitative findings presented in this report are morepositive than the impressions formed by the evaluators.
Table 4. Identification of Community Resources (5 Items)
Yes No N/AHillsborough (HKI) 44% 40% 16%Santa Rosa (FFN) 24% 56% 20%Escambia (FFN) 38% 42% 20%
A difference noted between HKI and FFN in the realm of community resources isthe utilization of community providers in the plans for the families. Of the three

34
counties visited, Hillsborough identified community providers most frequently,followed by Escambia. This happened least frequently in Santa Rosa County.FFN tends to provide services under the Lakeview umbrella whereas HKI is moreconnected to various providers throughout the community. Care managers in theHKI system used the staffings as an opportunity to learn more about availableresources. However, it was noted that few representatives from other agencieswere present at the staffings. One community provider was present at one of theFFN staffings. On a positive note, GALs were present at a number of staffings -four in Escambia County and three at HKI staffings.
Table 5. Individualization of Service Plan (9 Items)
Yes No N/AHillsborough (HKI) 47% 22% 31%Santa Rosa (FFN) 49% 28% 22%Escambia (FFN) 75% 2% 22%
The development of creative, individualized service plans continues to be achallenge within both lead agencies. This was evident in the observation ofpractice via the staffings as well as in interviews with multiple respondents,including practice and investigation supervisors. Respondents (i.e., casemanagers, supervisors, and foster parents) in both sites commented on theseeming unavailability of flex funds for use by case managers. Case managersand foster parents, in particular, frequently commented that “money is notavailable” when needed. Administrators in both sites lamented reductions in theavailability of flex funds related to budget cuts.
In one county served by FFN, the case managers complained that the processfor requesting flex funds from FFN was so cumbersome and so frequentlyrejected, that they have stopped making requests out of frustration. The Out-of-Home Coordinator who facilitated the staffings in Escambia County wasparticularly skilled at helping case managers identify strengths of families andincorporating those into service plans. The service plans, however, still tended tobe limited to a traditional array of services (i.e., counseling and parentingclasses).
The majority of service plans and planning processes observed within HKI wererated by the evaluators as being individualized, and the supervisors present atthe staffings were challenging the care managers to be even more creative.
Table 6. Sensitivity to Family Needs (10 Items)
Yes No N/A*Hillsborough (HKI) 41% 9% 50%Santa Rosa (FFN) 7% 17% 77%Escambia (FFN) 21% 7% 73%* Due to absence of family members at staffings.

35
The ratings in Table 6 regarding the sensitivity to family needs are difficult tointerpret due to the lack of family attendance at the staffings observed,particularly in Santa Rosa and Escambia Counties. Questions included in thissection of the observation form include “The parent/child is seated or invited to sitwhere he/she can be included in the discussion”, “Family members are treatedin a courteous fashion at all times”, and other questions pertaining to familyinvolvement in the meeting.
While family members were present at the majority of the HKI staffings, therewere a few unfavorable observations regarding their level of involvement andtreatment during the meetings. For example, a family being spoken about ratherthan spoken to during the meeting (e.g., “When did her [referring to the mothersitting in the room] die?” and “Do they [the couple sitting in the room] speakEnglish?). This example may also indicate a need for heightened attention tocultural and ethnic differences.
Case managers in Santa Rosa and Escambia Counties seemed to be morefamiliar with their families than did their counterparts in Hillsborough County. Thismade the fact that the parents and caregivers were not present even moreunsettling. It appeared that some FFN case managers have establishedrelationships with their families, but may not view their attendance at staffings asa high priority. In one FFN location, however, there was no discussion during thestaffings about why the parents were not in attendance.
Table 7. Interagency Collaboration (7 Items)
Yes No N/A*Hillsborough (HKI) 16% 16% 68%Santa Rosa (FFN) 51% 21% 29%Escambia (FFN) 33% 19% 48%*Due to absence of providers at staffings or discussion of other providers.
Interagency collaboration is somewhat difficult to assess using the TeamObservation Form because the form asks specific questions about theparticipation of providers from other agencies in the staffing process. As noted inTable 7, there was limited representation of other agencies at any of theobserved staffings. The staffings in Santa Rosa County were most consistentlyrated as evidencing interagency collaboration. This is likely because they wereESI staffings being held with the CPIs and FFN staff. It was difficult to determineif interagency collaboration was occurring in Escambia County since LakeviewCenter continued to be the primary provider. Respondents during the FFN sitevisit noted that there were lingering issues around confidentiality and someproviders were reluctant to share information with case managers about thefamilies they were jointly serving. In Hillsborough County, there was evidence(e.g., as evidenced by discussions in staffings), although limited, thatcommunication was occurring between providers outside of the meetings. It was

36
observed during both site visits (HKI and FFN) that multiple staff members wereaware of case status of families, suggesting that internal communication wasoccurring.
Table 8. Measurable Outcomes (2 Items)
Yes NoHillsborough (HKI) 67% 33%Santa Rosa (FFN) 0% 100%Escambia (FFN) 100% 0%
The two interrelated questions on the rating form under “desired outcomes” are(1) The plan of care goals are discussed in objective, measurable terms” and (2)“Objective or verifiable information on child and parent functioning is used asoutcome data.”
As noted in table 8, the staffings in Escambia County included goals andobjectives that were presented clearly and followed by discussion regarding goalattainment. In the discussion of each case there were objective and measurableoutcomes. This was primarily due to the facilitator’s leadership and practiceperspective. In Santa Rosa County supervisors presented the cases and therewas little clarity regarding goals and objectives, resulting in the 0% figurepresented above.
During the HKI site visit, there was variation across the three Care Centersprimarily due to the leadership styles of the three individuals facilitating themeetings. For example, in one of the Care Centers, the facilitator focused onguiding the care manager through the presentation, whereas another facilitatorfocused on talking directly with the parents and caregivers in a therapy-stylemanner. As a result, there was variability in the amount of attention paid to eitherthe discussion of objectives or their attainment.
In addition to the staffing observations, respondents in both systems indicatedthat the “numbers” (i.e., performance on key outcome measures) look favorablebut that there was a lack of emphasis on the quality of services. The data do, infact, look positive when reviewing Quality Assurance (QA) reports from bothsites. Both HKI and FFN, in addition to the Region/District, have QA proceduresin place that allow them to track compliance with Adoption and Safe Families Act(ASFA) standards.
Table 9. Management of the Staffing (5 Items)
Yes No N/AHillsborough (HKI) 84% 0% 16%Santa Rosa (FFN) 80% 0% 20%Escambia (FFN) 80% 0% 20%

37
Some staffings in Hillsborough and Santa Rosa Counties took on a tone of“compliance” and a review of parent(s)’ behavior. The observation that this isoccurring in the absence of the parents is contrary to accepted best practices.Best practice literature suggests that family involvement is a key factor in thesuccess of both prevention and intervention programs (Duchnowski, Kutash, &Friedman, 2002; Thomas, Leicht, Hughes, Madisan, Dowell, 2003). Overall, themanagement of the staffings and the performance of the staffing facilitators wereseen as relative strengths during both site visits (in all three counties wherestaffings were observed). This is promising, indicating there is a mechanism forquality care coordination. Both lead agencies have adopted the practice ofinviting family members to care planning meetings. The next steps in theirpractice evolution will be to engage families more fully in partnerships to meettheir identified needs and goals.
It was interesting to note during one HKI staffing that the supervisor told thefamily there would be another, less formal opportunity for the family to gettogether with all of the players to discuss their future. It is not clear why thestaffing that had all of the players together could not be used for that purpose.
Table 10. Assessment of the Staffing Facilitator (6 Items)
Yes No N/ASanta Rosa (FFN) 41% 59% 0%Escambia (FFN) 100% 0% 0%Hillsborough (HKI) 80% 11% 9%
This section of the Team Observation Form includes questions about theorganization of the meeting. For example, does the meeting facilitator make theagenda clear, does he/she review goals and objectives, is the meeting strengths-focused, and is a subsequent meeting scheduled. In the majority of staffingsobserved, the staffing facilitator organized the meeting in such a way that itspurpose was evident and issues needing to be addressed could be discussed. Arelative, and important, strength observed in all staffings was the focus on safetyof the children and families. This was particularly an issue in Santa Rosa Countywhere there was a high incidence of domestic violence and substance useinvolved in the cases being staffed. Across both sites, the staffings wereappropriately used by care coordinators/case managers as opportunities to askquestions about policies, procedures, and service options. During the HKIstaffings where families were present, they also had the opportunity to raisequestions about what services were available.
As noted in Table 10, the staffings in Escambia had the highest ratings forfacilitation. The cases were presented clearly and had stated goals andobjectives. A strengths perspective was inherent in the discussion of each caseand there were objective and measurable outcomes. The staffings in Santa Rosahad the most variability in this area due to the fact that various case managers
38
presented their own cases and facilitated the staffings. In Santa Rosa County,supervisors also used the staffings as opportunities to ensure that fingerprintshad been obtained and that other data had been entered into HomeSafenet.
Family Member InterviewsA brief interview format was developed specifically for this evaluation andtypically took 15 to 30 minutes to complete (see Appendix 3). The interviewincluded questions about contact with case managers, involvement in caseplanning activities, satisfaction with services, and involvement with lives of theirchildren who are in out-of-home care. When family members were present,consent was obtained for the observation and/or the interview.
During the HKI site visit, staffings were observed in all three Care Centers.During the FFN site visit, staffings were observed at two of the six ServiceCenters (Metro and Milton offices). Reportedly, family members were invited toattend all of the staffings in both sites. Family members were present at only fiveof the HKI meetings. Of the remaining four staffings, two were adoptionfinalizations and two were no-shows. In the case of the adoption finalizations, thecare manager had spoken with the adoptive families and the families had, in turn,made the decision that attendance was not worth missing work, as the meetingwas basically a formality. Of the two no-shows, one family involved two teenagedaughters and their estranged father; all three parties had made it clear theywould not be attending. The other family was an initial staffing and no one hadyet established a relationship with the mother to understand why she was notpresent.
Six interviews were conducted along with the HKI observations, reflecting five ofthe nine cases:
• A biological father and his sister (paternal aunt to the children in care)were interviewed together.
• A foster mother and father were interviewed. The biological mother hadbeen at the staffing, but left prior to the interview.
• Non-relative caregivers (husband/wife) and biological mother wereinterviewed separately.
• A biological mother was interviewed.• A biological mother was interviewed.
All of the parents/caregivers interviewed appreciated the opportunity toparticipate in the meetings regarding their children or the children in their care.The foster mother interviewed commented that it was the first time in 15 years asa foster parent that a staffing was scheduled around her work day. The parentsand caregivers consistently stated they did not believe they were participants inthe case planning process, but thought the meetings were an opportunity forthem to be informed about what was happening. Parents and caregivers spokepositively about their care managers, reporting they were trying to help thefamilies. However, one caregiver described the care manager as an objective

39
party to the process (e.g., someone to gather information) rather than assomeone to support and advocate for the family. This is apparently how the casemanager had described his role to the family.
Of the four biological parents interviewed as part of the HKI site visit, three ofthem had relatives caring for their children. Each reported that they were pleasedthe agency had been willing and able to place their children with family asopposed to foster care. In the remaining case, relative placements had beenunsuccessfully pursued. Visitation with children in out-of-home care wasoccurring regularly, perhaps due to the family connections, but also due to HKIefforts. There were mixed views from the parents about how involved they werein decision-making regarding their children while they were in out-of-home care.It is only fair to also note that there was also apparent variability in the level ofcooperation among the parents.
No family interviews were conducted during the FFN site visit. Initially, theevaluation team was provided names of “parents” (two biological parents, onepair of therapeutic foster parents, and two foster parents). While two fosterparents were interviewed, neither of the biological parents were available forinterviews, either in-person or on the phone. While on-site, evaluation staff madethe request that they be allowed to “shadow” case managers or attend anymeetings where families would be present. One interview occurred as a result ofthis effort. This interview was with a parent involved in the NeighborhoodPartnership Project, one of the innovative units at the Metro Center. The meetingwas an early orientation-type contact with the family and the caregiver was notyet able to discuss services.
The evaluation team is reluctant to make an assessment of the status of practicewithin FFN since direct practice was never observed, despite multiple efforts.What was observed, however, does not reflect the stated principle of “Children,their parents, and foster parents should be involved in the planning and deliveryof services” that is found in FFN’s CBC Readiness Assessment.
Community Partners SurveyThe evaluation team slightly modified the Community Partner Survey previouslyconducted by DCF’s Office of Mission Support and Performance. Rather thanresponding to their relationship with DCF, the identified partners were requestedto evaluate their working relationship with the local lead agency (i.e., HKI orFFN). The identified partners who received the survey included protectiveinvestigators and their supervisors, Guardian ad Litem coordinators (GAL), andthe juvenile court judges in each of the dependency sections. The number ofresponses was low and no follow-up attempts were made. It is recognized that infuture evaluation studies, a stronger methodology is required to obtain asufficient number of responses to allow for generalizable statements to be made.Future efforts at the Community Partners Survey will involve follow-up contacts.In total, 24 surveys were returned (15 from HKI and 9 from FFN). Over-

40
representation by one stakeholder group occurred at both sites; GALs from theHKI site and child protective investigators from FFN. No responses werereceived from dependency judges from either site. Fortunately, three judges wereinterviewed as part of the site visits. Their input is included under the heading ofsite visit observations.
The survey included 12 questions to which the respondent was asked to offer arating, using the following scale: 5 – Strongly Agree, 4 – Agree, 3 – Neutral, 2 –Disagree, and 1 – Strongly Disagree. Overall findings are presented in Table 11.Caution needs to be offered in review of these findings. Surveys were returnedby a self-selected, and perhaps particularly disappointed, subgroup of communitypartners. However, themes observed in review of these findings are consistentwith interview findings during site visits. In particular, there were concerns in bothsites about the inability of the case managers to make decisions on the spot(item #9) and the need for lead agencies to minimize bureaucratic red tape (item#11). The issue of the case managers being unable to make independent, onsitedecisions also was observed in the Santa Rosa County court and staffingobservations. Comments made during the HKI site visit were that workers had torun every decision past their supervisors, sometimes leaving families inunnecessarily difficult positions (e.g., responding to requests for assistance).
In summary, the Community Partners Survey highlights the need for ongoing andexpanded partnering in both communities. While the lead agencies (HKI andFFN) bring with them new potential, it is important for them to build on existingsystems and relationships. Case managers’ inability to visit with families who hadpreviously been visited by DCF case managers is an avoidable barrier. Whilesurvey respondents represent only a small sample of dissatisfied “partners”, theydid highlight the existing need. GALs and CPIs are both critical players in anychild welfare system, public or private.

41
Table 11. Overall Ratings on the Community Partners Survey
In my opinion, the local lead agency . . . AverageFFN(n=9)
AverageHKI
(n=15)1. cooperates well with our program. 3.38 3.21
2. is accessible to our program. 3.25 3.67
3. has staff who is competent. 3.00 2.80
4. shares appropriate information with ourprogram.
3.11 3.13
5. has included us in ongoing planning 3.00 2.33
6. is consistent and fair in its dealings with ourprogram.
3.25 2.80
7. responds in a timely manner. 2.78 3.33
8. responds in a manner that is sensitive to thepeople we serve.
2.88 2.92
9. provides its front-line staff with the necessaryauthority to act.
2.43 2.27
10. does a good job in following-up and monitoringits cases.
3.00 2.87
11. does a good job in surmounting bureaucraticobstacles.
2.38 2.27
12. overall is an effective partner with our program. 2.88 2.875 = Strongly Agree, 4 = Agree, 3 = Neutral, 2 = Disagree, and 1 = Strongly Disagree
Site Visit ObservationsAs indicated in the Community Partners Survey responses, there is a perceptionamong some stakeholders that front-line staff do not have “the necessaryauthority to act”. An issue repeatedly raised by case managers, their supervisors,and child protective investigators during the FFN site visit was the statutoryinability of case managers to remove children. While this practice is consistentwith Florida statute, it resulted in frustration on the part of the case managersthemselves as well as the CPIs who have to add to their existing workload. Arelated issue that arose in both site visits was the perceived authority of CBCcase managers in their communities. In the FFN site, there was a concern aboutworkers inability to visit families on military installations. An issue shared by HKI

42
(revealed during care manager focus groups conducted by HKI, not as part of thesite visit) was the inability of care managers to enter jails. In both cases, thepreviously existing jurisdiction of DCF has not been transferred to the leadagency case managers under CBC.
Interviews conducted with Judges and child welfare legal services (DCF inDistrict 1 and the Office of the Attorney General in Hillsborough County) indicatedthat a great deal of attention had been paid to improving the interface betweenthe courts and the child welfare service system. Hillsborough County hadrealigned its three dependency sections to coincide with the three HKI CareCenters and had begun using General Masters to hear judicial reviews. Opencommunication between the Office of Attorney General (OAG) and HKI allowedfor consultation regarding preparation of cases for court and the timeliness offiling case plans. In District 1, FFN and the courts began using court facilitators infamily cases where there have been delays in achieving permanency. Thisallows for an objective assessment of where the “stall” may be (either on the partof the family or the case manager) and facilitation is then provided by the courtliaisons. Both initiatives were seen as early successes by lead agency andDepartment staff interviewed during the site visits. They would not, however, besuccessful without the direct support and interest of the Judges who are viewedas visionaries in both communities.
Foster parents (12 in Hillsborough County and 5 in District 1) were interviewed atboth sites and reportedly faced challenges during the transition. At both sitesfoster parents reported other foster parents quitting during the transition, and thatsome others were threatening to quit. In attempts to validate these reports, arepresentative from the SunCoast Region reported that there were a smallnumber of Hillsborough County foster parents who “quit” during the transition; itwas much more the case that they were threatening to quit and complainingabout changes. A FFN representative denied that any foster homes hadvoluntarily closed during the transition. Some District 1 foster parents reportedbeing unable to access funds for entertainment (e.g., summer camps andoutings) of their children that used to be available. Neither group of foster parentsfelt they had been involved in the planning processes prior to the implementationof CBC. Foster parents in both sites report not being made aware of change inpolicies until after the fact. For example, in Walton County foster parents used tosubmit mileage once or twice a year to create a “bonus” for themselves. It is nowrequired monthly and will not be paid after sixty days. In Hillsborough County, afoster parent who wants a child removed from his/her home needs to submit atwo-week “request for move.” The process to initiate the move does not beginuntil the end of the two weeks. Data regarding foster parent retention andsatisfaction during the transition to CBC will be tracked in future evaluationstudies.
Quality services are most likely to be provided by staff who feel supported in theirwork and have a manageable workload. The Sarasota YMCA has been the mostsuccessful at reducing and maintaining caseload sizes to a reasonable level,

43
averaging 14 child cases per worker. FCP was again attempting to get itscaseload size down, with an average of 27 child cases per manager. HKI hasstruggled to some extent to decrease caseloads, but is now averaging 20 casesper care manager. (Note: HKI care managers follow families throughout thesystem. As a result, some of their “cases” are protective service families andsome are foster care children.) FFN was currently operating with an averagecaseload of 22 child cases per worker. However, the perception of respondentsacross sites was that the qualifications for case managers set by lead agenciesare higher than prior to CBC.
A high number of cases per case manager can in some areas be furtherexacerbated by the amount of travel required to see children. During a groupinterview with three FFN case managers, the case managers reported that on aweekly basis they can put as much as 150 miles per day on their car, resulting inone completed home visit. HKI care managers have cell phones rather than deskphones, allowing them to continue their work while in the field. This is somethingthe FFN case managers have requested. A major finding is that case managersin both sites believe they could better do their jobs if funds were more readilyavailable for services and supports.
The perception of many stakeholders in both communities was that, in theirinteractions with CBC case managers, the behavior of the case managers hasbeen more “professional” than that of DCF case managers in the past. By thesame token, stakeholders in both communities reported that supervisors neededto change their way of doing business to reflect a holistic, strengths-basedapproach to both practice and supervision. Case managers in both sites reportedwanting more field training and mentorship. Training provided by the PDC wasbelieved to be a reasonable introduction, but far more is needed and requested.Staff in both sites were asked what additional training was offered. At FFN,training provided by Lakeview was viewed as an impediment to being able tocomplete their work (e.g., training held in Pensacola on days when court is insession in Milton). A series of Lakeview-sponsored training modules needs to becompleted prior to being removed from probationary status. These trainingsessions are related to Lakeview’s agency policies rather than case managementpractice. Some case managers reported this process taking over six months.What they reported they would rather have is additional training in working with“difficult” families, developing case plans, and engaging families in the servicecommunity (e.g., substance abuse and domestic violence).
Quality Conclusions
A summary of quality analysis methods is presented in Table 12. The guidingframework of the quality analysis was that practice could not be assessed without(1) talking to service recipients and (2) observing practice. The first assumptionresulted in the individual caregiver interviews and group foster parent interviews.The second resulted in the staffing observations. Another tool introduced to the

44
evaluation was the Community Partners Survey, which was implemented to gaininsight into the perceptions held by community stakeholders of the CBC leadagencies. While used in a limited manner it revealed important perspectives ofkey community stakeholders (i.e., Guardians ad Litem and child protectiveinvestigators). The Survey will be expanded for use during the FY03-04evaluation efforts.
Table 12. Summary of Quality Analysis Methods
HKI FFN
Staffing observations 9 across all three ServiceCenters
9 in Santa Rosa County9 in Escambia County
Family interviews 6 family members interviews(reflected 5 cases)
No family interviews
Foster parent interviews 12 interviewed 5 interviewedCommunity PartnersSurvey
15 received 9 received
The quality analysis focused on the implementation of CBC in two sites – HKI inHillsborough County and FFN in District 1. Direct comparison between the twosites is not appropriate due to differences in their structure and theirdevelopmental phase of implementation.
The overall observation during the HKI site visit was that there is a clear vision ofhow practice should occur (i.e., according to Wraparound principles). Thispractice is emerging and there is a general consensus that the biggest impact willbe made by addressing reduction of caseload size, supervisory practices, directpractice approaches, and philosophies. As a whole, HKI has procedures in placeto encourage family participation and to move toward permanency. A concernvoiced by some key stakeholders in Hillsborough County was that cases arebeing “rushed” to assure timely permanency and that this emphasis may overridea focus on quality.
The result of the quality analysis at FFN was a concern that family participation isnot a high priority, and it was unclear during the site visit how practice will evolveto the standard presented in their proposed system of care. The introduction ofthe family conferencing model that is in the planning stages will begin to addressthis major concern. While caseloads were not particularly high, there may bechallenges due the geographic distance traveled by some case managers.Additional challenges included some of the highest rates of domestic violence inthe state, extreme poverty in the northern part of the district, and increased ratesof substance abuse and related criminal activity (e.g., arrests for crystalmethaline labs). There were, however, some promising practices in existence toaddress these concerns (e.g., Court Liaison and Neighborhood Projects).

45
Based on the multiple methods employed in the quality analysis, there are,however, some key findings that hold true for both sites. These findings reflect anearly stage of implementation, and are likely to be true for any CBC site in its firstyear of implementation.
Case managers believe they could better do their jobs if funds were morereadily available for tangible supports (e.g., utility deposits and furniture)and needed child assessments.
Florida Statute and Department policies need to be revisited to determineif they meet the needs of CBC (e.g., transfer of authority and removal ofchildren).
Training and supervision for case managers needs to be adapted to alignmore closely with the demands of CBC. Specific areas of training for casemanagers include: family-centered case management, development ofservices plans, and improved integration of community resources into theplans.
Training for case management supervisors needs to support the changesexpected in frontline practice.
Foster parents need reassurance during the ongoing transition and needto be informed of changes in policies and practice as they occur.

46
PROGRAMMATIC OUTCOMES
Because the performance outcomes set up by the 1997 Adoption and SafeFamilies Act (ASFA) continue to be the primary goals in child welfare practice,monitoring and measuring of these outcomes remains an important task.Therefore, the performance of CBC agencies in Florida was assessed on ASFArequired objectives (i.e., child safety, permanency, and well-being). Sixquantitative indicators were selected to measure child safety, permanency, andwell-being: (a) the proportion of children exiting out-of-home care, (b) rates ofreentry into out-of-home care, (c) rates of recurrence of maltreatment, (d) rates ofreunification with parents, (e) rates of custodial placement with relatives, and (d)the proportion of children with finalized adoption. The rate of reentry into out-of-home care and the rate of recurrence of maltreatment were selected asindicators of CBC counties’ efforts to attain the goals of child safety and well-being. The proportion of children exiting out-of-home care, the rate ofreunification with parents or relatives, and the proportion of children with finalizedadoption were the indicators selected to examine the CBC counties’ performanceon achieving permanency. These quantitative child protection indicators wereselected in consultation with the Office of Community-Based Care and weredeveloped in collaboration with the Office of Family Safety. Although thequantitative child protection indicators used in these analyses were modeled afterthe Performance-Based Program Budgeting program4 (PB2) and federal Adoptionand Out-of-Home Care Analysis and Reporting System (AFCARS) indicators,FMHI’s access to the original, disaggregated child-protection databases allowedus to construct indicators that were more appropriate for detailed geographic andlongitudinal statistical analysis. For example, analysis of these indicatorsdeveloped by FMHI relied on entry or exit cohorts of children, as opposed togroups of children who were in care at a specific point-in-time, thus reducingselection bias. Moreover, the statistical methods used to analyze the data werechosen to maximize the utility of the out-of-home care episode-level data thatwere made available by DCF. The above-mentioned indicators were calculatedfor FY01-02 to collect baseline data during this time period as well as to uncoverany differences between CBC counties.
Sources of DataThe primary source of data for the quantitative child protection indicators used inthis report was the State Automated Child Welfare Information System (SACWIS)for the State of Florida – HomeSafenet (HSn). The Florida Abuse HotlineInformation System (FAHIS) was used to obtain information on maltreatmentreports because the transition of this database system to HomeSafenet had notoccurred yet. HomeSafenet was used to obtain information on (a) period of time
4 see http://ewas1.dcf.state.fl.us/mspt/enc/encyclopedia.cfm (website available via DCF Intranet only)

47
when services were provided to the child, (b) specific service provision (e.g., in orout-of-home care), (c) reasons for discharge (e.g., adoption finalization,emancipation, reunification with parents, relatives, etc.), and (d) dates of serviceinitiation and service termination. Demographic information on children in thesystem that includes race, ethnicity, gender, age, and county of residence wasalso obtained from HomeSafenet.
MethodologyAll counties that implemented or began their transition to Community-Based Care(CBC counties) were included in the analysis. The counties that did not begin theimplementation of CBC were examined together and were referred to as “Rest-of-State” throughout the remainder of this section. The comparison was done byranking all the CBC counties and Rest-of-State on each indicator. Because of theState transition to the new information system and the first attempt to calculate allof the above-mentioned indicators using this system, the primary goal of thisanalysis was to obtain baseline data for CBC counties and to compare ‘moreexperienced’ counties or counties where CBC was implemented more than 2years ago with counties where the implementation of CBC is still in progress (seeFigure 1). Because the data available for the analysis were collected during FY2001-2002, only Sarasota and Manatee counties had implemented CBC for morethan 2 years during that period of time. The following CBC counties wereincluded in the analysis: (1) District one: (a) Escambia, (b) Okaloosa, (c) SantaRosa, and (d) Walton; (2) SunCoast Region: (a) DeSoto, (b) Hillsborough, (c)Manatee, (d) Pasco, (e) Pinellas, and (f) Sarasota; and (3) District 12: (a) Flaglerand (b) Volusia. Statistical methods included a survival analysis of time-to-eventindicators (i.e., percentage of children exiting out-of-home care, reentry into out-of-home care, and recurrence of maltreatment) and calculation of percentagesbased on either entry or exit cohorts for point-in-time indicators (i.e., thepercentage of children returned to parents, the percentage of children placedwith relatives, and the percentage of children with finalized adoption). Allindicators were calculated for the fiscal year 2001-2002 entry cohorts with 12months follow-up.
LimitationsA few limitations should be noted. First, the calculation of the above-mentionedindicators (with the exception of Recurrence of Maltreatment rates) wascalculated using data from the new database known as HomeSafenet. BecauseHomeSafenet was utilizing new fields, the examined indicators had to beredefined and new algorithms had to be developed.
Second, because HomeSafenet was recently implemented (the implementationbegan in January 2001 and ended in December 2001, and 2002 was the first fullyear when all counties were using HomeSafenet), the staff at local agencieswere still in the process of learning the new system, which might have impactedtimely data entry and the accuracy of these data. Therefore, the validity of thedata entered has to be further tested. Finally, the system itself is in the process of

48
refinement, which in turn, impacts the possibility of calculating certain indicators(e.g., reentry into out-of-home care because of inconsistency of assigning thesame identification number for the child who was reentering out-of-home care).
Proportion of Children Who Exited Out-of-Home Care
Description of the IndicatorThe proportion of children who exited out-of-home care during the first 12 monthsafter entry in FY01-02 was an estimate of the percentage of children who hadfewer than 12 months length of stay in out-of-home care (one of the ASFAgoals). The calculation of this indicator was also based on duplicated counts ofchildren, that is, children could have multiple episodes of out-of-home care withina fiscal year. Hence, all children who entered out-of-home care during FY01-02and began an out-of-home care episode, including children who began anepisode more than once during the same year, were incorporated in the analysis.
This definition of an out-of-home care episode was developed in collaborationwith the Department of Children and Families’ Office of Family Safety. An out-of-home care episode was defined as a continuous period of time in out-of-homecare, which begins on the date when the child was removed from parents orhome caregivers (i.e., Removal Date) and ends on the date when the child wasdischarged from an episode of out-of-home care (i.e., Discharge Date). An out-of-home care episode may consist of multiple placements (e.g., family shelterhome, residential treatment, pre-adoptive home, supervised practice independentliving, etc), which were all included in an episode of out-of-home care if there isno Discharge Date after a placement ends. The indicator was based on entrycohorts, that is, only children who entered out-of-home care (i.e., had removaldates fall within FY01-02) during this particular fiscal year were included in theanalysis. The decision to use entry cohorts was made in order to more accuratelyassess CBC program effects (i.e., to examine only children who came into careafter CBC was implemented and exclude children who came into care before theimplementation). The proportion of children who exited out-of-home care wascalculated using survival analysis (a statistical procedure that allows analysis ofdata collected over time as well as incorporation of information about caseswhere the event of interest did not occur during data collection [e.g., children whodid not exit out-of-home care during the 12-month period]).

49
ResultsGeneral results of the survival analyses are shown in Table 13.
Table 13. Proportion of Children who Entered Out-of-Home Care in FY01-02and Exited Within 12 Months: CBC Counties and Rest-of-State.
ComparisonSites
Results (%) Total number of cases inentry cohorts
Escambia 61.7 469
Flagler 56.3 16
Sarasota 54.5 183
Okaloosa 54.3 265
Santa Rosa 53.5 217
Manatee 51.0 415
Walton 50.8 71
Rest-of-State 44.9 13,580
DeSoto 36.6 55
Pinellas 35.9 1,133
Volusia 35.0 598
Pasco 31.4 307
Hillsborough 31.3 1,531
Mean = 45.9%; Median = 50.8
Table 13 shows the percentages of children exiting out-of-home care duringFY01-02. The counties were ranked in descending order according to theproportion of exiting from out-of-home episode children. As shown in Table 13,Escambia had the highest (61.7%) proportion of children exiting out-of-homecare during FY01-2002. All counties in District One (i.e., Escambia, Okaloosa,Santa Rosa, and Walton) had higher or equal the median percent (the Median forthis distribution is 50.8) and higher than the average (the Mean for thisdistribution is 45.9) percentages of children exiting out-of-home care. In addition,Sarasota, Manatee, and Flagler were the counties with higher than averagepercentages of children exiting out-of-home care. This corresponds to shorteraverage lengths of out-of-home episodes for these counties. The percentage forthe Rest-of-State was 44.9, which was not substantially below the average forthese CBC counties. Hillsborough was the county with the smallest percentage ofchildren exiting out-of-home care during FY01-02. The proportion of children

50
exiting out-of-home care in Hillsborough County was 30.4% lower than theproportion of children exiting out-of-home care in Escambia. Higher thanaverage proportions of children exiting out-of-home care in Manatee andSarasota counties might be explained by the fact that these counties were thefirst to implement CBC.
Reentry into Out-of-Home Care
Description of the IndicatorThe calculation of this indicator was based on exit cohorts of children (i.e.,children who exited their first out-of-home care episode during FY01-02, or whohad a Discharge Date during this fiscal year) and on unduplicated counts ofchildren (i.e., only children who exited their first episode of out-of-home carewere counted). Survival analysis was used to calculate the proportion of childrenreentering out-of-home care within 12 months of FY01-02 after exiting their firstepisode. Reentry into out-of-home care was indicated by a new Removal Dateafter a Discharge Date existed for the same child identified by a unique numbergiven by the HomeSafenet system. The calculation of this indicator hadsubstantial limitations. First, not all children who exited out-of-home care werefollowed for 12 months after exit because the last day of the data extract in therequested dataset was December 31, 2002. Second, because of the potentialinconsistency of assigning the same identification number for the child who wasreentering out-of-home care, some children who reentered out-of-home careduring FY01-02 could not be traced and as a result, could not be included in theanalysis. In some counties (e.g., Flagler, Santa Rosa, and Walton) no childrencould be identified as reentering out-of-home care because of small populationdensity and insufficient follow-up time.
ResultsGeneral results of the analysis of reentry into out-of-home care are shown inTable 14. The counties were ranked in ascending order according to theproportion of children reentering out-of-home care episode. However, due to anextremely small number of cases where reentry could be identified, these datashould be interpreted with caution.

51
Table 14. Comparison of CBC Counties and Rest-of-State on Proportion ofChildren Reentering Out-of-Home Care
County Percentage
Totalnumber ofcases in
exitcohorts
Okaloosa 0.6 147Sarasota 0.9 99Volusia 1.1 214Escambia 1.8 281Pinellas 1.9 425Rest-of-State 2.0 7,950Manatee 2.0 249Hillsborough 2.8 617Pasco 3.5 126DeSoto 4.0 33Flagler n/a 7Santa Rosa n/a 81Walton n/a 26
Mean = 2.06%; Median = 1.95
The Median for these reentry rates is 1.95 and the average (the Mean)percentage is 2.06. When compared to other counties and Rest-of-State, DeSotoshowed the highest reentry rate (4%) while Okaloosa showed the lowest reentryrate (0.6).
Proportion of Children with Recurrence of Maltreatment
Description of the IndicatorThe rates of recurrence of maltreatment reported here are estimates produced bysurvival analysis. Data for this analysis consist of unduplicated counts ofmaltreated children grouped by fiscal year entry cohort. Only children with“founded” maltreatment (i.e., when the protective investigation resulted in afinding of abuse, neglect, or threatened harm and when there was someindication of any type of maltreatment) were included in the analysis. Recurrenceof maltreatment was defined as a second founded episode of maltreatment (i.e.,when there was some indication of maltreatment or maltreatment was verified)within 12 months of a child’s first founded episode.
ResultsGeneral results of the analysis of recurrence of maltreatment are shown in Table15. The counties were ranked in ascending order according to the proportion of

52
children who had a second episode of founded maltreatment. As shown in Table15, Escambia County has the lowest (9.1%) proportion of children withrecurrence of maltreatment during FY01-02. The mean rate for this distribution is10.99% and the median is 11.1. Walton County had the highest recurrence ofmaltreatment rate during FY01-02. Almost all counties in the SunCoast Region(Hillsborough County is the only exception) had equal or lower than the Medianrate for recurrence of maltreatment.
Table 15. Recurrence of Maltreatment (Percentage)
County Percentage Numberof cases
Escambia 9.1 2,146Pasco 9.6 3,187Pinellas 10.1 7,562Rest-of-State 10.1 93,725DeSoto 10.2 334Sarasota 10.6 1,766Manatee 11.1 2,744Hillsborough 11.3 9,382Flagler 11.4 481Okaloosa 11.4 1,945Santa Rosa 12.1 1,521Volusia 12.9 4,566Walton 13.0 553
Mean = 10.9%; Median = 11.1%
Proportion of Children Returned to Parents or Legal Guardians andCustodial Placement with Relatives After Exiting Out-of-Home Care
Description of the IndicatorAnalysis of these two indicators was based on exit cohorts of children, definedhere as the duplicated number of children who exited out-of-home care duringFY01-02. Children in out-of-home care whose case status was not closed (i.e.,did not have a Discharge Date) and children who exited out-of-home care afterJune 30, 2002 were excluded from the analysis. Classification of childrenreturned to “parents of removal home caregivers” was based on “reasons fordischarge” from the HomeSafenet dataset. The indicator “Custodial placementwith relatives” also was based on “reasons for discharge” from HomeSafenet andincluded children placed with relatives or non-relatives who obtainedguardianship and children placed with relatives who were given long-termcustody. Both indicators were calculated as percentages. The numerator for the

53
percentage of children returned to parents of removal home caregivers is thenumber of children who exited out-of-home care and were returned to parents orlegal guardians during FY01-02. The denominator is the total number of childrenexiting out-of-home care FY01-02 (the denominator was indicated as the numberof cases in exit cohorts, Figures 6-17). The numerator for the percentage ofchildren who had a Custodial placement with relatives is the number of childrenwho exited out-of-home care and were placed with relatives who were giveneither long-term custody or guardianship during FY01-02. The denominator is thesame as above.
ResultsChildren Returned to Parents of Removal Home Caregivers After ExitingOut-of-Home Care
General results of the analyses based on this indicator are shown in Figures 6-17. Findings indicated that Santa Rosa and Walton Counties had the highestproportions of children who were returned to parents (63% and 61.5%respectively) during FY01-02 (see Figure 12 and 16). As shown in Figures 6 and7, Flagler and DeSoto Counties had the lowest proportions of children who werereturned to parents (28.6% and 24.2%, respectively). Almost all counties inDistrict One with the exception of Escambia had higher than average (the Meanfor this distribution is 47.9) and greater than Rest-of-State (51.3%) proportions ofchildren returned to parents. The Median for this distribution also was 51.3%.
Children Who Had Custodial Placement With Relatives After Exiting Out-of-Home Care
The results of the analysis regarding children who had custodial placements withrelatives after exiting out-of-home care are also presented in Figures 6–17. Thelowest percentage of children who were placed with relatives in FY01-02 wasobserved for Pasco County -- 15.9% (see Figure 10). As shown in Figure 7, thehighest percentage of children who were placed with relatives was found inFlagler County (71.4%). However, because there were only 7 cases in FlaglerCounty, this percentage should not be interpreted as an indication of whattypically occurs in a Florida County. When Flagler County was excluded from thedistribution the average percentage of children placed with relatives was 30.3%(the Median was 30.5), which is close to the percentage of children placed withrelatives for Rest-of-State. Excluding Flagler County, the highest percentage ofchildren who had custodial placement with relatives after exiting out-of-homecare was observed in Pinellas County (see Figure 11). Almost all counties in theSunCoast Region (Pasco was an exception and Manatee was only 0.2 belowaverage) had higher than average proportions of children who were placed withrelatives for long-term care.

54
Figure 6
13.818.2
28.1
36.4
51.3
24.2
0
10
20
30
40
50
60
DeSoto and Rest-of-State
(CBC) (CBC)Reunification with Parents Placement
with RelativesAdoption Finalized
(ROS) (ROS) (ROS) (CBC)
Total number of chidlren exited out-of-home care in DeSoto - 33Total number of chidlren exited out-of-home care in Rest-of-State - 7,950
Figure 7
13.8
0
28.1
71.4
51.3
28.6
0 10 20 30
40 50
60 70 80
Flagler and Rest-of-State
(CBC) (CBC)Reunification with Parents Placement
with RelativesAdoption Finalized
(ROS) (ROS) (ROS)(CBC)
Total number of chidlren exited out-of-home care in Flagler - 7Total number of chidlren exited out-of-home care in Rest-of-State - 7,950

55
Figure 8
13.8
6.8
28.131
51.3 51.9
0
10
20
30
40
50
60
Hillsborough and Rest-of-State
(CBC) (CBC)Reunification with Parents Placement
with RelativesAdoption Finalized
(ROS) (ROS) (ROS) (CBC)
Total number of chidlren exited out-of-home care in Hillsborough - 617Total number of chidlren exited out-of-home care in Rest-of-State - 7,950
Figure 9
13.814.3
28.126.5
51.3 56.5
0
10
20
30
40
50
60
Okaloosa and Rest-of-State
(CBC) (CBC)Reunification with
Placement with
Adoption (ROS) (ROS) (ROS) (CBC)
Total number of chidlren exited out-of-home care in Okaloosa - 147Total number of chidlren exited out-of-home care in Rest-of-State - 7,950

56
Figure 10
13.8
19.8
28.1
15.9
51.3
57.1
0
10
20
30
40
50
60
P asco and R es t-o f-S ta te
(C B C ) (C B C )R eu n ifica tio n w ith P a re n ts
P la ce m e n t w ith R e la tive s
Ad o p tio n F in a lize d (R O S ) (R O S ) (R O S ) (C B C )
Tota l num ber o f ch id lren exited ou t-o f-hom e care in P asco - 126Tota l num ber o f ch id lren exited ou t-o f-hom e care in R es t-o f-S ta te - 7 ,950
Figure 11
13.8
6.8
28.1
48.251.3
37.9
0
10
20
30
40
50
60
Pinellas and Rest-of-State
(CBC) (CBC)Reunification with Parents
Placement with Relatives
Adoption Finalized (ROS) (ROS) (ROS) (CBC)
Total number of chidlren exited out-of-home care in Total number of chidlren exited out-of-home care in Rest-of-State

57
Figure 12
13.8
2.5
28.1
33.3
51.3
63
0
10
20
30
40
50
60
70
Santa Rosa and Rest-of-State
(CBC) (CBC)Reunification with Parents Placement
with RelativesAdoption Finalized
(ROS) (ROS) (ROS)(CBC)
Total number of chidlren exited out-of-home care in Santa Rosa - 81Total number of chidlren exited out-of-home care in Rest-of-State - 7,950
Figure 13
13.815.2
28.131.3
51.3 48.5
0
10
20
30
40
50
60
Sarasota and Rest-of-State
(CBC) (CBC)Reunification with
Placement with
Adoption Finalized (ROS) (ROS) (ROS) (CBC)
Total number of chidlren exited out-of-home care in Sarasota - 99Total number of chidlren exited out-of-home care in Rest-of-State - 7,950

58
Figure 14
Reunification with Parents
13.813.7
28.130.1
51.3 52.6
0
10
20
30
40
50
60
Manatee and Rest-of-State
(CBC) (CBC) Placement with Relatives
Adoption Finalized (ROS) (ROS) (ROS) (CBC)
Total number of chidlren exited out-of-home care in Manatee - 249Total number of chidlren exited out-of-home care in Rest-of-State - 7,950
Figure 15
13.815
28.1
21
51.3 48.1
0
10
20
30
40
50
60
Volusia and Rest-of-State
(CBC) (CBC)Reunification with Parents Placement
with RelativesAdoption Finalized
(ROS) (ROS) (ROS) (CBC)
Total number of chidlren exited out-of-home care in Volusia - 214Total number of chidlren exited out-of-home care in Rest-of-State - 7,950

59
Figure 16
Reunification with Parents
13.811.5
28.1
19.2
51.3
61.5
0
10
20
30
40
50
60
70
Walton and Rest-of-State
(CBC) (CBC) Placement with Relatives
Adoption Finalized (ROS) (ROS) (ROS) (CBC)
Total number of chidlren exited out-of-home care in Walton - 26Total number of chidlren exited out-of-home care in Rest-of-State - 7,950
Figure 17
13.810.7
28.1
43.1
51.3
42.7
0
10
20
30
40
50
60
Escambia and Rest-of-State
(CBC) (CBC)Reunification with Parents
Placement with Relatives
Adoption Finalized (ROS) (ROS) (ROS) (CBC)
Total number of chidlren exited out-of-home care in Total number of chidlren exited out-of-home care in Rest-of-State

60
Children With Adoption Finalized After Exiting Out-of-Home Care
Description of the IndicatorThis is a new indicator added to the current report at DCF’s request. Analysis ofthis indicator was based on exit cohorts of children, defined here as theduplicated number of children who exited from out-of-home care during FY01-02.Classification of children with finalized adoption was based on “Reasons forDischarge” in the HomeSafenet database. The indicator was calculated as apercentage. The numerator for this indicator is the percentage of children exitingout-of-home care whose adoption was finalized during FY01-02. Thedenominator is the total number of children exiting out-of-home care duringFY01-02.
ResultsThe results of the analysis regarding children with finalized adoption after exitingout-of-home care are presented in Figures 6-17. Findings indicated that PascoCounty (see Figure 10) had the highest proportion of children whose adoptionswere finalized (19.8%). In contrast, Santa Rosa County (see Figure 12) had thelowest proportion of children with finalized adoptions (2.5%). Flagler County didnot have any cases with finalized adoptions (of seven cases all together inFlagler County, two children were returned to parents and five were placed withrelatives for long-term care). The average percentage of children with adoptionsfinalized for this distribution was 12.4 and the Median was 13.8, whichcorresponds to the proportion of children with adoption finalized in the Rest-of-State. As shown in Figures 10, 6, and 13, the counties with the three highestranks in this distribution were SunCoast Region counties (Pasco, DeSoto, andSarasota).
SummaryThere is great variability in the performance of CBC counties on differentindicators, which might reflect the implementation process or specifically,different stages of the implementation process experienced by the counties inthis timeframe. For example, Sarasota and Manatee Counties, whereCommunity-Based Care was introduced first, performed well on achieving childpermanency. The proportions of children returned to parents, with adoptionfinalized are higher compared to Rest-of-State and higher than average inSarasota and Manatee Counties. The proportions of children placed withrelatives for long-term care are higher than average in Sarasota, andconsiderably lower than average in Manatee but higher compared to Rest-of-State. The proportions of children exiting out-of-home care also are much higherthan average in Manatee and Sarasota Counties. Other counties were

61
considered to be at the beginning of the implementation process during the timeof data analysis and therefore the hypothesis regarding the association betweenthe performance of CBC counties and the stages of the implementation processcould not be tested. Future analysis will examine whether there are significantdifferences between counties that are fully operational, counties that have juststarted implementation, and counties that have been operational for more thantwo years.
The results of the quantitative analysis are confirmed by the findings of thequality analysis. Specifically, the quality analysis showed that the lead agenciesmade uneven progress while on roughly the same timeline chronologically, andthere was great variability in their success in different areas, such as thereduction of caseload size, supervisory practices, and direct practiceapproaches. Consequently, until the lead agencies advance within the domain ofquality performance, the outcomes for children are unlikely to change.
No definite conclusions can be made about the effectiveness of CBC countiesregarding programmatic outcomes. Comparisons between counties are notappropriate at this stage because most CBC counties, with an exception ofSarasota and Manatee, were at the beginning of different implementation stagesat the time of data analysis. Although all of the examined counties were referredto as CBC counties throughout the report, many had recently begun the transitionto Community-Based Care and were not fully operational.
The interpretation of the calculated indicators also should be done with cautionprimarily because of the tenuous situation of switching data sources from CIS toHomeSafenet. The complexity of the new system requires a longer period ofadjustment by the local agencies as well as system refinement by the users anddevelopers. HomeSafenet data still have missing records and lower number ofcases as a result, and incomplete or inaccurate records (e.g., 52% of missingrecords for the placement county field, 3% -- for the case county field, 3,5% ofinaccurate date of birth, etc.). When interpreting indicators, missing or inaccuraterecords limit our ability to generalize the results; conclusions can be made onlyfor the subset of children for whom data are available.
In conclusion, the results of the quantitative analysis indicated that Sarasota,Manatee, and CBC Counties in District 1 (i.e., Escambia, Okaloosa) appear tohave achieved favorable outcomes on all the examined indicators. Futureevaluation will show if these results are sustainable. Inclusion of the utilizedindicators in future analysis will be necessary to allow for a proper longitudinalcomparison.

62
ANALYSIS OF EXPENDITURES
This year’s fiscal analysis has 2 components: an analysis of direct childprotective services expenditures, and an examination of administrativeexpenditures related to child protective services. The evaluation questions,methodology, findings, and limitations for each component will be presentedseparately.
Analysis of Direct Child Protective Services Expenditures
Evaluation QuestionsHow do average expenditures per child for child protective services in the CBCsites compare with average expenditures per child in the non-CBC sites since thebeginning of CBC? How are expenditures distributed across direct servicecategories in CBC sites compared to non-CBC sites?
MethodologyDirect services expenditures for child protective services were analyzed in everyDCF district. For this analysis, direct services expenditures are defined asexpenditures incurred at the district level for out-of-home care (e.g., family out-of-home care, independent living support), in-home services (e.g., familypreservation), services related to adoption, and other child protective services(e.g., family support services) that don’t fit into the previous three categories.See Appendix 4 for a complete list of services by service category.
Several child protective services expenditures were excluded so that the CBCand non-CBC sites could be compared on the same basis. Our objective was toinsure that the services being compared would be comparable between CBC andnon-CBC sites. This analysis excludes expenditures for projects unique to aparticular district (e.g., contract with Broward Alcohol Rehabilitation Center forcounseling and intervention services in District 10), programs not made availableto CBC sites (e.g., Community Partners for Timely Adoptions), and legislativemember projects (e.g., District 11 contract with Kristi House for increasedservices for sexually abused foster children); see Appendix 5 for a table thataggregates these excluded expenditures by district and fiscal year. Expendituresfor protective investigation and legal services were also excluded. Althoughexpenditures for childcare and adult protection service are related to childprotection, they were also excluded. Administrative expenditures associatedwith child protective services were also omitted from this analysis but will bediscussed in the second component of this Analysis of Expenditures.
DCF accounting data from the Florida Accounting Information Resource (FLAIR)were used to calculate child protective services expenditures. The Office ofRevenue Management generated spreadsheets containing expenditures byDistrict and Other Cost Accumulator (OCA) for Budget Entities (BEs) 60600700,

63
60910303, and 60910304. With guidance from Office of Revenue Managementstaff, appropriate BE-OCA combinations that were used for direct child protectiveservices expenditures were identified (see Appendix 4 for a complete list ofcurrent OCAs by service category). This analysis covers the time period of FY95-96 (the year prior to the first CBC implementation) through FY 01-025, themost recent year for which administrative data is available.
Two separate accounting system limitations prevented us from reporting exactexpenditures for the Sarasota, Manatee, Pasco, and Pinellas CBC sites prior toFY00-01. The first limitation is that unique OCAs for CBC expenditures did notexist during FY96-97, FY97-98, FY98-99, and FY99-00. To overcome thislimitation, Office of Revenue Management staff helped us identify the OCAs thatwere being used for CBC expenditures during those years. While the CBCprogram has been rolled out at the county level, FLAIR cannot reportexpenditures any lower than the district level. This second limitation particularlyaffects the analysis of expenditures in Manatee and Sarasota Counties prior toFY00-01, because Manatee and Sarasota did not comprise an entire district atthat time in the same way as Pinellas and Pasco Counties (District 5). An expertpanel was consulted to help accurately allocate district level expenditures to thecounties within those districts. The panel advised us to allocate 18% of District6’s expenditures to Manatee and 27% of District 8’s expenditures to Sarasotaduring each of the above fiscal years. Both system limitations were alleviated inFY00-01 with the creation of unique OCAs for CBC expenditure categories.
To adjust for inflation, expenditures from FY95-96, FY96-97, FY97-98, FY98-99,FY99-00, and FY01-02 were converted to FY00-01 dollars using the ConsumerPrice Index (CPI) for the South Region of the United States.
Ideally, total expenditures would be compared; however, counties vary by thenumber of children they are obligated to serve and the number of childrenenrolled in the child welfare system. Thus, average expenditures per child werecalculated using 4 separate denominators: (1) total number of children served,(2) total number of child-days, (3) per capita, and (4) total number of investigativereports. A “child served” is defined as any child receiving protective supervision,ICCP, voluntary family services, other in-home services, out-of-home care, oradoptive home placement during the relevant fiscal year. The total number ofchildren served is a duplicated count (i.e., a child who exits and reenters thesystem in the same year is counted twice). A “child-day” is defined as each dayof service in which the child receives protective supervision, ICCP, voluntaryfamily services, other in-home services, out-of-home care, or adoptive homeplacement during the relevant fiscal year. The “per capita” denominator reflectsthe number of children under age 18 in the county population at the midpoint(January 1) of each fiscal year. The investigative reports denominator is aduplicated count of the number of protective investigations conducted in the 5 Expenditures that were incurred during FY01-02 but certified forward and not paid until FY02-03 wereincluded.

64
county in the relevant fiscal year, and serves as a proxy for potential need forchild welfare services. The advantage to presenting average expenditures perchild using four separate measures of the number of children is that it is possibleto analyze whether there were similar or dissimilar patterns that might aidinterpretation.
Children served and child-day data were extracted from the Office of FamilySafety’s Client Information System (for FY95-96 through FY00-01) andHomeSafenet (for FY01-02). Due to the transition to HomeSafenet during FY00-01, data on the total number of children served and total child days for all 12months were unavailable. Data available in CIS for that year ranged from 5-11months, so the actual numbers of children served and total child days werehigher than the amounts used in this report. Another limitation associated withthe change in data systems is that the fields for computing the number of childrenserved and child-days have changed. For example, the number of child days forFY01-02 is limited to the number of days in out-of-home care because there is noreliable way to count the number of days of in-home care. Consequently, itcannot be determined whether the FY01-02 numbers are totally comparable withprevious years’ data. The number of investigative reports was drawn from theFlorida Abuse Hotline Information System (FAHIS)6. Population data came fromthe Florida Legislature’s Office of Economic and Demographic Research.
In order to compare average expenditures in CBC sites to average expendituresin non-CBC sites, each county was assigned a CBC status by fiscal year. Forthe purposes of this expenditure analysis, a county’s CBC status was determinedby the first date that a lead agency had CBC service contract for that county (asindicated in Figure 1). For counties in which the service contract began duringthe middle of a fiscal year, their denominator data were allocated to CBC andnon-CBC based upon the proportion of the year each county under a CBCservice contract. For example, HKI’s service contract for Hillsborough began inMay 2002, which means Hillsborough was considered a CBC site for 2 months,or 16.7%, of FY01-02. The number of children served, child-days, investigativereports, and children in the population in Hillsborough County in FY01-02 werethen allocated – 16.7% to CBC and 83.3% to non-CBC. This method is intendedto more equitably attribute expenditures to the responsible payer (the leadagency for the time period after the service contract began, and the Departmentfor the time period prior to the service contract). See Appendix 6 for a table thatdelineates the CBC/non-CBC allocation percentages for each CBC site.
FindingsCBC sites and non-CBC sites experienced nearly opposite trends in averageexpenditures per child served over the study period. As shown in Figure 18,
6 Data presented here represent the total number of cases associated with a report of maltreatment, neglect,or abuse. Each report may be comprised of more than one case (e.g., if there is more than one child in thehome where the potential maltreatment occurred).

65
average expenditures in the CBC sites increased 41% from the first year ofimplementation (FY96-97) to the second implementation year (FY97-98), butdecreased during the following 3 years to $2,727 in FY99-00. In contrast, non-CBC sites saw their average expenditures per child served increase steadily overthe same time period, with average expenditures of $2,905 in FY99-00. In FY00-01, average expenditures per child served increased slightly in non-CBC sitesand decreased substantially in CBC sites, but these results should be interpretedwith caution because of substantial missing data due to the HSn transition.Average expenditures per child served increased significantly in CBC and non-CBC sites during FY01-02, but these results should also be interpreted withcaution because it appears that HSn underreported the true number of childrenserved and child days during that year.
Figure 18: AVERAGE EXPENDITURES FOR DIRECT CHILD PROTECTIVESERVICES PER CHILD SERVED: CBC Sites vs. Non-CBC Sites
$2,088
$2,445
$2,618 $2,715
$2,905$3,003
$7,857
$2,399
$3,384$2,816
$2,727
$5,109
$1,835
$-
$1,000
$2,000
$3,000
$4,000
$5,000
$6,000
$7,000
$8,000
$9,000
FY95-96 FY96-97 FY97-98 FY98-99 FY99-00 FY00-01 FY01-02Non-CBC Sites CBC Sites
Average expenditures per child-day have been very similar in CBC and non-CBCsites except during FY00-01 and FY01-02, as shown in Figure 19. CBC sites hadaverage expenditures per child-day that ranged from $15 to $18 from FY96-97through FY99-00. Average expenditures per child-day in the non-CBC sitesincreased modestly each year, starting at $10 in FY95-96 and rising to $16 inFY99-00. Similar to the findings for average expenditures per child served,FY00-01 saw the CBC sites average expenditures per child-day drop by 35%while the average for the non-CBC sites remained the same as in FY99-00. Thedata suggest that average expenditures per child-day doubled from FY00-01 toFY01-02. As mentioned previously, the results from FY00-01 and FY01-02should be viewed with caution.

66
Figure 19: AVERAGE EXPENDITURES FOR DIRECT CHILD PROTECTIVESERVICES PER CHILD-DAY IN SYSTEM: CBC Sites vs. Non-CBC Sites
$10$12
$14 $15$16
$16
$32
$15$18
$15$17
$11
$22
- $-
$5
$10
$15
$20
$25
$30
$35
FY95-96 FY96-97 FY97-98 FY98-99 FY99-00 FY00-01 FY01-02
Non-CBC Sites CBC Sites
The trends in average expenditures per capita were very similar to the trends inaverage expenditures per child-day described above. As shown in Figure 20,CBC sites alternated between a modest increase and a modest decrease year-over-year in average expenditures per capita, and increased overall from $76 inFY96-97 to $107 in FY01-02. Non-CBC sites, on the other hand, experienced asteady increase in average expenditures per capita throughout the study period,and increased overall from $67 in FY95-96 to $127 in FY01-02. The largestyear-over-year increases in average expenditures per capita occurred betweenFY98-99 and FY99-00 (36% in CBC sites and 23% in non-CBC sites) andbetween FY00-01 and FY01-02 (30% in CBC sites and 11% in non-CBC sites).Comparing CBC sites to non-CBC sites, average expenditures per capita weresimilar from FY96-97 through FY99-00, but non-CBC sites had 40% and 19%higher average expenditures per capita in FY00-01 and FY01-02, respectively,than CBC sites. These results should be reliable because they were calculatedusing population data rather than CIS or HSn data.

67
Figure 20: AVERAGE EXPENDITURES FOR DIRECT CHILD PROTECTIVESERVICES PER CAPITA: CBC Sites vs. Non-CBC Sites
$67 $72$80
$88 $108
$115$127
$107
$82
$109
$80
$86$76
$-
$20
$40
$60
$80
$100
$120
$140
FY95-96 FY96-97 FY97-98 FY98-99 FY99-00 FY00-01 FY01-02
Non-CBC Sites CBC Sites
CBC sites also experienced lower average expenditures per investigative reportin FY01-02 than in non-CBC sites, as shown in Figure 21. CBC sites spent anaverage of $1,088 per investigative report on direct services, while non-CBCsites spent an average of $1,383 per investigative report on direct services7.
Figure 21: AVERAGE EXPENDITURES FOR DIRECT CHILD PROTECTIVESERVICES PER INVESTIGATIVE REPORT: CBC Sites vs. Non-CBC Sites(FY01-02)
7 These statistics do not reflect average cost per investigation.
Non-CBC Sites
CBC Sites
$0 $250 $500 $750 $1,000 $1,250 $1,500

68
While out-of-home care represents the largest portion of expenditures for directchild protective services, there were small differences between CBC and non-CBC sites in direct child protective services by type of service (as shown inFigures 22 & 23). During FY01-02, non-CBC sites had a slightly higher proportionof direct services dollars spent on out-of-home care (60%) than non-CBC sites(55%). Conversely, CBC sites spent a higher proportion of their service dollarson in-home services (27% vs. 21%). Non-CBC sites also had a slightly higherproportion of expenditures for adoption-related services than CBC sites (17% vs.15%).

69
Figure 22. Direct Child Protective Services Expenditures by Type of Service(FY01-02) – Non-CBC Sites
Other2%
Out of Home 60%
In-home 21%
Adoption17%
Figure 23. Direct Child Protective Services Expenditures by Type of Service(FY01-02) –CBC Sites
Other3%
Out of Home 55%
In-home 27%
Adoption15%
70
Conclusions & LimitationsThe overall conclusion about the difference in average expenditures per child ismixed. On all 3 longitudinal measures, CBC and non-CBC sites experiencedsimilar average expenditures per child for every year analyzed except FY00-01and FY01-02. In FY99-00, the last year for which there is complete and reliabledata, CBC sites had slightly lower average expenditures per child served ($2,727vs. $2,905 in non-CBC sites) and slightly higher average expenditures per child-day ($17 vs. $16 in non-CBC sites). Average expenditures per capita, the onlyreliable indicator for FY00-01 and FY01-02, were significantly higher in non-CBCsites ($115 and $127 in FY00-01 and FY01-02, respectively) than in CBC sites($82 and $107, respectively). These differences reflect 29% and 16% lowerexpenditures for CBC sites, respectively, in those two years.
Some of the difference in average expenditures per capita in FY01-02 may beattributable to an apparent difference in service mix between CBC sites and non-CBC sites. CBC sites devoted a smaller proportion (55%) of their totalexpenditures to out-of-home services than non-CBC sites (60%). Althoughdetermining the actual cost of delivering out-of-home services is beyond thescope of this analysis, it is likely that the cost of one month in foster care farexceeds the cost of one month of in-home services or other types of directprotective services. Consequently, CBC sites may have experienced loweraverage expenditures per capita than non-CBC sites because they provided lessout-of-home care than non-CBC sites during FY01-02.
As mentioned earlier, the transition from CIS to HSn limited our ability togenerate complete and reliable counts of the number of children served andchild-days during FY00-01 and FY01-02. This limitation was identified in theFY00-01 data in last year’s report, but the extent to which this was still a problemin FY01-02 is surprising because every district’s data was supposed to appear inHSn beginning in June 2001. According to HSn data, the numbers of childrenserved and child days in FY01-02 were much lower than expected based onprevious years’ counts. As shown in Table 16, the total number of childrenserved statewide in FY01-02 was only 62,853, which is 52% lower than thenumber of children served during the first 11 months of FY00-01. Similarly, thetotal number of child days statewide in FY01-02 was 15,272,266, which is 38%lower than the total number of child days during the first 11 months of FY00-01.These decreases are inconsistent with the modest year-over-year increases intotal expenditures for direct child protective services, total children under age 18in the general population, and total number of investigative reports during thesame time periods. This limitation did not allow for the accurate estimation ofaverage expenditures per child served and average expenditures per child dayfor FY00-01 and FY01-02.

71
Table 16. Changes in Statewide Denominator Data vs. Changes inStatewide Numerator Data, FY99-00 thru FY01-02
FY99-00 FY00-01 Year-over-yearchange
FY01-02 Year-over-yearchange
Total Expendituresfor Direct ChildProtective Services $394
million$413
million +5% $466million +13%
Total ChildrenServed 136,017 131,840 -3% 62,853 -52%
Total Child Days 24.5million
24.5million 0% 15.3
million -38%
Total Children UnderAge 18 in GeneralPopulation
3.64million
3.71million +2% 3.76
million +1%
Total Number ofInvestigativeReports
262,039 269,486 +3% 347,350 +29%
Despite this limitation, the estimates of average expenditures per capita aresufficiently reliable and, therefore, can be interpreted. The large difference inaverage CBC expenditures per capita compared with average, per capitaexpenditures for non-CBC sites during FY00-01 may have been caused by alarger increase in total expenditures for non-CBC sites than for CBC sites fromFY99-00 to FY00-01. One cause of higher expenditures in the non-CBC group inFY00-01 occurred in District 10, where DCF spent additional dollars for childprotective services in response to the Ward lawsuit. Excluding District 10’sexpenditure and child data from the comparison group had a slight impact onnarrowing the gap in average expenditures per capita between CBCs and non-CBCs for FY00-01 (data not shown), but does not appear to fully explain the widegap between CBC and non-CBC sites that year.
Another important limitation to these findings is that there are unobservedcounty- or district-level factors unrelated to community-based care that mayaffect expenditure levels for direct child protective services. For example, thisanalysis does not account for what many perceive as a historically inequitabledistribution of child welfare system resources at the district level. Consequently,the differences in average expenditures per child reported here should be usedfor descriptive purposes only. We cannot infer from these findings that CBC siteshad lower average expenditures per child than non-CBC sites because of theadvent of CBC.

72
There are other limitations to these findings. FY00-01 was the first full year forsystem-wide changes to FLAIR. These changes included unique codes for CBCexpenditures. While these updated OCAs are thought to be better suited for thetype of analysis contained in this report, there is a concern that DCF district staffand CBC staff may not have used the new OCAs consistently initially. Theinconsistent use of OCAs may explain some of the FY00-01 difference inaverage expenditures per child between CBC sites and non-CBC sites. TheOffice of Revenue Management has conducted a great deal of training on codingissues in the last 12 months, so we expect that the OCA level data was morereliable in FY01-02.
This analysis is done from the perspective of DCF. With its focus on directexpenditures, the analysis fails to capture indirect expenditures such as lostproductivity due to time lost from work/school and morbidity. The analysis alsoexcludes child welfare services paid via other funding sources (e.g., dollarsraised by lead agencies in local communities). From a societal perspective,actual child protective services expenditures are much higher. The effect of CBCon indirect expenditures cannot be assessed from the data in this analysis, andconclusions cannot be made about the overall cost of CBC without consideringthe impact of administrative, infrastructure, and indirect expenditures.
Although per capita child expenditures were lower in CBC sites than in non-CBCsites during FY01-02, there are several possible explanations:
• CBC sites are delivering services more efficiently;• CBC sites may be covering administrative expenses not previously funded
in DCF’s budget with funds that would otherwise be used for services;• Lower expenditures per child could also reflect an under-delivery of
necessary services
Another limitation of these findings is that efficient service delivery may notrepresent effective or high quality service delivery. While CBC sites spent anaverage of $20 less per capita than non-CBC sites during FY01-02, this potentialefficiency gain may be nullified if children served in CBC sites fared worse onoutcome indicators than their non-CBC counterparts. The Discussion and PolicyImplications section of this report will interpret the efficiency findings in thecontext of the outcome indicators.
Analysis of Child Welfare Administrative Expenditures
Evaluation QuestionsWhat proportion of Family Safety’s total child welfare expenditures are used foradministration? Does the proportion of administrative expenditures vary bydistrict/region? How much do these estimates vary according to the allocationmethod used?

73
MethodologyAdministrative expenditures for child welfare occur at three different levels. TheCentral Office level includes expenditures incurred by Family Safety, and thisanalysis will focus on Program Management & Compliance, ChildProtection/Permanency, Child Abuse Prevention/Intervention, and Florida AbuseHotline expenditures. Child Care Regulation and Adult Protection expenditureshave been excluded. The second level is District-level, and this includes DistrictAdministration, Program Management & Compliance, and ChildProtection/Permanency expenditures. CBC lead agencies represent the thirdlevel, although their expenditures appear in FLAIR data as part of District-levelexpenditures. This year’s administrative expenditures analysis focuses onCentral Office- and District-level expenditures, and does not distinguish CBCexpenditures from other District-level expenditures.
FLAIR data was used for FY01-028 provided by the Office of RevenueManagement to identify administrative expenditures at the Central Office andDistrict levels. Using OCA level data from BEs 60910303, 60910304, and60910307, appropriate BE-OCA combinations were identified that were used foradministrative expenditures associated with child protection, protectiveinvestigation, and legal services. All administrative expenditures fell into one oftwo groups: (1) expenses incurred by a district and listed for that district (e.g.,Family Safety program administration); (2) expenses incurred by the CentralOffice that benefit the entire state (e.g., DCF’s contract with FMHI to evaluateCBC implementation). Non-operating expenditures and transfers to otheragencies were excluded from the analysis.
The next step was to aggregate and calculate district-level administrativeexpenditures for each district. Expenditures from group (1) were added tocalculate total district-specific administrative expenditures. For expendituresfrom group (2), two separate methods for allocating those statewide expendituresacross districts were applied: based on child population, and based oninvestigative reports. As done in the direct services analysis, child populationdata from the Florida Legislature’s Office of Economic and DemographicResearch was used to calculate the number of children under age 18 in eachdistrict as of January 1, 2002. Under this method, statewide expenditures wereallocated to each district in the same proportion as the district’s proportion of totalchildren statewide. For example, the Suncoast Region had a population of632,219 children, which was 17% of the Florida’s child population of 3,757,933,so we allocated 17% of statewide, Central Office level expenditures to theSuncoast Region. For the other allocation method, FAHIS data was used tocalculate the number of duplicated (i.e., non-unique child) investigative reportsfor each district during FY01-02, and allocated statewide expenditures in thesame proportion as the district’s proportion of total investigative reports
8 Expenditures that were incurred during FY01-02 but certified forward and not paid until FY02-03 wereincluded.

74
statewide. For example, the Suncoast Region had 18% of the State’sinvestigative reports, so we allocated 18% of statewide, Central Office levelexpenditures to the Suncoast Region. These two allocation methods wererecommended by DCF’s Allocation of Family Safety Child Protection Resourcesworkgroup in their Phase I report, and the FMHI evaluation team stronglysupports the workgroup’s assertion that child population and the number ofinvestigative reports equitably measure the potential need and demand for childprotection.
Finally, total child welfare expenditures were derived in order to calculateadministrative expenditures as a percentage of total child welfare expenditures.The data reported earlier on direct child protective services was used andexpenditures associated with protective investigations and legal services wereadded to calculate direct service expenditures for child welfare for each district.The total administrative expenditures and total direct services expenditures werethen combined to derive total child welfare expenditures.
FindingsDistrict-specific administrative expenditures were $15.6 million, or about 55% ofDCF’s $28.6 million in total child welfare administrative expenditures duringFY01-02. As shown in Table 17, district-specific administrative expendituresranged from $98,166 in District 14 to nearly $2.3 million in District 11. District 10had the third highest amount of district-specific administrative expenditures ($1.9million) despite being only the 4th or 5th largest district, but this may be due toresidual expenditures associated with the Ward lawsuit.
Table 17. Total Child Welfare Administrative Expenditures byDistrict/Region, Adjusted for Child Population (FY01-02)District District-Specific
AdministrativeExpenditures (A)
Share of StatewideAdministrative Expenditures,Divided According to Size ofDistrict’s Child Population (B)
Total AdministrativeExpenditures(C=A+B)
1 $ 901,174 $ 532,868 $ 1,434,0422 $ 536,206 $ 512,324 $ 1,048,5303 $ 842,481 $ 393,282 $ 1,235,7634 $ 838,366 $ 1,039,267 $ 1,877,6337 $ 1,388,415 $ 1,696,522 $ 3,084,9378 $ 1,183,139 $ 625,332 $ 1,808,4719 $ 1,293,427 $ 854,301 $ 2,147,728
10 $ 1,901,163 $ 1,353,929 $ 3,255,09211 $ 2,285,387 $ 2,025,352 $ 4,310,73912 $ 311,065 $ 348,783 $ 659,84813 $ 1,182,424 $ 541,804 $ 1,724,22814 $ 98,166 $ 501,940 $ 600,10615 $ 643,876 $ 346,457 $ 990,333SR $ 2,201,999 $ 2,178,819 $ 4,380,818
Total $ 15,607,288 $ 12,950,980 $ 28,558,268

75
When adjusted for child population, the Suncoast Region had the highest totaladministrative expenditures ($4.4 million) in the State. District 11, at $4.3 million,was 2nd highest, followed by District 10 ($3.3 million) and District 7 ($3.1 million).District 14 had the lowest total administrative expenditures ($0.6 million) in theState.
Table 18. Total Child Welfare Administrative Expenditures byDistrict/Region, Adjusted for Investigative Reports (FY01-02)District District-Specific
AdministrativeExpenditures (A)
Share of Statewide AdministrativeExpenditures, Divided Accordingto Number of InvestigativeReports in District (B)
Total AdministrativeExpenditures(C=A+B)
1 $ 901,174 $ 692,272 $ 1,593,4462 $ 536,206 $ 652,452 $ 1,188,6583 $ 842,481 $ 504,132 $ 1,346,6134 $ 838,366 $ 1,113,781 $ 1,952,1477 $ 1,388,415 $ 1,776,449 $ 3,164,8648 $ 1,183,139 $ 592,013 $ 1,775,1529 $ 1,293,427 $ 768,073 $ 2,061,500
10 $ 1,901,163 $ 979,741 $ 2,880,90411 $ 2,285,387 $ 1,186,785 $ 3,472,17212 $ 311,065 $ 478,181 $ 789,24613 $ 1,182,424 $ 721,168 $ 1,903,59214 $ 98,166 $ 739,550 $ 837,71615 $ 643,876 $ 378,369 $ 1,022,245SR $ 2,201,999 $ 2,368,014 $ 4,570,013
Total $ 15,607,288 $ 12,950,980 $ 28,558,268
When adjusted for the district number of investigative reports, as shown in Table18, district rankings for total administrative expenditures differed somewhat fromthe rankings associated with the totals in Table 17. The Suncoast Region wasstill the highest at $4.6 million, and still followed by District 11 ($3.5 million).District 7 moved from 4th highest to 3rd highest, at $3.2 million, while District 10moved from 3rd highest to 4th highest ($2.9 million). Under the investigativereports adjustment method, District 8 (rather than District 14) had the lowestadministrative expenditures ($0.8 million).
The differences in rankings are due to differences caused by the method used forallocating statewide administrative expenditures. As shown in Table 19, thesedifferences can be quite dramatic. For example, District 11’s share of statewideadministrative expenditures based on child population was $2.0 million becausethat district contains 16% of the State’s children. District 11’s share drops bymore than $800,000 (41%), to $1.2 million, if statewide administrativeexpenditures are allocated based on the number of investigative reports becauseDistrict 11 had only 9% of the State’s investigative reports in FY01-02. A similarphenomenon occurred for District 10, as their share of statewide administrativeexpenditures fell from $1.4 million to under $1 million (a 28% decrease) because

76
they had only 8% of the State’s investigative reports, despite having 10% of theState’s child population. District 14’s share changed in the opposite direction:they increased by 47%, from $502,000 to $740,000, because they had 4% of theState’s children but 6% of the State’s investigations.
Table 19. Comparison of Methods for Dividing Share of Statewide ChildWelfare Administrative Expenditures by District/Region, (FY01-02)
Share of StatewideAdministrative Expenditures,Divided According to Size ofDistrict’s Child Population
Share of StatewideAdministrative Expenditures,
Divided According toNumber of Investigative
Reports in District
Difference BetweenAdjustment
Methodologies
1 $ 532,868 $ 692,272 $ (159,405)2 $ 512,324 $ 652,452 $ (140,128)3 $ 393,282 $ 504,132 $ (110,850)4 $ 1,039,267 $ 1,113,781 $ (74,513)7 $ 1,696,522 $ 1,776,449 $ (79,926)8 $ 625,332 $ 592,013 $ 33,3199 $ 854,301 $ 768,073 $ 86,228
10 $ 1,353,929 $ 979,741 $ 374,18811 $ 2,025,352 $ 1,186,785 $ 838,56712 $ 348,783 $ 478,181 $ (129,398)13 $ 541,804 $ 721,168 $ (179,365)14 $ 501,940 $ 739,550 $ (237,610)15 $ 346,457 $ 378,369 $ (31,912)SR $ 2,178,819 $ 2,368,014 $ (189,195)
Total $ 12,950,980 $ 12,950,980 $ 0
Administrative expenditures as a percentage of total child welfare expenditureswere 4.5% statewide in FY01-02. Using the child population allocation method,District 8 had the highest proportion of administrative expenditures (7.6%),followed by District 9 (6.9%) and District 15 (6.6%), as shown in Figure 24.District 14 had the lowest proportion of administrative expenditures (2.0%).

77
Figure 24. Administrative Expenditures as a Percentage of TotalExpenditures, by District/Region, When Statewide AdministrativeExpenditures Were Divided According to Child Population (FY01-02)
4.2% 4.1%
7.6%
4.7%5.5%
2.0%
6.6%
3.7%
5.8% 5.2%
3.5% 3.3%
5.0%6.9%
0.0%1.0%2.0%3.0%4.0%5.0%6.0%7.0%8.0%
1 2 3 4 7 8 9 10 11 12 13 14 15 SR
District/Region
Admin % of Total
Administrative expenditures as a percentage of total child welfare expenditureswere similar when administrative expenditures were adjusted for the number ofinvestigative reports, as shown in Figure 25. District 8 still had the highestproportion of administrative expenditures (7.4%), while Districts 15 and 9reversed positions as the districts with the 2nd and 3rd highest proportions ofadministrative expenditures (6.8% and 6.6%, respectively). District 14maintained the lowest proportion of administrative expenditures (2.8%).

78
Figure 25. Administrative Expenditures as a Percentage of TotalExpenditures, by District/Region, When Statewide AdministrativeExpenditures Were Divided According to Number of Investigative Reports(FY01-02)
5.6%4.2%
3.5%
6.6%
4.1% 4.0%
6.1%
3.9%4.7%
7.4%
4.1%
6.8%
2.8%
6.4%
0.0%
2.0%
4.0%
6.0%
8.0%
1 2 3 4 7 8 9 10 11 12 13 14 15 SR
District/Region
Admin % of Total
Conclusions & LimitationsThis analysis of FLAIR data indicates that DCF incurred an estimated $29 millionof administrative expenditures for child welfare statewide during FY01-02. Withdirect services expenditures of $604 million in FY01-02, the $29 million ofadministrative expenditures represent approximately 4.5% of total child welfareexpenditures that year. Nearly 45% of administrative expenditures were incurredat the Central Office level while 55% of administrative expenditures were incurredat the District/Region level or incurred by the Central Office on behalf of aspecific district/region.
Administrative expenditures as a percentage of total expenditures variedsomewhat among districts. Regardless of the method used to allocate CentralOffice expenditures to districts, the proportion of total expenditures used foradministration ranged from 2.0% to 7.6% across the districts.
The allocation method used for distributing statewide, Central Officeadministrative expenditures across the districts/region had a significant impact oneach district’s/region’s share of administrative expenditures. District 11’s shareof statewide administrative expenditures was $2.0 million under the childpopulation allocation method, but fell to $1.2 million when those expenditureswere allocated according to the number of investigative reports that occurred ineach district. This $0.8 million difference was the largest among the districts.The allocation method also caused a large difference in District 10 ($374,000).

79
This finding has important implications for DCF as the Department grapples withadministrative resource sharing for CBC lead agencies. Child population and thenumber of investigative reports both represent reasonable measures of thenumber of children a lead agency will be responsible for under CBC, but cannotbe used interchangeably because population and investigations are not equallydistributed in every district.
An important limitation to these findings is that there are unobserved county- ordistrict-level factors that may affect administrative expenditure levels associatedwith child welfare services. As noted in the Analysis of Direct Child ProtectiveServices Expenditures section of this report, this analysis does not account forwhat many perceive as a historically inequitable distribution of child welfaresystem resources at the district level. Consequently, the differences inadministrative expenditures by district/region reported here should be used fordescriptive purposes only.
There are other limitations to these findings. The analysis may include somenon-recurring administrative expenditures that overstate a district’s “true” level ofrecurring administrative costs. These data may underreport total administrativeexpenditures incurred by CBCs if lead agencies are covering someadministrative costs with dollars raised locally (and thereby not submitted to DCFfor reimbursement). These findings also don’t allow us to disentangleadministrative costs unique to lead agencies from other district-leveladministrative costs.
In spite of these limitations, this analysis represents a useful first step towardsunderstanding current and historical levels of administrative expendituresassociated with child welfare. In next year’s evaluation, we plan to augmentthese data with additional historical data and CBC lead agency data toaccomplish two goals -- (1) to disentangle district/region administrativeexpenditures from CBC lead agency administrative expenditures, and (2) tobetter understand how administrative expenditures are distributed across allthree levels. Progress on these two goals will inform the administrative costbudgeting process as DCF further expands CBC statewide.

80
SECTION FOUR: DISCUSSION AND POLICYRECOMMENDATIONSThis report provided an evaluation of all CBC sites that were operational in FY01-02. Site visits were conducted at two relatively new sites: Hillsborough Kids, Inc.(HKI) and FamiliesFirst Network (FFN). Because of the lag time in obtainingclean administrative data, the outcome and cost data are for FY01-02, whereasthe quality and implementation analysis reflect FY02-03 data. In this section wediscuss the major conclusions that can be drawn from our findings and end withpolicy recommendations.
PROGRAMMATIC OUTCOMES
The task for this evaluation with respect to programmatic outcomes wasestablishing a baseline using HSn data for each of the CBC counties and theRest-of-State that will allow for the tracking of performance over time in futurereports. This was an essential first step because the transition to HSn hinderedthe analysis of changes in outcomes over time. It could not be determinedwhether any changes were the result of differences in performance or artifacts ofthe switch from one data source to another. Even with the baseline data acaveat is needed. The complexity of the new system requires a longer period ofadjustment by the local agencies as well as system refinement by the users anddevelopers.
The examination of the baseline data indicates that there is great variability in theperformance of CBC counties on different indicators, which may reflect differentstages of the implementation process experienced by the lead agencies.
QUALITY
The quality analysis focused on the implementation of CBC in two sites – HKI inHillsborough County and FFN in District 1. Direct comparison between the twosites is not appropriate due to differences in their structure and theirdevelopmental phase of implementation.
Based on the multiple methods employed in the quality analysis, there are,however, some key findings that hold true for both sites. These findings reflect anearly stage of implementation, and are likely to be true for any CBC site in its firstyear of implementation.
Case managers believe they could better do their jobs if funds were morereadily available for tangible supports (e.g., utility deposits and furniture)and needed child assessments.

81
Florida Statute and Department policies need to be revisited to determineif they meet the needs of CBC (e.g., transfer of authority and removal ofchildren).
Training and supervision for case managers needs to be adapted to alignmore closely with the demands of CBC. Specific areas of training for casemanagers include: family-centered case management, development ofservices plans, and improved integration of community resources into theplans.
Training for case management supervisors needs to support the changesexpected in frontline practice.
Foster parents need reassurance during the ongoing transition and needto be informed of changes in policies and practice as they occur.
COST
The overall conclusion about the difference in average expenditures per child ismixed. CBC and non-CBC sites experienced similar average expenditures perchild during the first 4 years of Community-Based Care. During the last twoyears of analysis, CBC sites had 29% and 16% lower average expenditures percapita, respectively, than non-CBC sites. CBC sites also appeared to have loweraverage expenditures per child served and per child-day during FY00-01 andFY01-02, but this finding should be interpreted with caution because there isevidence that CIS and HSn underreported the actual number of children servedand child days during those two years, respectively. It also cannot be concludedthat CBC sites were more cost-efficient during those years because there areseveral plausible interpretations of these findings, as noted earlier.
The distribution of administrative expenditures across DCF’s Family Safety,Region/District Offices, and lead agencies is an important issue as CBC expandsstatewide. DCF incurred an estimated $29 million of administrative expendituresfor child welfare statewide during FY01-02, which represents approximately 4.5%of total child welfare expenditures that year. The proportion of total expendituresused for administration ranged from 2.0% to 7.6% across the districts, and theseadministrative rates varied depending upon the allocation method applied.Although these data may underreport total administrative expenditures incurredby lead agencies if they are covering some administrative costs with dollarsraised locally (and thereby not submitted to DCF for reimbursement), thesefindings represent a first step towards understanding how administrativeexpenditures are distributed across the Central Office and District/Region levelsof child welfare administration as DCF continues to expand CBC statewide.
IMPLEMENTATION
Upon consultation with DCF Central Office, central office employees were notinterviewed for this evaluation report. However, last year’s report as well asfuture studies will include more viewpoints from this level. Therefore, a limitation

82
of this report is that it reflects the perspectives of regional, district, and leadagency staff more so than central office staff.
Areas of Progress
In this year’s evaluation we found that progress had been made on a number ofissues that were identified last year. Last year’s evaluation identified four majorissues that needed to be resolved:
1. The nature of the relationship between DCF and the lead agency and its provider network2. The role of the Regional office3. The program monitoring and auditing process4. The management information system, data collection, and reporting processes
The relationships between DCF, the lead agencies and Regional and Districtoffices were still evolving. It is important to note that the lead agencies aresharing information among themselves and with DCF and continuing in goodfaith to attempt to clarify their respective roles and relationships. DCF holdsregularly scheduled leadership forums with the lead agency executive directorswhere these issues are discussed. The roles of District, Regional and the DCFCentral Offices is currently under examination, including the distribution offunctions across the different levels, allocation of staff, and the nature of theirroles as CBC implementation progresses.
Substantial progress has been made with respect to program monitoring andauditing. A number of audits have been combined, and in some casesaccreditation visits have been scheduled to coincide with State monitoring. Thenumber of audits and monitoring visits has therefore been reduced. However,this is still a work in progress. Again, the important trend to note is that moredialogue is occurring and there have been a number of attempts to make theaudits more efficient and useful.
While no one would say that HomeSafenet is without problems, respondentsreported that Secretary Regier has been more flexible about how informationmay be entered and how the system is used. There now appears to be a greaterdialogue between programmers and end users. Progress has also been made inextracting reports from the system that can be useful for monitoring purposes.
New Findings
The evaluation of HKI and FFN reinforced the belief that there is not one bestway to organize a lead agency, but rather the most important factor is the fitbetween local resources and context, and the model chosen. In HillsboroughCounty a new agency was created and served as an ASO, contracting out allservice delivery. In District 1 a well-established agency with a long history of

83
service provision became the lead agency and provides most of the directservices with some small subcontracts.
A major finding in this evaluation cycle was that one of the most dauntingimplementation tasks is producing changes in actual practice. Such change isessential for improvements in the quality of care. The critical dilemma is needingthe experience and expertise of former DCF staff but also needing changes inthe way these staff have practiced for so many years. Even the two establishedlead agencies were still reported that there was more progress needed inachieving these changes. The importance of the supervisors in bringing aboutsuch change and as key drivers in implementing CBC also became very clear.The need for more training, coaching, and sharing of experiences amongsupervisors was evident across sites.
There were also a number of innovations, identified in the CBC sites such as theChildren’s Crisis Response Team, Youth Transition Coordinators who work withadolescents in obtaining emancipation and transitioning into adulthood, and theCourt Facilitation Project. These promising approaches received favorablereports from respondents at various levels. The development of these newprograms will continue to be tracked and analyzed in future evaluations.
The strengths of the partnership model also became clear in the course of thisyear’s evaluation and were best exemplified at HKI. Its effectiveness in creatingchecks and balances, local ownership and commitment to the CBC system,identifying and solving system problems, and as a continuous qualityimprovement mechanism was apparent.
POLICY RECOMMENDATIONS
The findings of this study lead to a number of policy recommendations as Floridacontinues to develop, implement, and monitor Community-Based Care sitesstatewide.
• The Department of Children and Families should continue to encourageand support flexibility in how community stakeholders structure their CBClead agencies. As noted earlier, the fit between the design of the leadagency, local resources, and context is a crucial factor in their success.

84
• The Department should encourage CBC organizational arrangements witha distribution and balance of control and accountability for budgetmanagement, review of performance indicators, and continuous qualityimprovement processes.
• The Department should continue the practice developed over the pastyear of using technical assistance teams to support districts in theirdevelopment of Community-Based Care.
• The partnership between DCF, the Professional Development Centers,and the lead agencies should prioritize skill development and competencytraining at the supervisory and case manager levels in evidence-basedpractices (e.g. family group conferencing, individualized care, andstrengths based approaches).
• The role of the Community Alliances in some parts of the State needs tobe resolved. Increased communication and role clarification betweenCommunity Alliances and lead agencies will benefit all parties.
• DCF and the lead agencies should continue to address and resolveseveral issues related to funding, such as appropriate levels of funding,inequities in funding levels across lead agencies, risk sharing, andadministrative costs of lead agencies.
• A review should be conducted of laws and policies that assume that only“agents” of the State can carry out a function. For those functions thathave been transferred to CBC, modifications are needed in statute oradministrative code to allow the lead agencies to perform them.
• If a crisis similar to Rilya Wilson should unfortunately occur, it may not beappropriate or beneficial to apply uniform mandates statewide. Leadagencies should be allowed to provide evidence that they have practiceddue diligence and be able to negotiate any additional actions that havebeen mandated in response to the crisis. If new tasks are required,additional resources should be allocated.
In sum, the implementation of CBC is a complicated process which takes time.All of the lead agencies have made substantial progress in implementingCommunity-Based Care and one can see a clear developmental curve, howeverchallenges remain. The evaluation team will continue to evaluate whether thesereforms result in better outcomes for children and families.

85
REFERENCES
Bess, R., Leos-Urbel, J., & Geen, R. (2001). The cost of protecting vulnerablechildren II: What has changed since 1996? (Rep. No. Occasional PaperNumber 46). Washington, DC: The Urban Institute.
Brown, E. C., Lipien, L., Trinidad, V., & Yampolskaya, S. (2001). Measuring thelength of stay experiences of Florida’s out-of-home care children. Tampa, FL:University of South Florida, Department of Child and Family Studies.
Brown, E. C., Yampolskaya, S., & Trinidad, V. (2001). A profile of children inFlorida’s child protection system: Fiscal year 1999-00. Tampa, FL: Universityof South Florida, Department of Child and Family Studies.
Child Welfare League of America. (1999). Standards of excellence for servicesfor abused or neglected children and their families. Washington, DC: Author.
Child Welfare League of America. (2000). 2000 Management, Finance, andContracting Survey. Washington, DC: Author.
Daley, D. (1996). The politics and administration of privatization: efforts amonglocal governments. Policy Studies Journal, 24:4, 629-631.
Duchnowski, A.J., Kutash, K., & Friedman, R.M. (2002). Community-BasedInterventions in a System of Care and Outcomes Framework. In B.J. Burns &K. Hoagwood (Eds.), Community Treatment for Youth: Evidence-BasedInterventions for Severe Emotional and Behavioral Disorders (p.330). NewYork: Oxford University Press.
Elmore, R.F. (1980). Backward mapping: implementation research and policydecisions. Political Science Quarterly, 94:4 (Winter), 601-616.
Falconer, M.K., Cash, S., & Ryan, S. (2001). Evaluation of Community –BasedCare in Foster Care and Related Service in Florida. Tallahassee, FL: Schoolof Social Work, Florida State University.
Fixler, P. E. & Poole, Jr. R.W. (1987). Status of state and local privatization.Prospects for Privatization: Proceedings of the Academy of Political Science,36:3, 164-178.
Florida Coalition for Children (2002). Implementing Community-Based Care:Critical issues & sensible solutions (white paper). Tallahassee, FL: author.
Freundlich, M. & Gerstenzang. (eds.) (2003). An assessment of the privatizationof child welfare services. Wasington, DC: Child Welfare League of America.
Geen, R. & Tumlin, K.C. (1999). State efforts to remake child welfare: Responsesto new challenges and increased scrutiny. Washington, DC: The UrbanInstitute.
Gibelman, M. & Demone, Jr. H. W. (eds.) (1998). The privatization of humanservices: Policy and practice issues. New York: Springer PublishingCompany.
Gibelman, M. & Demone, Jr. H. W. (eds.) (1998). The privatization of humanservices: Case studies in the purchase of services . New York: SpringerPublishing Company.

86
Greene, J. D. (1996). How much privatization? A research note examining theuse of privatization by cities in 1982 and 1992. Policy Studies Journal, 24:4,632-640.
Groves, I. D., & Foster, R. E. (1995). Service testing: Assessing the quality andoutcomes of systems of care performance through interaction with individualchildren services. Paper presented at the 8th Annual System of Care forChildren’s Mental Health: Expanding the Research Base Conference, Tampa,FL.
Hoagwood, K., Burns, B.J., & Weisz, J.R. (2002). A profitable conjunction: Fromscience to service to children’s mental health. In B.J. Burns & K. Hoagwood(Eds.), Community Treatment for Youth: Evidence-Based Interventions forSevere Emotional and Behavioral Disorders (p.330). New York: OxfordUniversity Press.
Human Systems and Outcomes, Inc. (2001, June). Using the QSR to improvepractices, services, and results. (Available from the Florida Department ofChildren and Families, Community-Based Care).
Lipsky, M. (1980). Street-Level Bureaucracy. New York: Russel SageFoundation.
Livert, D., Rindskoph, D., Laxe, L., & Stirratt, M. (2001). Using multilevelmodeling in the evaluation of community-based treatment programs.Multivariate Behavioral Research, 36 (2), 155-183.
Malm, K., Bess, R., Leos-Urbel, Geen, R., & Markowitz, T. (2001). Running tokeep in place: The continuing evolution of our nation’s child welfare system.Washington DC: The Urban Institute.
McCullough, C. & Schmitt, B. (2000). Child welfare league of America 2000:Management, finance, and contracting survey final report. Washington, DC:Child Welfare League of America, Managed Care Institute.
Paulson, R. I. (1988). People and garbage are not the same: Issues incontracting for public mental health services. Community Mental HealthJournal, Winter, 93-103.
Paulson, R. I. (1987). The interorganizational delivery of mental health servicesin Hamilton County (Final Report, Research Grant #84-160). Columbus, OH:Ohio Department of Mental Health Research.
Paulson, R. I. (1981). Social program implementation: An incentive systemsperspective. Journal of Urban Affairs, Fall.
Paulson, R.I., Armstrong, M., Brown, E., Jordan, N., Kershaw, M.A., Vargo, A.C.,Whitlock, A.R., Yampolskaya, S. (2003). Evaluation of the Florida Departmentof Children and Families Community-Based Care Initiative. Tampa, FL:University of South Florida, Department of Child and Family Studies.
Paulson, R.I., Armstrong, M., Brown, E., Jordan, N., Kershaw, M.A., Vargo, A.C.,Yampolskaya, S. (2002). Submission to the Florida Legislature: Evaluation ofthe Florida Department of Children and Families Community-Based CareInitiative in Manatee, Sarasota, Pinellas, and Pasco Counties. Tampa, FL:University of South Florida, Department of Child and Family Studies.
Pressman, J. L. & Wildavsky, A. (1979). Implementation (2nd ed.). Berkeley:University of California Press.

87
Singer, J. D. & Willet, J. B. (1991). Modeling the days of our lives: Using survivalanalysis when designing and analyzing longitudinal studies of duration andthe timing of events. Psychological Bulletin, 110 (2), 268-290.
Stitt, C. B., Olsen, T. F., & Certo, D. (2001). Submission to the Florida StateLegislature: Review of the Florida Department of Children and FamiliesPrototype “SunCoast” Regionalization. Indianapolis, IN: CompetitiveGovernment Strategies.
Thomas, D., Leicht, C., Hughes, C., Madigan, A., & Dowell, K. (2003). EmergingPractices in the Prevention of Child Abuse and Neglect. Washington, DC:Children’s Bureau Office on Child Abuse and Neglect.
U.S. Department of Health and Human Services, Administration for Children andFamilies, Administration of Children Youth and Families, Children’s Bureau(1998). Child welfare outcomes 1998: Annual report. Washington, DC: U.S.Government Printing Office.
U.S. General Accounting Office. (2000). Child welfare: New financing and servicestrategies hold promise but effects unknown (GAO/T-HEHS-00-158).Washington, DC: U.S. Government Printing Office.
Van Meter, D. S., & Van Horn, C. E. (1975). The Policy Implementation Process:A Conceptual Framework. Administration and Society, 6 (4), 445-488.
Williams, W. & Elmore, R. (1976). Social Program Implementation. New York:Academic Press.
Yin, R.K. (1994) Case Study Research: Design and Methods. Thousand Oaks.Sage Publications.

88
Appendix 1: Highlights from the 2001-02 Statewide Evaluation ofCommunity-Based Care
Background• Ensuring the safety and well-being of children in the child welfare system
has proven to be a long term and complex problem. Issues at the nationallevel include: 1) fragmented and uncoordinated services; 2) increasedcost; 3) more families receiving care, and with more serious problems; 4)limited accountability within state and local agencies; 5) increased publicscrutiny of child welfare organizations; and 6) litigation against the childwelfare system.
• One of Florida’s responses to such problems is the Community-BasedCare (CBC) initiative. The intent of CBC is to: 1) improve the safety andwell-being of children; 2) create community ownership around childwelfare issues; 3) shift the responsibility for direct service delivery in childwelfare from DCF to newly-created lead agencies; 4) create a moreintegrated and comprehensive child protective service system, and 5)more flexibly manage available resources.
• In 2001-02, the Department of Children and Families (DCF) contractedwith the University of South Florida Louis de la Parte Florida MentalHealth Institute (FMHI) to conduct an evaluation of the four counties inwhich Community-Based Care (CBC) was operational in FY00-01:Sarasota, Manatee, Pinellas, and Pasco Counties.
• As shown in Figure 1, Sarasota County, whose lead agency was theSarasota YMCA Children, Youth and Family Services, Inc., was the first toprovide services in Florida. Manatee County came under the SarasotaYMCA in 2000. Family Continuity Programs, Inc. (FCP), the lead agencyin Pinellas and Pasco Counties, began implementation of CBC in 2000and completed their effort in 2001. Flagler and Volusia Counties beganimplementing CBC in 2001, and became fully operational in 2002.
Status of CBC Implementation• Key stakeholders agreed that there was a mutually respectful and flexible
planning process during CBC implementation. In addition, there was policyconsensus and clear agreement about the purposes of CBC and the roleof a lead agency.
• The provision of a readiness assessment process, start-up funds, and aplanning year before service delivery began were important to the successof CBC.
• Those interviewed felt there was a shared commitment to CBC on the partof leadership at each level, and those in leadership roles had done asmuch as possible throughout the implementation process to ensure thesuccess of CBC.
• The need to consider policies and procedures from the point of view ofDCF as well as the lead agencies is a consistent source of tension, and is

89
likely to become more problematic as CBC is implemented statewide. Thedual objectives of flexibility at the local level (a key principal of CBC) andstandardization (to ensure quality and a consistently available level ofservices across the state) are not always compatible. While CBC wasseen as very important by DCF, it is currently only a small part of theagency’s overall operation.
• Two different CBC models/approaches emerged. Both allowed foradaptability to local issues and cultural differences, indicating there ismore than one way to successfully implement CBC. In Sarasota the leadagency was a large agency with a well-developed infrastructure but withno experience in delivering child welfare services. The Sarasota YMCAsaw its role as being a leader and advocate, and contracted out allservices. Family Continuity Programs was a small service provider with aninfrastructure much less equipped for such a major undertaking, thusmuch of their initial planning focused on infrastructure development. FCPstressed the importance of integrated services, and maintained leadershipover service integration by continuing to directly provide casemanagement.
• Lead agencies evolved a checks and balances approach to networkdevelopment and had management information systems (MIS) and qualityassurance/quality improvement systems that allowed them to identify andsolve problems on an ongoing basis.
• The CBC sites have made considerable progress developing thenecessary fiscal, MIS, quality improvement (QI), and personnelinfrastructure, but there is still room for improvement. Of particularconcern are the recruitment, retention, and professionalization of programstaff.
• Other major systems changes caused mid-stream adjustments toimplementation timetables and strategies. These changes included theaddition of Manatee County to the Sarasota site, and the creation of theSunCoast Region and the Community Alliances.
Safety and Well-being of Children• The table on the following page summarizes key findings on child safety
and permanency. In the area of child safety, CBC counties performed atleast as well as counties where CBC was not introduced on all measuredoutcomes. The proportion of children in CBC counties who re-entered out-of-home care was not significantly different from the proportion of childrenin non-CBC counties who returned to out-of-home care. In addition,children in most CBC counties were less likely than children in non-CBCcounties to be re-abused or re-neglected. CBC counties also performed aswell as non-CBC counties in the area of permanency. The percentage ofchildren exiting out-of-home care and returned to parent or legal guardianincreased over time for all examined CBC counties except forFlagler/Volusia, and by FY00-01 the proportion of children returned toparent or legal guardian was higher in CBC counties, except for in

90
Flagler/Volusia. Moreover, the proportion of children returned to relativesand transferred to adoption was higher for CBC counties than non-CBCcounties by FY00-01; Pasco/Pinellas was the exception, where theproportion of children returned to relatives was lower compared to Rest-of-State.
• There are a number of alternative interpretations for the programmaticoutcomes, and it is difficult to piece together a clear picture withoutanalyzing child-level data on child protection system use. External factorssuch as changes in information sources, policies, and practices ofprotective investigations and the courts all affect the indicators and theirinterpretation.
• It is important to recognize the developmental nature of CBCimplementation and the large amount of change experienced by the CBCsites, DCF, and the Florida child welfare system. Implementation has beenfurther complicated by a change in data system (to HomeSafenet) andchanges in the collection of accounting data. In short, CBCimplementation cannot yet be singled out as the cause of the reportedoutcomes.
Expenditures• The CBC sites appear to have done as well as non-CBC sites without
incurring additional cost to DCF for direct services, but this may bebecause FCP did not gain responsibility of all children in Pinellas andPasco Counties until April 2001. Average expenditures in these twocounties may have been much lower than in Sarasota and ManateeCounties in FY00-01 because the Department was still paying for manychild services in Pinellas and Pasco Counties.
• No full assessment can be made about overall cost-efficiency because theanalysis excluded administrative and other indirect costs of the programs.
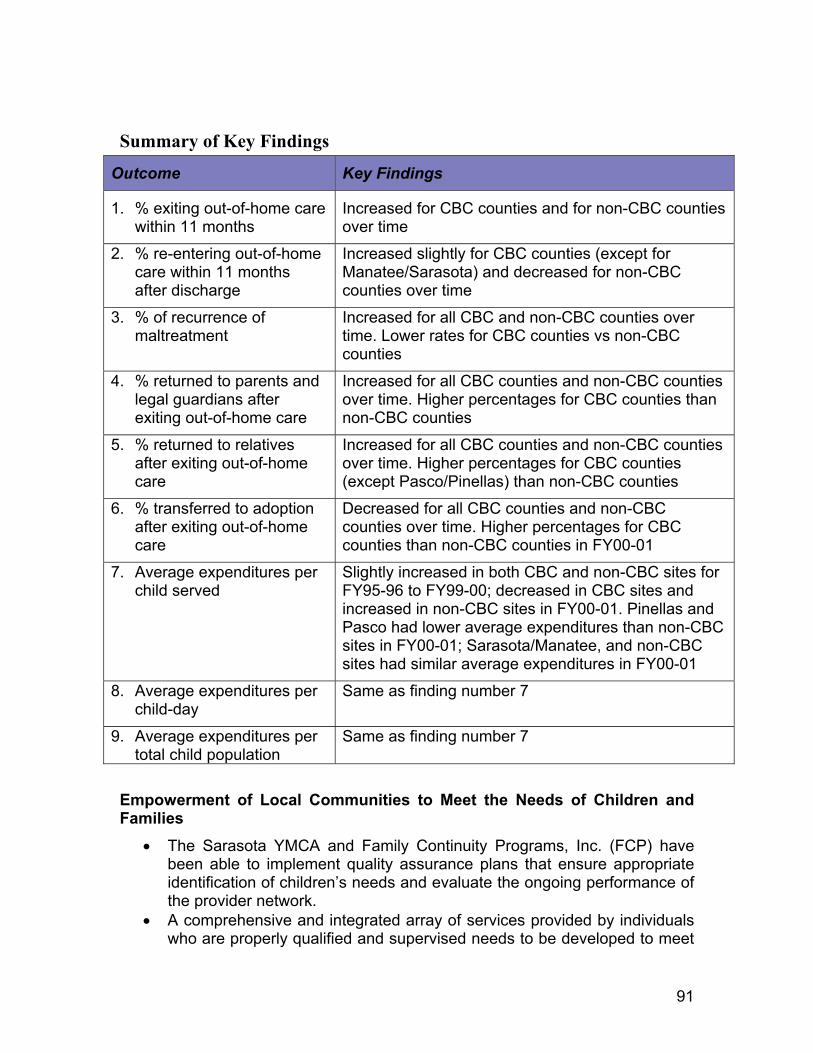
91
Summary of Key Findings
Outcome Key Findings
1. % exiting out-of-home carewithin 11 months
Increased for CBC counties and for non-CBC countiesover time
2. % re-entering out-of-homecare within 11 monthsafter discharge
Increased slightly for CBC counties (except forManatee/Sarasota) and decreased for non-CBCcounties over time
3. % of recurrence ofmaltreatment
Increased for all CBC and non-CBC counties overtime. Lower rates for CBC counties vs non-CBCcounties
4. % returned to parents andlegal guardians afterexiting out-of-home care
Increased for all CBC counties and non-CBC countiesover time. Higher percentages for CBC counties thannon-CBC counties
5. % returned to relativesafter exiting out-of-homecare
Increased for all CBC counties and non-CBC countiesover time. Higher percentages for CBC counties(except Pasco/Pinellas) than non-CBC counties
6. % transferred to adoptionafter exiting out-of-homecare
Decreased for all CBC counties and non-CBCcounties over time. Higher percentages for CBCcounties than non-CBC counties in FY00-01
7. Average expenditures perchild served
Slightly increased in both CBC and non-CBC sites forFY95-96 to FY99-00; decreased in CBC sites andincreased in non-CBC sites in FY00-01. Pinellas andPasco had lower average expenditures than non-CBCsites in FY00-01; Sarasota/Manatee, and non-CBCsites had similar average expenditures in FY00-01
8. Average expenditures perchild-day
Same as finding number 7
9. Average expenditures pertotal child population
Same as finding number 7
Empowerment of Local Communities to Meet the Needs of Children andFamilies
• The Sarasota YMCA and Family Continuity Programs, Inc. (FCP) havebeen able to implement quality assurance plans that ensure appropriateidentification of children’s needs and evaluate the ongoing performance ofthe provider network.
• A comprehensive and integrated array of services provided by individualswho are properly qualified and supervised needs to be developed to meet

92
the needs of children and families identified by lead agencies.Respondents suggested that this is occurring on an increasinglyconsistent basis within the CBC sites, and that services are beingprovided in new ways, building on traditional child protective services(e.g., parenting, counseling, and placement).
Outstanding Issues and RecommendationsOutstanding issues as the Department moves into the role of purchaser include:1) relationships between DCF, lead agencies, and the provider network; 2)staffing; 3) organizational dilemmas; 4) contracting; and 5) a past vs. futureorientation. The following recommendations support the plan for a more rapid,statewide expansion of CBC:
• Continue to develop and strengthen the CBC Leadership Forum. Thisforum brings stakeholders throughout the state together on a regular basisto discuss emerging issues and policy changes, share lessons learned,and resolve conflicting interpretations of roles and relationships betweenDCF, lead agencies, and provider network agencies.
• MIS issues need to be resolved quickly. The child welfare MIS mustprovide a way for lead agencies to electronically submit all data requiredby state and federal agencies through one data entry source. The systemneeds the capacity to produce timely reports on outcomes and budgetaryinformation at the county level.
• A more balanced contract monitoring process is needed. Theexecutive and legislative branches should work together to identifypriorities for the level of specification required by statute for eachcompliance requirement. Some current statutory requirements could beenforced via assurance, allowing auditors to focus their efforts on morecritical contract aspects.
• Fiscal processes need to be more efficient. Issues of highest priorityinclude: 1) the transfer of funds from CBC sites with lesser need to thosein greater need; 2) the matching of services and expenditures to federalfunding sources and categories; and 3) the resolution of cash flowproblems. In addition, new lead agencies will need technical assistance tomaster the federal financing requirements.
• The process of organizational culture change at the Regional andDistrict Office levels needs to accelerate so that the Department can beresponsive to the anticipated, more rapid development of CBC sites.

93
• The current organizational structure of the Department needs to beexamined as the Department moves into the role of purchaser. Each of itsoperations (contracting, accountability mechanisms, QI, and MIS) needsto be reviewed and aligned with the functions of a purchasing entity. Inaddition, the conflicting interpretations of relationships between the leadagency, DCF, and the provider network need to be resolved.
Conclusions• Many people underestimated the complexity of change that was required
for the implementation of CBC. For this reason it is not surprising thatSarasota County, the longest standing CBC county, performed best on theprogrammatic indicators.
• The CBC counties generally did as well on the outcome indicators as thecomparison counties did without incurring additional cost to DCF for directservices. They also successfully changed the service delivery structure.On average, children in CBC care appear to be at least as safe as childrenwere/are under the previous model. Significant progress in implementing aviable system of child welfare services has been made, but there isinsufficient evidence at this point to conclude whether the CBC model ismore effective (or less effective) than the previous model. Improvement ofthe organization, coordination, and quality of services is still a work inprogress.

94
Appendix 2: Staffing Observation Form
COMMUNITY
1. Information about resources Y N/interventions in the area isoffered to the team.
2. Plan of care includes at least Y None public and/or privatecommunity service/resource.
3. Plan of care includes at least Y None informal resource.
4. When residential placement is Y N NAdiscussed, team chooses communityplacements for child(ren) rather thanout-of-community placements,whenever possible.
5. Individuals (non- professionals) Y Nimportant to the family are presentat the meeting.
INDIVIDUALIZED
6. If an initial plan of care meeting, Y N NAthe parent is asked what treatmentsor interventions he/she felt worked/didn’t work prior to LPS.
7. Care Coordinator advocates Y Nfor services and resources for thefamily (e.g., identifies andargues for necessary services).
8. All services needed by family Y Nare included in plan (i.e., noneeded services were notoffered).
9. Barriers to services or resources/ Y N NAinterventions are identified andsolutions discussed.

95
10. The steps needed to implement Y Nthe plan of care are clearlyspecified by the team.
11. Strengths of family members Y Nare identified and discussed atthe meeting.
12. Plan of care that includes life Y N NAdomain(s) goals, objectives, andresources/interventions isdiscussed (or written).
13. Plan of care goals, Y N NAobjectives, or interventionsare based on family/child strengths.
14. Safety plan/crisis plan Y N NAdeveloped/reviewed.
FAMILY
15. Convenient arrangements Y N NAfor family’s presence atmeeting are made (e.g.,location, time, transportation,day care arrangements).
16. The parent/child is seated Y N NAor invited to sit where he/shecan be included in thediscussion.
17. Family members are Y N NAtreated in a courteousfashion at all times.
18. The family’s perspective is Y N NApresented to professionalsfrom other agencies.(*If NA, include 28,29)
19. The family is asked what Y N NAgoals they would like towork on.

96
20. The parent is asked about Y N NAthe types of services orresources/interventions he/shewould prefer for his/her family.
21. Family members are Y N NAinvolved in designing theplan of care.
22. In the plan of care, the family Y N NAand team members are assigned(or asked) tasks and responsibilitiesthat promote the family’s independence(e.g., accessing resources on own,budgeting, maintaining housing).
23. The team plans to keep the Y N NAfamily intact or to reunitethe family.
24. Family members voice Y N NAagreement/disagreementwith plan of care.
INTERAGENCY/COLLABORATION
25. Staff from other Y Nagencies who care aboutor provide resources/interventions to the familyare present at the meeting.
26. Staff from other Y N NAfacilities or agencies (if present)have an opportunity to provideinput.
27. Informal supports (if Y N NApresent) have an opportunityto provide input.
28. Problems that can develop Y N NAin an interagency team (e.g.,turf problems, challengesto authority) are not evidentor are resolved.

97
29. Staff from other Y N NAagencies describe supportresources/interventionsavailable in the community.
30. Statement(s) made by a staff Y N NAmember or an informalsupport indicate that contact/communication with anotherteam member occurred betweenmeetings.
31. Availability of alternative Y N NAfunding sources is discussedbefore flexible funds arecommitted.
OUTCOMES
32. The plan of care goals are Y N NAdiscussed in objective,measurable terms.
33. Objective or verifiable Y Ninformation on child andparent functioning is usedas outcome data.
MANAGEMENT
34. Key participants are invited Y N NAto the meeting (i.e., familymembers, CPS worker, teacher,therapist, others identified bythe family).
35. Current information about Y Nthe family (e.g., socialhistory, behavioral and emotionalstatus) is gathered prior to themeeting and shared at meeting(or beforehand).
36. All meeting participants Y N NAintroduce themselves (ifapplicable) or are introduced.

98
37. The family is informed that Y N NAthey may be observedduring the meeting.
38. Plan of care is agreed on by Y Nall present at the meeting.
CARE COORDINATOR
39. Care Coordinator makes Y N NAthe agenda of meeting clearto participants.
40. Care Coordinator reviews Y N NAgoals, objectives, interventions,and/or progress of plan of care.
41. Care Coordinator directs Y N(or redirects) team to discussfamily/child strengths.
42. Care Coordinator Y Ndirects (or redirects) team torevise/update plan of care.
43. Care Coordinator Y Nsummarizes content of themeeting at the conclusionof the meeting.
44. Care Coordinator sets next Y N NAmeeting date/time.

99
Appendix 3: Caregiver Interview
LocationEscambiaHillsboroughOkaloosaSanta RosaWalton
Note: If caregiver is unable to participate in interview, please explain why.
Interviewer:Date:
1. How are things going?
2. What is the biggest problem you are struggling with at the moment?
3. How long do you think it will be before this or other major problems areresolved?
4. Have you seen any improvements (i.e., in behavior, academics, or child’ssafety) since intervention by ?
5. How often do you see/speak with your family counselor?
6. How often does your child see/speak with your family counselor?
7. How many family counselors have you/your child had?
8. Are you satisfied with the job your family counselor is doing?
9. Think about what needs to change in your child’s/family’s life. Which ofthese changes will he or she need special help with (i.e. require services)?
10. Think about what needs to change in your life. Which of these changeswill you need special help with (i.e., require services)?
11. Do you know what the goals of your child’s service plans are?
12. Do you or your child have a choice regarding services you and he or shereceive?

100
13. How are you included in the planning and/or implementation of the serviceplan?
14. Do you feel the service plan supports you as well as your family?
15. What is the most important thing that needs to be done for your family?
16. Do you think the service plan will help your family live togethersuccessfully?
If in out-of-home placement:
17. How often do you visit with your child face to face? Where do you visit?
18. How often do you speak on the phone with your child?
19. Were family preservation services offered to keep your family together?
20. When do you anticipate your child’s return home?
21. Do you think your child’s placement is appropriate and what’s best forhim/her?
22. Is there anything else you would like to tell me about your child or yourworking relationship with ?

101
Appendix 4: Direct Services and OCAs by Service Category (FY01-02)Out-of-Home ServicesOCA OCA_Title
39EAS IV-A EMERGENCY ASSIST. FOR SUBSTITUTE CAREBX000 EMERGENCY SHELTER CARECHF0T CHAFEE FOSTER CARE INDEPENDENCE PROGRAM - OTHERCHFRB CHAFEE FC INDEPENDENCE PROGRAM ROOM AND BOARDCHKEM SECURITY CHECKS OF CAREGIVERSE1100 PSSF TIME-LIMITED FAMILY REUNIFICATION SERVICESE110R PSSF N’HOOD PARTNER. TIME-LIMITED FAMILY REUN.E1400 PSSF COMMUNITY FACILITATION - OHSE140R PSSF N’HOOD PARTNER. COMMUNITY FACILITATION-OHSFC00H FOSTER CARE ADMINISTRATION-OUT OF HOME CAREKR000 CHAFEE FC INDEPENDENCE PROGRAMKT000 FOSTER CARE RECRUITMENT AND RETENTIONNA000 NONPSYCHIATRIC RESIDENTIAL GROUP CAREPR005 MEDICAID ADMIN.- OHS - COMMUNITY-BASED CAREPR006 CHAFEE FC INDEPENDENCE PROGRAM - CBCPR020 IV-E FOSTER CARE CASE MANAGEMENT - CBCPR021 IV-E FOSTER CARE PREPLACEMENT/PLACEMENT - CBCPR022 IV-E FOSTER CARE ELIGIBILITY DETERMINATION - CBCPR023 IV-E FOSTER CARE - OTHER SERVICES - CBCPR024 SF CHILD WELFARE SVCS. OUT-OF-HOME ADMIN. - CBCPR025 CHILD WELFARE SVCS.- OUT OF HOME - TSTF - CBCPR026 IV-B CHILD WELFARE SVCS OUT-OF-HOME ADMIN. - CBCPR027 CHILD WELFARE SVCS. - OUT OF HOME - O&MTF - CBCPR050 IV-E FOSTER CARE MAINTENANCE PAYMENTS - CBCPR051 IV-E FOSTER CARE MAINTENANCE - TSTF - CBCPR052 IV-E FOSTER CARE MAINT.- EXCESS EARNINGS - CBCPR4A0 TITLE IV-A EMERGENCY ASST.-OUT-OF-HOME-CBCPR4A2 TITLE IV-A EMERGENCY ASSISTANCE - ADMIN. - CBCPRC0T CHAFEE FOSTER CARE INDEPENDENCE PRG. OTHER - CBCPRCRB CHAFEE FC INDEPENDENCE PROGRAM RM. & BOARD - CBCPRE11 PSSF TIME-LIMITED FAMILY REUNIFICATION - CBCPRE14 PSSF COMMUNITY FACILITATION - OUT-OF-HOME - CBCPRS11 SSBG FOSTER CARE SVCS. OHS ADMINISTRATION - CBCPRS29 SSBG OTHER CHILD WELFARE SERVICES - CBCPRSS2 SSBG TANF XFER CHILD WELFARE SVC OHS ADMIN - CBCPRT02 TITLE IV-A EMER. ASST. ELIGIBILITY DET. OH-CBCPRV01 IV-E FOSTER CARE ELIGIBILITY DET.- PRV CONTRACTSPRV02 STATE FUNDED OUT-OF-HOME ADMIN. - PRV. CONTRACTSPRV06 CHAFEE FC INDEPENDENCE PROGRAM - PRIVATIZATIONPRV12 TITLE IV-A EMERG. ASST. ADMIN.- OH-PRV. CONTRACTPRV13 IV-E FOSTER CARE PLACEMENT - PRIVATE CONTRACTPRV15 IV-E FOSTER CARE CASE MANAGEMENT-PRV. CONTRACTS

102
PRV17 IV-E FOSTER CARE OTHER SERVICES - PRV. CONTRACTSPRV18 IV-E FOSTER CARE LIC/RECRUIT/TRAIN-PRV. CONTRACTPRV72 TITLE IV-B FOSTER CARE OUT-OF-HOME SERVICESPRVB5 MEDICAID ADMIN.- FOSTER CARE - PRV. CONTRACTSPRVT0 IV-A EMERG. ASST. ELIGIBILITY DET.-PRV. CONTRACTRGC05 XIX MEDICAID ADMINISTRATION OUT-OF-HOME-RGCRGC20 IV-E FOSTER CARE CASE MANAGEMENT-RGCRGC21 IV-E FOSTER CARE - PLACEMENT OHS - RGCRGC22 IV-E FOSTER CARE - ELIG. DETERMINATION OH - RGCRGC23 IV-E FOSTER CARE OTHER-RGCRGC24 STATE FUNDED MAINTENANCE PAYMENTS OHC - RGCRGC50 IV-E FOSTER CARE MAINTENANCE - RGCRGC60 CHILD WELFARE SVCS. - OHC ADMINISTRATION - RGCSF00H STATE FUNDED OUT OF HOME CARESFBAP BEHAVIORAL ANALYST UNITSSFFPS FOSTER PARENT SUPPORTS CONTRACTED SERVICESWH000 FOSTER CARE PROGRAM ADMINISTRATIONWO004 CHILD WELFARE MAINTENANCE PAYMENTS - OHSWR000 IV-E FOSTER CARE MAINTENANCE PAYMENTS - OHS
In-Home ServicesOCA OCA_Title
2L000 FAMILY BUILDERS2LM0E FAMILY BUILDERS-TANF MOE39IHS TANF IN-HOME EMERGENCY SERVICES89K00 HOUSEKEEPER/HOMEMAKER SERVICES FOR CHILDREN89L00 SUPPORT SVCS FOR CHILDREN IN OUT-OF-HOME CAREE1300 PSSF COMMUNITY FACILITATION - IN-HOME SUPPORTE130R PSSF N’HOOD PARTNER. COMMUNITY FACILITATION-IHSE4000 PSSF FAMILY PRESERVATION SERVICESE400R PSSF N’HOOD PARTNER. FAMILY PRESERVATION SERVICEPR105 MEDICAID ADMINISTRATION - IN-HOME - CBCPR124 SF CHILD WELFARE SVCS. IHS ADMINISTRATION - CBCPR125 CHILD WELFARE SERVICES - IN-HOME - TSTF - CBCPR126 CHILD WELFARE SERVICES - IN-HOME - IV-B - CBCPR127 CHILD WELFARE SERVICES - IN-HOME - O&MTF - CBCPR2L0 FAMILY BUILDERS PROGRAM-COMMUNITY BASED CAREPR2LM FAMILY BUILDERS PROGRAM - TANF MOE - CBCPR4A1 TITLE IV-A EMERGENCY ASSIST. ADM. IN-HOME - CBCPRE04 PSSF FAMILY PRESERVATION SERVICES - CBCPRE13 PSSF COMMUNITY FACILITATION - IN-HOME - CBCPRS22 SSBG PROTECTIVE SERVICES - COMMUNITY-BASED CAREPRSS1 SSBG TANF TRANSFER - IN-HOME SVCS. - CBCPRT01 TANF ELIGIBILITY DETERMINATION - IH - CBCPRV05 MEDICAID ADMIN.- IN-HOME - PRV. CONTRACTS

103
PRV10 TANF PROTECTIVE SVCS. ADMIN.- PRV. CONTRACTSPRV21 STATE FUNDED PROTECTIVE SVCS.- PRV. CONTRACTSPRV34 SSBG-PREVENTION/INTERVENTION-IN HOME SUPPORTSPRV71 TITLE IV-B PROTECTIVE SUPERVISION-IH CASE PLANRGC15 XIX MEDICAID ADMINISTRATION IH - RGCRGC30 IV-E FOSTER CARE - CASE MANAGEMENT IH - RGCRGC34 STATE FUNDED CHILD WELFARE SERVICES IH -RGCW6000 INTENSIVE CRISIS COUNSELING PROGRAMWG000 PROTECTIVE SERVICES FOR CHILDREN
Adoption-Related ServicesOCA OCA_Title
39MAS TANF MAINTENANCE ADOPTION SUBSIDYAIA00 ADOPTION INCENTIVE AWARDE1200 PSSF ADOPTION PROMOTION & SUPPORT SERVICESLK000 PURCHASE OF ADOPTION SERVICESMCSA0 MEDICAL COSTS OF SUBSIDIZED ADOPTIONSMP000 NONRECURRING ADOPTION EXP. FOR SPEC. NEEDS CHILDPR003 IV-E ADOPTION ASSISTANCE ADMINISTRATION - CBCPR060 IV-E ADOPTION ASSISTANCE SUBSIDY PAYMENTS - CBCPR061 IV-E ADOPTION ASSISTANCE MAINT.- TSTF - CBCPR062 IV-E ADOPTION ASST. MAINT.- EXCESS EARNING - CBCPRA05 MEDICAID ADMINISTRATION - ADOPTION - CBCPRA24 SF CHILD WELFARE SVCS. ADOPTION ADMIN. - CBCPRA25 CHILD WELFARE SERVICES - ADOPTION - TSTF - CBCPRA25 CHILD WELFARE SERVICES - ADOPTION - TSTF - CBCPRA26 CHILD WELFARE SERVICES - ADOPTION - IV-B - CBCPRA27 CHILD WELFARE SERVICES - ADOPTION - O&MTF - CBCPRA70 STATE FUNDS CHILD WELFARE ADOPTION SUBSIDY - CBCPRA71 CHILD WELFARE ADOPTION SUBSIDIES - TSTF - CBCPRA80 MEDICAL COSTS OF SUBSIDIZED ADOPTIONS - GR - CBCPRA81 MEDICAL COSTS OF SUBSIDIZED ADOPTIONS-TSTF-CBCPRA90 MAINTENANCE ADOPTION SUBSIDY - TANF - CBCPRAIA IV-E ADOPTION INCENTIVE GRANT - CBCPRE12 PSSF ADOPTION PROMOTION & SUPPORT SERVICES - CBCPRS01 SSBG ADOPTION SERVICES ADMINISTRATON - CBCPRSSA SSBG TANF TRANSFER - ADOPTION - CBCPRT03 TANF ADOPTION ADMINISTRATION - CBCPRV03 IV-E ADOPTION ADMINISTRATION - PRV. CONTRACTSPRV04 STATE FUNDED ADOPTION ADMIN. - PRV. CONTRACTSPRV73 ADOPTION ASSISTANCE-NON IV-E ELIGIBLEPRVA5 MEDICAID ADMIN. ADOPTION - PRV. CONTRACTSPRVT2 TANF ADOPTION ASSISTANCE ADMIN. PRV. CONTRACTSWO006 CHILD WELFARE ADOPTION SUBSIDIESWR001 IV-E ADOPTION SUBSIDIES

104
WY000 ADOPTION PLACEMENT ADMINISTRATIONWYC00 ONE CHURCH ONE CHILD
Other Direct Child Protective ServicesOCA OCA_Title
DR001 CAN BASIC GRANT PREVENTION & INTERVENTIONE3000 HOME VISITOR/HIGH RISK NEWBORNE6000 PSSF FAMILY SUPPORT SERVICES - IHSE600R PSSF N’HOOD PARTNER. FAMILY SUPPORT SERVICESPR008 CAPTA GRANT - COMMUNITY-BASED CAREPR010 TANF RELATED CHILD WELFARE SERVICES - CBCPRE06 PSSF FAMILY SUPPORT SERVICES - CBCPRS04 SSBG COUNSELING SERVICES - COMMUNITY-BASED CAREPRS20 SSBG PREVENTION/INTERVENTION - CBCPRS29 SSBG OTHER CHILD WELFARE SERVICES - CBCTCMCW STATE SHARE OF CHILD WELFARE TARGETED CASE MGT.

105
Appendix 5: Total Expenditures for District Specific Projects by District andFiscal YearDistrict FY96 FY97 FY98 FY99 FY00 FY01 FY02 Total1 141,225 127,718 129,854 152,860 26,105 241,482 0 819,2442 227,792 207,253 210,718 205,221 45,625 62,998 0 959,6083 148,590 149,784 152,288 152,181 158,838 385,576 225,604 1,372,8604 258,691 233,765 232,142 275,506 24,653 8,895 0 1,033,6515 147,788 131,542 154,341 232,547 56,618 0 0 722,8366 268,481 220,222 251,890 486,610 200,459 253,503 0 1,681,1647 258,164 238,929 244,204 321,587 72,436 0 0 1,135,3218 200,412 99,980 141,193 124,083 23,489 2,860 0 592,0179 68,687 62,103 63,232 114,597 12,638 0 0 321,25710 192,663 168,286 178,527 219,839 39,065 52,230 0 850,61011 191,067 172,670 163,514 341,743 184,173 723,028 456,614 2,232,80912 85,291 76,289 78,565 90,894 14,642 137,566 0 483,24713 123,421 107,950 145,480 138,355 1,631 2,418 0 519,25514 160,211 143,920 154,793 137,916 17,794 12,005 0 626,63915 113,103 110,111 119,138 120,399 32,354 250 0 495,35623 0 0 0 0 0 0 0 0
Total 2,585,587 2,250,522 2,419,878 3,114,338 910,520 1,882,809 682,218 13,845,874

106
Appendix 6: Proportion of Each Study Year Data Were Allocated to CBCStatus, by CBC Site
County ServiceContractDate
FY9596 FY9697 FY9798 FY9899 FY9900 FY0001 FY0102
Sarasota 1/1/1997 0.0% 49.6% 100.0% 100.0% 100.0% 100.0% 100.0%Manatee 5/1/1999 0.0% 0.0% 0.0% 16.7% 100.0% 100.0% 100.0%Pinellas 6/1/2000 0.0% 0.0% 0.0% 0.0% 8.2% 100.0% 100.0%Pasco 6/1/2000 0.0% 0.0% 0.0% 0.0% 8.2% 100.0% 100.0%DeSoto 10/1/2001 0.0% 0.0% 0.0% 0.0% 0.0% 0.0% 74.8%Hillsborough 5/1/2002 0.0% 0.0% 0.0% 0.0% 0.0% 0.0% 16.7%Flagler 12/1/2001 0.0% 0.0% 0.0% 0.0% 0.0% 0.0% 58.1%Volusia 12/1/2001 0.0% 0.0% 0.0% 0.0% 0.0% 0.0% 58.1%Walton 12/21/2001 0.0% 0.0% 0.0% 0.0% 0.0% 0.0% 52.6%Escambia 12/21/2001 0.0% 0.0% 0.0% 0.0% 0.0% 0.0% 52.6%Santa Rosa 12/21/2001 0.0% 0.0% 0.0% 0.0% 0.0% 0.0% 52.6%Okaloosa 12/21/2001 0.0% 0.0% 0.0% 0.0% 0.0% 0.0% 52.6%

107
Appendix 7: Author Information
Robert I. Paulson, Ph.D., is a Visiting Research Professor at the Louis de laParte Florida Mental Health Institute at the University of South Florida. He is co-principle investigator of the Evaluation of Community Based Care for the FloridaDepartment of Children and Families Lead Research Scientist for the Center forConflict Management in Mental Health funded by the Hewlett Foundation, andco-investigator of an ORC-MACRO sub-study examining the implementation ofnine “graduating” CMHS System of Care Sites. He is currently on leave asProfessor at the Graduate School of Social Work, Portland State University andaw Adjunct Professor in the Departments of Public Health and PreventiveMedicine and Psychiatry at the Oregon Health Sciences University. He wasDirector of the NIMH funded Center for the Study of Mental Health Policy andServices. He was also Principal Investigator on a number of federally fundedmental health research projects studying housing, employment, organization andfinancing issues for adults and children with major mental illness. He wasformerly director of the Specialized Mental Health Training Program at the Schoolof Social Work, University of Cincinnati. He has also served as a member of anumber of federal grant review groups and consensus panels. Over the last 20years he has served on the board of community mental health centers, asPresident of the Ohio Council of Community Mental Health Agencies, and as aboard member of the Midwest Mental Health Leadership Consortium, theNational Community Behavioral Health care Council (formally the NationalCouncil of Community Mental Health Centers), the Oregon Consumer TechnicalAssistance Center, and the National Alliance of the Mentally Ill-Oregon Chapter.
Mary I. Armstrong, Ph.D. is the Director of the Division of State and LocalSupport, Department of Child and Family Studies at the Louis de la Parte FloridaMental Health Institute, University of South Florida. She is responsible for theadministration of the Division of State and Local Support including the direction ofevaluation and research activities, and specialized consultation, training, andtechnical assistance to public sector entities nationally and in Florida. Currentactivities include a national study of managed care and its effects on childrenwith serious emotional problems, child welfare privatization, the impact of welfarereform on the adolescent daughters of enrollees, and financing mechanisms forsystems of care. She is an active member of the National Association of SocialWorkers and has many publications in both professional journals and textbooks.
Neil Jordan, Ph.D., is an Assistant Professor in the Department of Mental HealthLaw & Policy in the Louis de la Parte Florida Mental Health Institute (FMHI) at theUniversity of South Florida. Dr. Jordan is a health economist and health servicesresearcher whose research interests include access to care for vulnerablepopulations, financing and delivery of mental health and substance abuseservices, Medicaid policy, and cost-effectiveness analysis. Dr. Jordan has eightyears of experience in the economic evaluation of human service systems,

108
medical procedures, and social policy. He has worked with the FloridaDepartment of Children and Families in analyzing the costs of a community-based care system for child welfare services. He is collaborating with MarionBecker on a series of studies examining the use and cost of behavioral healthservices among children and families in the child welfare system. Dr. Jordan iscurrently the principal investigator for an evaluation of changes to the publicbehavioral health system in two areas of Florida. He is also leading anevaluation of the cost-effectiveness of the Broward County Mental Health Court.
Mary Ann Kershaw is an Assistant in Research in the Department of Child &Family Studies at the Louis de la Parte Florida Mental Health Institute at theUniversity of South Florida. Originally trained as a clinician she has evolved overthe past decade as a researcher and evaluator. Her experiences as both atherapist and case manager have influenced her examination of child welfare andchildren’s mental health practice. Her primary area of interest is the interfacebetween the two systems and the challenges inherent in providing qualityservices to the children and families involved. Methodologically, she is drawn tothe application of qualitative techniques that gather information directly fromfront-line informants (i.e., consumers and direct line staff).
Frank C. Reyes, A.A. is a Human Service Program Specialist in the Departmentof Child & Family Studies at the Louis de la Parte Florida Mental Health Instituteat the University of South Florida. He comes to the Department of Child & FamilyStudies after 18 years managing the Intensive Residential Treatment (IRT) unitand the Clinical Research and Education Units at FMHI. During that time hesupervised the day staff, conducted psychoeducational groups, HIV educationand training, managed daily treatment team meetings, and coordinated QualityAssurance. Prior to arriving at FMHI his background was in developmentalservices, serving as Executive Director of a residential programs and the PascoAssociation for Retarded Citizens.
Amy Vargo, M.A. is a faculty member in the Department of Child & FamilyStudies at the Louis de la Parte Florida Mental Health Institute at the Universityof South Florida and is pursuing her doctorate in Applied Anthropology. Inaddition to experience as both a resident care worker and case managementintern for mentally ill adults, she brings with her five years of experience inprogram development and evaluation. Her past evaluation and research effortsinclude the evaluation of Community-Based Care, infant and toddler mentalhealth and service utilization, children with identified mental health needs withinthe child welfare system, teenage pregnancy prevention and intervention, qualityof and access to HIV services for African Americans, and substance abusetreatment for women and children. Of particular interest methodologically arequalitative techniques and multiple levels of analysis (e.g., cultural norms vs.individual characteristics).

109
Svetlana Yampolskaya, Ph.D. is a Research Assistant Professor in theDepartment of Child & Family Studies at the Louis de la Parte Florida MentalHealth Institute at the University of South Florida. She has extensive experiencein research related to program development and evaluation. She has developed,conducted, and participated in numerous studies including the evaluation ofCommunity-Based Care and the evaluation of the Florida Diagnostic andLearning Resources System (FDLRS). She has been a principle investigator fortwo projects that evaluated teen pregnancy prevention programs. In addition,she has participated in numerous studies involving the child welfare system andadolescents with serious emotional disturbances. She currently has a particularinterest in problem behavior in adolescents with history of child abuse.