Evaluation of the Effects of Hydrogen Peroxide on … of the Effects of Hydrogen Peroxide on Common...
24
Evaluation of the Effects of Hydrogen Peroxide on Common Aviation Structural Materials S.F. Chou, M.H. Sk, N.I. Sofyan, R.A. Overfelt, W.F. Gale, H.S. Gale C.G. Shannon, J.W. Fergus National Air Transportation Center of Excellence for Research in the Intermodal Transport Environment Auburn University Auburn, AL 36849 J. Watson Office of Aerospace Medicine Federal Aviation Administration Washington, DC 20591 December 2009 Final Report DOT/FAA/AM-09/23 Office of Aerospace Medicine Washington, DC 20591 OK-10-0077
Transcript of Evaluation of the Effects of Hydrogen Peroxide on … of the Effects of Hydrogen Peroxide on Common...

Evaluation of the Effects of Hydrogen Peroxide on Common Aviation Structural Materials
S.F. Chou, M.H. Sk, N.I. Sofyan, R.A. Overfelt, W.F. Gale, H.S. GaleC.G. Shannon, J.W. FergusNational Air Transportation Center of Excellence for Research in the Intermodal Transport EnvironmentAuburn UniversityAuburn, AL 36849J. WatsonOffice of Aerospace MedicineFederal Aviation AdministrationWashington, DC 20591
December 2009
Final Report
DOT/FAA/AM-09/23Office of Aerospace MedicineWashington, DC 20591
OK-10-0077

NOTICE
This document is disseminated under the sponsorship of the U.S. Department of Transportation in the interest
of information exchange. The United States Government assumes no liability for the contents thereof.
___________
This publication and all Office of Aerospace Medicine technical reports are available in full-text from the Civil Aerospace Medical Institute’s publications Web site:
www.faa.gov/library/reports/medical/oamtechreports

i
Technical Report Documentation Page
1. Report No. 2. Government Accession No. 3. Recipient's Catalog No.
DOT/FAA/AM-09/23 4. Title and Subtitle 5. Report Date
December 2009 Evaluation of the Effects of Hydrogen Peroxide on Common Aviation Structural Materials 6. Performing Organization Code 7. Author(s) Chou SF,1 Sofyan NI,1 Overfelt RA,1 Sk MH,1 Gale WF,1 Gale HS,1 Shannon CG,1 Fergus JF,1 Watson J2
8. Performing Organization Report No.
9. Performing Organization Name and Address 10. Work Unit No. (TRAIS) 1National Air Transportation Center of Excellence for Research in the Intermodal Transport Environment Auburn University Auburn, AL 36849
2FAA Office of Aerospace Medicine 800 Independence Avenue, S.W. Washington, DC 20591
11. Contract or Grant No. Co-Op Agrmt No. 07-C-RITE-AU
12. Sponsoring Agency name and Address Office of Aerospace Medicine Federal Aviation Administration 800 Independence Ave., S.W. Washington, DC 20591
13. Type of Report and Period Covered
14. Sponsoring Agency Code 15. Supplemental Notes Work was accomplished under Public law 108-76 16. Abstract Infected passengers can unintentionally contaminate the interior of aircraft; deliberate biological contamination from criminals and international adversaries is also possible. Previous work has provided information regarding the delivery mechanism and capability of STERIS Corporation's Vaporized Hydrogen Peroxide (VHP * ) technology as a decontaminant/disinfectant/sanitizer for transportation vehicles like aircraft, buses, subway trains, ambulances, etc. The present report documents a materials compatibility evaluation of the effects of hydrogen peroxide exposure on the physical and mechanical properties of the following commercial grade structural materials: 2024-T351, 2024-T6 and 7075-T6 aluminum, 304 stainless steel, carbon fiber/epoxy composites and glass fiber/epoxy composites, including FR4 laminate materials widely used for printed circuit boards. Measurements of changes in sample weights due to absorption, oxidation, or corrosion were made as were evaluations of changes in tensile and flexural mechanical properties. The tensile properties of samples of the metallic samples were unaffected by exposures to either vapor phase or 35% liquid phase hydrogen peroxide. In addition, the carbon fiber/epoxy, glass fiber/carbon fiber epoxy, and the FR4 printed circuit board materials exhibited no significant changes in flexural strength or strain at peak load after 10 VHP exposures. However, some mechanical degradation in the composite samples was observed after 168 hour exposure to 35% liquid hydrogen peroxide. It is recommended that condensation be avoided during application of vapor phase hydrogen peroxide. *VHP is a registered trademark of the STERIS Corporation, Mentor, OH.
17. Key Words 18. Distribution Statement
Hydrogen Peroxide, Decontamination, Materials Compatibility, Metals, Composites, Technology Evaluation
Document is available to the public through the Defense Technical Information Center, Ft. Belvoir, VA 22060; and the National Technical Information Service, Springfield, VA 22161
19. Security Classif. (of this report) 20. Security Classif. (of this page) 21. No. of Pages 22. Price
Unclassified Unclassified 21 Form DOT F 1700.7 (8-72) Reproduction of completed page authorized


iii
ABBREVIATIONS
As used in this report, the following abbreviations/acronyms have the meanings indicated
abbreviation meaning
Ag . . . . . . . . . . SilverASTM . . . . . . . American Society for Testing and MaterialsBI . . . . . . . . . . . Biological indicatorC . . . . . . . . . . . Carbon, CelsiusCF . . . . . . . . . . Carbon fiberCl . . . . . . . . . . . Chlorinecm . . . . . . . . . . Centimeter(s)DI . . . . . . . . . . DeionizedE . . . . . . . . . . . EpoxyFAA . . . . . . . . . Federal Aviation AdministrationFAR . . . . . . . . . Federal Aviation RegulationFl . . . . . . . . . . . FluorineFR . . . . . . . . . . Flame retardantFTIR . . . . . . . . Fourier transform infraredg . . . . . . . . . . . . Gram(s)GF . . . . . . . . . . Glass fiberH . . . . . . . . . . . Hydrogenhr . . . . . . . . . . . Hour(S)kV . . . . . . . . . . KilovoltsM . . . . . . . . . . . Molarmin . . . . . . . . . Minute(s)mm . . . . . . . . . Millimeter(s)MPa . . . . . . . . . Megapascal(s)mV . . . . . . . . . . Millivolt(s)mW . . . . . . . . . Milliwatt(s)N . . . . . . . . . . . NitrogenNa . . . . . . . . . . Sodiumnm . . . . . . . . . . Nanometer(S)O . . . . . . . . . . . Oxygenppm . . . . . . . . . Parts per millionpsi . . . . . . . . . . Pounds per square inchPt . . . . . . . . . . . PlatinumS . . . . . . . . . . . . Sulfurs, sec . . . . . . . . . Second(s)V . . . . . . . . . . . Volt(s)VHP . . . . . . . . Vaporized hydrogen peroxidemm . . . . . . . . . . Micron(s)


v
CONTENTS
INTRODUCTION . . . . . . . . . . . . . . . . . . . . . . . . . . . . . . . . . . . . . . . . . . . . . . . . . . . . . . . . . . . . . . . 1
METHODS AND MATERIALS . . . . . . . . . . . . . . . . . . . . . . . . . . . . . . . . . . . . . . . . . . . . . . . . . . . . 1
RESULTS AND DISCUSSION . . . . . . . . . . . . . . . . . . . . . . . . . . . . . . . . . . . . . . . . . . . . . . . . . . . . . 3
2024 Al, 7075 Al, and 304 Stainless Steel . . . . . . . . . . . . . . . . . . . . . . . . . . . . . . . . . . . . . . . . . . 3
Fiber/Epoxy Composites . . . . . . . . . . . . . . . . . . . . . . . . . . . . . . . . . . . . . . . . . . . . . . . . . . . . . . . 9
CONCLUSIONS . . . . . . . . . . . . . . . . . . . . . . . . . . . . . . . . . . . . . . . . . . . . . . . . . . . . . . . . . . . . . . . 16
REFERENCES . . . . . . . . . . . . . . . . . . . . . . . . . . . . . . . . . . . . . . . . . . . . . . . . . . . . . . . . . . . . . . . . . 16

1
Evaluation of thE EffEcts of hydrogEn PEroxidE on common aviation structural matErials
INTRODUCTION
Among all the large-scale disinfection and/or decon-tamination technologies available, vaporized hydrogen peroxide (VHP)1 is of particular interest because it can be rapidly sterilized, is easy to use, and intrinsically environmentally friendly (i .e ., simple by-products com-posed of only water and oxygen) and compatible with many materials and systems . VHP® technology has been investigated for possible usage in aircraft applications (1-3) . These studies used vaporized hydrogen peroxide concentrations in the range of 150 - 600 ppm and cycle times of 80 - 120 min . Maximum concentrations of hydrogen peroxide vapor were carefully controlled to avoid condensation in cool locations within the aircraft cabins . Although these previous studies did not evalu-ate the compatibility of the various cabin materials with exposure to vaporized hydrogen peroxide, it was noted that there were no noticeable changes to any of the cabin materials (2) .
A typical VHP® process cycle consists of an initial dehumidification step, then a conditioning phase, fol-lowed by the actual sanitization/decontamination process . Finally, an aeration phase is employed to remove residual hydrogen peroxide vapor . During the dehumidification phase, warm, dry air flows into the enclosure to lower the relative humidity to less than 10%, which allows a higher concentration of hydrogen peroxide vapor to be injected into the enclosure without condensation . Hy-drogen peroxide liquid concentrate (35% liquid H2O2 with a pH ~ 3) is then flash vaporized and injected into the enclosure during the initial conditioning phase, as well as the sanitization/decontamination phase . The purpose of the conditioning phase is to rapidly increase the hydrogen peroxide concentration to minimize the overall cycle time . During the sanitization/decontamina-tion phase, a steady concentration of hydrogen peroxide vapor (typically 250 - 450 ppm) is maintained to give the desired sanitization/decontamination cycle, as often measured by the 6-log kill (i .e ., 106 reduction) of a commercial biological indicator (BI) spore population of Geobacillus stearothermophilus . Once the sanitization/decontamination phase is completed, the enclosure is
1 VHP is a registered trademark of STERIS Corporation, Mentor, OH, USA .
then aerated with fresh air while any residual hydrogen peroxide vapor breaks down into environmentally benign water and oxygen .
Many polymeric materials are known to be susceptible to absorption of moisture . The small water molecules dif-fuse into the polymer matrix and force apart the polymer macromolecules causing swelling . Increases in the distance between the polymer chains reduce the strength of the secondary intermolecular bonds and increase the softness and ductility of the polymer . However, the highly cross-linked epoxies used in aerospace-grade fiber composites minimize moisture absorption, and these materials exhibit good resistance to degradation in wet environments (4) . While molecules of H2O2 vapor should be even less absorbed by epoxies than H2O molecules, the intermo-lecular cross-links might be degraded by oxidation from the hydrogen peroxide . The extensive use of fiber/epoxy composites in aerospace structures and avionics dictates that the compatibility of these materials with hydrogen peroxide vapor be examined .
The motivation for this work was to evaluate the ma-terials compatibility of typical aerospace-grade structural composites representative of those typically used in air-craft . A preliminary examination of the compatibility of common metal alloys used in airframes (2024 and 7075 aluminum alloys), galleys, and lavatories (304 austenitic stainless steel) has also been conducted .
METHODS AND MATERIALS
Thin commercial-grade sheet samples of 2024-T351 aluminum (1 .27 mm thick), 7075-T6 aluminum (1 .22mm thick), and annealed 304 stainless steel (1 .22 mm thick) were acquired from McMaster Carr Corpo-ration (Atlanta, GA, USA) . Thin sheets were chosen to maximize the surface area to volume ratio of the materi-als and enhance the potential measurable effects on the mechanical properties of the materials . A few samples of 2024 were solution heat treated and aged to the T6 condition .
Commercial-grade sheet samples of Hexcel Corpora-tion epoxy impregnated carbon fiber fabric composites (6 fabric layers, 3 .2 mm thick overall) were acquired from McMaster Carr Corporation (Atlanta, GA, USA) . The carbon fibers in the fabric were oriented along the length direction, as well as the transverse direction (i .e .,

2
0/90 orientations) and exhibited a total fiber volume of 55% of the overall sheet volume . These samples are identified as CF-E samples in this document . Additional samples of woven carbon/glass fiber fabrics impregnated with epoxy resin (2 fabric layers, 1 .6 thick overall) from Acculam Corporation were acquired from McMaster Carr Corporation (Atlanta, GA, USA) . These samples are identified as CF/GF-E samples in this document . These laminates were then sectioned into 75 X 12 .5 mm test coupons for hydrogen peroxide exposure and mechanical testing .
In addition, epoxy impregnated glass fiber fabric composites known as FR4 laminate for printed circuit board manufacture (3 layer lamination, uncoated: 5 .0 mm thick and coated 5 .15 mm thick) were acquired from Park Electrochemical Corp . These samples are identified as FR4 samples in this document . (Fullerton, CA) . Some samples of the FR4 laminate were conformal coated with a 0 .075 mm thick 1B31 protective acrylic coating at Humiseal Protective Coatings (Woodside, NY) before being sectioned into 152 X 12 .7 mm test samples for 3 point bending mechanical tests .
Tension testing of the metallic samples and flexural testing of the epoxy-based composite samples was per-formed according to ASTM standards E8M-00b (5) and D790-0 (6), respectively, in an environmentally conditioned laboratory (21 ± 1 ºC, 65 ± 2 % relative humidity) using a screw driven Instron 4400R (Instron Inc ., Canton, MA, USA) universal materials testing machine . A minimum of 5 samples were tested for each condition . Samples were taken from the sheets in either the longitudinal or transverse orientation .
Surface hardness of metallic samples was characterized by Vickers microhardness (300g load), and nanoindention measurements were performed using a NANO Indenter XP (MTS Systems, Eden Prairie, MN, USA) .
All sample exposures to vaporized hydrogen peroxide were performed with a 1000ED Bio-decontamination Unit (STERIS Corporation, Mentor, OH, USA) using VAPROX®2 as the sterilant in an enclosed chamber for 1, 10, or 25 VHP cycles . The exposure chamber was de-humidified to 10% relative humidity prior to VAPROX® injection to minimize any chance of unintended con-densation of the hydrogen peroxide vapor . The chamber concentration was maintained at 450ppm H2O2 for 4 .8 hr . Hydrogen peroxide concentrations were monitored with ATI Sensors (ATI Inc ., Collegeville, PA, USA) . These sensors are reported by the manufacturer as having an accuracy of +5% at concentrations above ~50ppm .
2 Vaprox is a registered trademark of STERIS Corporation, Mentor, OH, USA .
In order to investigate possible effects of hydrogen peroxide spillage or accidental condensation during a decontamination cycle, dip exposures of samples to 35% liquid phase hydrogen peroxide was carried out in opaque PVC bottles (Fisher Scientific, Fair Lawn, NJ, USA) for 24 hr and 168 hr . After dip exposure, all dip specimens were rinsed in DI-water and then air-dried in an electrostatic film drying cabinet (Delta 1, CPM, Inc . Dallas, TX) for 1 day .
Changes in the various samples after exposures to either 35% liquid hydrogen peroxide or vaporized hydrogen peroxide were initially examined via straightforward physical observation (i .e ., appearance to the unaided eyes) and weight change . Sample weights were measured by an accuSeries3 accu-124 balance (Fisher Scientific, Arvada, CO, USA) before and after hydrogen peroxide exposures . The reported accuracy of this device is +100 g . Samples of the CF-E and CF/GF-E composites were dried in a vacuum desiccator for 48 hr and then a standard calcium sulfate filled desiccator for 48 hr prior to measuring the initial weights . The same sample drying procedures were followed after hydrogen peroxide exposures and prior to post-exposure weight measurements . Weight changes of the FR4 samples were measured immediately before and after the VHP processes . Dipped FR4 specimens were air-dried for at least 1 day prior to weight change measurement .
Detailed examination of metallographic samples (be-fore and after exposure) was performed with an Olympus PME3 inverted metallurgical microscope . Keller’s reagent (2 .5mL HNO3, 1 .5mL HCl, 1 mL HF and 95 mL H2O) was used to etch the aluminum samples while an acidic mixture (2 .5 mL HF, 10 mL HNO3, 10 mL HCl and 27 .5 mL H2O) was used to etch the stainless steel samples .
Electron microscopy was performed using a JEOL JSM 7000F field emission scanning electron microscope operating at 20kV with energy dispersive X-ray spectros-copy (EDS) employing an ultrathin window detector and Princeton Gamma-Tech analyzer .
The effects of hydrogen peroxide exposure on the cor-rosion behavior of aluminum samples were investigated via cyclic voltammetry in a 0 .1M NaCl solution with an Ag-AgCl reference electrode and Pt counter electrode . Voltages from - .13 to 0 .3V were scanned at 2 mV s-1 . Corrosion samples (25 X 12 mm) were polished to FEPA P2500-P4000 surface finish . Three samples of each alloy were tested for the various hydrogen peroxide exposures .
Chemical analyses of the composite samples were per-formed using Fourier Transform Infrared Spectroscopy (FTIR) using an IR Prestige – 21 (Shimadzu Scientific
3 accuSeries is a registered trademark of Fisher Scientific, Fair Lawn, NJ, USA .

3
Instruments, Columbia, MD, USA) spectrometer over a scan range from 400 cm-1 to 4000 cm-1 . Raman spectroscopy was employed to complement the infrared spectroscopy . Raman spectra were acquired using an Invia Confocal Raman Microscope (Renishaw, Wotton-under-Edge, Gloucestershire, UK) using a 514 .5 nm wavelength and 1 mW laser excitation source . Spectra were recorded using a 50X objective lens which generated a 1μm laser spot .
Analysis of variance of the test results was performed using the SAS statistical analysis software package (SAS Institute Inc ., Cary, NC, USA) to evaluate the statistical significance of the observed changes due to hydrogen peroxide exposure .
RESULTS AND DISCUSSION
2024 Al, 7075 Al, and 304 Stainless Steel No discernable differences were seen on the surfaces of
the metallic samples after exposure to hydrogen peroxide (vapor or dip exposures) . Specimens of 2024-T351, 7075-T6 and 304 stainless steel were weighed before and after hydrogen peroxide exposure, and the net weight change data are shown in Figure 1 (7) . As seen in Figure 1, no statistically significant weight changes were observed for the stainless steel samples under any exposure condition . Both aluminum alloys exhibited a slight, but measurable weight gain after 25 VHP cycles (0 .01-0 .02%) suggesting a modest amount of superficial oxidation . Some weight loss (0 .03-0 .04%) was seen for the aluminum alloys after dip exposure to the 35% hydrogen peroxide liquid . Gale et al . (7) note that although the overall surface composition of the samples was not modified by the liquid hydrogen
peroxide, copper was preferentially leached from some of the larger intermetallic particles at the surface of the aluminum alloys .
Surface hardness data are shown in Figures 2a and 2b . No changes in surface hardness using the Vickers measurement (Figure 2a) or the nanoindenter (Figure 2b) were seen for any of the alloys or hydrogen peroxide exposure conditions except for some slight but statisti-cally significant softening observed in the nanohardness data of the 2024-T351 dip-tested samples .
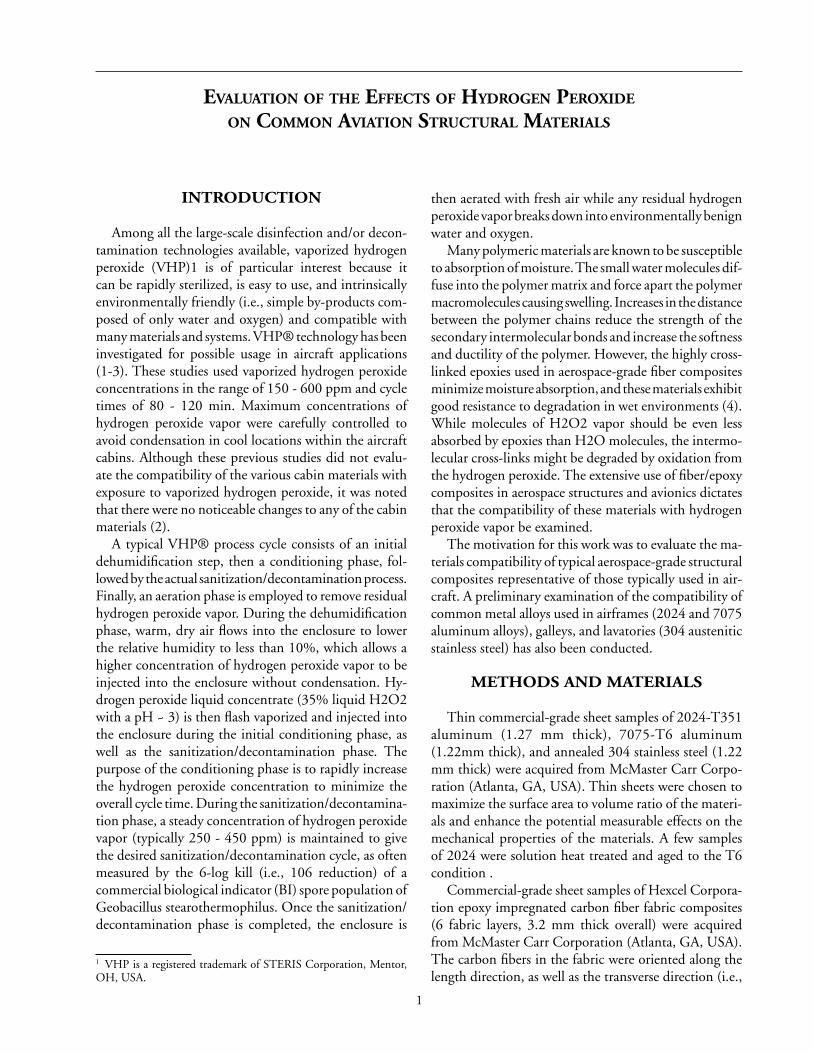
Cyclic voltammetry corrosion results are shown in Figure 3 for the 2024-T351 and the 7075-T6 aluminum samples . The potential of -0 .5V exhibited by the 2024-T351 aluminum alloy agreed with literature data for samples tested under the same conditions but without prior exposure to hydrogen peroxide .(8) The shapes of the curves shown in Figure 3 were not significantly in-fluenced by any of the hydrogen peroxide exposures, and the corrosion behavior of the alloys appears to have been unaffected by any of the hydrogen peroxide exposures .
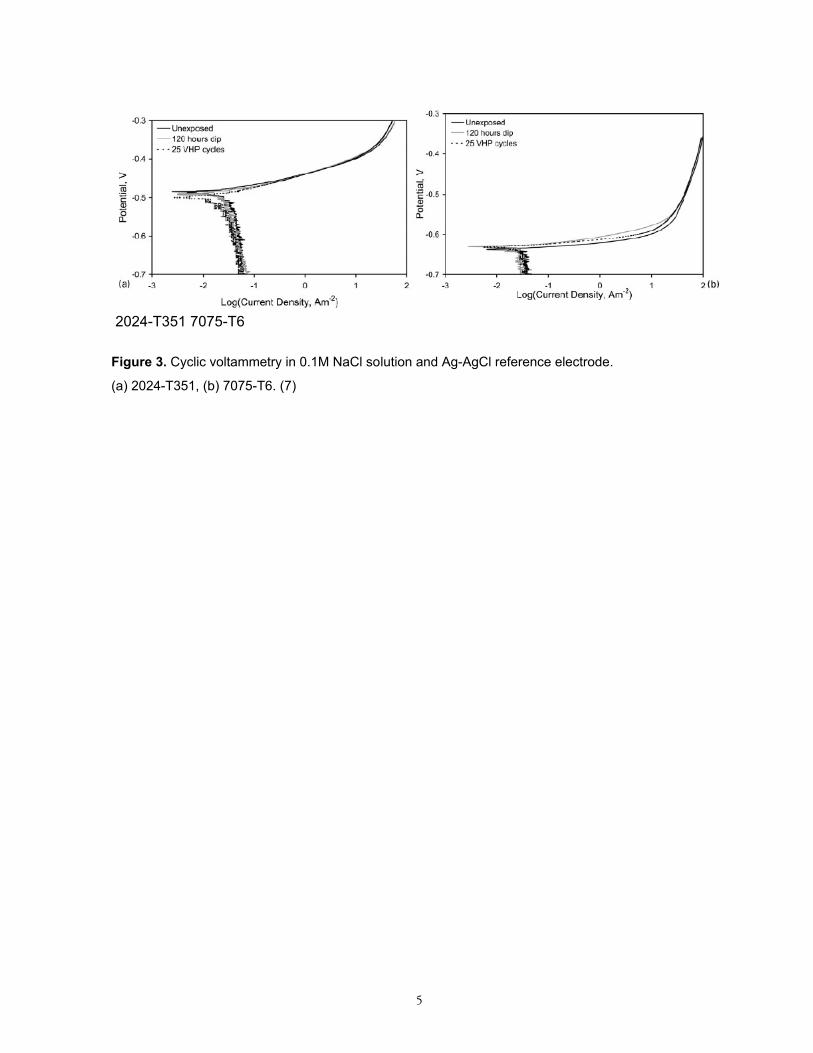
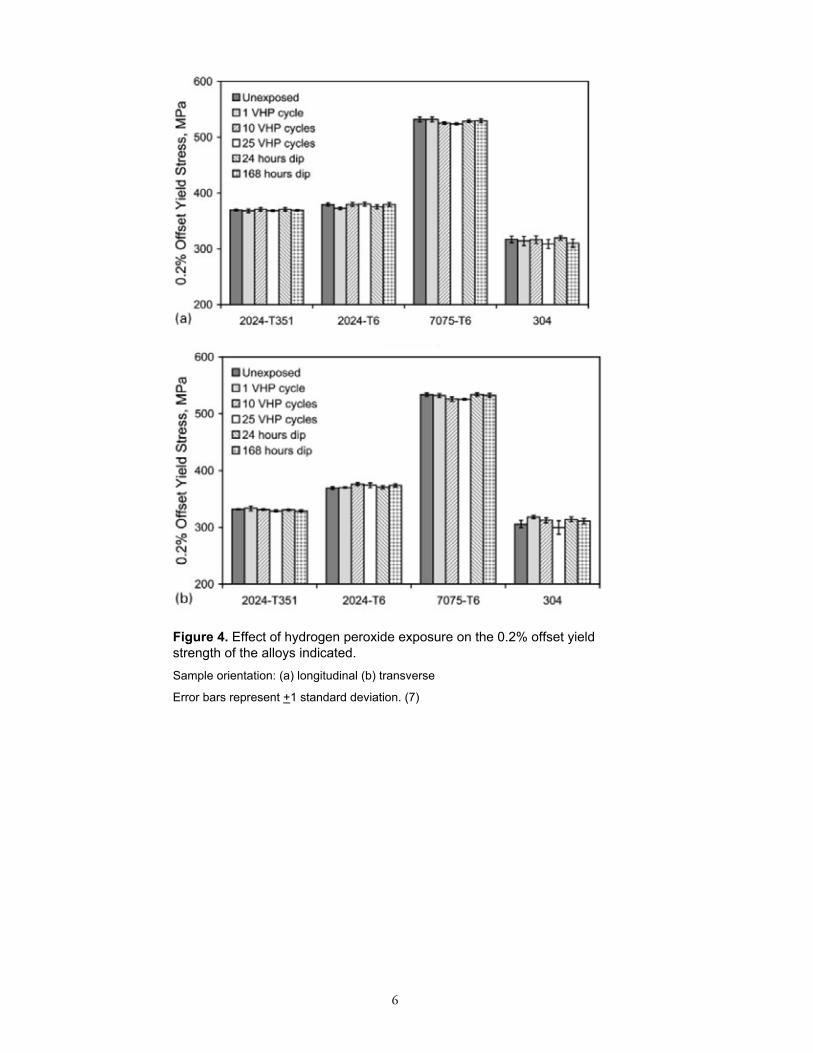
Figures 4, 5, and 6 show the tensile data of the various metallic samples after the indicated exposures to vapor phase or liquid phase hydrogen peroxide . Tensile samples were taken from the sheet materials in either the longitudinal orientation or the transverse orientation . Examination of the tensile data of the aluminum alloys did not reveal any statistically significant effects of the hydrogen peroxide exposures (vapor or dip) . Other than a slight decrease in the measured % elongation to failure of the transverse samples of the annealed 304 stainless steel (for reasons presently unclear), the 304 samples also did not exhibit any statistically significant affects of the hydrogen peroxide exposures .
Figure 1. Metallic sample weight changes due to VHP and dip exposures. Error bars represent +1 standard deviation. (7)

4
(a)
(b)
Figure 2. (a) Sample microhardness changes due to VHP and dip exposures.
(b) Sample nanohardness changes due to VHP and dip exposures.
Error bars represent +1 standard deviation. (7)
5
2024-T351 7075-T6
Figure 3. Cyclic voltammetry in 0.1M NaCl solution and Ag-AgCl reference electrode.
(a) 2024-T351, (b) 7075-T6. (7)
6
Figure 4. Effect of hydrogen peroxide exposure on the 0.2% offset yield strength of the alloys indicated.
Sample orientation: (a) longitudinal (b) transverse
Error bars represent +1 standard deviation. (7)

7
Figure 5. Effect of hydrogen peroxide exposure on the ultimate tensile strength of the alloys indicated.
Sample orientation: (a) longitudinal (b) transverse
Error bars represent +1 standard deviation. (7)
8
Figure 6. Effect of hydrogen peroxide exposure on the % elongation to failure of the alloys indicated.
Sample orientation: (a) longitudinal (b) transverse
Error bars represent +1 standard deviation. (7)

9
Figure 7. Various glass fiber/epoxy FR4 printed circuit board composite samples after 168 hr exposure to 35% liquid hydrogen peroxide. Control sample was not exposed.
Fiber/Epoxy Composites No visual differences were seen on the surfaces of
either the CF/E, CF/GF-E, or uncoated FR4 samples after exposure to hydrogen peroxide (vapor or dip exposures) . However, exposing the FR4 samples with the conformal coating to 35% liquid hydrogen per-oxide for 168 hr caused significant blistering and loss of the acrylic coating, as shown in Figure 7 . The net changes in weight for the various samples are shown in Figure 8 . The carbon fiber/epoxy material exhibited no significant weight change after 10 VHP exposures but approximately 0 .065 % increase in weight after the 168 hr liquid exposure followed by vacuum drying . The carbon fiberglass fiber/epoxy material exhibited increases in weight after vacuum drying of about 0 .015% after 10 VHP exposures and 0 .035% after the 168 hr liquid exposure .
The FR4 samples (coated and uncoated, longitu-dinal or transverse orientations) displayed negligible weight changes after a single VHP cycle but about 0 .02% decrease in weight after 10 VHP cycles . The 168-hr dip exposures caused increases in weight of about 0 .07% for the uncoated samples and approximately 0 .03% for the coated (transverse orientation) samples, indicating perhaps either some residual absorbed liquid or some slight oxidation of the samples . The dip exposures of the longitudinally oriented samples shown in Figure 7 caused highly variable weight losses consistent with the blistering of the conformal coating, as shown in Figure 7 .
The flexural properties of the carbon and glass fiber/epoxy structural composites are shown in Figure 9 . The carbon fiber/epoxy material exhibited no signifi-cant change in flexural strength or strain at peak load after 10 VHP cycles . However, statistically significant decreases in flexural strength and especially strain at peak load were exhibited after 168 hr dip exposures to 35% hydrogen peroxide . The failure modes of these samples were characterized by increased amounts of delamination of the reinforcement fabrics, as shown in Figure 10 . The decrease in peak load strain is particularly troubling, as it indicates increased brittleness of this material . This tendency to delaminate and the blistering tendency of the acrylic coating of the FR4 materials may be the result of diffusion of H2O2 molecules to the interfaces of these materials and then generation of microbubbles of either oxygen or water vapor, or both, during decomposition of the hydrogen peroxide .
Although the transverse direction flexural strength and strain at peak load of the carbon fiberglass fiber/epoxy material were lower than those measured in the longitudinal direction, as seen in Figure 9(b), no
significant changes were seen after exposure to either 10 VHP cycles or the 35% liquid hydrogen peroxide for 168 hr .
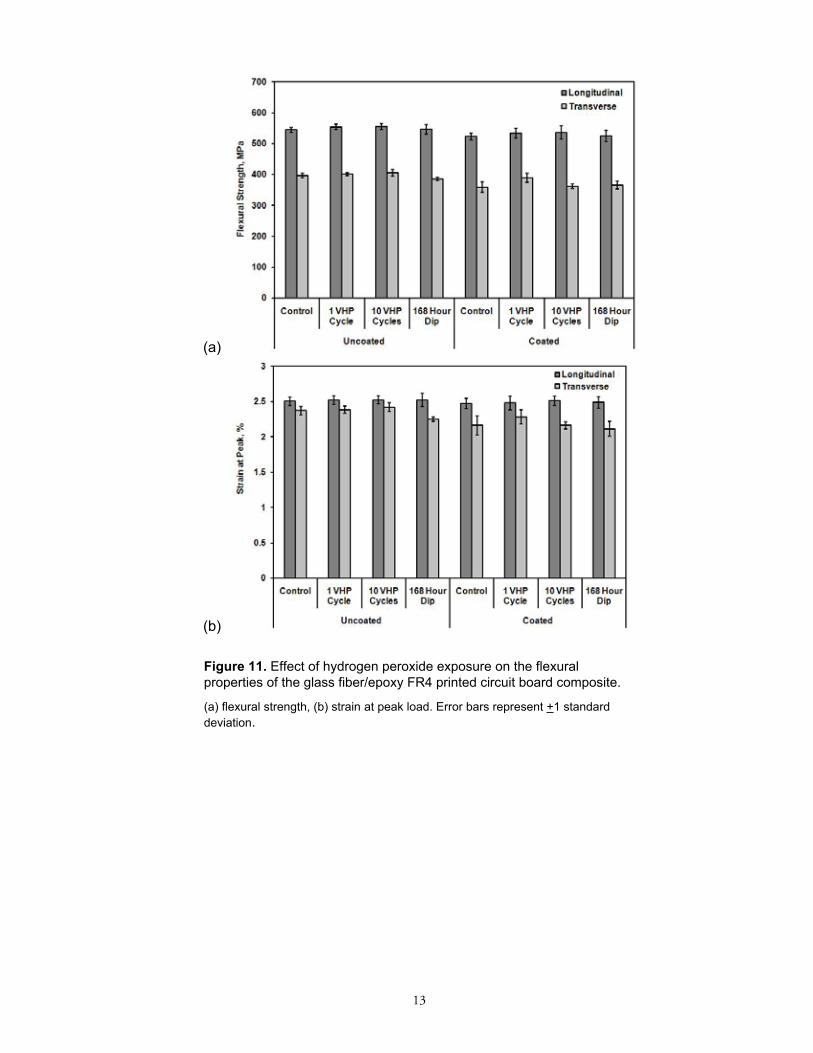
The flexural properties of the FR4 printed circuit board composites are shown in Figure 11 . As noted above for the carbon fiberglass fiber/epoxy material, the flexural properties measured in the transverse direc-tion were consistently lower than those measured in the longitudinal direction . No statistically significant differences were found in either the flexural strength or the strain at peak load as a result of FR4 exposure to hydrogen peroxide vapor or liquid, except for slight degradation of the FR4 transverse sample strain at peak load after 168 hr dip exposures to 35% hydrogen peroxide .
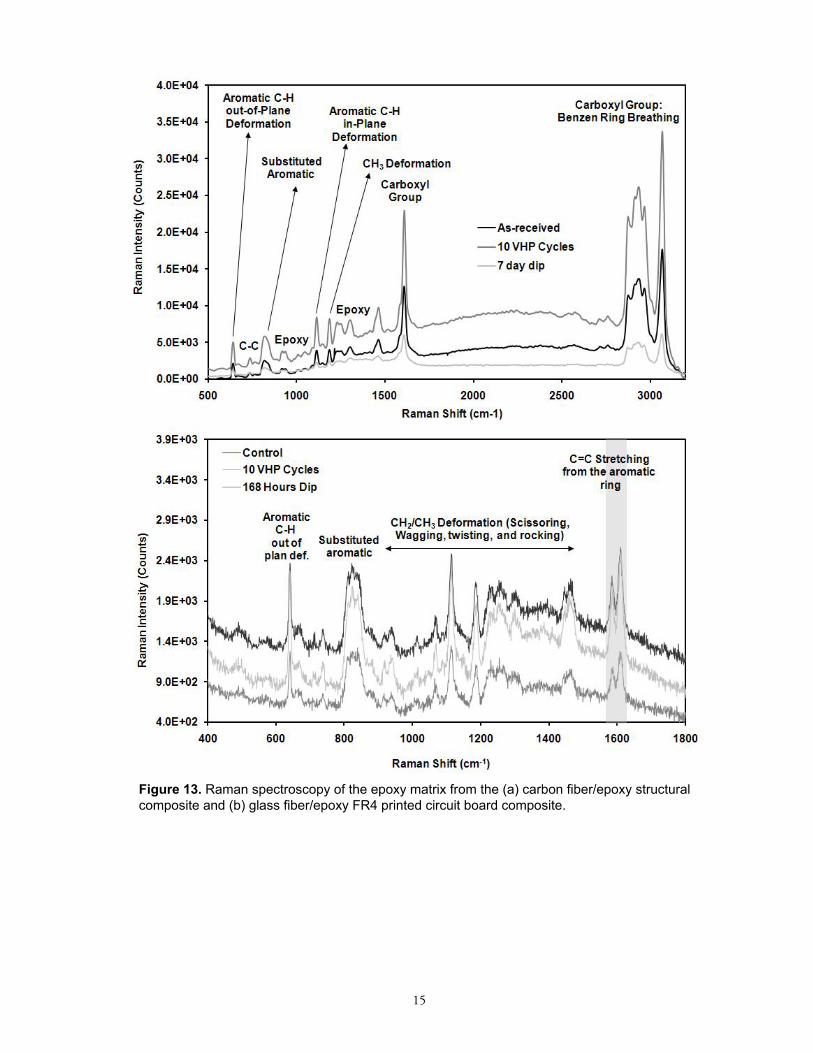
FTIR and Raman spectroscopy were used to ex-amine potential changes due to hydrogen peroxide exposure on the chemical structure of the acrylic conformal coating on the glass fiber/epoxy FR4 printed circuit board composite (see Figure 12), as well as the epoxy matrices of the carbon fiber/epoxy composite and the FR4 material (see Figure 13) . The analyses showed no detectable compositional-based changes due to hydrogen peroxide exposures . The usual characteristic bands observed in the spectra are noted in Figures 12 and 13 .

10
(a )
(b)
Figure 8. Composite sample weight changes due to VHP and dip exposures. (a) Carbon and glass fiber - epoxy structural composites, (b) glass fiber/epoxy FR4 printed circuit board composite. Error bars represent +1 standard deviation.

11
(a)
(b)
Figure 9. Effect of hydrogen peroxide exposure on the carbon and glass fiber - epoxy structural composites. (a) flexural strength, (b) strain at peak load Error bars represent +1 standard deviation.

12
Figure 10. Typical carbon fiber epoxy samples after flexural testing: control sample was not exposed while lower sample was exposed to 35% liquid H2O2 for 168 hr.
13
(a)
(b)
Figure 11. Effect of hydrogen peroxide exposure on the flexural properties of the glass fiber/epoxy FR4 printed circuit board composite.
(a) flexural strength, (b) strain at peak load. Error bars represent +1 standard deviation.

14
(a)
(b) Figure 12. (a) FTIR and (b) Raman spectroscopy of the acrylic conformal coating from the glass fiber/epoxy FR4 printed circuit board composite.
15
Figure 13. Raman spectroscopy of the epoxy matrix from the (a) carbon fiber/epoxy structural composite and (b) glass fiber/epoxy FR4 printed circuit board composite.
16
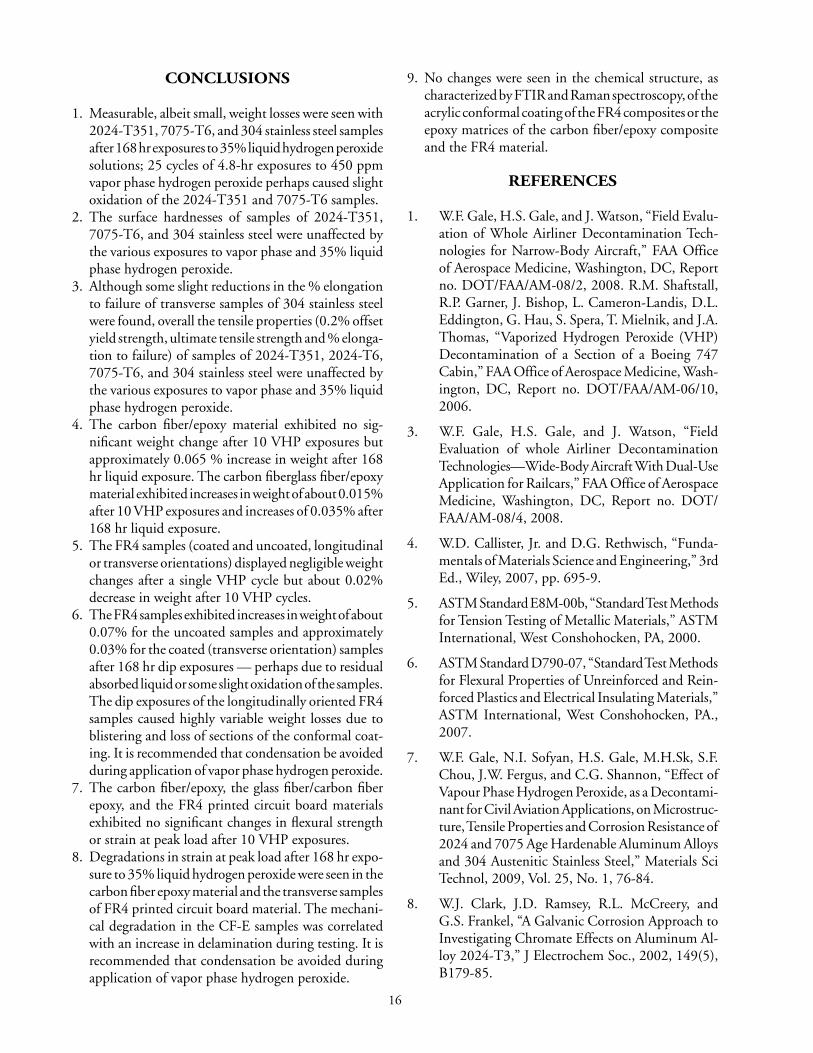
CONCLUSIONS
1 . Measurable, albeit small, weight losses were seen with 2024-T351, 7075-T6, and 304 stainless steel samples after 168 hr exposures to 35% liquid hydrogen peroxide solutions; 25 cycles of 4 .8-hr exposures to 450 ppm vapor phase hydrogen peroxide perhaps caused slight oxidation of the 2024-T351 and 7075-T6 samples .
2 . The surface hardnesses of samples of 2024-T351, 7075-T6, and 304 stainless steel were unaffected by the various exposures to vapor phase and 35% liquid phase hydrogen peroxide .
3 . Although some slight reductions in the % elongation to failure of transverse samples of 304 stainless steel were found, overall the tensile properties (0 .2% offset yield strength, ultimate tensile strength and % elonga-tion to failure) of samples of 2024-T351, 2024-T6, 7075-T6, and 304 stainless steel were unaffected by the various exposures to vapor phase and 35% liquid phase hydrogen peroxide .
4 . The carbon fiber/epoxy material exhibited no sig-nificant weight change after 10 VHP exposures but approximately 0 .065 % increase in weight after 168 hr liquid exposure . The carbon fiberglass fiber/epoxy material exhibited increases in weight of about 0 .015% after 10 VHP exposures and increases of 0 .035% after 168 hr liquid exposure .
5 . The FR4 samples (coated and uncoated, longitudinal or transverse orientations) displayed negligible weight changes after a single VHP cycle but about 0 .02% decrease in weight after 10 VHP cycles .
6 . The FR4 samples exhibited increases in weight of about 0 .07% for the uncoated samples and approximately 0 .03% for the coated (transverse orientation) samples after 168 hr dip exposures — perhaps due to residual absorbed liquid or some slight oxidation of the samples . The dip exposures of the longitudinally oriented FR4 samples caused highly variable weight losses due to blistering and loss of sections of the conformal coat-ing . It is recommended that condensation be avoided during application of vapor phase hydrogen peroxide .
7 . The carbon fiber/epoxy, the glass fiber/carbon fiber epoxy, and the FR4 printed circuit board materials exhibited no significant changes in flexural strength or strain at peak load after 10 VHP exposures .
8 . Degradations in strain at peak load after 168 hr expo-sure to 35% liquid hydrogen peroxide were seen in the carbon fiber epoxy material and the transverse samples of FR4 printed circuit board material . The mechani-cal degradation in the CF-E samples was correlated with an increase in delamination during testing . It is recommended that condensation be avoided during application of vapor phase hydrogen peroxide .
9 . No changes were seen in the chemical structure, as characterized by FTIR and Raman spectroscopy, of the acrylic conformal coating of the FR4 composites or the epoxy matrices of the carbon fiber/epoxy composite and the FR4 material .
REFERENCES
1 . W .F . Gale, H .S . Gale, and J . Watson, “Field Evalu-ation of Whole Airliner Decontamination Tech-nologies for Narrow-Body Aircraft,” FAA Office of Aerospace Medicine, Washington, DC, Report no . DOT/FAA/AM-08/2, 2008 . R .M . Shaftstall, R .P . Garner, J . Bishop, L . Cameron-Landis, D .L . Eddington, G . Hau, S . Spera, T . Mielnik, and J .A . Thomas, “Vaporized Hydrogen Peroxide (VHP) Decontamination of a Section of a Boeing 747 Cabin,” FAA Office of Aerospace Medicine, Wash-ington, DC, Report no . DOT/FAA/AM-06/10, 2006 .
3 . W .F . Gale, H .S . Gale, and J . Watson, “Field Evaluation of whole Airliner Decontamination Technologies—Wide-Body Aircraft With Dual-Use Application for Railcars,” FAA Office of Aerospace Medicine, Washington, DC, Report no . DOT/FAA/AM-08/4, 2008 .
4 . W .D . Callister, Jr . and D .G . Rethwisch, “Funda-mentals of Materials Science and Engineering,” 3rd Ed ., Wiley, 2007, pp . 695-9 .
5 . ASTM Standard E8M-00b, “Standard Test Methods for Tension Testing of Metallic Materials,” ASTM International, West Conshohocken, PA, 2000 .
6 . ASTM Standard D790-07, “Standard Test Methods for Flexural Properties of Unreinforced and Rein-forced Plastics and Electrical Insulating Materials,” ASTM International, West Conshohocken, PA ., 2007 .
7 . W .F . Gale, N .I . Sofyan, H .S . Gale, M .H .Sk, S .F . Chou, J .W . Fergus, and C .G . Shannon, “Effect of Vapour Phase Hydrogen Peroxide, as a Decontami-nant for Civil Aviation Applications, on Microstruc-ture, Tensile Properties and Corrosion Resistance of 2024 and 7075 Age Hardenable Aluminum Alloys and 304 Austenitic Stainless Steel,” Materials Sci Technol, 2009, Vol . 25, No . 1, 76-84 .
8 . W .J . Clark, J .D . Ramsey, R .L . McCreery, and G .S . Frankel, “A Galvanic Corrosion Approach to Investigating Chromate Effects on Aluminum Al-loy 2024-T3,” J Electrochem Soc ., 2002, 149(5), B179-85 .