Evaluation of the Compressive Strength of Masonry Prisms Filled ...
57
Evaluation of the Compressive Strength of Masonry Prisms Filled With High Volume Mineral Admixture Grout Constructed With Type N Mortar Brice Emerson Somers A project submitted to the faculty of Brigham Young University in partial fulfillment of the requirements for the degree of Master of Science Fernando S. Fonseca, Chair Paul W. Richards Mitsuru Saito Department of Civil and Environmental Engineering Brigham Young University December 2012 Copyright © 2012 Brice Emerson Somers All Rights Reserved
-
Upload
phungxuyen -
Category
Documents
-
view
217 -
download
1
Transcript of Evaluation of the Compressive Strength of Masonry Prisms Filled ...

Evaluation of the Compressive Strength of Masonry Prisms
Filled With High Volume Mineral Admixture Grout
Constructed With Type N Mortar
Brice Emerson Somers
A project submitted to the faculty of
Brigham Young University
in partial fulfillment of the requirements for the degree of
Master of Science
Fernando S. Fonseca, Chair
Paul W. Richards
Mitsuru Saito
Department of Civil and Environmental Engineering
Brigham Young University
December 2012
Copyright © 2012 Brice Emerson Somers
All Rights Reserved


ABSTRACT
Evaluation of the Compressive Strength of Masonry Prisms
Filled With High Volume Mineral Admixture Grout
Constructed With Type N Mortar
Brice Emerson Somers
Department of Civil and Environmental Engineering, BYU
Master of Science
The Concrete Masonry Association of California and Nevada commissioned a research
project at Brigham Young University to analyze the compressive strength of masonry prisms that
were to be cast with grout that had a high quantity of the Portland cement replaced with mineral
admixtures. The laboratory research associated with this project involved a control group of
prisms cast with Portland cement-based grout, a test group with Class F fly ash replacing
determined percentages of cement , and a third test group that utilized Class F fly ash and ground
blast-furnace slag to replace Portland cement. In the test groups, the mineral admixtures replace
45%, 55%, 65%, 75% and 85% of the mix design cement by weight. Sufficient samples of each
mixture were cast to test prisms after 14, 28, 42, 56 and 90 days of curing.
Analyses of the test results indicated that the minimum required design strength for
masonry prisms could be achieved with all of the designs tested except for the design that had
65% of the Portland cement replaced with fly ash. Some of the blended cements attained higher
strengths than the control group and also gained strength at a similar rate. This research
indicated that there was no observed deficiencies with the high mineral admixture volume grouts
and that up to 85% of the Portland cement could be replaced with cementitous by-products if
compressive strength is the only consideration.
Keywords: fly ash, ground granulated blast-furnace slag, high cement replacement concrete,
masonry prism, compressive test

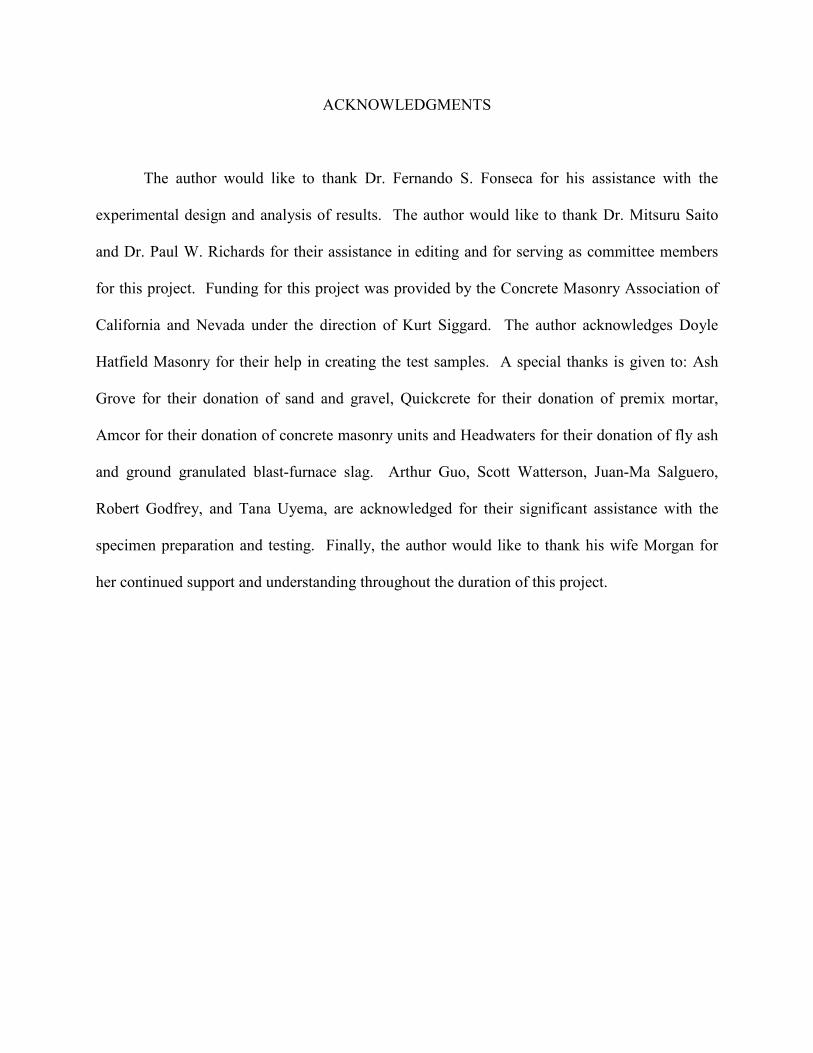
ACKNOWLEDGMENTS
The author would like to thank Dr. Fernando S. Fonseca for his assistance with the
experimental design and analysis of results. The author would like to thank Dr. Mitsuru Saito
and Dr. Paul W. Richards for their assistance in editing and for serving as committee members
for this project. Funding for this project was provided by the Concrete Masonry Association of
California and Nevada under the direction of Kurt Siggard. The author acknowledges Doyle
Hatfield Masonry for their help in creating the test samples. A special thanks is given to: Ash
Grove for their donation of sand and gravel, Quickcrete for their donation of premix mortar,
Amcor for their donation of concrete masonry units and Headwaters for their donation of fly ash
and ground granulated blast-furnace slag. Arthur Guo, Scott Watterson, Juan-Ma Salguero,
Robert Godfrey, and Tana Uyema, are acknowledged for their significant assistance with the
specimen preparation and testing. Finally, the author would like to thank his wife Morgan for
her continued support and understanding throughout the duration of this project.


v
TABLE OF CONTENTS
LIST OF TABLES ...................................................................................................................... vii
LIST OF FIGURES ..................................................................................................................... ix
1 Introduction ........................................................................................................................... 1
1.1 Problem Statement .......................................................................................................... 1
1.2 Scope ............................................................................................................................... 2
1.3 Outline of Report ............................................................................................................ 3
2 Background ........................................................................................................................... 5
2.1 Type N Masonry Mortar ................................................................................................. 5
2.2 Masonry Grout ................................................................................................................ 6
2.3 Portland Cement ............................................................................................................. 6
2.4 Mineral Admixtures ........................................................................................................ 7
2.4.1 Fly Ash ........................................................................................................................ 7
2.4.2 Ground Granulated Blast-Furnace Slag ...................................................................... 9
2.5 Chapter Summary ......................................................................................................... 10
3 Experimental Methodology ................................................................................................ 11
3.1 Mix Design ................................................................................................................... 12
3.2 Mortar and Hollow Prism Preparation .......................................................................... 13
3.3 Grout and Grouted Prism Construction ........................................................................ 17
3.4 Specimen Preparation ................................................................................................... 24
3.5 Specimen Testing .......................................................................................................... 25
3.6 Chapter Summary ......................................................................................................... 28
4 Results .................................................................................................................................. 29
4.1 Data Reduction ............................................................................................................. 29
4.2 Compressive Test Results ............................................................................................. 32

vi
4.3 Chapter Summary ......................................................................................................... 35
5 Conclusions and Recommendations .................................................................................. 37
5.1 Conclusions ................................................................................................................... 37
5.2 Recommendations ......................................................................................................... 38
REFERENCES ............................................................................................................................ 39
Appendix A: TWINING LABORATORY GROUT TEST INFORMATION ...................... 41
Appendix B: MATERIAL PROPERTY CHARTS ................................................................. 43

vii
LIST OF TABLES
Table 3-1: Components of Each Grout Type ................................................................................ 12
Table 3-2: Grout Slump Results ................................................................................................... 20
Table 4-1: Prism Compressive Strength at Each Time Interval in psi .......................................... 32
Table A-1: Twining Laboratories Grout Specimen Compressional Strength Data ...................... 41
Table A-2: Absorption, Density and Moisture Content of CMU Samples ................................... 41
Table A-3: Twining Laboratories Grout Compressive Strength Results ...................................... 42

viii
ix
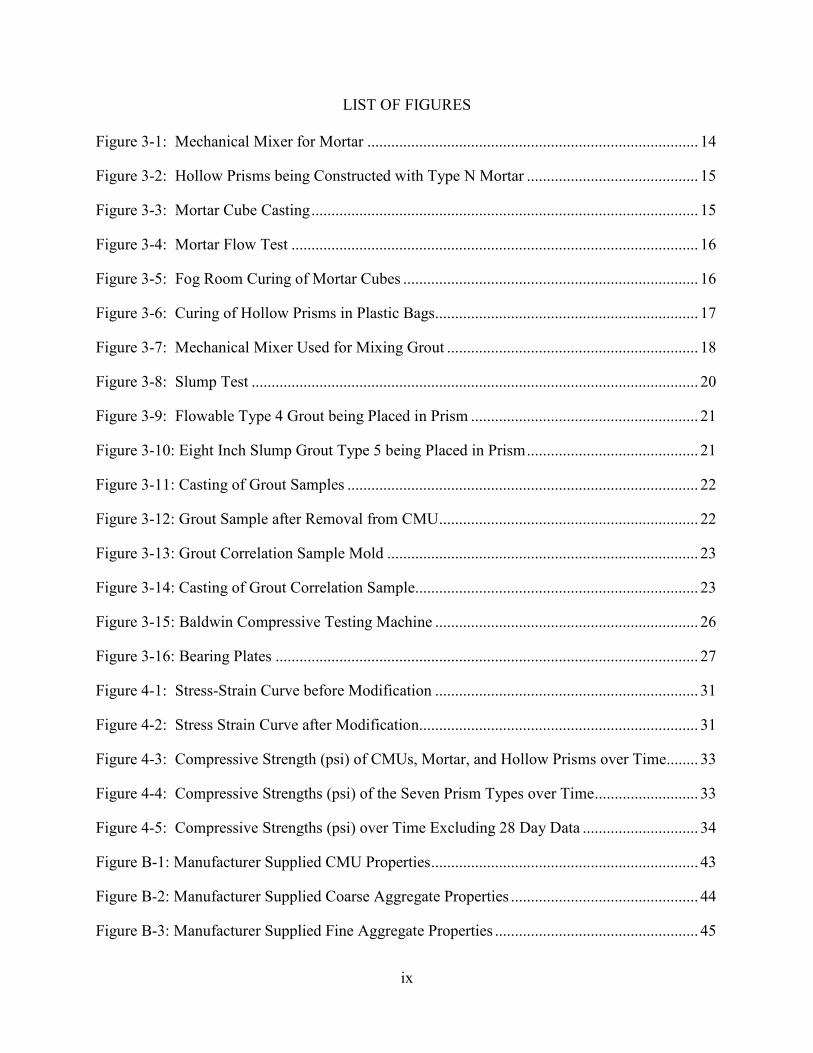
LIST OF FIGURES
Figure 3-1: Mechanical Mixer for Mortar ................................................................................... 14
Figure 3-2: Hollow Prisms being Constructed with Type N Mortar ........................................... 15
Figure 3-3: Mortar Cube Casting ................................................................................................. 15
Figure 3-4: Mortar Flow Test ...................................................................................................... 16
Figure 3-5: Fog Room Curing of Mortar Cubes .......................................................................... 16
Figure 3-6: Curing of Hollow Prisms in Plastic Bags.................................................................. 17
Figure 3-7: Mechanical Mixer Used for Mixing Grout ............................................................... 18
Figure 3-8: Slump Test ................................................................................................................ 20
Figure 3-9: Flowable Type 4 Grout being Placed in Prism ......................................................... 21
Figure 3-10: Eight Inch Slump Grout Type 5 being Placed in Prism ........................................... 21
Figure 3-11: Casting of Grout Samples ........................................................................................ 22
Figure 3-12: Grout Sample after Removal from CMU ................................................................. 22
Figure 3-13: Grout Correlation Sample Mold .............................................................................. 23
Figure 3-14: Casting of Grout Correlation Sample ....................................................................... 23
Figure 3-15: Baldwin Compressive Testing Machine .................................................................. 26
Figure 3-16: Bearing Plates .......................................................................................................... 27
Figure 4-1: Stress-Strain Curve before Modification .................................................................. 31
Figure 4-2: Stress Strain Curve after Modification...................................................................... 31
Figure 4-3: Compressive Strength (psi) of CMUs, Mortar, and Hollow Prisms over Time ........ 33
Figure 4-4: Compressive Strengths (psi) of the Seven Prism Types over Time .......................... 33
Figure 4-5: Compressive Strengths (psi) over Time Excluding 28 Day Data ............................. 34
Figure B-1: Manufacturer Supplied CMU Properties ................................................................... 43
Figure B-2: Manufacturer Supplied Coarse Aggregate Properties ............................................... 44
Figure B-3: Manufacturer Supplied Fine Aggregate Properties ................................................... 45

x

1
1 INTRODUCTION
1.1 Problem Statement
The production of Portland cement has been indicated as one of the leading producers of
carbon dioxide in the world contributing about 5% of total carbon dioxide emissions. “Cement
plants and factories across the world are projected to churn out almost 5bn (billion) tons of
carbon dioxide annually… 20 times as much as… the entire UK” (1). Portland cement is the
most common binding agent used to create concrete but other cementitous materials can be used
to replace or supplement Portland cement in concrete. In Europe, cement replacement products
are used more commonly; for example, studies show that in Europe 88% of fly ash (FA)
produced is reused as compared to only 33% is reused in the United States (2).
Masonry grout is a low strength concrete that is highly flowable and has a small nominal
aggregate size. Construction of masonry buildings competes directly with buildings constructed
with solid concrete walls, known as concrete tilt-up buildings. Due to the fact that tilt-up
construction requires concrete that gains high strengths in a short period of time, itt is hoped that
this research will lead to improved sustainability in masonry construction and thus give it a
significant edge over tilt-up construction methods. High replacement of Portland cement will
reduce the cost of the masonry grout, reduce the carbon footprint of the production process,
dispose of industrial byproducts, and increase the sustainability of masonry construction.

2
According to design standards, the required compressive strength of masonry grout is
2000 pounds per square inch (psi). Engineers from The Concrete Masonry Association of
California and Nevada (CMACN) postulate that masonry construction can reach this strength
even when high percentages of Portland cement are replaced by mineral admixtures such as FA
and ground granulated blast-furnace slag (GGBS). CMACN commissioned Twining
Laboratories, in California, to perform research concerning the compressive strength of a variety
of masonry grout types. These grout types have high volumes of FA and GGBS replacing the
common Portland cement binding agent. That research has shown that an adequate grout
compressive strength can be reached with up to 80% of the Portland cement replaced with FA
and GGBS (see Appendix Table A-1). CMACN desires to conduct further research to show how
these types of grouts will perform when they are used to fill the hollow cores of cinder block
(also known as concrete masonry units (CMUs)) walls. The purpose of this research is to
evaluate the compressive strength achieved by masonry prisms. A masonry prism consists of
CMUs that are stacked as they would be in construction, with a layer of mortar in between rows,
and have the hollow core filled with grout.
1.2 Scope
To evaluate the effect that mineral admixtures have on compressive strength of CMU
prisms, this research involved compressive strength testing of prisms that were cast with seven
different grout designs. For a control group, the first design used only Portland cement as a
binding agent in the grout. The second, third, and fourth designs were be identical to the first
design except that Class F FA was used to replace the Portland cement at rates of 45%, 55%, and
65% respectively. The replacement of the Portland cement with mineral admixtures was be done
by weight. The fifth, sixth, and seventh mix designs used a combination of FA and GGBS to

3
replace Portland cement at rates of 65%, 75%, and 85% respectively. In order to evaluate the
effects that each component of the masonry prism had on the entire prism, samples of the type-N
mortar, individual CMUs, prisms with no grout (hollow prisms), and samples of grout were
tested. In order to track the effect that the mineral admixtures had on curing time and strength
gain, compressive strength testing was completed at 14, 28, 42, 56, and 90 days after casting.
Five samples were cast for each type of sample for each test day; approximately 195 samples
were tested for this research.
1.3 Outline of Report
The report consists of five chapters. Chapter 1 has presented an introduction and
explained the scope of the research project. Chapter 2 contains the results of a literature review
on the types and uses of laboratory compressive tests as well as properties of various mineral
admixtures. In Chapter 3, the mix design, specimen preparation and testing, and data analysis
procedures are presented. The test results are included in Chapter 4, while Chapter 5 contains
conclusions based on the results of the testing and recommendations for further research
pertaining to the topic.

4

5
2 BACKGROUND
The following sections include the results of a literature review conducted for this
research. A description of each type of material used in this research is given including masonry
mortar, masonry grout, and Portland cement. A description of the mix design is followed by a
discussion of mineral admixtures including FA and GGBS.
2.1 Type N Masonry Mortar
Mortar is typically a mixture of Portland cement, lime, sand, and water. Increased lime
content in mortar make the mix more workable and more ductile when cured. The purpose of
mortar is to bind masonry units together and, therefore, its most important property is adhesion
rather than compressive strength. Mortar for masonry is produced in several typical types
including type M, type S, and type N. Of these mortar types, type M has the least amount of
lime and type N has the most. Compressive strengths of mortar are low compared to other types
of concrete; after 28 days of curing they are typically 2500psi (17.2 MPa), 1800psi (12.4 MPa),
and 750psi (5.2 MPa), for types M, S, and N, respectively. This research project analyzed the
compressive strengths of masonry prisms constructed with type N mortar and will be compared
to the results of concurrent research that involves types M and S.

6
2.2 Masonry Grout
Masonry grout is a type of concrete that has high slump and small aggregate and is used
to fill the hollow cores of CMUs. Grout bonds CMUs together as well as bonding to any
reinforcing bars set in the grout. The high slump of masonry grouts is important so that the grout
can be flowable and fill the hollow cores without leaving voids in the masonry construction and
is important because the hydrophilic CMUs wick a significant amount of water out of the grout.
ASTM standards do not allow the use of superplasticizers in masonry grouts due to the fact that a
grout with reduced water content will suffer from extreme plastic shrinkage after the CMUs
remove water from the grout. When considering the bulk cross-sectional area of a masonry
prism, there is more grout than CMU. Since masonry design parameters are all derived from the
compressive strength of the masonry system (CMU, grout, and mortar), the grout plays a very
significant role in the compressive strength of the system.
2.3 Portland Cement
Portland cement is the most commonly known binding agent used to make modern
concrete. Portland cement was named after the limestone cliffs on the Isle of Portland in
England and was patented by Joseph Aspdin in 1824 (3). Portland cement is produced by
mining limestone and clay, grinding these materials, and placing them together in a kiln. In the
kiln, the raw materials melt and the silica, alumina, and calcium from the raw materials bond to
form clinker. After cooling, the clinker is ground together with gypsum and becomes known as
Portland cement.
Portland cement is classified into five subgroups depending on composition and fineness.
Types I and II are the most common, while types III through V are primarily used for specialty
projects that require increased set time, low heats of hydration, or additional resistance to sulfate.
7
The primary Portland cement reaction is the hydration reaction which occurs when
Portland cement comes in contact with water. In this exothermic reaction, the combination of
calcium, silica, and water, results in the formation of calcium silicate hydrate (C-S-H) and excess
calcium hydroxide (CH). Calcium hydroxide remains as a useless byproduct in the concrete
unless a pozzolanic reaction utilizes its chemical make-up to form more C-S-H. C-S-H gel is the
primary binding agent that gives concrete its strength. This gel binds together the aggregates
(sand and gravel) found in concrete and masonry grout.
2.4 Mineral Admixtures
The mineral admixtures that will be utilized in this study are Class F FA and GGBS.
Both of these products are known to react chemically and form bonding calcium silicate hydrate
(C-S-H) gels similar to those produced by Portland cement. History records the use of mineral
admixtures for their cementitous properties since the Greeks, who used a volcanic ash from the
island of Santorin as a binding agent (4). The Romans are said to have adopted and expanded
this Greek technology. Evidence that the Romans used mineral admixtures in their cements can
be found in old Roman buildings along the Rhine (5). Mineral admixtures can enhance the
performance of concrete and are known to enhance strength and strength gain properties,
increase density and durability, increase workability, and reduce heat of hydration.
2.4.1 Fly Ash
Fly ash is a by-product of the coal industry and is a mineral admixture known as a
pozzolan. The major component in a pozzolan is the glassy or amorphous silica that it contains.
The primary pozzolanic reaction occurs when the silica or siliceous materials in the pozzolan
react with the calcium hydroxide byproduct of the Portland cement. This reaction forms binding
8
C-S-H gels similar to those formed in the Portland cement reaction. Reactive alumina in
pozzolans can also react to form cementitous calcium aluminum hydrate gels.
As coal is burned in power plants, FA is produced and trapped from the gases in the flue.
Each year over 250 million tons of FA is produced in the U.S. alone (4). FA may be
characterized as Class C or Class F, depending on the type and composition of the coal that is
burned. Class F FA is produced from bituminous and subbituminous coals typically found east
of the Mississippi River, while Class C FA comes from the lignitic coals usually found in the
western United States (4). Due to the differences in chemical composition, Class C is self-
cementing because it contains some calcium hydroxides but has high heat of hydration which can
often be deleterious. Class F FA hydrates at lower temperatures but is not self-cementing, it can
only react with products of Portland cement hydration. If too high of a replacement ratio is used,
the Class F FA would not be able to completely react due to a deficiency in the calcium
hydroxide that is required for the FA to react.
Fly ash particles are finer than those of Portland cement, creating a more densely packed
concrete product and; therefore, the use of FA increases the durability of concrete products.
Pozzolanic reactions occur more slowly and often concretes with high volume fly ash (HVFA)
contents do not meet the design strength after the specified 28 day cure time. Concretes with FA
are known to gain strength for extended periods of time and some FA has been known to
continue gaining strength for an entire year after placement (6). Due to the fact that pozzolanic
reactions occur at varying rates, depending largely on the composition of the FA (6), determining
the percentage of the final strength that will be achieved after a 7- or 14-day cure is not usually
possible.

9
In 1999, FA was added to the approved material list for masonry grout via ASTM C476-
99 “Standard Specification for Grout for Masonry”. At this time, there was, however, a
maximum permissible amount of 40% FA when used with Portland cement. This restriction was
placed due to concerns that FA results in less bleed water and that grout with high FA content
may have difficulty bonding to the CMU face shells (7). Further research on the topic has since
led to replacing this standard with ASTM C476-10 which allows for the use of any quantity of
FA as long as the required compressive strength is met.
FA particles are smaller and more rounded than Portland cement particles. These shape
properties affect the properties of the plastic and cured grout mixture. FA is known to reduce
hydration heat, reduce problems caused by the alkali-silica reaction (ASR), improve workability,
reduce permeability of the final grout, and improve the grout’s resistance to sulfate attack (8).
Grout mixes with high volumes of FA will not be subject to many of the problems encountered
with typical concrete products.
2.4.2 Ground Granulated Blast-Furnace Slag
Ground granulated blast-furnace slag is a hydraulic cement similar to Portland cement,
which is produced in the steel manufacturing process. Blast-furnace slag is a waste or byproduct
that forms in a blast-furnace when iron ore, coke, limestone and other materials are smelted to
form iron. Slags reach temperatures of 2900 degrees Fahrenheit (1600 degrees Celsius) after
which they are broken up with water jets in a process called granulation. Granulated pieces of
slag are then rapidly cooled or “quenched” in water. If the slag is not quenched, it will not
become “glassy” or amorphous and will not form the calcium aluminosilicate glass which makes
it hydraulically active (4). After granulation, the slag particles are ground into a powder. Blast-
furnace slags that come from iron production have high contents of silica, lime, and alumina but
10
are not entirely self-cementing. GGBS must be activated by alkaline compounds, and this is
most commonly achieved by combining GGBS with Portland cement. Much higher proportions
of GGBS can be mixed with Portland cement than pozzolans such as FA (9) and it is commonly
accepted that a mixture of up to 80/20 (GGBS/Portland cement) can be used. When combined
with Portland cement, GGBS forms C-S-H through the primary hydration reaction as well as
through the primary pozzolanic reaction (4).
GGBS is known to increase the ultimate strength of blended cements; increase the
workability of the plastic mix; gain strength for long periods of time; double its 28-day strength
over the period of a decade; decrease heat of hydration; increase sulfate, ASR, and chloride
resistance; prevent efflorescence; and result in a more attractive finish surface (10). The
production of GGBS uses one third the amount of raw materials and less than half the energy
consumption than does the production of Portland cement (5). When GGBS is acquired as a
byproduct, it uses only about 8% as much energy as Portland cement and has a similar cost.
2.5 Chapter Summary
A masonry prism consists of 2 or more CMUs that are connected with mortar and whose
hollow cores are filled with masonry grout. In this study type N mortar will be used and the
grouts will contain water, sand, gravel, Portland cement, FA, and GGBS. Portland cement is the
most commonly known binding agent in concrete products but mineral admixtures such as FA
and GGBS can also be used to make concrete products. These mineral admixtures provide many
benefits such as increasing the durability and workability of concretes but also have drawbacks
such as lower strength and slower strength gain over time when compared to Portland cement.
11
3 EXPERIMENTAL METHODOLOGY
In this research, a full-factorial laboratory experiment including seven mix designs and
two different mineral admixtures at different replacement rates, with five replicates of each mix
design and for each cure date, was performed. For comparison, single CMU blocks, hollow
CMU prisms, filled prisms, grout samples, and mortar samples were made and tested. One grout
mix design contained typical Portland cement grout and was used as a baseline to which all other
results would be compared to. The samples were subjected to compressive strength tests after
14, 28, 42, 56, and 90 days of curing. ASTM requires a minimum test group size of three
replicates and in this research 4 specimens were typically tested for each group leaving one extra
prism for each test group. With four replicates of each of the seven mix designs there were 28
solid prisms to be tested for each of the 5 cure dates. Specimens of hollow prisms, single CMUs,
and mortar cubes were also tested on each cure date. Approximately 156 samples were tested for
this research. This chapter presents the procedures and protocols used during the research
project, including mix design, specimen preparation, compressive testing, and data analyses. All
ASTM cited in the remainder of this document are provided by ASTM Volume 4.02 Concrete
and Aggregates (11)

12
3.1 Mix Design
As previously mentioned, there will be seven different types of grout tested in this
research project. In order to have results that are easily comparable to research performed by
CMACN, the mix designs used in this project will have the same weights of sand, gravel, and
cementitous material per cubic yard as did CMACN’s grout research. The first type of grout will
have only Portland cement as a binding agent. This grout will be called Grout 1. All seven grout
types will have the same weight of cementitous materials. For the second grout type (Grout 2),
45% of the cementitous materials will be Class F FA and the remaining 55% will be Portland
cement. The third grout (Grout 3) will contain 55% Class F FA and 45%Portland cement. The
fourth grout (Grout 4) will contain 65% Class F FA and 35% Portland cement. The cementitous
materials for the fifth grout (Grout 5) will be composed of 25% FA, 40% GGBS, and 35%
Portland cement. Grout 6 will be composed of 25% FA, 50% GGBS, and 35% Portland cement
and Grout 7 will be composed of 25% FA, 60% GGBS, and 35% Portland cement. The
composition of materials by weight for each grout type is listed in Table 3-1.
Table 3-1: Components of Each Grout Type
Grout Type Sand
(lbs)
Gravel
(lbs)
Water
(lbs)
Cement
(lbs)
Fly
Ash
(lbs)
Slag
(lbs)
Water
Cement
Ratio
1 (Portland Cement) 1923.5 813.8 566.9 591.8
0.883
2 (45 % FA) 1923.5 813.8 566.9 325.5 266.3
0.883
3 (55% FA) 1442.6 610.3 425.2 199.7 244.1
0.883
4 (65% FA) 1346.4 569.6 396.8 145.0 269.3
0.883
5 (25% FA, 40% GGBS) 1346.4 569.6 356.2 145.0 103.6 165.7 0.785
6 (25% FA, 50% GGBS) 1413.8 598.1 373.8 108.8 108.8 217.5 0.785
7 (25% FA, 60% GGBS) 1413.8 598.1 373.8 65.3 108.8 261.0 0.785

13
3.2 Mortar and Hollow Prism Preparation
Concrete masonry units were acquired from Amcor Masonry who prepared a batch of
CMUs specifically for this project. Testing was performed in accordance with American Society
for Testing and Materials (ASTM) C140 which provides information relating to the conditions of
the CMUs. This information consisted of, but was not limited to, CMU dimensions, absorption
(percent of block weight absorbed), dry weight, density and moisture content. With materials on
hand, Doyle Hatfield Masonry sent a work crew to Brigham Young University’s civil
engineering structures lab and constructed the hollow masonry prisms. CMUs were bonded
together using type-N mortar manufactured by Quickcrete. The premix bags of mortar
manufactured by Quickcrete conform to ASTM standards C144 and C270, which specify
aggregate gradation and the properties of the materials used to create the mix. Doyle Hatfield
masonry workers mixed the mortar adding water until the appropriate consistency was reached in
general accordance with ASTM C305 “Standard Practice for Mechanical Mixing of …Mortars”.
The mixer used for the mechanical mixing of the mortar is shown in Figure 3-1. While the
masons used the mortar to construct prisms (Figure 3-2), mortar cubes were made for
compressive strength testing (Figure 3-3), samples of mortar were tested for flow (Figure 3-4),
and plastic mortar temperature was recorded in accordance with ASTM C109. The mortar flow
and temperature results are given in Table 3-2. Figure 3-5 shows that after casting, mortar cubes
were placed in a controlled environment fog room in accordance with ASTM C511. Figure 3-6
shows that upon completion of constructing the hollow prisms, the samples were placed in
plastic bags and left to cure for 24 hours in accordance with ASTM C1314.

14
Figure 3-1: Mechanical Mixer for Mortar

15
Figure 3-2: Hollow Prisms being Constructed with Type N Mortar
Figure 3-3: Mortar Cube Casting

16
Figure 3-4: Mortar Flow Test
Figure 3-5: Fog Room Curing of Mortar Cubes

17
Figure 3-6: Curing of Hollow Prisms in Plastic Bags
3.3 Grout and Grouted Prism Construction
The following day, the plastic bags were opened and the prisms were prepped to be filled
with grout. Prep work included removing any pieces of hardened mortar that had fallen inside of
the constructed prisms. The manufacturer material properties charts for the sand, gravel,
Portland cement, FA, GGBS, and mortar are found in Appendix B. These material data sheets
indicate that the materials conform to all pertinent ASTM standards for materials used in the
construction and testing of masonry prisms. Potable water was used for the grout in accordance
to ASTM C1602. Appropriate quantities of sand, gravel, Portland cement, and water were
weighed and placed in a 1 cubic yard cement mixer, shown in figure 3-7, to make the first batch
of grout.

18
Figure 3-7: Mechanical Mixer Used for Mixing Grout
For the first grout type, no mineral admixtures were used. It was estimated that
approximately one cubic yard of grout was needed to fill prisms for this and other concurrent
research. Prior to adding materials to the mixer, the mixer was washed out with potable water
and excess water was allowed to drain out of the mixer. This process ensures that the interior of
the mixer is in a surface saturated dry (SSD) condition. The SSD condition of the mixer
guarantees that the mixer will neither contribute nor remove water to the batched materials in the
mixing process. With the mixer prepared, an approximation of the weight of water that would be
required for the batch was made and one half of the water was placed in the mixer. With water
in the mixer, the mixer was turned on and, as it was mixing, sand and gravel were weighed and
added to the mixer incrementally. With all of the sand and gravel in the mixer, Portland cement
and the majority of the remaining water were placed in the mixer. It was found that the volume
of grout that was produced in the initial batches was too much and therefore, the volume of grout
was reduced by 25% when Grout 3 was batched.

19
Slump tests were performed in accordance with ASTM 172 on the Grout 1 and the water
was added incrementally until the target slump of nine inches was achieved. The water cement
ratio that was found through this method was held constant for Grouts 1-4. It was observed that
slump increased with the increasing quantities of mineral admixture. For Grout 5, Grout 6 and
Grout 7 the amount of water was reduced (thus reducing the water-cement ratio) in order to
produce grouts that had a slump less than eleven inches. ASTM C476 requires that masonry
grouts have a slump between eight and eleven inches and researchers in this project desired to
maintain the slump within these parameters when possible. The results of the slump tests for
each grout design can be seen in Table 3-2.
Single CMUs were also filled with grout for the purpose of creating grout samples. Due
to the large quantity of grout samples that would be broken, it was determined by researchers to
cast samples in single CMUs and later remove the grout centers with the use of a masonry saw.
Samples would not be saw-cut to the appropriate dimensions before compressive strength testing
as per typical ASTM C1019 methods but would be tested at the full size of the inside of the
CMU. Ten samples were cast according to typical ASTM C 1019 methods because ASTM
C1019 allows for a correlation to be made when test samples do not conform to the ASTM
specification. This correlation involves casting ten grout samples in a three inch by three inch
mold created by carefully placing 4 CMUs in a specified pattern. This mold is to be lined with a
permeable liner and an example of this mold is shown in figure 3-13. Figures 3-8 through 3-14
show different phases of the casting and testing process.

20
Figure 3-8: Slump Test
Table 3-2: Grout Slump Results
Grout Mix Slump (in) Temperature (°F)
1 9 68
2 9.5 70
3 10.5 69
4 Flowable 68
5 8 69
6 8.5 70
7 10.5 70

21
Figure 3-9: Flowable Type 4 Grout being Placed in Prism
Figure 3-10: Eight Inch Slump Grout Type 5 being Placed in Prism

22
Figure 3-11: Casting of Grout Samples
Figure 3-12: Grout Sample after Removal from CMU

23
Figure 3-13: Grout Correlation Sample Mold
Figure 3-14: Casting of Grout Correlation Sample

24
3.4 Specimen Preparation
When prisms and grout samples have reached the end of their curing time and are ready to
be broken, the ends of the specimen that will be in contact with the plates of the compressive
strength testing machine must be altered. If the sample were left as is, the highest points of the
jagged sample end would come into contact with the loading plates first. This would cause loads
to be concentrated on portions of the surface rather than distributed evenly over entire surface of
the sample. The effective bearing area of the sample would be decreased and would not be
calculable. In order to provide a surface that ensures that the load is transferred from the loading
plates to the entire cross-section of the sample, ASTM C617 requires that the sample is capped
with either molten sulfur or gypsum cement. These two capping methods provide a cap that
molds to the contours of the surface of the sample and cures to have a compressive strength
higher than that of the sample. For this research it was decided to use gypsum cement to cap the
samples.
Gypsum capping was performed in accordance with ASTM C140. Following this
procedure, an abrasive stone was rubbed over each sample end to remove loose protrusions from
the specimens to be capped. To cap the bottom side of the prism, a glass capping plate was
placed on the floor, a light coat of lubricating oil (WD-40 brand) was sprayed on the glass, and
gypsum cement capping material was spread evenly over the glass. Directly after the capping
compound was placed on the glass plate, the prism was placed on the capping compound. The
weight of the prism was sufficient to force the capping compound into the surface of the concrete
and assure that the thickness of the gypsum was less than 1/8 of an inch. When hollow CMUs
were capped it was necessary to press down on the CMU firmly to achieve the same effect. With
the bottom of the prism capped first, the top of the prism was capped next. After smoothing with

25
the abrasive stone, capping compound was placed evenly over the surface of the prism. After the
capping compound was placed, a glass capping plate was pressed firmly on the top of the
capping compound and a weight such as a CMU was placed over the plate.
The capping compound was allowed to cure for a minimum of 25 minutes before the
glass plates were removed from the specimen. When removing the glass plates it was common
to find that about 15% of the caps were broken or incomplete. Caps that were determined to be
deficient were removed and replaced. The deficiencies encountered included: caps not covering
the corners of the prism, caps that did not bond to the prism, caps that did not completely cover
the prism surface, caps that had large air bubbles, caps that were not perpendicular within .08
inches to the vertical axis of the prism, or caps that were broken when the glass plates were
removed. After the capping process was complete, capped prisms were allowed to cure
overnight to assure that caps would achieve the required strength.
3.5 Specimen Testing
After specimens were prepared with plaster caps, they were tested for compressive
strength. Compressive strength testing was performed using a Baldwin loading machine as can
be seen in Figure: 3-15. During testing, stress, strain, loading rate, and compressive resistance
were recorded by a software program called “Merlin" made by the Instron Corporation (12).
In order to have a backup of the most crucial data, sample dimensions and ultimate
compressive loads for each sample were also recorded by hand in a notebook. Due to the
antiquated nature of the computer and Merlin software that were used with the Baldwin machine,
there were a number of computer “crashes” and several sets of data were lost. Hand recorded
data from the notebook were used for those cases.

26
Figure 3-15: Baldwin Compressive Testing Machine
In order to conform to ASTM C1314 it was necessary to enlarge the effective bearing area
of the plates that the machine uses to load the specimens. The swivel plate on the lower head of
the Baldwin was nearly large enough for the specimens to fit on, having a radius that was only
about a quarter inch too small to fit the entire prism. In order to make sure that the corners of the
specimen were not hanging off of the bearing swivel by a quarter inch and conforming to ASTM
C1388, a steel plate with a thickness of 7/16 of an inch was placed on the existing swivel head.
On the top head of the machine, the existing swivel head had a smaller diameter and was too
small by two inches. In order to conform to ASTM C1388, the thickness of added plates must be

27
equivalent to the amount by which the existing bearing radius is too small. There were no steel
plates available that had a thickness of two inches or greater so it was necessary for researchers
to combine two steel plates. The first plate had a thickness of one and a half inches and the
second plate had a thickness of one half inch. These plates were welded to the existing top
swivel head of the machine so that researchers would not have to concern themselves with
centering the plates on each specimen before testing. Figure 3-16 shows a masonry prism being
tested for compressive strength as well as the placement and welds of the plates on the top and
bottom heads of the machine.
Figure 3-16: Bearing Plates

28
3.6 Chapter Summary
Specimens of hollow prisms, grouted prisms, mortar cubes, and grout were made. The
methodology for constructing the test samples and for testing the materials used adhered closely
to all pertinent ASTM standards so that this process would be standardized and repeatable.
Samples were tested for compressive strength after Curing for 14, 28, 42, 56, and 90 days.

29
4 RESULTS
This chapter discusses the manner in which the data from the compressive strength
testing of the samples were interpreted. First, it is described how simple statistics were applied
to the compressive strength results to determine if the data were valid. After validating the data,
a method for modifying the stress-strain curves was applied in order to remove extraneous
information that inherently occurs due to the imperfections of the testing process. Lastly this
chapter shows the performance of each specimen type in compressive testing and how the
strength of each sample type increased as cure time elapsed.
4.1 Data Reduction
A minimum of three samples were tested for compressive strength for each of the seven
prism types at each time interval (14, 28, 42, 46, 90 days) in accordance with ASTM C1314. For
most data sets there were four samples tested, providing the ability to remove data that were
deemed outliers. Outliers could not be removed from any groups that had only three samples in
order to conform to ASTM C1314. It was decided that for this research any value that was more
than one standard deviation from the group mean would be eliminated. This course of action
was chosen because samples that are more than one standard deviation from the group mean are
likely to have structural deficiencies such as void space in the grouted center or poorly placed
gypsum caps. Most all samples fell within one standard deviation and not many data were

30
removed. After eliminating outliers from any groups, the mean values for the group were
reported to be the compressive strength for the corresponding cure time and prism type.
Stress-strain curves were calculated by computer software for each sample tested. Due to
mechanical play or “slop” in the plates of the compressive testing machine and inconsistency in
the initial load applied to each sample before testing, there was significant variability in the
initial portion of the stress-strain curves that were generated. It was necessary to normalize these
curves so that they could be compared to each other. Normalization was accomplished by
assuming that any stress less than 1% of the maximum stress could be considered mechanical
settlement as the plates draw tight to the sample. When stresses were recorded less than this
amount both the stress and corresponding strain were removed from the curve. The averages of
the removed stresses and strains were used to plot a point that serves as the new origin for the
remaining curve. While there is still some apparent settlement after the normalization process,
settlement is dramatically reduced. For samples that had less settlement, the modified curve has
little to no flat portion at the beginning of the curve. In order to have uniformity in the stress-
strain curves, the end of the curve was truncated. This was accomplished by terminating the
curve after the stress has decreased to 50% of the maximum recorded stress. Figures 4-1 and 4-2
show the stress strain curve for one sample before and after modification respectively.
The data modification detailed above slightly alters the stresses, strains, and loads from
that outputted by the computer software. This slight altercation decreases the inherent error that
is caused by the inconsistency of the initial portion of the recorded stress-strain curve. The focus
of this research is to observe and report the findings concerning the compressive strength of each
sample. It was noted that the data modification resulted in an insignificant change in the

31
compressive strength of each sample. The compressive strengths reported in this section will be
the actual recorded compressive strengths, not the modified values.
Figure 4-1: Stress-Strain Curve before Modification
Figure 4-2: Stress Strain Curve after Modification

32
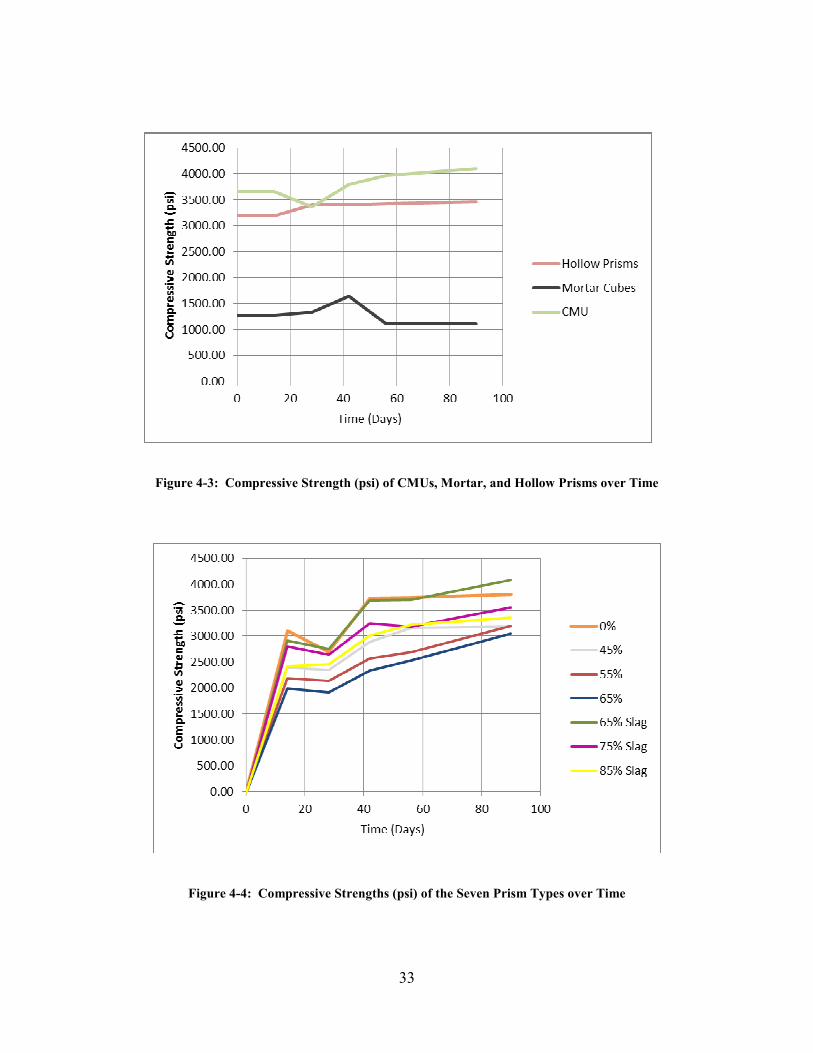
4.2 Compressive Test Results
ASTM C476 states that masonry prisms must have a compressive strength of 2000 psi at
28 days. As can be seen in Table 4-1, all seven grout types met this criteria except for the prisms
with Grout 4. ASTM C270 indicates that the minimum compressive strength for type N mortar
is 750 psi and, as can be seen in Table 4-1, the mortar cubes were much stronger than the
minimum. The hollow prisms and single CMUs had similar strength indicating that the thin
layer of weak mortar only has a slight effect on the strength of the system. Figure 4-3
graphically shows the compressive strength in psi of the hollow prisms, the CMUs, and the
mortar cubes. Figure 4-4 shows the compressive strength curves for the prisms with the seven
types of grout.
Table 4-1: Prism Compressive Strength at Each Time Interval in psi
GROUT TYPE Cure Time (DAYS)
14 28 42 56 90
1 3108.6 2702.4 3738.0 3748.8 3809.8
2 2397.4 2351.7 2891.6 3164.9 3188.5
3 2187.6 2132.5 2569.1 2686.4 3195.3
4 1984.0 1915.8 2340.8 2529.3 3052.0
5 2915.4 2751.3 3685.7 3699.1 4086.2
6 2803.0 2644.1 3242.0 3179.6 3557.0
7 2421.9 2462.7 3017.3 3221.9 3361.0
Hollow Prism 3192.4 3399.0 3393.7 3423.3 3458.0
CMU 3663.5 3366.6 2486.3 3963.7 2688.2
Mortar Cube 1266.4 1329.0 1636.1 1108.3 1108.3
33
Figure 4-3: Compressive Strength (psi) of CMUs, Mortar, and Hollow Prisms over Time
Figure 4-4: Compressive Strengths (psi) of the Seven Prism Types over Time

34
In these curves it can be observed that there was an apparent decrease in strength for all
seven prism types at the 28 day test time period. This is an unexpected result since it is
commonly known that concrete products gain strength over time. Researchers were unable to
determine what error might have caused these results but it is important to note that even with
this dip in strength, all prism types except for the Grout 4 group made strength at 28 days.
Figure 4-5 shows the strength gain curves for all seven prism types if the 28 day data were
eliminated. As is expected, the strength gain curve for the 100% Portland cement prisms has a
near level trajectory after 90 days but the prisms with FA and GGBS were continuing to gain
strength with time. A significant result is that mix number 5 gained early strength at a rate very
similar to the control group (100% Portland cement). It was not expected that a prism whose
grout has had 25% of the Portland cement replaced with FA and another 40% replaced with
GGBS gains strength as quickly as a Portland cement based grouted prism. This particular mix
also had a higher compressive strength at 90 days than the control group.
Figure 4-5: Compressive Strengths (psi) over Time Excluding 28 Day Data

35
4.3 Chapter Summary
Testing procedures provided stress-strain curves and ultimate compressive strength for
each sample. In test groups of four or more data for samples were discarded if the ultimate
compressive strength was more than one standard deviation from the group mean. Most data
were within one standard deviation. Stress-strain curves were modified to eliminate extraneous
data at the beginning and end of each curve. An inconsistency in the test results for the 28 day
tests was found and deemed to be insignificant due to the fact that all of the grout types except
for one still made strength.

36

37
5 CONCLUSIONS AND RECOMMENDATIONS
This chapter discusses the implications of compressive strengths attained by the masonry
samples tested in this study. A comparison is made between the compressive strength results of
the masonry prisms tested in this research and the masonry grout samples that were tested by
Twining Laboratories. Recommendations concerning further research that should be conducted
in order to ensure full confidence in the ability of these grouts to resist any possible load scenario
are made.
5.1 Conclusions
Compressive strength is the single most important design parameter in masonry design.
Other design parameters such as shear capacity and flexure are calculated based on the
compressive strength of the masonry prisms. Compressive strength testing of prisms is
commonly the only method used to ensure that materials used in construction meet the specified
design requirements.
Separate research performed concurrently with this research has confirmed that the
compressive strength of the grouts used to construct these masonry prisms were similar to the
grouts tested by Twining Laboratories (see appendix table A-3). Despite the fact that ASTM
C476 prohibits replacing more than 40% of Portland cement in masonry grout, this research has
shown that the required strength of 2000 psi can be met at 28 days when 45% and 55% of the

38
Portland cement is replaced with FA and when 65%, 75% and 85% is replaced with a mixture of
FA and GGBS. This research confirms that the performance of the prisms correlates to that of
the grout and that the use of high mineral admixture volume grouts is a viable method of
attaining the required compressive strength.
5.2 Recommendations
Further research should be conducted to determine if high mineral admixture volume
grouts differ from traditional grouts when tested for rebar pull-out strength, shear strength, and
flexural strength. The research performed in this study concentrated specifically on the
compressive strength of masonry prisms and it is possible that high volume of mineral admixture
in masonry grouts will change the way the system reacts in other loading conditions. In order to
ensure that design standards may be changed to allow the grout designs included in this study it
is necessary to ensure that they perform well to all potential loading scenarios.

39
REFERENCES
1. Adam, David: The unheralded polluter: Cement Industry Comes Clean on its Impact: in
Brussels The Guardian (newspaper), Thursday 11 October 2007. Accessed February 25,
2012. http://www.guardian.co.uk/environment/2007/oct/12/climatechange
2. Geertsema, Ari: Coal Products: Status and Future for the USA, University of Kentucky,
Center for Applied Energy Research. Accessed February 25, 2012.
http://www.flyash.info/2001/keynote/109geert.pdf
3. Mamlouk, Michael S. and Zaniewski, John P. Materials for Civil and Construction
Engineers Second Edition, Pearson Prentice Hall, Upper Saddle River, NJ 2006
4. Mindess, S., Young, J. F. and Darwin, D. Concrete, Second Edition. Prentice Hall, Upper
Saddle River, NJ, 2003
5. Swamy, R.M. Cement Replacement Materials, Surrey University Press, Blackie and Son
Ltd, 1986
6. Ferguson, G. and Levorson, S. M. Soil and Pavement Base Stabilization with Self-
Cementing Coal Fly Ash. American Coal Ash Association, Virginia, 1999.
7. Kang, Grace S. and Kren, Alan. Structural Engineering Strategies Towards Sustainable
Design September 10, 2007. Accessed February 25, 2012.
http://www.seaonc.org/pdfs/SESTSD%20final%20%20.pdf
8. ACI committee 232. Use of Fly Ash in Concrete, ACI Manual of Concrete Practice, reported
by American concrete institute, April 1996
9. Day, Ken W, Concrete Mix Design, Quality Control and Specification, E & FN Spon,
London, UK 1995
10. Whiting, David. Ground Granulated Blast-Furnace Slag, Federal Highway Administration,
USDOT. Accessed February 25, 2012.
http://www.fhwa.dot.gov/infrastructure/materialsgrp/GGBS.htm,
11. ASTM Volume 04.02, Concrete and Aggregates, ASTM International, West Conshohocken,
PA, 2010.
12. Merlin (Revision B) [software]. 825 University Ave.Norwood, MA 02062-2643:Instron

40

41
APPENDIX A: TWINING LABORATORY GROUT TEST INFORMATION
Table A-1: Twining Laboratories Grout Specimen Compressional Strength Data
Age
(days)
100%
Portland
Cement
(psi)
20% FA
Replacement
(psi)
30% FA
Replacement
(psi)
40% FA
Replacement
(psi)
50% FA
Replacement
(psi)
60% FA
Replacement
(psi)
50% FA &
GGBFS
Replacement
(psi)
60% FA &
GGBFS
Replacement
(psi)
70% FA &
GGBFS
Replacement
(psi)
80% FA &
GGBFS
Replacement
(psi)
7 2982.5 2780.0 2450.0 1540.0 1610.0 910.0 1890.0 2260.0 1940.0 1460.0
14 3285.0 2920.0 2970.0 2140.0 2090.0 1150.0 2890.0 3270.0 2770.0 1940.0
28 4062.5 3310.0 3830.0 2690.0 2880.0 1440.0 3310.0 3230.0 3410.0 2430.0
42 4175.0 3800.0 3880.0 3050.0 3130.0 1930.0 3660.0 4540.0 4210.0 2710.0
56 4300.0 4250.0 4650.0 3330.0 2960.0 2070.0 5010.0 4830.0 4260.0 3140.0
180 4120.0 5180.0 5670.0 4690.0 4330.0 3790.0 6210.0 6010.0 5260.0 3590.0
Table A-2: Absorption, Density and Moisture Content of CMU Samples
Wr,
Received
Weight
Wi,
Immersed
Weight
Ws,
Saturated
Weight
AbsorptionMoisture
Absorbed
Moisture
Content
(lb) (lb) (lb) (lb) (kg) (pcf) (g/cm3) (%) (%) (pcf) (g/cm
3) (%)
1 22.15 12.40 22.82 21.48 9.75 8.0 0.13 6.2 50.17 128.63 2.06 3.12
2 22.04 12.21 22.62 21.15 9.59 8.8 0.14 6.9 60.81 126.87 2.03 4.21
3 22.05 12.37 22.63 21.14 9.59 9.1 0.15 7.1 61.39 128.61 2.06 4.34
4 22.28 12.66 22.86 21.58 9.79 7.8 0.12 5.9 54.46 132.08 2.11 3.21
5 22.00 12.14 22.60 21.18 9.61 8.4 0.13 6.7 58.14 126.45 2.02 3.88
6 21.87 12.10 22.48 21.06 9.6 8.5 0.1 6.7 56.96 126.64 2.0 3.83
Averages 21.27 9.6 8.4 0.1 6.6 56.99 128.21 2.1 3.76
Wd, Dry
WeightSpecimen
#
DensityAbsorption

42
Table A-3: Twining Laboratories Grout Compressive Strength Results

43
APPENDIX B: MATERIAL PROPERTY CHARTS
Figure B-1: Manufacturer Supplied CMU Properties

44
Figure B-2: Manufacturer Supplied Coarse Aggregate Properties

45
Figure B-3: Manufacturer Supplied Fine Aggregate Properties