Evaluation of the Compacted Aggregate Resistance Test
62
Evaluation of the Compacted Aggregate Resistance Test John P. Zaniewski, Ph..D. Sean Rafferty Asphalt Technology Program Department of Civil and Environmental Engineering Morgantown, West Virginia April. 2004
Transcript of Evaluation of the Compacted Aggregate Resistance Test

Evaluation of the
Compacted Aggregate Resistance Test
John P. Zaniewski, Ph..D.
Sean Rafferty
Asphalt Technology Program
Department of Civil and Environmental Engineering
Morgantown, West Virginia
April. 2004

i
NOTICE
The contents of this report reflect the views of the authors who are responsible for
the facts and the accuracy of the data presented herein. The contents do not necessarily
reflect the official views or policies of the State or the Federal Highway Administration.
This report does not constitute a standard, specification, or regulation. Trade or
manufacturer names which may appear herein are cited only because they are considered
essential to the objectives of this report. The United States Government and the State of
West Virginia do not endorse products or manufacturers. This report is prepared for the
West Virginia Department of Transportation, Division of Highways, in cooperation with
the US Department of Transportation, Federal Highway Administration.

ii
Technical Report Documentation Page
1. Report No. 2. Government
Accociation No.
3. Recipient's catalog No.
4. Title and Subtitle Evaluation of the Compacted Aggregate Resistance Test
5. Report Date April, 2004
6. Performing Organization Code
7. Author(s) John P. Zaniewski, Sean Rafferty
8. Performing Organization Report No.
9. Performing Organization Name and Address Asphalt Technology Program
Department of Civil and Environmental Engineering
West Virginia University
P.O. Box 6103
Morgantown, WV 26506-6103
10. Work Unit No. (TRAIS)
11. Contract or Grant No.
12. Sponsoring Agency Name and Address West Virginia Division of Highways
1900 Washington St. East
Charleston, WV 25305
13. Type of Report and Period Covered
14. Sponsoring Agency Code
15. Supplementary Notes Performed in Cooperation with the U.S. Department of Transportation - Federal Highway Administration
16. Abstract The Compacted Aggregate Resistance (CAR) test is a procedure used to analyze the quality of asphalt. It is
a punch shear test that indirectly measures the shape and angularity of fine aggregates. The CAR test is in the
developing process of replacing the current Superpave standard for fine aggregate angularity.
The primary objective of this paper is to determine if there is a direct correlation between the results from the
CAR test and the quality of asphalt that corresponds to the results from an Asphalt Pavement Analyzer. Currently,
there has been good quality Hot Mix Asphalt (HMA) that cannot pass the Superpave criteria for fine aggregate
angularity. The goal of the CAR test is provide laboratory results to the quality of asphalt in the field. Field testing is
not feasible for this research project; therefore an Asphalt Pavement Analyzer (APA) is used to determine the quality
of the asphalt by the depth of the ruts it forms.
The testing consisted of two 9.5-millimeter (mm) mix designs. The mixes were modified to provide
combinations for comparison. The mixes were tested using different percentages of PG 70-22 asphalt binder, and
tested in the APA for quality. The fine aggregate in the mix designs was modified using increasing percentages of
river sand passing the #8 sieve (2.36 mm). The river sand directly replaced the mix design gradations so that the
percentage of aggregate on each sieve remained constant for each specimen being tested. Natural sand typically
produces a higher rut due to its low angularity; this will allow more variability for comparison.
The CAR test requires a gradation of aggregates passing the 2.36 mm sieve. The gradations for the CAR
tests use the same percentages of fine aggregate that were modified in the two mix designs. After modification, the
asphalt will not meet Superpave guidelines, but serve as a means of comparison.
It was found that that the CAR test results correspond with the rut potential of the specimens. The CAR test
results distinguish between blend gradations, whereas the Fine Aggregate Angularity test is determined by a
predetermined gradation. The research concludes that with further refinement, the CAR test can be a useful tool for
determining fine aggregate shape and angularity.
17. Key Words asphalt rutting, compacted aggregate resistance test, mix
design, fine aggregate angularity
18. Distribution Statement
19. Security Classif. (of this
report) Unclassified
20. Security Classif. (of
this page) Unclassified
21. No. Of Pages 62
22. Price
Form DOT F 1700.7 (8-72) Reproduction of completed page authorized

iii
TABLE OF CONENTS
CHAPTER 1 INTRODUCTION _____________________________________ 1
1.1 Background ....................................................................................................... 1
1.2 Problem Statement ............................................................................................ 2
1.3 Objectives ......................................................................................................... 2
1.4 Scope of Work and Limitations ........................................................................ 3
1.5 Report Overview ............................................................................................... 3
CHAPTER 2 LITERATURE REVIEW _______________________________ 5
2.1 Introduction ....................................................................................................... 5
2.2 Fine Aggregate Shape and Texture ................................................................... 5
2.3 Test Methods for Fine Aggregate Shape and Texture ...................................... 7
2.3.1 Visual Inspection Methods _____________________________________________ 8
2.3.2 Flow and Compaction Methods _________________________________________ 8
2.3.3 Shear Strength Tests _________________________________________________ 12
2.4 Literature Summary ........................................................................................ 18
CHAPTER 3 RESEARCH METHODOLOGY ________________________ 19
3.1 Introduction ..................................................................................................... 19
3.2 Design of Experiment ..................................................................................... 19
3.3 Aggregate Preparation .................................................................................... 21
3.4 Mix Preparation .............................................................................................. 22
3.5 Volumetric Analysis ....................................................................................... 22
3.6 Asphalt Pavement Analyzer ............................................................................ 24
3.7 Fine Aggregate Angularity Tests .................................................................... 26
3.8 CAR Test ........................................................................................................ 26

iv
CHAPTER 4 RESULTS AND ANALYSIS ____________________________ 28
4.1 Introduction ..................................................................................................... 28
4.2 AGGREGATE Evaluation .............................................................................. 28
4.2.1 CAR Results _______________________________________________________ 28
4.2.2 Fine Aggregate Angularity Results _____________________________________ 31
4.2.3 Comparison of CAR and FAA _________________________________________ 31
4.2.4 Evaluations and comparison with other studies ____________________________ 32
4.3 Rutting Results and Analysis .......................................................................... 32
4.4 Summary of Results ........................................................................................ 35
CHAPTER 5 CONCLUSIONS AND RECOMMENDATIONS ___________ 36
5.1 Conclusions ..................................................................................................... 36
5.2 Recommendations ........................................................................................... 37
5.3 Further Research ............................................................................................. 38
References _____________________________________________________ 39
Appendix A WVDOH Mix Designs _________________________________ 42
Appendix B CAR Testing Procedure ________________________________ 44
Appendix C CAR Test Output ______________________________________ 46
Appendix D Rut Depth Results _____________________________________ 52
Appendix E Volumetric Results _____________________________________ 54
List of Figures
Figure 2.1 Fine Aggregate Angularity Apparatus............................................................... 9
Figure 2.2 CAR loading head for use with Marshall stabilometer ................................... 15
Figure 3.1 Blend gradations .............................................................................................. 20
Figure 3.2 Asphalt pavement analyzer.............................................................................. 24
Figure 3.3 Measuring system for APA specimens............................................................ 25

v
Figure 4.1 Effect of percent limestone on CAR force ...................................................... 30
Figure 4.2 Fine Aggregate Angularity Results. ................................................................ 31
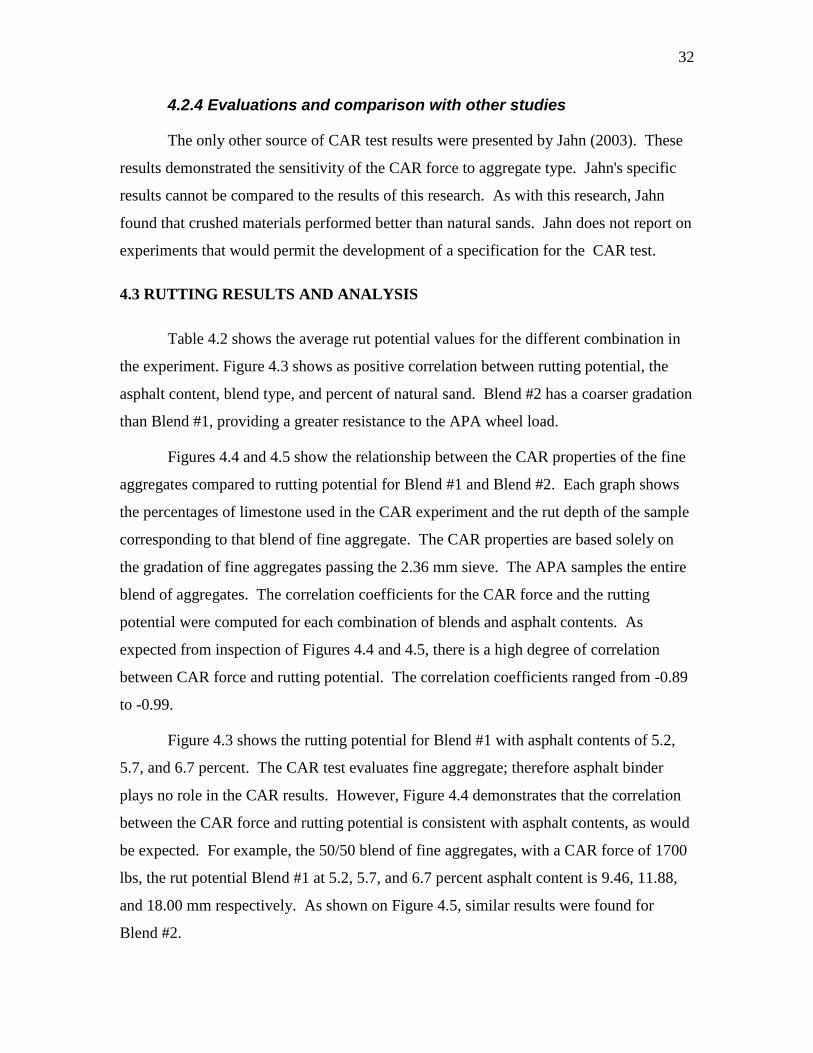
Figure 4.3 Effect of asphalt content, blend types and percent sand on rutting potential .. 34
Figure 4.4 Relationship between CAR force and rutting potential for Blend #1 ............. 34
Figure 4.5 Relationship between CAR force and rutting potential for Blend #2 ............. 35
Figure C.1 Blend #1 CAR results for 100% limestone ..................................................... 46
Figure C.2 Blend #1 CAR results for 75% limestone/ 25% natural sand ......................... 46
Figure C.3 Blend #1 CAR results for 50% limestone/ 50% natural sand ......................... 47
Figure C.4 Blend #1 CAR results for 25% limestone/ 75% natural sand ......................... 48
Figure C.5 Blend #1 CAR results for 100% natural sand ................................................. 48
Figure C.6 Blend #2 CAR results for 100% limestone ..................................................... 49
Figure C.7 Blend #2 CAR results for 75% limestone/ 25% natural sand ......................... 49
Figure C.8 Blend #2 CAR results for 50% limestone/ 50% natural sand ......................... 50
Figure C.9 Blend #2 CAR results for 25% limestone/ 75% natural sand ........................ 50
List of Tables
Table 2.1 WVDOH Aggregate Requirements .................................................................... 7
Table 3.2 Results of Fine Aggregate Angularity .............................................................. 26
Table 4.1 Results of CAR test........................................................................................... 29
Table 4.2 Results of rutting potential tests with the APA ................................................. 33
Table D.1 Rut Depth Data ............................................................................................... 52

1
CHAPTER 1 INTRODUCTION
1.1 BACKGROUND
The Strategic Highway Research Program (SHRP) was initiated in 1988 to study
methods to reduce pavement problems caused by increases in traffic volumes and heavier
vehicle loads which caused fatigue, rutting, and thermal cracking. The SHRP
administered a $50 million dollar project to improve Hot Mix Asphalt (HMA)
technology. By 1993, the research produced the Superior Performing Asphalt Pavements
(Superpave)TM
asphalt mix design method and performance grading for binders.
The research focused mainly on mix design and asphalt binder specifications,
while giving less attention to aggregate properties. However, the research team then
realized that investigating mineral aggregates would play a major role in HMA
performance (Roque, 2002), so new aggregate test methods and specifications were
developed for Superpave. However, since aggregate characteristics were not included in
the original SHRP research plan, there was no time during the project to validate the
aggregate specifications (Kandhal, 1998). In fact, the aggregate requirements are called
consensus properties, which is indicative of the way the requirements were developed.
One of these standards is the Fine Aggregate Angularity (FAA) test method and criteria.
The FAA test was implemented to ensure that the fine aggregate has sufficient texture
and angularity to provide a rut resistant mix. However, recent studies demonstrate that
FAA requirements do not have the desired effect on the performance of asphalt concrete
(Stakston, et al, 2002).
The SHRP researchers recommended FAA requirements of 45 and 40 percent
voids for high and medium traffic volume roads respectively (AASHTO MP2, 2001).
The reason for selecting this number is not well documented. Many state agencies and
aggregate companies have trouble passing the FAA requirements, while still producing
high quality asphalt (Roque, 2002).

2
1.2 PROBLEM STATEMENT
Because the reliability of the FAA test and criteria are unclear, there have been
several studies that evaluate the integrity of the test (Chowdury, et al, 2001, Stakston, et
al, 2002, Roque, 2002, and White, 1998). The results are all very similar; they do not
show a clear relationship between the FAA and the mixture performance. The implication
of the lack of correlation between the FAA results and performance of a mix in the field
is two fold:
some fine aggregates could be approved and yet produce poor performing
pavements, or
some aggregate sources that would produce acceptable performance are being
unnecessarily rejected.
Because FAA requirements have been questionable, the Compacted Aggregate
Resistance (CAR) test was proposed as an alternative method for measuring fine
aggregate properties with respect to their contribution to producing rut resistant mixes
(Jahn, 2003). The CAR test is still under development. Ongoing research will determine
if it can supplement or replace the FAA test. The CAR test is basically a “punch shear”
that measures the shear resistance of compacted fine aggregates. Conceptually, the CAR
test is similar to the California Bearing Ratio test. Although the initial evaluation of the
CAR test appears promising, further research is needed to establish a performance
relationship between CAR test results and the performance of asphalt concrete. Since the
FAA test and criteria were implemented to ensure the rutting performance of mixes, then
results from the CAR test should also be evaluated with respect to the rutting
performance of mixes.
1.3 OBJECTIVES
The objective of this research is to determine if the CAR test is a suitable method
for measuring and specifying the quality of fine aggregates with respect to their impact
on the rutting potential of HMA.
3
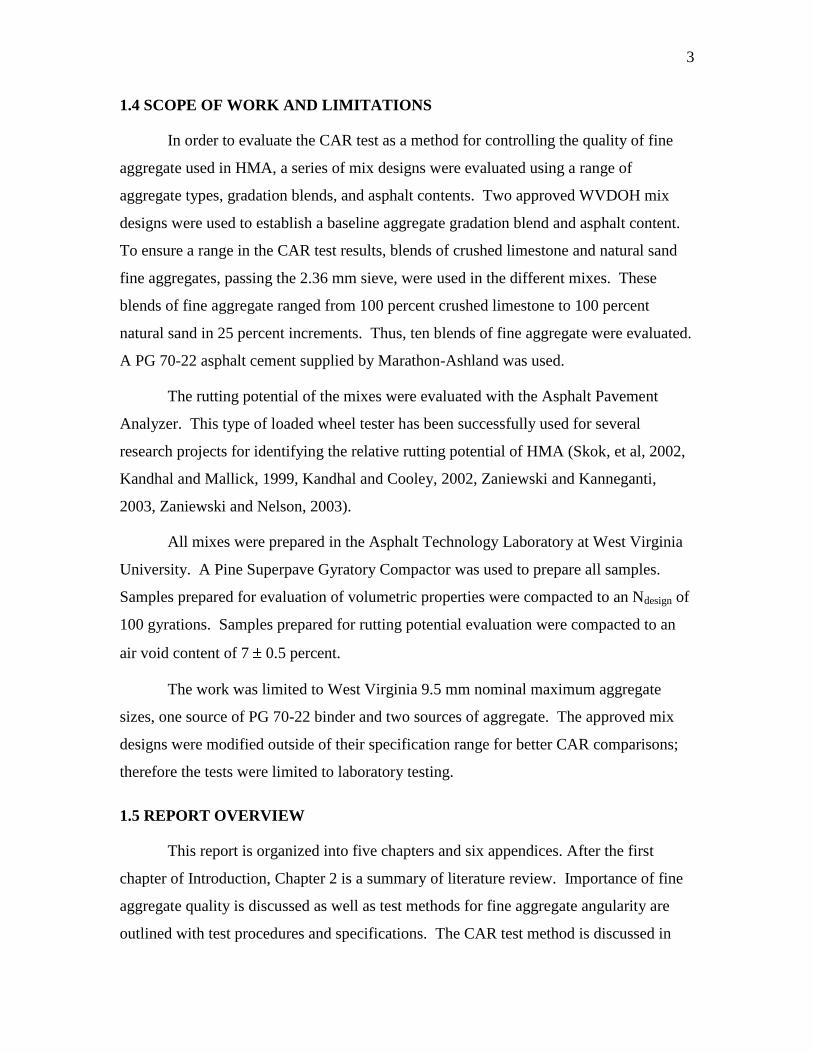
1.4 SCOPE OF WORK AND LIMITATIONS
In order to evaluate the CAR test as a method for controlling the quality of fine
aggregate used in HMA, a series of mix designs were evaluated using a range of
aggregate types, gradation blends, and asphalt contents. Two approved WVDOH mix
designs were used to establish a baseline aggregate gradation blend and asphalt content.
To ensure a range in the CAR test results, blends of crushed limestone and natural sand
fine aggregates, passing the 2.36 mm sieve, were used in the different mixes. These
blends of fine aggregate ranged from 100 percent crushed limestone to 100 percent
natural sand in 25 percent increments. Thus, ten blends of fine aggregate were evaluated.
A PG 70-22 asphalt cement supplied by Marathon-Ashland was used.
The rutting potential of the mixes were evaluated with the Asphalt Pavement
Analyzer. This type of loaded wheel tester has been successfully used for several
research projects for identifying the relative rutting potential of HMA (Skok, et al, 2002,
Kandhal and Mallick, 1999, Kandhal and Cooley, 2002, Zaniewski and Kanneganti,
2003, Zaniewski and Nelson, 2003).
All mixes were prepared in the Asphalt Technology Laboratory at West Virginia
University. A Pine Superpave Gyratory Compactor was used to prepare all samples.
Samples prepared for evaluation of volumetric properties were compacted to an Ndesign of
100 gyrations. Samples prepared for rutting potential evaluation were compacted to an
air void content of 7 0.5 percent.
The work was limited to West Virginia 9.5 mm nominal maximum aggregate
sizes, one source of PG 70-22 binder and two sources of aggregate. The approved mix
designs were modified outside of their specification range for better CAR comparisons;
therefore the tests were limited to laboratory testing.
1.5 REPORT OVERVIEW
This report is organized into five chapters and six appendices. After the first
chapter of Introduction, Chapter 2 is a summary of literature review. Importance of fine
aggregate quality is discussed as well as test methods for fine aggregate angularity are
outlined with test procedures and specifications. The CAR test method is discussed in

4
further detail including procedure and history. The research methodology and procedures
for preparing, testing and analyzing samples is presented in Chapter 3. Chapter 4
presents the results of the experiment and the analysis of the results. Chapter 5 concludes
the report with the conclusions and recommendations.
The mix designs used are presented in the Appendix A. Appendix B presents the
CAR procedure followed during this research. The individual CAR output for each
sample set is graphically presented in Appendix C. Appendix D and E presents
respectively the rut depth results and volumetric data for each specimen tested.

5
CHAPTER 2 LITERATURE REVIEW
2.1 INTRODUCTION
This review first analyzes the problems that the current test for measuring fine
aggregate angularity has faced. A number of tests have been evaluated to supplement or
replace the fine aggregate angularity test, but this study will focus on the CAR test, and
compare the results to those of the APA.
2.2 FINE AGGREGATE SHAPE AND TEXTURE
Particle shape of aggregates is important for workability and performance of
HMA. Cubicle-like particles, rather than flat, thin, and elongated particles are
recommended for use in HMA (Roberts, et al, 1996). Angular particles, a property found
in most crushed stone, provide a better interlocking property than rounded particles. This
provides better performance and less rutting under repetitive traffic loads. However, this
property also makes the workability during the compaction stage of construction more
difficult. Rounded particles provide better workability during compaction, but tend to
continue to compact under traffic loading due to the lack of interlocking particles.
The texture of aggregates is also important in the workability and performance of
HMA (Roberts, et al, 1996). Rough surfaces are found in fine aggregates produced by
crushing stone. Smooth-surfaced particles are often found in natural sand and gravel. A
rough surface provides a greater bonding strength with asphalt cement and provides
frictional resistance between particles. Due to the greater frictional resistance, fine
aggregate with high texture require a greater amount of asphalt cement to increase the
workability during construction, relative to the requirements for a smooth texture fine
aggregate. A rougher texture is preferred in HMA where friction between particles is
needed to provide stability.
It has been well documented that the characteristics of fine aggregates play a
significant role in rutting resistance for HMA (Chowdury, et al, 2001, Purcell and Cross,
2001, Stakston, et al, 2002, and White, 1998). However, the SHRP researchers originally
focused on the role of binder in the performance of HMA. The need to include aggregate

6
specifications was not addressed until late in the SHRP program. As a result, an expert
committee formulated Superpave aggregate specifications based on their experience and
using existing tests. These are identified as the consensus properties which are required
for all Superpave mixes, regardless of geographic location (Harman, et al, 2002). State
agencies are allowed to supplement the consensus properties with local requirements
known as source properties. Superpave requires the following consensus properties:
Coarse Aggregate Angularity (ASTM D5821) –materials retained on 4.75 mm
sieve.
Fine Aggregate Angularity (AASHTO T304) – materials passing the 2.36 mm
sieve.
Flat & Elongated particles (ASTM D4791) –materials retained on 9.5 mm sieve.
Sand Equivalent (AASHTO T176) –materials passing the 4.75 mm sieve.
Aggregate property requirements set forth by WVDOH are shown in Table 2.1
(WVDOH, 2000).
The design criterion for Superpave uses an AASHTO test method T 304,
Uncompacted Void Content of Fine Aggregates. This test provides an indirect measure
of angularity (Roque, 2002). The FAA requirement was implemented based on the
assumption that more angular fine aggregates will interlock and create a stronger shear
resistance than rounder particles. This concept is correct, however, there are other factors
that influence rutting resistance, including particle texture, toughness, gradation, VMA
and compaction (Roque, 2002). Some state agencies have reported that mixes that are
performing well in the field included fine aggregates that do not meet the current FAA
requirements. Some agency and industry representatives are suggesting a more direct
method of testing by adding a strength or torture test to the Superpave system (Roque,
2002). One proposal for evaluation fine aggregates is the CAR test, a punch shear test
that measures the stability of compacted fine aggregates (Chowdury, et al, 2001).

7
Table 2.1 WVDOH Aggregate Requirements
Design
ESALs
(Million)
Coarse Aggregate
angularity (%min)*
Fine aggregate
angularity (%min) Sand
equivalent
Percent
minimum
Flat &
elongated
Percent
minimum
100 mm
from
surface
>100
mm
from
surface
100
mm
from
surface
>100 mm
from
surface
<0.3 55/- - - - 40 -
0.3 to <3 75/- 50/- 40 40 40 10
<10 85/80 60/- 45 40 40 10
10 to <20 90/95 80/75 45 40 45 10
20 to <30 95/90 80/75 45 40 45 10
30 100/100 100/100 45 45 50 10
2.3 TEST METHODS FOR FINE AGGREGATE SHAPE AND TEXTURE
Chowdury, et al (2001) prepared an excellent report of the various fine aggregate
test methods that provided the basis for the following review. The angularity of fine
aggregates may be evaluated with either direct or indirect methods. Direct methods
evaluate angularity by inspection of the aggregate. Indirect methods test the behavior of
the aggregates, and relate the quality of the behavior to the angularity. Due to the size of
fine aggregates, it is not feasible to manually evaluate their shape and texture as is done
for coarse aggregates. With the advent of digital images and computer analysis, several
methods have recently been developed to measure shape and texture directly. However,
the state of the art has not developed to the point where these methods can be
recommended for implementation. For completeness, a brief review of these methods is
presented, but they were not considered for use during this research due to their
experimental nature. Indirect measures of shape and texture are based either on
measuring the shear resistance of the aggregate or on the ability of the aggregate to flow
and pack into a cylinder.
*The first number indicates the minimum percent of course aggregates with at least one fractured face.
The second number is the required minimum percent of coarse aggregate with more than one fractured
face.

8
2.3.1 Visual Inspection Methods
Visual inspection methods have recently been developed using machine vision to
capture an image of the aggregate and complex algorithms to process the image into
information about size, shape and texture. Research is ongoing in France, and at the
Universities of Texas, Washington, and Missouri to develop technologies for capturing
digital images and processing them into useful information about aggregate size, shape
and texture. The level of sophistication used for this approach of aggregate evaluation is
not feasible for implementation by highway agencies at this time.
2.3.2 Flow and Compaction Methods
The shape and surface texture of fine aggregate affect the packing of the
aggregates as they flow into a container, pass through an orifice, or compacted into a
container. Based on this observation, several test methods have been developed to
quickly and economically evaluate the surface texture and shape of fine aggregates.
2.3.2.1 Uncompacted Void Content
ASTM C-1252 (equivalent to AASTHO T-304) "Uncompacted Void Content of
Fine Aggregates" provides an indirect measure of fine aggregate texture and angularity.
This is the method referred to as either the National Aggregate Association (NAA) Flow
Test, or the Fine Aggregate Angularity (FAA) test. In this test, the FAA is described as
the percent of air voids present in uncompacted aggregates. The test is limited to
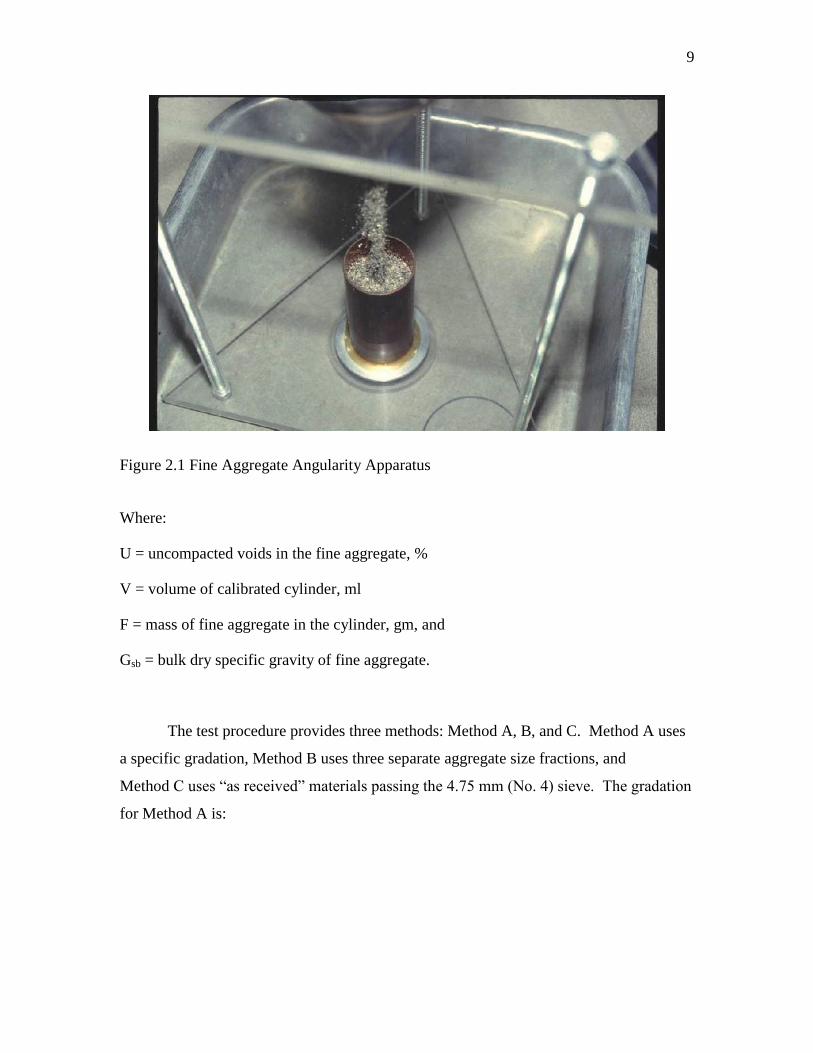
aggregates finer than 2.36 mm. The apparatus used in this test is shown in Figure 2.1. A
sample of dry fine aggregate is placed into the apparatus, and falls through the cone into a
calibrated cylinder. The orifice in the cone is 12.5 mm (0.5 inch). The height from the
orifice of the cone and the rim of the cylinder is 114 mm (4.5 inch). The theory behind
this test is that the higher the uncompacted void content, the more freshly fractured faces
and highly textured particle faces.
The uncompacted void content is determined as:
100V
GFV
Usb
(2.1)
9
Figure 2.1 Fine Aggregate Angularity Apparatus
Where:
U = uncompacted voids in the fine aggregate, %
V = volume of calibrated cylinder, ml
F = mass of fine aggregate in the cylinder, gm, and
Gsb = bulk dry specific gravity of fine aggregate.
The test procedure provides three methods: Method A, B, and C. Method A uses
a specific gradation, Method B uses three separate aggregate size fractions, and
Method C uses “as received” materials passing the 4.75 mm (No. 4) sieve. The gradation
for Method A is:

10
Individual Size Fraction Mass, gm
2.36 mm (No. 8) to 1.18 mm (No.16) 44
1.18 mm (No.16) to 0.60 mm (No.30) 57
0.60 mm (No. 30) to 0.30 mm (No. 50) 72
0.30 mm (No. 50) to 0.075 mm (No. 100) 17
Total: 190 gm
The Superpave methodology specifies the use of Method A. The criteria for an
acceptable fine aggregate are a function of the design traffic for the pavement section and
the depth of the material in the pavement structure as presented in Table 2.1.
Chowdury, et al (2001) performed an extensive study of different methods for
evaluating shape and texture, and a limited study of their relationship to rutting potential
as measured with the Asphalt Pavement Analyzer. Their conclusion relating FAA and
rutting potential was:
These limited findings indicate that FAA does not correlate well
with rut resistance of HMA mixtures. Further, certain fine
aggregates with a FAA value lower than 45 (limestone), or even
lower than 43 (blend 2), but with relatively high particle surface
texture, can produce mixtures with relatively good rut resistance.
Martin Marietta, a major aggregate supplier throughout the United States, found
significant concerns with the FAA test as implemented in Superpave. The research team
found several research reports cited from a variety of sources, including:
NCAT,
TRB,
ICAR,
NCHRP,
SEAUPG,
and Pooled Fund176.
These demonstrated poor correlation between FAA results and the performance of
HMA (Jahn, 2003). Conclusions in 21 research reports that show FAA is not a suitable
test for characterizing fine aggregate; it has a poor correlation with pavement

11
deformation, and several DOT’s do not apply FAA requirements (Marek, 2002) . For
example, the WVDOH has recently proposed lowering the FAA requirement from 45 to
43 for asphalt concrete mixes that use 100 percent crushed products (Barker, 2003).
2.3.2.2 Flow Rate Method
This method is similar to the FAA test in that it uses a standard funnel to
indirectly evaluate the shape and texture of fine aggregates. In this procedure, a specific
weight and size fraction of aggregates are poured through a funnel; the time it takes to
flow through the orifice is measured. The flow rate is determined by dividing the volume
of the sample, in cm3, by the flow time in seconds. The volume of the sand is determined
by the weight divided by the bulk dry specific gravity. The flow rate of a standard set of
round balls is measured. A shape-texture index (STI) is computed as the ratio of the flow
rate of the standard balls divided by the flow rate of the sand. Because the flow rate for
the standard set of round balls is constant, the STI changes proportionally with the flow
rate of the aggregates
The flow rate method is relatively simple and inexpensive, but has not been
widely accepted. There have been a number of tests done using different weights of
aggregate and size fractions, but a national standard has not been developed.
2.3.2.3 New Zealand Test
The New Zealand test is similar to the previously mentioned methods (Chowdury,
et al, 2001). A 1000 gram sample of fine aggregate passing the 2.36 mm sieve is placed
through a standard funnel. The uncompacted void content, and the time it takes for the
sample to pass are recorded. These measurements are used to indirectly evaluate particle
shape and texture.
2.3.2.4 Index of Aggregate Particle Shape and Texture
This is another indirect method of determining fine aggregate shape and texture
(Roberts, et al, 1996). This procedure consists of a combination of four different sieve
sizes:
2.36 mm (No. 8) to 1.18 mm (No. 16)

12
1.18 mm (No. 16) to 0.60 mm (No. 30)
0.60 mm (No. 30) to 0.30 mm (No. 50)
0.30 mm (No. 50) to 0.075 mm (No. 100)
A sample of each size is combined and compacted into three separate layers. The
layers are compacted in a mold with a specific height and diameter depending on the
aggregate size. Each layer receives 10 drops from a tamping rod 2 inches above the
specimen. The weight of the tamping rod is determined by the size fraction of the
aggregate. The percentage of voids, V10, is calculated as the difference between the
volume of the mold and the absolute volume of the sand. The absolute volume of the
sand is calculated by dividing the mass of the sample by the bulk dry specific gravity.
The procedure is repeated using 50 blows from the tamping rod giving the percentage of
voids V50. A shape index, Ia, is calculated as:
Ia = 1.25 V10 - 0.25V50 - 32.0 (2.2)
where,
Ia = particle index value;
V10 = percent voids in the aggregate compacted with 10 blows per layer; and
V50 = percent voids in the aggregate compacted with 50 blows per layer.
The shape index, Ia, for the original fine aggregate is determined by calculating
the weighted average of Ia for all size fractions in the original gradation. A rounded
aggregate with a smooth texture may have an index of 6 or 7, where a more angular
aggregate with a rough surface may have an index of 15 to 20 or more. The test is time
consuming, and, therefore, not commonly used.
2.3.3 Shear Strength Tests
The existing Superpave specification for fine aggregate angularity is an attempt to
limit the aggregate's contribution to rutting potential of HMA. FAA is a surrogate for
shape and texture, which in turn is a surrogate for a measure of the shear resistance
capacity of the aggregate. Shear test methods for evaluating the angle of internal friction

13
of fine aggregates are available and should be considered in the review and evaluation of
the Superpave mix design materials specification.
2.3.3.1 Direct Shear Test
The direct shear test can be applied to a cohesionless soil, e.g. sand, to measure
the angle of internal friction. This provides an indirect measure of shape and texture, as
particles with high angularity and texture have a higher angle of internal friction than
rounded and smooth particles. To measure shear resistance, an air dried sample is placed
into a direct shear apparatus for soil (ASTM D 3080). The box is split horizontally, with
either the top half or bottom half held stationary and the other half allowed to move when
a shearing force is applied. A normal stress is used to keep the sand consolidated. The
shear strength is measured at three different normal stresses, and the angle of internal
friction is the slope of the shear strength versus normal stress diagram.
Chowdury, et al (2001) found a correlation between rutting potential and the
direct shear test; however, the correlation coefficient, R2, for their regression equation
that relates the angle of internal friction and rut resistance was 0.69. The direct shear test
provides a measure of a fundamental engineering property. However, the biaxial load
requirements of the test require equipment that is not readily available to highway
agencies.
2.3.3.2 Compacted Aggregate Resistance Test
The CAR test is a punch shear method, which measures the resistance of
compacted fine aggregates. The CAR test uses standard Marshall equipment along with a
simple loading head, Figure 2.2, for evaluating the shear resistance of fine aggregates.
The CAR test shows potential for evaluating fine aggregates with respect to their
contribution to the rutting potential of HMA. The test procedure is summarized as:
The gradation of the fine aggregates used in the mix design is used for the test.
The aggregates are dried then brought to the required moisture content.
The aggregates are placed in a 4" Marshall mold and rodded to provide initial
compaction.

14
The sample is compacted using a standard Marshall hammer and drop height; 50
blows are applied to one face of the sample.
The sample is placed in a Marshall stabilometer configured with a punch loading
head as shown in Figure 2.2.
The load is applied at a rate of 2 inches per minute and the force and deformation are
recorded.
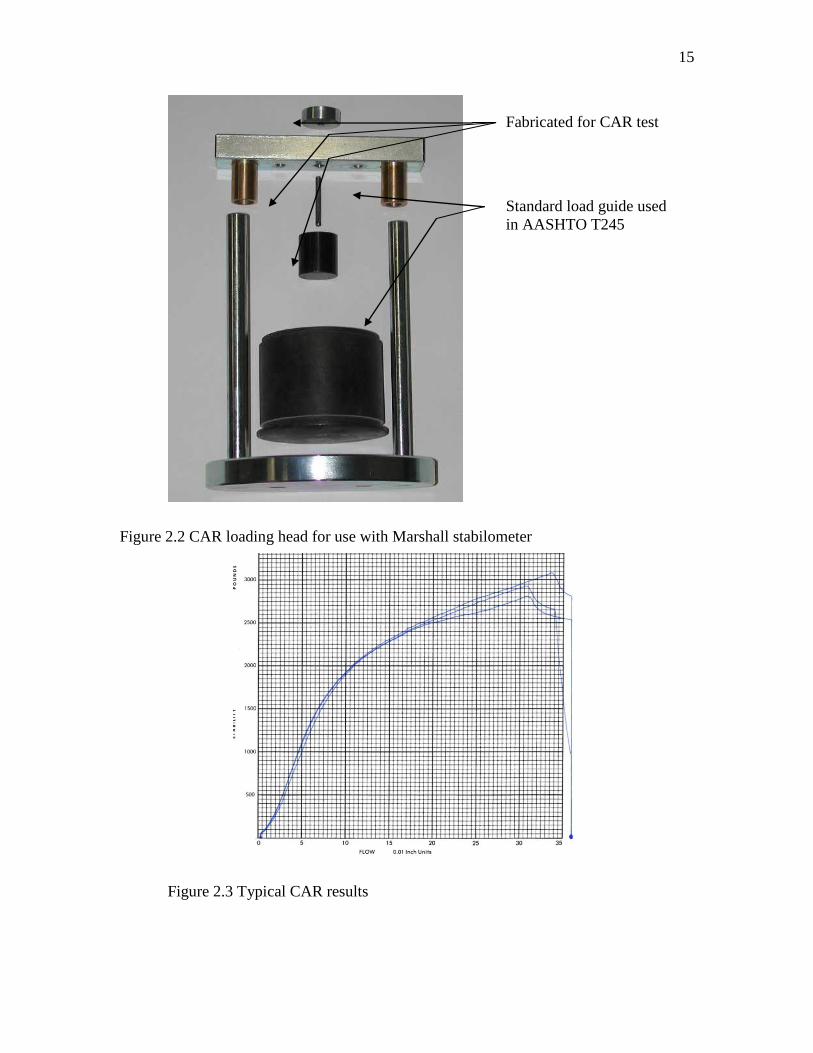
A typical CAR output is shown in Figure 2.3. The CAR result is the peak force
measured during the test, or the force (lbs) at a deformation of 0.25 inches if the
strength of the material exceeds the maximum load capacity of the machine. Jahn
(2004b) justified the use of measuring CAR force at 0.25 inches based on the
following arguments:
Some cubical limestone materials have a peak punch shear resistance in excess of
25,000 pounds. This is beyond the capabilities of the Marshall stabilometer.
Typically technicians using the Marshall stabilometer are familiar with reading
results on recording charts scaled for 5000 pounds maximum force.
Materials in which CAR force are in excess of 5000 pounds have high shear
resistance, and are therefore acceptable for producing rut resistant mixes.
The CAR test, like the FAA test, provides an evaluation of aggregate properties
prior to the mix design process. A simple test, using readily available equipment
was an objective of the development of the CAR test. Requiring users to
purchase higher capacity equipment is inconsistent with the objective of the test
method.
15
Figure 2.2 CAR loading head for use with Marshall stabilometer
Figure 2.3 Typical CAR results
Fabricated for CAR test
Standard load guide used
in AASHTO T245

16
In 1995, Martin Marietta’s research team became aware that cubicle shaped, 100
% limestone fine aggregate could be rejected by the FAA test, yet produce high quality
HMA (Jahn, 2004a). The Martin Marietta research team, led by David Jahn, found a
possible replacement for the FAA test from Indiana DOT’s previously used Florida
Bearing Ratio Test. Equipment for the Florida Bearing Ratio test was difficult to obtain,
but the test was based on a punch shear mechanism that could be achieved by modifying
Marshall equipment.
The Florida Bearing Ratio Test used a moisture content of 1.75 percent for
testing, this is the number used in the original CAR testing protocol. However, there was
a concern that the results could be sensitive to moisture content. An experiment was
performed using moisture contents of 1-5 percent, with two aggregate sources, producing
the results displayed in Figure 2.3 (Jahn, 2003). The CAR results are affected by low
moisture contents; however, the results appear to be consistent for moisture contents
greater than three percent. Based on this evaluation, Jahn recommended using a moisture
content of 3.5 percent as a standard for all aggregates.
The research team decided on materials passing the 2.36 mm sieve for the original
protocol, as does the Florida Bearing Ratio Test and the Fine Aggregate Angularity test.
The Fine Aggregate Angularity Test, method A, uses a constant blend of aggregates
passing the 2.36 mm sieve and also requires specific gravity to determine the results. The
CAR test eliminates the need for specific gravity computation and uses the “as received”
gradations. The research team has currently been testing materials passing the 4.75 mm
sieve, as recommended by NCAT (Jahn, 2004b).
The research team also experimented with the compaction effort of the Marshall
hammer. The original protocol also requires 50 blows to one face of the sample.
Experiments demonstrated that 50 blows provide adequate compaction to achieve
consistent results. Figure 2.4 shows the results of an experiment where different levels of
compactive effort were used to prepare the samples. While the CAR results are
correlated with the compactive effort, there is no difference in the ability of the test to
identify the relative performance of the aggregates. Hence, 50 blows on one side of the
sample was selected as the compactive effort for the CAR test.

17
Moisture Content
0
1000
2000
3000
4000
5000
6000
0 5 10 15 20 25
Deformation (0.01 inches)
CA
R F
orc
e (
lbs)
Crushed Gravel 1
Crushed Gravel 2
Crushed Gravel 3
Crushed Gravel 4
Crushed Gravel 5
Natural Sand 1
Natural Sand 2
Natural Sand 3
Natural Sand 4
Natural Sand 5
Figure 2.3 Martin Marietta’s moisture content testing results
Compactive Effort
0
1000
2000
3000
4000
5000
6000
0 5 10 15 20 25
Deformation (0.01 inches)
CA
R F
orc
e (
lbs)
50 Blows, Natural Sand
75 Blows, Natural Sand
100 Blows, Natural Sand
125 Blows, Natural Sand
50 Blows, Crushed Gravel
75 Blows, Crushed Gravel
100 Blows, Crushed Gravel
125 Blows, Crushed Gravel
Figure 2.4 Martin Marietta’s compaction results

18
Studies by Jahn indicate the CAR test has a good ability to distinguish the shear
capacity of different aggregates with good repeatability. However, the ability of the CAR
results to accurately indicate the contribution of fine aggregates to the rutting potential of
a mix has not been sufficiently evaluated to allow the development of a criterion that can
be used for specifying materials for mix design.
There is ongoing research to evaluate the CAR test (Jahn, 2004a). Research at
NCAT has suggested inclusion of all material passing the 4.75mm sieve. The test
method is also being evaluated in a project at Michigan Tech University.
2.4 LITERATURE SUMMARY
There are a variety of methods for evaluating fine aggregate characteristics. For
the purposes of developing a specification for the use of a fine aggregate material in
asphalt concrete, the procedure should provide direct evidence of the contribution that the
fine aggregate will make to the rutting resistance of a mix. The SHRP researchers
selected the Fine Aggregate Angularity method. While this is a simple and easy to
perform method, it has been criticized in the literature for not correlating well with the
rutting potential of asphalt mixes and for rejecting aggregates with a proven record of
acceptable performance. This has lead researchers to search for a viable candidate to
replace the current Superpave FAA requirement.
The direct shear test is a fundamentally sound test that provides a direct measure
of an aggregate's angle of internal friction. However, this test method requires equipment
that is not readily available in materials laboratories of state highway agencies.
The Compacted Aggregate Resistance test has the potential to fulfill the need for
providing a reliable evaluation of the ability of a fine aggregate to contribute to the
rutting resistance of an asphalt concrete mix. The CAR test offers the advantage of using
readily available equipment. The only additional equipment cost is for the loading head
used for the test.

19
CHAPTER 3 RESEARCH METHODOLOGY
3.1 INTRODUCTION
Research by Jahn has demonstrated the potential of the CAR test as a replacement
for the FAA method as a specification tool for evaluating fine aggregates used in asphalt
concrete. However, the CAR test is not ready for implementation at this time. Issues that
need to be resolved include:
the ability of independent laboratories to reliably perform the test,
refinements to the testing methodology, and
the development of specification criteria for the acceptance or rejection of
an aggregate source.
The following research methodology was designed to address these issues.
3.2 DESIGN OF EXPERIMENT
All materials used during the research are commonly used for asphalt concrete
mixes in West Virginia. Initial proportioning of the materials was based on WVDOH
approved mix designs as given in Appendix A. Two mix designs were evaluated during
the research, a Superpave 9.5 mix, and a Marshall Wearing I skid mix. Both mix types
have a 9.5 mm nominal maximum size aggregate. The Marshall mix had an optimum
asphalt content of 6.3 percent and used four aggregate stockpiles, #8 limestone, #8
dolomite, crushed limestone fine aggregate and natural sand, with blend proportions of
22, 22, 28, and 28 percent, respectively. The Superpave mix design had an optimum
asphalt content of 5.7 percent and also used four stockpiles, however, they were all
crushed limestone material. The aggregates used in the Superpave mix design were #8,
#9 and two fine aggregate stockpiles. For simplicity, the tests using the Superpave mix
design combinations will be referred to as Blend #1, and the tests done with the Marshall
mix design combination will be referred to as Blend #2. Figure 3.1 shows the gradation
of the two mixes. The lines on the right side of the figure are the overall gradations used
in the mix design. The lines on the left side of the figure are the gradations for the
20
0
10
20
30
40
50
60
70
80
90
100
Sieve size (mm)
Perc
en
t P
assin
g
Blend #1
Blend #2
Blend #1 fines
Blend #2 fines
12.59.54.752.361.180.60.30.075
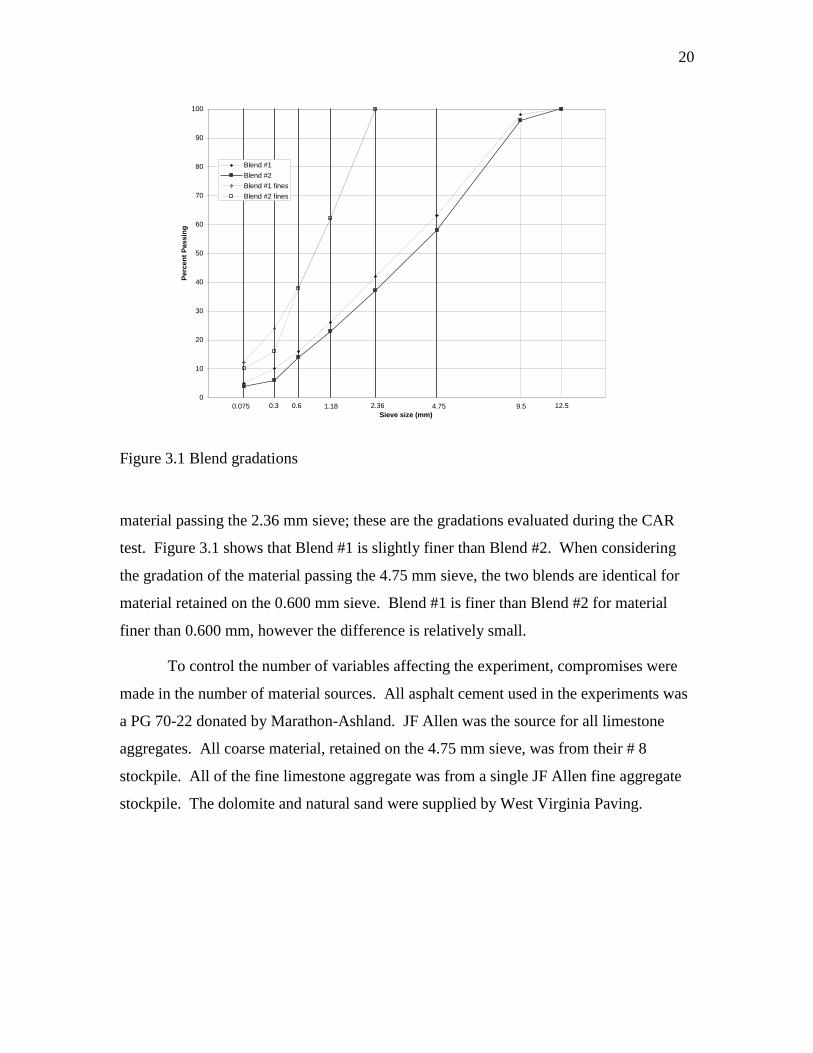
Figure 3.1 Blend gradations
material passing the 2.36 mm sieve; these are the gradations evaluated during the CAR
test. Figure 3.1 shows that Blend #1 is slightly finer than Blend #2. When considering
the gradation of the material passing the 4.75 mm sieve, the two blends are identical for
material retained on the 0.600 mm sieve. Blend #1 is finer than Blend #2 for material
finer than 0.600 mm, however the difference is relatively small.
To control the number of variables affecting the experiment, compromises were
made in the number of material sources. All asphalt cement used in the experiments was
a PG 70-22 donated by Marathon-Ashland. JF Allen was the source for all limestone
aggregates. All coarse material, retained on the 4.75 mm sieve, was from their # 8
stockpile. All of the fine limestone aggregate was from a single JF Allen fine aggregate
stockpile. The dolomite and natural sand were supplied by West Virginia Paving.

21
The combination of factors and levels examined during the experiment are:
Factors Levels
Asphalt content 5.2, 5.7, 6.7 percent
Coarse aggregate Blend #1 and Blend #2
Fine aggregate (percent of the fine aggregate
that is crushed limestone)
100, 75, 50, 25, 0
There were 10 combinations of aggregate factors. For each combination of
aggregates, the following testing schedule was performed:
Fine aggregate angularity, three replicates
CAR resistance, 6 replicates
There are 30 combinations of factors and levels tested during the experiment. All
combinations were tested. Tests performed were:
Maximum theoretical specific gravity, one per combination
Bulk specific gravity of samples compacted to 100 gyrations, two specimens per
combination
Asphalt pavement analyzer specimens compacted to 75mm with void contents of 7 ±
0.5 percent, six specimens per combination.
3.3 AGGREGATE PREPARATION
After the aggregates were collected from the supplier, they were air dried, sieved
(ASTM C136, 1984), washed, oven dried and stored in segregated bins. The aggregate
preparation for both mix designs were the same. The crushed limestone and dolomite
were stored in three bins with materials retained on the 9.5, 4.75 and 2.36 mm sieves,
respectively. The minor amount of material from the coarse stockpiles which passed the
2.36 mm sieve was discarded. The fine aggregates were separated into four separate bins
for each type of aggregate retained on the 1.18, 0.6, 0.3, and 0.075 mm sieves. The
minor amount material from the fine aggregate stockpiles retained on the 2.36 mm sieve
was discarded. The decision to separate the coarse and fine materials based on the

22
2.36 mm sieve is an artifact of the preliminary CAR testing protocol which specified the
test was to be performed on material finer than 2.36 mm.
3.4 MIX PREPARATION
Weigh-out tables were prepared for each specimen. The required amount of
aggregates were placed in a pan and heated to the compaction temperature for the asphalt
cement. The asphalt cement was heated to the same temperature. A Kol five-gallon
bucket mixer was used to prepare all compaction samples following the procedures
developed by Zaniewski and Hughes (2003). The bucket and paddle were heated. The
aggregates were added to the bucket and the required asphalt was added. The material
was mixed until a uniform coating of the aggregate was achieved. The material was then
transferred to a pan, then placed in an oven set at the mixing temperature for two hours.
The material was stirred every 30 minutes. After curing, the compaction samples were
transferred to the gyratory mold. The appropriate compaction was applied; 100 gyrations
for the specimens used for volumetric analysis, and compaction to a height of 75 mm for
the APA samples.
The procedure for mixing the theoretical maximum specific gravity samples was
similar, except the samples were hand mixed with the bowl resting in a heated sand bath.
3.5 VOLUMETRIC ANALYSIS
The bulk specific gravity samples were compacted with the Superpave gyratory
compactor to Ndesign of 100 gyrations (AASHTO T166, 2000). Two specimens were
prepared for each experimental combination. The volumetric properties of the mixes
were evaluated using the average specimen values. A maximum theoretical specific
gravity test (AASHTO T209, 1999) was performed for each combination. The bulk
specific gravity and maximum specific gravity from the tests were used to evaluate the
volumetric properties of the mix using Equations 3.1 to 3.8 (Roberts, et al, 1996).
mm
mbNdesmm
G
GG ,% (3.1)

23
b
b
mm
bse
G
P
G
PG
1
1 (3.2)
b
sesb
sbseba G
GG
GGP 100 (3.3)
bbabbe PPPP 1 (3.4)
beP
P
B
d 200#% (3.5)
mm
mb
G
GVTM 1 (3.6)
sb
bmb
G
PGVMA
11100 (3.7)
VMA
VTMVMAVFA 100 (3.8)
where,
%Gmm,Ndes = Percent of maximum specific gravity at design number of revolutions;
Gmb = Bulk specific gravity;
Gmm = Maximum specific gravity;
Gse = Effective specific gravity of aggregate;
Pb = Percent binder;
Gb = Specific gravity of the binder;
Pba = Percent binder absorbed;
Gsb = Bulk specific gravity of aggregate;
Pbe = Effective percent binder

24
%P#200 = Percent of the aggregate blend passing the #200 sieve;
%Gmm,Nini =Percent of maximum specific gravity at initial number of revolutions;
hdes = Height at the design number of revolutions;
hini = Height at the initial number of revolutions;
VTM = Air voids in compacted mixture;
VMA = Volume of voids in mineral aggregates; and
VFA = Voids filled with asphalt.
Equation 3.6 was also used to compute the voids content of the APA samples.
3.6 ASPHALT PAVEMENT ANALYZER
A Pavement Technology Inc. Asphalt Pavement Analyzer, Figure 3.2, was used to
evaluate the rutting potential of each mix. The utility and operation of this device is well-
documented in the literature (Skok, et al, 2002, Zaniewski and Nelson, 2003, Zaniewski
and Nallamothu, 2003, and Mohammad, et al, 2002).
Figure 3.2 Asphalt pavement analyzer
25
Asphalt Pavement Analyzer (APA) specimens were made using the Superpave
Gyratory compactor. These specimens were compacted to a height of 75 mm without
constraining the number of gyrations needed to achieve the required height. Specimens
for the APA were rejected if the void content was outside the range of 7 0.5 percent and
replacement specimens were made. All tests were performed at a temperature of 60 C.
The contact tubes were pressurized to 100 psi, and 8,000 applications of the 100 lb. wheel
load were applied. After APA testing, the rut depth was measured at two points equally
spaced across the specimen to determine the average rut depth for the sample. West
Virginia University uses an electronic Mitutoya Digimatic Indicator to measure the rut
depth of the specimen up to 13.66 mm in depth. However, during this project there were
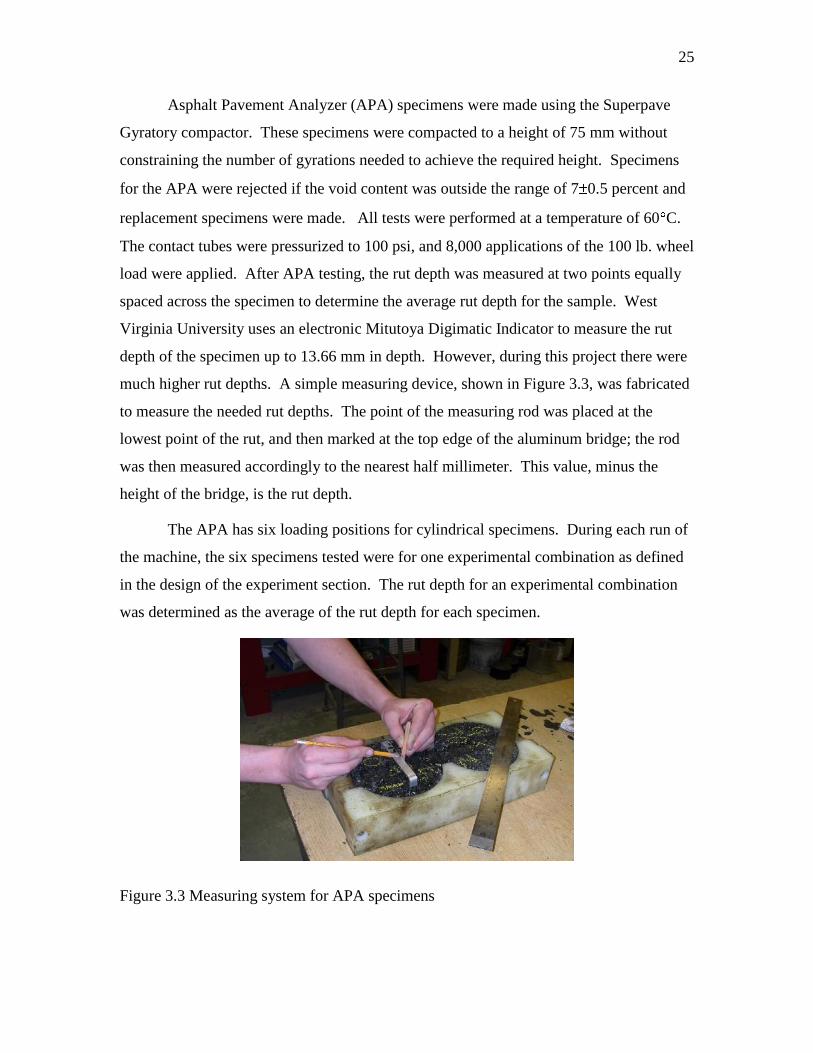
much higher rut depths. A simple measuring device, shown in Figure 3.3, was fabricated
to measure the needed rut depths. The point of the measuring rod was placed at the
lowest point of the rut, and then marked at the top edge of the aluminum bridge; the rod
was then measured accordingly to the nearest half millimeter. This value, minus the
height of the bridge, is the rut depth.
The APA has six loading positions for cylindrical specimens. During each run of
the machine, the six specimens tested were for one experimental combination as defined
in the design of the experiment section. The rut depth for an experimental combination
was determined as the average of the rut depth for each specimen.
Figure 3.3 Measuring system for APA specimens
26
3.7 FINE AGGREGATE ANGULARITY TESTS
The Fine Aggregate Angularity test ASTM C-1252 was performed on the crushed
limestone and natural sand fine aggregate. The FAA values for blends of the aggregates
were computed using a weighted average equation. Zaniewski and Nelson (2003) have
demonstrated that the weighted average equation produces results that are equal to the
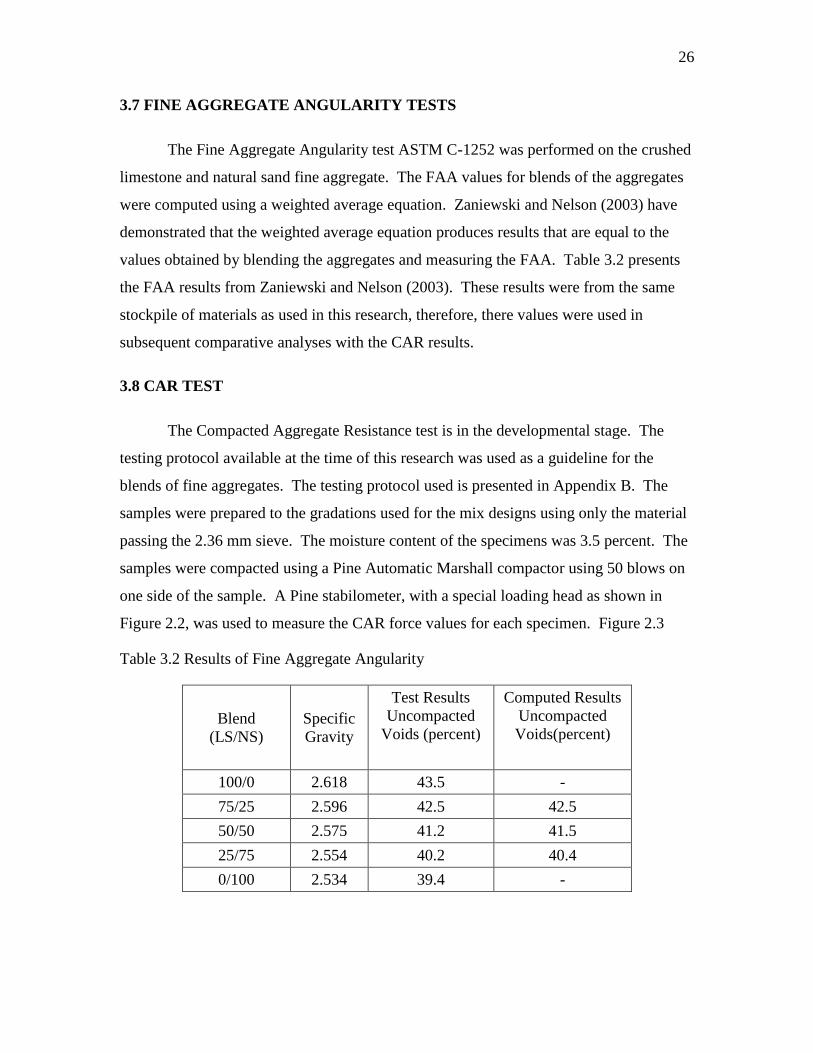
values obtained by blending the aggregates and measuring the FAA. Table 3.2 presents
the FAA results from Zaniewski and Nelson (2003). These results were from the same
stockpile of materials as used in this research, therefore, there values were used in
subsequent comparative analyses with the CAR results.
3.8 CAR TEST
The Compacted Aggregate Resistance test is in the developmental stage. The
testing protocol available at the time of this research was used as a guideline for the
blends of fine aggregates. The testing protocol used is presented in Appendix B. The
samples were prepared to the gradations used for the mix designs using only the material
passing the 2.36 mm sieve. The moisture content of the specimens was 3.5 percent. The
samples were compacted using a Pine Automatic Marshall compactor using 50 blows on
one side of the sample. A Pine stabilometer, with a special loading head as shown in
Figure 2.2, was used to measure the CAR force values for each specimen. Figure 2.3
Table 3.2 Results of Fine Aggregate Angularity
Blend
(LS/NS)
Specific
Gravity
Test Results
Uncompacted
Voids (percent)
Computed Results
Uncompacted
Voids(percent)
100/0 2.618 43.5 -
75/25 2.596 42.5 42.5
50/50 2.575 41.2 41.5
25/75 2.554 40.2 40.4
0/100 2.534 39.4 -

27
presents typical results from the CAR test. Ideally the CAR force should be the
maximum value for punching shear resistance for a material. However, the peak force on
some samples was not achieved within the deformation measurements capability of the
Marshall data recorder. In these cases, the CAR force was measured at 0.25 inch of
deformation. Six specimens were prepared and tested for each blend of fine aggregates.
The average of the six results was used as the CAR value for the subsequent analysis.

28
CHAPTER 4 RESULTS AND ANALYSIS
4.1 INTRODUCTION
Samples were prepared and tested in accordance with the experimental design
presented in the previous chapter. All work was performed in the Asphalt Technology
Laboratory at West Virginia University. The CAR force and APA rutting potential data
were collected during this research. The FAA tests had been performed on these
aggregates in a previous research project (Zaniewski and Nelson, 2003).
4.2 AGGREGATE EVALUATION
4.2.1 CAR Results
Plots of the individual CAR test results are presented in Appendix C. The results
of the CAR test are summarized in Table 4.1. As shown in Table 4.1, the fine aggregates
in blend design #2 had greater resistance than blend design #1. This demonstrates an
effect of gradation on the CAR results. Even though the difference in the gradations are
relatively minor, the CAR test consistently identified Blend #2, the slightly coarser mix,
as having more shear resistance.
For each combination of aggregates, six replicate CAR tests were performed.
Seven of the ten tests showed good repeatability with the coefficient of variation being
less than ten percent. In consistent test results, with a coefficient of variation greater than
ten percent were obtained when 100 percent natural sand was used in the mix. The blend
#1 mix with 75 percent sand had one test result which was out of line with the other
results, shown in bold in Table 4.1. This value is less than the mean result minus two
standard deviations. Therefore this result was treated as an outlier and removed from the
analysis. Blend #2 with 100 percent fine aggregate had a coefficient of variation of 31.5
percent, shown in bold in Table 4.1. This amount of variation is out of line compared to
the other results. The source for variability was not discovered. Jahn (2004b) reported
experience with high variability, and that it could be attributed to dust and dirt on the
shaft of the Marshall hammer, inhibiting the compactive effort. Since the mean values
for the CAR force of this material were reasonable, repeat tests were not performed.

Table 4.1 Results of CAR test
Blend Design #1 Limestone Coarse Aggregate
Lim
estone/
Natu
ral Sand
Fine
Aggregate
Angularity
Re
ading
CAR Force (lbs) A
vg.
S
t. Dev.
C
OV 100/
0
43.5 0.2
5 inch
2
220
2
775
2
550
2
350
2
450
2
600
2
490.8
1
95.5
7
.8% 75/2
5
42.5 0.2
5 inch
1
950
2
050
1
925
2
200
2
025
1
900
2
008.3
1
10.3
5
.5% 50/5
0
41.2 0.2
5 inch
1
640
1
650
1
690
1
790
1
740
1
690
1
700.0
5
6.6
3
.3% 25/7
5
40.2 At
Peak
1
400
7
00
1
275
1
525
1
490
1
475
1
433.0
2
38.2
1
6.6% 0/10
0
39.4 At
Peak
7
75
8
75
9
25
7
75
9
10
1
025
8
80.8
9
5.9
1
0.9% Blend Design #2 Limestone/Dolomite Coarse Aggregate (50/50)
Lim
estone/
Natu
ral Sand
Fine
Aggregate
Angularity
Re
ading
CAR Force (lbs) A
vg.
S
t. Dev.
C
OV 100/
0
43.5 0.2
5 inch
3
450
3
600
3
525
3
800
3
725
3
650
3
625
1
28.5
3
.5% 75/2
5
42.5 0.2
5 inch
3
250
3
400
3
425
3
350
3
350
3
425
3
366.7
6
6.5
2
.0% 50/5
0
41.2 0.2
5 inch
2
550
2
550
2
575
2
550
2
610
2
775
2
601.7
8
8.1
3
.4% 25/7
5
40.2 At
Peak
1
500
1
390
1
400
1
400
1
425
1
400
1
419.2
4
1.3
2
.9% 0/10
0
39.4 At
Peak
4
40
5
25
8
00
9
90
1
000
9
60
7
85.8
2
47.3 3
1.5%

30
Figure 4.1 shows the effect of sand on the CAR force for each of the blends. In
both Table 4.1 and Figure 4.1, the ratio of limestone to natural sand is based on the
material that is finer than the 2.36 sieve. For example, the rows in Table 4.1, identified as
75/25, indicate that 75 percent of the material finer than the 4.75 mm sieve is limestone
and 25 percent is sand. When the natural sand percentages were above 50%, the CAR
force reached peak values prior to 0.25 inches of penetration. When the percentage of
crushed limestone was 50% of the mix and greater a peak force was not identified so the
readings were taken at 0.25 inches of penetration. As expected, the greater the crushed
limestone in the mix, the greater the CAR force. Figure 4.1 demonstrates an increase in
the resistance to deformation as the percent of limestone fine aggregate increases.
However, the results vary depending on the gradation of the blends. Blend #1 has a fairly
linear relationship between the CAR results and the percent of limestone. Blend #2
indicates a nonlinear effect of the percent limestone. The results for the two gradations
were similar for 0 and 25 percent limestone. When limestone percent was greater than 50
percent, Blend #2 has higher CAR force than Blend #1. The only difference between
Blends #1 and #2 was a minor change in gradation as shown in Figure 3.1.
0.0
500.0
1000.0
1500.0
2000.0
2500.0
3000.0
3500.0
4000.0
0 25 50 75 100
Percent limestone fine aggregate
CA
R F
orc
e (
lbs
)
Blend Design #1
Blend Design #2
Figure 4.1 Effect of percent limestone on CAR force

31
4.2.2 Fine Aggregate Angularity Results
Figure 4.2 shows the FAA increasing as the percent of limestone in the fine
aggregate increases, similar to the CAR results. Since the FAA is performed on a
specified gradation, it is not capable of identifying the effect of gradation. The FAA test
procedure does permit altering the gradations. However, this is not the method required
by the Superpave specifications so this alternate method for preparing the samples was
not evaluated during this research. It was observed that the FAA for the crushed
limestone samples was 43.5 percent air voids. This is less than the Superpave
requirement of FAA ≥ 45 for high volume traffic design.
39.0
39.5
40.0
40.5
41.0
41.5
42.0
42.5
43.0
43.5
44.0
0 25 50 75 100
Percent Limestone
Fin
e A
gg
reg
ate
An
gu
lari
ty
Figure 4.2 Fine Aggregate Angularity Results.
4.2.3 Comparison of CAR and FAA
Comparison of Figures 4.1 and 4.2 demonstrate a significant weakness of the Fine
Aggregate Angularity test. Under the current Superpave specifications, the FAA test is
not capable of distinguishing the effect of gradation on the internal friction produced
between the fine aggregates. The CAR test appears to overcome this flaw.
32
4.2.4 Evaluations and comparison with other studies
The only other source of CAR test results were presented by Jahn (2003). These
results demonstrated the sensitivity of the CAR force to aggregate type. Jahn's specific
results cannot be compared to the results of this research. As with this research, Jahn
found that crushed materials performed better than natural sands. Jahn does not report on
experiments that would permit the development of a specification for the CAR test.
4.3 RUTTING RESULTS AND ANALYSIS
Table 4.2 shows the average rut potential values for the different combination in
the experiment. Figure 4.3 shows as positive correlation between rutting potential, the
asphalt content, blend type, and percent of natural sand. Blend #2 has a coarser gradation
than Blend #1, providing a greater resistance to the APA wheel load.
Figures 4.4 and 4.5 show the relationship between the CAR properties of the fine
aggregates compared to rutting potential for Blend #1 and Blend #2. Each graph shows
the percentages of limestone used in the CAR experiment and the rut depth of the sample
corresponding to that blend of fine aggregate. The CAR properties are based solely on
the gradation of fine aggregates passing the 2.36 mm sieve. The APA samples the entire
blend of aggregates. The correlation coefficients for the CAR force and the rutting
potential were computed for each combination of blends and asphalt contents. As
expected from inspection of Figures 4.4 and 4.5, there is a high degree of correlation
between CAR force and rutting potential. The correlation coefficients ranged from -0.89
to -0.99.
Figure 4.3 shows the rutting potential for Blend #1 with asphalt contents of 5.2,
5.7, and 6.7 percent. The CAR test evaluates fine aggregate; therefore asphalt binder
plays no role in the CAR results. However, Figure 4.4 demonstrates that the correlation
between the CAR force and rutting potential is consistent with asphalt contents, as would
be expected. For example, the 50/50 blend of fine aggregates, with a CAR force of 1700
lbs, the rut potential Blend #1 at 5.2, 5.7, and 6.7 percent asphalt content is 9.46, 11.88,
and 18.00 mm respectively. As shown on Figure 4.5, similar results were found for
Blend #2.

33
Table 4.2 Results of rutting potential tests with the APA
Blend #1. Limestone Coarse Aggregate
Asphalt Content
(%)
Limestone/Natural sand
Fine Aggregate
Avg. Rut Depth
(mm)
St. Dev.
5.2 100/0 7.25 1.67
75/25 7.46 1.08
50/50 9.46 1.48
25/75 9.75 0.87
0/100 15.75 2.73
5.7 100/0 7.50 1.43
75/25 9.42 1.58
50/50 11.88 2.15
25/75 12.67 1.70
0/100 16.38 3.35
6.7 100/0 14.58 4.25
75/25 16.50 2.00
50/50 18.00 2.39
25/75 21.54 2.63
0/100 23.17 2.08
Blend #2. Limestone/Dolomite (50/50) Coarse Aggregate
Asphalt Content
(%)
Limestone/Natural sand
Fine Aggregate
Avg. Rut Depth
(mm)
St. Dev
5.2 100/0 5.96 1.53
75/25 7.58 1.44
50/50 8.21 1.21
25/75 8.71 1.10
0/100 9.83 2.43
5.7 100/0 6.96 0.81
75/25 7.96 1.25
50/50 9.46 1.16
25/75 9.88 1.15
0/100 11.67 1.64
6.7 100/0 8.00 1.15
75/25 10.29 1.76
50/50 12.25 1.59
25/75 16.08 4.03
0/100 17.54 1.80

34
0
5
10
15
20
25
0 10 20 30 40 50 60 70 80 90 100
Percent Sand
Ru
t P
ote
nti
al (m
m)
Blend Design #1 (5.2% AC)
Blend Design #1 (5.7% AC)
Blend Design #1 (6.7% AC)
Blend Design #2 (5.2% AC)
Blend Design #2 (5.7% AC)
Blend Design #2 (6.7% AC)
Figure 4.3 Effect of asphalt content, blend types and percent sand on rutting potential
Fine Aggregate Limestone Percentage
0
5
10
15
20
25
0 500 1000 1500 2000 2500 3000
CAR
Ru
t P
ote
nti
al (m
m)
Blend Design #1 (5.2% AC)
Blend Design #1 (5.7% AC)
Blend Design #1 (6.7% AC)
0 25 50 75 10
Figure 4.4 Relationship between CAR force and rutting potential for Blend #1
35
Fine Aggregate Limestone Percentage
0
5
10
15
20
25
0 500 1000 1500 2000 2500 3000 3500 4000
CAR
Ru
t P
ote
nti
al (m
m)
Blend Design #2 (5.2% AC)
Blend Design #2 (5.7% AC)
Blend Design #2 (6.7% AC)
0 25 50 75 100
Figure 4.5 Relationship between CAR force and rutting potential for Blend #2
The strong correlation between the CAR force and rutting potential is
encouraging. However, it should be noted that the Georgia criterion for acceptable
rutting potential is 6 mm. Under this criterion, the only mix tested that meets the criteria
is Blend #2 with 5.2 percent asphalt and 100 percent limestone fine aggregate. Similar
criteria have not been developed for West Virginia. However, tests of Superpave 9.5 mm
materials from construction sites across the state indicate that the average rutting
potential is 6.3 mm. All of these samples used 100 percent limestone materials, so the
evaluation of rutting potential during this project is consistent with experience in the
state.
4.4 SUMMARY OF RESULTS
The CAR test demonstrated an ability to evaluate a meaningful characteristic of
fine aggregates. It is strongly correlated with rutting potential as evaluated by the asphalt
pavement analyzer. For all of the mixes evaluated, the CAR and APA results were
consistent with engineering expectations, i.e. increasing the natural sand content and
asphalt content increases the rutting potential of asphalt concrete.

36
CHAPTER 5 CONCLUSIONS AND RECOMMENDATIONS
5.1 CONCLUSIONS
This research project started while the CAR test was in the developmental stage.
The CAR tests performed during this project used material passing the 2.36 mm sieve,
blended to have the same proportion of materials on each sieve as is used in a mix design.
The current recommendation is to test all the material passing the 4.75 mm sieve (Jahn,
2003). The influence of how this change in testing protocol affects the results was not
evaluated during this research.
Overall, the repeatability of the CAR test was reasonable for the majority of the
results, with the coefficient of variation being less than 5 percent. However, the
coefficient of variation was more than 10 percent for three of the aggregate combinations.
In one case, for Blend #1 with 75 percent sand, there was an apparent outlier in the data.
The other two cases where the coefficient of variation was more than 10 percent occurred
for the 100 percent natural sand blends. The reason for the greater degree of variability
of the CAR force for the 100 percent sand was not investigated.
The CAR test was able to distinguish the two gradations evaluated during the
research, even though there was little difference in the percent of material retained on
each sieve as shown on Figure 3.1. This is an advantage over the fine aggregate
angularity procedure which uses a defined gradation during the test and is therefore
incapable of evaluating the effect of gradation.
Due to the loading limitations of the Marshall stabilometer, it was necessary to
use two methods for interpreting the test results. If the peak force on the sample is
reached during the test, then the CAR force is equal to the peak force. However, if the
sample's resistance to punching shear is greater than the test capability of the machine,
then the CAR force is determined as the force required to produce 0.25 in. of
deformation. For the aggregate blends evaluated, natural sand contents greater than 50
percent, had peak force that could be measured. At lower sand contents, the deformation-
37
based method for determining CAR force was required. This methodology could
potentially lead to inconsistent results.
Both the CAR and FAA test results correlated with the measured rutting potential
of the mixes. However, the CAR test was able to distinguish the effect of gradation,
which cannot be evaluated with the FAA test using the Superpave specified protocol.
It should be noted that the quality of fine aggregates is only one factor
contributing to the rutting potential of hot mix asphalt concrete. Test results from this
project demonstrate the influence of asphalt content. Other factors that contribute to
rutting potential include the characteristics and gradation of the coarse aggregates, the
voids in the total mix, the type or grade of asphalt cement, etc. While testing the
characteristics of fine aggregate may be valid for screening fine aggregates with respect
to their contribution to rutting potential, they cannot be used as the sole indicator of the
rutting potential of a mix.
A primary objective of this research was to assess the relationship between the
CAR test and rutting potential. Ideally, this information would provide insight for the
development of a specification for an acceptable limit for CAR results. However, the
rutting potential measured for the mixes included in this experiment were in excess of
what is generally considered as an acceptable value for rut resistance and mixes. Hence
the project did not provide information sought for the development of the specification
limit for the CAR test.
5.2 RECOMMENDATIONS
The CAR method is still under development and has not been adopted by any
highway agency as a means for screening fine aggregates for use in asphalt concrete.
Further research is needed to establish the validity of the method. However, the method
does produce a measure that is highly correlated with rutting potential. The CAR results
appear to have good repeatability, though the weaker mixes appear more sensitive to the
shear force. The inconsistent data may be the result of an unrefined experimental
procedure. The presentation at ICAR (2003) by David Jahn suggested a few
recommendations for reducing variances.

38
Monitor the Marshall hammer so that debris from the compacted
aggregate does not transport to the shaft and cause unwanted friction.
Keep the shaft well-lubricated before every test.
5.3 FURTHER RESEARCH
Although the CAR test demonstrated a strong correlation with rutting potential, it
should be noted that the CAR results were also well correlated with the FAA results and
the percent sand in the mix. This being the case, for the set of materials evaluated during
this research, similar results would have been obtained correlating rutting potential with
FAA or percent sand. This demonstrates a need to continue to evaluate and develop the
CAR test for a broader range of materials.
The issue of using a deformation cutoff criteria for aggregates with a high
resistance to punching shear should be resolved if the CAR method is to be used for more
than screening aggregates. The need for the deformation cutoff criteria is an artifact of
the desire to use a commonly available testing device in lieu of developing a machine
specifically for the task. Alternatives could include developing a more powerful
Marshall stabilometer, looking at different sample sizes, or possibly reducing the size of
the loading head used for the CAR test.
In order to develop limits for acceptable CAR test results, a more robust
relationship between CAR results and the rutting potential of a mix needs to be
established. The research presented herein demonstrates that a relationship exists, but the
data set was not adequate for defining a performance limit. More research is required,
especially with mixes that have low rutting potential, to establish limits for the CAR
results.

39
REFERENCES
1. Barker L.R., Materials Division, WVDOH, phone communications with
John Zaniewski, 2003.
2. Chowdury A., Button J.W., Kohale V., and D.W. Jahn, Evaluation of
Superpave Fine Aggregate Angularity Specification, Report No. 404011-
1, International Center for Aggregate Research, Austin, TX, 2001.
3. Harman T., D’Angelo J., and J. Bukowski, Superpave Asphalt
MixtureDesign. Workshop Version 8.0, Federal Highway Administration,
Washington D.C., January 2002.
4. Jahn D.W., Compacted Aggregate Resistance Test, Presentation at ICAR,
May 2003.
5. Jahn D.W., Product Development, Martin Marietta Technologies,
electronic mail communications with Sean Rafferty, 2004a.
6. Jahn D.W., Product Development, Martin Marietta Technologies, letter
to Sean Rafferty, 2004b.
7. Kandhal, P.S., Investigation of the Restricted Zone in the Superpave
Aggregate Gradation Specification, National Cooperative Highway
Research Program, NCAT Report No. 9-14, Auburn University, Auburn
AL, 1998.
8. Kandhal P.S., and L.A. Cooley, Evaluation of Permanent Deformation of
Asphalt Mixtures Using Loaded Wheel Tester, Association of Asphalt
Paving Technologists, March 2002.
9. Kandhal P.S., and R.B. Mallick, Evaluation of Asphalt Pavement
Analyzer for HMA Design, NCAT Report No. 99-4, June 1999.
10. Marek, C.M., White Paper on Fine Aggregate Angularity, Vulcan
Materials Company, Minneapolis, MN, August, 2002.
11. Mohammad L.N., Wu Z., Wang L., and C. Abadie, A Rut Susceptibility
Study of Superpave Asphalt Mixtures, Louisiana Transportation Research
Center, Baton Rouge, LA, May 2002.
12. Purcell E.M., and S.A. Cross, Effects of Aggregate Angularity on VMA
and Rutting of KDOT Superpave Level I Mixes, Kansas Department of
Transportation, Topeka, KN, May 2001.

40
13. Roberts F.L., Kandhal P.S., Brown E.R., Lee D., and T.W. Kennedy, Hot
Mix Asphalt Materials, Mixture Design, and Construction, NAPA
Education Foundation, Lanham, MD, 1996.
14. Roque R., Evaluation of SuperpaveTM Criteria for VMA and Fine
Aggregate Angularity, Department of Civil and Coastal Engineering,
University of Florida, Gainesville, Fl, March 2002.
15. Skok E.L., Turk A., and E. Johnson, Asphalt Pavement Analyzer (APA)
Evaluation, Minnesota Department of Transportation, St. Paul, MN,
September 2002.
16. Stakston A.D., Hussain B.U., and J.J. Bushek, Effect of Fine Aggregate
Angularity on Compaction and Shearing Resistance of Asphalt Mixtures,
Transportation Research Record 1789, pp. 14-22, 2002.
17. White T., Effects of Fine Aggregate Angularity on Asphalt Mixture
Performance, INDOT Project Number SPR – 2153, Purdue University,
IN, December 1998.
18. Zaniewski J.P., and Hughes, Inter Laboratory Variability of the Marshall
Test Method for Asphalt Concrete, WVDOH RP #137, West Virginia
University, Morgantown, WV, 2003.
19. Zaniewski J. P., V. Kanneganti, Comparison of 19 mm Superpave and
Marshall Base II Mixes in West Virginia, WVDOH Report, West
Virginia University, Morgantown, WV, 2003.
20. Zaniewski J. P., and S.H. Nallamothu, Evaluation of Binder Grades on
Rutting Performance, WVDOH Report, West Virginia University,
Morgantown, WV, 2003.
21. Zaniewski J.P., and J. Nelson, Comparison of 9.5mm Superpave and
Marshall Wearing I Mixes in West Virginia, WVDOH Report, West
Virginia University, Morgantown, WV, 2003.
Specifications and Test Methods
1. Plastic Fines in Graded Aggregates and Soils by Use of the Sand
Equivalent Test. AASHTO T176, 2000.
2. Uncompacted Void Content of Fine Aggregate, AASHTO T304 (ASTM
C-1252), 1996.
3. Test Method for Determining the Percentage of Fractured Particles in
Coarse Aggregate, ASTM D5821, 1995.

41
4. Test Method for Determining Flat or Elongated Particles in Coarse
Aggregate, ASTM D4791, 1999.
5. Specification for Superpave Volumetric Mix Design, AASTHO MP2,
2001.
6. West Virginia Division of Highways Standard Specifications, Charleston,
West Virginia, 2000.
7. Test Method for Determining Direct Shear Resistance, ASTM D3080.
8. Resistance to Plastic Flow of Bituminous Mixtures Using Marshall
Apparatus. AASHTO T245. 1993.
9. Sieve Analysis, ASTM C136, 1984.
10. Bulk Specific Gravity of Compacted Bituminous Mixtures Using
Saturated Surface-Dry Specimens, AASHTO T166, 2000.
11. Theoretical Maximum Specific Gravity and Density of Bituminous
Paving Mixtures, AASHTO T209, 1999.

42
APPENDIX A
WVDOH MIX DESIGNS
Figrue C.1 Marshall mix design used for initial trials

43
Figrue C.2 Superpave mix design used for initial trials

44
APPENDIX B
CAR TESTING PROCEDURE
This test method was prepared by David Jahn (2003) and is presented here to
document the procedures followed during this research.
This procedure is intended for use on the combined fine aggregate materials to be
used in the paving mixture. The performance of individual components can be judged
provided common sense is used. For example, a component with a high fines content
may have good shear resistance but could not represent 100% of the fine aggregate
portion of the mix. Some “high fines” materials will exhibit very high shear values.
Equipment Needed
Marshall mold with base-plate attached (welded or secured in a permanent manner),
Marshall mold collar,
Marshall Compaction Hammer,
Mixing bowl and utensils,
Riffle Splitter, Screen Shaker,
2.36mm (No 8) Sieve,
Drying Oven,
Balance (at least 8,000 gram capacity accurate to 0.1 gram),
Marshall Stability and Flow Machine with Graph Recorder (5,000lb. Graph Paper),
Loading head, 1.5 inch diameter X 1.5 inch high steel round stock (top and bottom
are flat), mounted to the frame used for split tensile testing.
Procedure
Secure a representative 5,000-6,000 gram sample by riffle splitting. Splitting
should be performed at or near SSD (Saturated- Surface Dry) condition to prevent loss of
fines.
Sieve this portion to refusal over a 2.36 mm (No. 8) screen, again, at or near SSD
to prevent the loss of fines. A Gilson 2’ X 3’ screen shaker is recommended. Discard the
material retained on the 2.36mm (No. 8) sieve1.
Oven dry the material finer than the 2.36 mm (No. 8) sieve to a constant weight at
110 ± 5°C (230 ± 10°F)
Remove from oven and cool the material to ambient temperature.
Weigh the material to the nearest 0.1 gram.
1 Recently, this requirement has been altered to include all material passing the 4.75 mm sieve.

45
Add 1.75% water by dry weight of the sample and mix thoroughly.2
Reduce material by riffle splitting or quartering to approximately 1,100 grams as
quickly as possible to reduce moisture loss. Record this weight. Remaining prepared
material may be used within one hour if kept in a sealed container. Secondary absorption
after a period of time may require that the drying procedure be repeated.
Cover the Marshall compaction hammer striking face with cellophane (Saran
Wrap) held in place with a rubber band or aluminum foil. This will prevent particles
from adhering to the striking face surface and will produce a smooth bearing surface on
the compacted specimen.
Place material in 4-inch diameter Marshall mold meeting the requirements of
ASTM D 1559. Spade the material with a spatula 15 times around the perimeter and 10
times over the interior. Remove the collar and smooth the surface with the spatula to a
slightly rounded shape.
Replace collar and place mold assembly with specimen on the compaction
pedestal. Compact specimen using 50 blows from the Marshall hammer. Unlike the
Marshall method only one surface of the specimen is to be compacted.
After compaction carefully remove mold assembly from compaction pedestal.
Remove collar and measure distance from top of mold to top of specimen. Calculate
specimen height. The specimen should be 6.35 ± 0.318 cm (2.5 ± 0.125 inches) in
height. If specimen does not meet height requirements, discard compacted specimen (use
of Marshall stability correction factors has not been verified). Compact a new specimen
using remaining prepared material adjusting the amount required to achieve a specimen
height of 6.35 cm (2.5 inches) using the following formula:
inches)in obtainedheight specimen (Actual
used) aggregate of weight X (2.5 aggregate of weight Adjusted
Place compacted sample, with base plate and mold still in the upright, vertical
position (compacted face up) along with appropriate spacers (to minimize travel) on the
Marshall Stability and Flow machine. Place 1.5-inch diameter x 1.5-inch high steel
round stock (flat top and bottom) on the center of the compacted specimen and align
vertically under the load cell.
Operate Stability and Flow apparatus at 2 inches travel per minute, recording
results on 5,000lb scale paper and plot Shear Resistance vs. Penetration (stability vs.
flow) on the graph paper. Carry the penetration to 10% of the compacted specimen
thickness (flow value of 25).
Some fine aggregate materials develop high Shear Resistance values and may
therefore damage load cells. The test should be terminated before damage occurs.
2 The moisture content for the samples has been increased to 3.5 percent, which is the value used
for the samples prepared and tested during this research.

46
APPENDIX C
CAR TEST OUTPUT
0
500
1000
1500
2000
2500
3000
3500
4000
4500
0 5 10 15 20 25 30
Deformation (0.01 Inch Units)
CA
R (
lbs
)
Trial 1
Trial 2
Trial 3
Trial 4
Trial 5
Trial 6
Figure C.1 Blend #1 CAR results for 100% limestone
0
500
1000
1500
2000
2500
3000
3500
4000
4500
0 5 10 15 20 25 30Deformation (0.01 Inch Units)
CA
R (
lsb
)
Trial 1
Trial 2
Trial 3
Trial 4
Trial 5
Series7
Figure C.2 Blend #1 CAR results for 75% limestone/ 25% natural sand

47
0
500
1000
1500
2000
2500
3000
3500
4000
4500
0 5 10 15 20 25 30
Deformation (0.01 Inch Units)
CA
R (
lbs
)
Trial 1
Trial 2
Trial 3
Trial 4
Trial 5
Trial 6
Figure C.3 Blend #1 CAR results for 50% limestone/ 50% natural sand
0
500
1000
1500
2000
2500
3000
3500
4000
4500
0 5 10 15 20 25 30
Deformation (0.01 Inches)
CA
R (
lbs
)
Trial 1
Trial 2
Trial 3
Trial 4
Trial 5
Trial 6

48
Figure C.4 Blend #1 CAR results for 25% limestone/ 75% natural sand
0
500
1000
1500
2000
2500
3000
3500
4000
4500
0 5 10 15 20 25 30
Deformation (0.01 inches)
CA
R (
lbs
)
Trial 1
Trial 2
Trial 3
Trial 4
Trial 5
Trial 6
Figure C.5 Blend #1 CAR results for 100% natural sand

49
0
500
1000
1500
2000
2500
3000
3500
4000
4500
0 5 10 15 20 25 30
Deformation (0.01 Inches)
CA
R (
lbs
)
Trial 1
Trial 2
Trial 3
Trial 4
Trial 5
Trial 6
Figure C.6 Blend #2 CAR results for 100% limestone
0
500
1000
1500
2000
2500
3000
3500
4000
4500
0 5 10 15 20 25 30
Deformation (0.01 Inches)
CA
R (
lbs)
Trial 1
Trial 2
Trial 3
Trial 4
Trial 5
Trial 6
Figure C.7 Blend #2 CAR results for 75% limestone/ 25% natural sand

50
0
500
1000
1500
2000
2500
3000
3500
4000
4500
0 5 10 15 20 25 30
Deformation (0.01 Inches)
CA
R (
lbs)
Trial 1
Trial 2
Trial 3
Trial 4
Trial 5
Trial 6
Figure C.8 Blend #2 CAR results for 50% limestone/ 50% natural sand
0
500
1000
1500
2000
2500
3000
3500
4000
4500
0 5 10 15 20 25 30
Flow (0.01 Inches)
CA
R (
lbs)
Trial 1
Trial 2
Trial 3
Trial 4
Trial 5
Trial 6
Figure C.9 Blend #2 CAR results for 25% limestone/ 75% natural sand

51
0
500
1000
1500
2000
2500
3000
3500
4000
4500
0 5 10 15 20 25 30Deformation (0.01 Inches)
CA
R (
lbs
)
Trial 1
Trial 2
Trial 3
Trial 4
Trial 5
Trial 6
Figure C.10 Blend #2 CAR results for 100% natural sand

52
APPENDIX D
RUT DEPTH RESULTS
Table D.1 Rut Depth Data
Mix Design #1 (5.2% AC)
Limestone Coarse Aggregate APA Rut Depths
Limestone/River Stone Fine Aggregate AC Pill 1 Pill 2 Pill 3 Pill 4 Pill 5 Pill 6
100/0 5.2 8 8 8 7.5 7 6.5 5.5 4 6.5 6.5 9 10.5
75/25 5.2 8 8 8.5 6 7.5 8 7 5.5 9 8.5 7 6.5
50/50 5.2 11.5 11.5 11 9 11 9 8 7.5 10 8 9 8
25/75 5.2 11 10 9 9 10 10 10 8 10 11 9 10
0/100 5.2 15 18 12 15 12 14 15 13 19 19 19 18
Mix Design #1 (5.7% AC)
Limestone Coarse Aggregate APA Rut Depths
Limestone/River Stone Fine
Aggregate AC Pill 1 Pill 2 Pill 3 Pill 4 Pill 5 Pill 6
100/0 5.7 9 10 9.5 7.5 7.5 6 5 6.5 7 7 7.5 7.5
75/25 5.7 10.5 10 11 8 7 8 8 8 12 10 9.5 11
50/50 5.7 9.5 10.5 13 9 12 11.5 10 10 16 14 13.5 13.
5
25/75 5.7 13 14 12.5 12 12.5 13 9 10 13 14.5 14 14.5
0/100 5.7 16 17 17.5 15 15 14 11 11 21 19 20 20
Mix Design #1 (6.2% AC)
Limestone Coarse Aggregate APA Rut Depths
Limestone/River Stone Fine
Aggregate AC Pill 1 Pill 2 Pill 3 Pill 4 Pill 5 Pill 6
100/0 6.2 9.5 11.5 13 13 11.5 12 13 12.5 17.5 17.5 20 24
75/25 6.2 18.5 19 19 17 13 15.5 15 13.5 16 16.5 18 17
50/50 6.2 17.5 17.5 15 17 15 18 17 15.5 19.5 21 22 21
25/75 6.2 20 21.5 24 20 20.5 22 19 16.5 22 25 26 22
0/100 6.2 22.5 26 22.5 24 21 22.5 21.5 20 22 24 27 25
Mix Design #2 (5.2% AC)
Limestone/Dolomite Coarse Aggregate (50/50) APA Rut Depths
Limestone/River Stone Fine Aggregate AC Pill 1 Pill 2 Pill 3 Pill 4 Pill 5 Pill 6
100/0 5.2 8 9 6 5.5 7 4 4 7 5 5.5 5.5 5
75/25 5.2 10 8 8 6 8 6 6 8 8 7 10 6
50/50 5.2 11 8 9.5 8 8 7 6.5 9 8.5 8 7 8
25/75 5.2 9 11 8.5 8 9 8 9 7.5 8 10.5 7.5 8.5
0/100 5.2 12 11 9.5 7.5 9 8 8 7 14 14 10 8

53
Mix Design #2 (5.7% AC)
Limestone/Dolomite Coarse Aggregate (50/50) APA Rut Depths
Limestone/River Stone Fine
Aggregate AC Pill 1 Pill 2 Pill 3 Pill 4 Pill 5 Pill 6
100/0 5.7 6.5 6 8 6 7.5 7.5 7 7 7.5 8 7 5.5
75/25 5.7 9.5 8 9 8 10 7.5 6.5 7.5 8 9 6.5 6
50/50 5.7 9 10 10 9.5 10 8 8 10 8 9 12 10
25/75 5.7 9.5 9.5 10.5 10 10.5 8.5 8.5 10.5 8.5 9.5 12.5 10.5
0/100 5.7 12.5 12.5 10 10 10.5 10 11 10.5 12 14 15 12
Mix Design #2 (6.2% AC)
Limestone/Dolomite Coarse
Aggregate (50/50) APA Rut Depths
Limestone/River Stone Fine Aggregate AC Pill 1 Pill 2 Pill 3 Pill 4 Pill 5 Pill 6
100/0 6.2 10 7 9 7 7 7.5 8 8.5 8 9 9 6
75/25 6.2 8 8 12.5 12.5 10 10 9.5 7.5 11 12 11.5 11
50/50 6.2 13 12 13 12.5 13 13 9 11 14 14.5 12 10
25/75 6.2 10 9 16 14.5 17.5 16 15.5 14 22 22 17 19.5
0/100 6.2 19.5 18 18 16.5 16.5 19 19 16.5 19 18.5 17 13

54
APPENDIX E
VOLUMETRIC RESULTS
Asphalt Content
% Blend Fine agg % Limestone Gsb Pill
Rice Bulk
Dry Wgt
Sub Wgt Bowl Gmm
Dry Wgt.
Sub Wgt
SSD Wgt Gmb VTM VMA VFA
Avg VTM
Avg VMA
Avg VFA
5.2
1
100 2.623 1 2381.6 2625.0 1330.0 2.500 4706.5 2750.8 4716.2 2.395 4.2 13.4 68.7 3.80 13.10 71.05
2 4750.0 2789.8 4757.5 2.414 3.4 12.8 73.4
75 2.590 1 2138.0 2790.8 1508.9 2.497 4721.6 2761.4 4732.7 2.395 4.1 12.3 66.7 3.65 11.90 69.45
2 4769.4 2803.6 4776.6 2.417 3.2 11.5 72.2
50 2.557 1 2172.4 2630.7 1330.0 2.492 4775.5 2792.9 4783.6 2.399 3.7 11.1 66.7 3.95 11.30 65.10
2 4759.0 2774.3 4768.4 2.387 4.2 11.5 63.5
25 2.524 1 2181.4 2812.2 1508.9 2.484 4777.2 2789.1 4783.9 2.395 3.6 10 64 3.85 10.30 62.65
2 4740.5 2757.2 4748.2 2.381 4.1 10.6 61.3
0 2.491 1 2154.8 2599.7 1330.0 2.435 4772.6 2779.7 4779.6 2.386 2 9.2 78.3 2.10 9.25 77.30
2 4757.9 2767.4 4765.0 2.382 2.2 9.3 76.3
2
100 2.619 1 2197.4 2651.5 1330.0 2.509 4795.6 2769.7 4818.3 2.341 6.7 15.2 55.9 6.90 15.40 55.20
2 4769.1 2746.3 4791.3 2.332 7.1 15.6 54.5
75 2.589 1 2185.3 2820.7 1508.9 2.502 4770.2 2748.3 4792.0 2.334 6.7 14.6 54.1 6.75 14.65 53.90
2 4779.0 2751.4 4802.0 2.331 6.8 14.7 53.7
50 2.560 1 2186.4 2642.2 1330.0 2.501 4784.7 2753.2 4805.3 2.332 6.8 13.7 50.4 8.10 14.90 46.00
2 4704.4 2669.1 4744.4 2.267 9.4 16.1 41.6
25 2.531 1 1193.4 2223.7 1508.9 2.494 4750.0 2701.2 4775.8 2.290 8.2 14.2 42.3 8.05 14.05 42.75
2 4769.2 2718.8 4793.8 2.298 7.9 13.9 43.2
0 2.502 1 2172.9 2630.8 1330.0 2.492 4771.4 2715.2 4797.4 2.292 8 13.2 39.4 8.20 13.35 38.60
2 4760.3 2711.7 4797.1 2.283 8.4 13.5 37.8

55
Asphalt Content
% Blend
Fine agg %
Limestone Gsb Pill
Rice Bulk
Dry
Wgt
Sub
Wgt Bowl Gmm Dry
Wgt.
Sub
Wgt
SSD
Wgt Gmb VTM VMA VFA Avg
VTM
Avg
VMA
Avg
VFA
5.7
1
100 2.623 1 2160.2 2620.0 1330.0 2.482 4703.9 2757.5 4715.8 2.402 3.2 13.2 75.8 2.95 12.95 77.25
2 4700.7 2765.8 4711.1 2.416 2.7 12.7 78.7
75 2.590 1 2147.2 2787.4 1508.9 2.472 4715.5 2781.4 4721.6 2.430 1.7 11.1 84.7 2.05 11.40 82.10
2 4671.9 2744.5 4681.3 2.412 2.4 11.7 79.5
50 2.557 1 2088.6 2574.2 1330.0 2.473 4691.7 2750.8 4700.5 2.406 2.7 10.8 75 2.40 10.50 77.20
2 4722.5 2778.6 4729.6 2.421 2.1 10.2 79.4
25 2.524 1 2155.6 2793.0 1508.9 2.473 4736.0 2754.2 4744.1 2.380 3.8 10.6 64.2 3.75 10.60 64.65
2 4745.4 2757.8 4751.1 2.381 3.7 10.6 65.1
0 2.491 1 2195.4 2633.9 1330.0 2.463 4714.3 2738.5 4720.3 2.379 3.4 9.5 64.2 3.45 9.50 63.70
2 4743.1 2754.1 4749.4 2.377 3.5 9.5 63.2
2
100 2.619 1 1191.9 2042.1 1330.0 2.484 4770.2 2739.2 4792.8 2.323 6.5 15.9 59.1 5.90 15.40 61.75
2 4775.4 2757.7 4787.8 2.352 5.3 14.9 64.4
75 2.589 1 1188.4 2217.9 1508.9 2.479 4766.6 2741.5 4783.1 2.335 5.8 14.5 60 5.95 14.60 59.25
2 4741.5 2724.8 4760.6 2.329 6.1 14.7 58.5
50 2.560 1 1177.1 2033.3 1330.0 2.484 4760.2 2735.5 4775.6 2.333 6.1 13.6 55.1 6.50 14.00 53.60
2 4763.3 2727.1 4787.5 2.312 6.9 14.4 52.1
25 2.531 1 1184.5 2215.7 1508.9 2.480 4757.6 2710.4 4778.8 2.300 7.3 13.9 47.5 7.50 14.10 46.85
2 4719.4 2679.6 4741.5 2.289 7.7 14.3 46.2
0 2.502 1 1183.5 2036.0 1330.0 2.479 4768.8 2718.6 4784.7 2.308 6.9 12.6 45.2 7.05 12.70 44.50
2 4775.4 2719.9 4795.2 2.301 7.2 12.8 43.8

56
Asphalt Content
% Blend Fine agg %
Limestone Gsb Pill
Rice Bulk
Dry
Wgt
Sub
Wgt Bowl Gmm Dry
Wgt.
Sub
Wgt
SSD
Wgt Gmb VTM VMA VFA Avg
VTM
Avg
VMA
Avg
VFA
6.7
1
100 2.623 1 2151.0 2777.8 1508.9 2.438 4635.8 2720.8 4640.7 2.415 0.9 12.7 92.9 0.80 12.60 93.65
2 4684.4 2752.9 4688.9 2.420 0.7 12.5 94.4
75 2.590 1 2153.1 2600.1 1330.0 2.438 4656.5 2730.2 4662.4 2.410 1.1 11.8 90.7 1.10 11.80 90.70
2 4672.1 2738.2 4677.2 2.410 1.1 11.8 90.7
50 2.557 1 2165.6 2787.1 1508.9 2.440 4680.7 2704.8 4686.0 2.363 3.2 12.4 74.2 2.00 11.30 83.20
2 4646.8 2732.7 4652.0 2.421 0.8 10.2 92.2
25 2.524 1 2182.2 2615.5 1330.0 2.434 4708.5 2758.5 4713.4 2.409 1 9.5 89.5 1.15 9.60 88.05
2 4673.7 2735.0 4679.7 2.403 1.3 9.7 86.6
0 2.491 1 2171.6 2787.1 1508.9 2.431 4691.8 2748.1 4696.6 2.408 0.9 8.3 89.2 0.95 8.35 88.65
2 4673.0 2736.6 4678.1 2.407 1 8.4 88.1
2
100 2.619 1 1179.2 2206.0 1508.9 2.446 4754.3 2743.0 4767.9 2.348 4 15 73.3 3.90 14.90 73.80
2 4757.4 2748.1 4770.1 2.353 3.8 14.8 74.3
75 2.589 1 1197.4 2036.5 1330.0 2.439 4755.3 2743.1 4767.0 2.350 3.6 14 74.3 3.70 14.05 73.65
2 4752.1 2740.0 4765.2 2.346 3.8 14.1 73
50 2.560 1 1184.8 2208.2 1508.9 2.440 4758.7 2747.5 4766.1 2.357 3.4 12.7 73.2 3.40 12.70 73.20
2 4747.7 2738.2 4752.2 2.357 3.4 12.7 73.2
25 2.531 1 1189.0 2030.9 1330.0 2.436 4753.5 2735.1 4763.5 2.343 3.8 12.2 68.9 3.70 12.10 69.45
2 4764.5 2746.2 4774.4 2.349 3.6 12 70
0 2.502 1 1184.8 2207.3 1508.9 2.436 4747.0 2724.6 4757.2 2.335 4.1 11.5 64.3 3.95 11.35 65.20
2 4766.0 2743.2 4777.2 2.343 3.8 11.2 66.1