EVALUATION OF THE BARTON SPRINGS/EDWARDS AQUIFER CONSERVATION DISTRICT’S 1991 DROUGHT RULE...
26
EVALUATION OF THE BARTON SPRINGS/EDWARDS AQUIFER CONSERVATION DISTRICT’S 1991 DROUGHT RULE TRIGGERS prepared for the BARTON SPRINGS/EDWARDS AQUIFER CONSERVATION DISTRICT AUSTIN, TEXAS by RONALD G. FIESELER BARTON SPRINGS/EDWARDS AQUIFER CONSERVATION DISTRICT AUSTIN, TEXAS & DONALD G. RAUSCHUBER & ASSOCIATES, INC. AUSTIN, TEXAS MARCH 2001
-
Upload
ashlie-page -
Category
Documents
-
view
218 -
download
0
Transcript of EVALUATION OF THE BARTON SPRINGS/EDWARDS AQUIFER CONSERVATION DISTRICT’S 1991 DROUGHT RULE...
EVALUATION OF THE BARTON SPRINGS/EDWARDS AQUIFER CONSERVATION DISTRICT’S 1991
DROUGHT RULE TRIGGERS
prepared for the
BARTON SPRINGS/EDWARDS AQUIFER CONSERVATION DISTRICT
AUSTIN, TEXAS
by
RONALD G. FIESELERBARTON SPRINGS/EDWARDS AQUIFER CONSERVATION
DISTRICTAUSTIN, TEXAS
&
DONALD G. RAUSCHUBER & ASSOCIATES, INC.AUSTIN, TEXAS
MARCH 2001
INTRODUCTION
1988 - An early task of the Barton Springs/Edwards Aquifer Conservation District (District) was to accumulate historical ground water levels and develop new water level data whenever possible to provide a basis for the development of aquifer management plans and policies.
The District obtained historical water level data going back 50 years or more.
The District wanted to use water levels as a reference in determining the severity of drought.
1990 - The District contracted with Donald G. Rauschuber and Associates (DGRA) to develop a District Regional Water Plan, which included recommending a drought management plan for Board of Directors adoption.
DGRA recommended five monitor wells with specific water elevation levels or “triggers” which the District could use to designate drought conditions.
BSEACD MONITOR WELLS
Mountain City (a.k.a., Negley Well): Well No. 58-57-903
Buda: Well No. 58-58-101
San Leanna (a.k.a, Dowell Well): Well No. 58-50-801
South Austin (a.k.a., Lovelady Well): Well No. 58-50-301
Barton Springs: Well No. 58-42-903
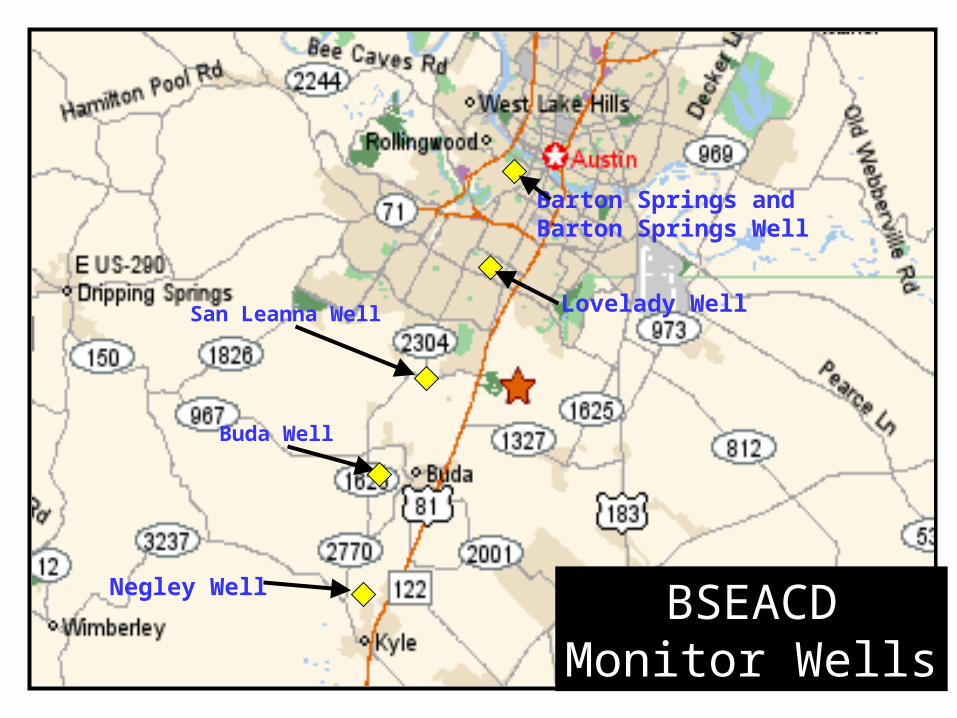
Negley Well
Lovelady Well
Barton Springs andBarton Springs Well
Buda Well
San Leanna Well
BSEACDMonitor Wells
BSEACD DROUGHT MANAGEMENT RULES
In 1991, the District adopted Drought Rules for the purpose of achieving the following goals and objectives:
Assure the availability of an adequate quantity of water
Assure the availability of a suitable quality of water
Assure that Barton Springs flow does not fall appreciably below historic low levels.
To accomplish these goals, the District instituted rules and policies that promote voluntary and mandatory water conservation based on “trigger” water levels in five monitoring wells.
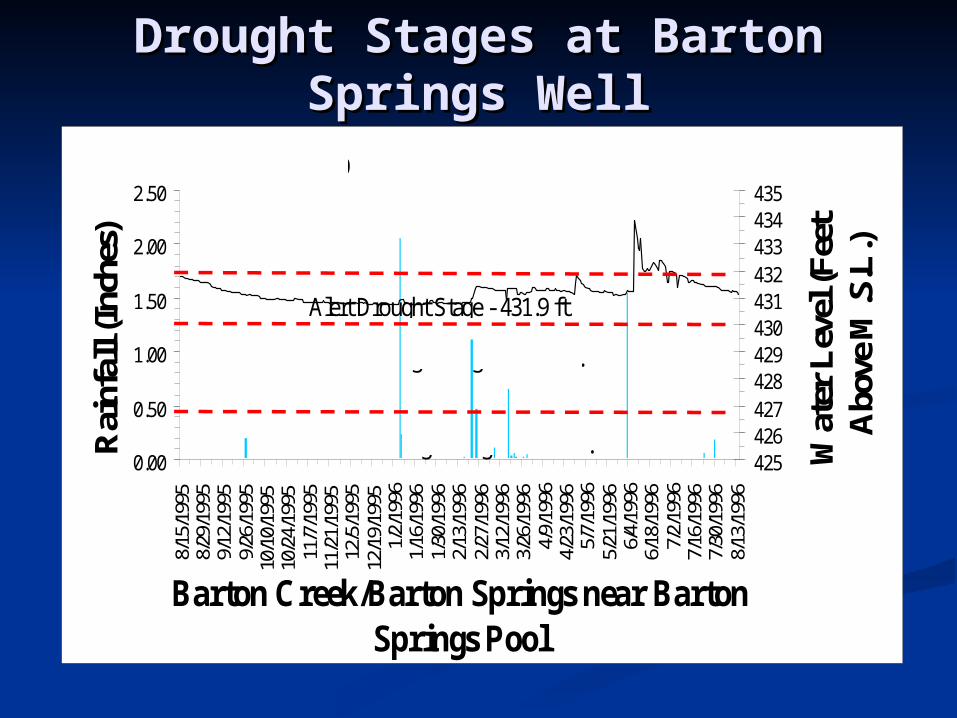
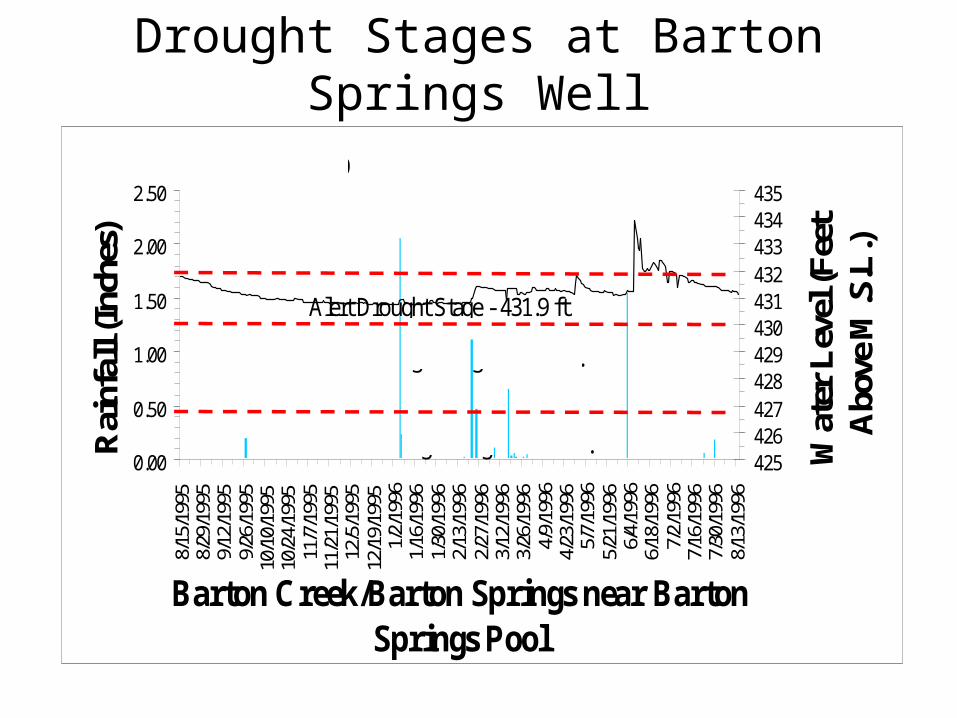
Drought Stages at Barton Drought Stages at Barton Springs WellSprings Well
0.00
0.50
1.00
1.50
2.00
2.508/
15/1
995
8/29
/199
59/
12/1
995
9/26
/199
510
/10/
1995
10/2
4/19
9511
/7/1
995
11/2
1/19
9512
/5/1
995
12/1
9/19
951/
2/19
961/
16/1
996
1/30
/199
62/
13/1
996
2/27
/199
63/
12/1
996
3/26
/199
64/
9/19
964/
23/1
996
5/7/
1996
5/21
/199
66/
4/19
966/
18/1
996
7/2/
1996
7/16
/199
67/
30/1
996
8/13
/199
6
Barton Creek/Barton Springs near Barton Springs Pool
Rai
nfal
l (In
ches
)
425426427428429430431432433434435
Wat
er L
evel
(Fee
t A
bove
M.S
.L.)
Alert Drought Stage - 431.9 ft.
Alarm Drought Stage - 430.0 ft.
Critical Drought Stage - 426.7 ft.
431.15 on 8/16/00431.79 on 8/16/99
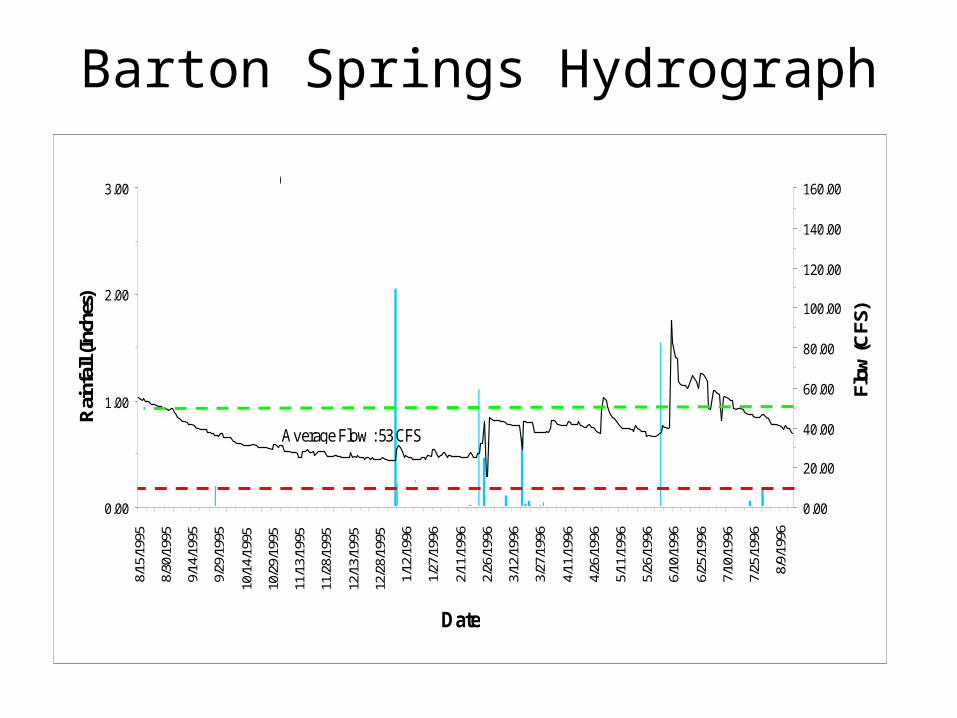
Barton Springs Hydrograph
0.00
1.00
2.00
3.00
8/15
/199
5
8/30
/199
5
9/14
/199
5
9/29
/199
5
10/1
4/19
95
10/2
9/19
95
11/1
3/19
95
11/2
8/19
95
12/1
3/19
95
12/2
8/19
95
1/12
/199
6
1/27
/199
6
2/11
/199
6
2/26
/199
6
3/12
/199
6
3/27
/199
6
4/11
/199
6
4/26
/199
6
5/11
/199
6
5/26
/199
6
6/10
/199
6
6/25
/199
6
7/10
/199
6
7/25
/199
6
8/9/
1996
Date
Rai
nfal
l (In
ches
)
0.00
20.00
40.00
60.00
80.00
100.00
120.00
140.00
160.00
Flow
(CFS
)
Average Flow : 53 CFS
1956 Drought : 9.6 CFS
37.19 on 8/16/0054.50 on 8/16/99
NEED FOR RE-EVALUATION
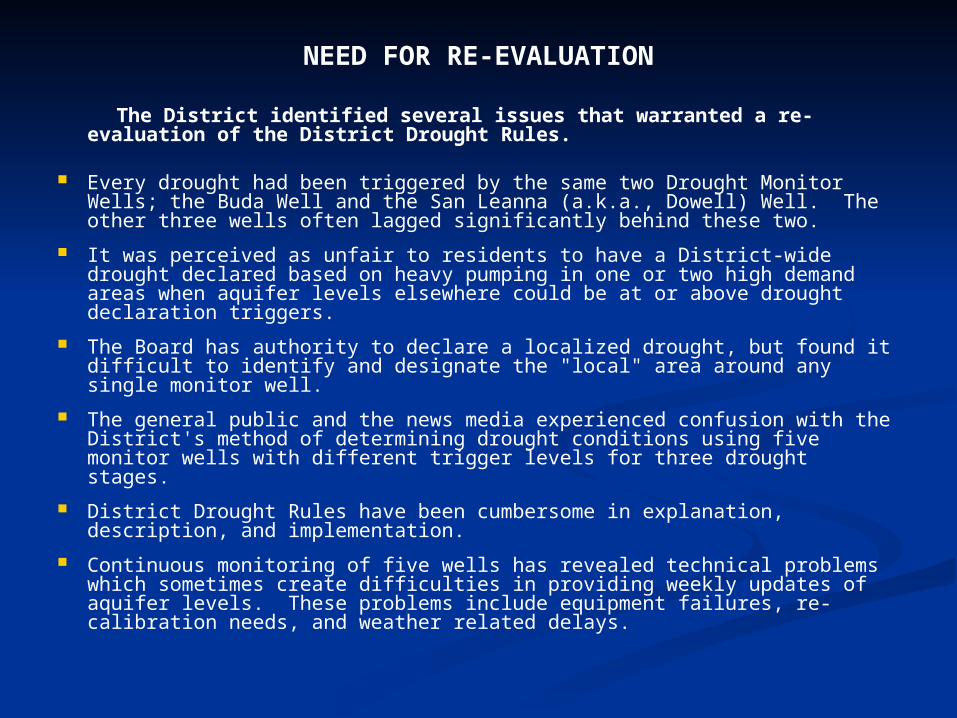
The District identified several issues that warranted a re-evaluation of the District Drought Rules.
Every drought had been triggered by the same two Drought Monitor Wells; the Buda Well and the San Leanna (a.k.a., Dowell) Well. The other three wells often lagged significantly behind these two.
It was perceived as unfair to residents to have a District-wide drought declared based on heavy pumping in one or two high demand areas when aquifer levels elsewhere could be at or above drought declaration triggers.
The Board has authority to declare a localized drought, but found it difficult to identify and designate the "local" area around any single monitor well.
The general public and the news media experienced confusion with the District's method of determining drought conditions using five monitor wells with different trigger levels for three drought stages.
District Drought Rules have been cumbersome in explanation, description, and implementation.
Continuous monitoring of five wells has revealed technical problems which sometimes create difficulties in providing weekly updates of aquifer levels. These problems include equipment failures, re-calibration needs, and weather related delays.
Drought Stages at Barton Springs Well
0.00
0.50
1.00
1.50
2.00
2.508/
15/1
995
8/29
/199
59/
12/1
995
9/26
/199
510
/10/
1995
10/2
4/19
9511
/7/1
995
11/2
1/19
9512
/5/1
995
12/1
9/19
951/
2/19
961/
16/1
996
1/30
/199
62/
13/1
996
2/27
/199
63/
12/1
996
3/26
/199
64/
9/19
964/
23/1
996
5/7/
1996
5/21
/199
66/
4/19
966/
18/1
996
7/2/
1996
7/16
/199
67/
30/1
996
8/13
/199
6
Barton Creek/Barton Springs near Barton Springs Pool
Rai
nfal
l (In
ches
)
425426427428429430431432433434435
Wat
er L
evel
(Fee
t A
bove
M.S
.L.)
Alert Drought Stage - 431.9 ft.
Alarm Drought Stage - 430.0 ft.
Critical Drought Stage - 426.7 ft.
431.15 on 8/16/00431.79 on 8/16/99
The District determined that the Drought Rules needed attention in three areas.
A review of the 1989-1990 analyses of water level data and the associated Rules.
(This analysis found that the previous analyses, recommendations, and subsequently adopted Drought Rules were still supported by the historical data.)
Analyze the aquifer level data obtained during the last 10 years, compare the results with the previous data, and determine what modifications, if any, might be necessary to the Drought Rule.
(This analysis found that recent data supported the historical data and in and of itself would not warrant Drought Rule revisions.)
Investigate alternative methods of drought determination and identifying affected areas.
(This became the primary line of investigation.)
Alternative Approaches to Drought Stage Determination Suggested for Evaluation
A "bull’s-eye" approach – concentric rings around each monitor well
A “polygon” approach – irregularly shaped areas around each monitor well based on geology, topography, geography, well clustering, demand centers, etc.
Aquifer segmentation – divide the aquifer into multiple areas based on geology, topography, geography, well clustering, demand centers, etc.
A single indicator well (similar to the EAA’s J-17 Monitor Well) – develop rational, scientifically valid, and functional reasons for using a single well on a District-wide basis, and attempt to identify a well that would meet the necessary criteria
COMMON PARAMETERS, PROBLEMS, AND ISSUES
A review of local and area-wide geology revealed a myriad of faults and fault blocks that makes it very difficult to divide into segments or areas. Similarly, segmentation of the aquifer by surface features was found to be more subjective than objective, and was more intuitive than science-based.
The distribution of water wells was reviewed. Particular attention was paid to clusters of large volume wells and major pumping centers. The Buda and the San Leanna areas were most obvious and clearly demonstrated local cones of depression in aquifer levels. An attempt was made to determine the extent of these two cones of depression and perhaps determine an area subject to localized drought. This approach was abandoned due to lack of data and inability to accurately project direction or areas of potential drawdown.
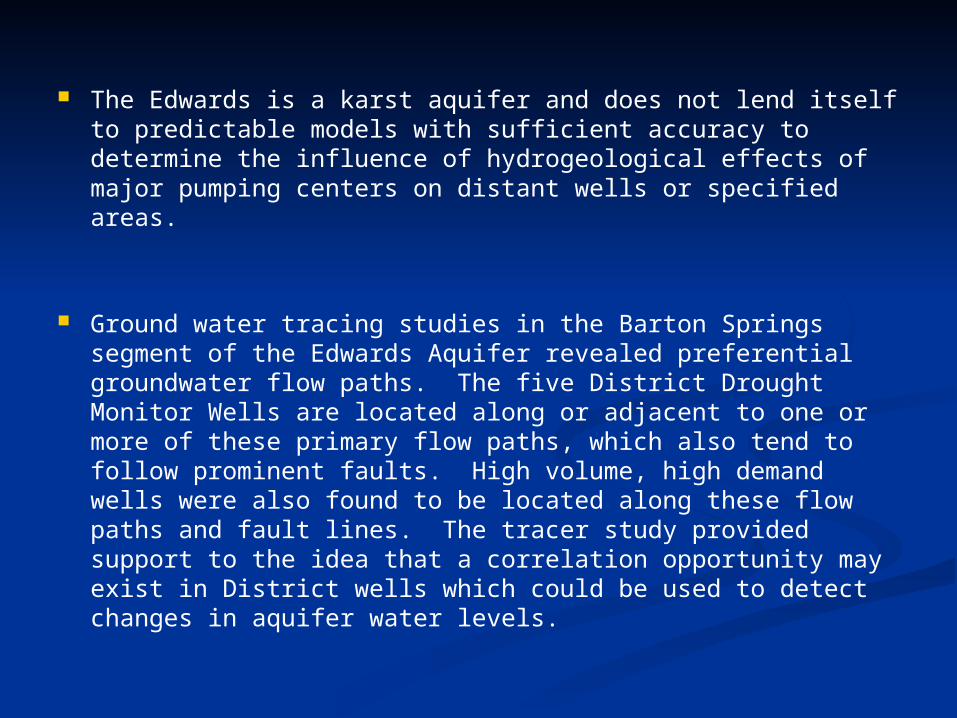
The Edwards is a karst aquifer and does not lend itself to predictable models with sufficient accuracy to determine the influence of hydrogeological effects of major pumping centers on distant wells or specified areas.
Ground water tracing studies in the Barton Springs segment of the Edwards Aquifer revealed preferential groundwater flow paths. The five District Drought Monitor Wells are located along or adjacent to one or more of these primary flow paths, which also tend to follow prominent faults. High volume, high demand wells were also found to be located along these flow paths and fault lines. The tracer study provided support to the idea that a correlation opportunity may exist in District wells which could be used to detect changes in aquifer water levels.
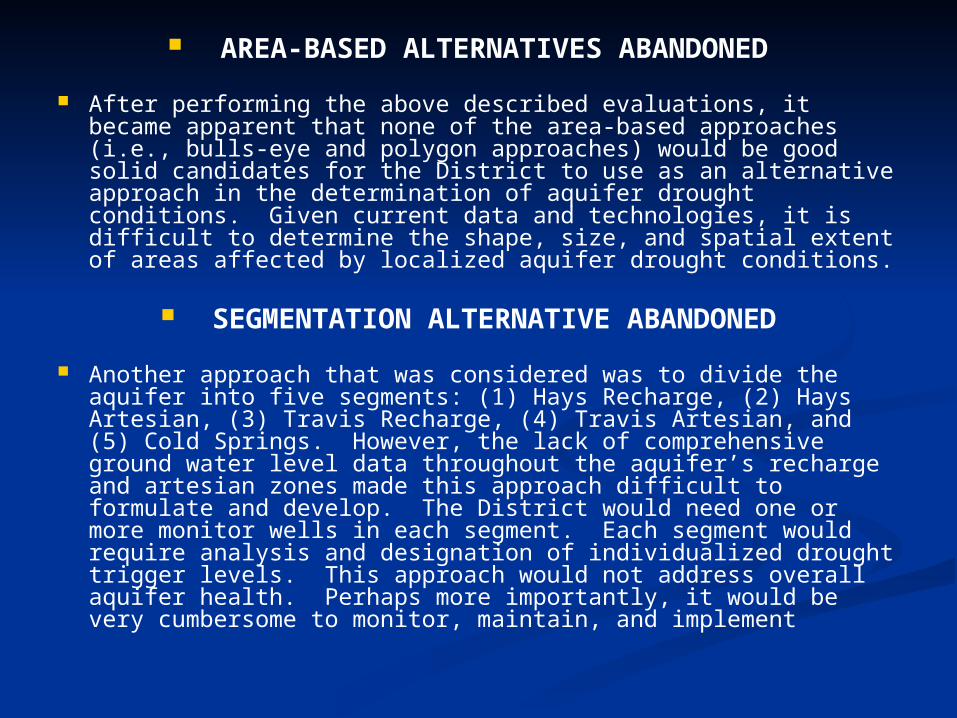
AREA-BASED ALTERNATIVES ABANDONED
After performing the above described evaluations, it became apparent that none of the area-based approaches (i.e., bulls-eye and polygon approaches) would be good solid candidates for the District to use as an alternative approach in the determination of aquifer drought conditions. Given current data and technologies, it is difficult to determine the shape, size, and spatial extent of areas affected by localized aquifer drought conditions.
SEGMENTATION ALTERNATIVE ABANDONED
Another approach that was considered was to divide the aquifer into five segments: (1) Hays Recharge, (2) Hays Artesian, (3) Travis Recharge, (4) Travis Artesian, and (5) Cold Springs. However, the lack of comprehensive ground water level data throughout the aquifer’s recharge and artesian zones made this approach difficult to formulate and develop. The District would need one or more monitor wells in each segment. Each segment would require analysis and designation of individualized drought trigger levels. This approach would not address overall aquifer health. Perhaps more importantly, it would be very cumbersome to monitor, maintain, and implement
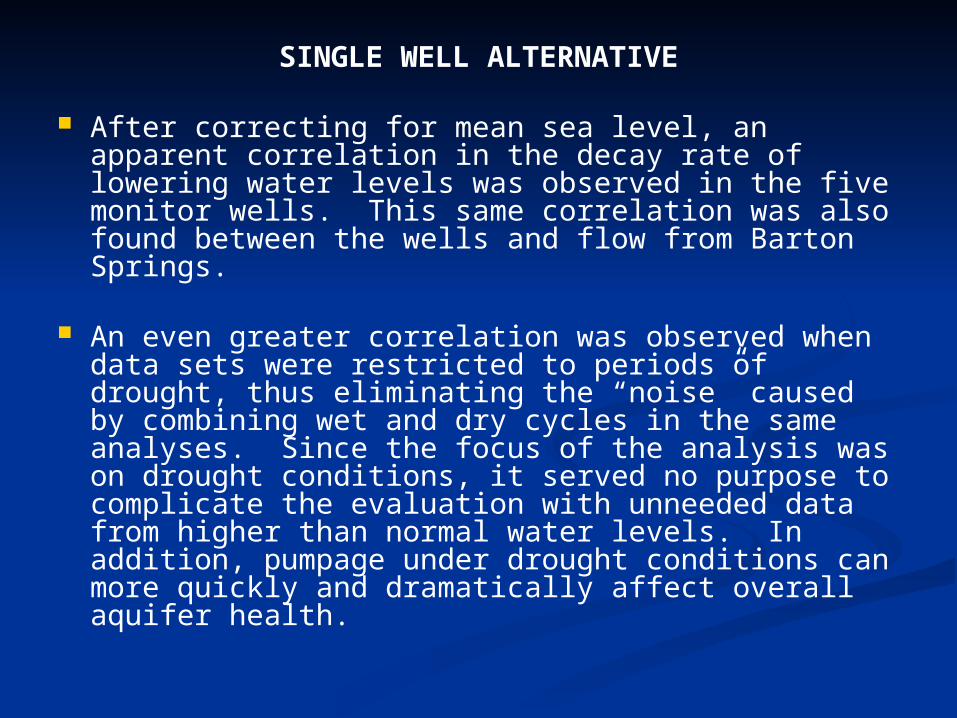
SINGLE WELL ALTERNATIVE
After correcting for mean sea level, an apparent correlation in the decay rate of lowering water levels was observed in the five monitor wells. This same correlation was also found between the wells and flow from Barton Springs.
An even greater correlation was observed when data sets were restricted to periods of drought, thus eliminating the “noise” caused by combining wet and dry cycles in the same analyses. Since the focus of the analysis was on drought conditions, it served no purpose to complicate the evaluation with unneeded data from higher than normal water levels. In addition, pumpage under drought conditions can more quickly and dramatically affect overall aquifer health.

BEST CORRELATION BETWEEN TWO WELLS
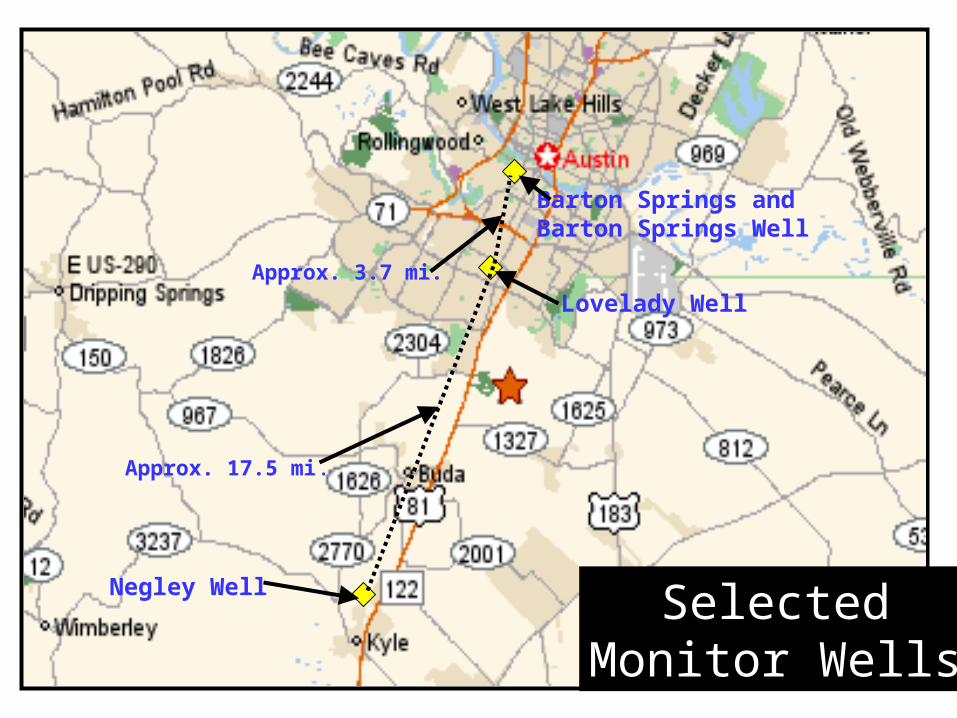
The best correlation was found to be between the Negley Well and the Lovelady Well.
These two wells are approximately 17.5 miles apart.
They are not directly influenced by the Buda and San Leanna area pumping centers.
These wells have very similar ground water level decay rates and respond similarly to recharge events.
Correlating water level measurements in these two wells for drought only conditions using linear regression procedures results in a statistically significant R-squared value of 0.97.
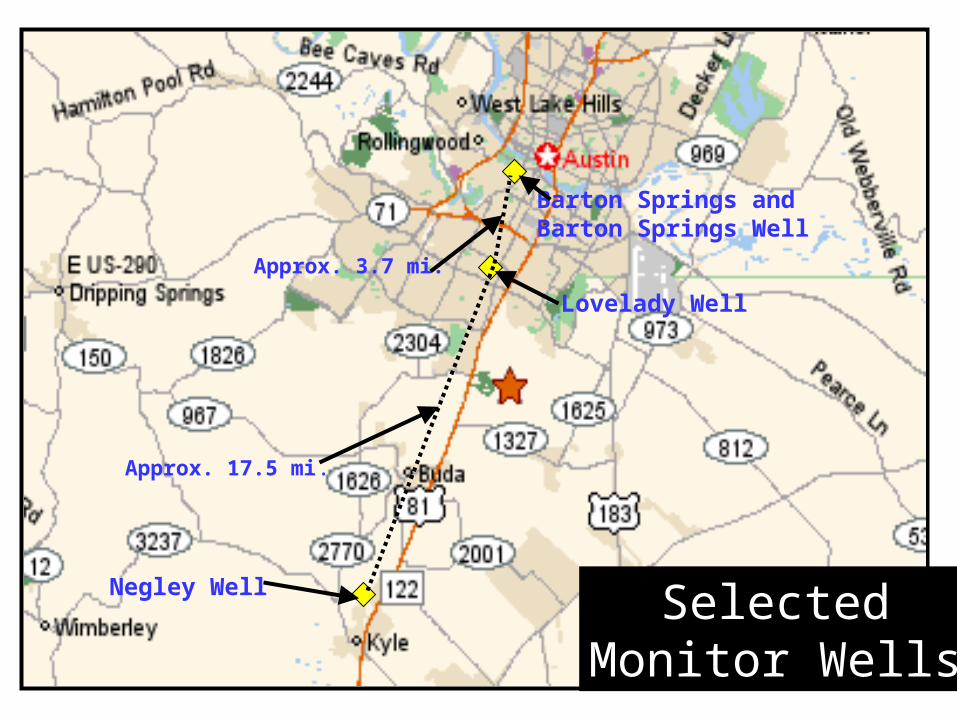
Negley Well
Lovelady Well
Barton Springs andBarton Springs Well
Approx. 17.5 mi.
Approx. 3.7 mi.
SelectedMonitor Wells
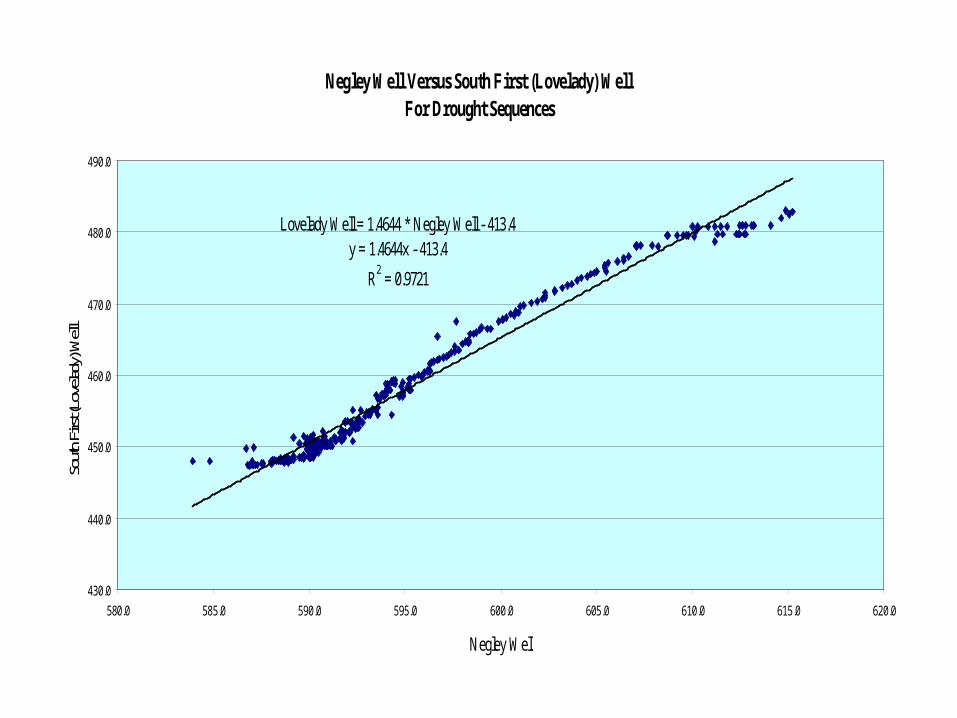
Negley Well Versus South First (Lovelady) WellFor Drought Sequences
Lovelady Well = 1.4644 * Negley Well - 413.4y = 1.4644x - 413.4
R2 = 0.9721
430.0
440.0
450.0
460.0
470.0
480.0
490.0
580.0 585.0 590.0 595.0 600.0 605.0 610.0 615.0 620.0
Negley Well
South
First
(Lov
elady
) Well
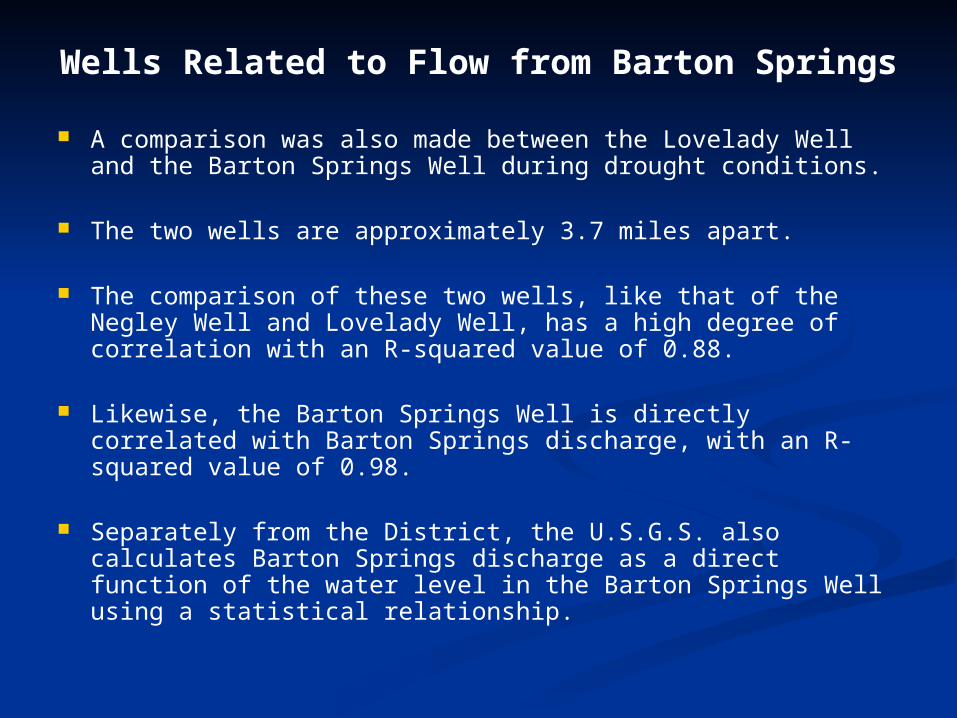
Wells Related to Flow from Barton Springs
A comparison was also made between the Lovelady Well and the Barton Springs Well during drought conditions.
The two wells are approximately 3.7 miles apart.
The comparison of these two wells, like that of the Negley Well and Lovelady Well, has a high degree of correlation with an R-squared value of 0.88.
Likewise, the Barton Springs Well is directly correlated with Barton Springs discharge, with an R-squared value of 0.98.
Separately from the District, the U.S.G.S. also calculates Barton Springs discharge as a direct function of the water level in the Barton Springs Well using a statistical relationship.
Negley Well
Lovelady Well
Barton Springs andBarton Springs Well
Approx. 17.5 mi.
Approx. 3.7 mi.
SelectedMonitor Wells
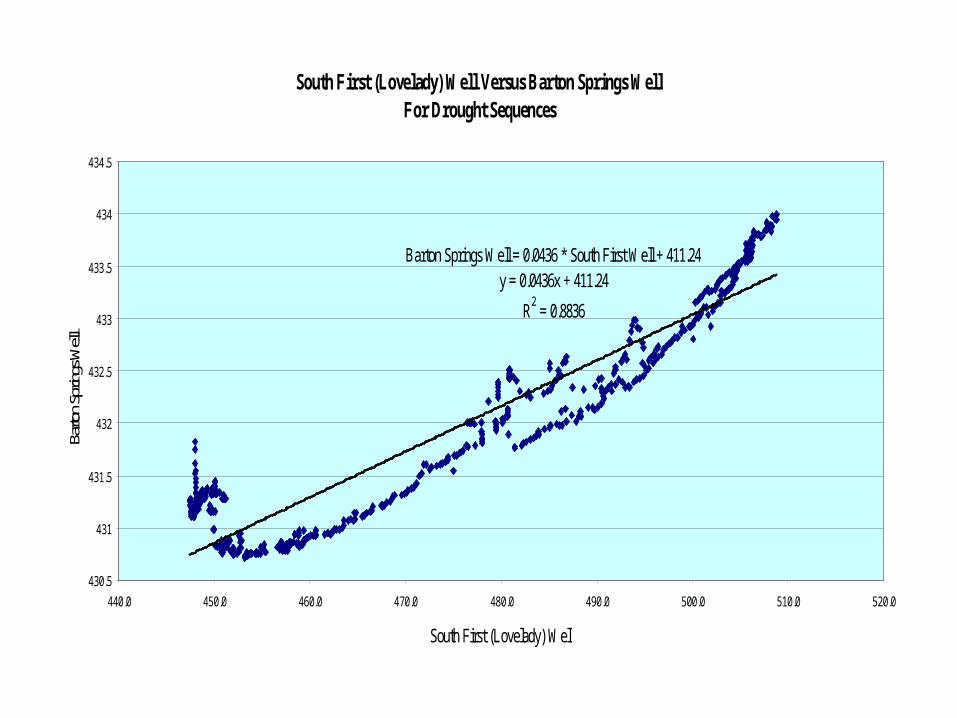
South First (Lovelady) Well Versus Barton Springs WellFor Drought Sequences
Barton Springs Well = 0.0436 * South First Well + 411.24y = 0.0436x + 411.24
R2 = 0.8836
430.5
431
431.5
432
432.5
433
433.5
434
434.5
440.0 450.0 460.0 470.0 480.0 490.0 500.0 510.0 520.0
South First (Lovelady) Well
Barto
n Spr
ings W
ell
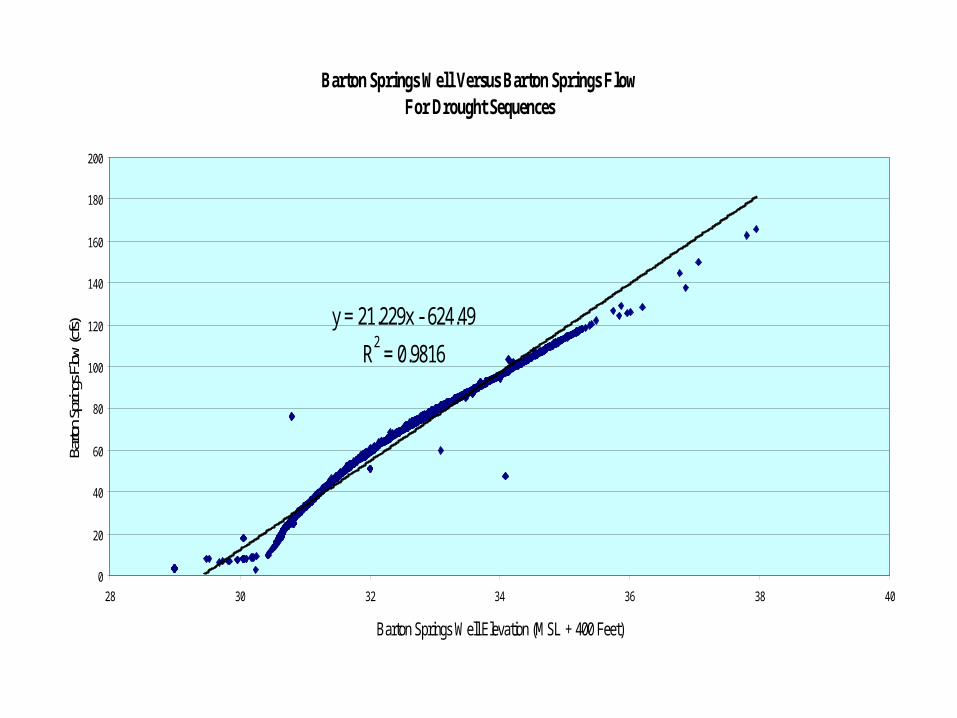
Barton Springs Well Versus Barton Springs FlowFor Drought Sequences
y = 21.229x - 624.49
R2 = 0.9816
0
20
40
60
80
100
120
140
160
180
200
28 30 32 34 36 38 40
Barton Springs Well Elevation (MSL + 400 Feet)
Barto
n Sp
rings
Flo
w (c
fs)
MULTI-WELL COMPARISONS
The hydrographs of several wells were compared between 1986 through 1996. When the noise and spikes are ignored, this comparison shows that during the 10 year period, the changes in ground water levels in all wells follow similar trends.
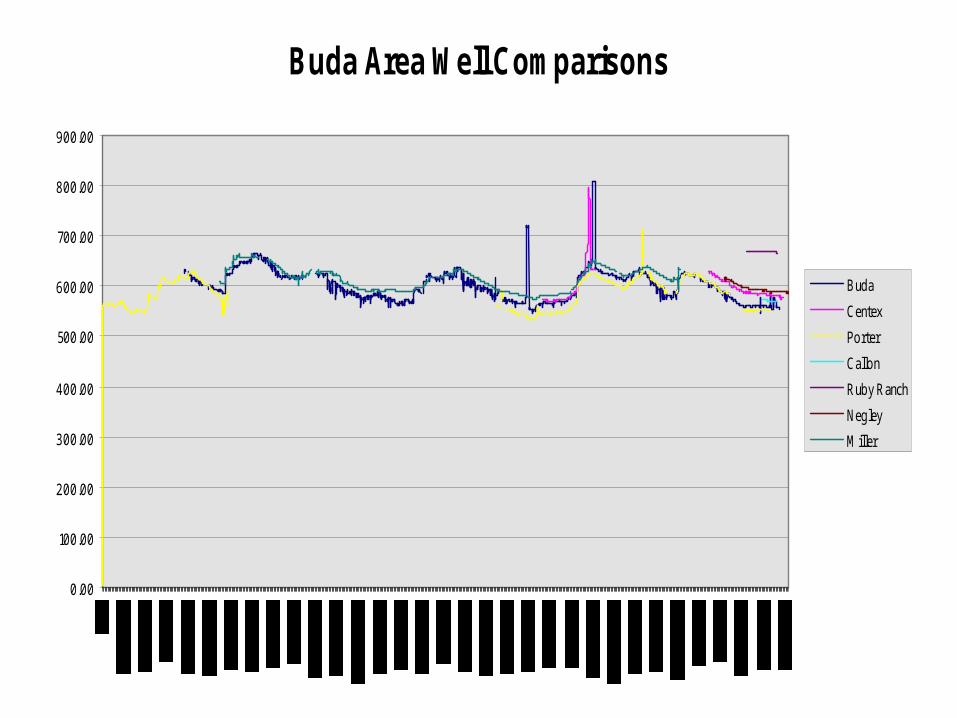
Buda Area Well Comparisons
0.00
100.00
200.00
300.00
400.00
500.00
600.00
700.00
800.00
900.00
Buda
Centex
Porter
Callon
Ruby Ranch
Negley
Miller
The noise and spikes must be ignored because they can confuse or mislead general trends and correlations. For instance, if all water level data is included, correlations between the Negley Well and Buda Well, and the San Leanna Well with the Lovelady Well, result in low R-squared values of 0.44 and 0.53, respectively. Yet, a favorable, overall trend is clearly evident on the graph. Much of this noise is almost certainly due to the influence of localized pumping on water levels in the high demand areas of Buda and San Leanna.
IN SUMMARY
Multi-well monitoring programs will still be a valuable source of long-term data for groundwater districts. However, drought management needs may be better served by careful selection of a single monitor well.
The high correlations between specific monitor wells and Barton Springs flow, and the general water level trends exhibited by several wells over a 10 year period, help support the concept that a single monitor well can reliably represent overall aquifer conditions and provide for the determination of drought status of the Barton Springs segment of the Edwards Aquifer.
If such is the case for this highly complex aquifer, then one may expect that other aquifers may also be adequately served by a single monitor well.