
EVALUATION OF SURFACE ROUGHNESS AND MRR …ethesis.nitrkl.ac.in/4934/1/109ME0359.pdf · EVALUATION...
33
1 EVALUATION OF SURFACE ROUGHNESS AND MRR OF EN18 STEEL TOOL IN EDM PROCESS A THESIS SUBMITTED IN PARTIAL FULFILMENT OF THE REQUIREMENTS FOR THE DEGREE OF Bachelor of technology In Mechanical engineering By Parbesh Agrawal 109me0359 Under the guideline of Dr. C.k. biswas Department of Mechanical Engineering National Institute of Technology Rourkela 2013
Transcript of EVALUATION OF SURFACE ROUGHNESS AND MRR …ethesis.nitrkl.ac.in/4934/1/109ME0359.pdf · EVALUATION...

1
EVALUATION OF SURFACE ROUGHNESS AND MRR OF EN18 STEEL TOOL IN EDM PROCESS
A THESIS SUBMITTED IN PARTIAL FULFILMENT
OF THE REQUIREMENTS FOR THE DEGREE OF
Bachelor of technology
In
Mechanical engineering
By
Parbesh Agrawal
109me0359
Under the guideline of
Dr. C.k. biswas
Department of Mechanical Engineering
National Institute of Technology
Rourkela
2013

2
CERTIFICATE
This is to certify that the thesis entitled, “EVALUATION OF
SURFACE ROUGHNESS AND MRR OF EN18 STEEL TOOL
IN EDM PROCESS” submitted by Mr. PARBESH AGRAWAL in
partial fulfillment of the requirements for the award of Bachelor of
Technology Degree in Mechanical Engineering at National Institute of
Technology, Rourkela is an authentic work carried out by him under
my supervision and guidance.
To the best of my knowledge, the matter embodied in this thesis has
not been submitted to any other university/ institute for award of any
Degree or Diploma.
DATE: Dr. C.K. BISWAS
Associate Professor
Dept. of Mechanical Engineering
National Institute of technology
Rourkela-769008

3
ACKNOWLEDGEMENT
I express my deep sense of gratitude and indebtedness to my supervisor Dr. C.K Biswas, Associate Professor, Department of Mechanical Engineering for providing precious guidance, inspiring discussions and constant supervision throughout the course of this work being carried out. His timely help, constructive criticism and conscientious efforts made it possible to present the work contained in this thesis.
I express my sincere thanks and gratitude to Mr. Kunal Nayak, Technical Assistant, Production Engineering Lab for his assistance and all sort of help while conducting the experiments.
I would also like to thank Mr. Shailesh Dewangan, Ph D Scholar, Production Engineering who helped me while accomplishing this task successfully.
Date: PARBESH AGRAWAL
Roll No. 109ME0359

4
ABSTRACT
Electrical discharge machining also known as EDM has been proven as an alternative process for machining complex and intricate shapes from the conductive ceramic composition. It is generally used for machining of very tough and brittle electrically conducting material. In this experiment EN18 steel is used as work piece and copper is used as tool. EN series is a popular steel tool. There are three input variable parameters used which are current, pulse time and duty cycle. Taguchi method is used to create L9 orthogonal array of input variables. MRR and Surface Roughness is found out and the effects of the input variables on this characteristics are studies in this experiment. The EDM machine used in this experiment is ELECTRONICA -ELECTRAPLUS PS 50ZNC (die sinking type) EDM.
After the results have studied it is found out that current is most significant value followed by pulse time and duty cycle is least significant for both MRR and SR. both MRR and SR increased nonlinearly with the increases in current. As pulse time increases MRR decreases slightly and with increase in duty cycle it increases insignificantly. But SR first increases with increases in pulse time but after 500µs it decreases. For duty cycle also SR increases up to 65% then started decreasing.

5
ABBREVIATIONS AND SYMBOLS
µm Micrometer
µs Microsecond
EDM Electrical Discharge Machining
V Voltage
A Ampere
Ip Discharge Current
MRR Material Discharge Material
SR Surface Roughness
Ton Pulse on Time
Toff Pulse off time
Tau Duty Cycle
Tw Tool Work Time
T↑ Tool life time
SEN Sensitivity
ASEN Anti-arc Sensitivity
DF Degree of freedom
S Standard error of Deviation
R2 Amount of variation

6
CONTENTS
Topic Page No.
Acknowledgement 3
Abstract 4
Abbreviations and Symbols 5
Contents 6
List of Figures 7
List of Tables 8
Chapter 1 Introduction
1.1 History
1.2 Introduction of EDM
1.3 Principle of EDM
1.4 Types of EDM
1.5 Important parameters
1.6 Advantages of EDM
1.7 Disadvantages of EDM
9
9
9
9
11
13
14
14
Chapter 2 Literature Review 15
Chapter 3 Experimentation
3.1 Experimental Setup
3.2 Selection of Material
3.3 Selection of tool
3.4 Evaluation of MRR
3.5 Evaluation of Surface Roughness
3.6 Design of Experiments Analysis
18
18
19
20
20
21
22
Chapter 4 Result and Discussion
4.1 Analysis and Discussion of MRR
4.2 Analysis and Discussion of Surface Roughness
23
24
27
Chapter 5 Conclusion 30
Chapter 6 Appendix 31
References 33
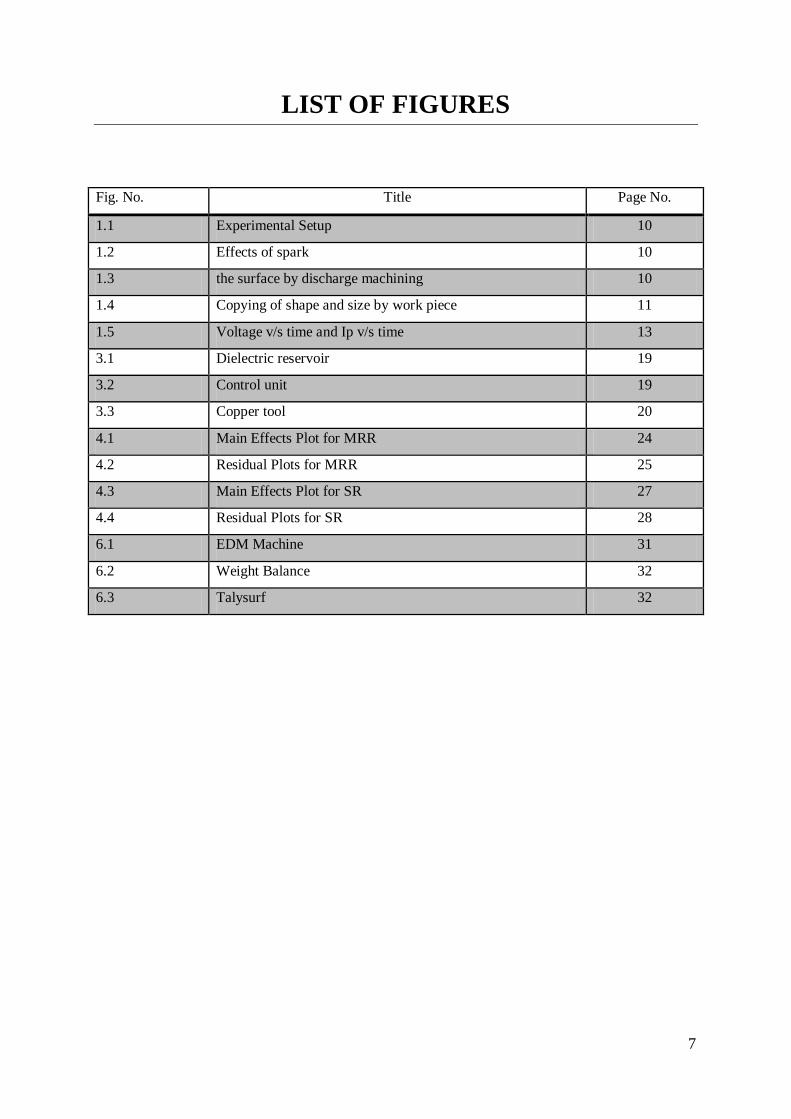
7
LIST OF FIGURES
Fig. No. Title Page No.
1.1 Experimental Setup 10
1.2 Effects of spark 10
1.3 the surface by discharge machining 10
1.4 Copying of shape and size by work piece 11
1.5 Voltage v/s time and Ip v/s time 13
3.1 Dielectric reservoir 19
3.2 Control unit 19
3.3 Copper tool 20
4.1 Main Effects Plot for MRR 24
4.2 Residual Plots for MRR 25
4.3 Main Effects Plot for SR 27
4.4 Residual Plots for SR 28
6.1 EDM Machine 31
6.2 Weight Balance 32
6.3 Talysurf 32

8
LIST OF TABLES
Table No. Title Page No.
3.1 Variable Machining Parameters and their Level 22
4.1 Observation Table 23
4.2 Estimated Model Coefficients for MRR 25
4.3 Analysis of Variance for MRR 26
4.4 Response Table for Mean of MRR 26
4.5 Estimated Model Coefficients for SR 28
4.6 Analysis of Variance for SR 29
4.7 Response Table for SR 29

9
CHAPTER 1 INTRODUCTION
1.1 INTRODUCTION
Electrical discharge machining also known as EDM has been proven as an alternative process for machining complex and intricate shapes from the conductive ceramic composition. It is a non-conventional machining method. In electrical discharge machining process electrical energy is used to cut the material to final shape and size. Efforts are made to utilize the whole energy by applying it at the exact spot where the operation needs to be carried out. There is no mechanical pressure existing between work piece and electrode as there is no direct contact. Any type of conductive material can be machined using EDM irrespective of the hardness or toughness of the material.
1.2 HISTORY
EDM was first discovered by English scientist joseph priestly in 1770. But at that time it was imprecise and riddle with failure. Electrical discharge machining takes full advantage when two Russian scientists Mr. & Mrs. Lazarenko learned how the erosive effect can be controlled and utilize for machining in 1943. From mid 1970s wire EDM began to be a viable technique that helped shape the metalworking industry I see today. From mid 1980s EDM techniques transferred to a machine tool. Nowadays wire EDM is used for machining harder material with precision cutting.
1.3 PRINCIPLES OF EDM
When a different potential is applied between two conductors emerge in a dielectric medium the fluid will ionized. If the potential difference reaches a high value a spark will occur. The control erosion of material is achieved by rapidly recurring spark. Discharge occurs in both the electrode, the tool and work piece. The tool is made as cathode and work piece as anode. The

10
MRR and surface integrity varies as I vary the pulse energy, pulse time, pulse current and many other factors.
Fig1.1 Experimental setup
Fig 1.2 Effects of spark
Fig 1.3 the surface by discharge machining

11
If both the electrodes are made of same material then it has been found that the greater erosion takes place on the positive electrode. Therefore in order to remove maximum metal and minimum tool wear the tool is made as cathode and w/p as anode. The two electrodes are separated by dielectric medium such as paraffin oil, white spirit, kerosene, deionized water. The EDM is also called as a machining method by copying as the work piece takes the shape and size of electrode which is generally made of material like copper.
Fig 1.4 Copying of shape and size by work piece
1.4 TYPES OF EDM
EDM enables different types of machining some of which are conventional as milling and die sinking others have its own characteristics. But simple and general classification can be done based on application:
1. Die sinking EDM 2. Wire EDM 3. EDM milling 4. Wire Electrical discharge grinding

12
1.4.1 Die sinking EDM
In this type of EDM the tool electrode has the complementary form of finished work piece and literally sinks into the rough material. In this I get more accuracy but the machining time is more. It is also known as volume EDM or cavity type EDM. 1.4.2 Wire EDM
In this type of EDM the electrode is a wire that cuts through the work piece and renewed constantly to avoid rapture. This wire is cheaper than the electrode. In this method the machining time is short but the operation should be done on ruled surfaces and wire may bend which cause substantial shape error. It is mostly used when lower residual stress is required. 1.4.3 EDM milling
It is used when a large holes or complex geometry is required. Usually in this method a rotating cylindrical electrode follows a path through the work piece, yielding the desired final geometry.
1.4.4 Wire Electrical Discharge Grinding
It is used when small holes are used. In this the polarity of the electrode and workpiece is reversed so that les material removal takes place from the workpiece.

13
1.5 IMPORTANT PARAMATERS
1.5.1 Ton :
It is also known as spark on time or pulse width. It means duration of spark. Its unit is μs (microsecond). Range is 0-1000μs.
1.5.2 Toff:
It is also known as spark off time or downtime. It means the time in between the sparks generated. In this time the molten metal is removed. It is set in the range between 0-1000μS.
1.5.3 Voltage (V):
The potential difference applied between the electrode and the workpiece. It is set in the range of 40-200V.
1.5.4 Discharge current (Ip):
It means the electric current value of the spark. It is shown in the unit of amp(A).it is set in the range of 0.5-400amp.
1.5.5 Duty cycle (Tau):
It is the ratio of Ton and total cycle time.
Tau = Ton /( Ton+Toff )
Fig 1.5 Voltage v/s time and Ip v/s time

14
1.6 ADVANTAGES OF EDM
Complex shapes can be machined which is difficult in conventional
cutting tools. In EDM process no cutting force generated as there is no contact
between workpiece and electrode so it permit the production of small and fragile surfaces.
Extremely hard material can be machined without deformation Any types of conductive material can be machined Burr free edges can be produced Intricate details and very high surface finish can be obtained Fine holes can be drilled easily
1.7 DISADVANTAGES OF EDM
MRR is very less compare to other machining operation like chip machining
The work piece must be a electrically conducting material The tool wear is excessive during machining Power consumption is more Different parameter have to be optimized to get a good result Lead time is needed to produce specific and consumable
shapes It is difficult to reproduce sharp corners because of tool wear

15
CHAPTER 2 LITERATURE REVIEW
In this section I have discussed some of the research paper based on Electrical Discharge Machining. The experiment or studies carried out in these papers are concerned with different parameter in EDM such as voltage, current, duty cycle, Ton , Toff etc and its effects on machining characteristics like material removal rate (MRR), and surface roughness.
Boujelbene et al. [1] carried out experiment on two electrical discharge machines to obtain high surface finish and other machining aspects. By doing experiment they found out increasing discharge energy, impulse the MRR increases and surface becomes rougher and white layer thickness increases. This happens because of more melting and recasting of material. They also found that if the degree of induce stream exceeds the maximum tensile stress of material cracking will occur.
Hwa-Teng Lee et al. [2] have done experiments and found out that the value of MRR and surface roughness increases with increasing the values of pulse current but after certain value the MRR and SR reduces due to expansion of electric plasma. The pulse current affects the surface crack density while the pulse on duration influences the degree of crack opening. The residual stress induced by hole drilling increases with increasing values of pulse current and pulse on time.

16
K.M. Patel et al. [3] investigated the machining characteristics, Surface integrity and material removal mechanism of Al2O3-SiCw-Tic with EDM. They concluded that the surface roughness and recast layer increases with current and pulse on time. The material removes because of dissociation melting and evaporation and to some extent oxidization and decomposition at lower current and thermal spelling at higher current.
J.C. Rebelo et al. [4] have performed experiment on ROBOFORM 200-“Charmilles Technology” taking martensitic steel as workpiece. They vary time and pulse current. Many experimental techniques used for assessing surface integrity. They found the penetration and depth of cracks in the recast layer increases with current, cementite white layer formed at the white layer and different heat affected zone were observed which depends on machining energy. Residual stress of tensile nature determined.
A. hascalik and U. Caydas [5] conducted the EDM experiments on model M25A with specimen as Ti-6Al-4V and then the same specimen machined by AECG process on model ECG-SGI12X36. They found that surface is rough because of debris and recast layer formed on surface. In AECG with increasing flow rate cleaner surface were observed. It is possible to get EDM damages free surface by AECG
Y.S. Liao et al. [6] have designed pulse-generating circuit by removing the high voltage discharging circuit from original circuit. They found that a dc pulse generating circuit of positive polarity can achieve a better surface roughness. They did experiment by varying different parameter like voltage, current, capacitance and appropriate values are chosen and a surface roughness of 0.22µm is achieved.

17
M. Kiyak and O. Cakir [7] had performed the experiment on AJAN-EDM982 machine. They found out that with low current and pulse on time and high pulse off time high surface finish can be produced but MRR will be low. This combination used in finishing operation. With high pulse on time, pulse current and low pulse off time I get high MRR but low surface finish, this is used for rough machining step of EDM process.
A. Hascalik and U. Caydas [8] had performed the experiment on sodick A32OD/EX28 wire EDM. After experiment they found four layer such as recast layer, white layer, annealed area and parental material. By increasing voltage and pulse duration the density in white layer increases. The cutting surfaces are harder than bulk material because of white layer and heat affected zone is softer in quenched and tempered specimen. Surface roughness increases with increasing in pulse duration and voltage.

18
CHAPTER 3 EXPERIMENTATION
In this section, I have discussed about the experimental work done prior to the execution of the work which includes L9 orthogonal array using Taguchi design, selection of material, experimental setup, tool design, and how to calculate MRR and surface roughness.
3.1 EXPERIMENTAL SETUP
The whole experiment was conducted on Electrical Discharge Machine which is a die sinking type EDM machine of model ELECTRONICA -ELECTRAPLUS PS 50ZNC. The voltage set as 40V. The polarity of workpiece set as positive (anode) and electrode as negative (cathode). EDM oil is taken as dielectric fluid.
The EDM consist of following parts
Power generator and control unit XY working table Dielectric reservoir, pump, and circulation table The tool holder Working tank with work holding device The servo system for feeding the tool

19
Fig. 3.1 Dielectric reservoir Fig. 3.2 Control unit
3.2 SELECTION OF MATERIAL
EN-18 steel tool is a part of popular EN series steels. EN steels are mixture of carbon and alloys. EN series came during the world war time and it is the outcome of British standard (BS970) steels. This steel generally contains carbon, Magnesium, Silicon, Sulphur, Phosphorous, Chromium, Nickel and Molybdenum.
The chemical composition of EN18 steel (by weight):
Carbon – 0.4 %
Silicon – 0.2 %
Magnesium – 0.75 %
Sulphur – 0.04 %
Phosphorous – 0.04 %
Chromium – 1.01 %

20
3.3 SELECTION OF TOOL
There are variety of material can be used as tool for EDM process like copper, brass aluminium alloys, silver alloys etc. the electrode used in this experiment is copper. The shape of copper is cylindrical with diameter 21 mm.
Fig.3.3 Copper tool
3.4 EVALUATION OF MRR
MRR is the rate at which the material is removed from the work piece. Its unit is mm3/s. the material is removed from the work piece because of series of recurring spark between the two electrodes. The MRR can be defined as the rate of material removed per second or the ratio of change in volume of workpiece during machining divided by duration of machining.
MRR = (Wi-Wf) / t × ρ Where, Wi = initial weight of material
Wf = final weight of material after experiment
t = machining time = 5 min
ρ = density of material = 7.84 gm/cc3

21
3.5 EVALUATION OF SURFACE ROUGHNESS
Surface roughness or simply called as roughness is the measure of surface texture. Its unit is µm. it can be defined as the vertical deviation of real surface from ideal surface. If the deviation is more, it is said as rough surface and if the deviation is less, it is said as smooth surface. Surface roughness generally measured using portable type profilometer, talysurf.
3.6 DESIGN OF EXPERIMENTS ANALYSIS
I have used Taguchi Method. Dr. Genichi Taguchi of Nippon Telephones and Telegraph Company, Japan developed this method which is based on Orthogonal Array experiment to improve the quality of manufactured products and nowadays used in engineering. Taguchi Method can be defined as the quality control methodology that combine control charts and process control with product and process design to achieve a good design. It aims to reduce product variability with a system for developing specifications and designing them into product or process. The design of experiment is used to find the best combination of parameters used as input values in an orthogonal array.
In this experiment I have used three input parameters:
1. Ip 2. Ton 3. Tau
There are 3 variables so the design becomes a 3 level 3 factorial Taguchi design. L9 orthogonal array was chosen for the experiment to be conducted.

22
Table no. 3.1 Variable Machining Parameters and their Level
Machining Parameter Unit 1
Levels 2
3
Discharge Current A 1 5 9 Pulse on time µs 100 500 1000 Duty Cycle (Tau) % 50 65 85
I have fixed some of the machining parameters which are as follows:
Voltage = 40V
ASEN = 3
SEN = 6
Tw = 0.8
T = 0.6
Polarity = +ve

23
CHAPTER 4 RESULT AND DISCUSSION
In this section I have discussed the result obtained from the experiment and analyze the effect of different parameters on MRR and Surface Roughness.
Table no. 4.1 Observation Table
Expt. no.
Pulse time I (A)
Pulse time Ton (µs)
Duty Cycle Tau (%)
MRR (mm3/min)
Surface Roughness
(µm) 1 1 100 50 0.24221 3.8
2 1 500 65 0.21685 7.13
3 1 1000 85 0.10205 6.13
4 5 100 65 2.03954 7.4
5 5 500 85 2.00242 8.26
6 5 1000 50 0.89272 7.13
7 9 100 85 5.76275 7.8
8 9 500 50 5.58673 12.67
9 9 1000 65 5.38266 12.33

24
4.1 ANALYSIS AND DISCUSSION OF MRR
Fig 4.1 Main Effects Plot for MRR
The MRR increases as the value of Ip increases. The rate of increase in value of MRR is more for the range of Ip (5A to 9A) than the range of Ip (1A to 5A). The MRR decreases very slightly as I increases the values of Ton from 100µs to 500µs. As I increase the value further from 500µs to 1000µs the MRR value decreases more rapidly. MRR increases as the value of duty cycle increases from 50% to 65%. But after 65% MRR increment is very slight.

25
Fig 4.2 Residual Plots for MRR
Linear Model Analysis: Means versus Ip, Ton, tau:
Table No.4.2 Estimated Model Coefficients for MRR
Term Coef. SR Coef. T P
Constant 2.46944 0.08983 27.490 0.001 Ip 1 -2.28240 0.12704 -17.966 0.003 Ip 5 -0.82455 0.12704 -6.490 0.023
Ton 100 0.21206 0.12704 1.699 0.237 Ton 500 o.13157 0.12704 1.063 0.409 Tau 50 -0.22298 0.12704 -1.809 0.212 Tau 65 0.07691 0.12704 0.605 0.606
S = 0.2695 R-Sq = 99.7% R-Sq(adj) = 98.8%

26
Table No.4.3 Analysis of Variance for MRR
Source DF Seq SS Adj SS Adj MS F P Ip 2 46.6271 46.6271 23.3136 321.01 0.003 Ton 2 0.5411 0.5411 0.2705 3.73 0.212 Tau 2 0.2465 0.2465 0.1232 1.70 0.371
Residual Error 2 0.1453 0.1453 0.0726 Total 8 47.5599
Table No.4.4 Response Table for MRR
Level Ip Ton Tau
1 0.1870 2.6815 2.2396 2 1.6449 2.6010 2.5463 3 5.5764 2.1258 2.6224 Delta 5.3894 0.5557 0.3828 Rank 1 2 3
From the ANOVA table it is found that only Ip has significant value as its P value is less than 0.05. The P value of Ton and Tau are greater than 0.05. The most significant value is Ip followed by Ton and Tau is least significant.
The standard deviation of error, S = 0.2695
And R2 = 99.7%

27
4.2 ANALYSIS AND DISCUSSION OF SURFACE ROUGHNESS
Fig 4.3 Main Effects Plot for SR
Surface Roughness increases with the increase in the value of Ip. From 1A to 5A, SR increases with a good rate but from 5A to 9A it increases rapidly.
Surface Roughness Increases with increasing in values of Ton from 100µs to 500µs after that SR decreases as Ton increases from 500µs to 1000µs.
Surface Roughness increases as the Tau increases from 50% to 65%, but after 65% as I increase Tau up to 85% the value of SR decreases.

28
Fig 4.4 Residual Plots for SR
Table No.4.5 Estimated Model Coefficients for SR
Term Coef. SR Coef. T P
Constant 8.0722 0.3994 20.210 0.002
Ip 1 -2.3856 0.5649 -4.223 0.052
Ip 5 -0.4765 0.5649 -0.842 0.488
Ton 100 -1.7389 0.5649 -3.078 0.091
Ton 500 1.2811 0.5649 2.268 0.151
Tau 50 -0.2056 0.5649 -0.364 0.751
Tau 65 0.8811 0.5649 1.560 0.259
S = 1.198 R-Sq = 95.5% R-Sq(adj) = 81.9%

29
Table No.4.6 Analysis of Variance for SR
Source DF Seq SS Adj SS Adj MS F P Ip 2 42.309 42.309 21.154 14.73 0.064 Ton 2 14.624 14.625 7.312 5.09 0.164 Tau 2 3.825 3.825 1.912 1.33 0.429
Residual Error 2 2.872 2.872 1.436 Total 8 63.629
Table No.4.7 Response Table for SR
Level Ip Ton Tau
1 5.687 6.333 7.867 2 7.597 9.353 8.953 3 10.933 8.530 7.397
Delta 5.247 3.020 1.557 Rank 1 2 3
From above ANOVA table it is found that neither of three are significant values as P of every parameter is greater than 0.05. But for Ip P is slightly more than 0.05, therefore Ip is slightly significant whereas Ton less significant and Tau is least significant as P of Tau is more.
The standard deviation of error, S = 1.198
And R2 = 95.5%

30
CHAPTER 5 CONCLUSION
The experiments are done in Electric Discharge Machine, model ELECTRONICA -ELECTRAPLUS PS 50ZNC (die sinking type) using three variable parameters Ip, Ton and Tau. The aim of this experiment is to find out Material Removal Rate and Surface Roughness and the effects of the variables used on these characteristics. The electrode used in this experiment is copper and En18 steel tool is used as work piece. In this experiment Taguchi method is used to create an L9 orthogonal array and experiments are done accordingly. By doing experiments following conclusion can be drawn:
Ip is more significant value for MRR while significance of Ton is less and that of Tau least. As I increase Ip, MRR increases nonlinearly. As Ton increases MRR decreases slightly and with increase in Tau it increases insignificantly.
For Surface Roughness Ip is most significant then Ton and Tau is least significant. As Ip increases SR increases and it increases rapidly as Ip values is more. As I increases Ton SR increases but after 500µs it started decreasing. Similarly for Tau it increases up to 65% and then decreases.

31
CHAPTER 6 APPENDIX
In this section, I have discussed about the machines and equipment used for conducting the experiments.
EDM Machine
All the experiment is conducted on EDM machine of model ELECTRONICA- ELECTRAPULS PS 50ZNC (die-sinking type) with servo-head (constant gap).
Fig 6.1 EDM machine
Weight Balance To measure the weight of workpiece before and after each experiment I used precision balance of brand SHINKO DENSHI Co. LTD, JAPAN, and Model DJ 300S. The capacity of this machine is 300gm and accuracy is 0.001gm.

32
Fig 6.2 Weight Balance
Talysurf:
To measure the values of Surface Roughness of specimen I used portable type profilometer talysurf (Model: Taylor Hobson, Surtronic 3+)
Fig 6.3 Talysurf

33
REFERENCES
1. Boujelbene M., Bayraktar E., Tebni W., Ben Salem S. – Influence of machining parameters on the surface integrity in electrical discharge machining, Archives of Materials Science and Engineering, volume 37, issue 2, June 2009, 110-116
2. Lee H.T, Hsu F.C, Tai T.Y – Study of surface integrity using the small area EDM process with a Copper-Tungsten electrode, material science and engineering A364, 2004, 346-356
3. Patel K.M, Pandey P.M, Rao P.V – surface integrity and material removal mechanism associated with the EDM of Al2O3 ceramic composite, Int. Journal of refractory metals and hard materials 27, issue 5, 2007, 892-899
4. Rebelo J.C., Dias A.M., Krember D., Lebrun J.L. – Influence of EDM pulse energy on the surface of integrity of martensitic steel, Journal of material processing Technology 84, 1998, 90-96
5. Hascalik A., Caydas U. – A comparative study of surface integrity of Ti-6Al-4V alloy machined by EDM and AECG, Journal of material processing Technology 190, 2007, 173-180
6. Liao Y.S., Huang J.T., Chen Y.H. – A study to achieve a fine surface finish in wire EDM, Journal of material processing Technology 149, 2004, 165-171
7. Kiyak M., Cakir O. – Examination of machining parameter on surface roughness of EDM of tool steel, Journal of material processing Technology 191, 2007, 141-144
8. Hascalik .A, Caydas U. – Experimental study of wire electrical discharge machining of AISI D5 tool steel, Journal of material processing Technology 148, 2004, 363-367.
9. Shailesh Dewangan - Experimental Investigation of Machining Parameters for EDM Using U-shaped Electrode of AISI P20 Tool Steel. M-Tech thesis, NIT Rourkela, 2010.


![Investigation of surface roughness and MRR for turning of ...Gopalakannan [3] studied the machinability of aluminum metal matrix composite reinforced with SiC particles. Electric discharge](https://static.fdocuments.in/doc/165x107/609e36a6c52adc0bdd1fe283/investigation-of-surface-roughness-and-mrr-for-turning-of-gopalakannan-3-studied.jpg)