Evaluation of Stationary Fuel Cell Deployments, Costs, and ... · Evaluation of Stationary Fuel...
25
NREL is a national laboratory of the U.S. Department of Energy, Office of Energy Efficiency and Renewable Energy, operated by the Alliance for Sustainable Energy, LLC. Evaluation of Stationary Fuel Cell Deployments, Costs, and Fuels 2013 Fuel Cell Seminar and Energy Exposition Keith Wipke (presenter) for Chris Ainscough, Jennifer Kurtz, Michael Peters, Genevieve Saur October 23, 2013 Columbus, Ohio NREL/PR-5400-60903 STA32-1
Transcript of Evaluation of Stationary Fuel Cell Deployments, Costs, and ... · Evaluation of Stationary Fuel...

NREL is a national laboratory of the U.S. Department of Energy, Office of Energy Efficiency and Renewable Energy, operated by the Alliance for Sustainable Energy, LLC.
Evaluation of Stationary Fuel Cell Deployments, Costs, and Fuels
2013 Fuel Cell Seminar and Energy Exposition Keith Wipke (presenter) for Chris Ainscough, Jennifer Kurtz, Michael Peters, Genevieve Saur
October 23, 2013 Columbus, Ohio
NREL/PR-5400-60903 STA32-1

2
Technology Validation at NREL
• Confirmation of component and system technical targets • Evaluation, optimization, and demonstration in integrated
energy systems • National Fuel Cell Technology Evaluation Center (NFCTEC)
Photo by Dennis Schroeder, NREL Figures and illustrations: NREL

3
www.nrel.gov/hydrogen/proj_tech_validation.html
NFCTEC Analysis Approach
National Fuel Cell Technology Evaluation Center
NFCTEC
Analysis and reporting of real-world operation data

4
Major Ramp-Up of Fuel Cell Stationary System Deployments Began in 2010
2001 2002 2003 2004 2005 2006 2007 2008 2009 2010 2011 2012 20130
50
100
150
200
250
300
Total = 295 units
Cumulative Deployment Count by Year*Pr
ojec
t Cou
nt
TotalCHPElectric Only
2001 2002 2003 2004 2005 2006 2007 2008 2009 2010 2011 2012 20130
50
100
150
Total = 121 MW
Cap
acity
[MW
]
Cumulative Capacity by Year*
TotalCHPElectric Only
NREL cdp_stat_01Created: Sep-25-13 9:08 AM | Data Range: 2001Q2-2013Q2 *Data from the California SGIP.
Majority of deployments and nearly all capacity is electric only

5
Contractual Status of Stationary Fuel Cell Systems in Deployment
3%
5%
15%
69%
Deployment Count By Status*
Other Categories: ICF ReviewICF InspectionRRF Technical ReviewRRF ReservedPPM Technical ReviewICF Technical Review
Definitions: RRF = Reservation Request Form, is the first step in the SGIP incentive claim process.PPM = Proof of Project Milestone; the applicant must prove progress and committment to the project.ICF = Incentive Claim Form is the step where the appliant, after meeting all SGIP requirements requests payment of the incentive.PBI = Performance Based Incentive is the way in which the incentive is paid out over time based on performance of the system.
OtherICF Pending PaymentPayment PBI in ProcessPPM ConfirmedPayment Completed
NREL cdp_stat_02Created: Sep-25-13 9:21 AM | Data Range: 2001Q2-2013Q2 *Data from the California SGIP.
New projects since 2011 receiving the performance-based incentive
Payment Completed

6
Stationary Fuel Cell System Count and Capacity by Fuel Type (ALL Fuel Cell Systems)
5%10%
12%
74%
Site Count by Fuel Type*
Biomass
Digester Gas
Landfill Gas
Natural Gas
4%
17%
14%
65%
Installed Capacity by Fuel Type
NREL cdp_stat_04Created: Sep-27-13 10:12 AM | Data Range: 2001Q2-2013Q2
Includes Status Categories:CompletedAdvancementPending PaymentPayment CompletedICF InspectionICF Pending PaymentICF ReviewICF Technical ReviewPayment PBI in ProcessPPM ConfirmedPPM Technical ReviewRRF ReservedRRF Technical Review
Total Capacity: 121 MWTotal Sites: 295
Installations by Fuel Type(All Fuel Cell Systems)
Definitions: RRF = Reservation Request Form, is the first step in the SGIP incentive claim process.PPM = Proof of Project Milestone; the applicant must prove progress and committment to the project.ICF = Incentive Claim Form is the step where the appliant, after meeting all SGIP requirements requests payment of the incentive.PBI = Performance Based Incentive is the way in which the incentive is paid out over time based on performance of the system. *Data from the California SGIP.
Natural gas is the most-used fuel. However, renewable fuels make up one-third of capacity.

7
Installations By Fuel Type (CHP Fuel Cells Only)
1%
99%
Site Count by Fuel Type*
Digester Gas
Natural Gas
18%
82%
Installed Capacity by Fuel Type
NREL cdp_stat_20Created: Sep-27-13 10:12 AM | Data Range: 2001Q2-2013Q2
Includes Status Categories:CompletedAdvancementPending PaymentPayment CompletedICF InspectionICF Pending PaymentICF ReviewICF Technical ReviewPayment PBI in ProcessPPM ConfirmedPPM Technical ReviewRRF ReservedRRF Technical Review
Total Capacity: 8 MWTotal Sites: 71
Installations by Fuel Type(CHP Fuel Cell Systems)
Definitions: RRF = Reservation Request Form, is the first step in the SGIP incentive claim process.PPM = Proof of Project Milestone; the applicant must prove progress and committment to the project.ICF = Incentive Claim Form is the step where the appliant, after meeting all SGIP requirements requests payment of the incentive.PBI = Performance Based Incentive is the way in which the incentive is paid out over time based on performance of the system. *Data from the California SGIP.
Nearly all CHP systems use natural gas.

8
Fuel Type Capacity (All Systems)
Biomass Digester Gas Landfill Gas Natural Gas0
100
200
300
400
500
600
700
800
900
1000
Inst
alle
d C
apac
ity (k
W)
Installation Capacity Statistics by Fuel Type*
NREL cdp_stat_05Created: Sep-27-13 10:17 AM | Data Range: 2001Q2-2013Q2
75% Percentile
Median
25% Percentile
Mean
*Data from the California SGIP.
Natural gas systems have a wide range of sizes. Digester systems tend to be the largest.

9
Installation Capacity by Fuel Type (CHP Fuel Cells)
Digester Gas Natural Gas0
100
200
Inst
alle
d C
apac
ity (k
W)
Installation Capacity Statistics by Fuel Type (CHP)*
NREL cdp_stat_21Created: Sep-27-13 1:33 PM | Data Range: 2001Q2-2013Q2
75% Percentile
Median
25% Percentile
Mean
Insufficientdata toprotect
anonymity
*Data from the California SGIP.
Natural gas CHP has a few large deployments (large mean, small 25–75 percentiles)
10
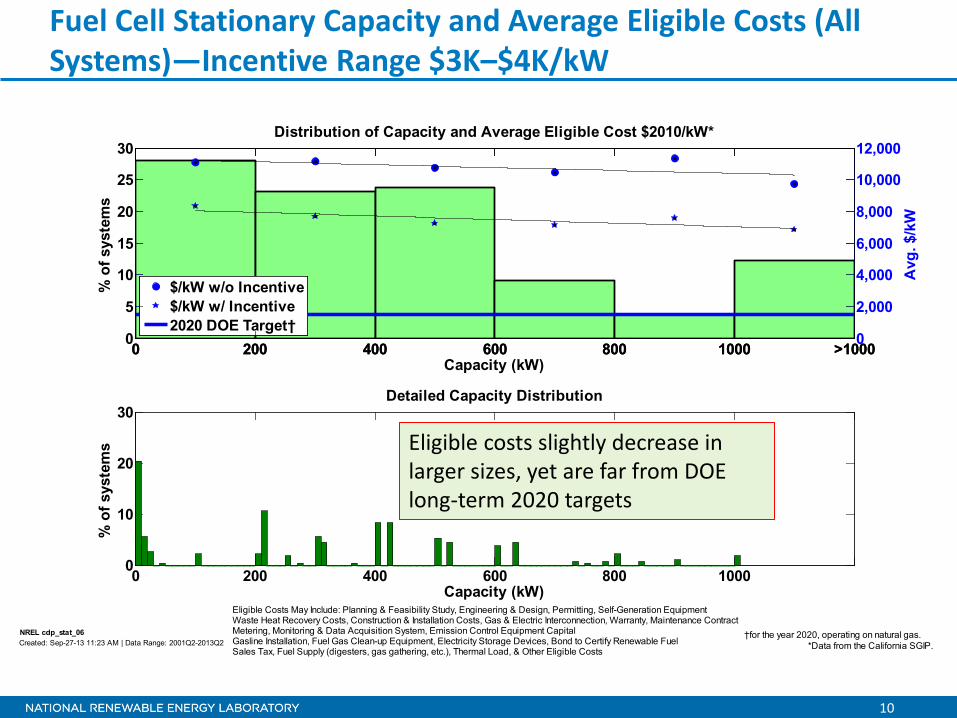
Fuel Cell Stationary Capacity and Average Eligible Costs (All Systems)—Incentive Range $3K–$4K/kW
0 200 400 600 800 1000 >10000
5
10
15
20
25
30Distribution of Capacity and Average Eligible Cost $2010/kW*
Capacity (kW)
% o
f sys
tem
s
0 200 400 600 800 1000 >10000
2,000
4,000
6,000
8,000
10,000
12,000
Avg
. $/k
W
$/kW w/o Incentive$/kW w/ Incentive2020 DOE Target†
0 200 400 600 800 1000 0
10
20
30
Capacity (kW)
% o
f sys
tem
s
Detailed Capacity Distribution
NREL cdp_stat_06Created: Sep-27-13 11:23 AM | Data Range: 2001Q2-2013Q2
†for the year 2020, operating on natural gas.*Data from the California SGIP.
Eligible Costs May Include: Planning & Feasibility Study, Engineering & Design, Permitting, Self-Generation EquipmentWaste Heat Recovery Costs, Construction & Installation Costs, Gas & Electric Interconnection, Warranty, Maintenance ContractMetering, Monitoring & Data Acquisition System, Emission Control Equipment CapitalGasline Installation, Fuel Gas Clean-up Equipment, Electricity Storage Devices, Bond to Certify Renewable FuelSales Tax, Fuel Supply (digesters, gas gathering, etc.), Thermal Load, & Other Eligible Costs
Eligible costs slightly decrease in larger sizes, yet are far from DOE long-term 2020 targets

11
Distribution of Capacity and Eligible Cost (CHP FC Only)
0 200 400 600 800 1000 >10000
20
40
60
80
Distribution of Capacity and Average Eligible Cost $2010/kW (CHP Fuel Cell)*
Capacity (kW)
% o
f sys
tem
s
0 200 400 600 800 1000 >10000
2,000
4,000
6,000
8,000
10,000
12,000
Avg
. $/k
W
$/kW w/o Incentive$/kW w/ Incentive2020 DOE Target†
0 200 400 600 800 1000 0
20
40
60
Capacity (kW)
% o
f sys
tem
s
Detailed Capacity Distribution
NREL cdp_stat_22Created: Sep-27-13 11:23 AM | Data Range: 2001Q2-2013Q2
†for the year 2020, operating on natural gas.*Data from the California SGIP.
Eligible Costs May Include: Planning & Feasibility Study, Engineering & Design, Permitting, Self-Generation EquipmentWaste Heat Recovery Costs, Construction & Installation Costs, Gas & Electric Interconnection, Warranty, Maintenance ContractMetering, Monitoring & Data Acquisition System, Emission Control Equipment CapitalGasline Installation, Fuel Gas Clean-up Equipment, Electricity Storage Devices, Bond to Certify Renewable FuelSales Tax, Fuel Supply (digesters, gas gathering, etc.), Thermal Load, & Other Eligible Costs
Economies of scale are better for CHP systems

12
Distribution of Stationary Fuel Cell Install Cost With and Without Incentives
0
20
40
60
80
0
1000
20
00
3000
40
00
5000
60
00
7000
80
00
9000
1000
011
000
1200
013
000
1400
015
000
1600
017
000
1800
019
000
2000
021
000
proj
ect c
ount
Price without incentives [$2010/kW]
Installed Eligible Cost Per kW*Adjusted To 2010 Dollars
Avg = $10,412 $/kW
CurrentDOE 2020 Target
0
20
40
60
0
1000
20
00
3000
40
00
5000
60
00
7000
80
00
9000
1000
011
000
1200
013
000
1400
015
000
1600
017
000
1800
019
000
2000
021
000
proj
ect c
ount
Price with incentives [$2010/kW]
Avg = $6,896 $/kW
CurrentDOE 2020 Target
NREL cdp_stat_07Created: Sep-27-13 12:16 PM | Data Range: 2001Q2-2013Q2 *Data from the California SGIP.
Eligible Costs May Include: Planning & Feasibility Study, Engineering & Design, Permitting, Self-Generation EquipmentWaste Heat Recovery Costs, Construction & Installation Costs, Gas & Electric Interconnection, Warranty, Maintenance ContractMetering, Monitoring & Data Acquisition System, Emission Control Equipment CapitalGasline Installation, Fuel Gas Clean-up Equipment, Electricity Storage Devices, Bond to Certify Renewable FuelSales Tax, Fuel Supply (digesters, gas gathering, etc.), Thermal Load, & Other Eligible Costs
Average incentives are $3,500/kW historically; fuel cell incentives are now set to decrease 10% per year.

13
Stationary Fuel Cell Install Cost Over Time With and Without Incentives
2001 2002 2003 2004 2005 2006 2007 2008 2009 2010 2011 2012 20130
5
10
15
20
25
Ave
rage
$20
10/W
of In
stal
led
Cap
acity
Average Eligible Cost $2010/W Trend for Overall Deployments*
Without IncentiveWith IncentiveDOE 2020 Target
0
5
10
15
20
25
200120
0220
0320
0420
0520
0620
0720
0820
0920
1020
1120
1220
13
Capacity < 500 kW
Ave
rage
$20
10/W
of In
stal
led
Cap
acity
0
5
10
15
20
25
200120
0220
0320
0420
0520
0620
0720
0820
0920
1020
1120
1220
13
500 kW <= Capacity < 1000 kW
0
5
10
15
20
25
200120
0220
0320
0420
0520
0620
0720
0820
0920
1020
1120
1220
13
Capacity >= 1000 kW
NREL cdp_stat_08Created: Sep-25-13 9:08 AM | Data Range: 2001Q2-2013Q2 *Data from the California SGIP.
Eligible Costs May Include: Planning & Feasibility Study, Engineering & Design, Permitting, Self-Generation EquipmentWaste Heat Recovery Costs, Construction & Installation Costs, Gas & Electric Interconnection, Warranty, Maintenance ContractMetering, Monitoring & Data Acquisition System, Emission Control Equipment CapitalGasline Installation, Fuel Gas Clean-up Equipment, Electricity Storage Devices, Bond to Certify Renewable FuelSales Tax, Fuel Supply (digesters, gas gathering, etc.), Thermal Load, & Other Eligible Costs
Eligible costs are generally increasing over time (inflation adjusted), driven by the sub-MW size range

14
Stationary Fuel Cell Install Cost by Fuel Type With and Without Incentives
Biomass Digester Gas Landfill Gas Natural Gas2000
4000
6000
8000
10000
12000
$201
0/kW
of In
stal
led
Cap
acity
Eligible Cost $2010/kW of Installed Capacity by Fuel Type*
Avg. Without IncentiveAvg. With Incentive
NREL cdp_stat_09Created: Sep-25-13 9:09 AM | Data Range: 2001Q2-2013Q2
75% Percentile
Median
25% Percentile
Mean
*Data from the California SGIP.
Eligible Costs May Include: Planning & Feasibility Study, Engineering & Design, Permitting, Self-Generation EquipmentWaste Heat Recovery Costs, Construction & Installation Costs, Gas & Electric Interconnection, Warranty, Maintenance ContractMetering, Monitoring & Data Acquisition System, Emission Control Equipment CapitalGasline Installation, Fuel Gas Clean-up Equipment, Electricity Storage Devices, Bond to Certify Renewable FuelSales Tax, Fuel Supply (digesters, gas gathering, etc.), Thermal Load, & Other Eligible Costs
Digester systems have the lowest costs in both mean and 25 percentile

15
Total Incentive Spending ($2010) per kW by Year
2001 2002 2003 2004 2005 2006 2007 2008 2009 2010 2011 2012 20130
20
40
60
80
100
120
140
Cap
acity
[MW
]
Year2000
2500
3000
3500
4000
4500
5000
5500
Ince
ntiv
e Sp
endi
ng ($
2010
) Per
kW
Inst
alle
d
Total Incentive ($2010) per kW by Year*
NREL cdp_stat_11Created: Sep-25-13 9:09 AM | Data Range: 2001Q2-2013Q2 *Data from the California SGIP.
Deployments are continuing to increase in an era of decreasing incentives

16
Average System Size Installed Per Year (kW)
2001 2002 2003 2004 2005 2006 2007 2008 2009 2010 2011 2012 20130
100
200
300
400
500
600
700
800
Ave
rage
Sys
tem
Siz
e In
stal
led
Per Y
ear (
kW)
Year
Average System Size Installed Per Year (kW)*
Overall Average Capacity = 471 kW
NREL cdp_stat_12Created: Sep-25-13 9:09 AM | Data Range: 2001Q2-2013Q2 *Data from the California SGIP.
2013 has seen the third largest average system size 1 2
3

17
Installed Annual Capacity by Fuel Type
2001 2002 2003 2004 2005 2006 2007 2008 2009 2010 2011 2012 20130
10
20
30
40
50
60
Year
Tota
l Ann
ual I
nsta
lled
Cap
acity
(MW
)
Installed Fuel Type By Year*
BiomassDigester GasLandfill GasNatural Gas
NREL cdp_stat_13Created: Sep-25-13 9:09 AM | Data Range: 2001Q2-2013Q2 *Data from the California SGIP.
Rule change in 2011 requiring directed biogas to be in state, and a lack of its availability (it’s all being used already) has led to dominance of natural gas

18
Comparing FC to Other Distributed Generation (DG): Distribution of Capacity by Equipment Type
0 200 400 600 800 1000 1200 1400 1600 1800 2000 >20000
50
100
150
200
250
300Distribution of Capacity by Equipment Type*
Capacity (kW)
Tota
l # o
f Sys
tem
s
Fuel Cell CHPFuel Cell ElectricGas TurbineInternal CombustionMicroturbinePressure Reduction Turbine
NREL cdp_stat_14Created: Sep-30-13 1:57 PM | Data Range: 2010Q10-2013Q2 *Data from the California SGIP.
Fuel cells represent about one-third of installed generation capacity in most size bins in SGIP

19
Comparing FC to Other DG: Average Eligible Cost by Equipment Type
2001 2002 2003 2004 2005 2006 2007 2008 2009 2010 2011 2012 20130
5
10
15
20
25
Ave
rage
$20
10/W
of In
stal
led
Cap
acity
Average Eligible Cost $2010/W Trend for Overall Deployments*Without Incentives
2001 2002 2003 2004 2005 2006 2007 2008 2009 2010 2011 2012 20130
5
10
15
20
25
Average Eligible Cost $2010/W Trend for Overall Deployments*With Incentives
Ave
rage
$20
10/W
of In
stal
led
Cap
acity
Fuel Cell CHPFuel Cell ElectricGas TurbineInternal CombustionMicroturbinePressure Reduction Turbine
NREL cdp_stat_15Created: Sep-30-13 1:57 PM | Data Range: 2010Q10-2013Q2 *Data from the California SGIP.
Eligible Costs May Include: Planning & Feasibility Study, Engineering & Design, Permitting, Self-Generation EquipmentWaste Heat Recovery Costs, Construction & Installation Costs, Gas & Electric Interconnection, Warranty, Maintenance ContractMetering, Monitoring & Data Acquisition System, Emission Control Equipment CapitalGasline Installation, Fuel Gas Clean-up Equipment, Electricity Storage Devices, Bond to Certify Renewable FuelSales Tax, Fuel Supply (digesters, gas gathering, etc.), Thermal Load, & Other Eligible Costs
Without incentives, fuel cells have a cost disadvantage compared to other technologies

20
Average Eligible Cost for Biogas Sources
0 200 400 600 800 1000 >10000
2000
4000
6000
8000
10000
12000
Average Eligible Cost $2010/kW Biogas Source*Without Incentives
System Size (kW)
$201
0/kW
of In
stal
led
Cap
acity
DirectedOnsite
0 200 400 600 800 1000 >10000
2000
4000
6000
8000
Average Eligible Cost $2010/kW Biogas Source*With Incentives
System Size (kW)
$201
0/kW
of In
stal
led
Cap
acity
DirectedOnsite
NREL cdp_stat_16Created: Sep-30-13 1:57 PM | Data Range: 2010Q10-2013Q2 *Data from the California SGIP.
Eligible Costs May Include: Planning & Feasibility Study, Engineering & Design, Permitting, Self-Generation EquipmentWaste Heat Recovery Costs, Construction & Installation Costs, Gas & Electric Interconnection, Warranty, Maintenance ContractMetering, Monitoring & Data Acquisition System, Emission Control Equipment CapitalGasline Installation, Fuel Gas Clean-up Equipment, Electricity Storage Devices, Bond to Certify Renewable FuelSales Tax, Fuel Supply (digesters, gas gathering, etc.), Thermal Load, & Other Eligible Costs
Directed biogas systems tend to cost more than onsite sources

21
Mean Time Between Stoppage (For Any Reason)
0 1000 2000 3000 4000 5000 6000 7000 8000 9000 10000 11000 12000 13000 140000
5
10
15
20
25
30
35
40
% o
f Uni
ts
Mean Time (hr) between Stoppages
Mean Time Between Stoppage (hours)*
NREL cdp_stat_17Created: Sep-30-13 1:57 PM | Data Range: 2010Q10-2013Q2
Overall Mean = 2742 hours
*Data from outside the SGIP.

22
Mean Unit Lifetime Electrical Efficiency (%HHV)
10 15 20 25 30 35 40 450
5
10
15
20
25
30
35
% o
f Uni
ts
Mean Unit Electrical Efficiency (% HHV)
Unit Lifetime Mean Electrical Efficiency (HHV)*†
NREL cdp_stat_18Created: Sep-30-13 2:04 PM | Data Range: 2010Q10-2013Q2
Overall Mean = 27 %
†Includes startup, shutdown, transient and partial power operation *Data from outside the SGIP.
Efficiency includes startup, shutdown, transients, and part
load

23
Mean Unit Lifetime Availability
40 45 50 55 60 65 70 75 80 85 90 95 1000
5
10
15
20
25
30
35
40
% o
f Uni
ts
Mean Unit Availability (%)
Unit Mean Availability*
NREL cdp_stat_19Created: Sep-30-13 1:57 PM | Data Range: 2010Q10-2013Q2
Overall Mean = 93 %
*Data from outside the SGIP.
Availability includes stoppages for all
reasons, including customer request
24
Conclusions
• Stationary fuel cell deployments are accelerating despite decreasing incentives
• Current SGIP incentives make FC systems more competitive with other distributed generation systems
• Lack of available directed biogas in CA has caused new SGIP installations to be natural gas
• Cost curves need to begin going down (not up) to accommodate decreasing incentives
• NREL will continue to update results as new data are available

25
Acknowledgements
This project was supported by the Technology Validation subprogram of the U.S. Department of Energy’s Fuel Cell Technologies Office.