Evaluation of Responsible Beverage Service to … of responsible beverage service to reduce impaired...
89
Evaluation of Responsible Beverage Service to Reduce Impaired Driving by 21- to 34-Year-Old Drivers
Transcript of Evaluation of Responsible Beverage Service to … of responsible beverage service to reduce impaired...
Evaluation of Responsible Beverage Service to Reduce Impaired Driving by 21- to 34-Year-Old Drivers
DISCLAIMER
This publication is distributed by the U.S. Department of Transportation, National Highway Traffic Safety Administration, in the interest of information exchange. The opinions, findings, and conclusions expressed in this publication are those of the authors and not necessarily those of the Department of Transportation or the National Highway Traffic Safety Administration. The United States Government assumes no liability for its contents or use thereof. If trade names, manufacturers’ names, or specific products are mentioned, it is because they are considered essential to the object of the publication and should not be construed as an endorsement. The United States Government does not endorse products or manufacturers.
Suggested APA Format Citation:
Fell, J. C., Fisher, D. A., Yao, J., McKnight, A. S., Blackman, K. O., & Coleman, H. L. (2017, April). Evaluation of responsible beverage service to reduce impaired driving by 21- to 34-year-old drivers (Report No. DOT HS 812 398). Washington, DC: National Highway Traffic Safety Administration.
i
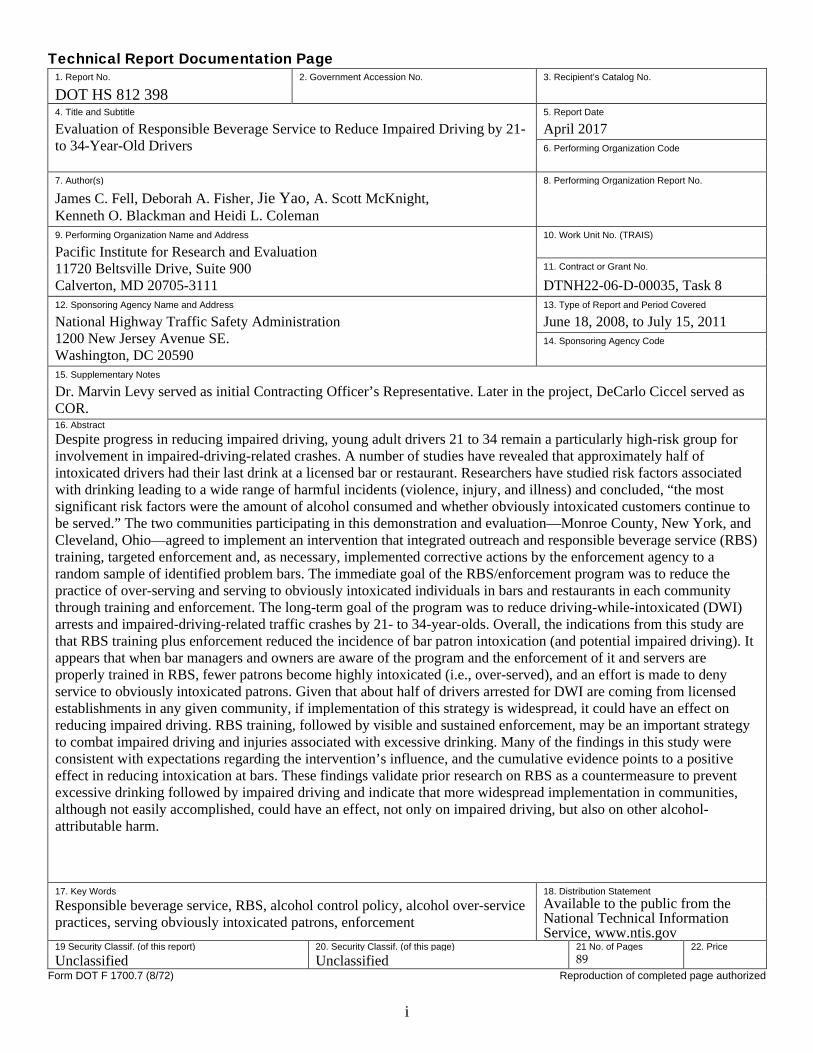
Technical Report Documentation Page 1. Report No. 2. Government Accession No. 3. Recipient’s Catalog No.
DOT HS 812 398 4. Title and Subtitle 5. Report Date
Evaluation of Responsible Beverage Service to Reduce Impaired Driving by 21- to 34-Year-Old Drivers
April 2017 6. Performing Organization Code
7. Author(s) 8. Performing Organization Report No.
James C. Fell, Deborah A. Fisher, Jie Yao, A. Scott McKnight, Kenneth O. Blackman and Heidi L. Coleman
9. Performing Organization Name and Address 10. Work Unit No. (TRAIS)
Pacific Institute for Research and Evaluation 11720 Beltsville Drive, Suite 900 Calverton, MD 20705-3111
11. Contract or Grant No.
DTNH22-06-D-00035, Task 8 12. Sponsoring Agency Name and Address 13. Type of Report and Period Covered
National Highway Traffic Safety Administration 1200 New Jersey Avenue SE. Washington, DC 20590
June 18, 2008, to July 15, 2011 14. Sponsoring Agency Code
15. Supplementary Notes
Dr. Marvin Levy served as initial Contracting Officer’s Representative. Later in the project, DeCarlo Ciccel served as COR. 16. Abstract
Despite progress in reducing impaired driving, young adult drivers 21 to 34 remain a particularly high-risk group for involvement in impaired-driving-related crashes. A number of studies have revealed that approximately half of intoxicated drivers had their last drink at a licensed bar or restaurant. Researchers have studied risk factors associated with drinking leading to a wide range of harmful incidents (violence, injury, and illness) and concluded, “the most significant risk factors were the amount of alcohol consumed and whether obviously intoxicated customers continue to be served.” The two communities participating in this demonstration and evaluation—Monroe County, New York, and Cleveland, Ohio—agreed to implement an intervention that integrated outreach and responsible beverage service (RBS) training, targeted enforcement and, as necessary, implemented corrective actions by the enforcement agency to a random sample of identified problem bars. The immediate goal of the RBS/enforcement program was to reduce the practice of over-serving and serving to obviously intoxicated individuals in bars and restaurants in each community through training and enforcement. The long-term goal of the program was to reduce driving-while-intoxicated (DWI) arrests and impaired-driving-related traffic crashes by 21- to 34-year-olds. Overall, the indications from this study are that RBS training plus enforcement reduced the incidence of bar patron intoxication (and potential impaired driving). It appears that when bar managers and owners are aware of the program and the enforcement of it and servers are properly trained in RBS, fewer patrons become highly intoxicated (i.e., over-served), and an effort is made to deny service to obviously intoxicated patrons. Given that about half of drivers arrested for DWI are coming from licensed establishments in any given community, if implementation of this strategy is widespread, it could have an effect on reducing impaired driving. RBS training, followed by visible and sustained enforcement, may be an important strategy to combat impaired driving and injuries associated with excessive drinking. Many of the findings in this study were consistent with expectations regarding the intervention’s influence, and the cumulative evidence points to a positive effect in reducing intoxication at bars. These findings validate prior research on RBS as a countermeasure to prevent excessive drinking followed by impaired driving and indicate that more widespread implementation in communities, although not easily accomplished, could have an effect, not only on impaired driving, but also on other alcohol-attributable harm. 17. Key Words 18. Distribution Statement
Responsible beverage service, RBS, alcohol control policy, alcohol over-service practices, serving obviously intoxicated patrons, enforcement
Available to the public from the National Technical Information Service, www.ntis.gov
19 Security Classif. (of this report) 20. Security Classif. (of this page) 21 No. of Pages 22. Price
Unclassified Unclassified 89 Form DOT F 1700.7 (8/72) Reproduction of completed page authorized
Evaluation of a Responsible Beverage Service to Reduce Impaired Driving by 21- to 34-Year-Old Drivers
ii
LIST OF ACRONYMS ABC ............................... alcohol beverage control APIS .............................. Alcohol Policy Information System ASK ............................... Alcohol Server Knowledge BAC ............................... blood alcohol concentration BMV .............................. Bureau of Motor Vehicles BRFSS ........................... Behavioral Risk Factor Surveillance System CPD ............................... Cleveland Police Department DDP ............................... drunk driving programs DMV .............................. Department of Motor Vehicles DWI ............................... Driving while intoxicated e-TIPS ............................ Electronic Training for Intervention Procedures FAIR .............................. Fundamentals of Alcohol Intoxication Recognition FARS ............................. Fatality Analysis Reporting System g/dL ............................... grams per deciliter IPS ................................. Institute for Public Strategies IRB ................................ Institutional Review Board MCSO ............................ Monroe County Sheriff’s Office MVD .............................. multiple-vehicle daytime NIAAA .......................... National Institute on Alcohol Abuse and Alcoholism OIU ................................ Ohio Investigative Unit OR ................................. odds ratios PBT ................................ preliminary breath test POLD............................. Place of last drink RBS ............................... responsible beverage service RBSS ............................. Responsible Beverage Sales and Service SLA ............................... State Liquor Authority SVN ............................... single-vehicle nighttime UH ................................. University Hospitals Case Medical Center VIF................................. variance inflation factor
Evaluation of a Responsible Beverage Service to Reduce Impaired Driving by 21- to 34-Year-Old Drivers
iii
ACKNOWLEDGMENTS We extend our thanks to the following key individuals for their outstanding management
and dedication in the implementation of the programs.
Peggy Duffy, Monroe County (New York) STOP DWI Coordinator
Linda Miano, RBS Project Manager, Monroe County (New York)
Dr. Kathryn L. Wesolowski, Program Manager, Rainbow Injury Prevention Center, University Hospitals Rainbow Babies and Children’s Hospital, Cleveland, Ohio
Dr. Susan Connor, Research Manager, Rainbow Injury Prevention Center, University Hospitals Rainbow Babies and Children’s Hospital, Cleveland, Ohio
We also express our thanks to the following organizations for their participation and cooperation in this project.
In Monroe County, New York:
• Monroe County STOP-DWI Program
• New York State Liquor Authority
• Monroe County Sheriff’s Office
• Monroe County Department of Public Safety
• Monroe County Department of Motor Vehicles
• Onondaga County Department of Motor Vehicles
In Cleveland, Ohio:
• Cleveland Police Department
• Ohio Investigative Unit (OIU; the State liquor control agency)
• Case Western Reserve University’s Mt. Sinai Skills and Simulation Center
• Toledo Safe Kids
• Bureau of Motor Vehicles
Evaluation of a Responsible Beverage Service to Reduce Impaired Driving by 21- to 34-Year-Old Drivers
iv
Table of Contents
Background ................................................................................................................................. x
Research Objectives ................................................................................................................... xi
Method ...................................................................................................................................... xii
Results ...................................................................................................................................... xiii
Monroe County ................................................................................................................ xiii
Cleveland ......................................................................................................................... xiv
Discussion ................................................................................................................................ xvi
Conclusion .............................................................................................................................. xvii
Recommendations .................................................................................................................. xviii
Drivers 21 to 34 Years Old ......................................................................................................... 1
Previous Studies on Responsible Beverage Service Programs and Law Enforcement .............. 2
Server Intervention .............................................................................................................. 2
Enforcement of Alcohol Service Laws ............................................................................... 5
Research Objectives .................................................................................................................... 6
Research Questions ..................................................................................................................... 6
Bar Practices ....................................................................................................................... 6
Drinking and Driving .......................................................................................................... 7
Alcohol-Related Harm ........................................................................................................ 7
Overview of Program Implementation ....................................................................................... 8
Identifying Problem Establishments Using POLD Data .................................................... 8
Letter Writing and Bar Assessments ................................................................................... 8
RBS Training ...................................................................................................................... 9
Enhanced Enforcement ....................................................................................................... 9
Monroe County ........................................................................................................................... 9
Community-Based Intervention .......................................................................................... 9
Identification of Problem Bars and Assignment to Conditions ........................................ 10
Letter Writing for Recruitment ......................................................................................... 11
RBS Training .................................................................................................................... 11
Evaluation of a Responsible Beverage Service to Reduce Impaired Driving by 21- to 34-Year-Old Drivers
v
Enhanced Enforcement ..................................................................................................... 13
Cleveland .................................................................................................................................. 13
Community-Based Intervention ........................................................................................ 13
Identification of Problem Bars and Assignment to Conditions ........................................ 14
Letter Writing and Recruitment ........................................................................................ 15
RBS Training .................................................................................................................... 15
Enhanced Enforcement ..................................................................................................... 16
Program Evaluation .................................................................................................................. 16
Evaluation Design ............................................................................................................. 16
Field Data-Collection Activities ....................................................................................... 18
Bar Patron Breath Tests .................................................................................................... 18
Pseudo-Patron Assessments .............................................................................................. 19
Bar Assessments ............................................................................................................... 19
DMV/BMV Data .............................................................................................................. 19
Archival Data Collection .................................................................................................. 19
Calls-for-Service ............................................................................................................... 19
Place-of-Last-Drink .......................................................................................................... 20
DWI Arrests ...................................................................................................................... 20
Traffic Crashes .................................................................................................................. 20
Monroe County ......................................................................................................................... 21
Pseudo Bar Patrons ........................................................................................................... 21
Refusal of Service ............................................................................................................. 21
Attempt at Intervention Provided ...................................................................................... 22
Bar Assessment Data ........................................................................................................ 23
Place of Last Drink Data ................................................................................................... 23
Bar Patrons ........................................................................................................................ 24
Analyses of Mean BACs ................................................................................................... 25
Subgroup Analyses ........................................................................................................... 28
Analysis of Intoxicated Bar Patrons ................................................................................. 29
Analysis of Highly Intoxicated Bar Patrons ..................................................................... 30
Driver Self-Reports of Impaired Driving .................................................................................. 31
Evaluation of a Responsible Beverage Service to Reduce Impaired Driving by 21- to 34-Year-Old Drivers
vi
Impaired-Driving-Related Crashes ................................................................................... 32
DWI Arrests ...................................................................................................................... 33
Calls-for-Service ............................................................................................................... 34
Summary of Analytic Findings ................................................................................................. 35
Cleveland .................................................................................................................................. 36
Pseudo Bar Patrons ........................................................................................................... 36
Refusal of Service ............................................................................................................. 37
Attempt at Intervention Provided ...................................................................................... 39
Bar Assessment Data ........................................................................................................ 40
POLD Data........................................................................................................................ 41
Bar Patrons ........................................................................................................................ 41
Analysis of Mean BACs ................................................................................................... 42
Analyses of Intoxicated Bar Patrons ................................................................................. 44
Analyses of Highly Intoxicated Bar Patrons ..................................................................... 46
Subgroup Analyses ........................................................................................................... 47
Driver Self-Reports of Impaired Driving .......................................................................... 47
Impaired Driving-Related Crashes ................................................................................... 49
Single-Vehicle Nighttime Versus Multiple-Vehicle Daytime Crashes ............................ 50
DWI Arrests ...................................................................................................................... 51
Calls-for-Service ............................................................................................................... 52
Summary of Analytic Findings Cleveland ................................................................................ 52
Monroe County ......................................................................................................................... 55
Cleveland .................................................................................................................................. 56
Limitations in Study Design ..................................................................................................... 60
Monroe County ......................................................................................................................... 60
Challenges to Program Implementation ............................................................................ 60
RBS Training .................................................................................................................... 60
Enhanced Enforcement ..................................................................................................... 60
Challenges to Data Collection/Evaluation ........................................................................ 61
Changes in Sample Over Time ......................................................................................... 61
Assessing Where Over-Service Has Occurred ................................................................. 61
Evaluation of a Responsible Beverage Service to Reduce Impaired Driving by 21- to 34-Year-Old Drivers
vii
Use of Female Pseudo-Patrons ......................................................................................... 62
Resistance From Bar Owners ............................................................................................ 62
Project Staff Attrition ........................................................................................................ 62
Cleveland .................................................................................................................................. 63
Challenges to Program Implementation ............................................................................ 63
Identification of Problem Establishments ......................................................................... 63
Challenges to Data Collection/Evaluation ........................................................................ 63
Process Delays .................................................................................................................. 63
Pseudo-Patron Assessments .............................................................................................. 64
Recommendations for Future Demonstrations ......................................................................... 64
TABLES:
Summary Table I. Findings From Monroe County ..................................................................... xiv Summary Table II. Findings in Cleveland .................................................................................... xv
Table 1. Sample Establishments and Changes, Monroe County .................................................. 11 Table 2. RBS Training Sessions by Establishment, Monroe County ........................................... 12 Table 3. Sample Establishments and Changes, Cleveland ........................................................... 15 Table 4. RBS Training Sessions by Establishment, Cleveland .................................................... 16 Table 5. Timeline for Intervention and Data Collection ............................................................... 17 Table 6. Data-Collection Activities and Level of Comparison ..................................................... 18 Table 7. Service Outcome for Monroe County Pseudo-Patrons by Period .................................. 22 Table 8. Percentage of Refusals for Monroe County Pseudo-Patrons by Period ......................... 22 Table 9. Percentage of Pseudo-Patrons in Monroe County Provided With Some Type of Server
Intervention by Period .................................................................................................. 23 Table 10. Numbers of Observation of Service to Intoxicated Patrons by Bar Type and Period .. 23 Table 11. Number of POLD Mentions by Bar Type and Period .................................................. 24 Table 12. Mean BAC for Monroe County Intervention and Control Bar Patrons by Period ....... 25 Table 13. Mean BAC for Monroe County Intervention and Control Bar Patrons by Period and
Age Group .................................................................................................................... 26 Table 14. Mean BAC for Monroe County Intervention and Control Bar Patrons by Period and
Gender .......................................................................................................................... 26 Table 15. ANOVA Results for Individual Bar Patron’s Mean BAC, Comparing the Three
Periods .......................................................................................................................... 27 Table 16. ANOVA Results for Individual Bar Patron’s Mean BACs From Pre-Intervention to the
Second Post-Intervention Period .................................................................................. 27
Evaluation of a Responsible Beverage Service to Reduce Impaired Driving by 21- to 34-Year-Old Drivers
viii
Table 17. BAC Group for Monroe County Intervention and Control Bar Patrons by Period ...... 29 Table 18. Percentage of Monroe County Intervention and Control Bar Patrons at .08 BAC or
Higher, by Period ......................................................................................................... 29 Table 19. Percentage of Monroe County Intervention and Control Bar Patrons at .15 BAC or
Higher, by Period ......................................................................................................... 30 Table 20. Logistic Regression Results for Highly Intoxicated Bar Patrons (BAC ≥.15), First
Versus Second Post-Intervention Period ...................................................................... 30 Table 21. Proportion of 21- to 34-Year-Olds Who Reported Driving After Drinking by
Community Type and Period ....................................................................................... 31 Table 22. Proportion of 21- to 34-Year-Olds Who Reported Driving After Drinking Too Much
by Community Type and Period .................................................................................. 32 Table 23. Proportion of 21- to 34-Year-Olds Who Reported Drinking Too Much in
Bars/Restaurants Before Driving by Community Type and Period ............................. 32 Table 24. The Pre-Intervention Period: Summary of Crashes in Monroe and Onondaga Counties
...................................................................................................................................... 32 Table 25. The Intervention Period: Summary of Crashes in Monroe and Onondaga Counties ... 33 Table 26. Average Number of DWI Arrests by Age Group and Period in Monroe County ........ 33 Table 27. Average Number of DWI Arrests by Age Group and Period in Onondaga County .... 34 Table 28. Average Monthly Numbers of Calls-for-Service by Bar Type and Period .................. 34 Table 29. ANOVA Results for Number of Calls-for-Service From Pre-Intervention to Post-
Intervention .................................................................................................................. 34 Table 30. Summary of Findings From Monroe County ............................................................... 35 Table 31. Summary of Subgroup Analyses Findings ................................................................... 36 Table 32. Service Outcome for Cleveland Pseudo-Patrons by Period .......................................... 37 Table 33. Percentage of Refusals for Cleveland Pseudo-Patrons by Period ................................. 38 Table 34. Logistic Regression Results for Pseudo-Patrons Refused Service, Pre-Intervention
Versus Both Post-Intervention Periods ........................................................................ 38 Table 35. Logistic Regression Results for Pseudo-Patrons Refused Service, First Versus Second
Post-Intervention Period ............................................................................................... 39 Table 36. Percentage of Pseudo-Patrons in Cleveland Provided with Some Type of Server
Intervention by Period .................................................................................................. 39 Table 37. Logistic Regression Results for Pseudo-Patrons to Whom an Attempt at Intervention
Was Provided, Pre-Intervention Versus Both Post-Intervention Periods ..................... 40 Table 38. Logistic Regression Results for Pseudo-Patrons to Whom an Attempt at Intervention
Was Provided, First Versus Second Post-Intervention Period ..................................... 40 Table 39. Numbers of Observation of Service to Intoxicated Patrons by Bar Type and Period .. 41 Table 40. Mean BAC for Cleveland Intervention and Control Bar Patrons by Period ................ 42 Table 41. Mean BAC for Cleveland Intervention and Control Bar Patrons by Period and Age
Group ............................................................................................................................ 43 Table 42. Mean BAC for Cleveland Intervention and Control Bar Patrons by Period and Gender
...................................................................................................................................... 43
Evaluation of a Responsible Beverage Service to Reduce Impaired Driving by 21- to 34-Year-Old Drivers
ix
Table 43. ANOVA Results for Individual Bar Patron’s Mean BAC, Comparing the Three Periods .......................................................................................................................... 44
Table 44. BAC Group for Cleveland Intervention and Control Bar Patrons by Period ............... 44 Table 45. Percentage of Cleveland Intervention and Control Bar Patrons at .08 BAC or Higher,
by Period ....................................................................................................................... 44 Table 46. Logistic Regression Results for Intoxicated Bar Patrons (BAC ≥.08), Pre-Intervention
Versus Both Post-Intervention Periods ........................................................................ 45 Table 47. Logistic Regression Results for Intoxicated Bar Patrons (BAC ≥.08), First Versus
Second Post-Intervention Period .................................................................................. 46 Table 48. Percentage of Cleveland Intervention and Control Bar Patrons at .15 BAC or Higher,
by Period ....................................................................................................................... 46 Table 49. Proportion of 21- to 34-Year-Olds Who Reported Driving after Drinking by
Community Type and Period ....................................................................................... 47 Table 50. Proportion of 21- to 34-Year-Olds Who Reported Driving after Too Much by
Community Type and Period ....................................................................................... 48 Table 51. Proportion of 21- to 34-Year-Olds Who Reported Drinking Too Much in
Bars/Restaurants Before Driving by Community Type and Period ............................. 48 Table 52. Logistic Regression Results for Driving After Drinking Too Much, Pre-Intervention
Versus Both Post-Intervention Periods ........................................................................ 48 Table 53. Logistic Regression Results for Driving After Drinking Too Much, First Versus
Second Post-Intervention Period .................................................................................. 49 Table 54. Logistic Regression Results for Driving After Drinking Too Much, Pre-Intervention
Versus Both Post-Intervention Periods ........................................................................ 49 Table 55. Average Monthly Totals of Alcohol-related Crashes/Injuries/Deaths Involving
Drinking Drivers 21 to 34 Years Old, by Community and Period ............................... 50 Table 56. Ratios of Single-Vehicle Nighttime Crashes to Multiple-Vehicle Daytime Crashes
Among 21- to 34-Year-Olds, by Community and Period ............................................ 50 Table 57. Numbers of Single-Vehicle Nighttime Crashes Among 21- to 34-year-olds, by
Community and Period ................................................................................................. 51 Table 58. Average Monthly Numbers of DWI Arrests by Period in Cleveland ........................... 51 Table 59. Average Monthly Numbers of DWI Arrests by Period in Toledo ................................ 51 Table 60. Average Monthly Numbers of Calls-for-Service by Bar Type and Period .................. 52 Table 61. Summary of Overall Sample Findings .......................................................................... 52 Table 62. Summary of Subgroup Analyses Findings ................................................................... 53
Evaluation of a Responsible Beverage Service to Reduce Impaired Driving by 21- to 34-Year-Old Drivers
x
EXECUTIVE SUMMARY
Background Despite progress in reducing impaired driving, drivers 21 to 34 years old remain a
particularly high-risk group for involvement in impaired-driving-related crashes. In 2014, 21- to 34-year-olds accounted for 42 percent of the impaired drivers (i.e., those with a blood alcohol concentration [BAC] of .08 grams per deciliter [g/dL] or greater) of all ages in fatal crashes and 30 percent of all drivers (drinking or not drinking) in fatal crashes. The proportion of drivers in fatal crashes in 2014 with BACs of .08 or greater for drivers 21 to 24 was 30 percent, followed by drivers 25 to 34 at 29 percent (National Center for Statistics and Analysis, 2015). Kennedy, Isaac, and Graham (1996) found that 70 percent of fatally injured male drinking drivers in the Fatality Analysis Reporting System (FARS) were 21 to 39 years, with 65 percent of them having a BAC of .15 or greater.
In response to the overall problem of impaired driving, a variety of public health efforts have been undertaken including media campaigns, enforcement initiatives, and legal and policy efforts (e.g., reducing the illegal BAC limit to .08). Strong enforcement of impaired-driving laws can be effective in reducing impaired-driving-related crashes involving drivers 21 to 34. However, other programs aimed at reducing excessive drinking can work to prevent driving after drinking, ultimately reducing not only injuries, but also the costs of driving-while-intoxicated (DWI) convictions for alcohol-impaired drivers of all ages. Such programs, which change the environment that promotes risky drinking-driving behavior, are of particular interest to the National Highway Traffic Safety Administration and other safety researchers and advocates.
Several studies have revealed that approximately half of intoxicated drivers had their last drink at a licensed bar or restaurant (Wolfe, 1975; Damkot, 1979; Ontario Ministry of Transport and Communications, 1980; O’Donnell, 1985; Palmer, 1986; Foss, Perrine, Meyers, Musty, & Voas, 1990; Eby, 1995; Anglin, Caverson, Fennel, Giesbrecht, & Mann, 1997; Lacey et al., 2009; Fell, Tippetts, & Voas, 2010). Stockwell, Lang, and Rydon (1993) studied risk factors associated with drinking that led to a wide range of harmful incidents (violence, injury, and illness) and concluded, “the most significant risk factors were the amount of alcohol consumed and whether obviously intoxicated customers continue to be served.”
Except in a few jurisdictions, the service of alcohol to intoxicated patrons is prohibited by State or local law, as well as by liquor control regulation. In addition, Dram Shop laws in most States allow injured third parties to recover damages from licensed establishments when the crash resulted from the service of alcohol to intoxicated patrons (NHTSA, 2016). Given the high proportion of alcohol-impaired drivers who come from licensed establishments, it is evident that these legal measures have not prevented intoxicated patrons from being served or from leaving licensed establishments in an intoxicated condition. In recent years, restricting alcohol at the point of sale has increased in an effort to reduce impaired-driving-related motor-vehicle crashes and other negative consequences of alcohol abuse.
Evaluation of a Responsible Beverage Service to Reduce Impaired Driving by 21- to 34-Year-Old Drivers
xi
In a systematic review of interventions designed to reduce alcohol use and related harms in drinking environments (Jones, Hughes, Atkinson, & Bellis, 2011), effects of server intervention programs on patrons’ alcohol consumption were mixed. However, one study of statewide mandated server training (Holder & Wagenaar, 1994) showed that such training had a statistically significant effect on single-vehicle nighttime crashes. Another study (Graham et al., 2004) found that an intervention designed to reduce aggression among bar patrons had a modest influence on severe and moderate patron aggression. Following introduction of an experimental alcohol service enforcement effort in one Michigan county, denial of service to pseudo-patrons (individuals recruited by the researcher to pose as patrons, according to protocols established by the researcher) simulating signs of intoxication rose from 18 percent to 54 percent of visits to licensed establishments, a threefold increase (McKnight & Streff, 1994). Simultaneously, the proportion of arrested drinking drivers coming from bars and restaurants declined from 32 percent to 23 percent, a decrease of more than 25 percent. The results of these studies show that responsible beverage service (RBS) training and follow-up enforcement and/or monitoring can be a tool in lowering the rates of high-risk alcohol consumption and impaired driving. Some of these results suggest that RBS training can be effectively implemented as one aspect of a multicomponent intervention.
Research Objectives To test the effectiveness of a multicomponent intervention with RBS to reduce impaired
driving among 21- to 34-year-olds, NHTSA funded two demonstration projects and their evaluations. In the summer of 2007, two communities were selected—Monroe County, New York (through the Monroe County STOP-DWI Program), and Cleveland (through University Hospitals Case Medical Center)—in which the RBS and enhanced alcohol enforcement intervention would be conducted and the data for the evaluation would be collected. The overall goal of the RBS/enforcement program was to reduce over-service practices and the frequency of serving to obviously intoxicated individuals in bars and restaurants in each community through training and enforcement. The long-term goal of the program was to reduce DWI arrests and impaired-driving-related traffic crashes in the 21- to 34-year-old age group.
Within the two treatment communities, we compared 10 intervention and 10 control bars to gauge the effects of the RBS/enforcement program on serving practices. Specifically, we measured the changes in the frequency of service to and intervention with visibly intoxicated pseudo-patrons, the reductions in the frequency of place-of-last-drink (POLD) mentions of RBS-trained establishments among drivers arrested for DWI, and patrons’ drinking behavior (e.g., changes in the frequency of high-BAC patrons leaving intervention establishments). Contrasts between the two treatment communities (Monroe County and Cleveland) and their respective comparison communities (Onondaga County, New York, and Toledo, Ohio) were used to examine broader changes beyond those affecting only bars and their patrons. These comparisons investigated changes from pre- to post-intervention in public attitudes and reports of driving while impaired, DWI arrests, and the ratio of impaired-driving-related crashes to non-impaired-driving-related crashes.
Evaluation of a Responsible Beverage Service to Reduce Impaired Driving by 21- to 34-Year-Old Drivers
xii
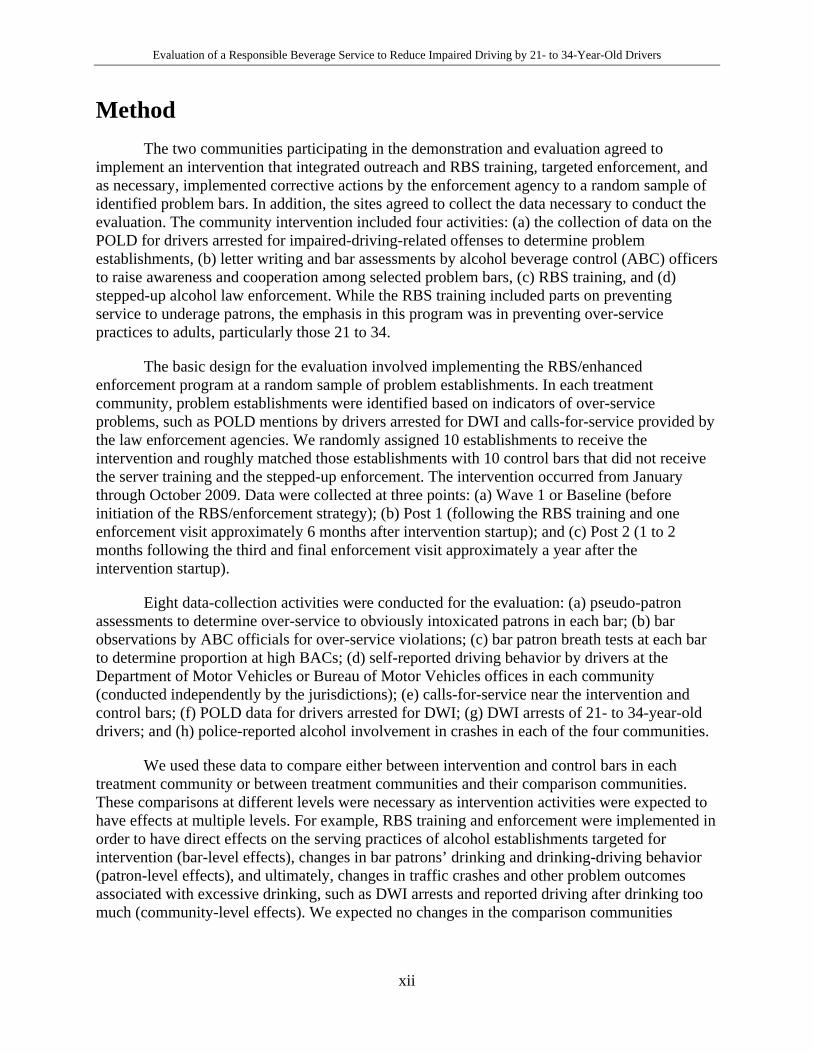
Method The two communities participating in the demonstration and evaluation agreed to
implement an intervention that integrated outreach and RBS training, targeted enforcement, and as necessary, implemented corrective actions by the enforcement agency to a random sample of identified problem bars. In addition, the sites agreed to collect the data necessary to conduct the evaluation. The community intervention included four activities: (a) the collection of data on the POLD for drivers arrested for impaired-driving-related offenses to determine problem establishments, (b) letter writing and bar assessments by alcohol beverage control (ABC) officers to raise awareness and cooperation among selected problem bars, (c) RBS training, and (d) stepped-up alcohol law enforcement. While the RBS training included parts on preventing service to underage patrons, the emphasis in this program was in preventing over-service practices to adults, particularly those 21 to 34.
The basic design for the evaluation involved implementing the RBS/enhanced enforcement program at a random sample of problem establishments. In each treatment community, problem establishments were identified based on indicators of over-service problems, such as POLD mentions by drivers arrested for DWI and calls-for-service provided by the law enforcement agencies. We randomly assigned 10 establishments to receive the intervention and roughly matched those establishments with 10 control bars that did not receive the server training and the stepped-up enforcement. The intervention occurred from January through October 2009. Data were collected at three points: (a) Wave 1 or Baseline (before initiation of the RBS/enforcement strategy); (b) Post 1 (following the RBS training and one enforcement visit approximately 6 months after intervention startup); and (c) Post 2 (1 to 2 months following the third and final enforcement visit approximately a year after the intervention startup).
Eight data-collection activities were conducted for the evaluation: (a) pseudo-patron assessments to determine over-service to obviously intoxicated patrons in each bar; (b) bar observations by ABC officials for over-service violations; (c) bar patron breath tests at each bar to determine proportion at high BACs; (d) self-reported driving behavior by drivers at the Department of Motor Vehicles or Bureau of Motor Vehicles offices in each community (conducted independently by the jurisdictions); (e) calls-for-service near the intervention and control bars; (f) POLD data for drivers arrested for DWI; (g) DWI arrests of 21- to 34-year-old drivers; and (h) police-reported alcohol involvement in crashes in each of the four communities.
We used these data to compare either between intervention and control bars in each treatment community or between treatment communities and their comparison communities. These comparisons at different levels were necessary as intervention activities were expected to have effects at multiple levels. For example, RBS training and enforcement were implemented in order to have direct effects on the serving practices of alcohol establishments targeted for intervention (bar-level effects), changes in bar patrons’ drinking and drinking-driving behavior (patron-level effects), and ultimately, changes in traffic crashes and other problem outcomes associated with excessive drinking, such as DWI arrests and reported driving after drinking too much (community-level effects). We expected no changes in the comparison communities
Evaluation of a Responsible Beverage Service to Reduce Impaired Driving by 21- to 34-Year-Old Drivers
xiii
(Onondaga County and Toledo) on these measures as no similar program was being administered in either community during the intervention period.
Results Monroe County
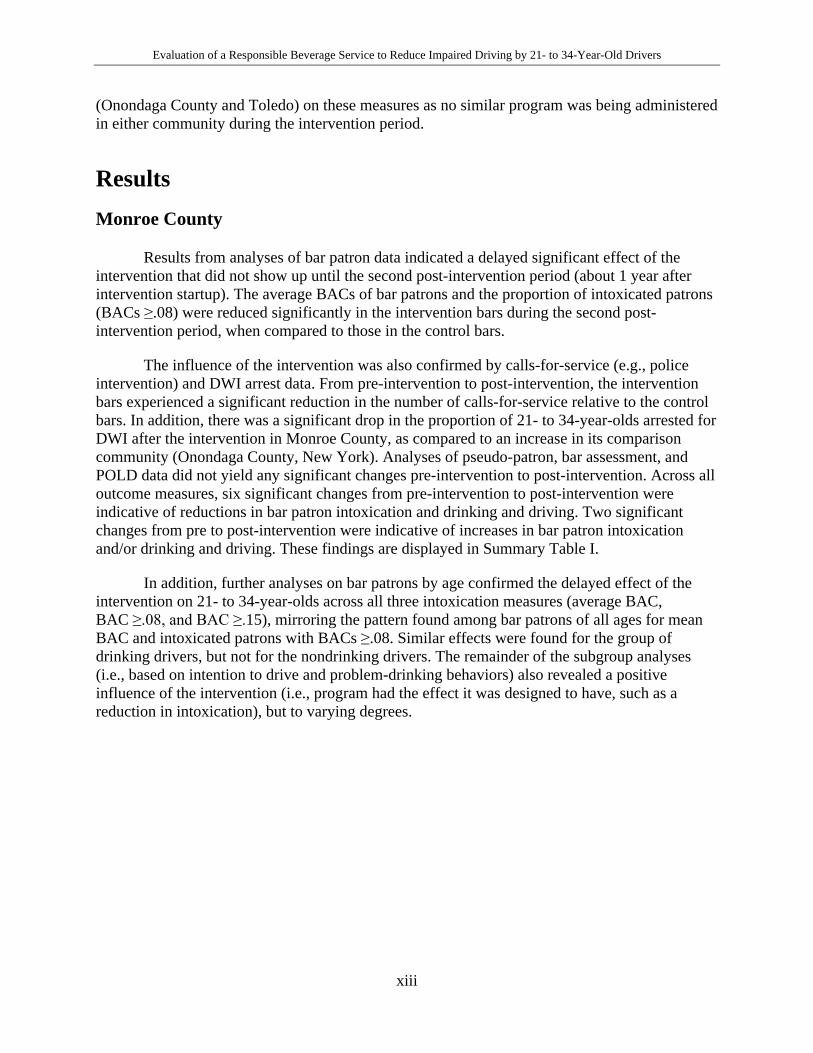
Results from analyses of bar patron data indicated a delayed significant effect of the intervention that did not show up until the second post-intervention period (about 1 year after intervention startup). The average BACs of bar patrons and the proportion of intoxicated patrons (BACs ≥.08) were reduced significantly in the intervention bars during the second post-intervention period, when compared to those in the control bars.
The influence of the intervention was also confirmed by calls-for-service (e.g., police intervention) and DWI arrest data. From pre-intervention to post-intervention, the intervention bars experienced a significant reduction in the number of calls-for-service relative to the control bars. In addition, there was a significant drop in the proportion of 21- to 34-year-olds arrested for DWI after the intervention in Monroe County, as compared to an increase in its comparison community (Onondaga County, New York). Analyses of pseudo-patron, bar assessment, and POLD data did not yield any significant changes pre-intervention to post-intervention. Across all outcome measures, six significant changes from pre-intervention to post-intervention were indicative of reductions in bar patron intoxication and drinking and driving. Two significant changes from pre to post-intervention were indicative of increases in bar patron intoxication and/or drinking and driving. These findings are displayed in Summary Table I.
In addition, further analyses on bar patrons by age confirmed the delayed effect of the intervention on 21- to 34-year-olds across all three intoxication measures (average BAC, BAC ≥.08, and BAC ≥.15), mirroring the pattern found among bar patrons of all ages for mean BAC and intoxicated patrons with BACs ≥.08. Similar effects were found for the group of drinking drivers, but not for the nondrinking drivers. The remainder of the subgroup analyses (i.e., based on intention to drive and problem-drinking behaviors) also revealed a positive influence of the intervention (i.e., program had the effect it was designed to have, such as a reduction in intoxication), but to varying degrees.
Evaluation of a Responsible Beverage Service to Reduce Impaired Driving by 21- to 34-Year-Old Drivers
xiv
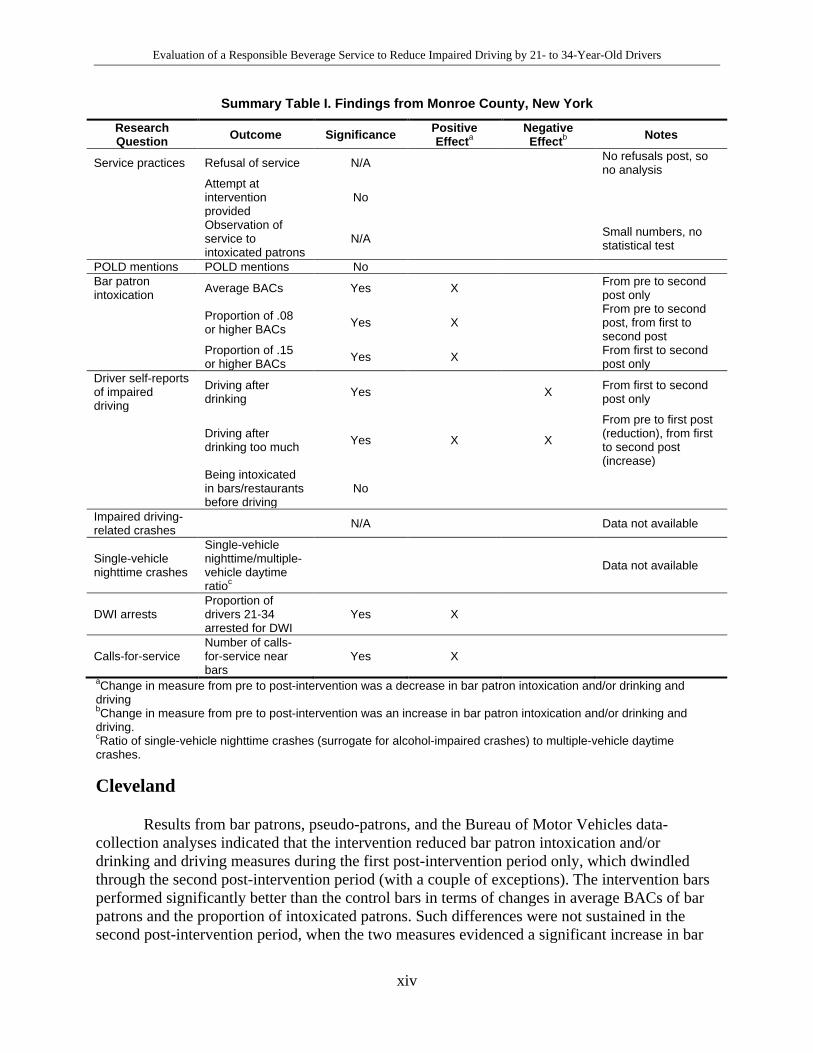
Summary Table I. Findings from Monroe County, New York
Research Question Outcome Significance Positive
Effecta Negative Effectb Notes
Service practices Refusal of service N/A No refusals post, so no analysis
Attempt at intervention provided
No
Observation of service to intoxicated patrons
N/A Small numbers, no statistical test
POLD mentions POLD mentions No Bar patron intoxication Average BACs Yes X From pre to second
post only
Proportion of .08 or higher BACs Yes X
From pre to second post, from first to second post
Proportion of .15 or higher BACs Yes X From first to second
post only Driver self-reports of impaired driving
Driving after drinking Yes X From first to second
post only
Driving after drinking too much Yes X X
From pre to first post (reduction), from first to second post (increase)
Being intoxicated in bars/restaurants before driving
No
Impaired driving-related crashes N/A Data not available
Single-vehicle nighttime crashes
Single-vehicle nighttime/multiple-vehicle daytime ratioc
Data not available
DWI arrests Proportion of drivers 21-34 arrested for DWI
Yes X
Calls-for-service Number of calls-for-service near bars
Yes X
aChange in measure from pre to post-intervention was a decrease in bar patron intoxication and/or drinking and driving
bChange in measure from pre to post-intervention was an increase in bar patron intoxication and/or drinking and driving. cRatio of single-vehicle nighttime crashes (surrogate for alcohol-impaired crashes) to multiple-vehicle daytime crashes.
Cleveland
Results from bar patrons, pseudo-patrons, and the Bureau of Motor Vehicles data-collection analyses indicated that the intervention reduced bar patron intoxication and/or drinking and driving measures during the first post-intervention period only, which dwindled through the second post-intervention period (with a couple of exceptions). The intervention bars performed significantly better than the control bars in terms of changes in average BACs of bar patrons and the proportion of intoxicated patrons. Such differences were not sustained in the second post-intervention period, when the two measures evidenced a significant increase in bar
Evaluation of a Responsible Beverage Service to Reduce Impaired Driving by 21- to 34-Year-Old Drivers
xv
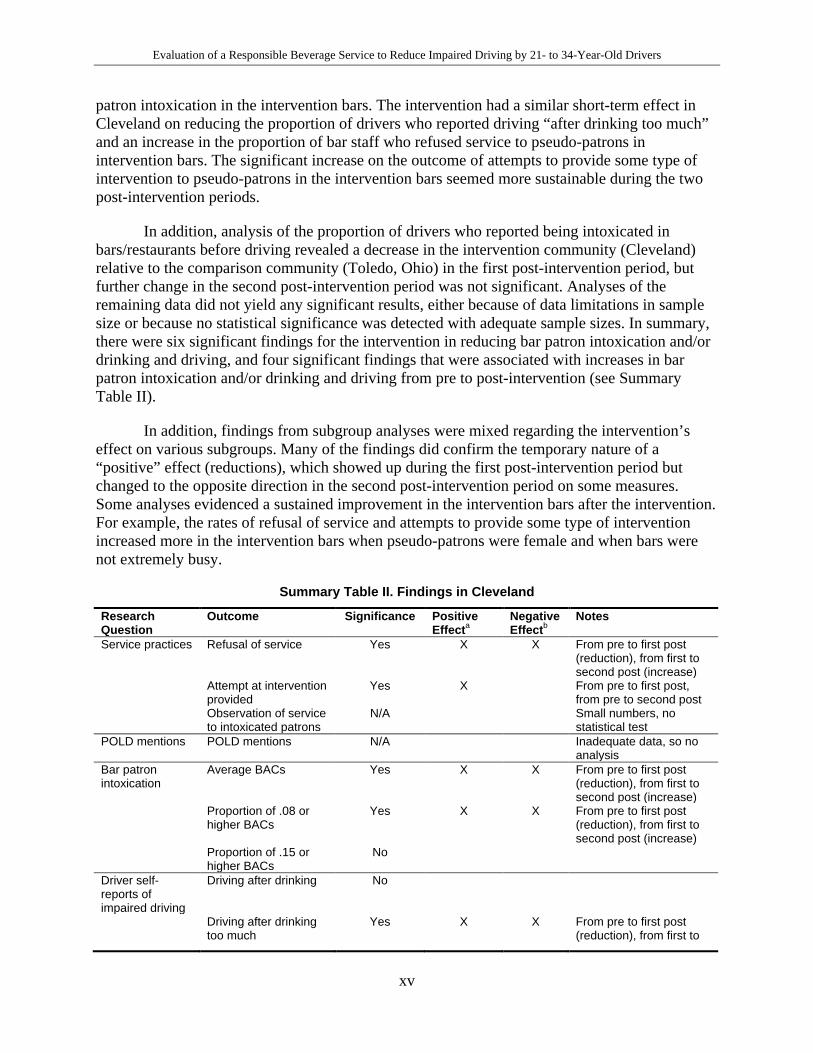
patron intoxication in the intervention bars. The intervention had a similar short-term effect in Cleveland on reducing the proportion of drivers who reported driving “after drinking too much” and an increase in the proportion of bar staff who refused service to pseudo-patrons in intervention bars. The significant increase on the outcome of attempts to provide some type of intervention to pseudo-patrons in the intervention bars seemed more sustainable during the two post-intervention periods.
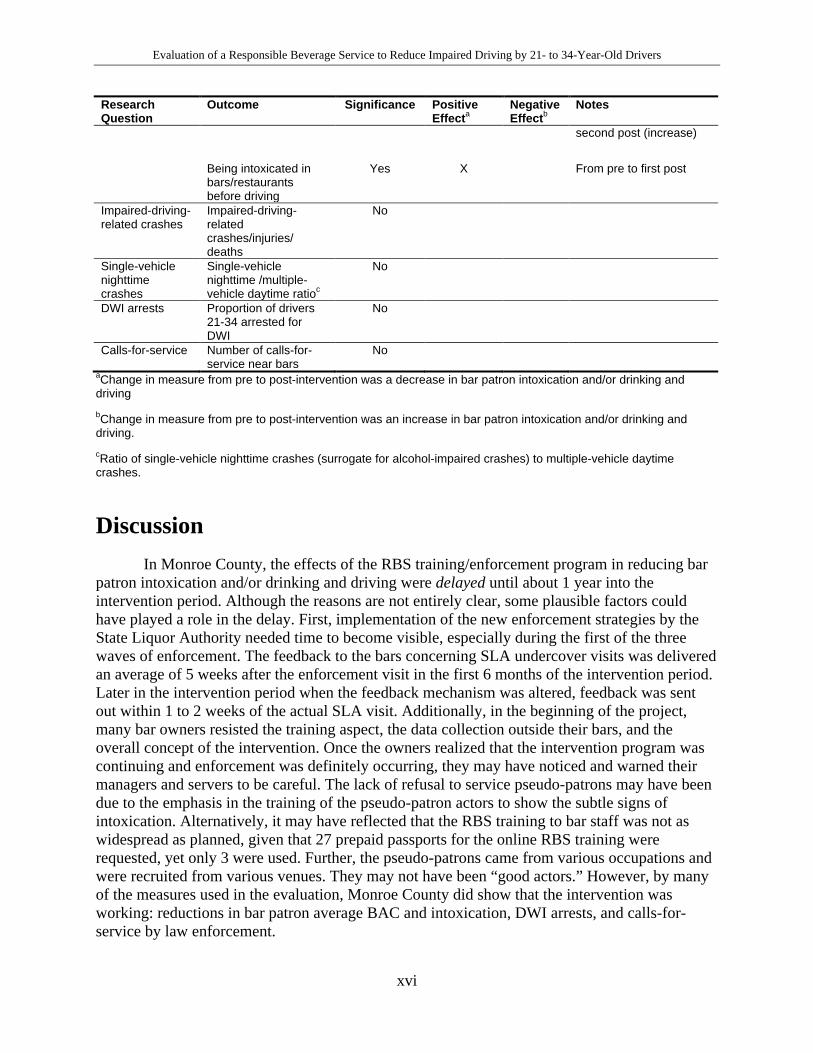
In addition, analysis of the proportion of drivers who reported being intoxicated in bars/restaurants before driving revealed a decrease in the intervention community (Cleveland) relative to the comparison community (Toledo, Ohio) in the first post-intervention period, but further change in the second post-intervention period was not significant. Analyses of the remaining data did not yield any significant results, either because of data limitations in sample size or because no statistical significance was detected with adequate sample sizes. In summary, there were six significant findings for the intervention in reducing bar patron intoxication and/or drinking and driving, and four significant findings that were associated with increases in bar patron intoxication and/or drinking and driving from pre to post-intervention (see Summary Table II).
In addition, findings from subgroup analyses were mixed regarding the intervention’s effect on various subgroups. Many of the findings did confirm the temporary nature of a “positive” effect (reductions), which showed up during the first post-intervention period but changed to the opposite direction in the second post-intervention period on some measures. Some analyses evidenced a sustained improvement in the intervention bars after the intervention. For example, the rates of refusal of service and attempts to provide some type of intervention increased more in the intervention bars when pseudo-patrons were female and when bars were not extremely busy.
Summary Table II. Findings in Cleveland
Research Question
Outcome Significance Positive Effecta
Negative Effectb
Notes
Service practices Refusal of service Yes X X From pre to first post (reduction), from first to second post (increase)
Attempt at intervention provided
Yes X From pre to first post, from pre to second post
Observation of service to intoxicated patrons
N/A Small numbers, no statistical test
POLD mentions POLD mentions N/A Inadequate data, so no analysis
Bar patron intoxication
Average BACs Yes X X From pre to first post (reduction), from first to second post (increase)
Proportion of .08 or higher BACs
Yes X X From pre to first post (reduction), from first to second post (increase)
Proportion of .15 or higher BACs
No
Driver self-reports of impaired driving
Driving after drinking No
Driving after drinking too much
Yes X X From pre to first post (reduction), from first to
Evaluation of a Responsible Beverage Service to Reduce Impaired Driving by 21- to 34-Year-Old Drivers
xvi
Research Question
Outcome Significance Positive Effecta
Negative Effectb
Notes
second post (increase)
Being intoxicated in bars/restaurants before driving
Yes X From pre to first post
Impaired-driving-related crashes
Impaired-driving-related crashes/injuries/ deaths
No
Single-vehicle nighttime crashes
Single-vehicle nighttime /multiple-vehicle daytime ratioc
No
DWI arrests Proportion of drivers 21-34 arrested for DWI
No
Calls-for-service Number of calls-for-service near bars
No
aChange in measure from pre to post-intervention was a decrease in bar patron intoxication and/or drinking and driving
bChange in measure from pre to post-intervention was an increase in bar patron intoxication and/or drinking and driving. cRatio of single-vehicle nighttime crashes (surrogate for alcohol-impaired crashes) to multiple-vehicle daytime crashes.
Discussion In Monroe County, the effects of the RBS training/enforcement program in reducing bar
patron intoxication and/or drinking and driving were delayed until about 1 year into the intervention period. Although the reasons are not entirely clear, some plausible factors could have played a role in the delay. First, implementation of the new enforcement strategies by the State Liquor Authority needed time to become visible, especially during the first of the three waves of enforcement. The feedback to the bars concerning SLA undercover visits was delivered an average of 5 weeks after the enforcement visit in the first 6 months of the intervention period. Later in the intervention period when the feedback mechanism was altered, feedback was sent out within 1 to 2 weeks of the actual SLA visit. Additionally, in the beginning of the project, many bar owners resisted the training aspect, the data collection outside their bars, and the overall concept of the intervention. Once the owners realized that the intervention program was continuing and enforcement was definitely occurring, they may have noticed and warned their managers and servers to be careful. The lack of refusal to service pseudo-patrons may have been due to the emphasis in the training of the pseudo-patron actors to show the subtle signs of intoxication. Alternatively, it may have reflected that the RBS training to bar staff was not as widespread as planned, given that 27 prepaid passports for the online RBS training were requested, yet only 3 were used. Further, the pseudo-patrons came from various occupations and were recruited from various venues. They may not have been “good actors.” However, by many of the measures used in the evaluation, Monroe County did show that the intervention was working: reductions in bar patron average BAC and intoxication, DWI arrests, and calls-for-service by law enforcement.
Evaluation of a Responsible Beverage Service to Reduce Impaired Driving by 21- to 34-Year-Old Drivers
xvii
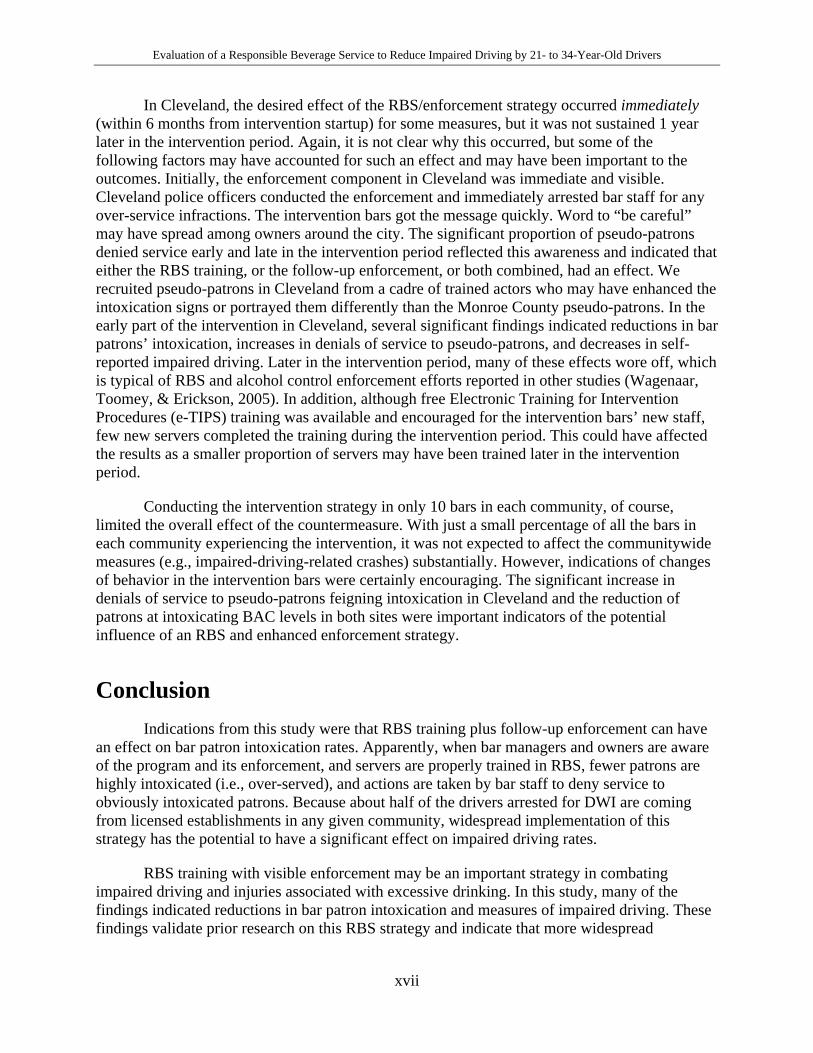
In Cleveland, the desired effect of the RBS/enforcement strategy occurred immediately (within 6 months from intervention startup) for some measures, but it was not sustained 1 year later in the intervention period. Again, it is not clear why this occurred, but some of the following factors may have accounted for such an effect and may have been important to the outcomes. Initially, the enforcement component in Cleveland was immediate and visible. Cleveland police officers conducted the enforcement and immediately arrested bar staff for any over-service infractions. The intervention bars got the message quickly. Word to “be careful” may have spread among owners around the city. The significant proportion of pseudo-patrons denied service early and late in the intervention period reflected this awareness and indicated that either the RBS training, or the follow-up enforcement, or both combined, had an effect. We recruited pseudo-patrons in Cleveland from a cadre of trained actors who may have enhanced the intoxication signs or portrayed them differently than the Monroe County pseudo-patrons. In the early part of the intervention in Cleveland, several significant findings indicated reductions in bar patrons’ intoxication, increases in denials of service to pseudo-patrons, and decreases in self-reported impaired driving. Later in the intervention period, many of these effects wore off, which is typical of RBS and alcohol control enforcement efforts reported in other studies (Wagenaar, Toomey, & Erickson, 2005). In addition, although free Electronic Training for Intervention Procedures (e-TIPS) training was available and encouraged for the intervention bars’ new staff, few new servers completed the training during the intervention period. This could have affected the results as a smaller proportion of servers may have been trained later in the intervention period.
Conducting the intervention strategy in only 10 bars in each community, of course, limited the overall effect of the countermeasure. With just a small percentage of all the bars in each community experiencing the intervention, it was not expected to affect the communitywide measures (e.g., impaired-driving-related crashes) substantially. However, indications of changes of behavior in the intervention bars were certainly encouraging. The significant increase in denials of service to pseudo-patrons feigning intoxication in Cleveland and the reduction of patrons at intoxicating BAC levels in both sites were important indicators of the potential influence of an RBS and enhanced enforcement strategy.
Conclusion Indications from this study were that RBS training plus follow-up enforcement can have
an effect on bar patron intoxication rates. Apparently, when bar managers and owners are aware of the program and its enforcement, and servers are properly trained in RBS, fewer patrons are highly intoxicated (i.e., over-served), and actions are taken by bar staff to deny service to obviously intoxicated patrons. Because about half of the drivers arrested for DWI are coming from licensed establishments in any given community, widespread implementation of this strategy has the potential to have a significant effect on impaired driving rates.
RBS training with visible enforcement may be an important strategy in combating impaired driving and injuries associated with excessive drinking. In this study, many of the findings indicated reductions in bar patron intoxication and measures of impaired driving. These findings validate prior research on this RBS strategy and indicate that more widespread
Evaluation of a Responsible Beverage Service to Reduce Impaired Driving by 21- to 34-Year-Old Drivers
xviii
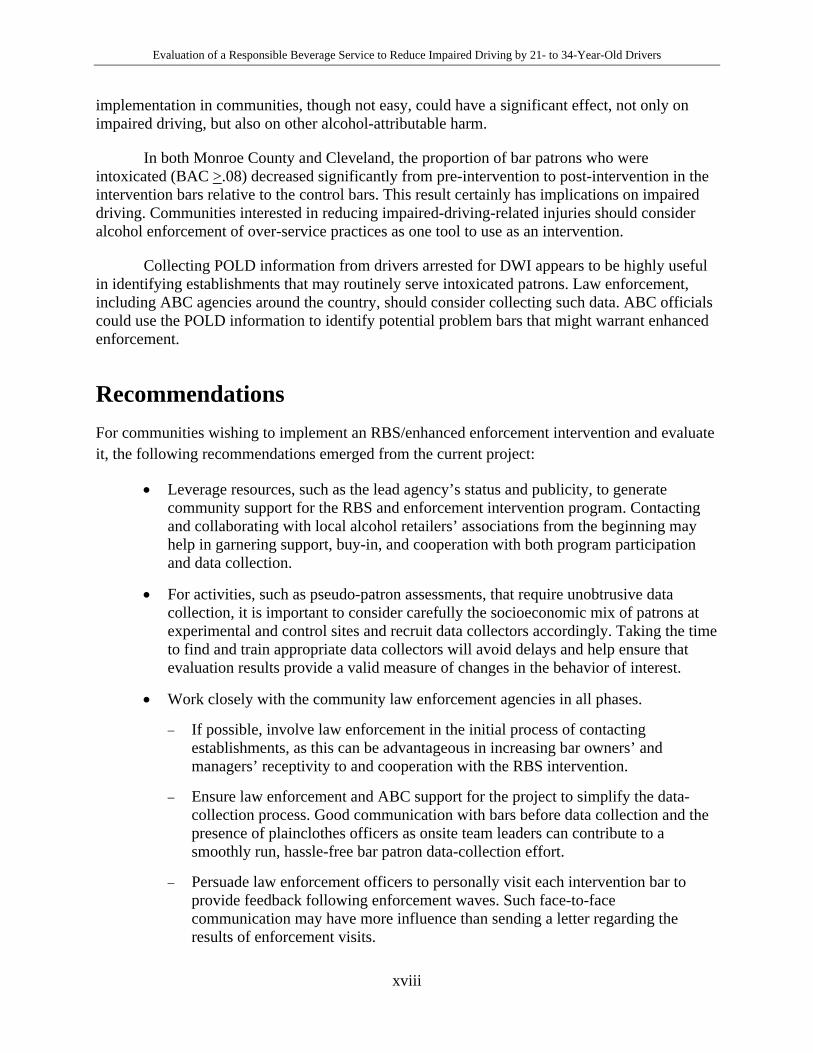
implementation in communities, though not easy, could have a significant effect, not only on impaired driving, but also on other alcohol-attributable harm.
In both Monroe County and Cleveland, the proportion of bar patrons who were intoxicated (BAC >.08) decreased significantly from pre-intervention to post-intervention in the intervention bars relative to the control bars. This result certainly has implications on impaired driving. Communities interested in reducing impaired-driving-related injuries should consider alcohol enforcement of over-service practices as one tool to use as an intervention.
Collecting POLD information from drivers arrested for DWI appears to be highly useful in identifying establishments that may routinely serve intoxicated patrons. Law enforcement, including ABC agencies around the country, should consider collecting such data. ABC officials could use the POLD information to identify potential problem bars that might warrant enhanced enforcement.
Recommendations For communities wishing to implement an RBS/enhanced enforcement intervention and evaluate it, the following recommendations emerged from the current project:
• Leverage resources, such as the lead agency’s status and publicity, to generate community support for the RBS and enforcement intervention program. Contacting and collaborating with local alcohol retailers’ associations from the beginning may help in garnering support, buy-in, and cooperation with both program participation and data collection.
• For activities, such as pseudo-patron assessments, that require unobtrusive data collection, it is important to consider carefully the socioeconomic mix of patrons at experimental and control sites and recruit data collectors accordingly. Taking the time to find and train appropriate data collectors will avoid delays and help ensure that evaluation results provide a valid measure of changes in the behavior of interest.
• Work closely with the community law enforcement agencies in all phases.
− If possible, involve law enforcement in the initial process of contacting establishments, as this can be advantageous in increasing bar owners’ and managers’ receptivity to and cooperation with the RBS intervention.
− Ensure law enforcement and ABC support for the project to simplify the data-collection process. Good communication with bars before data collection and the presence of plainclothes officers as onsite team leaders can contribute to a smoothly run, hassle-free bar patron data-collection effort.
− Persuade law enforcement officers to personally visit each intervention bar to provide feedback following enforcement waves. Such face-to-face communication may have more influence than sending a letter regarding the results of enforcement visits.
Evaluation of a Responsible Beverage Service to Reduce Impaired Driving by 21- to 34-Year-Old Drivers
1
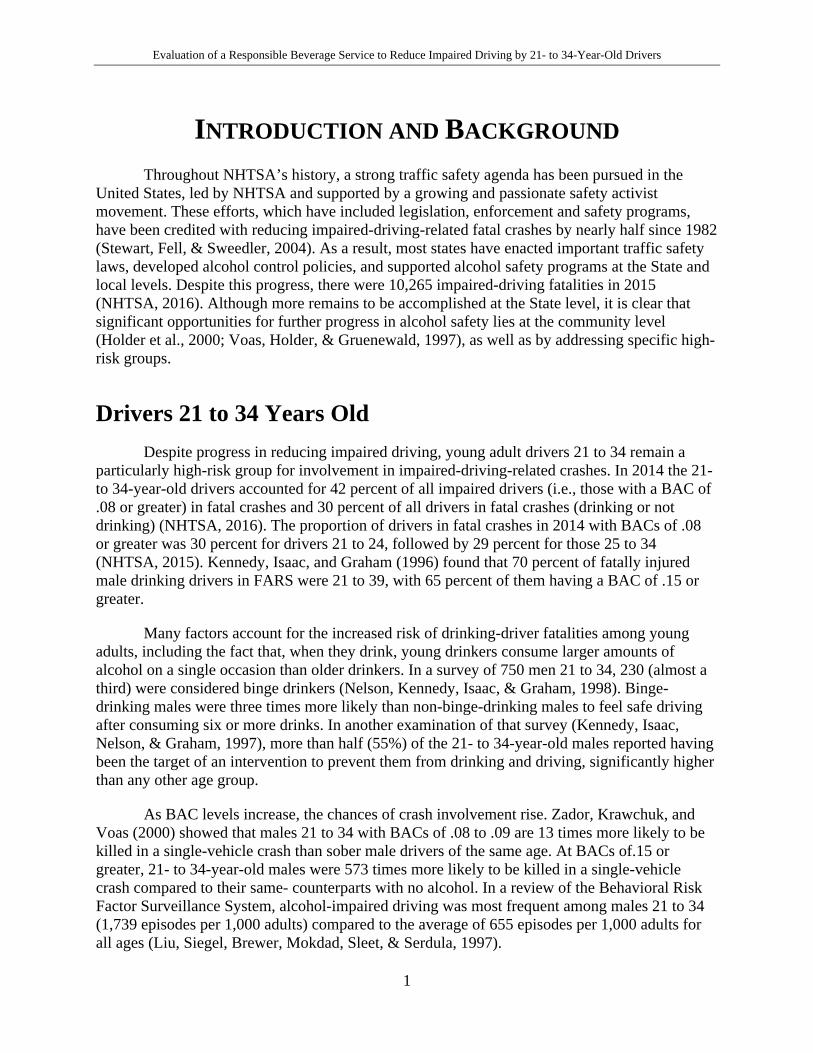
INTRODUCTION AND BACKGROUND Throughout NHTSA’s history, a strong traffic safety agenda has been pursued in the
United States, led by NHTSA and supported by a growing and passionate safety activist movement. These efforts, which have included legislation, enforcement and safety programs, have been credited with reducing impaired-driving-related fatal crashes by nearly half since 1982 (Stewart, Fell, & Sweedler, 2004). As a result, most states have enacted important traffic safety laws, developed alcohol control policies, and supported alcohol safety programs at the State and local levels. Despite this progress, there were 10,265 impaired-driving fatalities in 2015 (NHTSA, 2016). Although more remains to be accomplished at the State level, it is clear that significant opportunities for further progress in alcohol safety lies at the community level (Holder et al., 2000; Voas, Holder, & Gruenewald, 1997), as well as by addressing specific high-risk groups.
Drivers 21 to 34 Years Old Despite progress in reducing impaired driving, young adult drivers 21 to 34 remain a
particularly high-risk group for involvement in impaired-driving-related crashes. In 2014 the 21- to 34-year-old drivers accounted for 42 percent of all impaired drivers (i.e., those with a BAC of .08 or greater) in fatal crashes and 30 percent of all drivers in fatal crashes (drinking or not drinking) (NHTSA, 2016). The proportion of drivers in fatal crashes in 2014 with BACs of .08 or greater was 30 percent for drivers 21 to 24, followed by 29 percent for those 25 to 34 (NHTSA, 2015). Kennedy, Isaac, and Graham (1996) found that 70 percent of fatally injured male drinking drivers in FARS were 21 to 39, with 65 percent of them having a BAC of .15 or greater.
Many factors account for the increased risk of drinking-driver fatalities among young adults, including the fact that, when they drink, young drinkers consume larger amounts of alcohol on a single occasion than older drinkers. In a survey of 750 men 21 to 34, 230 (almost a third) were considered binge drinkers (Nelson, Kennedy, Isaac, & Graham, 1998). Binge-drinking males were three times more likely than non-binge-drinking males to feel safe driving after consuming six or more drinks. In another examination of that survey (Kennedy, Isaac, Nelson, & Graham, 1997), more than half (55%) of the 21- to 34-year-old males reported having been the target of an intervention to prevent them from drinking and driving, significantly higher than any other age group.
As BAC levels increase, the chances of crash involvement rise. Zador, Krawchuk, and Voas (2000) showed that males 21 to 34 with BACs of .08 to .09 are 13 times more likely to be killed in a single-vehicle crash than sober male drivers of the same age. At BACs of.15 or greater, 21- to 34-year-old males were 573 times more likely to be killed in a single-vehicle crash compared to their same- counterparts with no alcohol. In a review of the Behavioral Risk Factor Surveillance System, alcohol-impaired driving was most frequent among males 21 to 34 (1,739 episodes per 1,000 adults) compared to the average of 655 episodes per 1,000 adults for all ages (Liu, Siegel, Brewer, Mokdad, Sleet, & Serdula, 1997).
Evaluation of a Responsible Beverage Service to Reduce Impaired Driving by 21- to 34-Year-Old Drivers
2
In response to the overall problem of impaired driving, a variety of public health efforts have been undertaken, including media campaigns, enforcement initiatives, and legal and policy efforts (e.g., reducing the illegal BAC limit to .08). Strong enforcement of impaired-driving laws can be effective in reducing impaired-driving-related crashes involving young drivers 21 to 34 (Fell, Tippetts, & Levy, 2008). Other programs, however, can work to prevent driving after drinking, ultimately reducing not only injuries, but also the costs of DWI convictions for young drivers. Such programs (Holder et al., 2000), which change the environment in a community that promotes risky drinking-driving behavior, are of particular interest to NHTSA and other safety researchers and advocates. One such program aimed at 21- to 34-year-old bar patrons used an alternative transportation approach (Rivara, Boisvert, Relyea-Chew, & Gomez, 2011). This project promoted the use of designated drivers, safe rides home, and taxi stands. The program did not have an effect on self-reported drinking and driving, serving as a designated driver, or using taxis after drinking in bars. Among the heaviest drinkers, however, the promotion program resulted in significantly increased use of designated drivers by 48 percent and use of taxis by 63 percent in Seattle, versus the comparison cities of Spokane, and Portland.
Previous Studies on Responsible Beverage Service Programs and Law Enforcement
Studies have revealed that approximately half of the intoxicated drivers had their last drink at a licensed bar or restaurant. (Wolfe, 1975; Damkot, 1979; Ontario Ministry of Transport and Communications, 1980; O’Donnell, 1985; Palmer, 1986; Foss, Perrine, Meyers, Musty, & Voas, 1990; Eby, 1995; Anglin Caverson, Fennel, Giesbrecht, & Mann, 1997; Lacey et al., 2009; Fell, Tippetts, & Voas, 2010). Stockwell, Lang, and Rydon (1993) studied risk factors associated with drinking, leading to a wide range of harmful incidents (violence, injury, and illness), and concluded that “the most significant risk factors were the amount of alcohol consumed and whether obviously intoxicated customers continue to be served.”
Except in a few jurisdictions, the service of alcohol to intoxicated patrons is prohibited by State or local law as well as liquor control regulation. In addition, so called “dram shop” laws in 36 States allow injured third parties to recover damages from licensed establishments in crashes resulting from the service of alcohol to intoxicated patrons. Several other states have dram shop laws that apply only to underage drinkers (NHTSA, 2016). Given the high proportion of alcohol-impaired drivers who come from licensed establishments, it is evident that these legal measures have not prevented all intoxicated patrons from being served or from leaving licensed establishments in an intoxicated condition. In recent years, restricting alcohol at the point of sale has increased in an effort to reduce impaired-driving-related automobile crashes and other unacceptable consequences of alcohol abuse or misuse.
Server Intervention
Beginning in the mid-1980s, a major effort was undertaken to encourage voluntary compliance by alcohol servers with laws prohibiting the sale of alcoholic beverages to intoxicated patrons. Generally referred to as “server intervention,” these efforts encompassing bartenders, waiters, waitresses, managers, and owners have been most comprehensively
Evaluation of a Responsible Beverage Service to Reduce Impaired Driving by 21- to 34-Year-Old Drivers
3
described by Mosher (1983). Server intervention programs typically involve skills training to refuse or slow the service of alcohol when recognizing signs of intoxication by tracking number of drinks served, offering food and nonalcoholic beverages, or arranging a safe ride home. In reducing impaired-driving-involved crashes, intervention by servers has the advantage over driver-oriented efforts whose judgment may already be impaired by alcohol.
Over the past decade, an ever-increasing number of education programs has been developed and taught in an effort to encourage more responsible behavior by servers. According to the National Institute on Alcohol Abuse and Alcoholism (NIAAA) Alcohol Policy Information System (APIS), as of January 1, 2009, 17 States and the District of Columbia have laws mandating alcohol beverage service training for at least one group of staff (licensee, manager, and server/seller); in 14 States, such training must involve alcohol servers and sellers. An additional 23 States have laws that provide discounts or other incentives to retailers (e.g., mitigation of penalties, protection of retail license, age identification scanners) to participate voluntarily in beverage service training programs. Many municipalities have also enacted laws that either mandate server education directly or create strong incentives for servers to seek it, such as substantial discounts on liability insurance.
Evaluations of server training programs have shown significant shifts toward more responsible service by both servers and managers of licensed establishments (Russ & Geller, 1986; Saltz, 1987; Gliksman, 1988; McKnight, 1988; Howard-Pitney, Johnson, Altman, Hopkins, & Hammond, 1991; Saltz & Hennessy, 1990; Molof & Kimball, 1994; Stockwell, Lang, & Rydon, 1993). Favorable outcomes, however, were largely limited to those efforts aimed at preventing patrons from becoming intoxicated. McKnight (1991) examined the effects of server education programs upon service to trained pseudo-patrons simulating signs of visible intoxication. The results were discouraging because refusals of service only occurred 5 percent of the time before training and 7 percent of the time after training. Stockwell, Lang, and Rydon (1993) found refusal rates of only 10 percent of servers before and after training and reductions in the number of bar patrons with high BACs (>.15) that lasted only a few months. Saltz and Hennessy (1990) concluded that server training alone was unlikely to affect significantly the patrons’ intoxication and that management must also be prepared to alter policies that lead to overdrinking, such as two-drinks-for-one specials and reduced happy hour prices.
Holder and Wagenaar (1994) reported a drop in the single-vehicle nighttime (SVN) crashes following enactment and implementation of Oregon's mandatory server education law. However, the drop did not coincide with implementation of the law and, without evidence that the drop was unique to SVN crashes, it cannot legitimately be attributed to the server training program.
In a systematic review of interventions designed to reduce alcohol use and related harms in drinking environments (Jones Hughes, Atkinson, & Bellis, 2011), seven studies were included that evaluated server-training interventions aimed at increasing RBS practices. Among the seven studies, three studies specifically examined the effect of server training on RBS intervention practices by servers. One found no impact; the other two found some increases in server intervention. Both studies, however, indicated that there was a low frequency of intervention among the trained servers. Effects of server intervention programs on patrons’ alcohol consumption were also mixed. One study of statewide mandated server training previously
Evaluation of a Responsible Beverage Service to Reduce Impaired Driving by 21- to 34-Year-Old Drivers
4
discussed (Holder & Wagenaar, 1994) showed that such training had a statistically significant effect on SVN crashes. Another study (Graham et al., 2004) found that an intervention designed to reduce aggression among bar patrons (better lighting, visible presence of bouncers) had a modest effect on severe and moderate patron aggression (reduction in verbal arguments and physical fights).
Research on RBS programs have shown that RBS can be a valuable tool in lowering the rates of high-risk alcohol consumption and impaired driving. For example, Johnsson and Berglund (2003) suggested that server training programs can help reduce the level of intoxication of bar patrons. In this study, the average BACs of patrons of intervention bars (the bars given a server-training program) were reduced more than the patrons were at the control bars at a 1-month followup. Toomey, Wagenaar, Gehan, Kilian, Murray, and Perry (2001) found a similar result in their study. In their project, the owners and managers of five bars in Minnesota received information on risk level, policies to prevent illegal sales, legal issues, and communication. The result of underage and pseudo-intoxicated purchase attempts conducted before and after the intervention showed that underage sales decreased by 11.5 percent, and pseudo-intoxicated sales fell by 46 percent compared to the control bars. Due to the small sample size, these results were not statistically significant, but they indicated that this kind of intervention could have an effect.
Wallin, Gripenberg, and Andreasson (2002) found that a community alcohol prevention program can significantly lower the frequency of pseudo-intoxicated patrons being served alcohol. This prevention program, including RBS training, took place in Stockholm, Sweden. At the follow-up in 1999, 47 percent of licensed premises denied service of alcohol to these pseudo-intoxicated patrons, a significant increase from the baseline of 5 percent in 1996. These results showed that RBS training, in combination with periodic enforcement and other policy initiatives, can play a significant role in lowering high-risk drinking. In another study, in the United States, Holder et al. (2000) found that a community-based environmental intervention, including RBS, can reduce high-risk alcohol consumption and alcohol-related injuries resulting from motor-vehicle crashes and assaults.
A comprehensive RBS program sponsored by NHTSA (Institute for Public Strategies , 2003) was designed to reduce impaired driving by targeting the supply of alcohol. The key component of the project was to target high-risk alcohol outlets (on-premise) and administer RBS training as an intervention. The program involved development of a Hospitality Oversight Committee to coordinate and guide interventions in response to over-service data and oversee the implementation of the project. The heart of the program was the POLD surveys. These surveys were administered to individuals attending drunk driving programs at four sites in the Ventura area of California. All participants had been arrested previously for DWI. The survey was administered by DDP counselors. The POLD surveys collected data on participants’ demographics and asked participants to describe their drinking and drinking-and-driving behavior on the night of their arrests. In particular, the survey asked participants to provide information about their POLD before the arrest. If the type of location was a commercial establishment, participants were asked to indicate the specific outlet. Participants described how long they were drinking on the night of arrest, how many drinks they had, when they were arrested, and whether they had prior DWI arrests. These POLD surveys were used (in aggregate) to identify alcohol outlets that appeared to produce relatively high numbers of intoxicated drivers.
Evaluation of a Responsible Beverage Service to Reduce Impaired Driving by 21- to 34-Year-Old Drivers
5
Another component of the Ventura project was Bar Risk Assessments. A procedure was developed where inconspicuous staff would visit a bar and systematically and objectively measure peak-hour alcohol over-service practices that might contribute to driver risk. Evidence from Bar Risk Assessments was used in corroboration with POLD survey results to identify high-risk bars. An outlet was considered potentially problematic if (a) the POLD surveys identified that a relatively higher number of DWI arrests originated from that bar, and (b) two separate Bar Risk Assessments confirmed risky alcohol service practices. Evidence regarding such bars was forwarded to the Hospitality Oversight Committee, which then made decisions regarding intervention activity.
Responsible Beverage Sales and Service training was an important component of the intervention. Staff approached targeted bars and offered free training. The training procedures were customized for the specific bars based on the risk assessments. In addition, IPS developed a follow-up program to monitor and assess improvements made with the outlet. During the project, 2,823 POLD surveys and 36 Bar Risk Assessments were administered. Additionally, nine RBSS trainings were conducted. The results were limited to two outlets that were trained in RBSS and received follow-up risk assessments. In one of these outlets, there was a steady, significant reduction in DWI mentions and changes in business practices as identified by the follow-up risk assessments. For the second outlet, Bar Risk Assessments and reports from law enforcement suggested that the development of formal house policies had the intended effects.
The results of these studies show that RBS training and follow-up enforcement and/or monitoring is an important tool in lowering the rates of high-risk alcohol consumption and impaired driving. Some of these results suggest that RBS training can be implemented effectively as one aspect of a multipart intervention.
Enforcement of Alcohol Service Laws
Lack of compliance with prohibitions against service to the intoxicated can be, at least in part, attributed to a lack of enforcement. Laws unenforced in many cases are laws unobserved. Following introduction of an experimental alcohol service enforcement effort in one Michigan county, denial of service to pseudo-patrons simulating signs of intoxication rose from 18 percent to 54 percent of visits to licensed establishments, a threefold increase (McKnight & Streff, 1994). Simultaneously, the proportion of arrested drinking drivers coming from bars and restaurants declined from 32 percent to 23 percent, a decrease of 25 percent, in the relative number of DWI arrestees coming from bars.
Enforcement requires awareness by the public that it is taking place if it is to serve as a deterrent to the targeted behavior. In the Michigan study just described, several enforcement agencies invited licensees to scheduled meetings, at which the nature of the enforcement effort and penalties for alcohol service violations were detailed. Each visit to an establishment by plainclothes law enforcement officers was followed by a letter revealing that it had taken place, a step intended to leave the impression that enforcement officers could be present at any time. Although enforcement can be effective in deterring service of alcohol to the intoxicated, suitable enforcement methods entail significant expense. The effort in Michigan involved an average of 1.5 hours of enforcement for each observed instance of service to an intoxicated patron. A cost-benefit analysis of the observed reduction in DWI arrestees coming from licensed establishments
Evaluation of a Responsible Beverage Service to Reduce Impaired Driving by 21- to 34-Year-Old Drivers
6
showed that the enforcement more than paid for itself in projected crash reduction. However, the benefits realized by the public do not provide specific financial support to the effort that produces those benefits (i.e., the savings in dollars from fewer crashes do not go into funding the enforcement). Where ABC enforcement falls to community police departments, it must compete for time and funds with control of other criminal activity, vehicle traffic, and various other forms of public protection.
Research Objectives To test the effectiveness of a multicomponent intervention with RBS to reduce impaired
driving among 21- to 34-year-olds, NHTSA funded two demonstration projects and their evaluations. In the summer of 2007, two communities were selected—Monroe County (through the Monroe County STOP-DWI Program) and Cleveland (through University Hospitals Case Medical Center)—in which RBS and enhanced alcohol enforcement interventions would be conducted and data necessary to conduct the evaluation would be collected. The overall goal of the RBS/enforcement program was to reduce over-service practices and the frequency of serving to obviously intoxicated individuals in bars and restaurants in each community through training and enforcement. The long-term goal of the program was to reduce DWI arrests and impaired-driving-related traffic crashes in the 21- to 34-year-old age group.
Within the two treatment communities, we compared 10 intervention and 10 control bars to gauge the effects of the RBS/enforcement program on serving practices. Specifically, we compared changes in the frequency of service to and intervention with visibly intoxicated pseudo-patrons, reductions in the frequency of POLD mentions of RBS trained establishments among drivers arrested for DWI, and patrons’ drinking behavior (e.g., changes in the frequency of high-BAC patrons leaving intervention establishments). Contrasts between the two treatment communities (Monroe County and Cleveland) and two similar comparison communities (Onondaga County and Toledo) were used to examine broader changes beyond those affecting only bars and their patrons. These comparisons investigated changes from pre- to post-intervention in public attitudes and reports of driving while impaired, DWI arrests, and the proportion of impaired-driving-related to non-impaired-driving-related crashes.
Research Questions Bar Practices
1. Were there significant changes in the service practices in intervention versus control bars as measured by the pseudo-patron and bar assessments before and after implementation of the RBS/enhanced enforcement program?
2. Were there decreases in the number of POLD mentions among bars in the intervention groups versus control groups in each treatment community during program implementation?
Evaluation of a Responsible Beverage Service to Reduce Impaired Driving by 21- to 34-Year-Old Drivers
7
3. Were there reductions in the proportion of 21- to 34-year-old patrons leaving intervention bars intoxicated compared to control bars as measured by BAC levels?
Drinking and Driving
4. Were there decreases in the proportion of 21- to 34-year-olds in the general population who reported driving after drinking too much in each treatment community in relation to its comparison community?
5. Was there a reduction in impaired-driving-related crashes, injuries, or deaths among 21- to 34-year-olds in each treatment community versus its comparison community commensurate with the RBS/enhanced enforcement program?
6. Commensurate with the RBS program, was there a decrease across each treatment community relative to its comparison community in the ratio of SVN crashes to multiple-vehicle daytime crashes among 21- to 34-year-old drivers compared to the same ratio among older drivers?
7. Was there a reduction in the proportion of drivers arrested for DWI who were 21 to 34 before and after program implementation in each treatment community relative to its comparison community?
Alcohol-Related Harm
8. Was there a decrease in the number of calls-for-service from pre- to post-intervention in comparing intervention bars to control bars?
Evaluation of a Responsible Beverage Service to Reduce Impaired Driving by 21- to 34-Year-Old Drivers
8
METHOD
Overview of Program Implementation The two communities participating in the evaluation—Monroe County and Cleveland—
agreed to implement an intervention that integrated outreach and RBS training, targeted enforcement, and as necessary, corrective actions to a random sample of identified problem bars. The overall goal of the RBS/enforcement program was to reduce over-service practices and the frequency of serving to obviously intoxicated individuals in bars and restaurants in each community through training and enforcement. The long-term goal of the program was to reduce DWI arrests and impaired-driving-related traffic crashes in the 21- to 34-year-old age group. Each site collected data necessary to conduct the evaluation (a description of the evaluation design and data-collection activities is provided in the next section on program evaluation). The community interventions included four activities: (a) the collection of data on POLD for drivers arrested for impaired-driving-related offenses to determine problem establishments, (b) letter writing and bar assessments by ABC enforcement officers to raise awareness and cooperation among problem bars, (c) RBS training, and (d) stepped-up alcohol law enforcement.
Identifying Problem Establishments Using POLD Data
Each site collected POLD data to identify a list of problem establishments to initiate the program. Law enforcement, after each arrest of a driver for DWI, recorded the place where the driver had his or her last drink before arrest. Law enforcement also recorded POLD data when investigating crashes of suspected drinking drivers, even if a DWI arrest was not made. If the POLD was a commercial establishment, the name and location of the place were to be obtained and recorded.
Following collection of the POLD information, we arrayed the bars by the number of POLD mentions (or POLD data combined with other indicators of over-service problems) to develop a problem index. We then stratified the top 30 problem establishments according to POLD mentions/problem indices into three groups: high, medium, and low. Within each stratum, we randomly assigned the bars to one of three groups—intervention, control (or non-intervention), and alternate. The bars in the alternate group (also stratified into the high, medium, and low groups) were to serve as replacements for bars in the intervention and control groups that were eliminated from the sample, such as an intervention bar that refused to participate in the RBS program. If the refusal bar was stratified as “high,” then the alternate bar would be randomly selected from the “high” bars. The resulting stratified random sample yielded 10 bars in each of the three groups.
Letter Writing and Bar Assessments
This part of the intervention involved ABC officials writing letters and personally delivering them to the 10 intervention establishments. These letters described the results of the POLD data to raise awareness and concern about the problem of over-service of alcohol. The
Evaluation of a Responsible Beverage Service to Reduce Impaired Driving by 21- to 34-Year-Old Drivers
9
letters were also to be used to enlist the cooperation of bars in the RBS training program (see Appendices A and B). When letters were delivered, project staff verified information on the age of the establishment’s clientele through observations and discussions with bartenders. They also noted other issues that might affect the feasibility of collecting data from an establishment (e.g., strip clubs that made it difficult for an unescorted female to enter for pseudo-patron visits, private parking lots that greatly reduced access to bar patrons). Additionally, trained ABC officers conducted bar assessments at the 10 intervention and 10 control establishments to determine if any specific over-service practices were occurring. We used these baseline bar assessments to help track specific over-service practices over time and to provide information to be emphasized in the RBS training.
RBS Training
RBS training, provided by the local ABC agency or by well-established vendors who were already providing this service, was offered to each of the identified intervention establishments free of charge. All bars accepted the free training. Training consisted of learning how to recognize signs of intoxication, and owners, managers, and servers were instructed on strategies for preventing intoxication and impaired driving (e.g., offering food, serving water or soda free of charge to customers who were not consuming alcohol, providing alternative transportation). In addition to the live classroom RBS training, 100 passports per site were provided for the Web-based, self-paced, interactive e-TIPS program. The online RBS training through e-TIPS was used to ensure that RBS training was available to any current bar staff unable to attend the live training and any serving staff, manager, or new hires at the 10 intervention bars that started work during the 12-month period of the intervention.
Enhanced Enforcement
The two treatment communities provided overtime funding for increased alcohol law enforcement in the 10 intervention establishments after the baseline bar assessments and RBS training were completed. Such enforcement involved more frequent visits by the ABC midway between data-collection waves to observe service practices in intervention bars, with feedback to establishments (e.g., notification of violations, congratulatory letter if no violations are observed). The bars/restaurants’ owners, managers, and serving staffs were encouraged to be involved in the planning of this project and were informed at the start of the project about the planned enforcement. These actions were motivational to encourage the 10 intervention bars to take the RBS training seriously, to reduce over-service practices, to stop serving obviously intoxicated patrons, and to implement other interventions.
Monroe County Community-Based Intervention
In 2007 the program planning began in Monroe County. It involved the collaborative efforts of the following agencies: the Monroe County STOP-DWI Program, the New York State Liquor Authority, the Monroe County Sheriff’s Office, the Monroe County Department of Public
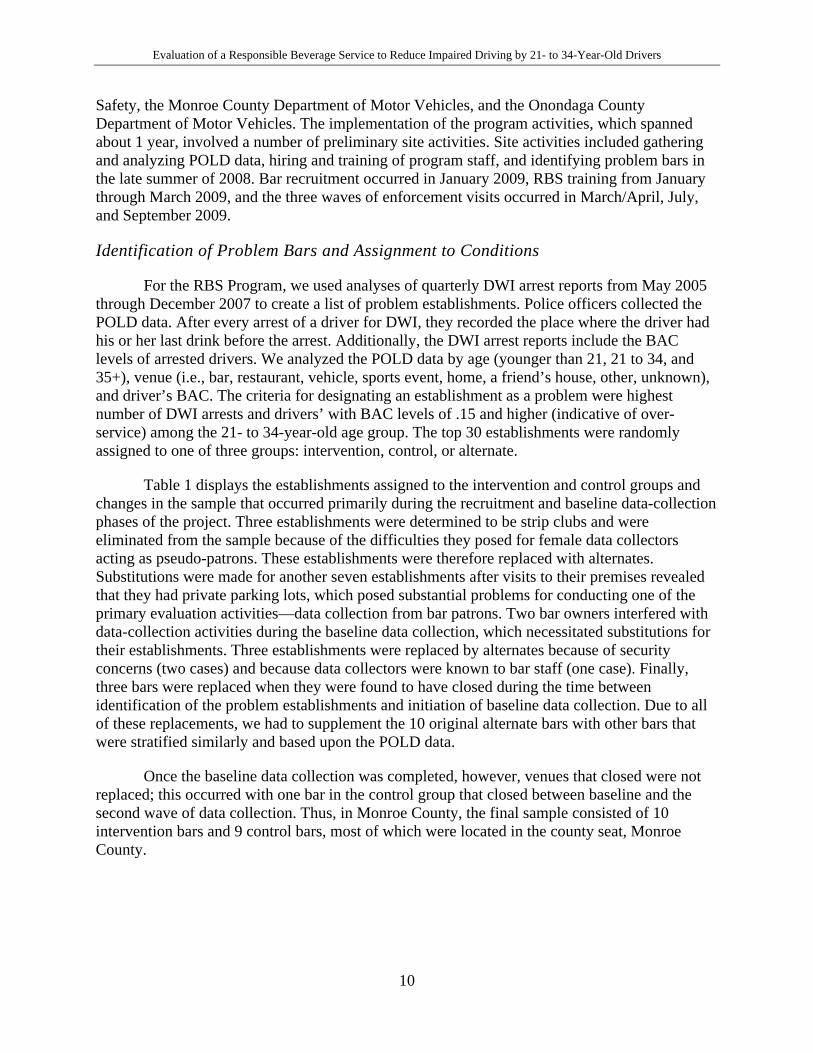
Evaluation of a Responsible Beverage Service to Reduce Impaired Driving by 21- to 34-Year-Old Drivers
10
Safety, the Monroe County Department of Motor Vehicles, and the Onondaga County Department of Motor Vehicles. The implementation of the program activities, which spanned about 1 year, involved a number of preliminary site activities. Site activities included gathering and analyzing POLD data, hiring and training of program staff, and identifying problem bars in the late summer of 2008. Bar recruitment occurred in January 2009, RBS training from January through March 2009, and the three waves of enforcement visits occurred in March/April, July, and September 2009.
Identification of Problem Bars and Assignment to Conditions
For the RBS Program, we used analyses of quarterly DWI arrest reports from May 2005 through December 2007 to create a list of problem establishments. Police officers collected the POLD data. After every arrest of a driver for DWI, they recorded the place where the driver had his or her last drink before the arrest. Additionally, the DWI arrest reports include the BAC levels of arrested drivers. We analyzed the POLD data by age (younger than 21, 21 to 34, and 35+), venue (i.e., bar, restaurant, vehicle, sports event, home, a friend’s house, other, unknown), and driver’s BAC. The criteria for designating an establishment as a problem were highest number of DWI arrests and drivers’ with BAC levels of .15 and higher (indicative of over-service) among the 21- to 34-year-old age group. The top 30 establishments were randomly assigned to one of three groups: intervention, control, or alternate.
Table 1 displays the establishments assigned to the intervention and control groups and changes in the sample that occurred primarily during the recruitment and baseline data-collection phases of the project. Three establishments were determined to be strip clubs and were eliminated from the sample because of the difficulties they posed for female data collectors acting as pseudo-patrons. These establishments were therefore replaced with alternates. Substitutions were made for another seven establishments after visits to their premises revealed that they had private parking lots, which posed substantial problems for conducting one of the primary evaluation activities—data collection from bar patrons. Two bar owners interfered with data-collection activities during the baseline data collection, which necessitated substitutions for their establishments. Three establishments were replaced by alternates because of security concerns (two cases) and because data collectors were known to bar staff (one case). Finally, three bars were replaced when they were found to have closed during the time between identification of the problem establishments and initiation of baseline data collection. Due to all of these replacements, we had to supplement the 10 original alternate bars with other bars that were stratified similarly and based upon the POLD data.
Once the baseline data collection was completed, however, venues that closed were not replaced; this occurred with one bar in the control group that closed between baseline and the second wave of data collection. Thus, in Monroe County, the final sample consisted of 10 intervention bars and 9 control bars, most of which were located in the county seat, Monroe County.
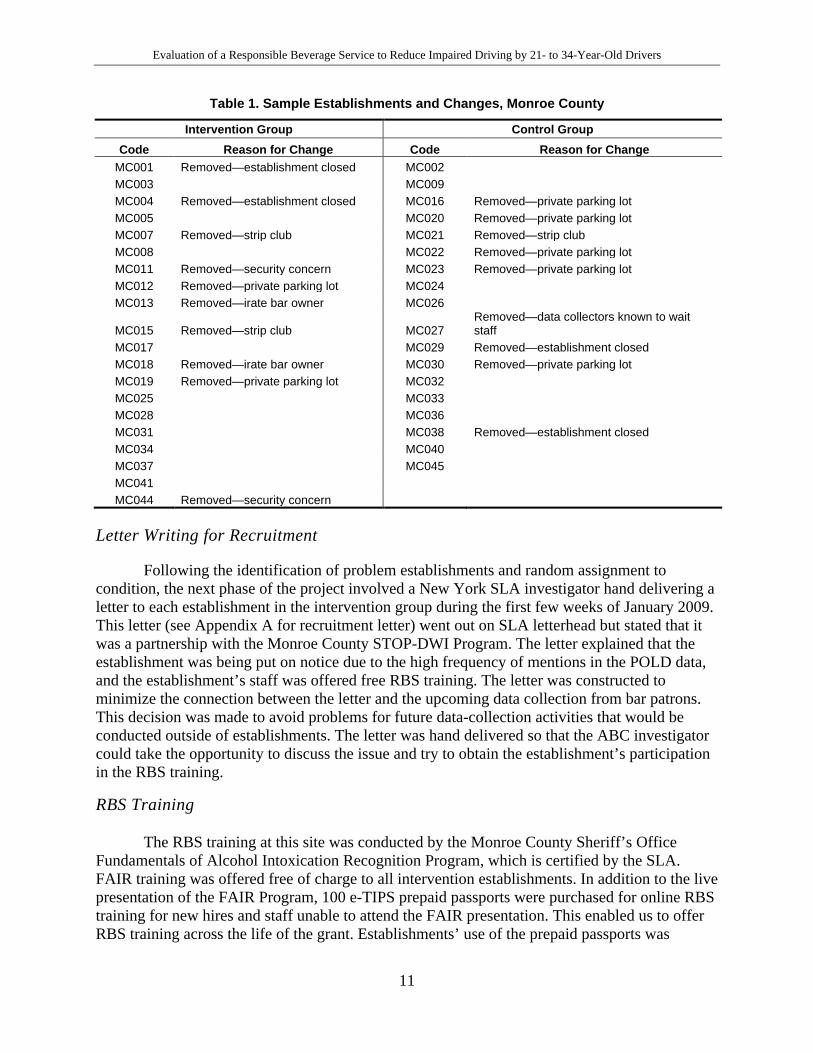
Evaluation of a Responsible Beverage Service to Reduce Impaired Driving by 21- to 34-Year-Old Drivers
11
Table 1. Sample Establishments and Changes, Monroe County
Intervention Group Control Group Code Reason for Change Code Reason for Change
MC001 Removed—establishment closed MC002 MC003 MC009 MC004 Removed—establishment closed MC016 Removed—private parking lot MC005 MC020 Removed—private parking lot MC007 Removed—strip club MC021 Removed—strip club MC008 MC022 Removed—private parking lot MC011 Removed—security concern MC023 Removed—private parking lot MC012 Removed—private parking lot MC024 MC013 Removed—irate bar owner MC026
MC015 Removed—strip club MC027 Removed—data collectors known to wait staff
MC017 MC029 Removed—establishment closed MC018 Removed—irate bar owner MC030 Removed—private parking lot MC019 Removed—private parking lot MC032 MC025 MC033 MC028 MC036 MC031 MC038 Removed—establishment closed MC034 MC040 MC037 MC045 MC041 MC044 Removed—security concern
Letter Writing for Recruitment
Following the identification of problem establishments and random assignment to condition, the next phase of the project involved a New York SLA investigator hand delivering a letter to each establishment in the intervention group during the first few weeks of January 2009. This letter (see Appendix A for recruitment letter) went out on SLA letterhead but stated that it was a partnership with the Monroe County STOP-DWI Program. The letter explained that the establishment was being put on notice due to the high frequency of mentions in the POLD data, and the establishment’s staff was offered free RBS training. The letter was constructed to minimize the connection between the letter and the upcoming data collection from bar patrons. This decision was made to avoid problems for future data-collection activities that would be conducted outside of establishments. The letter was hand delivered so that the ABC investigator could take the opportunity to discuss the issue and try to obtain the establishment’s participation in the RBS training.
RBS Training
The RBS training at this site was conducted by the Monroe County Sheriff’s Office Fundamentals of Alcohol Intoxication Recognition Program, which is certified by the SLA. FAIR training was offered free of charge to all intervention establishments. In addition to the live presentation of the FAIR Program, 100 e-TIPS prepaid passports were purchased for online RBS training for new hires and staff unable to attend the FAIR presentation. This enabled us to offer RBS training across the life of the grant. Establishments’ use of the prepaid passports was
Evaluation of a Responsible Beverage Service to Reduce Impaired Driving by 21- to 34-Year-Old Drivers
12
monitored by the FAIR Program representative, and bars were reminded of the passports in the enforcement visit followup letters (see Appendix A).
One of the establishments (MC028) had already requested a FAIR training before receiving the recruitment letter in January 2009. FAIR training for this establishment occurred in December 2008. The remaining nine intervention establishments received their training between January and March 2009. Most of the training sessions were held at the establishment’s place of business, although a few training sessions were held jointly for more than one establishment. The 10 intervention establishments exceeded the goal of 90 percent staff participation in RBS training through attending FAIR or in combination with e-TIPS. Along with serving staff, six managers, two owners, and in two establishments, both owners and managers received training. No incentive was offered to bars to participate in the training. While service to underage patrons was part of the training, over-service practices to adults was emphasized. Table 2 provides additional information on the RBS training for the intervention bars.
During the training period, all establishments were encouraged to have their staff attend a live presentation rather than pursue the online e-TIPS option, although passports were made available. Of the 100 prepaid passports made available to establishments, only 27 were requested, and of those, only 3 completed the online program.
In addition to tracking the intervention establishments, we requested that the individual providing FAIR training also track the control establishments to see if any of them requested RBS training during the grant period. On November 11, 2009 (just as the final wave of data collection was being conducted), control establishment MC036 received RBS training; this was the only control establishment to initiate a request for training.
Table 2. RBS Training Sessions by Establishment, Monroe County
Establishment
Date of RBS
training
# Staff serving alcohol
# Staff who
attended
# of eTIPS given
# of eTIPS completed
Management in RBS training
attendance 100%
Yes/No MC003 2/3/09 4 5 3 0 Manager Yes MC005 2/28/09
3/2/09 6 3
2 0 2
1 Manager
Yes
MC008 2/21/09 6 7 0 N/A Owner Yes MC017 2/28/09 12 11 6 0 Owner Yes MC025 2/14/09 10 10 2 0 Manager Yes MC028 12/8/08
12/18/08 16
7 9
0 N/A Manager Yes
MC031 2/7/09 2/28/09
12 10 1
0 N/A Manager Yes
MC034 3/7/09 15 20 5 2 Owner Manager
Yes
MC037 1/31/09 6 8 0 N/A Owner Manager
Yes
MC041 2/14/09 3/2/09
8 7 1
1 0 Manager Yes
Evaluation of a Responsible Beverage Service to Reduce Impaired Driving by 21- to 34-Year-Old Drivers
13
Enhanced Enforcement
During the final component of the intervention, SLA investigators conducted the enhanced alcohol enforcement in the intervention establishments. Covert enforcement visits by the SLA occurred four times in each establishment during the implementation phase: pre-intervention bar assessment at baseline (November/December 2008) and three post-period enforcements (March/April, July, and September 2009). These 1-hour visits were followed either by another visit or by a letter to the establishment providing feedback. The protocol for providing feedback to establishments changed during the program, as described in the following paragraphs.
Traditionally, when a violation is observed, the SLA investigator sends a report to the agency’s legal department to initiate a violation. Often, the procedures for dealing with violations can take several months before action is taken and the establishment is notified. However, for enforcement to be effective in this demonstration project, quick notification to the establishments was imperative. Therefore, for this RBS grant, Monroe County STOP-DWI worked out an arrangement with the SLA to provide more immediate feedback (within a week or two) to establishments with violations. The feedback mechanism was a letter sent to those establishments where over-service practices were observed. The standard process for dealing with violations would occur following the letter. For establishments where no over-service practices were observed, the initial feedback protocol involved a face-to-face meeting provided by a different investigator within 2 weeks of the enforcement visit. Because the SLA experienced a reduction in staff, however, scheduling investigator visits was very difficult. Consequently, the average time between enforcement visit and feedback was 5 weeks in the beginning 6 months of the demonstration. In the first wave of enforcement, nine establishments received investigator visits, and the one remaining establishment received a letter.
Given the difficulties experienced during the first wave of enforcement visits, the enforcement protocol was revised. The new protocol outlined that all establishments receive feedback via a letter sent by the SLA’s supervising investigator in lieu of an in-person visit by an investigator. The feedback letter informed the establishment that an enforcement visit had taken place within the last week, more visits were planned, to pass the information to serving staff as it is their behaviors being observed, and the availability of e-TIPS prepaid passports through the end of the year. For the second and third rounds of enforcement visits, feedback was more timely (within 2 weeks as opposed to 5 weeks or later).
Cleveland Community-Based Intervention
In 2007 University Hospitals Case Medical Center initiated a program using a combined RBS program and enhanced enforcement on (a) service practices to obviously intoxicated 21- to 34-year-old patrons in bars and restaurants, (b) self-reported attitudes and behaviors related to drinking and driving, and (c) impaired-driving-related crash rates. In addition to UH, the project in Cleveland involved the Cleveland Police Department, the Ohio Investigative Unit, Case
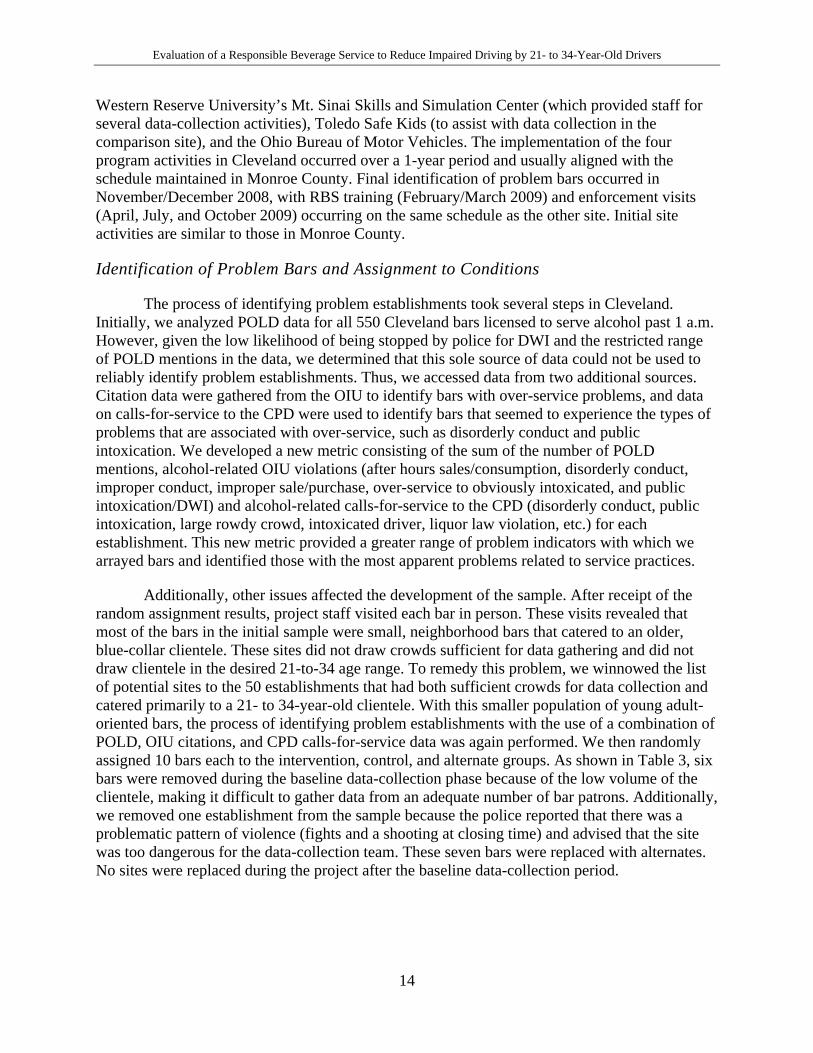
Evaluation of a Responsible Beverage Service to Reduce Impaired Driving by 21- to 34-Year-Old Drivers
14
Western Reserve University’s Mt. Sinai Skills and Simulation Center (which provided staff for several data-collection activities), Toledo Safe Kids (to assist with data collection in the comparison site), and the Ohio Bureau of Motor Vehicles. The implementation of the four program activities in Cleveland occurred over a 1-year period and usually aligned with the schedule maintained in Monroe County. Final identification of problem bars occurred in November/December 2008, with RBS training (February/March 2009) and enforcement visits (April, July, and October 2009) occurring on the same schedule as the other site. Initial site activities are similar to those in Monroe County.
Identification of Problem Bars and Assignment to Conditions
The process of identifying problem establishments took several steps in Cleveland. Initially, we analyzed POLD data for all 550 Cleveland bars licensed to serve alcohol past 1 a.m. However, given the low likelihood of being stopped by police for DWI and the restricted range of POLD mentions in the data, we determined that this sole source of data could not be used to reliably identify problem establishments. Thus, we accessed data from two additional sources. Citation data were gathered from the OIU to identify bars with over-service problems, and data on calls-for-service to the CPD were used to identify bars that seemed to experience the types of problems that are associated with over-service, such as disorderly conduct and public intoxication. We developed a new metric consisting of the sum of the number of POLD mentions, alcohol-related OIU violations (after hours sales/consumption, disorderly conduct, improper conduct, improper sale/purchase, over-service to obviously intoxicated, and public intoxication/DWI) and alcohol-related calls-for-service to the CPD (disorderly conduct, public intoxication, large rowdy crowd, intoxicated driver, liquor law violation, etc.) for each establishment. This new metric provided a greater range of problem indicators with which we arrayed bars and identified those with the most apparent problems related to service practices.
Additionally, other issues affected the development of the sample. After receipt of the random assignment results, project staff visited each bar in person. These visits revealed that most of the bars in the initial sample were small, neighborhood bars that catered to an older, blue-collar clientele. These sites did not draw crowds sufficient for data gathering and did not draw clientele in the desired 21-to-34 age range. To remedy this problem, we winnowed the list of potential sites to the 50 establishments that had both sufficient crowds for data collection and catered primarily to a 21- to 34-year-old clientele. With this smaller population of young adult-oriented bars, the process of identifying problem establishments with the use of a combination of POLD, OIU citations, and CPD calls-for-service data was again performed. We then randomly assigned 10 bars each to the intervention, control, and alternate groups. As shown in Table 3, six bars were removed during the baseline data-collection phase because of the low volume of the clientele, making it difficult to gather data from an adequate number of bar patrons. Additionally, we removed one establishment from the sample because the police reported that there was a problematic pattern of violence (fights and a shooting at closing time) and advised that the site was too dangerous for the data-collection team. These seven bars were replaced with alternates. No sites were replaced during the project after the baseline data-collection period.
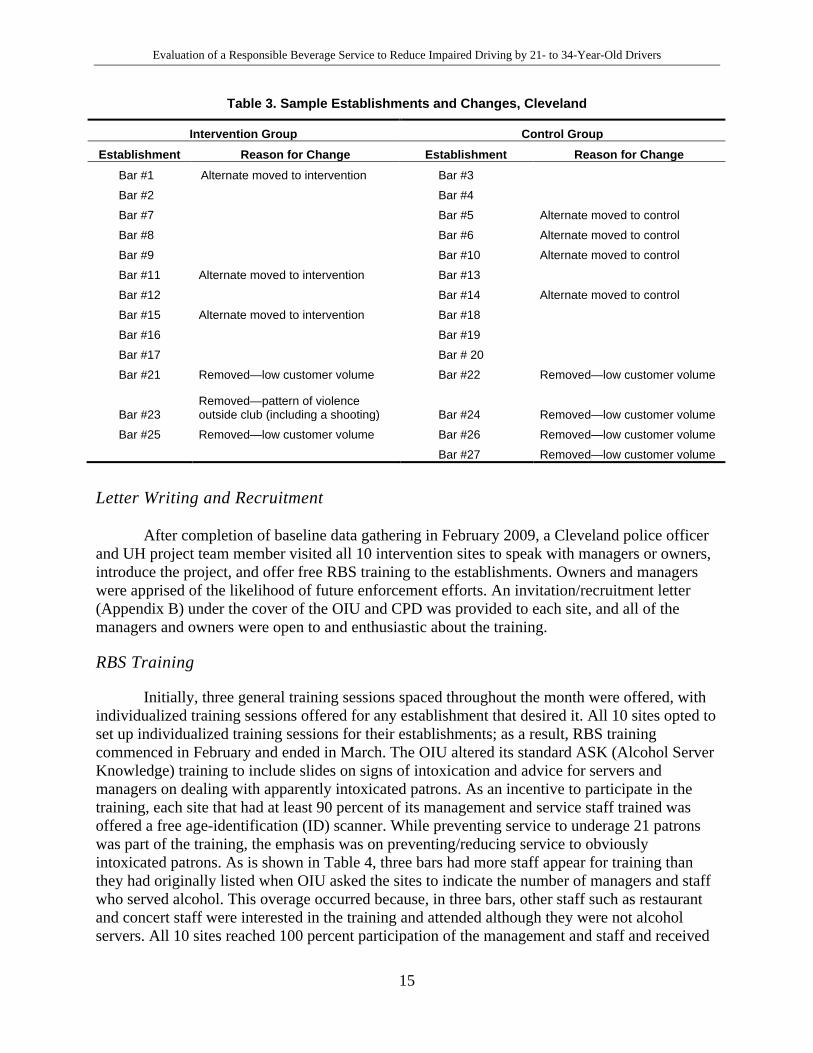
Evaluation of a Responsible Beverage Service to Reduce Impaired Driving by 21- to 34-Year-Old Drivers
15
Table 3. Sample Establishments and Changes, Cleveland
Intervention Group Control Group Establishment Reason for Change Establishment Reason for Change
Bar #1 Alternate moved to intervention Bar #3
Bar #2 Bar #4
Bar #7 Bar #5 Alternate moved to control
Bar #8 Bar #6 Alternate moved to control
Bar #9 Bar #10 Alternate moved to control
Bar #11 Alternate moved to intervention Bar #13
Bar #12 Bar #14 Alternate moved to control
Bar #15 Alternate moved to intervention Bar #18
Bar #16 Bar #19
Bar #17 Bar # 20
Bar #21 Removed—low customer volume Bar #22 Removed—low customer volume
Bar #23 Removed—pattern of violence outside club (including a shooting) Bar #24 Removed—low customer volume
Bar #25 Removed—low customer volume Bar #26 Removed—low customer volume
Bar #27 Removed—low customer volume
Letter Writing and Recruitment
After completion of baseline data gathering in February 2009, a Cleveland police officer and UH project team member visited all 10 intervention sites to speak with managers or owners, introduce the project, and offer free RBS training to the establishments. Owners and managers were apprised of the likelihood of future enforcement efforts. An invitation/recruitment letter (Appendix B) under the cover of the OIU and CPD was provided to each site, and all of the managers and owners were open to and enthusiastic about the training.
RBS Training
Initially, three general training sessions spaced throughout the month were offered, with individualized training sessions offered for any establishment that desired it. All 10 sites opted to set up individualized training sessions for their establishments; as a result, RBS training commenced in February and ended in March. The OIU altered its standard ASK (Alcohol Server Knowledge) training to include slides on signs of intoxication and advice for servers and managers on dealing with apparently intoxicated patrons. As an incentive to participate in the training, each site that had at least 90 percent of its management and service staff trained was offered a free age-identification (ID) scanner. While preventing service to underage 21 patrons was part of the training, the emphasis was on preventing/reducing service to obviously intoxicated patrons. As is shown in Table 4, three bars had more staff appear for training than they had originally listed when OIU asked the sites to indicate the number of managers and staff who served alcohol. This overage occurred because, in three bars, other staff such as restaurant and concert staff were interested in the training and attended although they were not alcohol servers. All 10 sites reached 100 percent participation of the management and staff and received
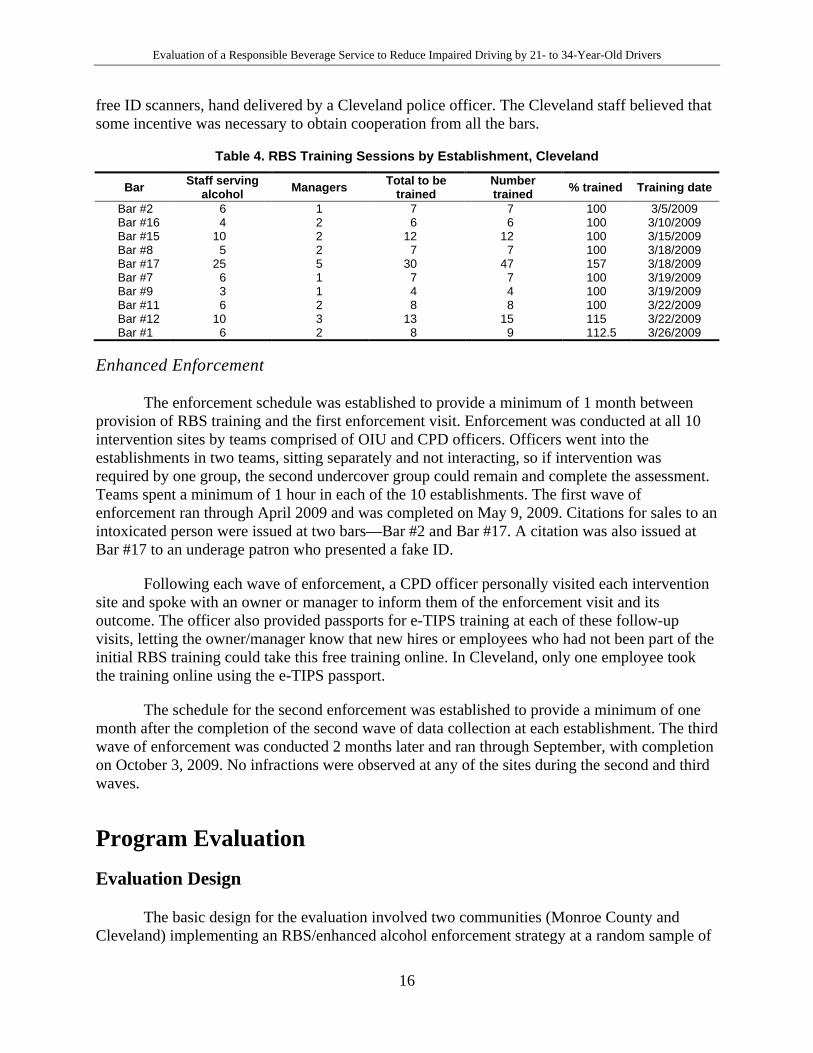
Evaluation of a Responsible Beverage Service to Reduce Impaired Driving by 21- to 34-Year-Old Drivers
16
free ID scanners, hand delivered by a Cleveland police officer. The Cleveland staff believed that some incentive was necessary to obtain cooperation from all the bars.
Table 4. RBS Training Sessions by Establishment, Cleveland
Bar Staff serving alcohol Managers Total to be
trained Number trained % trained Training date
Bar #2 6 1 7 7 100 3/5/2009 Bar #16 4 2 6 6 100 3/10/2009 Bar #15 10 2 12 12 100 3/15/2009 Bar #8 5 2 7 7 100 3/18/2009 Bar #17 25 5 30 47 157 3/18/2009 Bar #7 6 1 7 7 100 3/19/2009 Bar #9 3 1 4 4 100 3/19/2009 Bar #11 6 2 8 8 100 3/22/2009 Bar #12 10 3 13 15 115 3/22/2009 Bar #1 6 2 8 9 112.5 3/26/2009
Enhanced Enforcement
The enforcement schedule was established to provide a minimum of 1 month between provision of RBS training and the first enforcement visit. Enforcement was conducted at all 10 intervention sites by teams comprised of OIU and CPD officers. Officers went into the establishments in two teams, sitting separately and not interacting, so if intervention was required by one group, the second undercover group could remain and complete the assessment. Teams spent a minimum of 1 hour in each of the 10 establishments. The first wave of enforcement ran through April 2009 and was completed on May 9, 2009. Citations for sales to an intoxicated person were issued at two bars—Bar #2 and Bar #17. A citation was also issued at Bar #17 to an underage patron who presented a fake ID.
Following each wave of enforcement, a CPD officer personally visited each intervention site and spoke with an owner or manager to inform them of the enforcement visit and its outcome. The officer also provided passports for e-TIPS training at each of these follow-up visits, letting the owner/manager know that new hires or employees who had not been part of the initial RBS training could take this free training online. In Cleveland, only one employee took the training online using the e-TIPS passport.
The schedule for the second enforcement was established to provide a minimum of one month after the completion of the second wave of data collection at each establishment. The third wave of enforcement was conducted 2 months later and ran through September, with completion on October 3, 2009. No infractions were observed at any of the sites during the second and third waves.
Program Evaluation Evaluation Design
The basic design for the evaluation involved two communities (Monroe County and Cleveland) implementing an RBS/enhanced alcohol enforcement strategy at a random sample of
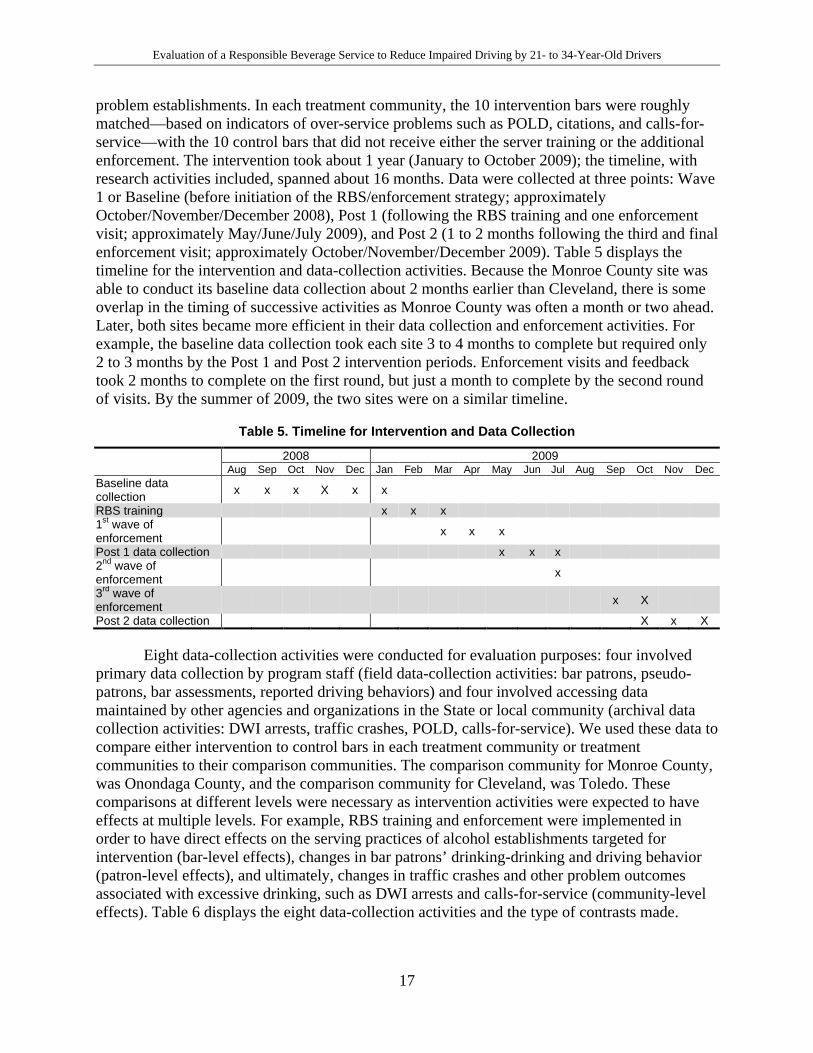
Evaluation of a Responsible Beverage Service to Reduce Impaired Driving by 21- to 34-Year-Old Drivers
17
problem establishments. In each treatment community, the 10 intervention bars were roughly matched—based on indicators of over-service problems such as POLD, citations, and calls-for-service—with the 10 control bars that did not receive either the server training or the additional enforcement. The intervention took about 1 year (January to October 2009); the timeline, with research activities included, spanned about 16 months. Data were collected at three points: Wave 1 or Baseline (before initiation of the RBS/enforcement strategy; approximately October/November/December 2008), Post 1 (following the RBS training and one enforcement visit; approximately May/June/July 2009), and Post 2 (1 to 2 months following the third and final enforcement visit; approximately October/November/December 2009). Table 5 displays the timeline for the intervention and data-collection activities. Because the Monroe County site was able to conduct its baseline data collection about 2 months earlier than Cleveland, there is some overlap in the timing of successive activities as Monroe County was often a month or two ahead. Later, both sites became more efficient in their data collection and enforcement activities. For example, the baseline data collection took each site 3 to 4 months to complete but required only 2 to 3 months by the Post 1 and Post 2 intervention periods. Enforcement visits and feedback took 2 months to complete on the first round, but just a month to complete by the second round of visits. By the summer of 2009, the two sites were on a similar timeline.
Table 5. Timeline for Intervention and Data Collection
2008 2009 Aug Sep Oct Nov Dec Jan Feb Mar Apr May Jun Jul Aug Sep Oct Nov Dec
Baseline data collection x x x X x x
RBS training x x x 1st wave of enforcement x x x
Post 1 data collection x x x 2nd wave of enforcement x
3rd wave of enforcement x X
Post 2 data collection X x X
Eight data-collection activities were conducted for evaluation purposes: four involved primary data collection by program staff (field data-collection activities: bar patrons, pseudo-patrons, bar assessments, reported driving behaviors) and four involved accessing data maintained by other agencies and organizations in the State or local community (archival data collection activities: DWI arrests, traffic crashes, POLD, calls-for-service). We used these data to compare either intervention to control bars in each treatment community or treatment communities to their comparison communities. The comparison community for Monroe County, was Onondaga County, and the comparison community for Cleveland, was Toledo. These comparisons at different levels were necessary as intervention activities were expected to have effects at multiple levels. For example, RBS training and enforcement were implemented in order to have direct effects on the serving practices of alcohol establishments targeted for intervention (bar-level effects), changes in bar patrons’ drinking-drinking and driving behavior (patron-level effects), and ultimately, changes in traffic crashes and other problem outcomes associated with excessive drinking, such as DWI arrests and calls-for-service (community-level effects). Table 6 displays the eight data-collection activities and the type of contrasts made.

Evaluation of a Responsible Beverage Service to Reduce Impaired Driving by 21- to 34-Year-Old Drivers
18
Table 6. Data-Collection Activities and Level of Comparison
Field data collection Archival data collection Bar patron
self-assessments
Pseudo-patron
assessments
Bar assessments DMV DWI
arrests Traffic
crashes POLD Calls-for-
service Intervention versus control bars
x X X X X
Treatment versus comparison communities
x x X
Field Data-Collection Activities
We provided sites with detailed instructions on how to conduct the four field data-collection activities. A summary of the procedures used follows. For more detailed information on these procedures, see the Data-Collection Design and Methods in Appendices C and D that contain the training manuals for the bar patron and pseudo-patron data-collection activities. The human subjects protocols for the evaluation were reviewed and approved by the Institutional Review Board of the Pacific Institute for Research and Evaluation as well as UH’s IRB in Cleveland. This was necessary to define and resolve any risks to pseudo-patrons, bar patrons, the project data-collection staff, and law enforcement. All data-collection activities were anonymous.
Bar Patron Breath Tests
Three waves of anonymous breath tests were conducted of patrons leaving the intervention bars and control bars (n=50 per bar per wave) in each treatment community. Age, gender, and BAC were collected on each patron. Bar patrons who participated in the data collection in both sites were offered a $5 incentive to cooperate. Incorporated into this data-collection activity was an impaired-driving protocol used by field staff to identify potentially impaired drivers, assess them further, and provide a safe alternative to get them home. Data was collected on Thursdays, Fridays, and Saturdays on selected weekends from 10 p.m. until 2 a.m. At each site, teams consisting of a supervisor and several data collectors/interviewers visited at least one intervention and one control bar each night. Several teams of data collectors were used so that data from the 20 bars in each treatment community could be collected over a 3- to 4-week period.
Before the collection of baseline data, we provided extensive classroom and field training to data collectors. A 2-day training was held in each treatment community that covered data-collection procedures for the bar patron and pseudo-patron activities. The training sessions for the bar patron data collection focused on random selection of patrons, interviewing techniques, how to use the equipment such as the preliminary breath-test device for collecting BACs, how to record data using the data-collection forms developed for the project, and how to implement the impaired-driving/bar-patron safeguards protocol to ensure that those who appeared to be intoxicated were provided with a safe ride home. The training for the pseudo-patron data collection involved reviewing the signs of intoxication, practice modeling those signs, and how to record data (see Appendix E for all field data-collection forms). For both activities, the in-
Evaluation of a Responsible Beverage Service to Reduce Impaired Driving by 21- to 34-Year-Old Drivers
19
class training was supplemented by pilot testing at several bars not included in the sample. The manual for data-collection supervisors at the bar patron activities provides a description of the safeguards protocol used to identify intoxicated patrons and intervene if they were planning to drive.
Pseudo-Patron Assessments
To determine if the RBS training had any effect on alcohol service, pseudo-patron assessments were conducted in each of the intervention bars and control bars in each treatment community at each of the three waves of data collection. To test serving practices and intervention skills of alcohol servers, actors modeling the appearance and behavior of intoxicated patrons entered the bars, ordered one beer and noted the outcome (i.e., whether they were served, whether any driving interventions were attempted by servers). Four pseudo-patrons were scheduled to make two visits to each bar during each wave of data collection (n = 160 visits per wave with 8 visits per each of the 20 bars). Pseudo-patrons visited establishments twice, ordering a beer on one visit from the bar and on one visit while seated at a table. At least one of the four pseudo-patrons was to be female to permit the investigation of the effects of pseudo-patrons’ gender on service and intervention practices.
Bar Assessments
Observational data by ABC officials were collected for use in investigating differences between the two groups of bars in alcohol-serving practices over the three waves of data collection. For these unobtrusive observations, ABC agents entered the intervention and control establishments ideally for a 2- to 3-hour period and noted any alcohol law violations, particularly service to minors and visibly intoxicated patrons.
DMV/BMV Data
Anonymous self-assessments of drivers at the two States’ Department of Motor Vehicle/Bureau of Motor Vehicle (DMV/BMV) offices (n = 600 each at the two treatment and two comparison communities) were conducted independently by the jurisdictions at each of the three waves, which revealed the proportion of drivers who report driving after “drinking too much” and other associated behaviors. This permitted an analysis to detect any changes in reported drinking-driving behaviors during the year-long intervention.
Archival Data Collection
Calls-for-Service
Calls-for-service to police, fire, and emergency medical services were collected for pre- and post-intervention analysis for the intervention and control bars. These calls-for-service are an indication of fights and disorderly conduct near the bars that are likely alcohol related.
Evaluation of a Responsible Beverage Service to Reduce Impaired Driving by 21- to 34-Year-Old Drivers
20
Place-of-Last-Drink
POLD data from DWI arrestees or those in impaired-driving-related crashes also were collected, typically quarterly, to be analyzed pre- and post-intervention for changes in the number of mentions for the intervention establishments relative to the control bars in each treatment community.
DWI Arrests
Numbers and rates of DWI arrests, especially among 21- to 34-year-olds were tracked pre-intervention and post-intervention to determine any changes over time in the treatment versus the comparison communities.
Traffic Crashes
Each community provided access to crash data files from the treatment community and its comparison community. We used these data to conduct time-series analyses to determine if any significant changes occurred in drinking-driver-related crashes in the treatment communities commensurate with the intervention. Police-reported alcohol involvement of the drivers constituted the prime measure of alcohol involvement. In addition, single vehicle nighttime (SVN) (a surrogate for alcohol impaired driving crash involvement) and multiple vehicle daytime (MVD) crashes (a surrogate for not involving an impaired driver) also were used. Nighttime crashes were defined as those occurring between 6:00 p.m. and 5:59 a.m., whereas daytime crashes were those that occurred between 6:00 a.m. and 5:59 p.m. SVN crashes have the highest alcohol impaired driving involvement of crash types, and MVD crashes have the lowest rates of impaired driving involvement. We used the ratio of SVN crashes to MVD crashes to examine changes in the incidence of crashes most likely to involve alcohol.
Evaluation of a Responsible Beverage Service to Reduce Impaired Driving by 21- to 34-Year-Old Drivers
21
RESULTS
Monroe County Pseudo Bar Patrons
For the pseudo-patron analyses, the data were comprised of the following service outcomes:
• Served with no question—the server supplied a drink without questioning the pseudo-patron.
• Served after attempted drink intervention—the server attempted to steer the pseudo-patron to an alternative other than an alcoholic drink but ultimately provided the drink.
• Refused with no attempt at driving intervention—the server refused service but did not attempt to prevent the pseudo-patron from driving away.
• Refused with attempted driving intervention—the server refused service and attempted to prevent the pseudo-patron from driving.
• Other—the server attempted some type of intervention, but the patron may have been served.
We then restructured the five service outcomes in two ways. First, a dichotomous variable was created in which the first two levels of service were classified as service and the second two were classified as refusal. Next, a dichotomous “attempted drinking and/or driving intervention” outcome was created, which separated cases in which service was provided without question (the first column related to service outcome in Table 7) from cases in which some attempt at intervention was made (columns 2 through 5 associated with service outcomes).
We then analyzed the two outcomes using logistic regression. Here, the main interest was to determine if the intervention bars had increased odds of refusing service or attempting to provide drinking-driving intervention in the post-intervention periods compared with the control bars. In these analyses, however, we used models comprised only of bar type, period, and the bar patron type by period interaction.
Refusal of Service
Table 7 shows the percentage of intervention and control pseudo-patrons for each of the service outcomes. Table 8 presents the results from pooling the third and fourth outcomes to form the “refused” category. The results show that there were no refusals in the intervention bars. In the control bars, only 1.2 percent of the pseudo-patrons were refused service in the pre-
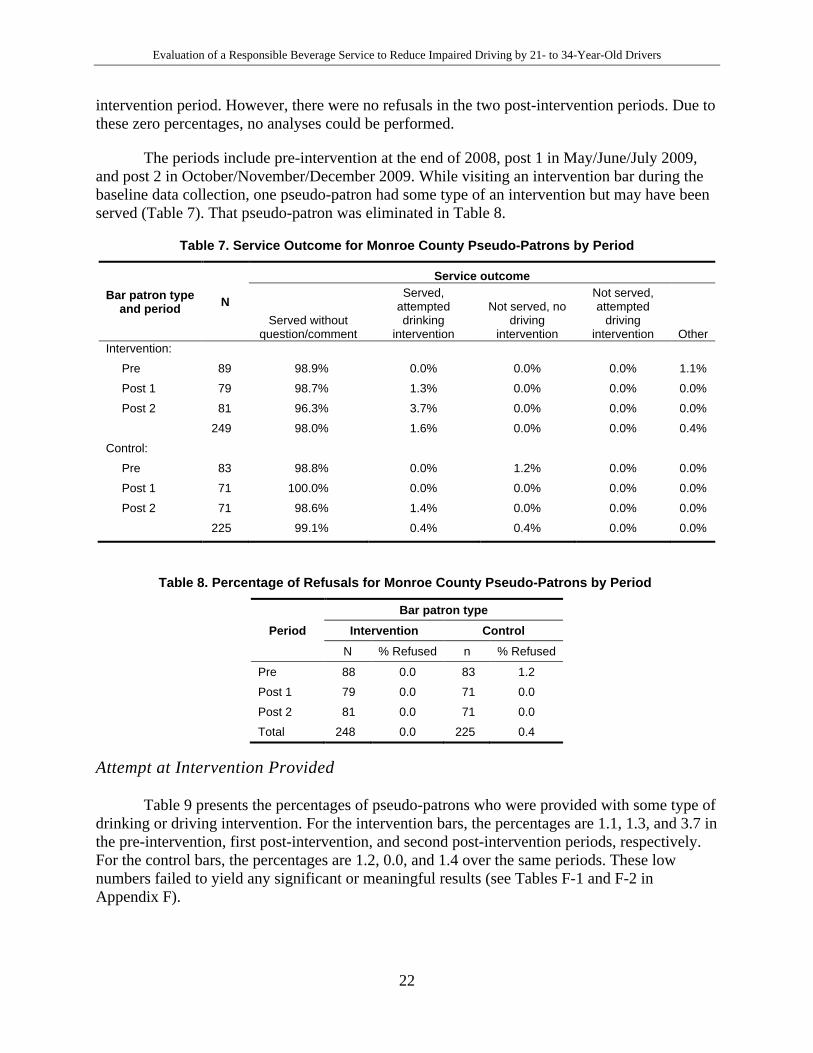
Evaluation of a Responsible Beverage Service to Reduce Impaired Driving by 21- to 34-Year-Old Drivers
22
intervention period. However, there were no refusals in the two post-intervention periods. Due to these zero percentages, no analyses could be performed.
The periods include pre-intervention at the end of 2008, post 1 in May/June/July 2009, and post 2 in October/November/December 2009. While visiting an intervention bar during the baseline data collection, one pseudo-patron had some type of an intervention but may have been served (Table 7). That pseudo-patron was eliminated in Table 8.
Table 7. Service Outcome for Monroe County Pseudo-Patrons by Period
Bar patron type and period N
Service outcome
Served without question/comment
Served, attempted drinking
intervention
Not served, no driving
intervention
Not served, attempted
driving intervention Other
Intervention:
Pre 89 98.9% 0.0% 0.0% 0.0% 1.1%
Post 1 79 98.7% 1.3% 0.0% 0.0% 0.0%
Post 2 81 96.3% 3.7% 0.0% 0.0% 0.0%
249 98.0% 1.6% 0.0% 0.0% 0.4%
Control:
Pre 83 98.8% 0.0% 1.2% 0.0% 0.0%
Post 1 71 100.0% 0.0% 0.0% 0.0% 0.0%
Post 2 71 98.6% 1.4% 0.0% 0.0% 0.0%
225 99.1% 0.4% 0.4% 0.0% 0.0%
Table 8. Percentage of Refusals for Monroe County Pseudo-Patrons by Period
Period Bar patron type
Intervention Control N % Refused n % Refused
Pre 88 0.0 83 1.2
Post 1 79 0.0 71 0.0
Post 2 81 0.0 71 0.0
Total 248 0.0 225 0.4
Attempt at Intervention Provided
Table 9 presents the percentages of pseudo-patrons who were provided with some type of drinking or driving intervention. For the intervention bars, the percentages are 1.1, 1.3, and 3.7 in the pre-intervention, first post-intervention, and second post-intervention periods, respectively. For the control bars, the percentages are 1.2, 0.0, and 1.4 over the same periods. These low numbers failed to yield any significant or meaningful results (see Tables F-1 and F-2 in Appendix F).
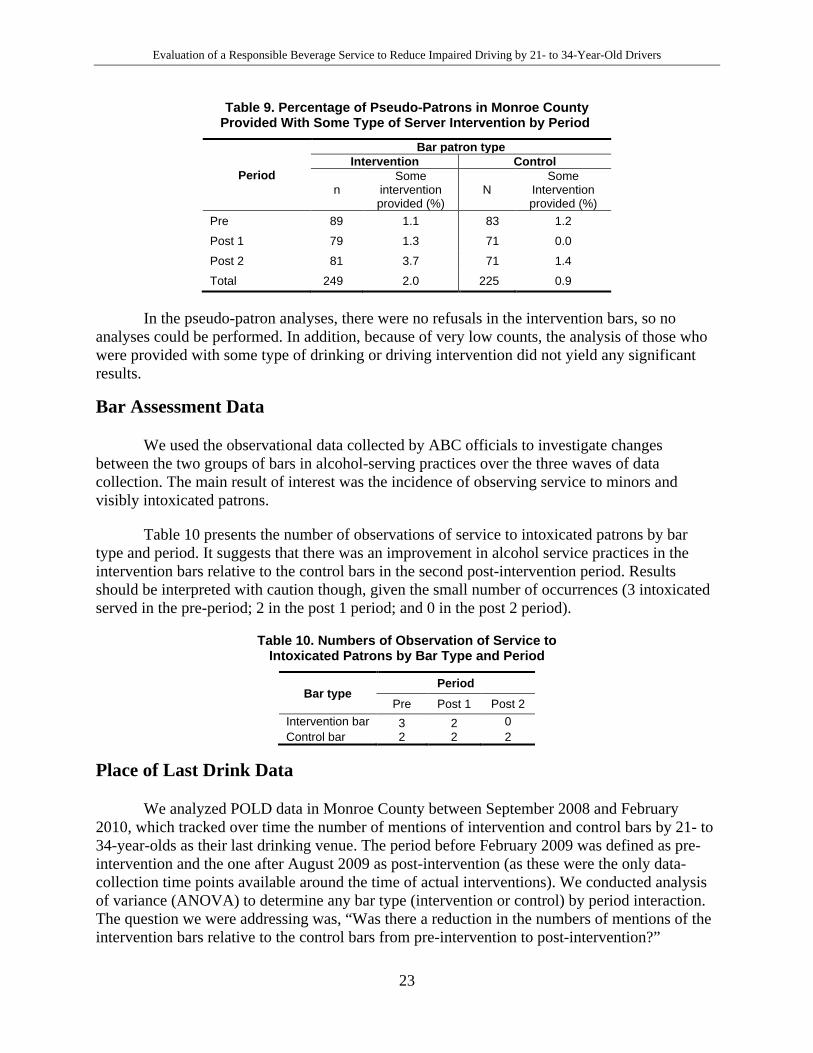
Evaluation of a Responsible Beverage Service to Reduce Impaired Driving by 21- to 34-Year-Old Drivers
23
Table 9. Percentage of Pseudo-Patrons in Monroe County Provided With Some Type of Server Intervention by Period
Period
Bar patron type Intervention Control
n Some
intervention provided (%)
N Some
Intervention provided (%)
Pre 89 1.1 83 1.2
Post 1 79 1.3 71 0.0
Post 2 81 3.7 71 1.4
Total 249 2.0 225 0.9
In the pseudo-patron analyses, there were no refusals in the intervention bars, so no analyses could be performed. In addition, because of very low counts, the analysis of those who were provided with some type of drinking or driving intervention did not yield any significant results.
Bar Assessment Data
We used the observational data collected by ABC officials to investigate changes between the two groups of bars in alcohol-serving practices over the three waves of data collection. The main result of interest was the incidence of observing service to minors and visibly intoxicated patrons.
Table 10 presents the number of observations of service to intoxicated patrons by bar type and period. It suggests that there was an improvement in alcohol service practices in the intervention bars relative to the control bars in the second post-intervention period. Results should be interpreted with caution though, given the small number of occurrences (3 intoxicated served in the pre-period; 2 in the post 1 period; and 0 in the post 2 period).
Table 10. Numbers of Observation of Service to Intoxicated Patrons by Bar Type and Period
Bar type Period
Pre Post 1 Post 2 Intervention bar 3 2 0 Control bar 2 2 2
Place of Last Drink Data
We analyzed POLD data in Monroe County between September 2008 and February 2010, which tracked over time the number of mentions of intervention and control bars by 21- to 34-year-olds as their last drinking venue. The period before February 2009 was defined as pre-intervention and the one after August 2009 as post-intervention (as these were the only data-collection time points available around the time of actual interventions). We conducted analysis of variance (ANOVA) to determine any bar type (intervention or control) by period interaction. The question we were addressing was, “Was there a reduction in the numbers of mentions of the intervention bars relative to the control bars from pre-intervention to post-intervention?”
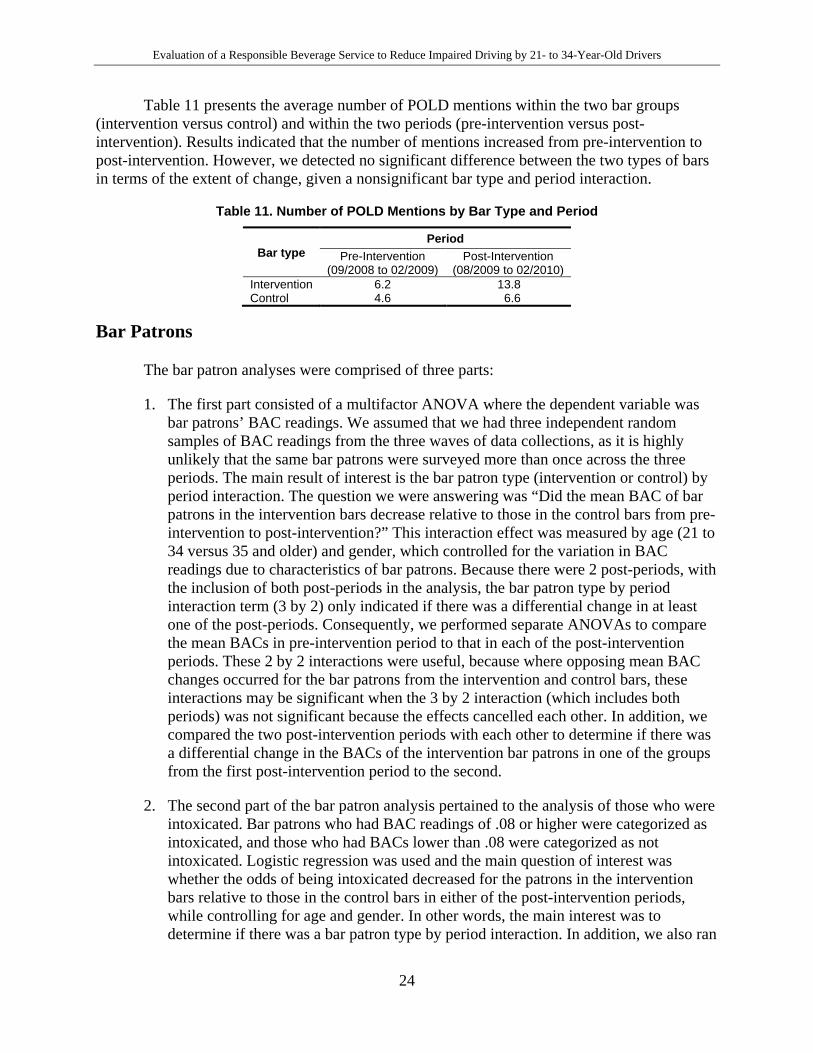
Evaluation of a Responsible Beverage Service to Reduce Impaired Driving by 21- to 34-Year-Old Drivers
24
Table 11 presents the average number of POLD mentions within the two bar groups (intervention versus control) and within the two periods (pre-intervention versus post-intervention). Results indicated that the number of mentions increased from pre-intervention to post-intervention. However, we detected no significant difference between the two types of bars in terms of the extent of change, given a nonsignificant bar type and period interaction.
Table 11. Number of POLD Mentions by Bar Type and Period
Bar type Period
Pre-Intervention (09/2008 to 02/2009)
Post-Intervention (08/2009 to 02/2010)
Intervention 6.2 13.8 Control 4.6 6.6
Bar Patrons
The bar patron analyses were comprised of three parts:
1. The first part consisted of a multifactor ANOVA where the dependent variable was bar patrons’ BAC readings. We assumed that we had three independent random samples of BAC readings from the three waves of data collections, as it is highly unlikely that the same bar patrons were surveyed more than once across the three periods. The main result of interest is the bar patron type (intervention or control) by period interaction. The question we were answering was “Did the mean BAC of bar patrons in the intervention bars decrease relative to those in the control bars from pre-intervention to post-intervention?” This interaction effect was measured by age (21 to 34 versus 35 and older) and gender, which controlled for the variation in BAC readings due to characteristics of bar patrons. Because there were 2 post-periods, with the inclusion of both post-periods in the analysis, the bar patron type by period interaction term (3 by 2) only indicated if there was a differential change in at least one of the post-periods. Consequently, we performed separate ANOVAs to compare the mean BACs in pre-intervention period to that in each of the post-intervention periods. These 2 by 2 interactions were useful, because where opposing mean BAC changes occurred for the bar patrons from the intervention and control bars, these interactions may be significant when the 3 by 2 interaction (which includes both periods) was not significant because the effects cancelled each other. In addition, we compared the two post-intervention periods with each other to determine if there was a differential change in the BACs of the intervention bar patrons in one of the groups from the first post-intervention period to the second.
2. The second part of the bar patron analysis pertained to the analysis of those who were intoxicated. Bar patrons who had BAC readings of .08 or higher were categorized as intoxicated, and those who had BACs lower than .08 were categorized as not intoxicated. Logistic regression was used and the main question of interest was whether the odds of being intoxicated decreased for the patrons in the intervention bars relative to those in the control bars in either of the post-intervention periods, while controlling for age and gender. In other words, the main interest was to determine if there was a bar patron type by period interaction. In addition, we also ran
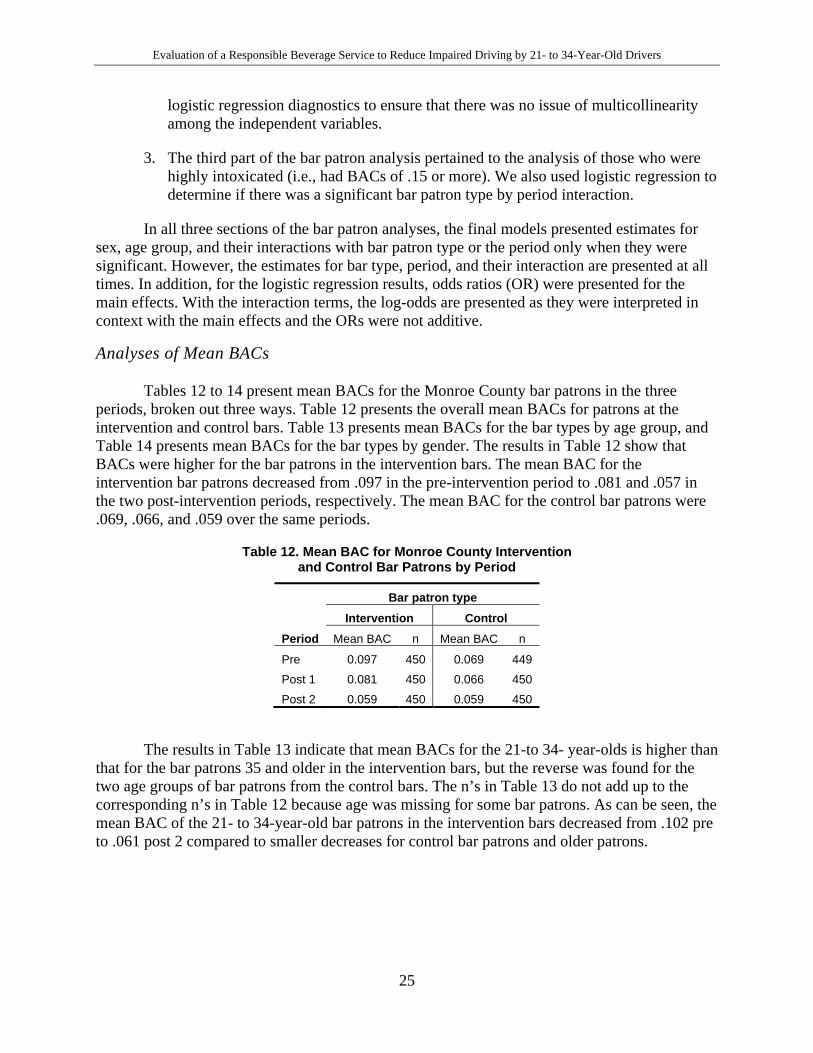
Evaluation of a Responsible Beverage Service to Reduce Impaired Driving by 21- to 34-Year-Old Drivers
25
logistic regression diagnostics to ensure that there was no issue of multicollinearity among the independent variables.
3. The third part of the bar patron analysis pertained to the analysis of those who were highly intoxicated (i.e., had BACs of .15 or more). We also used logistic regression to determine if there was a significant bar patron type by period interaction.
In all three sections of the bar patron analyses, the final models presented estimates for sex, age group, and their interactions with bar patron type or the period only when they were significant. However, the estimates for bar type, period, and their interaction are presented at all times. In addition, for the logistic regression results, odds ratios (OR) were presented for the main effects. With the interaction terms, the log-odds are presented as they were interpreted in context with the main effects and the ORs were not additive.
Analyses of Mean BACs
Tables 12 to 14 present mean BACs for the Monroe County bar patrons in the three periods, broken out three ways. Table 12 presents the overall mean BACs for patrons at the intervention and control bars. Table 13 presents mean BACs for the bar types by age group, and Table 14 presents mean BACs for the bar types by gender. The results in Table 12 show that BACs were higher for the bar patrons in the intervention bars. The mean BAC for the intervention bar patrons decreased from .097 in the pre-intervention period to .081 and .057 in the two post-intervention periods, respectively. The mean BAC for the control bar patrons were .069, .066, and .059 over the same periods.
Table 12. Mean BAC for Monroe County Intervention and Control Bar Patrons by Period
Period
Bar patron type Intervention Control
Mean BAC n Mean BAC n
Pre 0.097 450 0.069 449
Post 1 0.081 450 0.066 450
Post 2 0.059 450 0.059 450
The results in Table 13 indicate that mean BACs for the 21-to 34- year-olds is higher than that for the bar patrons 35 and older in the intervention bars, but the reverse was found for the two age groups of bar patrons from the control bars. The n’s in Table 13 do not add up to the corresponding n’s in Table 12 because age was missing for some bar patrons. As can be seen, the mean BAC of the 21- to 34-year-old bar patrons in the intervention bars decreased from .102 pre to .061 post 2 compared to smaller decreases for control bar patrons and older patrons.
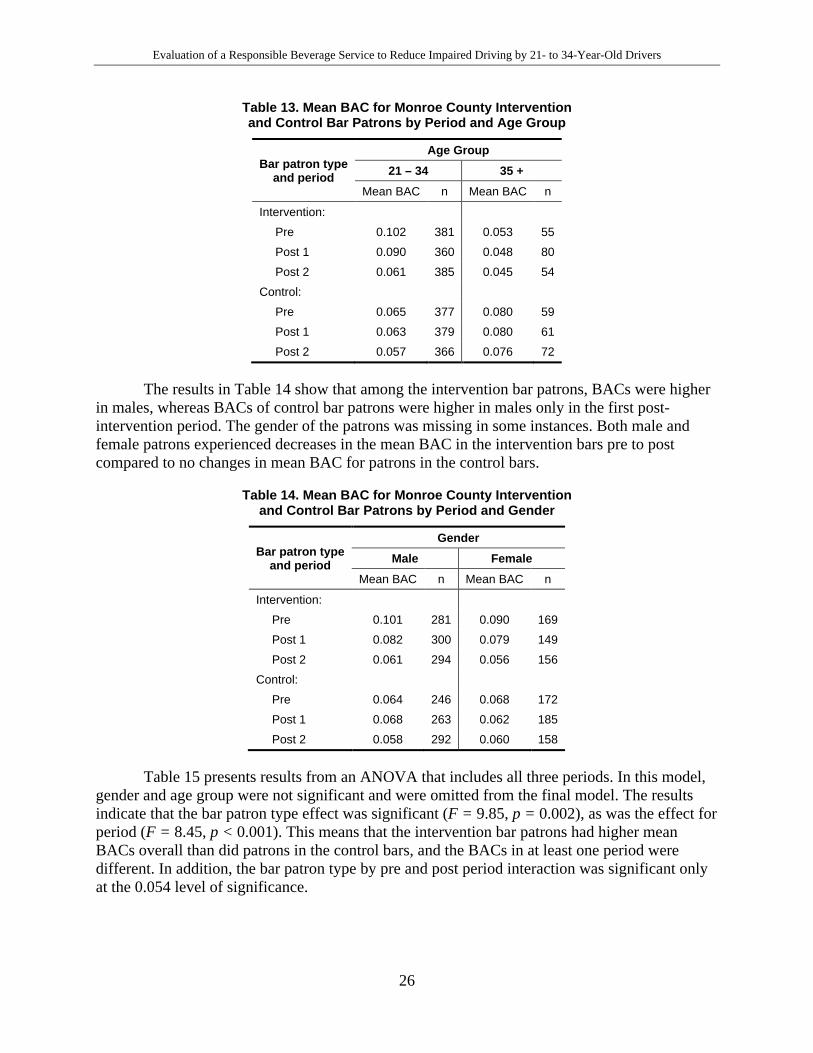
Evaluation of a Responsible Beverage Service to Reduce Impaired Driving by 21- to 34-Year-Old Drivers
26
Table 13. Mean BAC for Monroe County Intervention and Control Bar Patrons by Period and Age Group
Bar patron type and period
Age Group 21 – 34 35 +
Mean BAC n Mean BAC n
Intervention:
Pre 0.102 381 0.053 55
Post 1 0.090 360 0.048 80
Post 2 0.061 385 0.045 54
Control:
Pre 0.065 377 0.080 59
Post 1 0.063 379 0.080 61
Post 2 0.057 366 0.076 72
The results in Table 14 show that among the intervention bar patrons, BACs were higher in males, whereas BACs of control bar patrons were higher in males only in the first post-intervention period. The gender of the patrons was missing in some instances. Both male and female patrons experienced decreases in the mean BAC in the intervention bars pre to post compared to no changes in mean BAC for patrons in the control bars.
Table 14. Mean BAC for Monroe County Intervention and Control Bar Patrons by Period and Gender
Bar patron type and period
Gender Male Female
Mean BAC n Mean BAC n
Intervention:
Pre 0.101 281 0.090 169
Post 1 0.082 300 0.079 149
Post 2 0.061 294 0.056 156
Control:
Pre 0.064 246 0.068 172
Post 1 0.068 263 0.062 185
Post 2 0.058 292 0.060 158
Table 15 presents results from an ANOVA that includes all three periods. In this model, gender and age group were not significant and were omitted from the final model. The results indicate that the bar patron type effect was significant (F = 9.85, p = 0.002), as was the effect for period (F = 8.45, p < 0.001). This means that the intervention bar patrons had higher mean BACs overall than did patrons in the control bars, and the BACs in at least one period were different. In addition, the bar patron type by pre and post period interaction was significant only at the 0.054 level of significance.
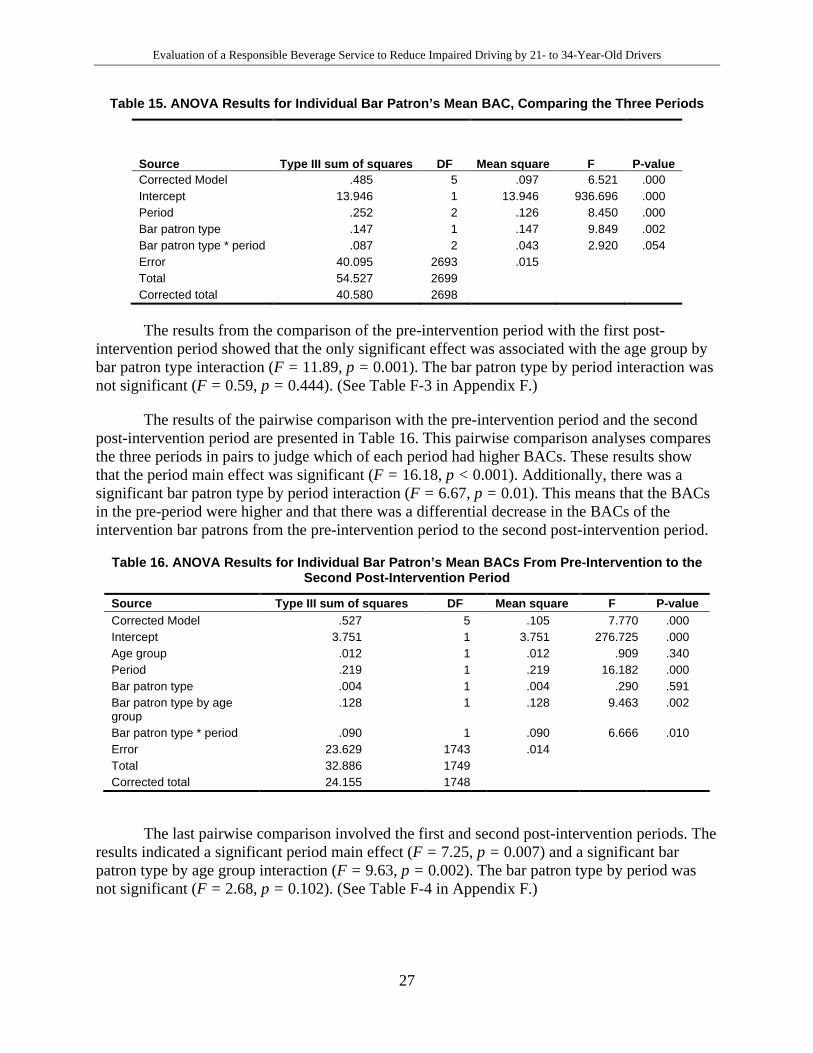
Evaluation of a Responsible Beverage Service to Reduce Impaired Driving by 21- to 34-Year-Old Drivers
27
Table 15. ANOVA Results for Individual Bar Patron’s Mean BAC, Comparing the Three Periods
Source Type III sum of squares DF Mean square F P-value Corrected Model .485 5 .097 6.521 .000 Intercept 13.946 1 13.946 936.696 .000 Period .252 2 .126 8.450 .000 Bar patron type .147 1 .147 9.849 .002 Bar patron type * period .087 2 .043 2.920 .054 Error 40.095 2693 .015
Total 54.527 2699
Corrected total 40.580 2698
The results from the comparison of the pre-intervention period with the first post-intervention period showed that the only significant effect was associated with the age group by bar patron type interaction (F = 11.89, p = 0.001). The bar patron type by period interaction was not significant (F = 0.59, p = 0.444). (See Table F-3 in Appendix F.)
The results of the pairwise comparison with the pre-intervention period and the second post-intervention period are presented in Table 16. This pairwise comparison analyses compares the three periods in pairs to judge which of each period had higher BACs. These results show that the period main effect was significant (F = 16.18, p < 0.001). Additionally, there was a significant bar patron type by period interaction (F = 6.67, p = 0.01). This means that the BACs in the pre-period were higher and that there was a differential decrease in the BACs of the intervention bar patrons from the pre-intervention period to the second post-intervention period.
Table 16. ANOVA Results for Individual Bar Patron’s Mean BACs From Pre-Intervention to the Second Post-Intervention Period
Source Type III sum of squares DF Mean square F P-value Corrected Model .527 5 .105 7.770 .000 Intercept 3.751 1 3.751 276.725 .000 Age group .012 1 .012 .909 .340 Period .219 1 .219 16.182 .000 Bar patron type .004 1 .004 .290 .591 Bar patron type by age group
.128 1 .128 9.463 .002
Bar patron type * period .090 1 .090 6.666 .010 Error 23.629 1743 .014
Total 32.886 1749 Corrected total 24.155 1748
The last pairwise comparison involved the first and second post-intervention periods. The results indicated a significant period main effect (F = 7.25, p = 0.007) and a significant bar patron type by age group interaction (F = 9.63, p = 0.002). The bar patron type by period was not significant (F = 2.68, p = 0.102). (See Table F-4 in Appendix F.)
Evaluation of a Responsible Beverage Service to Reduce Impaired Driving by 21- to 34-Year-Old Drivers
28
Subgroup Analyses
In addition to the analyses on the overall sample, we examined subgroup differences for the three BAC outcome measures (mean BACs, likelihood of being intoxicated, and likelihood of being highly intoxicated), using the same statistical techniques as the overall analyses. These group-level analyses were based on bar patrons’ age, intention to drive afterwards, past drinking-driving behaviors, and problem drinking. Only significant results are presented. Following are the findings on subgroup differences on mean BAC.
• By age group
− For patrons 21 to 34, there was a significant and negative interaction for bar patron type by period (β = -0.032, p = 0.007, see Table G-1 in Appendix G), when the second post-intervention period is compared against the pre-intervention period. This means that there was a greater decrease in the mean BACs among the intervention bars than the control bars from the pre-intervention period to the second post-intervention period.
− No significant effect was found among older patrons.
• To measure intention to drive, patrons were asked whether they were driving that evening, and separate analyses were conducted based on their answers. No significant interaction for bar patron type by period was found for either group.
• For past drinking-driving behavior, patrons provided self-reports about the number of times in the past month they had driven within 2 hours after drinking alcohol. Those who answered “never/none” were classified as non-drinking drivers, and all others were classified as drinking drivers.
− For drinking drivers, there was a significant and negative interaction for bar patron type by period, when the second post-intervention period was compared against the pre-intervention period (see Table G-2 in Appendix G). This means that there was a greater decrease in the BACs among the intervention bars than the control bars from the pre-intervention to the second post-intervention period.
− No such effect was detected among nondrinking drivers.
• For past problem-drinking behavior, patrons were asked about their past problematic drinking behaviors by a set of four self-report items comprising the CAGE (“Have you ever felt the need to cut down on your drinking?” “Have people annoyed you by criticizing your drinking?” “Have you ever felt badly or guilty about your drinking?’ “Have you ever had a drink first thing in the morning [eye-opener]?”). Those who answered “yes” to at least two of the four questions were categorized as problem-drinkers. No significant effect was found among either problem drinkers or non-problem drinkers.
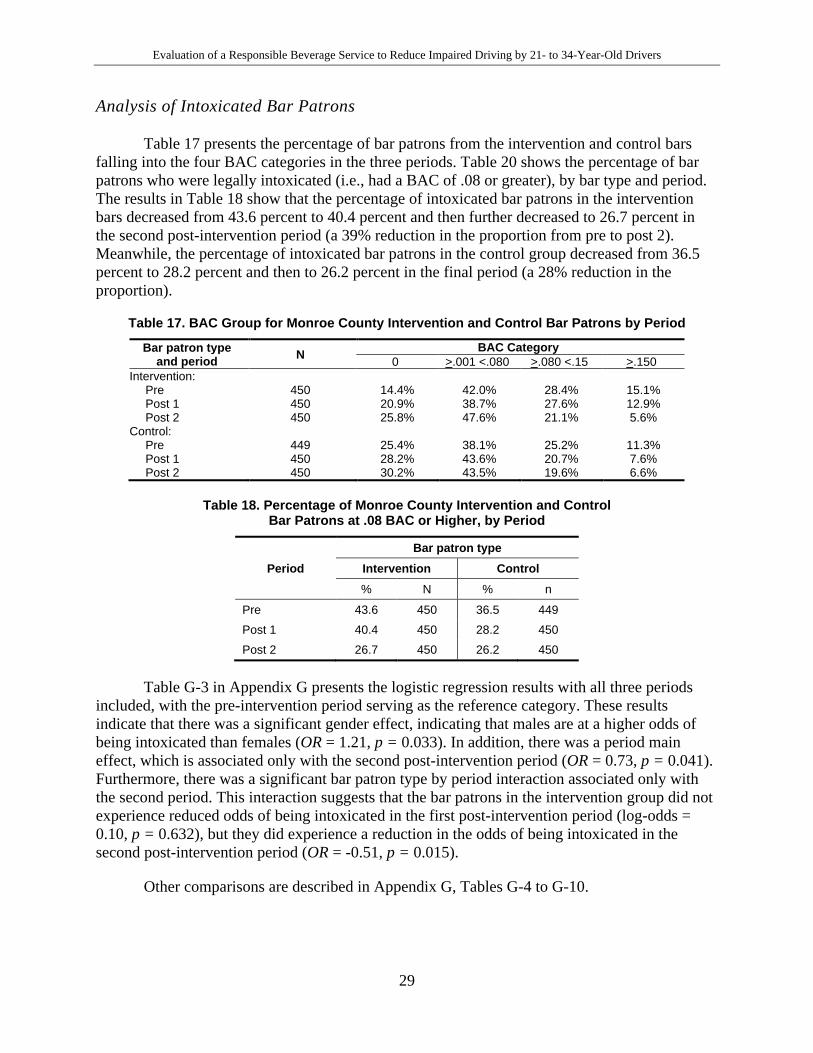
Evaluation of a Responsible Beverage Service to Reduce Impaired Driving by 21- to 34-Year-Old Drivers
29
Analysis of Intoxicated Bar Patrons
Table 17 presents the percentage of bar patrons from the intervention and control bars falling into the four BAC categories in the three periods. Table 20 shows the percentage of bar patrons who were legally intoxicated (i.e., had a BAC of .08 or greater), by bar type and period. The results in Table 18 show that the percentage of intoxicated bar patrons in the intervention bars decreased from 43.6 percent to 40.4 percent and then further decreased to 26.7 percent in the second post-intervention period (a 39% reduction in the proportion from pre to post 2). Meanwhile, the percentage of intoxicated bar patrons in the control group decreased from 36.5 percent to 28.2 percent and then to 26.2 percent in the final period (a 28% reduction in the proportion).
Table 17. BAC Group for Monroe County Intervention and Control Bar Patrons by Period
Bar patron type and period N BAC Category
0 >.001 <.080 >.080 <.15 >.150 Intervention:
Pre 450 14.4% 42.0% 28.4% 15.1% Post 1 450 20.9% 38.7% 27.6% 12.9% Post 2 450 25.8% 47.6% 21.1% 5.6%
Control: Pre 449 25.4% 38.1% 25.2% 11.3% Post 1 450 28.2% 43.6% 20.7% 7.6% Post 2 450 30.2% 43.5% 19.6% 6.6%
Table 18. Percentage of Monroe County Intervention and Control Bar Patrons at .08 BAC or Higher, by Period
Period Bar patron type
Intervention Control % N % n
Pre 43.6 450 36.5 449
Post 1 40.4 450 28.2 450
Post 2 26.7 450 26.2 450
Table G-3 in Appendix G presents the logistic regression results with all three periods included, with the pre-intervention period serving as the reference category. These results indicate that there was a significant gender effect, indicating that males are at a higher odds of being intoxicated than females (OR = 1.21, p = 0.033). In addition, there was a period main effect, which is associated only with the second post-intervention period (OR = 0.73, p = 0.041). Furthermore, there was a significant bar patron type by period interaction associated only with the second period. This interaction suggests that the bar patrons in the intervention group did not experience reduced odds of being intoxicated in the first post-intervention period (log-odds = 0.10, p = 0.632), but they did experience a reduction in the odds of being intoxicated in the second post-intervention period (OR = -0.51, p = 0.015).
Other comparisons are described in Appendix G, Tables G-4 to G-10.
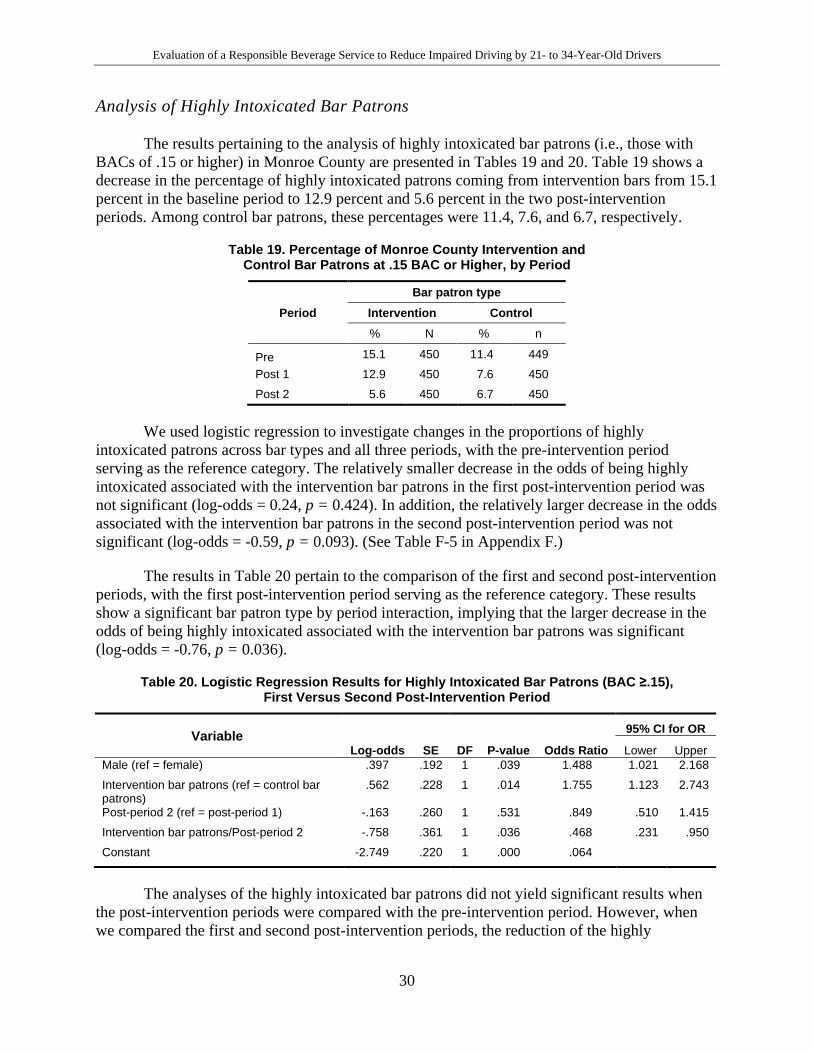
Evaluation of a Responsible Beverage Service to Reduce Impaired Driving by 21- to 34-Year-Old Drivers
30
Analysis of Highly Intoxicated Bar Patrons
The results pertaining to the analysis of highly intoxicated bar patrons (i.e., those with BACs of .15 or higher) in Monroe County are presented in Tables 19 and 20. Table 19 shows a decrease in the percentage of highly intoxicated patrons coming from intervention bars from 15.1 percent in the baseline period to 12.9 percent and 5.6 percent in the two post-intervention periods. Among control bar patrons, these percentages were 11.4, 7.6, and 6.7, respectively.
Table 19. Percentage of Monroe County Intervention and Control Bar Patrons at .15 BAC or Higher, by Period
Period Bar patron type
Intervention Control % N % n
Pre 15.1 450 11.4 449
Post 1 12.9 450 7.6 450
Post 2 5.6 450 6.7 450
We used logistic regression to investigate changes in the proportions of highly intoxicated patrons across bar types and all three periods, with the pre-intervention period serving as the reference category. The relatively smaller decrease in the odds of being highly intoxicated associated with the intervention bar patrons in the first post-intervention period was not significant (log-odds = 0.24, p = 0.424). In addition, the relatively larger decrease in the odds associated with the intervention bar patrons in the second post-intervention period was not significant (log-odds = -0.59, p = 0.093). (See Table F-5 in Appendix F.)
The results in Table 20 pertain to the comparison of the first and second post-intervention periods, with the first post-intervention period serving as the reference category. These results show a significant bar patron type by period interaction, implying that the larger decrease in the odds of being highly intoxicated associated with the intervention bar patrons was significant (log-odds = -0.76, p = 0.036).
Table 20. Logistic Regression Results for Highly Intoxicated Bar Patrons (BAC ≥.15), First Versus Second Post-Intervention Period
Variable Log-odds SE DF P-value Odds Ratio
95% CI for OR
Lower Upper Male (ref = female) .397 .192 1 .039 1.488 1.021 2.168
Intervention bar patrons (ref = control bar patrons)
.562 .228 1 .014 1.755 1.123 2.743
Post-period 2 (ref = post-period 1) -.163 .260 1 .531 .849 .510 1.415
Intervention bar patrons/Post-period 2 -.758 .361 1 .036 .468 .231 .950
Constant -2.749 .220 1 .000 .064
The analyses of the highly intoxicated bar patrons did not yield significant results when the post-intervention periods were compared with the pre-intervention period. However, when we compared the first and second post-intervention periods, the reduction of the highly
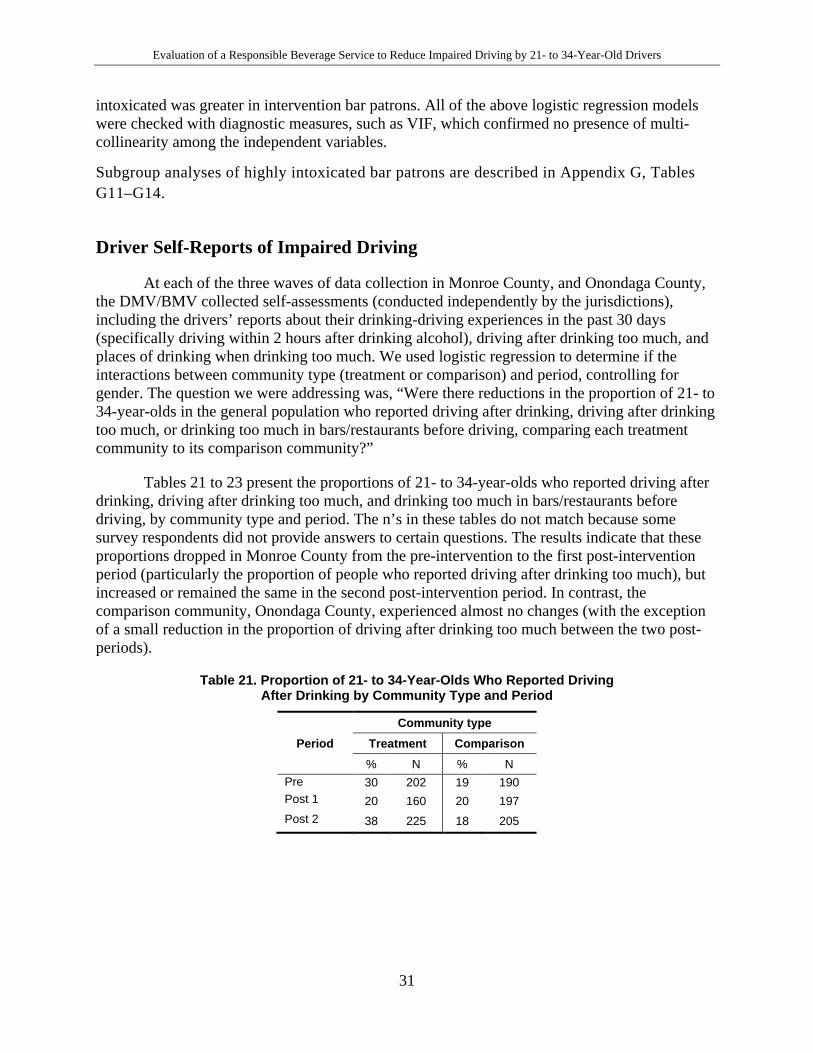
Evaluation of a Responsible Beverage Service to Reduce Impaired Driving by 21- to 34-Year-Old Drivers
31
intoxicated was greater in intervention bar patrons. All of the above logistic regression models were checked with diagnostic measures, such as VIF, which confirmed no presence of multi-collinearity among the independent variables.
Subgroup analyses of highly intoxicated bar patrons are described in Appendix G, Tables G11–G14.
Driver Self-Reports of Impaired Driving At each of the three waves of data collection in Monroe County, and Onondaga County,
the DMV/BMV collected self-assessments (conducted independently by the jurisdictions), including the drivers’ reports about their drinking-driving experiences in the past 30 days (specifically driving within 2 hours after drinking alcohol), driving after drinking too much, and places of drinking when drinking too much. We used logistic regression to determine if the interactions between community type (treatment or comparison) and period, controlling for gender. The question we were addressing was, “Were there reductions in the proportion of 21- to 34-year-olds in the general population who reported driving after drinking, driving after drinking too much, or drinking too much in bars/restaurants before driving, comparing each treatment community to its comparison community?”
Tables 21 to 23 present the proportions of 21- to 34-year-olds who reported driving after drinking, driving after drinking too much, and drinking too much in bars/restaurants before driving, by community type and period. The n’s in these tables do not match because some survey respondents did not provide answers to certain questions. The results indicate that these proportions dropped in Monroe County from the pre-intervention to the first post-intervention period (particularly the proportion of people who reported driving after drinking too much), but increased or remained the same in the second post-intervention period. In contrast, the comparison community, Onondaga County, experienced almost no changes (with the exception of a small reduction in the proportion of driving after drinking too much between the two post-periods).
Table 21. Proportion of 21- to 34-Year-Olds Who Reported Driving After Drinking by Community Type and Period
Period Community type
Treatment Comparison % N % N
Pre 30 202 19 190 Post 1 20 160 20 197 Post 2 38 225 18 205
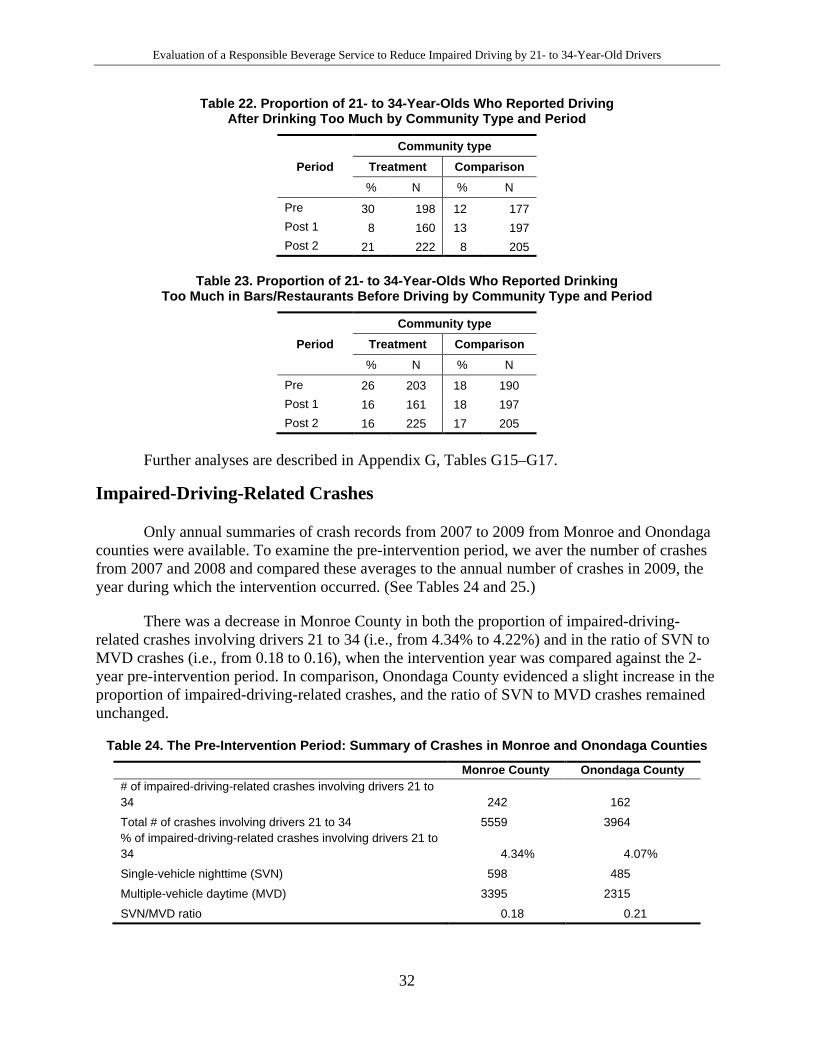
Evaluation of a Responsible Beverage Service to Reduce Impaired Driving by 21- to 34-Year-Old Drivers
32
Table 22. Proportion of 21- to 34-Year-Olds Who Reported Driving After Drinking Too Much by Community Type and Period
Period Community type
Treatment Comparison % N % N
Pre 30 198 12 177 Post 1 8 160 13 197 Post 2 21 222 8 205
Table 23. Proportion of 21- to 34-Year-Olds Who Reported Drinking Too Much in Bars/Restaurants Before Driving by Community Type and Period
Period Community type
Treatment Comparison % N % N
Pre 26 203 18 190 Post 1 16 161 18 197 Post 2 16 225 17 205
Further analyses are described in Appendix G, Tables G15–G17.
Impaired-Driving-Related Crashes
Only annual summaries of crash records from 2007 to 2009 from Monroe and Onondaga counties were available. To examine the pre-intervention period, we aver the number of crashes from 2007 and 2008 and compared these averages to the annual number of crashes in 2009, the year during which the intervention occurred. (See Tables 24 and 25.)
There was a decrease in Monroe County in both the proportion of impaired-driving-related crashes involving drivers 21 to 34 (i.e., from 4.34% to 4.22%) and in the ratio of SVN to MVD crashes (i.e., from 0.18 to 0.16), when the intervention year was compared against the 2-year pre-intervention period. In comparison, Onondaga County evidenced a slight increase in the proportion of impaired-driving-related crashes, and the ratio of SVN to MVD crashes remained unchanged.
Table 24. The Pre-Intervention Period: Summary of Crashes in Monroe and Onondaga Counties
Monroe County Onondaga County # of impaired-driving-related crashes involving drivers 21 to 34 242 162
Total # of crashes involving drivers 21 to 34 5559 3964 % of impaired-driving-related crashes involving drivers 21 to 34 4.34% 4.07%
Single-vehicle nighttime (SVN) 598 485
Multiple-vehicle daytime (MVD) 3395 2315
SVN/MVD ratio 0.18 0.21
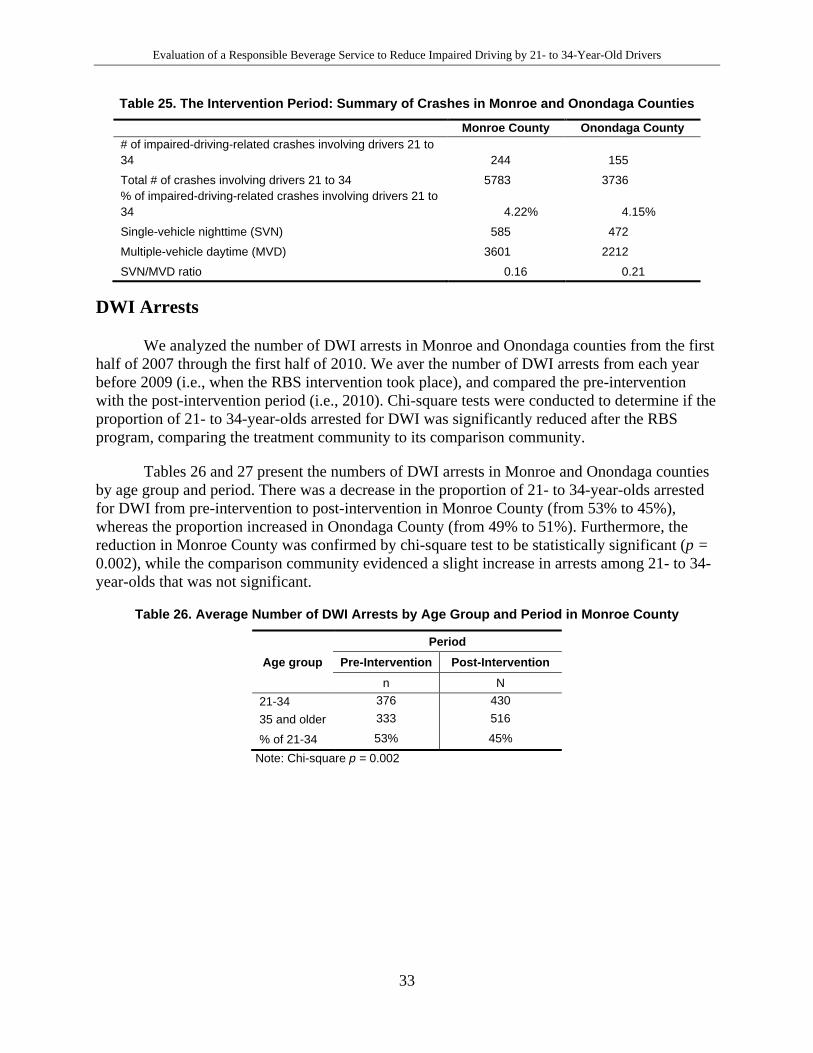
Evaluation of a Responsible Beverage Service to Reduce Impaired Driving by 21- to 34-Year-Old Drivers
33
Table 25. The Intervention Period: Summary of Crashes in Monroe and Onondaga Counties
Monroe County Onondaga County # of impaired-driving-related crashes involving drivers 21 to 34 244 155
Total # of crashes involving drivers 21 to 34 5783 3736 % of impaired-driving-related crashes involving drivers 21 to 34 4.22% 4.15%
Single-vehicle nighttime (SVN) 585 472
Multiple-vehicle daytime (MVD) 3601 2212
SVN/MVD ratio 0.16 0.21
DWI Arrests
We analyzed the number of DWI arrests in Monroe and Onondaga counties from the first half of 2007 through the first half of 2010. We aver the number of DWI arrests from each year before 2009 (i.e., when the RBS intervention took place), and compared the pre-intervention with the post-intervention period (i.e., 2010). Chi-square tests were conducted to determine if the proportion of 21- to 34-year-olds arrested for DWI was significantly reduced after the RBS program, comparing the treatment community to its comparison community.
Tables 26 and 27 present the numbers of DWI arrests in Monroe and Onondaga counties by age group and period. There was a decrease in the proportion of 21- to 34-year-olds arrested for DWI from pre-intervention to post-intervention in Monroe County (from 53% to 45%), whereas the proportion increased in Onondaga County (from 49% to 51%). Furthermore, the reduction in Monroe County was confirmed by chi-square test to be statistically significant (p = 0.002), while the comparison community evidenced a slight increase in arrests among 21- to 34-year-olds that was not significant.
Table 26. Average Number of DWI Arrests by Age Group and Period in Monroe County
Age group Period
Pre-Intervention Post-Intervention n N
21-34 376 430 35 and older 333 516
% of 21-34 53% 45% Note: Chi-square p = 0.002
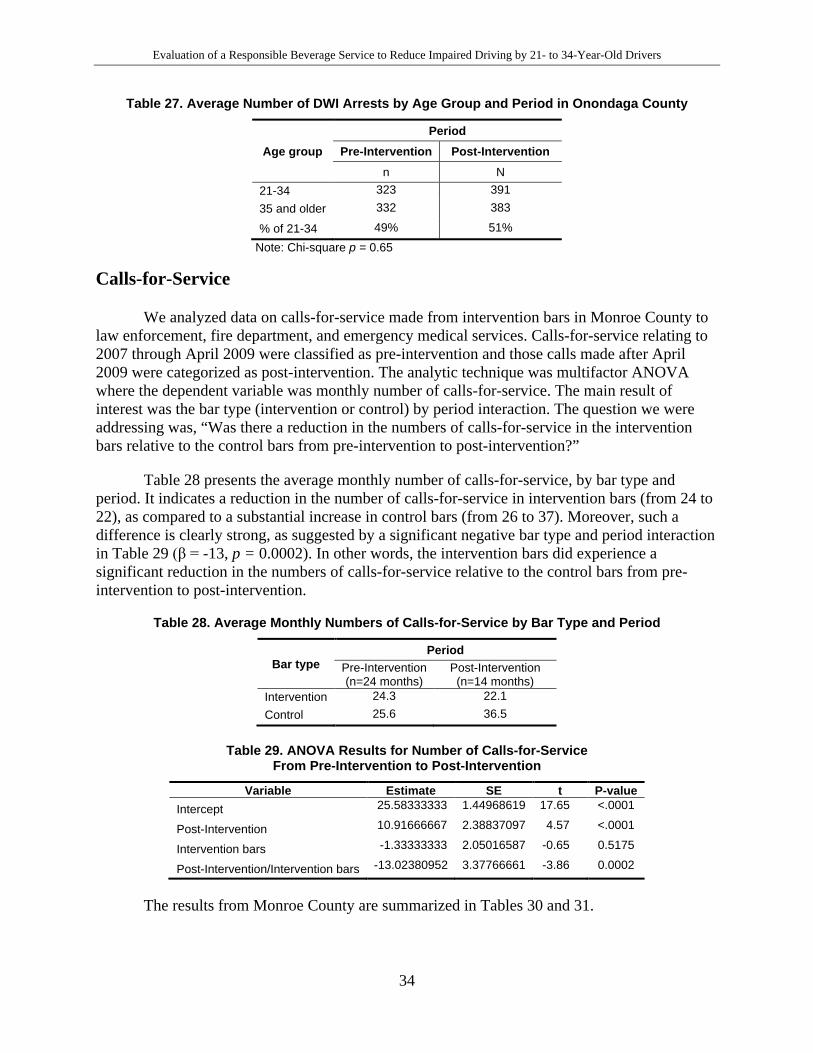
Evaluation of a Responsible Beverage Service to Reduce Impaired Driving by 21- to 34-Year-Old Drivers
34
Table 27. Average Number of DWI Arrests by Age Group and Period in Onondaga County
Age group Period
Pre-Intervention Post-Intervention n N
21-34 323 391 35 and older 332 383
% of 21-34 49% 51% Note: Chi-square p = 0.65
Calls-for-Service
We analyzed data on calls-for-service made from intervention bars in Monroe County to law enforcement, fire department, and emergency medical services. Calls-for-service relating to 2007 through April 2009 were classified as pre-intervention and those calls made after April 2009 were categorized as post-intervention. The analytic technique was multifactor ANOVA where the dependent variable was monthly number of calls-for-service. The main result of interest was the bar type (intervention or control) by period interaction. The question we were addressing was, “Was there a reduction in the numbers of calls-for-service in the intervention bars relative to the control bars from pre-intervention to post-intervention?”
Table 28 presents the average monthly number of calls-for-service, by bar type and period. It indicates a reduction in the number of calls-for-service in intervention bars (from 24 to 22), as compared to a substantial increase in control bars (from 26 to 37). Moreover, such a difference is clearly strong, as suggested by a significant negative bar type and period interaction in Table 29 (β = -13, p = 0.0002). In other words, the intervention bars did experience a significant reduction in the numbers of calls-for-service relative to the control bars from pre-intervention to post-intervention.
Table 28. Average Monthly Numbers of Calls-for-Service by Bar Type and Period
Bar type Period
Pre-Intervention (n=24 months)
Post-Intervention (n=14 months)
Intervention 24.3 22.1 Control 25.6 36.5
Table 29. ANOVA Results for Number of Calls-for-Service From Pre-Intervention to Post-Intervention
Variable Estimate SE t P-value Intercept 25.58333333 1.44968619 17.65 <.0001
Post-Intervention 10.91666667 2.38837097 4.57 <.0001
Intervention bars -1.33333333 2.05016587 -0.65 0.5175
Post-Intervention/Intervention bars -13.02380952 3.37766661 -3.86 0.0002
The results from Monroe County are summarized in Tables 30 and 31.
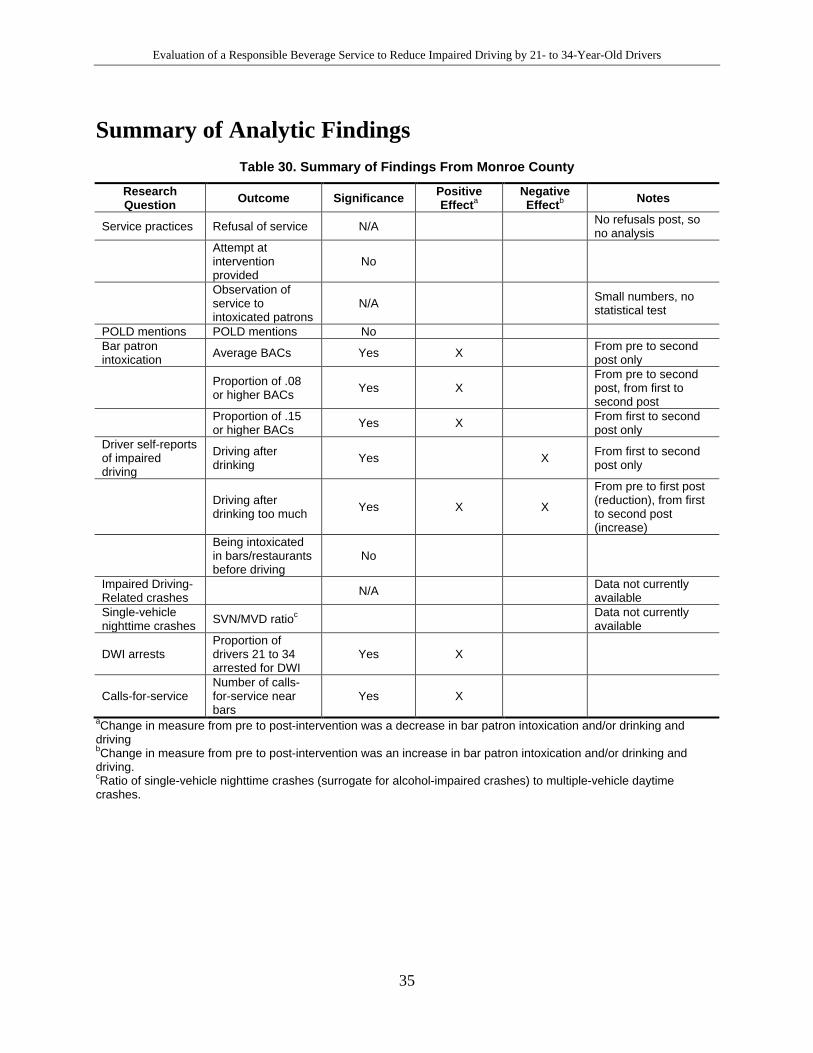
Evaluation of a Responsible Beverage Service to Reduce Impaired Driving by 21- to 34-Year-Old Drivers
35
Summary of Analytic Findings Table 30. Summary of Findings From Monroe County
Research Question Outcome Significance Positive
Effecta Negative Effectb Notes
Service practices Refusal of service N/A No refusals post, so no analysis
Attempt at intervention provided
No
Observation of service to intoxicated patrons
N/A Small numbers, no statistical test
POLD mentions POLD mentions No Bar patron intoxication Average BACs Yes X From pre to second
post only
Proportion of .08 or higher BACs Yes X
From pre to second post, from first to second post
Proportion of .15 or higher BACs Yes X From first to second
post only Driver self-reports of impaired driving
Driving after drinking Yes X From first to second
post only
Driving after drinking too much Yes X X
From pre to first post (reduction), from first to second post (increase)
Being intoxicated in bars/restaurants before driving
No
Impaired Driving-Related crashes N/A Data not currently
available Single-vehicle nighttime crashes SVN/MVD ratioc Data not currently
available
DWI arrests Proportion of drivers 21 to 34 arrested for DWI
Yes X
Calls-for-service Number of calls-for-service near bars
Yes X
aChange in measure from pre to post-intervention was a decrease in bar patron intoxication and/or drinking and driving
bChange in measure from pre to post-intervention was an increase in bar patron intoxication and/or drinking and driving. cRatio of single-vehicle nighttime crashes (surrogate for alcohol-impaired crashes) to multiple-vehicle daytime crashes.
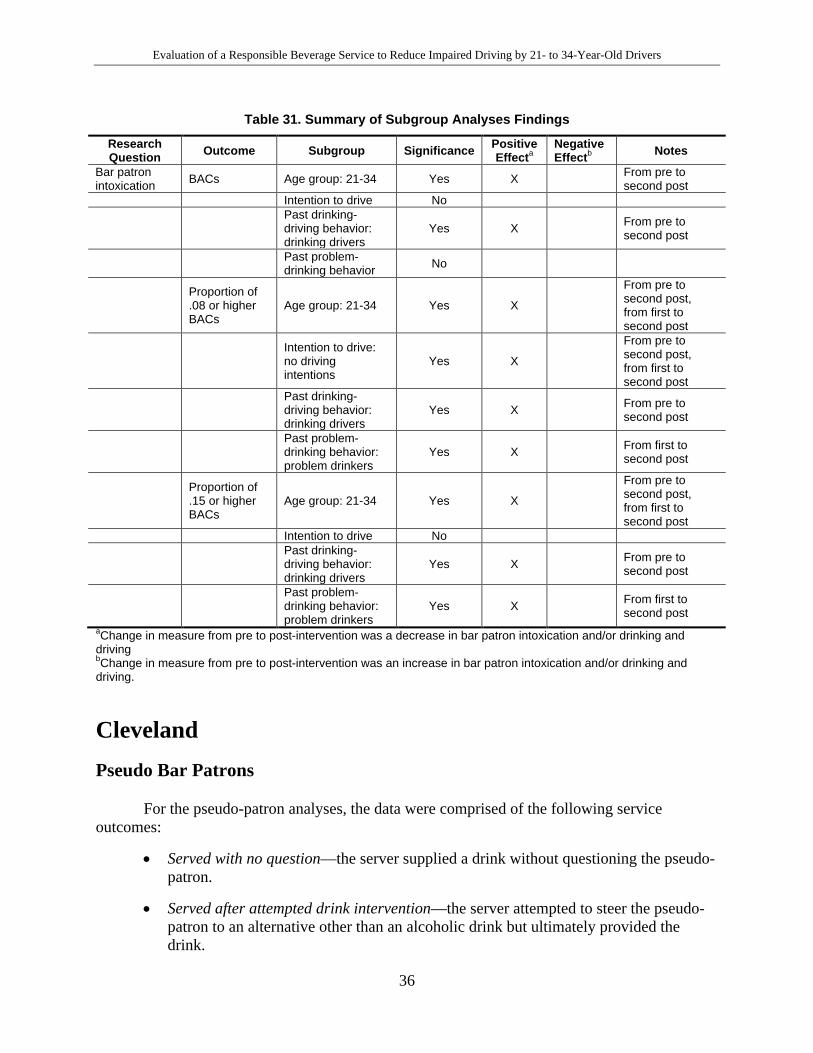
Evaluation of a Responsible Beverage Service to Reduce Impaired Driving by 21- to 34-Year-Old Drivers
36
Table 31. Summary of Subgroup Analyses Findings
Research Question Outcome Subgroup Significance Positive
Effecta Negative Effectb Notes
Bar patron intoxication BACs Age group: 21-34 Yes X From pre to
second post Intention to drive No
Past drinking-driving behavior: drinking drivers
Yes X From pre to second post
Past problem-drinking behavior No
Proportion of .08 or higher BACs
Age group: 21-34 Yes X
From pre to second post, from first to second post
Intention to drive: no driving intentions
Yes X
From pre to second post, from first to second post
Past drinking-driving behavior: drinking drivers
Yes X From pre to second post
Past problem-drinking behavior: problem drinkers
Yes X From first to second post
Proportion of .15 or higher BACs
Age group: 21-34 Yes X
From pre to second post, from first to second post
Intention to drive No
Past drinking-driving behavior: drinking drivers
Yes X From pre to second post
Past problem-drinking behavior: problem drinkers
Yes X From first to second post
aChange in measure from pre to post-intervention was a decrease in bar patron intoxication and/or drinking and driving
bChange in measure from pre to post-intervention was an increase in bar patron intoxication and/or drinking and driving.
Cleveland Pseudo Bar Patrons
For the pseudo-patron analyses, the data were comprised of the following service outcomes:
• Served with no question—the server supplied a drink without questioning the pseudo-patron.
• Served after attempted drink intervention—the server attempted to steer the pseudo-patron to an alternative other than an alcoholic drink but ultimately provided the drink.
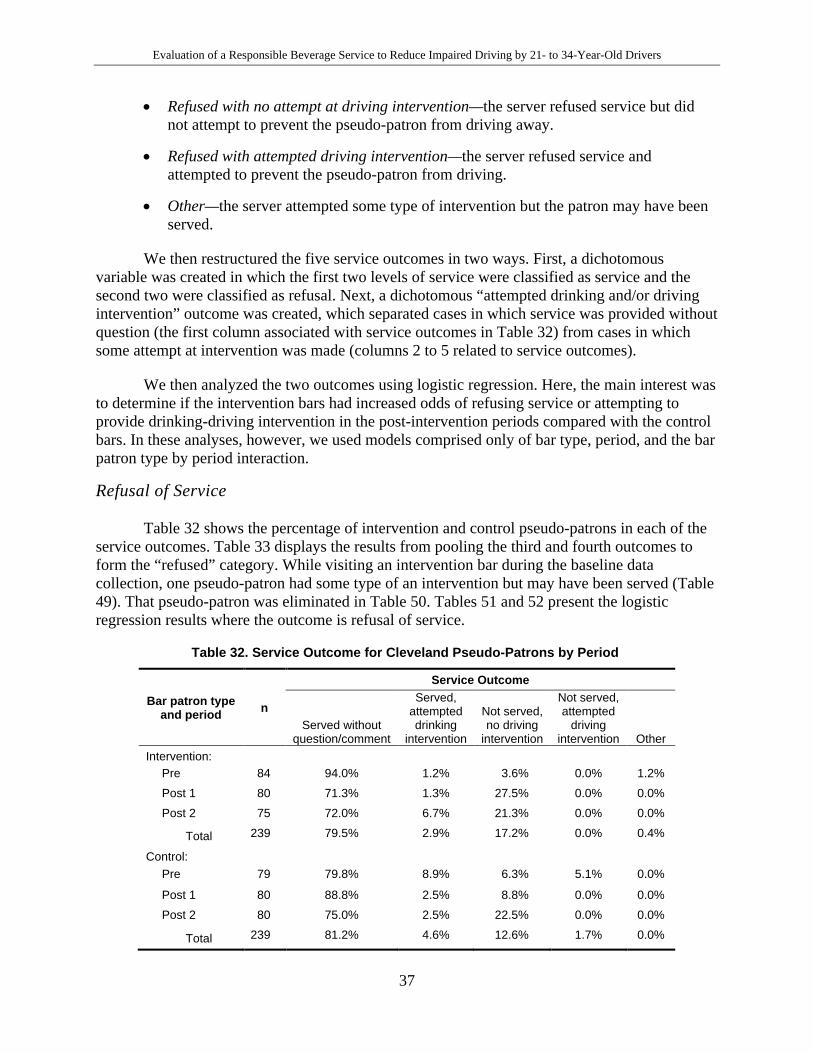
Evaluation of a Responsible Beverage Service to Reduce Impaired Driving by 21- to 34-Year-Old Drivers
37
• Refused with no attempt at driving intervention—the server refused service but did not attempt to prevent the pseudo-patron from driving away.
• Refused with attempted driving intervention—the server refused service and attempted to prevent the pseudo-patron from driving.
• Other—the server attempted some type of intervention but the patron may have been served.
We then restructured the five service outcomes in two ways. First, a dichotomous variable was created in which the first two levels of service were classified as service and the second two were classified as refusal. Next, a dichotomous “attempted drinking and/or driving intervention” outcome was created, which separated cases in which service was provided without question (the first column associated with service outcomes in Table 32) from cases in which some attempt at intervention was made (columns 2 to 5 related to service outcomes).
We then analyzed the two outcomes using logistic regression. Here, the main interest was to determine if the intervention bars had increased odds of refusing service or attempting to provide drinking-driving intervention in the post-intervention periods compared with the control bars. In these analyses, however, we used models comprised only of bar type, period, and the bar patron type by period interaction.
Refusal of Service
Table 32 shows the percentage of intervention and control pseudo-patrons in each of the service outcomes. Table 33 displays the results from pooling the third and fourth outcomes to form the “refused” category. While visiting an intervention bar during the baseline data collection, one pseudo-patron had some type of an intervention but may have been served (Table 49). That pseudo-patron was eliminated in Table 50. Tables 51 and 52 present the logistic regression results where the outcome is refusal of service.
Table 32. Service Outcome for Cleveland Pseudo-Patrons by Period
Bar patron type and period n
Service Outcome
Served without question/comment
Served, attempted drinking
intervention
Not served, no driving
intervention
Not served, attempted
driving intervention Other
Intervention:
Pre 84 94.0% 1.2% 3.6% 0.0% 1.2%
Post 1 80 71.3% 1.3% 27.5% 0.0% 0.0%
Post 2 75 72.0% 6.7% 21.3% 0.0% 0.0%
Total 239 79.5% 2.9% 17.2% 0.0% 0.4%
Control:
Pre 79 79.8% 8.9% 6.3% 5.1% 0.0%
Post 1 80 88.8% 2.5% 8.8% 0.0% 0.0%
Post 2 80 75.0% 2.5% 22.5% 0.0% 0.0%
Total 239 81.2% 4.6% 12.6% 1.7% 0.0%
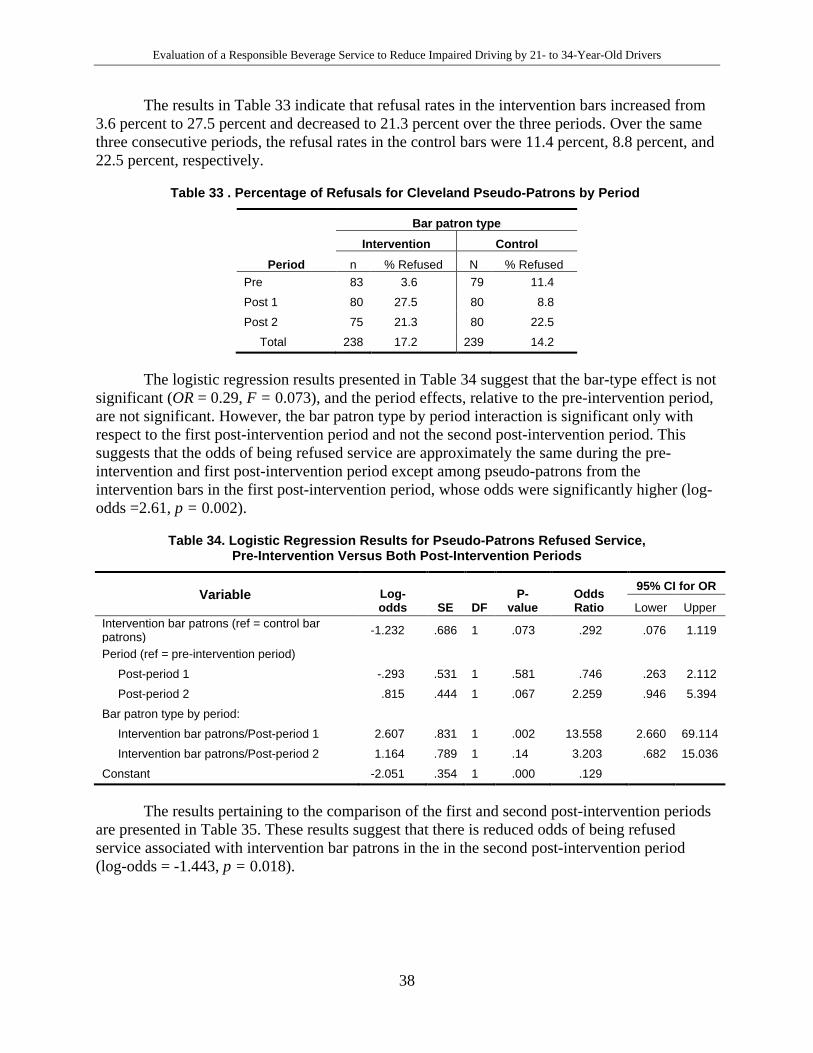
Evaluation of a Responsible Beverage Service to Reduce Impaired Driving by 21- to 34-Year-Old Drivers
38
The results in Table 33 indicate that refusal rates in the intervention bars increased from 3.6 percent to 27.5 percent and decreased to 21.3 percent over the three periods. Over the same three consecutive periods, the refusal rates in the control bars were 11.4 percent, 8.8 percent, and 22.5 percent, respectively.
Table 33 . Percentage of Refusals for Cleveland Pseudo-Patrons by Period
Period
Bar patron type Intervention Control
n % Refused N % Refused Pre 83 3.6 79 11.4
Post 1 80 27.5 80 8.8
Post 2 75 21.3 80 22.5
Total 238 17.2 239 14.2
The logistic regression results presented in Table 34 suggest that the bar-type effect is not significant (OR = 0.29, F = 0.073), and the period effects, relative to the pre-intervention period, are not significant. However, the bar patron type by period interaction is significant only with respect to the first post-intervention period and not the second post-intervention period. This suggests that the odds of being refused service are approximately the same during the pre-intervention and first post-intervention period except among pseudo-patrons from the intervention bars in the first post-intervention period, whose odds were significantly higher (log-odds =2.61, p = 0.002).
Table 34. Logistic Regression Results for Pseudo-Patrons Refused Service, Pre-Intervention Versus Both Post-Intervention Periods
Variable Log-odds SE DF
P-value
Odds Ratio
95% CI for OR
Lower Upper Intervention bar patrons (ref = control bar patrons) -1.232 .686 1 .073 .292 .076 1.119
Period (ref = pre-intervention period) Post-period 1 -.293 .531 1 .581 .746 .263 2.112
Post-period 2 .815 .444 1 .067 2.259 .946 5.394
Bar patron type by period: Intervention bar patrons/Post-period 1 2.607 .831 1 .002 13.558 2.660 69.114
Intervention bar patrons/Post-period 2 1.164 .789 1 .14 3.203 .682 15.036
Constant -2.051 .354 1 .000 .129
The results pertaining to the comparison of the first and second post-intervention periods are presented in Table 35. These results suggest that there is reduced odds of being refused service associated with intervention bar patrons in the in the second post-intervention period (log-odds = -1.443, p = 0.018).
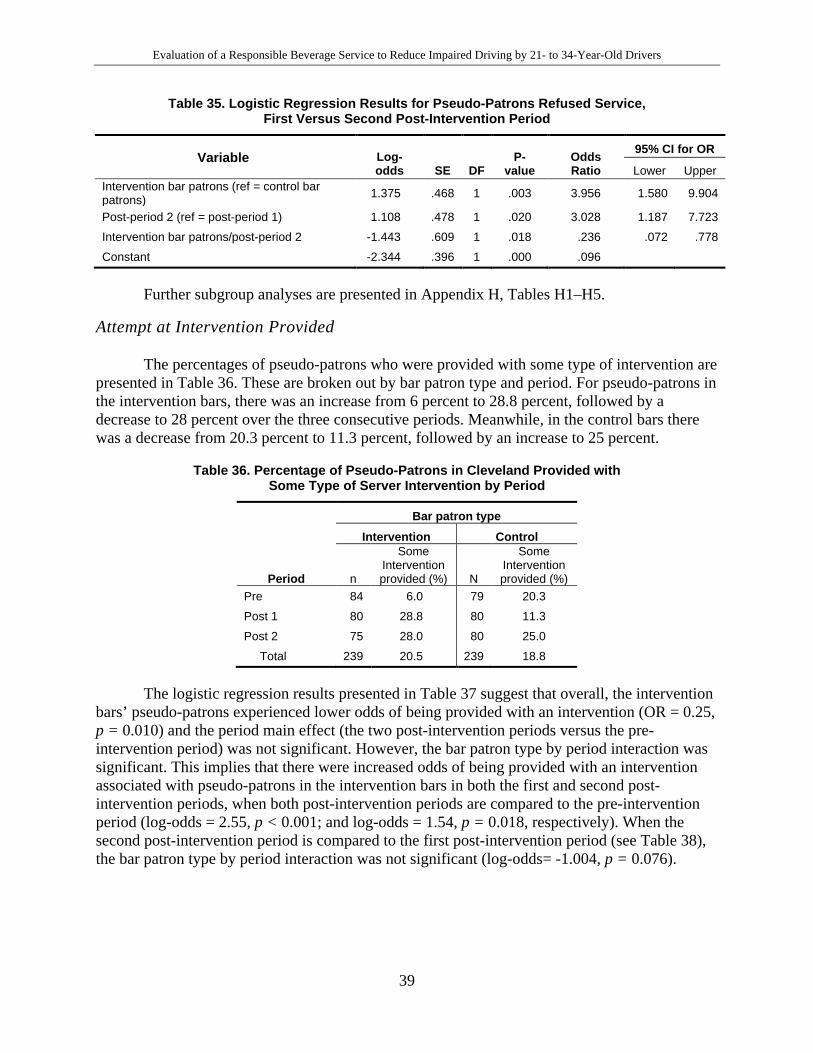
Evaluation of a Responsible Beverage Service to Reduce Impaired Driving by 21- to 34-Year-Old Drivers
39
Table 35. Logistic Regression Results for Pseudo-Patrons Refused Service, First Versus Second Post-Intervention Period
Variable Log-odds SE DF
P-value
Odds Ratio
95% CI for OR
Lower Upper Intervention bar patrons (ref = control bar patrons) 1.375 .468 1 .003 3.956 1.580 9.904
Post-period 2 (ref = post-period 1) 1.108 .478 1 .020 3.028 1.187 7.723
Intervention bar patrons/post-period 2 -1.443 .609 1 .018 .236 .072 .778
Constant -2.344 .396 1 .000 .096
Further subgroup analyses are presented in Appendix H, Tables H1–H5.
Attempt at Intervention Provided
The percentages of pseudo-patrons who were provided with some type of intervention are presented in Table 36. These are broken out by bar patron type and period. For pseudo-patrons in the intervention bars, there was an increase from 6 percent to 28.8 percent, followed by a decrease to 28 percent over the three consecutive periods. Meanwhile, in the control bars there was a decrease from 20.3 percent to 11.3 percent, followed by an increase to 25 percent.
Table 36. Percentage of Pseudo-Patrons in Cleveland Provided with Some Type of Server Intervention by Period
Period
Bar patron type Intervention Control
n
Some Intervention provided (%) N
Some Intervention provided (%)
Pre 84 6.0 79 20.3
Post 1 80 28.8 80 11.3
Post 2 75 28.0 80 25.0
Total 239 20.5 239 18.8
The logistic regression results presented in Table 37 suggest that overall, the intervention bars’ pseudo-patrons experienced lower odds of being provided with an intervention (OR = 0.25, p = 0.010) and the period main effect (the two post-intervention periods versus the pre-intervention period) was not significant. However, the bar patron type by period interaction was significant. This implies that there were increased odds of being provided with an intervention associated with pseudo-patrons in the intervention bars in both the first and second post-intervention periods, when both post-intervention periods are compared to the pre-intervention period (log-odds = 2.55, p < 0.001; and log-odds = 1.54, p = 0.018, respectively). When the second post-intervention period is compared to the first post-intervention period (see Table 38), the bar patron type by period interaction was not significant (log-odds= -1.004, p = 0.076).
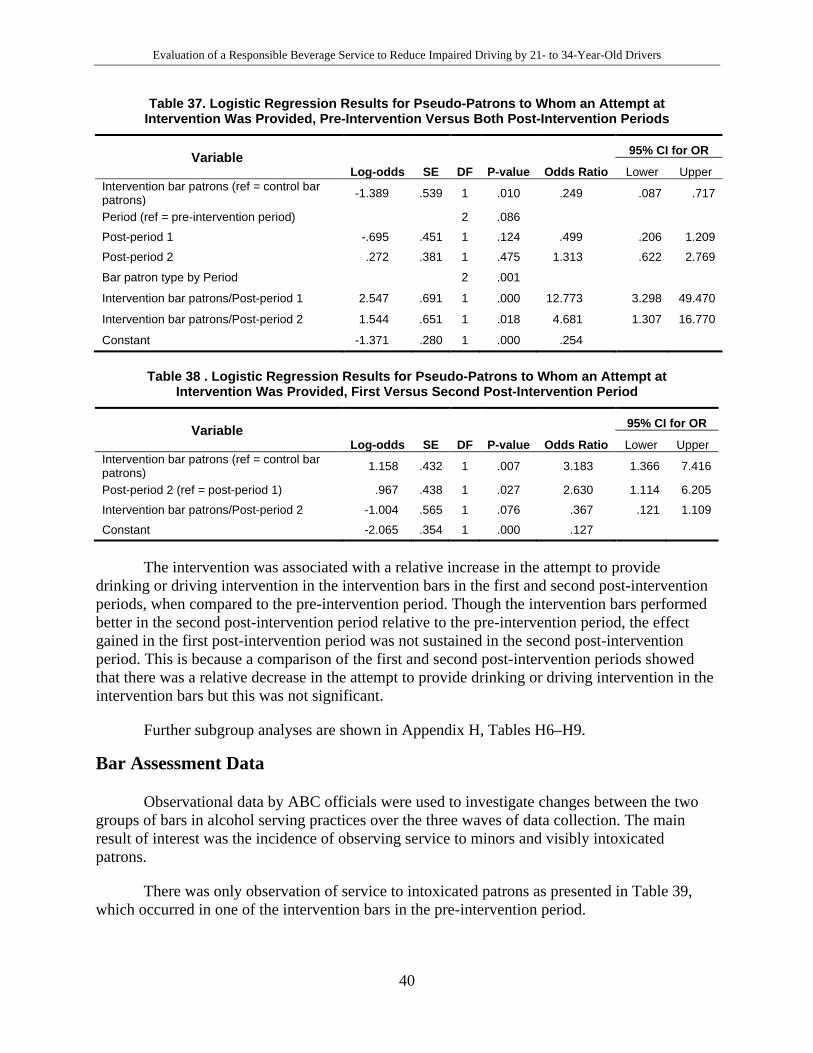
Evaluation of a Responsible Beverage Service to Reduce Impaired Driving by 21- to 34-Year-Old Drivers
40
Table 37. Logistic Regression Results for Pseudo-Patrons to Whom an Attempt at Intervention Was Provided, Pre-Intervention Versus Both Post-Intervention Periods
Variable Log-odds SE DF P-value Odds Ratio
95% CI for OR
Lower Upper Intervention bar patrons (ref = control bar patrons) -1.389 .539 1 .010 .249 .087 .717
Period (ref = pre-intervention period) 2 .086 Post-period 1 -.695 .451 1 .124 .499 .206 1.209
Post-period 2 .272 .381 1 .475 1.313 .622 2.769
Bar patron type by Period 2 .001 Intervention bar patrons/Post-period 1 2.547 .691 1 .000 12.773 3.298 49.470
Intervention bar patrons/Post-period 2 1.544 .651 1 .018 4.681 1.307 16.770
Constant -1.371 .280 1 .000 .254
Table 38 . Logistic Regression Results for Pseudo-Patrons to Whom an Attempt at Intervention Was Provided, First Versus Second Post-Intervention Period
Variable Log-odds SE DF P-value Odds Ratio
95% CI for OR
Lower Upper Intervention bar patrons (ref = control bar patrons) 1.158 .432 1 .007 3.183 1.366 7.416
Post-period 2 (ref = post-period 1) .967 .438 1 .027 2.630 1.114 6.205
Intervention bar patrons/Post-period 2 -1.004 .565 1 .076 .367 .121 1.109
Constant -2.065 .354 1 .000 .127
The intervention was associated with a relative increase in the attempt to provide drinking or driving intervention in the intervention bars in the first and second post-intervention periods, when compared to the pre-intervention period. Though the intervention bars performed better in the second post-intervention period relative to the pre-intervention period, the effect gained in the first post-intervention period was not sustained in the second post-intervention period. This is because a comparison of the first and second post-intervention periods showed that there was a relative decrease in the attempt to provide drinking or driving intervention in the intervention bars but this was not significant.
Further subgroup analyses are shown in Appendix H, Tables H6–H9.
Bar Assessment Data
Observational data by ABC officials were used to investigate changes between the two groups of bars in alcohol serving practices over the three waves of data collection. The main result of interest was the incidence of observing service to minors and visibly intoxicated patrons.
There was only observation of service to intoxicated patrons as presented in Table 39, which occurred in one of the intervention bars in the pre-intervention period.

Evaluation of a Responsible Beverage Service to Reduce Impaired Driving by 21- to 34-Year-Old Drivers
41
Table 39. Numbers of Observation of Service to Intoxicated Patrons by Bar Type and Period
Bar type Period
Pre Post 1 Post 2 Intervention 1 0 0
Control 0 0 0
POLD Data
POLD data in Cleveland between 2007 and 2010 were available. However, the intervention and control bars included in this study were seldom mentioned in the data, and virtually no bars were mentioned more than once. The reasons for the low numbers of POLD mentions per bar include the existence of a great number of bars/restaurants in Cleveland (i.e., n = 550), the low percentage of respondents who provided any POLD information, and the even lower rate of naming a specific bar. Therefore, no analyses could be conducted to track changes across the intervention and control bars.
Bar Patrons
The bar patron analyses were comprised of three parts:
1. The first part consisted of a multi-factor ANOVA where the dependent variable was bar patrons’ BAC readings. We assume that we have three independent random samples of BAC readings from the three waves of data collections, since it is highly unlikely that the same bar patrons were surveyed more than once across the three periods. The main result of interest is the bar patron type (intervention or control) by period interaction. The question to be answered is “Did the mean BAC of bar patrons in the intervention bars decrease relative to those in the control bars from pre-intervention to post-intervention?” This interaction effect was measured in the presence of age (21 to 34 versus 35 and older) and gender, which controlled for the variation in BAC readings due to characteristics of bar patrons. Because there are two post-periods, with the inclusion of both post-periods in the analysis, the bar patron type by period interaction term (3 by 2) only indicates if there was a differential change in at least one of the post-periods. As a result of this, separate ANOVAs were performed to compare the mean BACs in pre-intervention period to that in each of the post-intervention periods. These 2 by 2 interactions are useful, in that in the case where opposing mean BAC changes occurred in the bar patrons from the intervention and control bars, these interactions may be significant when the 3 by 2 interaction (which includes both periods) was not significant because the effects cancelled each other. In addition, the two post-intervention periods were compared with each other to determine if there was a differential change in the BACs of the intervention bar patrons in one of the groups from the first post-intervention period to the second.
2. The second part of the bar patron analysis pertains to the analysis of those who were intoxicated. Bar patrons who had BAC readings of .08 or higher were categorized as intoxicated and those with BACs lower than .08 were categorized as not intoxicated.
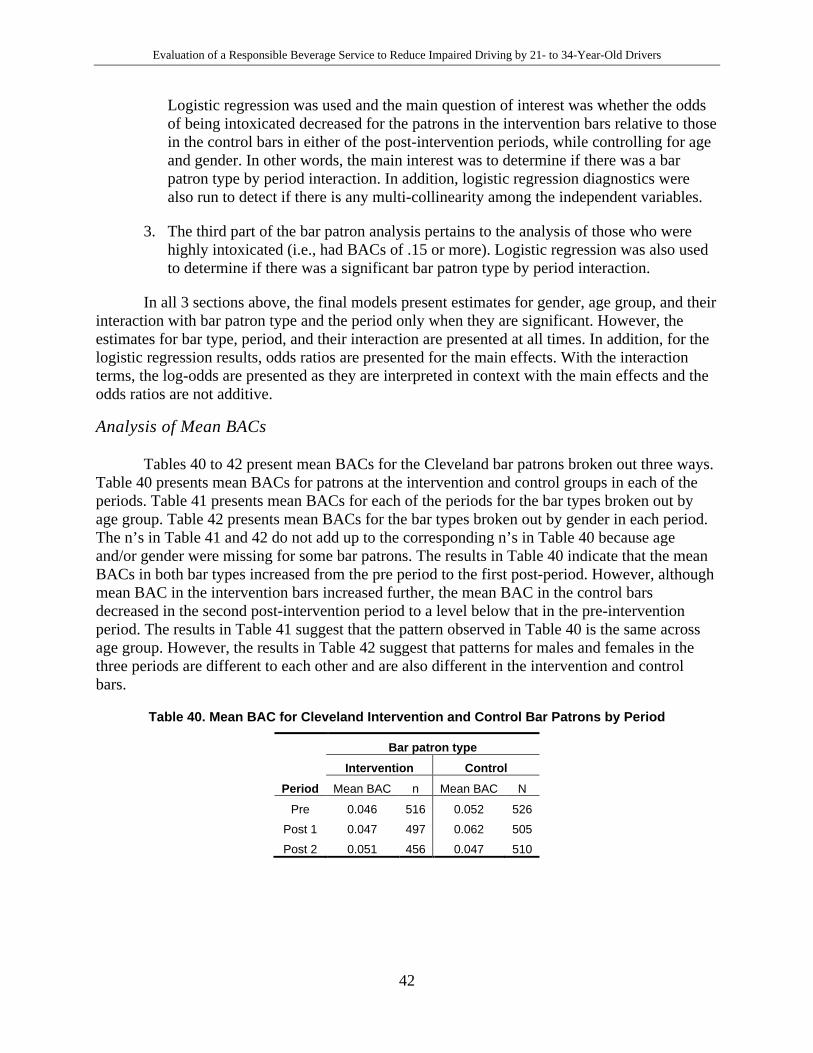
Evaluation of a Responsible Beverage Service to Reduce Impaired Driving by 21- to 34-Year-Old Drivers
42
Logistic regression was used and the main question of interest was whether the odds of being intoxicated decreased for the patrons in the intervention bars relative to those in the control bars in either of the post-intervention periods, while controlling for age and gender. In other words, the main interest was to determine if there was a bar patron type by period interaction. In addition, logistic regression diagnostics were also run to detect if there is any multi-collinearity among the independent variables.
3. The third part of the bar patron analysis pertains to the analysis of those who were highly intoxicated (i.e., had BACs of .15 or more). Logistic regression was also used to determine if there was a significant bar patron type by period interaction.
In all 3 sections above, the final models present estimates for gender, age group, and their interaction with bar patron type and the period only when they are significant. However, the estimates for bar type, period, and their interaction are presented at all times. In addition, for the logistic regression results, odds ratios are presented for the main effects. With the interaction terms, the log-odds are presented as they are interpreted in context with the main effects and the odds ratios are not additive.
Analysis of Mean BACs
Tables 40 to 42 present mean BACs for the Cleveland bar patrons broken out three ways. Table 40 presents mean BACs for patrons at the intervention and control groups in each of the periods. Table 41 presents mean BACs for each of the periods for the bar types broken out by age group. Table 42 presents mean BACs for the bar types broken out by gender in each period. The n’s in Table 41 and 42 do not add up to the corresponding n’s in Table 40 because age and/or gender were missing for some bar patrons. The results in Table 40 indicate that the mean BACs in both bar types increased from the pre period to the first post-period. However, although mean BAC in the intervention bars increased further, the mean BAC in the control bars decreased in the second post-intervention period to a level below that in the pre-intervention period. The results in Table 41 suggest that the pattern observed in Table 40 is the same across age group. However, the results in Table 42 suggest that patterns for males and females in the three periods are different to each other and are also different in the intervention and control bars.
Table 40. Mean BAC for Cleveland Intervention and Control Bar Patrons by Period
Period
Bar patron type Intervention Control
Mean BAC n Mean BAC N
Pre 0.046 516 0.052 526
Post 1 0.047 497 0.062 505
Post 2 0.051 456 0.047 510
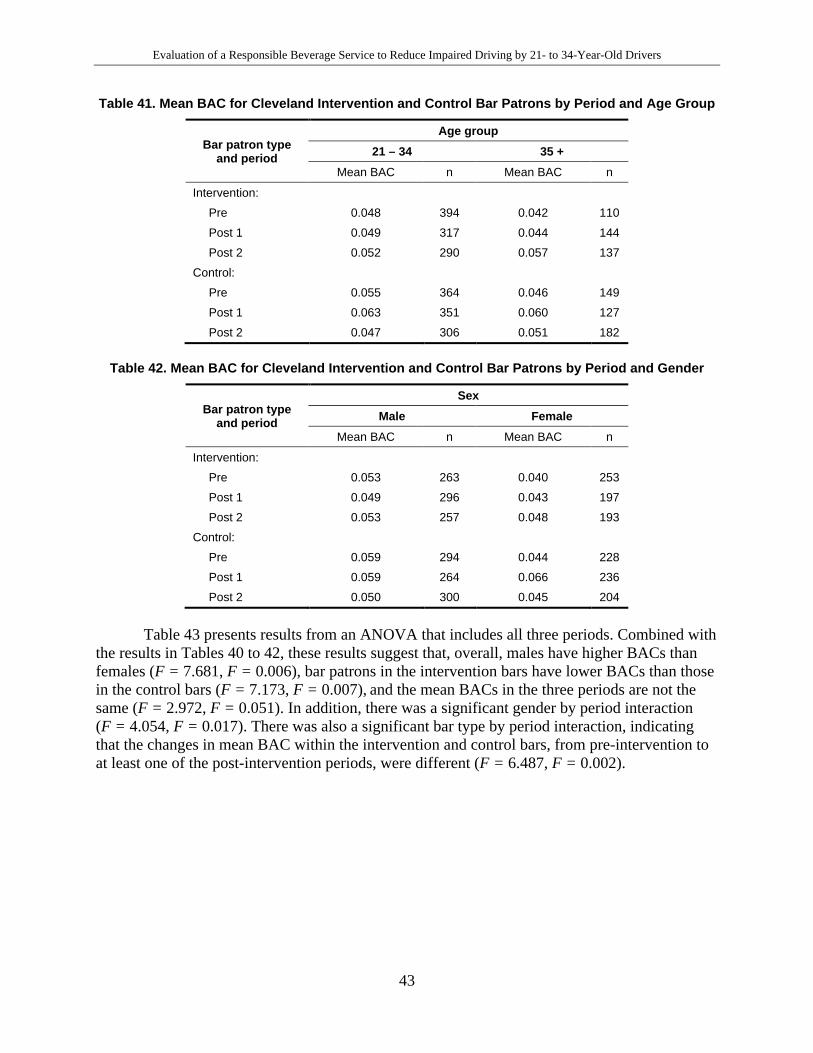
Evaluation of a Responsible Beverage Service to Reduce Impaired Driving by 21- to 34-Year-Old Drivers
43
Table 41. Mean BAC for Cleveland Intervention and Control Bar Patrons by Period and Age Group
Bar patron type and period
Age group 21 – 34 35 +
Mean BAC n Mean BAC n
Intervention:
Pre 0.048 394 0.042 110
Post 1 0.049 317 0.044 144
Post 2 0.052 290 0.057 137
Control:
Pre 0.055 364 0.046 149
Post 1 0.063 351 0.060 127
Post 2 0.047 306 0.051 182
Table 42. Mean BAC for Cleveland Intervention and Control Bar Patrons by Period and Gender
Bar patron type and period
Sex Male Female
Mean BAC n Mean BAC n
Intervention:
Pre 0.053 263 0.040 253
Post 1 0.049 296 0.043 197
Post 2 0.053 257 0.048 193
Control:
Pre 0.059 294 0.044 228
Post 1 0.059 264 0.066 236
Post 2 0.050 300 0.045 204
Table 43 presents results from an ANOVA that includes all three periods. Combined with the results in Tables 40 to 42, these results suggest that, overall, males have higher BACs than females (F = 7.681, F = 0.006), bar patrons in the intervention bars have lower BACs than those in the control bars (F = 7.173, F = 0.007), and the mean BACs in the three periods are not the same (F = 2.972, F = 0.051). In addition, there was a significant gender by period interaction (F = 4.054, F = 0.017). There was also a significant bar type by period interaction, indicating that the changes in mean BAC within the intervention and control bars, from pre-intervention to at least one of the post-intervention periods, were different (F = 6.487, F = 0.002).
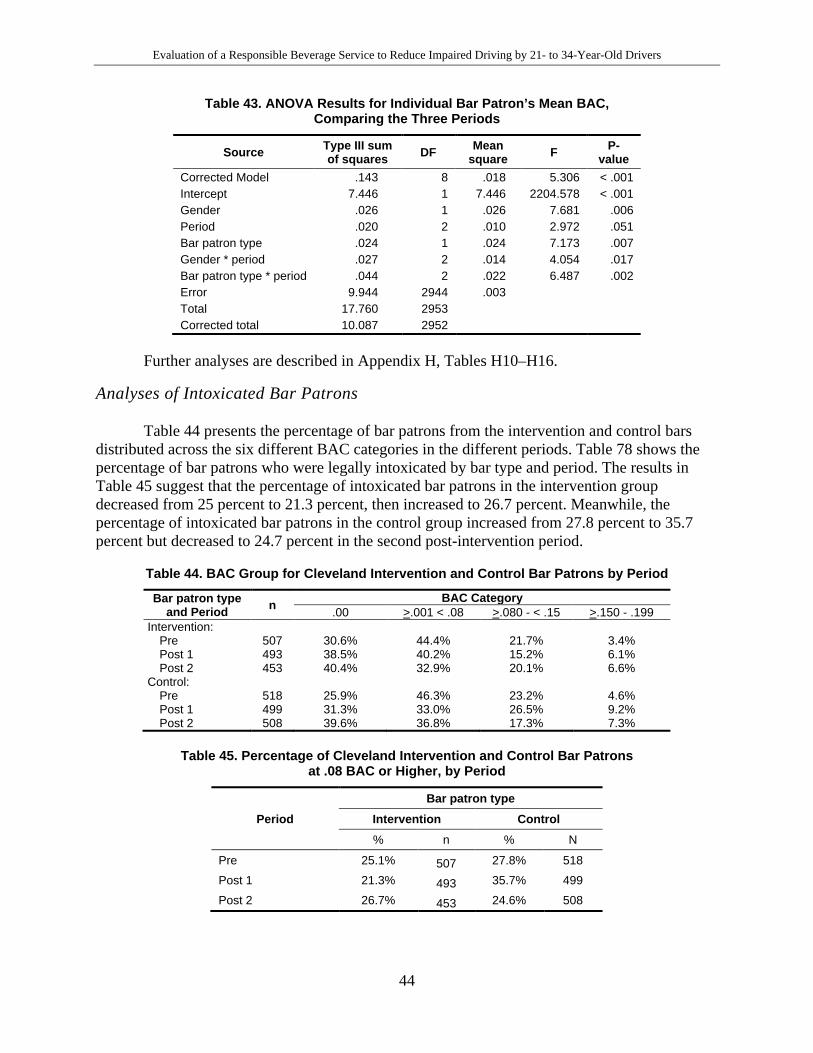
Evaluation of a Responsible Beverage Service to Reduce Impaired Driving by 21- to 34-Year-Old Drivers
44
Table 43. ANOVA Results for Individual Bar Patron’s Mean BAC, Comparing the Three Periods
Source Type III sum of squares DF Mean
square F P-value
Corrected Model .143 8 .018 5.306 < .001 Intercept 7.446 1 7.446 2204.578 < .001 Gender .026 1 .026 7.681 .006 Period .020 2 .010 2.972 .051 Bar patron type .024 1 .024 7.173 .007 Gender * period .027 2 .014 4.054 .017 Bar patron type * period .044 2 .022 6.487 .002 Error 9.944 2944 .003 Total 17.760 2953 Corrected total 10.087 2952
Further analyses are described in Appendix H, Tables H10–H16.
Analyses of Intoxicated Bar Patrons
Table 44 presents the percentage of bar patrons from the intervention and control bars distributed across the six different BAC categories in the different periods. Table 78 shows the percentage of bar patrons who were legally intoxicated by bar type and period. The results in Table 45 suggest that the percentage of intoxicated bar patrons in the intervention group decreased from 25 percent to 21.3 percent, then increased to 26.7 percent. Meanwhile, the percentage of intoxicated bar patrons in the control group increased from 27.8 percent to 35.7 percent but decreased to 24.7 percent in the second post-intervention period.
Table 44. BAC Group for Cleveland Intervention and Control Bar Patrons by Period
Bar patron type and Period n BAC Category
.00 >.001 < .08 >.080 - < .15 >.150 - .199 Intervention:
Pre 507 30.6% 44.4% 21.7% 3.4% Post 1 493 38.5% 40.2% 15.2% 6.1% Post 2 453 40.4% 32.9% 20.1% 6.6%
Control: Pre 518 25.9% 46.3% 23.2% 4.6% Post 1 499 31.3% 33.0% 26.5% 9.2% Post 2 508 39.6% 36.8% 17.3% 7.3%
Table 45. Percentage of Cleveland Intervention and Control Bar Patrons at .08 BAC or Higher, by Period
Period Bar patron type
Intervention Control % n % N
Pre 25.1% 507 27.8% 518
Post 1 21.3% 493 35.7% 499
Post 2 26.7% 453 24.6% 508
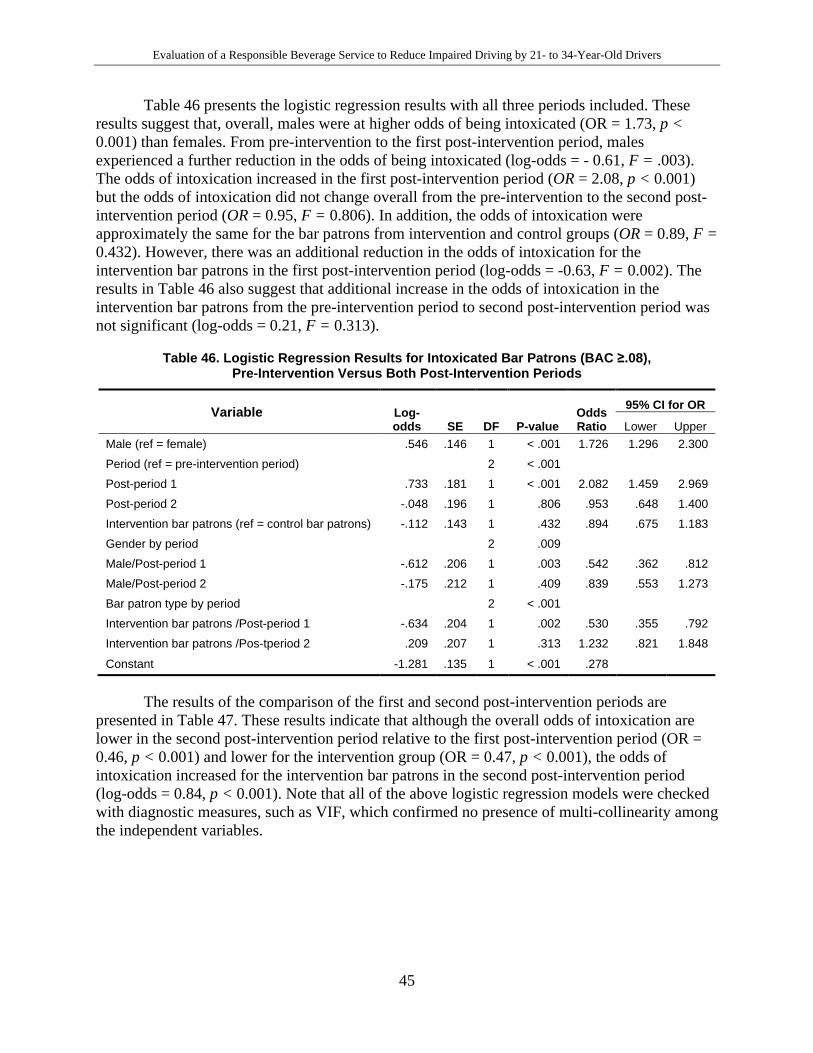
Evaluation of a Responsible Beverage Service to Reduce Impaired Driving by 21- to 34-Year-Old Drivers
45
Table 46 presents the logistic regression results with all three periods included. These results suggest that, overall, males were at higher odds of being intoxicated (OR = 1.73, p < 0.001) than females. From pre-intervention to the first post-intervention period, males experienced a further reduction in the odds of being intoxicated (log-odds = - 0.61, F = .003). The odds of intoxication increased in the first post-intervention period (OR = 2.08, p < 0.001) but the odds of intoxication did not change overall from the pre-intervention to the second post-intervention period (OR = 0.95, F = 0.806). In addition, the odds of intoxication were approximately the same for the bar patrons from intervention and control groups (OR = 0.89, F = 0.432). However, there was an additional reduction in the odds of intoxication for the intervention bar patrons in the first post-intervention period (log-odds = -0.63, F = 0.002). The results in Table 46 also suggest that additional increase in the odds of intoxication in the intervention bar patrons from the pre-intervention period to second post-intervention period was not significant (log-odds = 0.21, F = 0.313).
Table 46. Logistic Regression Results for Intoxicated Bar Patrons (BAC ≥.08), Pre-Intervention Versus Both Post-Intervention Periods
Variable Log-odds SE DF P-value
Odds Ratio
95% CI for OR
Lower Upper Male (ref = female) .546 .146 1 < .001 1.726 1.296 2.300
Period (ref = pre-intervention period) 2 < .001 Post-period 1 .733 .181 1 < .001 2.082 1.459 2.969
Post-period 2 -.048 .196 1 .806 .953 .648 1.400
Intervention bar patrons (ref = control bar patrons) -.112 .143 1 .432 .894 .675 1.183
Gender by period 2 .009 Male/Post-period 1 -.612 .206 1 .003 .542 .362 .812
Male/Post-period 2 -.175 .212 1 .409 .839 .553 1.273
Bar patron type by period 2 < .001 Intervention bar patrons /Post-period 1 -.634 .204 1 .002 .530 .355 .792
Intervention bar patrons /Pos-tperiod 2 .209 .207 1 .313 1.232 .821 1.848
Constant -1.281 .135 1 < .001 .278
The results of the comparison of the first and second post-intervention periods are presented in Table 47. These results indicate that although the overall odds of intoxication are lower in the second post-intervention period relative to the first post-intervention period (OR = 0.46, p < 0.001) and lower for the intervention group (OR = 0.47, p < 0.001), the odds of intoxication increased for the intervention bar patrons in the second post-intervention period (log-odds = 0.84, p < 0.001). Note that all of the above logistic regression models were checked with diagnostic measures, such as VIF, which confirmed no presence of multi-collinearity among the independent variables.
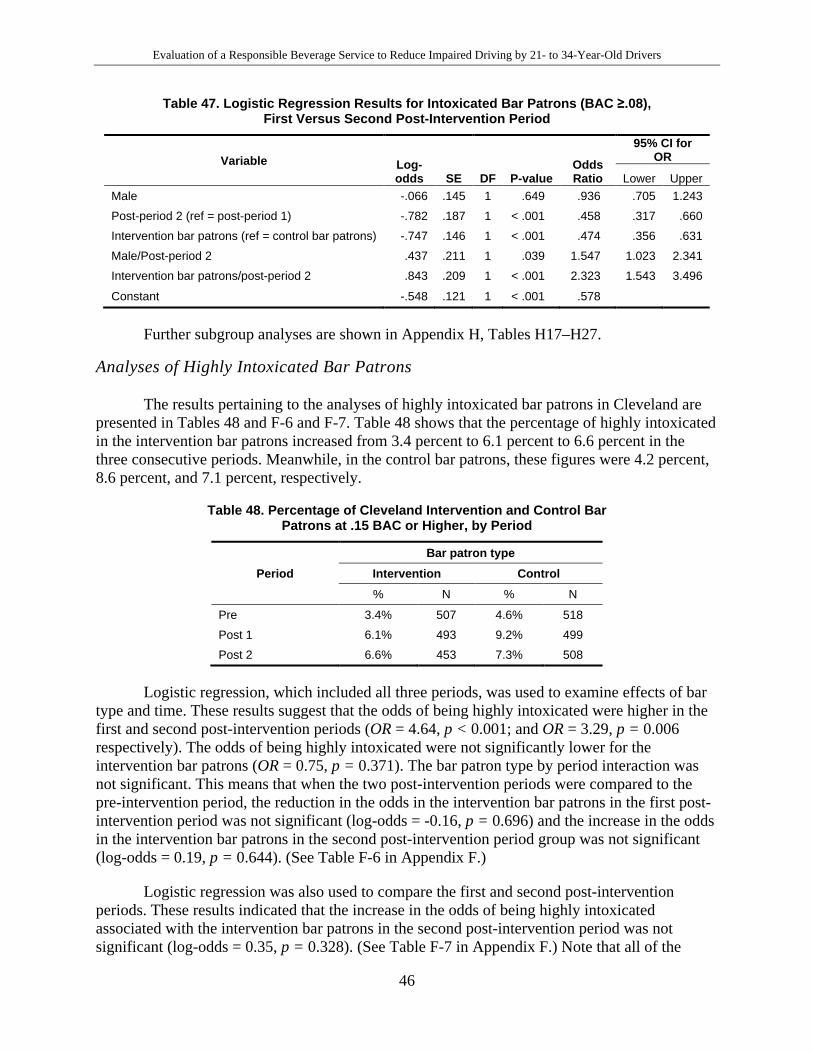
Evaluation of a Responsible Beverage Service to Reduce Impaired Driving by 21- to 34-Year-Old Drivers
46
Table 47. Logistic Regression Results for Intoxicated Bar Patrons (BAC ≥.08), First Versus Second Post-Intervention Period
Variable Log-odds SE DF P-value
Odds Ratio
95% CI for OR
Lower Upper Male -.066 .145 1 .649 .936 .705 1.243
Post-period 2 (ref = post-period 1) -.782 .187 1 < .001 .458 .317 .660
Intervention bar patrons (ref = control bar patrons) -.747 .146 1 < .001 .474 .356 .631
Male/Post-period 2 .437 .211 1 .039 1.547 1.023 2.341
Intervention bar patrons/post-period 2 .843 .209 1 < .001 2.323 1.543 3.496
Constant -.548 .121 1 < .001 .578
Further subgroup analyses are shown in Appendix H, Tables H17–H27.
Analyses of Highly Intoxicated Bar Patrons
The results pertaining to the analyses of highly intoxicated bar patrons in Cleveland are presented in Tables 48 and F-6 and F-7. Table 48 shows that the percentage of highly intoxicated in the intervention bar patrons increased from 3.4 percent to 6.1 percent to 6.6 percent in the three consecutive periods. Meanwhile, in the control bar patrons, these figures were 4.2 percent, 8.6 percent, and 7.1 percent, respectively.
Table 48. Percentage of Cleveland Intervention and Control Bar Patrons at .15 BAC or Higher, by Period
Period Bar patron type
Intervention Control % N % N
Pre 3.4% 507 4.6% 518
Post 1 6.1% 493 9.2% 499
Post 2 6.6% 453 7.3% 508
Logistic regression, which included all three periods, was used to examine effects of bar type and time. These results suggest that the odds of being highly intoxicated were higher in the first and second post-intervention periods (OR = 4.64, p < 0.001; and OR = 3.29, p = 0.006 respectively). The odds of being highly intoxicated were not significantly lower for the intervention bar patrons (OR = 0.75, p = 0.371). The bar patron type by period interaction was not significant. This means that when the two post-intervention periods were compared to the pre-intervention period, the reduction in the odds in the intervention bar patrons in the first post-intervention period was not significant (log-odds = -0.16, p = 0.696) and the increase in the odds in the intervention bar patrons in the second post-intervention period group was not significant (log-odds = 0.19, p = 0.644). (See Table F-6 in Appendix F.)
Logistic regression was also used to compare the first and second post-intervention periods. These results indicated that the increase in the odds of being highly intoxicated associated with the intervention bar patrons in the second post-intervention period was not significant (log-odds = 0.35, p = 0.328). (See Table F-7 in Appendix F.) Note that all of the
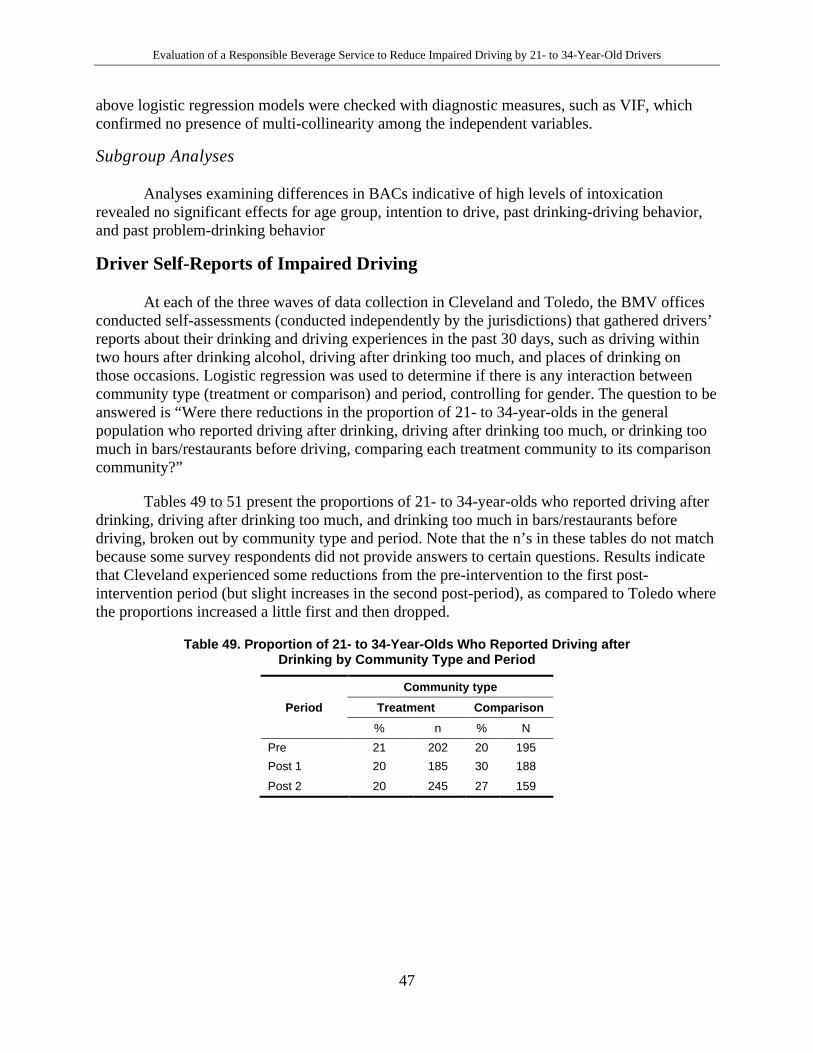
Evaluation of a Responsible Beverage Service to Reduce Impaired Driving by 21- to 34-Year-Old Drivers
47
above logistic regression models were checked with diagnostic measures, such as VIF, which confirmed no presence of multi-collinearity among the independent variables.
Subgroup Analyses
Analyses examining differences in BACs indicative of high levels of intoxication revealed no significant effects for age group, intention to drive, past drinking-driving behavior, and past problem-drinking behavior
Driver Self-Reports of Impaired Driving
At each of the three waves of data collection in Cleveland and Toledo, the BMV offices conducted self-assessments (conducted independently by the jurisdictions) that gathered drivers’ reports about their drinking and driving experiences in the past 30 days, such as driving within two hours after drinking alcohol, driving after drinking too much, and places of drinking on those occasions. Logistic regression was used to determine if there is any interaction between community type (treatment or comparison) and period, controlling for gender. The question to be answered is “Were there reductions in the proportion of 21- to 34-year-olds in the general population who reported driving after drinking, driving after drinking too much, or drinking too much in bars/restaurants before driving, comparing each treatment community to its comparison community?”
Tables 49 to 51 present the proportions of 21- to 34-year-olds who reported driving after drinking, driving after drinking too much, and drinking too much in bars/restaurants before driving, broken out by community type and period. Note that the n’s in these tables do not match because some survey respondents did not provide answers to certain questions. Results indicate that Cleveland experienced some reductions from the pre-intervention to the first post-intervention period (but slight increases in the second post-period), as compared to Toledo where the proportions increased a little first and then dropped.
Table 49. Proportion of 21- to 34-Year-Olds Who Reported Driving after Drinking by Community Type and Period
Period Community type
Treatment Comparison % n % N
Pre 21 202 20 195 Post 1 20 185 30 188
Post 2 20 245 27 159
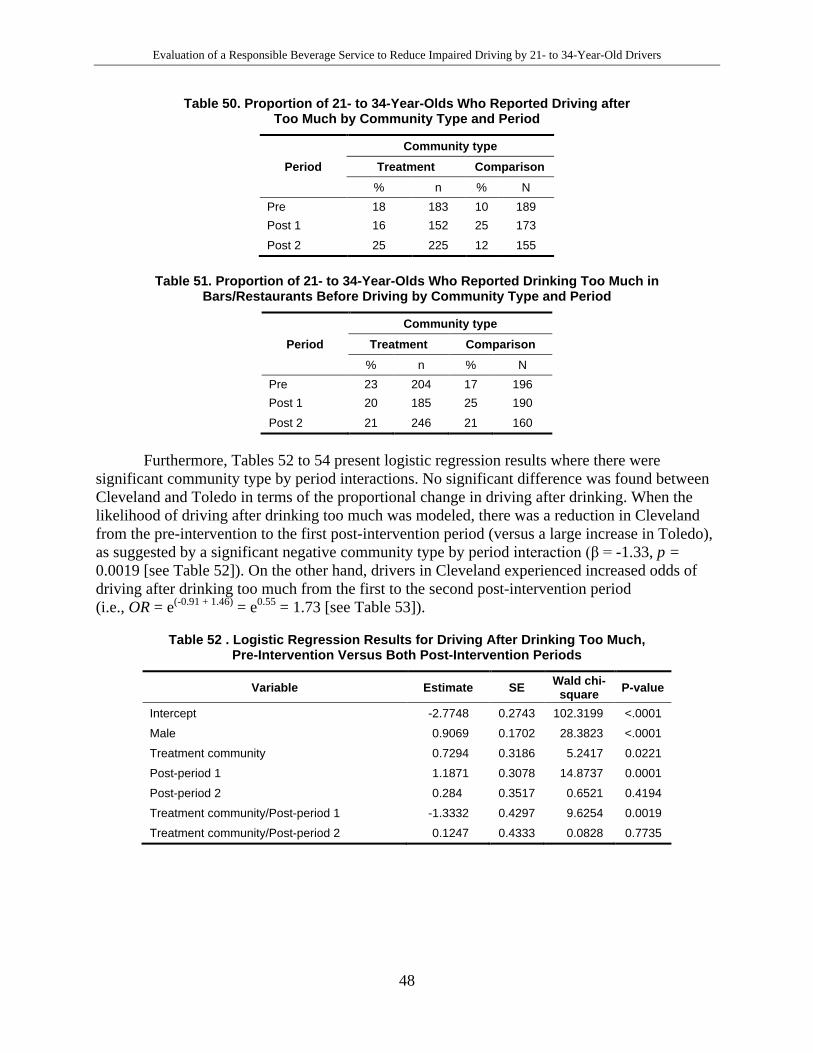
Evaluation of a Responsible Beverage Service to Reduce Impaired Driving by 21- to 34-Year-Old Drivers
48
Table 50. Proportion of 21- to 34-Year-Olds Who Reported Driving after Too Much by Community Type and Period
Period Community type
Treatment Comparison % n % N
Pre 18 183 10 189 Post 1 16 152 25 173
Post 2 25 225 12 155
Table 51. Proportion of 21- to 34-Year-Olds Who Reported Drinking Too Much in Bars/Restaurants Before Driving by Community Type and Period
Period Community type
Treatment Comparison % n % N
Pre 23 204 17 196 Post 1 20 185 25 190
Post 2 21 246 21 160
Furthermore, Tables 52 to 54 present logistic regression results where there were significant community type by period interactions. No significant difference was found between Cleveland and Toledo in terms of the proportional change in driving after drinking. When the likelihood of driving after drinking too much was modeled, there was a reduction in Cleveland from the pre-intervention to the first post-intervention period (versus a large increase in Toledo), as suggested by a significant negative community type by period interaction (β = -1.33, p = 0.0019 [see Table 52]). On the other hand, drivers in Cleveland experienced increased odds of driving after drinking too much from the first to the second post-intervention period (i.e., OR = e(-0.91 + 1.46) = e0.55 = 1.73 [see Table 53]).
Table 52 . Logistic Regression Results for Driving After Drinking Too Much, Pre-Intervention Versus Both Post-Intervention Periods
Variable Estimate SE Wald chi-square P-value
Intercept -2.7748 0.2743 102.3199 <.0001
Male 0.9069 0.1702 28.3823 <.0001
Treatment community 0.7294 0.3186 5.2417 0.0221
Post-period 1 1.1871 0.3078 14.8737 0.0001
Post-period 2 0.284 0.3517 0.6521 0.4194
Treatment community/Post-period 1 -1.3332 0.4297 9.6254 0.0019
Treatment community/Post-period 2 0.1247 0.4333 0.0828 0.7735
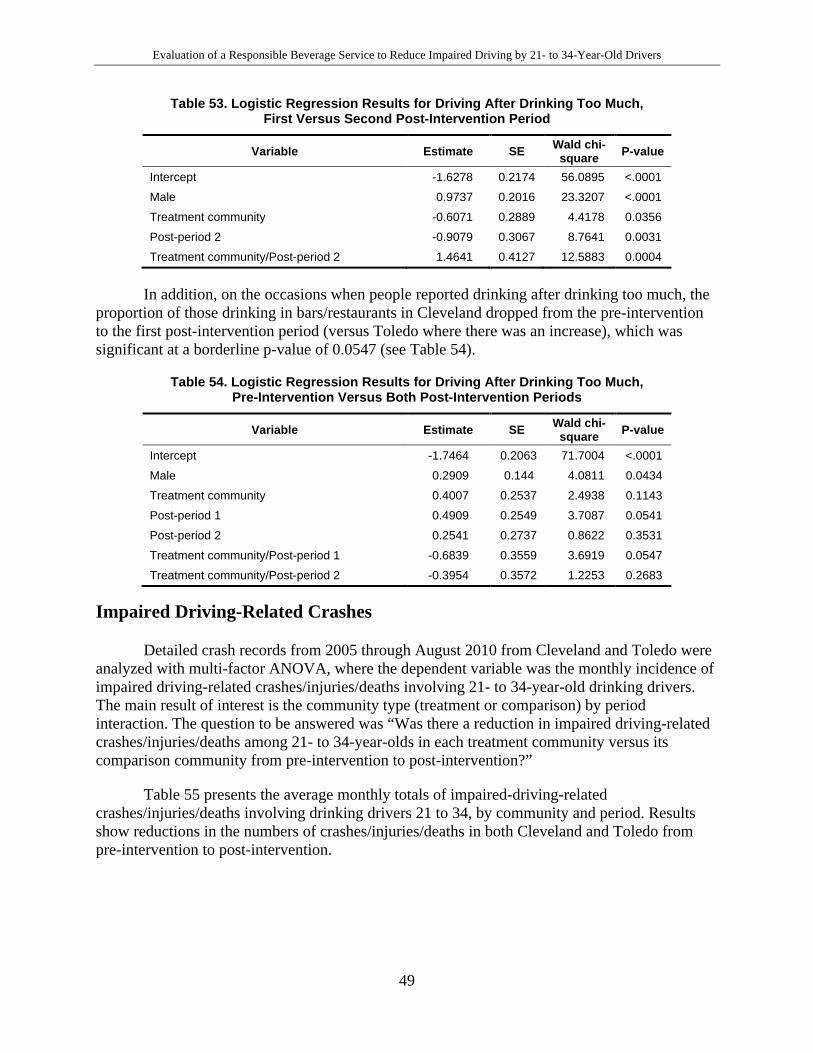
Evaluation of a Responsible Beverage Service to Reduce Impaired Driving by 21- to 34-Year-Old Drivers
49
Table 53. Logistic Regression Results for Driving After Drinking Too Much, First Versus Second Post-Intervention Period
Variable Estimate SE Wald chi-square P-value
Intercept -1.6278 0.2174 56.0895 <.0001
Male 0.9737 0.2016 23.3207 <.0001
Treatment community -0.6071 0.2889 4.4178 0.0356
Post-period 2 -0.9079 0.3067 8.7641 0.0031
Treatment community/Post-period 2 1.4641 0.4127 12.5883 0.0004
In addition, on the occasions when people reported drinking after drinking too much, the proportion of those drinking in bars/restaurants in Cleveland dropped from the pre-intervention to the first post-intervention period (versus Toledo where there was an increase), which was significant at a borderline p-value of 0.0547 (see Table 54).
Table 54. Logistic Regression Results for Driving After Drinking Too Much, Pre-Intervention Versus Both Post-Intervention Periods
Variable Estimate SE Wald chi-square P-value
Intercept -1.7464 0.2063 71.7004 <.0001
Male 0.2909 0.144 4.0811 0.0434
Treatment community 0.4007 0.2537 2.4938 0.1143
Post-period 1 0.4909 0.2549 3.7087 0.0541
Post-period 2 0.2541 0.2737 0.8622 0.3531
Treatment community/Post-period 1 -0.6839 0.3559 3.6919 0.0547
Treatment community/Post-period 2 -0.3954 0.3572 1.2253 0.2683
Impaired Driving-Related Crashes
Detailed crash records from 2005 through August 2010 from Cleveland and Toledo were analyzed with multi-factor ANOVA, where the dependent variable was the monthly incidence of impaired driving-related crashes/injuries/deaths involving 21- to 34-year-old drinking drivers. The main result of interest is the community type (treatment or comparison) by period interaction. The question to be answered was “Was there a reduction in impaired driving-related crashes/injuries/deaths among 21- to 34-year-olds in each treatment community versus its comparison community from pre-intervention to post-intervention?”
Table 55 presents the average monthly totals of impaired-driving-related crashes/injuries/deaths involving drinking drivers 21 to 34, by community and period. Results show reductions in the numbers of crashes/injuries/deaths in both Cleveland and Toledo from pre-intervention to post-intervention.
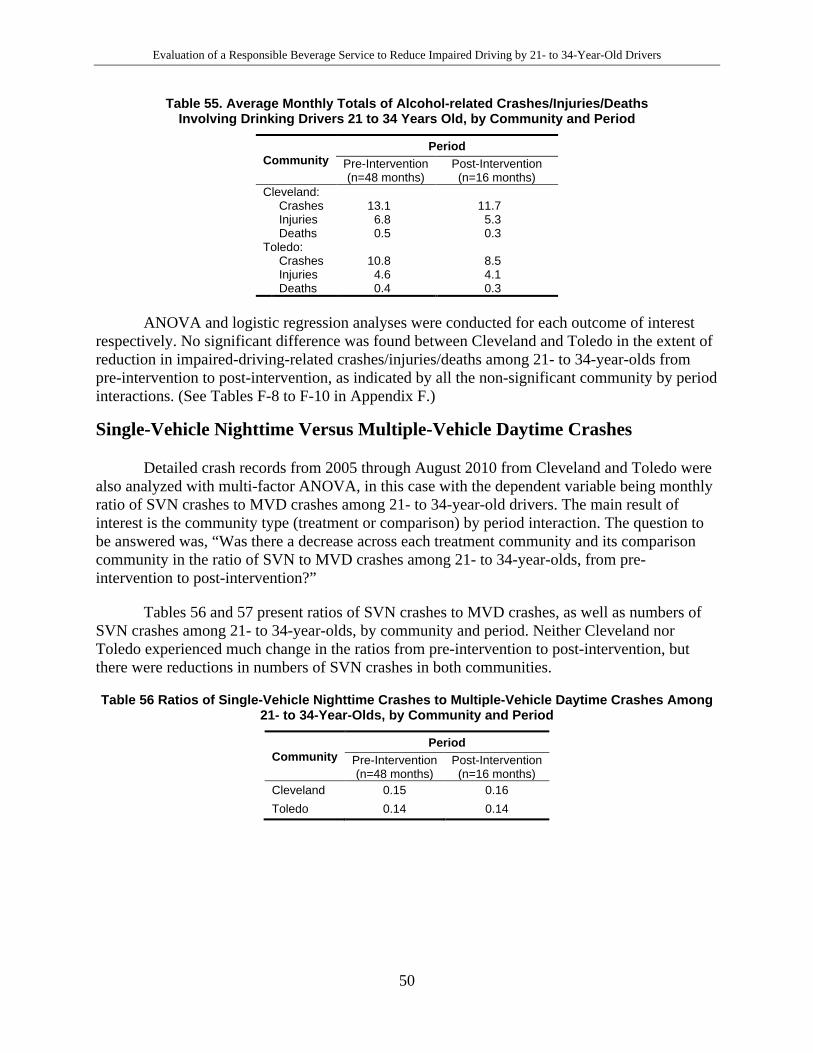
Evaluation of a Responsible Beverage Service to Reduce Impaired Driving by 21- to 34-Year-Old Drivers
50
Table 55. Average Monthly Totals of Alcohol-related Crashes/Injuries/Deaths Involving Drinking Drivers 21 to 34 Years Old, by Community and Period
Community Period
Pre-Intervention (n=48 months)
Post-Intervention (n=16 months)
Cleveland: Crashes 13.1 11.7
Injuries 6.8 5.3 Deaths 0.5 0.3
Toledo: Crashes 10.8 8.5
Injuries 4.6 4.1 Deaths 0.4 0.3
ANOVA and logistic regression analyses were conducted for each outcome of interest respectively. No significant difference was found between Cleveland and Toledo in the extent of reduction in impaired-driving-related crashes/injuries/deaths among 21- to 34-year-olds from pre-intervention to post-intervention, as indicated by all the non-significant community by period interactions. (See Tables F-8 to F-10 in Appendix F.)
Single-Vehicle Nighttime Versus Multiple-Vehicle Daytime Crashes
Detailed crash records from 2005 through August 2010 from Cleveland and Toledo were also analyzed with multi-factor ANOVA, in this case with the dependent variable being monthly ratio of SVN crashes to MVD crashes among 21- to 34-year-old drivers. The main result of interest is the community type (treatment or comparison) by period interaction. The question to be answered was, “Was there a decrease across each treatment community and its comparison community in the ratio of SVN to MVD crashes among 21- to 34-year-olds, from pre-intervention to post-intervention?”
Tables 56 and 57 present ratios of SVN crashes to MVD crashes, as well as numbers of SVN crashes among 21- to 34-year-olds, by community and period. Neither Cleveland nor Toledo experienced much change in the ratios from pre-intervention to post-intervention, but there were reductions in numbers of SVN crashes in both communities.
Table 56 Ratios of Single-Vehicle Nighttime Crashes to Multiple-Vehicle Daytime Crashes Among 21- to 34-Year-Olds, by Community and Period
Community Period
Pre-Intervention (n=48 months)
Post-Intervention (n=16 months)
Cleveland 0.15 0.16 Toledo 0.14 0.14
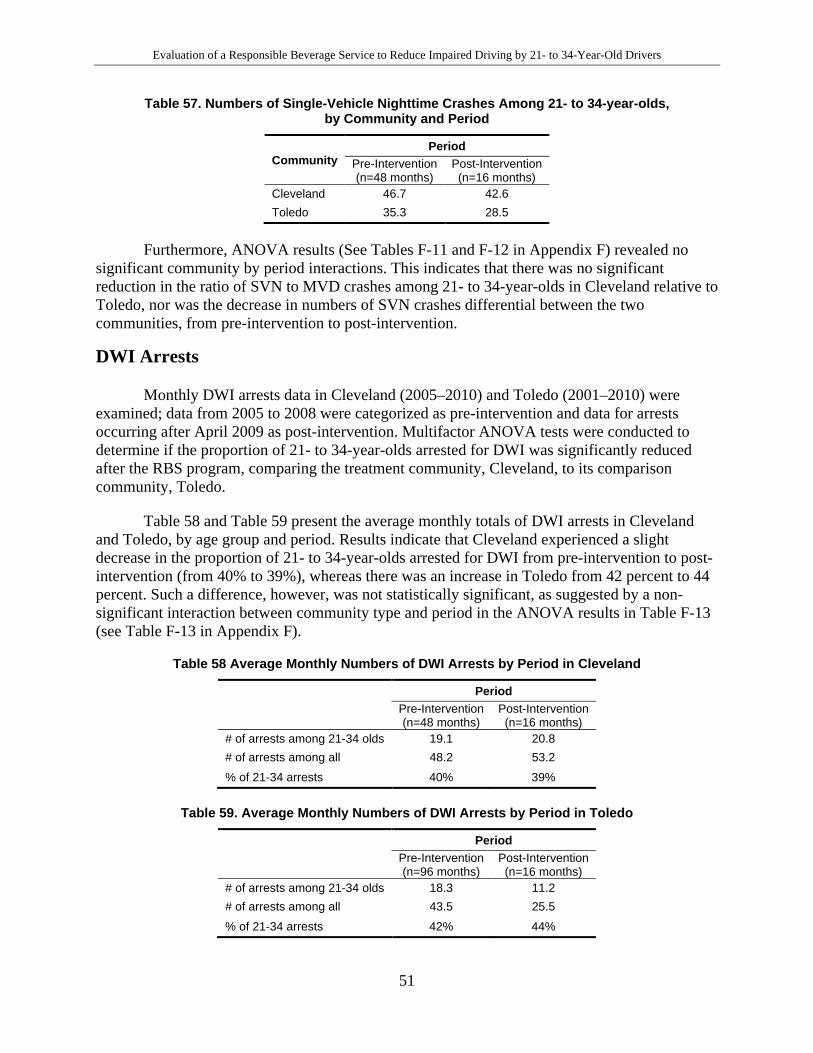
Evaluation of a Responsible Beverage Service to Reduce Impaired Driving by 21- to 34-Year-Old Drivers
51
Table 57. Numbers of Single-Vehicle Nighttime Crashes Among 21- to 34-year-olds, by Community and Period
Community Period
Pre-Intervention (n=48 months)
Post-Intervention (n=16 months)
Cleveland 46.7 42.6 Toledo 35.3 28.5
Furthermore, ANOVA results (See Tables F-11 and F-12 in Appendix F) revealed no significant community by period interactions. This indicates that there was no significant reduction in the ratio of SVN to MVD crashes among 21- to 34-year-olds in Cleveland relative to Toledo, nor was the decrease in numbers of SVN crashes differential between the two communities, from pre-intervention to post-intervention.
DWI Arrests
Monthly DWI arrests data in Cleveland (2005–2010) and Toledo (2001–2010) were examined; data from 2005 to 2008 were categorized as pre-intervention and data for arrests occurring after April 2009 as post-intervention. Multifactor ANOVA tests were conducted to determine if the proportion of 21- to 34-year-olds arrested for DWI was significantly reduced after the RBS program, comparing the treatment community, Cleveland, to its comparison community, Toledo.
Table 58 and Table 59 present the average monthly totals of DWI arrests in Cleveland and Toledo, by age group and period. Results indicate that Cleveland experienced a slight decrease in the proportion of 21- to 34-year-olds arrested for DWI from pre-intervention to post-intervention (from 40% to 39%), whereas there was an increase in Toledo from 42 percent to 44 percent. Such a difference, however, was not statistically significant, as suggested by a non-significant interaction between community type and period in the ANOVA results in Table F-13 (see Table F-13 in Appendix F).
Table 58 Average Monthly Numbers of DWI Arrests by Period in Cleveland
Period Pre-Intervention (n=48 months)
Post-Intervention (n=16 months)
# of arrests among 21-34 olds 19.1 20.8 # of arrests among all 48.2 53.2
% of 21-34 arrests 40% 39%
Table 59. Average Monthly Numbers of DWI Arrests by Period in Toledo
Period Pre-Intervention (n=96 months)
Post-Intervention (n=16 months)
# of arrests among 21-34 olds 18.3 11.2 # of arrests among all 43.5 25.5
% of 21-34 arrests 42% 44%
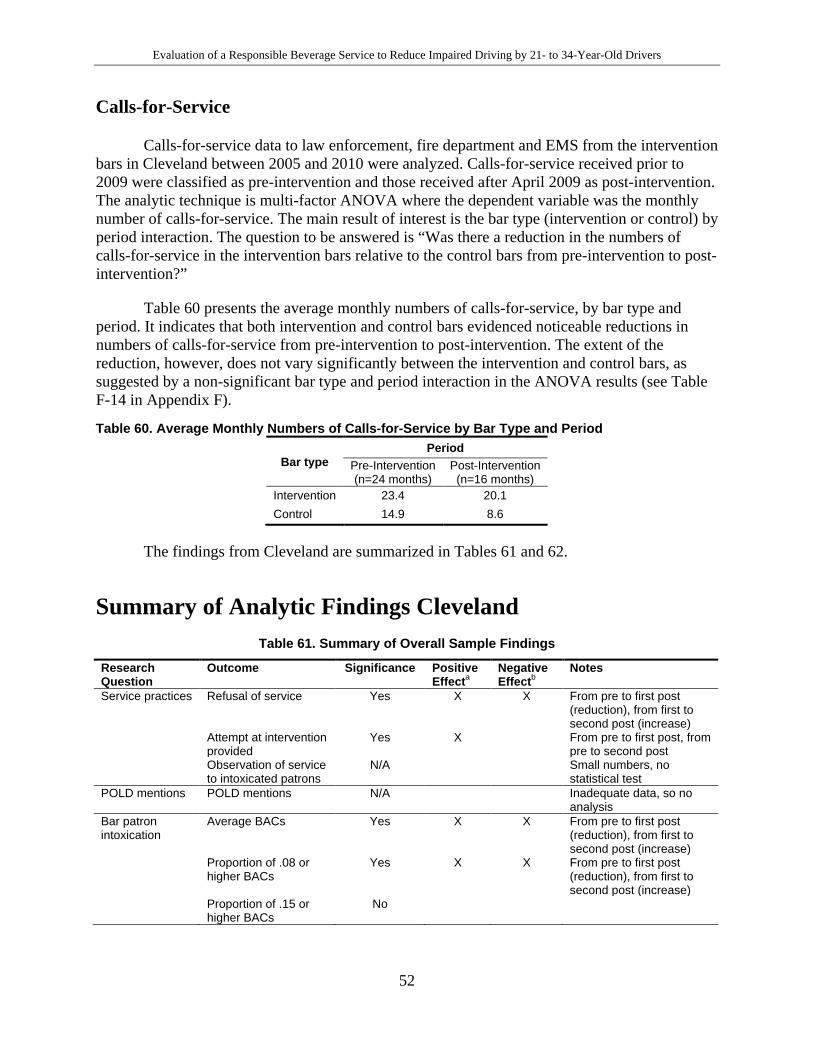
Evaluation of a Responsible Beverage Service to Reduce Impaired Driving by 21- to 34-Year-Old Drivers
52
Calls-for-Service
Calls-for-service data to law enforcement, fire department and EMS from the intervention bars in Cleveland between 2005 and 2010 were analyzed. Calls-for-service received prior to 2009 were classified as pre-intervention and those received after April 2009 as post-intervention. The analytic technique is multi-factor ANOVA where the dependent variable was the monthly number of calls-for-service. The main result of interest is the bar type (intervention or control) by period interaction. The question to be answered is “Was there a reduction in the numbers of calls-for-service in the intervention bars relative to the control bars from pre-intervention to post-intervention?”
Table 60 presents the average monthly numbers of calls-for-service, by bar type and period. It indicates that both intervention and control bars evidenced noticeable reductions in numbers of calls-for-service from pre-intervention to post-intervention. The extent of the reduction, however, does not vary significantly between the intervention and control bars, as suggested by a non-significant bar type and period interaction in the ANOVA results (see Table F-14 in Appendix F).
Table 60. Average Monthly Numbers of Calls-for-Service by Bar Type and Period
Bar type Period
Pre-Intervention (n=24 months)
Post-Intervention (n=16 months)
Intervention 23.4 20.1 Control 14.9 8.6
The findings from Cleveland are summarized in Tables 61 and 62.
Summary of Analytic Findings Cleveland Table 61. Summary of Overall Sample Findings
Research Question
Outcome Significance Positive Effecta
Negative Effectb
Notes
Service practices Refusal of service Yes X X From pre to first post (reduction), from first to second post (increase)
Attempt at intervention provided
Yes X From pre to first post, from pre to second post
Observation of service to intoxicated patrons
N/A Small numbers, no statistical test
POLD mentions POLD mentions N/A Inadequate data, so no analysis
Bar patron intoxication
Average BACs Yes X X From pre to first post (reduction), from first to second post (increase)
Proportion of .08 or higher BACs
Yes X X From pre to first post (reduction), from first to second post (increase)
Proportion of .15 or higher BACs
No
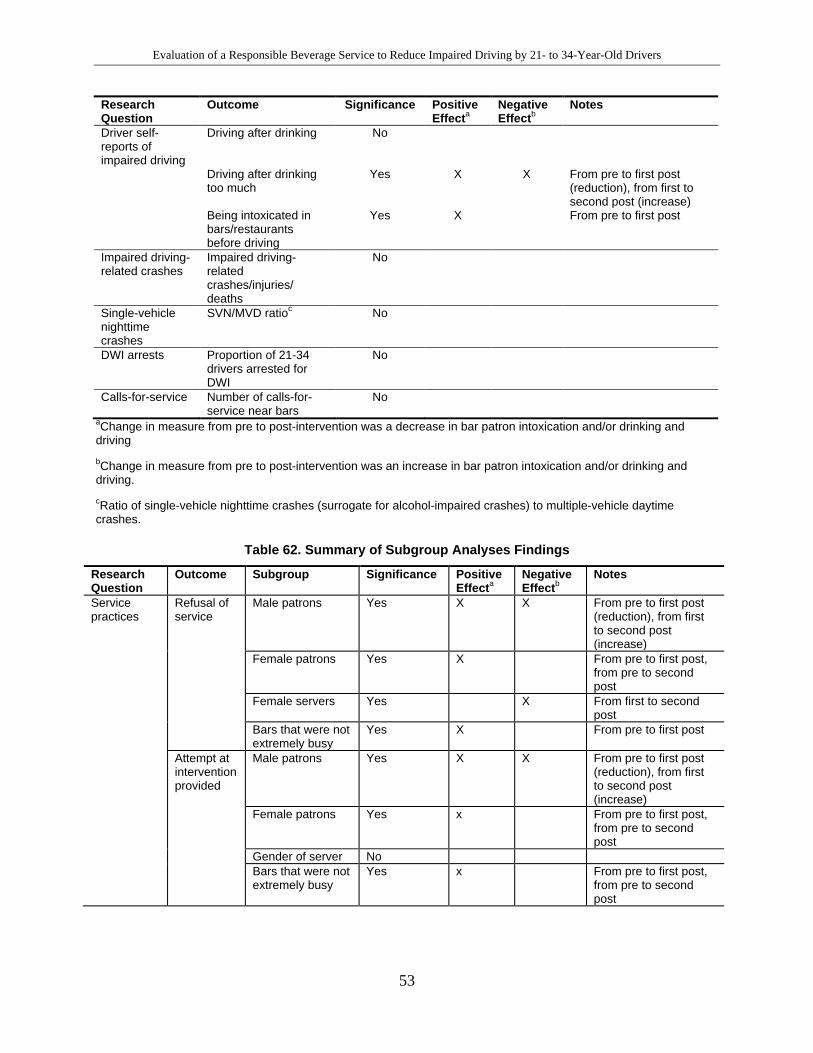
Evaluation of a Responsible Beverage Service to Reduce Impaired Driving by 21- to 34-Year-Old Drivers
53
Research Question
Outcome Significance Positive Effecta
Negative Effectb
Notes
Driver self-reports of impaired driving
Driving after drinking No
Driving after drinking too much
Yes X X From pre to first post (reduction), from first to second post (increase)
Being intoxicated in bars/restaurants before driving
Yes X From pre to first post
Impaired driving-related crashes
Impaired driving-related crashes/injuries/ deaths
No
Single-vehicle nighttime crashes
SVN/MVD ratioc No
DWI arrests Proportion of 21-34 drivers arrested for DWI
No
Calls-for-service Number of calls-for-service near bars
No
aChange in measure from pre to post-intervention was a decrease in bar patron intoxication and/or drinking and driving
bChange in measure from pre to post-intervention was an increase in bar patron intoxication and/or drinking and driving. cRatio of single-vehicle nighttime crashes (surrogate for alcohol-impaired crashes) to multiple-vehicle daytime crashes.
Table 62. Summary of Subgroup Analyses Findings
Research Question
Outcome Subgroup Significance Positive Effecta
Negative Effectb
Notes
Service practices
Refusal of service
Male patrons Yes X X From pre to first post (reduction), from first to second post (increase)
Female patrons Yes X From pre to first post, from pre to second post
Female servers Yes X From first to second post
Bars that were not extremely busy
Yes X From pre to first post
Attempt at intervention provided
Male patrons Yes X X From pre to first post (reduction), from first to second post (increase)
Female patrons Yes x From pre to first post, from pre to second post
Gender of server No Bars that were not
extremely busy Yes x From pre to first post,
from pre to second post
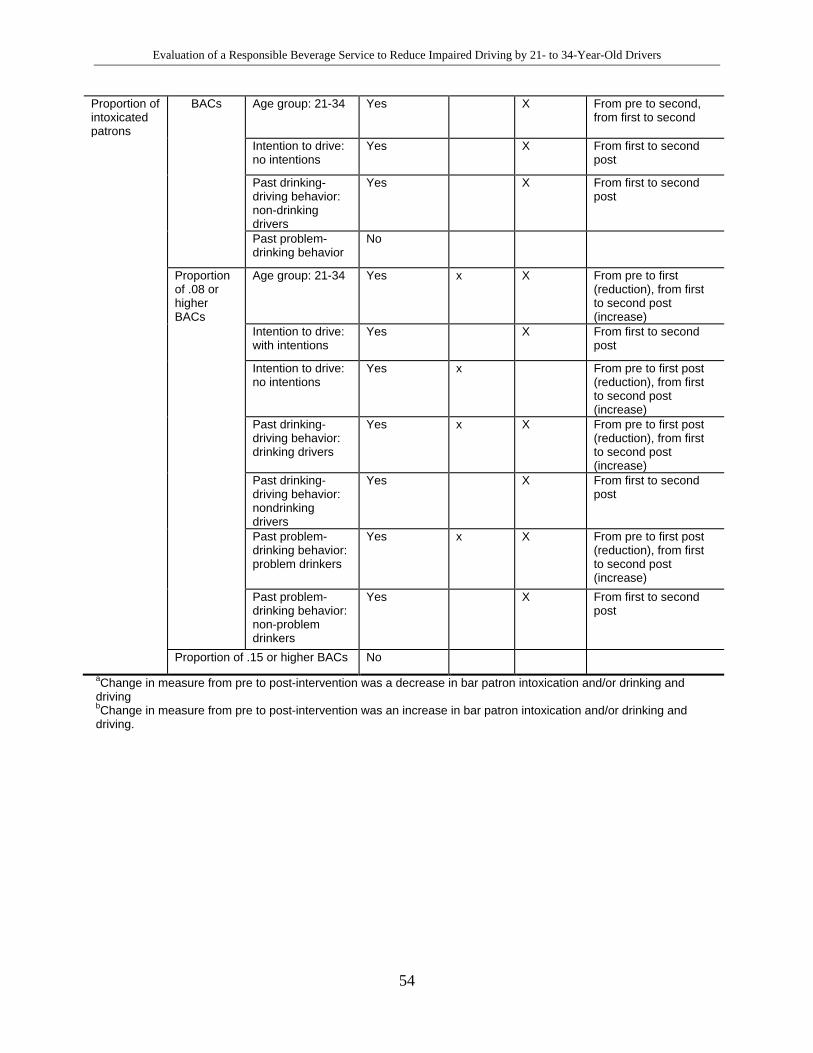
Evaluation of a Responsible Beverage Service to Reduce Impaired Driving by 21- to 34-Year-Old Drivers
54
Proportion of intoxicated patrons
BACs Age group: 21-34 Yes X From pre to second, from first to second
Intention to drive: no intentions
Yes X From first to second post
Past drinking-driving behavior: non-drinking drivers
Yes X From first to second post
Past problem-drinking behavior
No
Proportion of .08 or higher BACs
Age group: 21-34 Yes x X From pre to first (reduction), from first to second post (increase)
Intention to drive: with intentions
Yes X From first to second post
Intention to drive: no intentions
Yes x From pre to first post (reduction), from first to second post (increase)
Past drinking-driving behavior: drinking drivers
Yes x X From pre to first post (reduction), from first to second post (increase)
Past drinking-driving behavior: nondrinking drivers
Yes X From first to second post
Past problem-drinking behavior: problem drinkers
Yes x X From pre to first post (reduction), from first to second post (increase)
Past problem-drinking behavior: non-problem drinkers
Yes X From first to second post
Proportion of .15 or higher BACs No aChange in measure from pre to post-intervention was a decrease in bar patron intoxication and/or drinking and driving
bChange in measure from pre to post-intervention was an increase in bar patron intoxication and/or drinking and driving.
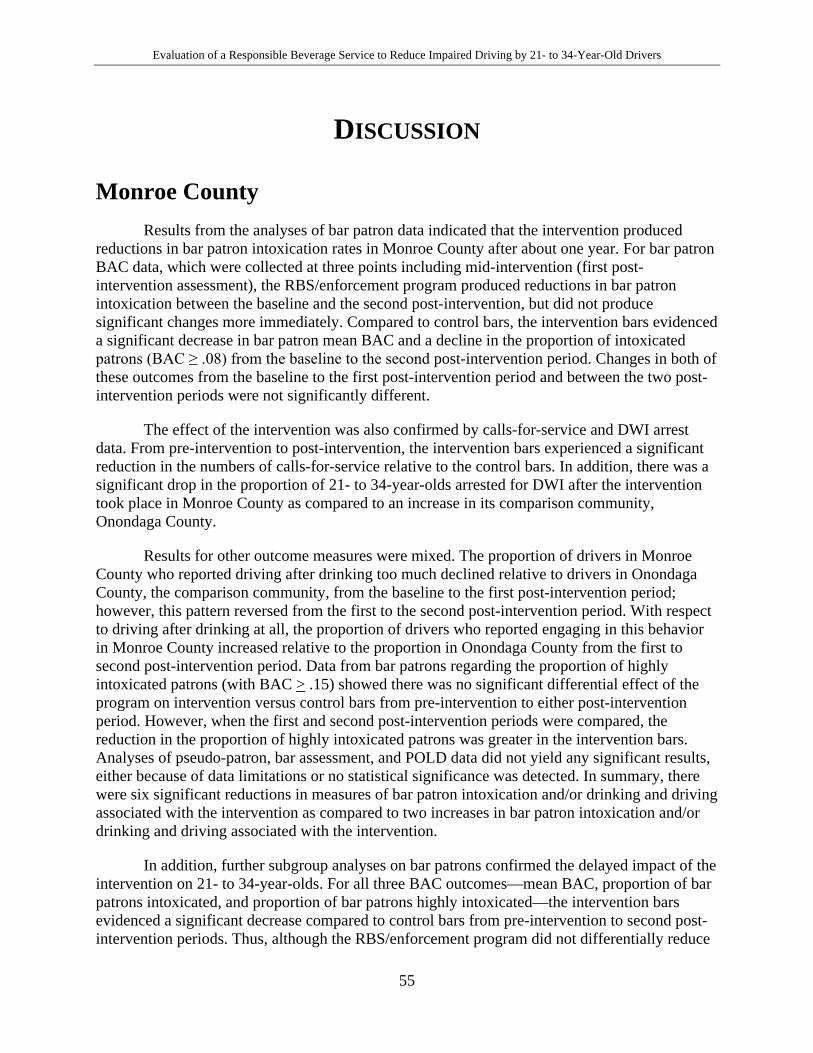
Evaluation of a Responsible Beverage Service to Reduce Impaired Driving by 21- to 34-Year-Old Drivers
55
DISCUSSION
Monroe County Results from the analyses of bar patron data indicated that the intervention produced
reductions in bar patron intoxication rates in Monroe County after about one year. For bar patron BAC data, which were collected at three points including mid-intervention (first post-intervention assessment), the RBS/enforcement program produced reductions in bar patron intoxication between the baseline and the second post-intervention, but did not produce significant changes more immediately. Compared to control bars, the intervention bars evidenced a significant decrease in bar patron mean BAC and a decline in the proportion of intoxicated patrons (BAC ≥ .08) from the baseline to the second post-intervention period. Changes in both of these outcomes from the baseline to the first post-intervention period and between the two post-intervention periods were not significantly different.
The effect of the intervention was also confirmed by calls-for-service and DWI arrest data. From pre-intervention to post-intervention, the intervention bars experienced a significant reduction in the numbers of calls-for-service relative to the control bars. In addition, there was a significant drop in the proportion of 21- to 34-year-olds arrested for DWI after the intervention took place in Monroe County as compared to an increase in its comparison community, Onondaga County.
Results for other outcome measures were mixed. The proportion of drivers in Monroe County who reported driving after drinking too much declined relative to drivers in Onondaga County, the comparison community, from the baseline to the first post-intervention period; however, this pattern reversed from the first to the second post-intervention period. With respect to driving after drinking at all, the proportion of drivers who reported engaging in this behavior in Monroe County increased relative to the proportion in Onondaga County from the first to second post-intervention period. Data from bar patrons regarding the proportion of highly intoxicated patrons (with BAC > .15) showed there was no significant differential effect of the program on intervention versus control bars from pre-intervention to either post-intervention period. However, when the first and second post-intervention periods were compared, the reduction in the proportion of highly intoxicated patrons was greater in the intervention bars. Analyses of pseudo-patron, bar assessment, and POLD data did not yield any significant results, either because of data limitations or no statistical significance was detected. In summary, there were six significant reductions in measures of bar patron intoxication and/or drinking and driving associated with the intervention as compared to two increases in bar patron intoxication and/or drinking and driving associated with the intervention.
In addition, further subgroup analyses on bar patrons confirmed the delayed impact of the intervention on 21- to 34-year-olds. For all three BAC outcomes—mean BAC, proportion of bar patrons intoxicated, and proportion of bar patrons highly intoxicated—the intervention bars evidenced a significant decrease compared to control bars from pre-intervention to second post-intervention periods. Thus, although the RBS/enforcement program did not differentially reduce
Evaluation of a Responsible Beverage Service to Reduce Impaired Driving by 21- to 34-Year-Old Drivers
56
the proportion of highly intoxicated patrons across all patrons, it was successful in reducing this proportion among younger patrons 21 to 34 by the second post-intervention period. Other subgroup analyses (i.e., based on intention to drive, past drinking-driving and problem-drinking behaviors) also revealed this delayed effect, but to varying degrees. In summary, there were nine significant reductions in the measures of bar patron intoxication and/or drinking and driving (versus three nonsignificant findings), and all of them were in the direction of a benefit for the intervention.
In Monroe County, the effects of the RBS training/enforcement program were delayed until later in the intervention period with two exceptions (self-reports of driving after drinking at all and driving after drinking too much). While the reasons for this are not entirely clear, there are some plausible factors that could have played a role in the delay. First, the enforcement by the SLA took some time to become implemented visibly, especially during the first of the three waves of enforcement. The feedback to the bars concerning SLA undercover visits (using investigator visits where no violations were observed and formal notification via letters to those where violations were observed) occurred an average of 5 weeks after the enforcement visit in the first 6 months of the intervention period due to reductions in the SLA’s staff resources. Later in the intervention period when the protocol for providing feedback was changed to sending letters to all bars to inform them of the occurrence of the enforcement visits and their ongoing nature, these reminders of enforcement activity were sent out within days of the actual SLA visit. In addition, in the beginning of the project, there was resistance by many bar owners to cooperate with the training aspect, the data collection outside the bars, and the overall concept. Many of these establishments were removed from the sample prior to or during the baseline data collection. Among those bars that participated in the project, it is possible that once the owners realized that the program was continuing and enforcement was taking place, they may have begun to take notice and, perhaps, warned their managers and servers to be careful. The fact that there was no refusal of service to pseudo-patrons may have been due to the emphasis in training on the subtle signs of intoxication. Also, pseudo-patrons came from various other occupations and were recruited from various venues. They may not have been “good actors.” However, by many of the measures used in the evaluation, Monroe County did show reductions in bar patron BAC, bar patron intoxication, DWI arrest rates among 21- to 34-year-olds, and calls-for-service later in the intervention period indicating some success from the strategy.
Cleveland Results from bar patron, pseudo-patron, and BMV data collection analyses indicated a
positive impact of the intervention (reduction) during the first post-intervention period only, which dwindled through the second post-intervention period (with a couple of exceptions). The pseudo-patron analyses in Cleveland showed that the intervention was associated with a relative increase in the refusal of service in the intervention bars, relative to the control bars, in the first post-intervention period. However, the effect on refusals was not significant when the second post-intervention was compared to the pre-intervention period. In fact, the intervention bars experienced a relative decrease in refusals when the post-intervention periods were compared. The influence of the intervention seemed more sustainable during the two post-intervention
Evaluation of a Responsible Beverage Service to Reduce Impaired Driving by 21- to 34-Year-Old Drivers
57
periods on the outcome of attempt to provide some type of intervention to pseudo-patrons in the intervention bars.
The intervention had a similar short-term positive influence (reduction) on two of the three bar patron BAC measures when the full sample was examined. The intervention bars performed significantly better than the control bars in terms of changes in the mean BACs of bar patrons and the proportion of intoxicated patrons. However, such differences were not sustained in the second post-intervention period, when the two measures both evidenced a significant change in the opposite direction (i.e., they increased, inconsistent with expectations regarding the program’s influence) in the intervention bars. The intervention had a similar effect on the proportion of drivers in the community who reported driving after drinking too much. In addition, the proportion of drivers who reported being intoxicated in bars/restaurants before driving revealed a decrease in Cleveland relative to its comparison community, Toledo, in the first post-intervention period, but further change was not significant.
Analyses of the remaining data did not yield any significant results, either because of data limitations due to small sample sizes or no statistical significance was detected when there were adequate sample sizes. For example, the intervention and control bars in Cleveland were seldom mentioned in the POLD data and rarely did a bar in the sample have more than one POLD mention. Several reasons accounted for the small number of POLD mentions for the bars in the sample including the large number of bars in Cleveland, the low percentage of DWI arrestees who provided information on their last drinking location, and even lower rate of naming a specific establishment. Because of the dearth of POLD data for bars in the sample, it was not possible to examine changes in POLD mentions over the course of the intervention. Overall, there were six significant reductions in bar patron intoxication and/or drinking and driving measures associated with the intervention, and four significant increases in bar patron intoxication and/or drinking and driving measures associated with the intervention.
In addition, findings from subgroup analyses were mixed regarding the intervention’s effect on various subgroups. Many of the findings did confirm the temporary nature of a positive influence (reduction), which showed up during the first post-intervention period but changed to the opposite direction in the second post-intervention period. Some subgroups showed a sustained improvement in the intervention bars relative to those in control bars after the intervention. For example, the rates of refusal of service and attempts to provide some type of intervention continued to increase to a greater extent in the intervention bars when female pseudo-patrons ordered drinks and when bars were not extremely busy. There were 17 significant findings (versus three nonsignificant findings), but they were almost evenly divided between those in the “positive” or intended direction (reduction) versus those in the “negative” or unintended direction (increase) concerning the intervention (see tables 61 and 62).
In Cleveland, the “positive” effect of the RBS/enforcement strategy took place immediately (within 6 months from intervention startup) in some measures, but it was not sustained 1 year later in the intervention period. Again, it is not clear why this occurred, but some of the following factors may have accounted for such an effect and may have been important to the outcomes. Enforcement in Cleveland was conducted by officers from the Cleveland Police Department, with arrests and citations for serving staff and intoxicated or underage patrons occurring on site in an immediate and visible manner. Although there were few
Evaluation of a Responsible Beverage Service to Reduce Impaired Driving by 21- to 34-Year-Old Drivers
58
infractions, it is possible the intervention bars got the message quickly. Word between owners may have gotten around the city to “be careful.” The significant proportion of pseudo-patrons denied service early in the intervention period reflected this awareness and indicated that the RBS training had an effect. It should be noted, however, that the pseudo-patrons in Cleveland were recruited from a cadre of trained actors who may have enhanced the intoxication signs or performed them differently than the Monroe County pseudo-patrons. In Cleveland, several significant findings were positive (e.g., reductions in bar patron intoxication, increase in pseudo-patron denials of service, decreases in reported impaired driving) in the early part of the intervention, indicating that the RBS training and the follow-up enforcement had an immediate and strong effect. Later in the intervention period, these effects wore off, which is very typical of RBS and alcohol control enforcement efforts reported in other studies (Wagenaar, Toomey, & Erickson, 2005). In addition, although free e-TIPS training was available and encouraged for the intervention bars’ new staff, few new servers completed the training during the intervention period. This could have affected the results.
Conducting the intervention strategy in only 10 bars in each community limited the overall effect of the countermeasure. With just a small percentage of all the bars in each community experiencing the intervention, it was not expected to affect some of the communitywide measures (e.g., impaired-driving-related crashes). However, indications of changes of behavior in the intervention bars were certainly encouraging. The significant increase in denials of service to pseudo-patrons feigning intoxication in Cleveland and the reduction of patrons at intoxicating BAC levels in both sites were important indicators of the potential effect of this RBS/enforcement strategy.
In summary, there are indications from this study that RBS training plus some enforcement can have an effect on bar patron intoxication (and potential impaired driving). It appears that when bar managers and owners are aware of the program and the enforcement of it, and servers are properly trained in responsible beverage service, fewer patrons are highly intoxicated (i.e., over-served), and some effort is made to deny service to obviously intoxicated patrons. Because about half of drivers arrested for DWI are coming from licensed establishments in any given community, widespread implementation of this strategy could have a significant effect on impaired driving.
Evaluation of a Responsible Beverage Service to Reduce Impaired Driving by 21- to 34-Year-Old Drivers
59
CONCLUSIONS There were indications from this study that RBS training plus enforcement can have an
effect on bar patron intoxication. Apparently, when bar managers and owners are aware of the program and its enforcement, and servers are properly trained in responsible beverage service, fewer patrons are highly intoxicated (i.e., over-served) and an effort is made to deny service to obviously intoxicated patrons. RBS training, followed up with visible enforcement, may be an important strategy in combatting impaired driving and other injuries associated with excessive drinking. There were many findings in the “positive” or intended direction in this study, and the cumulative evidence points to a reduction in measures of bar patron intoxication and/or drinking and driving. These findings validate prior research on this RBS strategy and indicate that more widespread implementation in communities, though not easy, could have a significant effect, not only on impaired driving, but also on other alcohol-attributable harm.
In both Monroe County and Cleveland, the proportion of bar patrons who were intoxicated (BAC > .08) decreased significantly from pre-intervention to post-intervention in the intervention bars relative to the control bars. This result certainly has implications on impaired driving. Alcohol enforcement of over-service practices should certainly be considered by communities interested in reducing impaired-driving-related injuries.
Collecting POLD information from drivers arrested for DWI can be very useful in identifying establishments that routinely serve intoxicated patrons, assuming there are sufficient data and variety in POLD mentions across establishments. Law enforcement, including alcohol beverage control agencies around the country, should consider collecting such data. ABC officials should then use the POLD information to identify potential problem bars and target them for enhanced enforcement.
Evaluation of a Responsible Beverage Service to Reduce Impaired Driving by 21- to 34-Year-Old Drivers
60
CHALLENGES AND LESSONS LEARNED
Limitations in Study Design In retrospect, two years of post-intervention data may have provided a more thorough
analysis of longer term impacts of these activities.
We had no control over communications that may have occurred between intervention bars and control bars in each community. It is possible that control bar staff felt they were being observed for serving practices since bar patron data collection did occur at their establishments. This could have affected their over-service practices resulted in comparisons that were conservative.
Monroe County Challenges to Program Implementation
RBS Training
Although the live FAIR training was well attended by intervention bar staff, few new hires took advantage of the online e-TIPS training. As noted, only 27 online passports were requested and only four were used to complete the online program. In part, the relative lack of use of the e-TIPS passports may have resulted from the change from direct face-to-face feedback following the enforcement visits (during which owners/managers were encouraged to have staff who did not attend the live training use the online training) to delivery of feedback via a mailed letter. Although the letter referenced the e-TIPS training, the direct contact may have elicited greater participation.
Enhanced Enforcement
As alluded to above, the agency responsible for enforcing alcoholic beverage control laws experienced ongoing problems that affected the enforcement component of the program. The initial problem with reductions in staff led to a lag of five weeks rather than the scheduled two weeks between visits to establishments and the provision of feedback during in-person visits during Wave one of enforcement. As a result, the mechanism for providing feedback was changed from in-person feedback to a mailed letter. The letters were addressed to the licensee/owner, with a request that the feedback be shared with managers and bar wait staff (see Appendix A for sample enforcement letter). Unlike the recruitment letter that was hand-delivered by the investigator, however, there is no way of knowing whether the feedback letters that were mailed out were received or by whom they were read. Also, in the two establishments where over-service was observed, the initiation of a violation did not occur until after the project was concluded. Thus, compared to Cleveland, where violators (both bar staff and underage patrons)
Evaluation of a Responsible Beverage Service to Reduce Impaired Driving by 21- to 34-Year-Old Drivers
61
were arrested or cited on site, enforcement in Monroe County was much less visible and not nearly as swift.
In addition to staffing issues, other political and financial complications arose during the course of the project with respect to enforcement. For example, prior to the start of the Wave two enforcement visits, leadership at the SLA was in transition and confirmation of the new chairman resulted in some uncertainty about the agency’s ability to conduct the enforcement visits. Ultimately, these issues were worked out, and the second wave of enforcement visits began on schedule.
Finally, during the third wave of enforcement visits, local issues beyond the control of NHTSA or the researcher led to a temporary halt in enforcement visits until these issues could be resolved.
Challenges to Data Collection/Evaluation
Changes in Sample Over Time
In Monroe County the sample list of establishments underwent many changes over the course of the grant from the original group that was assembled. Several reasons played a factor in bringing about those revisions: establishment closures; problems with strip clubs such as their policy of non-admittance to single female pseudo-patrons; irate owners stirring up bar patrons against the data collection teams; establishments located in private parking lots refusing access to bar patron data collection teams; concerns about security due to establishment location; and an establishment dropped because most of the pseudo-patrons were well known to their serving staff. Because of these constraints, the establishments that were the worst offenders in terms of POLD mentions were not included in the study. As often happens with field studies, the criteria for inclusion in the sample combined with practical limitations to determine which establishments constituted the final sample.
The process of replacing establishments posing logistical problems for data collection created extra work for data collection teams. At times, establishments were replaced after one or more of the three data collection activities had already been completed (i.e., pseudo-patron visits had been made when it was realized that the bar patron data collection could not be accomplished).
Assessing Where Over-Service Has Occurred
Also in Monroe County, the establishments on the finalized sample list became polarized to two main downtown areas with a handful sprinkled throughout the suburbs and a couple located near a college. The two downtown areas each have many bars located within a three to four block radius. The usual practice for patrons is to bar hop between the various bars. This is a factor that is necessary to keep in mind when evaluating the BAC levels of bar patrons participating in the study. A patron may indicate none to a couple of drinks but have a BAC indicative of over-service. Because of the tendency to bar hop, it is difficult to figure out where the over-service occurred. It is also quite possible that the bar vacated when the data collection

Evaluation of a Responsible Beverage Service to Reduce Impaired Driving by 21- to 34-Year-Old Drivers
62
was done will not be the last stop for the night for this bar patron. The issue of over-service may be due to the fact that more than one bar is visited in a night.
Use of Female Pseudo-Patrons
The use of female pseudo-patrons brought about concerns that were not as pertinent to the male pseudo-patrons. One issue discussed earlier was her inability to gain entrance into every establishment. A second issue was the relative oddity of a female entering a bar alone. The female pseudo-patrons’ solitary state was commented on frequently by bouncers especially in those establishments located off the beaten path. In fact, strip clubs would not admit single females, which contributed to these types of establishments being removed from the sample. It may have been better to have two females enter together and both portray signs of intoxication. This would eliminate the thinking that the sober one was driving. A third issue faced by our female pseudo-patron was the frequency of having other male patrons offering to buy her a drink. One patron actually followed her out prompting the bouncer to intervene. There was definitely a level of discomfort on the part of our female pseudo-patron, which may have impacted this pseudo-patron’s ability to display signs of intoxication at the bar or to make observations in an inconspicuous manner.
Resistance From Bar Owners
As mentioned in the prior section on changes in the sample over time, initial contacts with bar owners to notify them of the upcoming data collection activities resulted in pushback from several bar owners, who requested that their establishment be removed from the sample and/or interfered with data collection activities (e.g., denying project staff access to parking lots for subject recruitment, encouraging patrons to not participate in the data collection activities). In particular, strip clubs were adamant about not having data collection teams visit their premises, prompting all such establishments to be dropped from the sample. Leveraging support from the Monroe County STOP-DWI Program, a well-established anti-impaired driving task force program, might have garnered the program greater access to and support from more alcohol retail establishments. Press releases and media events could have brought a visibility that might have circumvented problems with bar owners. Additionally, other organizations with entré to bar owners may have been able to assist with the project. As part of the preparation for the program and evaluation, the New York State Bar and Restaurant Association was contacted to see if they would send a letter to their membership. Because only one establishment on the sample list was part of their membership, the association declined this request. However, another agency to have approached early on was the New York State Bar and Tavern Association. It is possible that more of the establishments in the sample were members of that organization. Their assistance may have helped with obtaining bar owner buy-in and cooperation with the grant.
Project Staff Attrition
Changes over time in staff personnel were an ongoing challenge. This was particularly the case throughout the first wave of the data collection when one half of the staff turned over for a variety of reasons. One data collector was a part-time police officer and left the project as his involvement with the study was perceived by his department to be a conflict of interest. More common reasons for staff turnover included harassment of data collection teams by bar owners
Evaluation of a Responsible Beverage Service to Reduce Impaired Driving by 21- to 34-Year-Old Drivers
63
and boredom/discomfort as well as frustration with low response rates during data collection sessions. Attrition by project staff necessitated additional recruitment and training; as a result, there was less consistency across data collectors over time than was desired.
Cleveland Challenges to Program Implementation
Identification of Problem Establishments
Problem identification both took far longer than expected and led to a later than anticipated project start date. The initial plan had been to utilize POLD forms as the basis of identifying problem bars, but this approach did not provide adequate information to distinguish problem establishments, with most bars having 0 to 2 POLD mentions. Considering the relative unlikelihood of being stopped by police for suspicion of impaired driving, relying on POLD data alone for identification of potential intervention bars/restaurants proved to be problematic. The lack of POLD data also had repercussions for the evaluation as data analyses could not be used to examine changes over the course of the intervention in POLD mentions of intervention versus control bars. To provide additional data for use in identifying problem establishments, citation data were gathered from the OIU and calls-for-service data were gathered from CPD to the addresses of different establishments for over-service and related problems, such as disorderly conduct and public intoxication.
The identification of control and intervention establishments was also hampered by an initial approach that considered all 550 Cleveland bars as equal candidates for program testing. After the initial assignment of bars to intervention and control conditions based on the problem assessment, in-person visits determined that the majority of bars were small neighborhood establishments with an older, blue-collar clientele. These sites did not draw crowds sufficient for data gathering and did not draw clientele in the desired 21-to-34 age range. To remedy this problem, the list of potential establishments was winnowed down to the 50 establishments that had both sufficient crowds for data gathering purposes and catered primarily to a 21- to 34-year-old clientele, the problem identification steps combining POLD, OIU, and CPD data were repeated, and the data were provided to PIRE. Final random assignment of 10 intervention and 10 control sites was received from PIRE in October 2008.
Challenges to Data Collection/Evaluation
Process Delays
Negotiating with BMV administration significantly delayed the completion of the site’s baseline data collection. Furthermore, the start of the project was delayed by issues with the UH and University of Toledo IRBs, the Ohio Department of Public Safety (lead agency for the OIU), and the legal department of CWRU that, in retrospect, should have been expected. The project was unique enough to draw scrutiny from legal departments and human subjects’ protection
Evaluation of a Responsible Beverage Service to Reduce Impaired Driving by 21- to 34-Year-Old Drivers
64
boards. Time should have been built into project development to account for these inevitable delays.
Pseudo-Patron Assessments
In both Monroe County and Cleveland, pseudo-patrons were trained to display subtle rather than dramatic signs of impairment. This may, in part, explain why so few refusals of service or other interventions with apparently impaired patrons occurred across sites. There were also differences between the two treatment sites in the individuals used in the pseudo-patron assessments. In Monroe County, project staff was used for this task, while in Cleveland, the project contracted with the Mt. Sinai Skills and Simulation Center of Case Western Reserve University, which provided trained “actors” who take part in a variety of simulation exercises for health sciences education and evaluation. SIM Center staff was used in all aspects of data collection in Cleveland—bar patron, pseudo-patron, and BMV data collection activities. It is possible that the differences in background and training of project staff in the two sites, particularly with respect to the pseudo-patron data collection, may have accounted for differences in the findings across treatment sites.
Recommendations for Future Demonstrations Each stage of project development was a learning process—from the best way to identify
intervention and control bars to recruiting data collection staff to working through the logistics and bureaucratic hurdles of establishing contracts and collecting data at different venues. The early stages of the project were the most laborious and time consuming. Most challenges were overcome successfully and provide guidance for other sites that may wish to implement a similar strategy.
• Leverage resources such as the lead agency’s status and publicity to generate support for intervention programs. The support of a highly regarded agency or local impaired driving task force that is well established in the community can help lend credibility to the effort and gain greater access to and support from alcohol retail establishments. Press releases and conferences can be used to bring visibility to anti-impaired driving efforts that may increase the chances that bar owners and manager will be supportive.
• To the extent possible, set up overlapping responsibilities for program activities among participating agencies and organizations. Such duplication or redundancy may help avoid problems and delays should one participating entity run into problems affecting their ability to fulfill their roles. For example, if local police officers can be trained and used for alcohol enforcement rather than the ABC alone, this can reduce the burden on agencies involved in the enforcement part of the program.
• Invest sufficient time during the preparatory phase to avoid repeating processes that can cause delays in project start up. For example, before getting started, it is important to assess the adequacy of the metrics to be used for problem identification, based on the data available. If a planned indicator does not provide sufficient data or sufficient variability across establishments, additional data may be needed from other
Evaluation of a Responsible Beverage Service to Reduce Impaired Driving by 21- to 34-Year-Old Drivers
65
sources to adequately measure the construct of “problem establishments.” It is best to uncover this before the program launches. Also, once the most problematic establishments had been identified, it is advisable to investigate relevant factors (e.g., clientele age group, feasibility for data collection) prior to conducting the random assignment process to ensure the sample contains the types of bars of interest (e.g., those catering to a young adult clientele).
• Work closely with the community law enforcement agencies during all phases.
• If possible, involve local law enforcement in the initial process of contacting establishments as this can be advantageous in increasing bar owners’ and managers’ receptivity to and cooperation with the RBS intervention.
• Ensure law enforcement and ABC support for the project simplified the data-collection process. Good communication with bars before data collection and the presence of plainclothes officers as onsite team leaders can contribute to a smoothly run, hassle-free bar patron data collection effort.
• Persuade police officers to personally visit each intervention bar to provide feedback following enforcement waves was also well received by bar owners and managers. Such face-to-face communication may have more influence than sending a letter regarding the results of enforcement visits.
• Offer bars an incentive such as an ID scanner may be helpful in garnering high cooperation rates from bar owner and manager in the RBS training for their staff.
• Rely on a single pool of data collectors to handle all portions of the data collection process (bar patron, pseudo-patron, and BMV self-assessments) will inevitably draw out the data collection process. Having multiple pools of staff from which to draw would have allowed for greater overlap of activities and streamlined the data collection process.
• For activities such as pseudo-patron assessments that require data collection in an unobtrusive fashion, it is important to carefully consider the socioeconomic mix of patrons at experimental and control sites and recruit data collectors accordingly. Taking the time to find and train appropriate data collectors will avoid delays and help ensure that evaluation results provide a valid measure of changes in the behavior of interest.
• It is to be expected that establishments that have over-service problems may also have financial or legal difficulties. Thus, it is likely some of the intervention bars will close prior to the final wave of data collection. This should be considered when developing the sampling plan.
Evaluation of a Responsible Beverage Service to Reduce Impaired Driving by 21- to 34-Year-Old Drivers
66
REFERENCES Anglin, L., Caverson, R., Fennel, R., Giesbrecht, N., & Mann, R.E. (1997). A Study of Impaired
Drivers Stopped by Police in Sudbury, Ontario. Toronto: Addiction Research Foundation.
Damkot, D. K. (1979). Alcohol and the rural driver. In Incurrence in Alcoholism, Vol. VI. New York: Grune and Straten.
Eby, D. W. (1995). The convicted drunk driver in Michigan: a profile of offenders. UMTRI Research Review, 25(52), April-June.
Fell, J. C., Tippetts, A. S., & Levy, Marvin. (2008). Road Use Behavior: Evaluation of Seven Publicized Enforcement Demonstration Programs to Reduce Impaired Driving: Georgia, Louisiana, Pennsylvania, Tennessee, Texas, Indiana, and Michigan. Annals of Advances in Automotive Medicine, Vol. 52. Evanston, IL: Association for the Advancement of Automotive Medicine.
Fell, J. C., Tippetts, S., & Voas, R. (2010). Drinking characteristics of drivers arrested for driving while intoxicated in two police jurisdictions. Traffic Injury Prevention, 11(5), 443-452. doi: 927278362 [pii] 10.1080/15389588.2010.488274
Foss, R. D., Perrine, M. W., Meyers, A. M., Musty, R. E., & Voas, R. B. (1990). A roadside survey in the computer age. In M. W. Perrine (Ed.), Proceedings of the 11th International Conference on Alcohol, Drugs and Traffic Safety, October 24-27, 1989, Chicago, Illinois, U.S.A. (pp. 920-929). Chicago: National Safety Council.
Gliksman, L. (1988). Consequences of alcohol use: Behavior changes and problems during first year of university. The International Journal of the Addictions, 23(12), 1281-1295.
Graham, K., Osgood, D. W., Zibrowski, E., Purcell, J., Gilksman, L., Leonard, K., . . . & Toomey, T. L. (2004). The effect of the Safer Bars programme on physical aggression in bars: Results of a randomized controlled trial. Drug and Alcohol Review, 23(1), 31-41.
Holder, H. D., Gruenewald, P. J., Ponicki, W. R., Treno, A. J., Grube, J. W., Saltz, R. F., . . . & Roeper, P. (2000). Effect of community-based interventions on high-risk drinking and alcohol-related injuries. Journal of the American Medical Association, 284(18), 2341-2347.
Holder, H. D., & Wagenaar, A. C. (1994). Mandated server training and reduced alcohol-involved traffic crashes: A time series analysis of the Oregon experience. Accident Analysis and Prevention, 26(1), 89-98.
Howard-Pitney, B., Johnson, M. D., Altman, D. G., Hopkins, R., & Hammond, N. (1991). Responsible alcohol service: A study of server, manager, and environmental impact. American Journal of Public Health, 81(2), pp 197-198.
Institute for Public Strategies. (2003). Southern California Prevention Exchange-Impaired driving pilot project, Final Report, 2001-2003. Washington, DC: National Highway Traffic Safety Administration.
Johnsson, K. O., & Berglund, M. (2003). Education of key personnel in student pubs leads to a decrease in alcohol consumption among the patrons: A randomized controlled trial. Addiction, 98(5), 627-633.
Jones, L., Hughes, K., Atkinson, A. M., & Bellis, M. A. (2011). Reducing harm in drinking environments: A systematic review of effective approaches. Health & Place, 17(2), 508-518.

Evaluation of a Responsible Beverage Service to Reduce Impaired Driving by 21- to 34-Year-Old Drivers
67
Kennedy, B. P., Isaac, N. E., & Graham, J. D. (1996). The role of heavy drinking in the risk of traffic fatalities. Risk Analysis, 16(4), 565-569.
Kennedy, B. P., Isaac, N. E., Nelson, T. F., & Graham, J. D. (1997). Young male drinkers and impaired driving intervention: Results of a U.S. telephone survey. Accident Analysis and Prevention, 29(6), 707-713.
Lacey, J. H., Kelley-Baker, T., Furr-Holden, D., Voas, R. B., … & Berning, A. (2009, December). 2007 National Roadside Survey of Alcohol and Drug Use by Drivers: Alcohol Results (Report No. DOT HS 811 248). Washington, DC: National Highway Traffic Safety Administration. Available at https://ntl.bts.gov/lib/31000/31600/31643/811248.pdf
Liu, S., Siegel, P. Z., Brewer, R. D., Mokdad, A. H., Sleet, D. A., & Serdula, M. (1997). Prevalence of alcohol-impaired driving: Results from a national self-reported survey of health behaviors. Journal of the American Medical Association, 277(2), 122-126.
McKnight, A. J. (1991). Factors influencing the effectiveness of server-intervention education. Journal of Studies on Alcohol, 52(5), 389-397.
McKnight, A. J. (1987, March). Development and field test of a responsible alcohol service program, Vol. 1: Research findings (Report No. DOT HS 807 221). Washington, DC: U.S. Department of Transportation, National Highway Traffic Safety Administration. Available at https://ntl.bts.gov/lib/25000/25700/25758/DOT-HS-807-221_001.pdf
McKnight, A. J., & Streff, F. M. (1994). The effect of enforcement upon service of alcohol to intoxicated patrons of bars and restaurants. Accident Analysis and Prevention, 26(1), 79-88.
Molof, M. J., & Kimball, C. (1994). A study of the implementation and effects of Oregon’s mandatory alcohol server training program. Eugene, OR: Oregon Research Services Inc..
Mosher, J. F. (1983). Server intervention: A new approach for preventing drinking-driving. Accident Analysis and Prevention, 15(6), 483-497.
National Center for Statistics and Analysis. (2016). 2015 motor vehicle crashes: Overview (Traffic Safety Facts: Research Note. Report No. DOT HS 812 318). Washington, DC: National Highway Traffic Safety Administration. available at https://crashstats.nhtsa.dot.gov/Api/Public/ViewPublication/812318
National Center for Statistics and Analysis. (2016, May). Young drivers: 2014 data (Traffic Safety Facts. Report No. DOT HS 812 278). Washington, DC: National Highway Traffic Safety Administration. Available at https://crashstats.nhtsa.dot.gov/Api/Public/-ViewPublication/812278
National Center for Statistics and Analysis. (2015). Alcohol-impaired driving: 2014 data (Traffic Safety Facts. Report No. DOT HS 812 231). Washington, DC: National Highway Traffic Safety Administration. Available at https://crashstats.nhtsa.dot.gov/Api/Public/ViewPublication/812231
National Highway Traffic Safety Administration. (2016). Digest of impaired driving and selected beverage control laws, 29th edition. (Report No. DOT HS 812 267) .Washington, DC: National Highway Traffic Safety Administration. Available at www.nhtsa.gov/staticfiles/nti/pdf/812267_2014-ImpairedDrivingDigest.pdf
Nelson, T. F., Kennedy, B. P., Isaac, N. E., & Graham, J. D. (1998). Correlates of drinking-driving in men at risk for impaired driving crashes. American Journal of Health Behavior, 22(2), 151-158.
Evaluation of a Responsible Beverage Service to Reduce Impaired Driving by 21- to 34-Year-Old Drivers
68
O’Donnell, M. (1985). Research on drinking locations of alcohol-impaired drivers: Implications for prevention policies. Journal of Public Health Policy, 6, 510-525.
Ontario Ministry of Transport and Communications. (1980). The 1979 Ontario roadside BAC survey: Summary report, Interministerial Committee on Drinking and Driving. Ontario, Canada: Ontario Ministry of Transport and Communications.
Palmer, J. W. (1986). Minnesota roadside survey: Alcohol positive drivers. Saint Cloud, MN: Saint Cloud University.
Rivara, F. P., Boisvert, D., Relyea-Chew, A. , & Gomez, T. . (2011). Last Call: Decreasing drunk driving among 21-34-year-old bar patrons. International Journal of Injury Control and Safety Promotion, 1-9.
Russ, N. W., & Geller, E. S. (1986). Evaluation of a server intervention program for preventing drunk driving. Blacksburg, VA: Virginia Polytechnic Institute and State University.
Saltz, R. F. (1987). The roles of bars and restaurants in preventing alcohol-impaired driving: An evaluation of server intervention. Evaluation and the Health Professions, 10(1), 5-27.
Saltz, R. F., & Hennessy, M. (1990). Reducing intoxication in commercial establishments: An evaluation of responsible beverage service practices. Berkeley, CA: Prevention Research Center.
Stewart, K., Fell, J., & Sweedler, B. (2004, August 8-13). Trends in Impaired Driving in the United States: How to Resume Progress. In J. Oliver, P. Williams, & A. Clayton (Eds.), Proceedings of the 17th International Conference on Alcohol, Drugs and Traffic Safety. Glasgow, UK.
Stockwell, T., Lang, E., & Rydon, P. (1993). High risk drinking settings: The association of serving and promotional practices with harmful drinking. Addiction, 88(11), 1519-1526.
Toomey, T. L., Wagenaar, A. C., Gehan, J. P., Kilian, G., Murray, D. B., & Perry, C. L. (2001). Project Arm: Alcohol risk management to prevent sales to underage and intoxicated patrons. Health Education & Behavior, 28(2), 186-199.
Voas, R. B., Holder, H. D., & Gruenewald, P. J. (1997). The effect of drinking and driving interventions on alcohol-involved traffic crashes within a comprehensive community trial. Addiction, 92 (Supplement 2), S221-S236.
Wagenaar, A. C., Toomey, T. L., & Erickson, D. J. (2005). Complying with the minimum drinking age: Effects of enforcement and training interventions. Alcoholism: Clinical and Experimental Research, 29(3), 255-262.
Wallin, E., Gripenberg, J., & Andreasson, S. (2002). Too drunk for a beer? A study of overserving in Stockholm. Addiction, 97(7), 901-907.
Wolfe, A. C. (1975). Characteristics of late-night, weekend drivers: Results of the U.S. national roadside breath-testing survey and several local surveys. In S. Israelstam & S. Lambert (Eds.), Proceedings of the 6th international conference on alcohol, drugs and traffic safety (pp. 411-449), Toronto, Ontario, Canada.
Zador, P. L., Krawchuk, S. A., & Voas, R. B. (2000). Alcohol-related relative risk of driver fatalities and driver involvement in fatal crashes in relation to driver age and gender: An update using 1996 data. Journal of Studies on Alcohol, 61(3), 387-395.
DOT HS 812 398April 2017
13009-041217-v2