Evaluation of Protein Utilization in Low and High Protein ...
86
University of Nebraska - Lincoln DigitalCommons@University of Nebraska - Lincoln eses and Dissertations in Animal Science Animal Science Department 5-2019 Evaluation of Protein Utilization in Low and High Protein Forage Sources and the Economic Value of Supplementing Field Peas (pisum sativum) to Growing Cale Grazing Crested Wheatgrass Pastures Braden C. Troyer University of Nebraska-Lincoln, [email protected] Follow this and additional works at: hps://digitalcommons.unl.edu/animalscidiss Part of the Agriculture Commons , and the Animal Sciences Commons is Article is brought to you for free and open access by the Animal Science Department at DigitalCommons@University of Nebraska - Lincoln. It has been accepted for inclusion in eses and Dissertations in Animal Science by an authorized administrator of DigitalCommons@University of Nebraska - Lincoln. Troyer, Braden C., "Evaluation of Protein Utilization in Low and High Protein Forage Sources and the Economic Value of Supplementing Field Peas (pisum sativum) to Growing Cale Grazing Crested Wheatgrass Pastures" (2019). eses and Dissertations in Animal Science. 179. hps://digitalcommons.unl.edu/animalscidiss/179
Transcript of Evaluation of Protein Utilization in Low and High Protein ...

University of Nebraska - LincolnDigitalCommons@University of Nebraska - Lincoln
Theses and Dissertations in Animal Science Animal Science Department
5-2019
Evaluation of Protein Utilization in Low and HighProtein Forage Sources and the Economic Value ofSupplementing Field Peas (pisum sativum) toGrowing Cattle Grazing Crested WheatgrassPasturesBraden C. TroyerUniversity of Nebraska-Lincoln, [email protected]
Follow this and additional works at: https://digitalcommons.unl.edu/animalscidiss
Part of the Agriculture Commons, and the Animal Sciences Commons
This Article is brought to you for free and open access by the Animal Science Department at DigitalCommons@University of Nebraska - Lincoln. It hasbeen accepted for inclusion in Theses and Dissertations in Animal Science by an authorized administrator of DigitalCommons@University of Nebraska- Lincoln.
Troyer, Braden C., "Evaluation of Protein Utilization in Low and High Protein Forage Sources and the Economic Value ofSupplementing Field Peas (pisum sativum) to Growing Cattle Grazing Crested Wheatgrass Pastures" (2019). Theses and Dissertationsin Animal Science. 179.https://digitalcommons.unl.edu/animalscidiss/179

Evaluation of Protein Utilization in Low and High Protein Forage Sources
and the Economic Value of Supplementing Field Peas (pisum sativum) to
Growing Cattle Grazing Crested Wheatgrass Pastures
by
Braden C. Troyer
A THESIS
Presented to the Faculty of
The Graduate College at the University of Nebraska
In Partial Fulfillment of Requirements
For the Degree of Master of Science
Major: Animal Science
Under the Supervision of Professor
Andrea K. Watson
Lincoln, Nebraska
May 2019
Evaluation of Protein Utilization in Low and High Protein Forage Sources
and the Economic Value of Supplementing Field Peas (pisum sativum) to
Growing Cattle Grazing Crested Wheatgrass Pastures
Braden C. Troyer, M.S.
University of Nebraska, 2019
Advisor: Andrea K. Watson
Field peas are widely grown in the panhandle of Nebraska; however, markets
quickly become saturated. A two year experiment was conducted comparing field peas to
dry distillers grains with solubles (DDGS) as a protein supplement. The objective was to
establish a price producers could pay for field peas relative to DDGS. There was a
significant difference in ADG due to type of supplement (P = 0.02). Field pea
supplemented heifers had 10% lower ADG compared to DDGS supplemented heifers.
Economically, this means if DDGS is priced at or $124.58/ 909 kg DM a producer could
pay $2.89/ 27 kg, for field peas.
Variable sources of grazed forages are used in cattle backgrounding systems, but
in most systems metabolizable protein (MP) is limiting and rumen undegradable protein
(RUP) supplement can meet this deficiency. The first objective was to determine if RUP
is limiting and the second objective was to determine if highly digestible forages with
rapid passage rate allow some rumen degradable protein (RDP) to bypass the rumen. A
pooled analysis of growing cattle grazing forages demonstrated that average daily gain
(ADG) increased with increased RUP supplement received, with the exception of animals
grazing forages that were 17% crude protein (CP) or greater. A metabolism study

evaluating high and low quality forages showed lower intakes and digestibility values for
the lower quality forages. Rapid liquid passage rates suggest some degradable protein
could be leaving the rumen before degradation. Numerous digestibility markers were
used to evaluate markers in forage based diets.
Key words: RUP supplementation, forage digestibility, field peas, beef cattle

Acknowledgements
I would like to begin by thanking all my professors and mentors Drs. Andrea Watson,
Karla Jenkins, Terry Klopfenstein, Galen Erickson, Jim MacDonald, and Mary
Drewnoski. I am grateful for the opportunity to expand my knowledge in a field that I am
so passionate about. I also would like to thank all of my fellow graduate students that
have made these years some that I will never forget. The assistance in research has been
extremely valuable and the memories made will be some that I cherish.
I would also like to thank my family. The guidance I received as a child made me the
person I am today. I was always given opportunities to pursue my interests and was
encouraged to work hard during every endeavor I choose to embark on. My family has
been the single most supportive entity that I could count on during times of success and
failure. For this reason I am extremely grateful.
“Brothers and sisters, I do not consider myself yet to have taken hold of it. But one thing
I do: Forgetting what is behind and straining toward what is ahead, I press on toward the
goal to win the prize for which God has called my heavenward in Christ Jesus.”
Philippians 3:13-14

Table of Contents Chapter 1. Review of Literature ..................................................................................... 8
Introduction ..................................................................................................................... 8
Metabolizable Protein ................................................................................................... 10
Rumen Degradable Protein (RDP) ............................................................................ 12
Rumen Undegradable Protein (RUP) ........................................................................ 15
Bypass Soluble Protein .............................................................................................. 16
Measuring Rumen Undegradable Protein (RUP) ...................................................... 16
Forage Quality ............................................................................................................... 19
Protein Supplementation ............................................................................................... 23
Passage Rate .................................................................................................................. 26
Field Peas ...................................................................................................................... 28
Field Peas in Cattle Diets........................................................................................... 29
Conclusion ..................................................................................................................... 31
Literature Cited ............................................................................................................. 33
Chapter II. Economics of Field Pea Supplementation for Cattle Grazing Crested
Wheatgrass ........................................................................................................................ 39
Abstract ......................................................................................................................... 40
Introduction ................................................................................................................... 41
Materials and Methods .................................................................................................. 42
Animal Management ................................................................................................. 42
Pasture Management .................................................................................................. 43
Statistical & Economical Analysis ............................................................................ 43
Results ........................................................................................................................... 44
Cattle Performance .................................................................................................... 44
Economic Analysis .................................................................................................... 45
Implications ............................................................................................................... 46
Literature Cited ............................................................................................................. 47
Chapter III. Utilization of Forage Crude Protein and the Need for Rumen
Undegradable Protein Supplementation ........................................................................... 52
Abstract ......................................................................................................................... 53
Introduction ................................................................................................................... 54
Materials and Methods .................................................................................................. 55

Experiment 1.............................................................................................................. 55
Experiment 2.............................................................................................................. 60
Results ........................................................................................................................... 63
Experiment 1.............................................................................................................. 63
Experiment 2.............................................................................................................. 68
Literature Cited ............................................................................................................. 74

List of Tables and Figures
CHAPTER II.
Table 1. Performance of heifers grazing crested wheatgrass pastures supplemented with
whole field peas or distillers grains plus solubles………………………………………..49
Table 2. Economic value of field peas compared to DDGS……………………………..50
Figure 1. Performance of heifers supplemented with field peas or dry distillers grains plus
solubles while grazing crested wheatgrass pastures……………………………………..51
CHAPTER III.
Table 1. Pooled analysis papers, authors, and years……………………………………..77
Figure 1. Pooled response in ADG above the control calves to RUP supplement in 10
studies subdivided by initial BW………………………………………………………...78
Figure 2. Pooled response in ADG above the control calves to RUP supplement in 10
studies subdivided by grazed forage type………………………………………………..79
Figure 3. Pooled response in ADG above the control calves to RUP supplement in 10
studies subdivided by CP of grazed forage………………………………………………80
Table 2. Average dry matter, organic matter, and neutral detergent fiber intake of
treatments….......................................................................................................................81
Table 3. Feed nutrient analysis including NDF, ADF, and CP………………………......82
Table 4.1. Dry matter digestibility values using in-vitro, AIA, TiO2, and IADF as
markers………………………...…………………………………………………………83
Table 4.2. Organic matter digestibility values using in-vitro, AIA, TiO2, and IADF as
markers…………………………………………………………………………………...84
Table 4.3. Neutral detergent fiber digestibility values using AIA, TiO2, and IADF as
markers…………………………………………………………………………………...85

8
Chapter 1. Review of Literature
Introduction Protein is an essential part of every mammalian species. Protein is utilized for
muscle deposition and for energy within the animal. Feeding protein in most species is
relatively simple compared to feeding protein to ruminants. Most animals break down
protein into amino acids in the stomach and small intestine where it can be absorbed into
the portal vein and travel to the liver or peripheral tissue to be utilized or stored.
Ruminants, like cattle, have a much more complex system that takes place within the
rumen, an anaerobic environment, as well as the stomach and small intestine.
Protein that is broken down by the microbes within the rumen is known as rumen
degradable protein (RDP). These microbes utilize the dietary protein and energy to grow
and divide, which increases the concentration of microbes within the rumen. Some
microbes wash into the lower tract with the digesta and these are broken down in the
small intestine and amino acids are absorbed. The microbes that wash out are known as
microbial crude protein (MCP), in the NASEM (2016). Between 50 and 100% of MP
requirements are provided by digestible MCP (Wilkerson et al., 1993; Owens et al.,
2014). The remainder, especially in growing or lactating cattle is rumen undegradable
protein (RUP).
Rumen undegradable protein is utilized similar to protein in non-ruminants. This
bypass protein escapes the rumen without being degraded and re-synthesized into amino
acids by the microbes and is digested in the stomach and some in the small intestine as
well. Then RUP is absorbed as amino acids, along with the MCP and the total absorbed
amino acids are termed metabolizable protein. Many have debated calculations for RDP,

9
MCP, and RUP and recommendations have been given and given again, however, even
experts within the field do not fully understand how protein is utilized within the
ruminant. Many factors affect how dietary protein is digested and absorbed within the
digestive tract and research in this area is continuously improving our knowledge.
Forage quality is an important aspect to account for when attempting to maximize
performance of growing animals. Plants are comprised of two major parts, a completely
digestible core, known as cell solubles, and a partially digestible structural component,
known as the cell wall. As plants mature they become less digestible, as a result of
lignification of their cell walls. Cattle are very selective animals when they forage, but as
the grazing season progresses pastures change and force cattle to adapt. Producers can
affect forage quality and yield by managing their pastures with grazing systems and
timely fertilization application, however, environmental factors such as light intensity,
precipitation, and ambient air temperature also play an important role. An inevitable
outcome is a decline in available nutrients from forage for growing cattle late in the
grazing season, but this can be alleviated by supplementing protein in order to meet
requirements and maintain performance.
Understanding exactly how protein is utilized is crucial when formulating diets or
allocating supplements to grazing animals. As forage quality changes growing animals
may be deficient in protein. Supplementing the correct type of protein is an extremely
important economic decision. Studies have shown benefits of both RDP and RUP
supplementation dependent on the time of year and system in place.
Passage rate is another factor that plays a role in nutrient utilization. Ruminants
are unique in that they utilize a symbiotic relationship with microbes in their rumens to

10
extract nutrients from ingested feed. However, protein that can be digested and absorbed
in the gastrointestinal tract benefits the host animal to a larger degree. Passage rate
impacts how many available nutrients bypass the rumen before the microbes can utilize
them. Passage rate is affected by intake, forage:concentrate ratio, particle size and
density, and environmental temperature. Accounting for passage rate of different diets is
another challenging issue when determining nutrient utilization within a ruminant.
Field peas, a highly digestible legume, are grown in excess in parts of western
Nebraska. This excess is due to an increase in production and slow utilization due to
processing bottlenecks. Production has increased as a result of field pea’s popularity in
rotational cropping systems. Excess peas are available for cattle producers in that area,
which may help alleviate scarce byproduct availability. Peas provide adequate protein
and also energy, proving to be viable options in both growing and finishing diets. If
economics allow, cattle producers may help alleviate the overabundance of field pea
production.
Metabolizable Protein The best way to express protein requirements has been debated some, but
historically requirements have been expressed in terms of crude protein (NRC, 1984).
One main flaw of this system was that it assumed equal rumen degradation of all
feedstuffs, which led to improper calculations of absorbed protein (NRC, 1996). An
alternative system was needed to fix this issue, so the Subcommittee on Nitrogen Usage
in Ruminants (1985) proposed expressing protein requirements in terms of absorbed
protein which was accepted in the dairy industry in 1989 (NASEM, 2016). The beef
industry followed this new expression and it has become known as metabolizable protein.

11
The new system was designed to help producers feed cattle more efficiently, which
would reduce the environmental effects of producing meat and milk products by
decreasing excess nitrogen the animal does not retain (Broderick et al., 2010).
Metabolizable protein is the sum of dietary escape protein, also known as digestible RUP,
and digestible microbial protein (Wilkerson et al., 1993). Understanding that ruminant
animals have different requirements than just that of the host is a foundational part of the
metabolizable protein (MP) system. Microbes, which contribute to the protein supply for
the animal in the small intestine, have separate protein requirements that allow them to
grow (Lardy et al., 2004). However, determining the exact amount of both microbial
crude protein (MCP) that will be produced from a feedstuff and RUP in a feedstuff can be
challenging. Producers’ targeted MP supply may differ depending on the goal of the
operation and the particular animal they are attempting to feed. In general, animals that
are at or near maintenance can reach MP balance by supplying them with dietary RDP,
and thereby MCP in the small intestine. However, animals that are lactating or growing
will need to have additional dietary RDP and RUP supplied in order to maintain growth
and milk production (Klopfenstein et al., 1996). Determining the amount of RDP and
RUP in a diet is an important aspect in feeding cattle.
Several methods have been used for obtaining RDP and RUP values in feedstuffs.
The first method is to measure in vivo the amount of dietary protein that has bypassed the
rumen and enters the abomasum. The second method is to encapsulate a feedstuff in a
bag that is permeable to rumen microbes and measure the amount of protein that remains
after in situ ruminal incubation (Orskov et al., 1970). Both methods measure the amount
of RUP within a feedstuff. Measuring either RDP or RUP is a good way to determine the

12
unknown because crude protein (CP) is equal to the sum of RDP and RUP (NASEM,
2016). The in situ method is popular because it takes into account time of incubation,
which is correlated to passage rate, a variable factor depending on feedstuff, diet, intake,
and type of animal (Orskov et al., 1970).
Rumen Degradable Protein (RDP)
Rumen degradable protein is a source of protein that is degraded in the rumen by
the microbes that allows them to grow and divide (Klopfenstein et al., 1996; Lardy et al.,
2004). Rumen degradable protein is degraded in the rumen by bacteria, protozoa, and
fungi which produce volatile fatty acids (VFA) and ammonia (Kang-Meznarich et al.,
1981). These VFA’s can supply 70-85% of the energy that is absorbed and used by the
animal. The conversion of the diet to MCP is related to degradability of the feed,
ruminally available energy, and mean retention time in the rumen (Storm et al., 1983).
Microbial crude protein is the microbes that flow out of the rumen in the liquid fraction
or attached to feed particles and are available to be absorbed by the host animal. These
microbes that pass into the small intestine ultimately provide amino acids as the animal
digests and absorbs them across the small intestine epithelium (Stern et al., 2006). Also,
MCP can supply between half to nearly all of the MP the body needs to function (NRC,
1996). This is true for cattle that are at or near maintenance, with the exception of
growing cattle, which typically need to have some escape protein to supplement total MP
in the diet (Klopfenstein et al., 1996). Maximizing the growth of microbes in the rumen
can have huge impacts on growth of the host as well. Microbial crude protein is a
function of the flow of microbes out of the rumen that can be degraded and absorbed as
protein in the small intestine. As microbial activity within the rumen increases, MCP

13
supply and microbial nitrogen (N) flow to the small intestine both increase as well
(Wickersham et al., 2008).
Microbes need RDP in order to grow and reproduce in the rumen (Orskov et al.,
1970). The need for RDP by the microbes is a function of the amount of rumen digestible
energy. Energy actually drives the production of MCP as long as there is a sufficient
amount of RDP present (Klopfenstein et al., 1996). This means that synchronizing the
supply of nitrogen and energy (TDN) in the rumen will result in maximum RDP
utilization and optimal microbial growth rate (Chanjula et al., 2004); however, synchrony
is well coordinated by the ruminant animal. Ruminants have the ability to recycle
nitrogen throughout the body, which is evident due to the appearance of N between the
mouth and the small intestine (Wickersham et al., 2008). This process begins in the liver
where urea is produced from ammonia via the urea cycle and enters the blood to be
reused or is excreted into the urine (Wickersham et al., 2008). Depending on the demand
for recycled nitrogen, between 40-80% of the urea produced in the liver can reenter the
blood supply (Lapierre et al., 2001). When fermentable energy is present in the rumen the
urea can pass through the epithelial tissue or enter through the saliva and be converted
into ammonia (Reynolds et al., 2008). This ammonia can be used as a substrate by the
microbes along with energy to produce VFA’s and increase microbial activity. This
process is what allows synchronization of nitrogen and fermentable energy within the
rumen, which would normally not be present. This also allows producers to supplement
cattle infrequently and expect similar results while decreasing supplementation costs
dramatically (Bohnert et al., 2002). One issue with recycling is calculating if RDP
supplementation is needed to maximize MCP production.

14
Calculating MCP that is produced within the rumen is challenging because it
deals with total digestible nutrients (TDN) and RDP. Other factors also influence the
efficiency of the microbes such as passage rate, how fermentable the energy source is,
and where the digestion is taking place (Klopfenstein et al., 1996). An original model was
based off of a 10.4% efficiency multiplied by total digestible nutrients (TDN)
concentration. This model assumes that 52% of TDN is actually digested in the rumen, of
that 52% only one quarter produces MCP when sufficient nitrogen is available, and 80%
of the MCP is true protein, of which 80% is digestible and available to the host
(Burroughs et al., 1975). The 1996 NRC calculated MCP by assuming 13% of the TDN
was converted to MCP for diets containing over 40% forage. Diets containing under 40%
forage used a 2.2% reduction in MCP for each 1% decrease in effective neutral detergent
fiber (NDF) in the diet below 20% effective NDF (NRC, 1996). Research utilizing 66
treatment means from previously published papers led to a new equation. Forty papers
were used to develop the model and 26 were used to evaluate the model (Galyean and
Tedeschi, 2014). The Galyean and Tedeschi model and the 1996 NRC model appear to
model similar efficiency for low-quality forage diets and high concentrate diets, but they
were significantly different for growing diets. Currently the Beef Cattle Nutrient
Requirements Model (2016) uses the Galyean and Tedeschi (2014) equation of MCP =
0.087 TDNI + 42.73 or MCP = 0.096 FFTDNI + 55.33 (TDNI- total digestible nutrient
intake; FFTDNI- fat free total digestible nutrient intake). Overall, MCP is hard to
measure effectively and has significant consequences when measured incorrectly. The
consequence of using an incorrect efficiency when calculating MCP is under or
overestimating MP supply (NRC, 1996). This can lead to supplementing cattle when it is

15
unneeded or failing to supplement when needed, both of which are costly to operations
raising cattle.
The amount of MCP that contributes to MP that is absorbed is another
opportunity for error in calculating the protein the animal can utilize. The first main point
is to understand that feeding different sources of RDP will not result in large changes in
the protein quality that is absorbed as MCP. Furthermore the digestibility of the MCP is
constant regardless of source of RDP (Bergen et al., 1968). The value used for MCP
digestibility is 80% and only 80% of the nitrogen in MCP is true protein as well
(Burroughs et al., 1975). This means that of the MCP that makes it to the small intestine
only 64% (0.8 x 0.8 = 0.64) is actually converted into MP that is absorbed for use. This
means that ruminants fed low quality forages or non-protein nitrogen benefit from MCP
because the nutritive value is increased. However, if ruminants are fed high quality RDP
they actually are receiving less nutritive value relative to intake, which makes them less
efficient compared to non-ruminants (Dewhurst et al., 2000).
Rumen Undegradable Protein (RUP)
Rumen undegradable protein is protein that is not degraded in the rumen and is
available to be broken down in the small intestine (NASEM, 2016). This source of
protein may be a smaller portion of total MP, but can have impacts above and beyond
that of just supplying the host with MCP from the microbes (Klopfenstein et al., 1996).
Cattle that are growing or lactating show increasing performance from a diet containing
RUP (Klopfenstein et al., 2001; Buckner et al., 2013). RUP content of feeds, especially
forages, is not well established and, historically, digestibility of the RUP in the small
intestine has been overestimated (Mass et al., 1999; Buckner et al., 2013). Forages

16
typically have been known to provide mostly RDP and very little RUP to the diet
(Klopfenstein et al., 2001; Buckner et al., 2013). RUP in forages has been estimated to be
10-40% of the total CP (NRC, 1996). However, understanding the amount of RUP that
forages provide and the digestibility of the RUP is crucial to formulating a diet that
maximizes desired performance as the nutrient profile of the grass changes (Buckner et
al., 2013).
Bypass Soluble Protein
High quality forages are rapidly digested and have rapid rates of passage. They
are also high in CP, most of which is soluble and rapidly degraded in the rumen.
However some of the soluble protein may pass from the rumen due to rate of passage and
poor microbial utilization (Volden et al., 2002). Peptides, amino acids, and ammonia that
have been broken down by the microbes may flow out of the rumen prior to utilization by
the microbial population (Volden et al., 2002). This protein fraction is absorbed in the
small intestine similarly to RUP but is digested like RDP within the rumen. Volden et al.
(2002) conducted a study using pulse doses of long chain peptides (PLP), short chain
peptides (SP), and free fatty acids (FFA). Measurements of PLP, SP, and FFA showed
that they were not completely degraded in the rumen. This means that some soluble
protein was flowing out of the rumen prior to use by the microbes. Overall, predicting
MP supply is heavily dependent on correctly calculating the amount of soluble protein
that bypasses the rumen.
Measuring Rumen Undegradable Protein (RUP)
The ability to estimate total RUP in different forage sources is needed because
values are not well known or well estimated. The difficulty of estimating RUP is that
microbial N is also entering the small intestine and can falsify the N amounts that are
17
sometimes accounted for as RUP (Mass et al., 1999). Methods such as using total CP or
in-vitro dry matter digestibility (IVDMD) are a poor proxy of RUP (Buckner et al.,
2013). The method that has been previously accepted is using neutral detergent insoluble
nitrogen (NDIN) to estimate RUP. This method used first order disappearance, which
was thought to be incorrect due to the buoyancy of forage and the lack of constant
passage of material (Lamothe et al., 2003). Mass et al. (1999) set out to test if measuring
NDIN on forages that had been incubated in the rumen could correctly predict RUP with
or without microbial correction. Also their study was designed to improve the overall
procedure in order to be more exact with RUP predictions. The study looked at different
pools of nitrogen that included total residual nitrogen, microbial nitrogen, and NDIN.
Additionally it determined the effect of using different types of in situ bags, which
resulted in a non-significant difference. Lastly it took into account the degradability of
NDIN, which has been proven to be less than 100%. Results concluded that NDIN is the
best estimate of RUP and that correcting for digestibility of NDIN will give accurate
measures of RUP (Mass et al., 1999). Another aspect of RUP predictions takes into
account retention time in the rumen. This is affected to a great degree by a lag in passage,
due to buoyancy of the forage. This lag time is crucial to account for because it allows the
bacteria to attach to the forage, and if it isn’t accounted for it will cause RUP values to be
overestimated (Orskov et al., 1970.) The estimated lag time is 10 hours. Allowing bags to
incubate in the rumen for the total mean retention time (TMRT) will underestimate RUP.
This is related to the first order disappearance, which means that forage passes out of the
rumen at different time points as fermentation is occurring. A 75% TMRT produced RUP
values that were similar to fractional rates of degradation and passage, so that method has

18
been adopted (Lamothe et al., 2003). Once the RUP fraction of a forage or feedstuff is
determined the digestibility of RUP present needs to be calculated.
Rumen undegradable protein digestibility is extremely important to measure
because feed that is high in RUP does not always correlate to high MP from RUP. Some
forages that are high in RUP and low in RUP digestibility actually have very little MP
supplied to the animal (Buckner et al., 2013). Digestibility varies, but the 1996 NRC used
an assumption that all RUP was 80% digestible (NRC 1996). Haugen et al. (2006)
hypothesized RUP digestibility was overestimated for forages and conducted research to
test that hypothesis. Two forages were used and RUP was isolated in in situ bags by
using the previously discussed NDIN techniques. These bags were then placed in the
duodenum and digestibility of RUP was calculated by looking at indigestible protein that
is collected in the bags after passage in feces. These bags are washed in NDF solution to
remove microbial nitrogen. The nitrogen left in the bags was used to calculate
digestibility. Digestibility of the RUP in smooth brome grass and birdsfoot trefoil were
between 21.0-38.6% which proves that RUP contributing to MP was being overestimated
assuming 80% digestibility formerly used (Haugen et al., 2006). Another study that was
conducted looked at a wider array of forages and concluded that forage RUP digestibility
usually ranges between 25-60% of RUP (Buckner et al., 2013). Understanding the
amount of RUP in a feed and the digestibility in the small intestine is critically important
in determining the amount of MP that is supplied. Another important point is determining
how both of these change as forage matures throughout the growing season.
A study was conducted with smooth brome grass, subirrigated meadow, upland
native range, and warm-season grasses throughout the growing season. Samples were

19
collected from esophageally cannulated cows or ruminally cannulated steers throughout
the growing season and lab work was conducted to determine RUP and RUP digestibility.
Results showed that RUP increased and RUP digestibility decreased throughout the year.
This is a function of the plant maturing. These changes led to the total digested RUP as a
% of dry matter (DM) decreasing as forage matured. One experiment sampled
subirrigated meadow and upland native range using esophageally fistulated cows monthly
from May to September. Analysis showed RUP as a % of CP increasing from 13.6% to
20.0% over the sampling period, however, digested RUP as a % DM decreased from
0.75% to 0.21% due to a reduction in RUP digestibility from 41.8% to 10.8% (Buckner et
al., 2013). In another study, results showed a decrease in total MP supply from May to
September on range and meadow samples (Lamothe et al., 2003). This would indicate
that less protein would be degraded in the rumen and would lead to increased RUP,
however the maturity would decrease how digestible this escape protein is in the small
intestine as well.
Forage Quality Forages represent the predominant class of feed for beef cattle operations.
Mekonnen et al. (2019) estimated that 81% of beef cattle feed comes from either pasture
or harvested forages. However, differences in plant variety, maturity, and management
cause DM digestibility, CP, and palatability to vary greatly across forage types (Bohnert
et al., 2011). Plants are comprised of cells that contain two major parts. The outer portion
is known as the cell wall and is comprised of cellulose, hemicellulose, and lignin. This
section of the plant helps with structure and also protects the second portion known as the
cell contents or solubles. This inner portion is comprised of protein, minerals, soluble
carbohydrates, and starch which the plants use for growth and nutrition. Generally the

20
cell contents are almost completely digestible so differences in digestibility between
forages depend on amount and digestibility of the cell wall (Deinum, 1981). Lignin is
thought to be the main factor within the cell wall that reduces digestibility. Lignin is
considered indigestible and as plants mature lignification increases, therefore, plant
maturity and an increased lignin content lead to lower digestibility in forages (Van Soest,
1994).
Many factors influence the relative value of forages as a feed source for
ruminants, but two of the largest factors are forage species and stage of growth (Beever et
al., 1986). Three common categories of plants utilized by ruminants are legumes, C3
grasses, and C4 grasses. Overall C3, or cool season, grasses are more nutritious than C4, or
warm season, grasses because they have greater CP levels and lower carbon:nitrogen
(C:N) ratios (Barbehenn et al., 2004). As the grazing season progresses the plant matures
and CP levels and in vitro organic matter digestibility (IVOMD) decrease significantly
(Kirby and Parman, 1986). This decrease in CP and IVOMD is largely due to the shift in
leaf to stem ratio. Leaf blades can contain up to twice as much CP as the stem within the
same plant. Legumes have an increased leaf to stem ratio compared to other plant species
that cattle consume making them more nutritious throughout the grazing season (Buxton,
1996). As the plant begins to transition from a vegetative state to a reproductive state the
leaf to stem ratio declines. Also, as the plant matures CP declines more rapidly in the
stem than in the leaves leading to a lower overall nutrient supply for the animals
consuming mature plants later in the grazing season (Griffin and Jung, 1983). Maturation
of plants also leads to a decrease in digestibility of both stems and leaves. Leaf
digestibility decreases at a slower rate than stem digestibility, likewise legumes are more
21
digestible compared to grasses even when they are mature (Buxton, 1996). Grazing
animals are very selective on which plants they eat, often they choose to eat the more
vegetative plants because they benefit the animal due to an increased nutrient intake
(Anderson et al., 1988). Selectivity of animals is due in part to nutrient uptake and
digestibility, but animals also learn to be selective based on palatability, which isn’t well
understood, but is somewhat correlated to more nutrient rich feed sources (Baumont et
al., 2000). Availability of forage also affects selectivity. Cattle select forage based on
available biomass of individual grass types within a pasture. This response was observed
by Willms and Rode (1998) when cattle selected taller standing grass over foraging for
shorter grass types, especially during times of snow fall.
Forage quality and yield can be affected by many management and environmental
factors. Maturity of the plant influences quality more than any other single factor;
however, environmental factors also play a key role (Buxton, 1996). Grazing systems can
influence nutritive value of grasslands for years to come. More intensive grazing systems
lead to increases in both CP and digestibility of forage resources because plants remain in
the vegetative state throughout a longer period of the gazing season. Also intensive
grazing can lead to a more productive piece of land in terms of total forage yield (Pavlu
et al., 2006). Fertilization is another way that both CP and yield can be increased in
forage sources (Buxton, 1996). Water stress affects both the yield and the quality of
plants. Quality of plants increases during times of drought, but yield decreases (Deinum,
1981). The increase in digestibility and CP of the stems of the plant is believed to be
attributed to a slower maturation of the plant itself and also a reduction in cell wall
formation. Stem to leaf ratio is also increased in water deficient plants mostly due to a

22
decrease in stem length, which plays a role in the lower yield (Halim et al., 1989). Light
intensity also plays a key role in forage yield and quality, but has no significant effect on
digestibility. Greater light intensity increases yield and soluble carbohydrates within the
forage, but it also decreases total CP. This relationship is explained by an increase in
photosynthesis, which is caused by the high light intensity, resulting in increased growth
of the forage and more storage of carbohydrates. The plant uptake of nitrogen is limited
by the available nitrogen in the soil and causes the CP of the forage to decrease due to
more total yield of forage with relatively little change in uptake of nitrogen. Low light
intensity causes the opposite change in forage sources yield and CP amounts. These
forages yield less total mass, but are known for increased nutrient densities due to the
lower distribution across the forage and relatively unchanged uptake from the soil
(Deinum, 1981). Temperature may have the largest impact on forage quality and
influences both yield and digestibility significantly (Buxton, 1996). Greater temperatures
lead to a decrease in digestibility due to increase in lignification. Stems are affected at a
greater rate than leaves, which are not structural in nature, and also grasses have a greater
decrease in digestibility compared to legumes. The increased temperature leads to an
increase in photosynthesis and causes the cellular components to be converted to
structural components at a greater rate. This leads to an increase in forage yield, but
decreased forage quality due to lower protein in the entire plant (Van Soest, 1994). As a
whole environmental factors are often highly correlated and play a large role in the
quantity and quality of forage available for use by cattle. For instance, high light
intensity, high temperatures, and water stress frequently occur simultaneously and can all
influence growth and characteristics of the plants that are available. It is difficult in

23
nature to point out what exactly is impacting the forage when all of these factors are
playing a role (Deinum, 1981). One thing that is well known is that as available nutrients
in forage decline during the grazing period animals may need additional supplementation
in order to meet nutrient requirements for growth and lactation.
Protein Supplementation Backgrounding systems often use grazed forages to produce yearling cattle, target
higher prices at the sale barn, and also ensure a constant supply of finished cattle for
packing plants (Gillespie-Lewis et al., 2016). Providing protein supplementation in
differing amounts is one way to target different end points, which allows producers to
maximize profits. Protein supplementation has been shown to enhance forage utilization
and increase livestock performance while grazing (Beaty et al., 1994). Delivering
supplements in cubes, on the ground, or in troughs, with or without ample room for
animals, changes the amount individual animals consume (Bowman and Sowell, 1997).
The majority of the protein associated with forages is broken down rapidly and
utilized by rumen microbes for growth. This protein is known as RDP. This rapidly
degraded protein found in growing forages is often not enough to meet the MP
requirements of growing calves that are grazing forages (Creighton et al., 2003). Small
amounts of protein escape the rumen and are available for digestion in the small intestine,
however digestibility of this escape protein, or RUP, differs among plants (Klopfenstein
et al., 2001). Understanding that very little RUP is available in forages that are being
grazed means that RUP may be the first limiting nutrient that calves need to increase
growth (Creighton et al., 2003). Anderson et al. (1988) set up an experiment with 0.11,
0.23, and 0.34 kg/d of RUP. The supplement was an equal-protein-basis mix of corn

24
gluten meal and bloodmeal and 15% molasses. A linear response in average daily gain
(ADG) was observed above an energy control supplement when steers were grazing
smooth brome grass pastures ranging from 10.4-13.4% CP. Cattle that received no
supplement gained 0.89 kg/d compared to cattle receiving 0.34 kg/d of RUP gained just
over 1.00 kg/d. Karges et al. (1992) conducted a study near Whitman, NE looking at both
RDP and RUP supplementation to cattle grazing summer native range. Supplements
included a negative control that received no supplement, an energy control that received
no protein but equal amounts of energy and 3 treatments of RDP and RUP. Low,
medium, and high RDP treatments provided 0.15, 0.27, and 0.37 kg/d of RDP,
respectively, and consisted of cornstarch, molasses, corn steep liquor, and urea. Low,
medium, and high RUP treatments provided 0.07, 0.14, and 0.21 kg/d of RUP,
respectively, and consisted of cornstarch, molasses, corn steep liquor, urea, soybean
meal, and feather meal. These treatments contained 75% RUP and 25% RDP. This forage
ranged from 9.0-14.1% CP and results of this study showed a linear improvement in
ADG from 1.02 to 1.10 kg/d with greater amounts of RUP supplementation, which
agreed with the Anderson et al. (1988) work. Cattle that received no supplement gained
0.96 kg/d, cattle on the energy control gained 1.02 kg/d, RDP supplementation created a
quadratic response with 1.06, 1.04, and 0.96 kg/d as supplementation increased. Smooth
brome grass is a cool season grass and summer native range is primarily warm season
grasses which demonstrates that both forage types may be unable to provide the total MP
that growing cattle require. Utilizing RUP sources such as distillers grains is a great way
to make up the balance that the forage source cannot provide. However, as supplement
increases animals will begin to replace forage intake with supplement intake. Griffen et

25
al. (2012) observed a 0.5 to 1.0 kg reduction in forage intake for every kg of dry distillers
grains plus solubles that was supplemented. Supplementing distillers grains to growing
cattle grazing forages, on average, will increase both final body weight (BW) and ADG.
Supplementing RDP sources, especially on low quality forages, has been
evaluated as well. Hafley et al. (1993) found that RUP supplementation resulted in no
difference in performance of yearlings grazing 12.0% CP and 48.6% DMD forage source
compared to an energy control treatment. However, supplementing RDP tended to
increase gains over the energy control treatment. This response to RDP supplementation
is based on an increase in forage utilization in the rumen. Lardy et al. (1999) found that
summer calving cows grazing native range during the breeding season lost less weight
and maintained condition score when supplemented with RDP over cows that received no
supplement or an energy supplement. Also performance did not differ from cows
receiving a RDP plus RUP supplement. Performance of calves was greatest for the RDP
and RDP plus RUP supplemented cows as well.
Differing supplement delivery is another way to alter performance and
economics. Beaty et al. (1994) found that supplementing pregnant cows daily or 3 times
per week had little to no effect on performance, but reduced input costs of the system.
Cattle that are supplemented daily show signs of reduced grazing as they anticipate the
delivery of supplement, this behavior is not observed when supplement is delivered less
frequently (Melton and Riggs, 1964). Musgrave et al. (2012) showed a reduction in
performance of cattle supplemented on the ground compared to those supplemented in
bunks. This reduction in response is believed to be due to 36-41% of the DDGS offered

26
being wasted. Wasted supplement can become a concern, especially when a producer is
supplementing large numbers of cattle.
Passage Rate Animals that are consuming primarily forage based diets have a unique rumen
environment. This environment is comprised of three distinct phases which are a liquid
phase, a solid floating mat phase, and smaller solid particles that are found in the liquid
phase (Vieira et al., 2008). Liquid and solid phases pass at different rates, so research
focused on digesta movement attempts to account for each phase independently (Uden et
al., 1980). Although passage rate is difficult to measure it is extremely important for
several reasons, one of which is because it influences voluntary feed intake to a large
degree, especially when forage comprises the majority of an animal’s diet and gut fill
limits intake (Bartocci et al., 1997). Passage rate is influenced by intake,
forage:concentrate ratio, particle size and density, and environmental temperature
(Bartocci et al., 1997). Passage rate is increased as intake increases and an assumption
that increased passage rate leads to a reduction in digestibility has been generally
accepted within the cattle world (Balch, 1950; Colucci et al., 1982). Depressions in
forage digestibility at faster passage rates are due to a reduction in mastication and a
shorter rumen fermentation period (Colucci et al., 1982). Diets containing different levels
of forage, concentrate, and liquid have different rates of passage throughout the tract.
Forage, in general, has a longer retention time than concentrate (Colucci et al., 1982).
Temperature is a complex factor that has been shown to effect passage rate. As cattle are
exposed to increased ambient temperatures their bodies attempt to maintain thermal
neutral conditions by limiting intake, especially fiber, thereby reducing heat of
fermentation. This reduction in intake reduces passage rate in an attempt to increase

27
digestibility and secure needed nutrients (Bernabucci et al., 1999). Passage rate
undoubtedly has an effect on protein degradation, cell wall digestion, and microbial
efficiency (Huhtanen and Kukkonen, 1995). The effects passage rate has on how protein
is broken down in the ruminant animal can lead to changes in total MP supplied to the
host. Passage rate affects the amount of protein that is available for microbial use, which
leads to differences in the amount of protein available for host digestion that is not MCP.
(Orskov and McDonald, 1970). When protein that is available in the rumen flows out
prior to microbial fermentation the host animal is able to break it down and absorb it
through the small intestine. This path of uptake changes the amount of MP supplied to the
animal depending on the amino acid (AA) profile of the protein. Essential amino acids
(EAA) are required to be consumed or produced outside of the host animal (Merchen and
Titgemeyer, 1992). Microbes supply ruminants with some EAA, but this leads to other
limiting AA that can reduce growth of animals. When only MCP is supplied methionine,
lysine, and threonine are the first three limiting AA, in that order (Merchen and
Titgemeyer, 1992). Protein sources that supply these AA are high quality protein because
they meet the EAA requirement and help increase growth. However, microbes can utilize
both good and bad quality protein to produce more MCP, which is why AA entering the
small intestine vary in quantity and quality when compared to AA intake (Merchen and
Titgemeyer, 1992). Good quality proteins are more beneficial to the animal when they
bypass microbial use and are absorbed into the small intestine as AA (Menke et al.,
1979). Understanding exactly how the animal is utilizing protein within the digestive
tract is crucial to understand total MP supplied, which is what dictates the necessity of
supplementation.

28
Field Peas Field pea production in the United States has increased dramatically in recent
years (Fendrick et al., 2005). In 2011 around 146,000 hectares were planted and in 2016
just over 513,000 hectares were allocated to field pea production (NASS, 2016). Field
peas are primarily grown for human consumption; however, grain that fails to meet
specifications for human consumption can be used for livestock feed (Birkelo et al.,
2000; Loe et al., 2003; Lardy et al., 2009; Fendrick et al., 2005). Entry into the human
consumption market is limited by slow processing equipment and also a high standard
that the grain must meet. Recent increases in production of field peas are largely due to
the benefits for subsequent harvest of crops in a rotational system. Rotational systems are
becoming more popular in order to reduce the amount of engineered inputs by selecting
ecological processes that target desired results (Liebman and Dyck, 1993). Generally
peas are grown in a rotational system with other crops such as wheat or barley. One
benefit is that peas help minimize the reliance on purchased fertilizers by fixing nitrogen
in the soil (Anderson et al., 2007; Jenkins et al., 2011). Also rotational systems help
reduce the prevalence of weeds while reducing the need for herbicides, which leads to an
increase in crop production (Liebman and Dyck, 1993). Field peas also offer benefits like
pest control due to the fact that they are not hosts to some pests that can destroy fields of
barley or wheat. Studies have shown that planting non-host crops can greatly reduce the
incidence of these pests in following years (Allen et al., 1970). Overall utilizing peas in a
rotational system helps increase yields of other crops and decreases inputs compared to
planting monocultures every year.

29
Field Peas in Cattle Diets
Field peas are a highly digestible legume and are rapidly fermented in the rumen
similar to other cereal grains (Reed et al., 2004). Field peas contain 20-28% CP and
around 44% starch, compared to dry rolled corn which contains around 72% starch
(Fendrick et al., 2005;NASEM, 2016). Starch fermentation rate is similar to corn, but is
slower than both barley and wheat (Anderson et al., 2007). Finishing diets show no
difference in performance of cattle fed whole field peas or dry rolled field peas, which
suggests that processing is an unnecessary step when utilizing peas (Fendrick et al.,
2005). The protein fraction in peas is highly degradable (Mustafa et al., 1998) and RDP
can be as high as 73.0% of total CP when using in situ bags to determine protein
degradation (Aufrere et al., 1994). Estimates for RDP range from 65.0-73.0% of CP,
making RUP anywhere from 27.0-35.0% (Anderson et al., 2007; Greenwell et al., 2018).
Greenwell et al. (2018) used in situ bags to determine RUP content of field peas and also
RUP digestibility. This study showed field peas contain 30-35% RUP as a percent of CP
and 97.4-98.9% RUP digestibility. The nutrient profile of peas is comparable to other
cereal grains making them a viable option in cattle diets.
Field peas have been studied in several performance studies ranging from creep
feeding to finishing diets and comparing field peas to more traditional protein sources or
cereal grains. Utilizing field peas in creep feed replacing wheat middlings did not result
in any differences in ADG; however, unless intake was restricted by salt greater
inclusions of field peas led to an increase in dry matter intake (DMI; Gelvin et al., 2004).
Other studies showed that ADG was not different when peas were included at 33% or
67% of the creep feed with the remainder being wheat middlings, and that intake did not
differ between treatments (Anderson, 1999; Landblom et al., 2000). In receiving diets
30
when field peas replaced 12% corn and 9% canola oil ending BW was greater, DMI was
greater, but there were no differences in ADG or gain to feed (G:F) compared to the
control diet (Gilbery et al., 2007). In another study replacing DDGS, wheat middlings,
and barley malt with 20% field peas in a receiving diet resulted in no difference in
receiving performance or finishing performance, but net returns were increased from
$8.90 to $13.23 per head in favor of the field pea receiving ration (Landblom et al.,
2007). In a third growing study no differences in DMI were observed, but an increase in
VFA concentration and a lower mean pH were observed when peas replaced corn at
increasing levels up to 50% of the total diet. Diets that contained 50% dry rolled corn and
no field peas had a mean pH of 6.68 and when corn was completely replaced with field
peas the mean pH dropped to 6.62. The change in mean pH coupled with the increase in
VFA concentration indicates that peas were rapidly fermented and utilized by the
microbes and were a suitable replacement for corn (Reed et al., 2004). A study looking at
performance differences when a 70.8% corn, 24% condensed distillers solubles, and
5.2% urea supplement versus field peas were supplemented at 0.5% of BW to growing
cattle grazing crested wheat grass showed a reduction in ADG from 0.99 to 0.87 kg/d and
a lower ending BW for the field pea treatment. However, performance of the same cattle
during the finishing phase resulted in a tendency (P=0.07) for field pea supplemented
cattle to have a greater ADG. A tendency (P=0.07) for lower hot carcass weight (HCW)
was also reported for the field pea supplemented cattle when compared to the soluble
supplemented cattle with 394 kg and 403 kg HCW, respectively. However, replacing
20% DRC in the finishing diet with field peas resulted in no difference in ADG or HCW
(Greenwell et al., 2018). Replacing dry rolled corn (DRC) with 15%, 30%, or 45%

31
inclusion of field peas resulted in no difference in performance for lambs fed finishing
diets. In another study, DRC was replaced with field peas at 10% of the diet and there
were no differences in performance of finishing cattle or carcass characteristics at the
plant. In this study, whole field peas were also compared to rolled field peas and there
were no differences in performance based on processing method. This study concluded
that peas are a suitable replacement for DRC (up to 10% of diet DM) and there is no
benefit from processing the field peas (Birkelo et al., 2000). Another study showed
replacing DRC with field peas at 10%, 20%, and 30% of the diet resulted in no
performance or carcass differences, however greater inclusion of peas increased overall
desirability and flavor of the beef (Jenkins et al., 2011.) Overall field peas seem to be a
viable option for replacing other cereal grains in creep feeds, receiving diets, and also in
finishing diets without having detrimental effects on performance, and in some cases may
improve economics depending on price procurement of peas.
Conclusion In conclusion, protein work in grazing cattle is challenging due to the fact that
cattle feeders are essentially supplying two creatures protein that each use at different
efficiencies. The metabolizable protein system does a fairly adequate job of allowing
producers to maximize protein utilization by understanding RDP and RUP requirements.
However, the need for research in protein is still great. Values for both RDP and RUP are
difficult to calculate because many factors affect actual MP supply. Passage rate, nitrogen
recycling, and energy availability are all key components that impact the amount of RDP
being converted into MCP. Values for the amount of RUP that can be absorbed as MP
depend heavily on RUP digestibility and passage rate.
32
A greater supply of field peas than current markets can support has led to interest
in using field peas as cattle feed. Field peas have been shown to be beneficial in both
growing and finishing cattle diets. The nutrient profile of field peas has led to interest in
using them as a supplement for growing cattle. The objective of my first study was to
compare DDGS and field peas as grazing supplements for growing cattle. This study is
designed to look at performance and economics of field peas compared to a well-known
product that has an established price and market.
The lack of research and difficulty calculating RDP and RUP values has led to my
second study, which will look at passage rate, protein utilization, and digestibility. The
objective is to determine passage rate of different forages, which will increase accuracy
in RDP and RUP values. A better understanding of where in the digestive tract forages
are broken down will allow producers to supplement only what cattle actually need in
order to meet a desired production level. This exact supplementation will ultimately lead
to less environmental impact and also an increased economic savings for producers.

33
Literature Cited Allen, M. W., W. H. Hart, and K. Baghott. 1970. Crop rotation controls barley root-knot
nematode at Tulelake. Calif. Agri. 24:4-5
Anderson, S. J., T. J. Klopfenstein, and V. Wilkerson. 1988. Escape Protein
Supplementation of Yearling Steers Grazing Smooth Brome Pastures. J. Anim.
Sci. 66:237-242.
Anderson, V. I. 1999. Field peas in creep feed for beef calves. NDSU Carrington Res.
Ext. Center Beef and Bison Field Day Proc. 22:1-4.
Anderson, V., G. Lardy, and B. Ilse. 2007. Field Pea Grain for Beef Cattle. NDSU
Extension Service. 1-5.
Aufrere, J., D. Graviou, and B. Michalet-Doreau. 1994. Degredation in the rumen of
protein of 2 legumes; soybean meal and field pea. Reprod. Nutr. Dev. 34:483-490.
Balch, C. C. 1950. Factors Affecting the Utilization of Food by Dairy Cows. National
Institute for Res. Dairying. 361-388.
Barbehenn, R. V., Z. Chen, D. N. Karowe, and A. Spickards. 2004. C3 grasses have
higher nutritional quality than C4 grasses under ambient and elevated atmospheric
CO2. Global Change Biology. 10:1565-1575.
Bartocci, S., A. Amici, M. Verna, S. Terramoccia, and F. Martillotti. 1997. Solid and
fluid passage rate in buffalo, cattle and sheep fed diets with different forage to
concentrate ratios. Livestock Prod. Sci. 52:201-208.
Baumont, R., S. Prache, M. Meuret, and P. Morand-Fehr. 2000. How forage
characteristics influence behavior and intake in small ruminants: a review.
Livestock Production Services. 64:15-28.
Beaty, J. L., R. C. Cochran, B. A. Lintzenich, E. S. Vanzant, J. L. Morrill, R. T. Brandt,
Jr., and D. E. Johnson. 1994. Effect of Frequency of Supplementation and Protein
Concentration in Supplements on Performance and Digestion Characteristics of
Beef Cattle Consuming Low-Quality Forages J. Anim. Sci. 72:2475-2486.
Beever, D. E., H. R. Losada, S. B. Cammell, R. T. Evans, and M. J. Haines. 1986. Effect
of forage species and season on nutrient digestion and supply in grazing cattle.
British J. of Nutr. 56:209-225.
Bergen, W. G., D. B. Purser, and J. H. Cline. 1968. Effect of Ration on the Nutritive
Quality of Rumen Microbial Protein. J. Anim. Sci. 27:1497-1501.
Bernabucci, U., P. Bani, B. Ronchi, N. Lacetera, and A. Nardone. 1999. Influence of
Short- and Long-Term Exposure to a Hot Environment on Rumen Passage Rate
and Diet Digestibility by Friesian Heifers. J. Dairy Sci. 82:967-973.
Birkelo, C. P., B. J. Johnson, and B. D. Rops. 2000. Field Peas in Finishing Cattle Diets
and the Effect of Processing. South Dakota Beef Report, 2000. Paper 5

34
Bohnert, D. W., C. S. Schauer, M. L. Bauer, and T. DelCurto. 2002. Influence of rumen
protein degradability and supplementation frequency on steers consuming low-
quality forage: Site of digestion and microbial efficiency. J. Anim. Sci. 80:2967-
2977.
Bohnert, D. W., T. DelCurto, A. A. Clark, M. L. Merrill, S. J. Falck, and D. L. Harmon.
2011. Protein supplementation of ruminants consuming low-quality cool- and
warm-season forage: Differences in intake and digestibility. J. Anim. Sci.
89:3707-3717.
Broderick, G. A., P. Huhtanen, S. Ahvenjarvi, S. M. Reynal, and K. J. Shingfield. 2010.
Quantifying ruminal nitrogen metabolism using the omasal sampling technique in
cattle A meta-analysis. J. Dairy Sci. 93:3216-3230.
Bowman, J. G. P. and Sowell, B. F. 1997. Delivery Method and Supplement
Consumption by Grazing Ruminants: A Review. J. Anim. Sci. 75:543-550.
Buckner, C. D., T. J. Klopfenstein, K. M. Rolfe, W. A. Griffin, M. J. Lamothe, A. K.
Watson, J. C. MacDonald, W. H. Schacht, and P. Schroeder. 2013. Ruminally
undegradable protein content and digestibility for forages using the mobile bag in
situ technique. J. Anim. Sci. 91:2812-2822.
Burroughs, W., D. K. Nelson, and D. R. Mertens. 1975. Protein Pyhsiology and Its
Application in the Lactating Cow: The Metabolizable Protein Feeding Standard. J.
Anim. Sci. 41:933-944.
Buxton, D. R. 1996. Quality-related characteristics of forages as influenced by plant
environment and agronomic factors. Anim. Feed Sci. Tech. 59:37-49.
Chanjula, P., M. Wanapat, C. Wachirapakorn, and P. Rowlinson. 2004. Effect of
Synchronizing Starch Sources and Protein (NPN) in the Rumen on Feed Intake,
Rumen Microbial Fermentation, Nutrient Utilization and Performance of
Lactating Dairy Cows. J. Anim. Sci. 17:1400-1410.
Colucci, P. E., L. E. Chase, and P. J. Van Soest. 1982. Feed Intake, Apparent Diet
Digestibility, and Rate of Particulate Passage in Dairy Cows. J. Dairy Sci.
65:1445-1456.
Creighton, K. W., C. B. Wilson, T. J. Klopfenstein, and D. C. Adams. 2003.
Undegradable intake protein supplementation of compensating spring-born steers
and summer-born steers during summer grazing. J. Ani. Sci. 81:791-799.
Deinum, B., 1981. The Influence of Physical Factors on the Nutrient Content of Forages.
Mededelingen Landbouwhogeschool, Wageningen, The Netherlands.
Dewhurst, R. J., D. R. Davies, and R. J. Merry. 2000. Microbial protein supply from the
rumen. Anim. Feed Sci. and Tech. 85:1-21.
Fendrick, E. M., I. G. Rush, D. R. Brink, G. E. Erickson, D. D. Baltensperger. 2005.
Effects of Field Peas in Beef Finishing Diets. Nebraska Beef Cattle Reports. 161

35
Galyean, M. L., and L. O. Tedeschi. 2014. Predicting microbial protein synthesis in beef
cattle: Relationship to intakes of total digestible nutrients and crude protein. J.
Anim. Sci. 92:5099-5111.
Gelvin, A. A., G. P. Lardy, S. A. Soto-Navarro, D. G. Landblom, and J. S. Caton. 2004.
Effect of field pea-based creep feed on intake, digestibility, ruminal fermentation,
and performance by nursing calves grazing native range in western North Dakota.
J. Anim. Sci. 82:3589-3599.
Gilbery, T. C., G. P. Lardy, S. A. Soto-Navarro, M. L. Bauer, and V. L. Anderson. 2007.
Effect of field peas, chickpeas, and lentils on rumen fermentation, digestion,
microbial protein synthesis, and feedlot performance in receiving diets for beef
cattle. J. Anim. Sci. 85:3045-3053.
Gillespie-Lewis, K. L, B. L. Nuttleman, J. D. Volesky, G. E. Erickson, T. J. Klopfenstein,
J. C. MacDonald, and A. K. Watson. 2016. Case Study: Distillers grains
supplementation in a forage system with spayed heifers. Prof. Anim. Scientist.
32:357-367.
Greenwell, H. L., K. H. Jenkins, and J. C. MacDonald. 2018. Evaluating field peas as an
energy source for growing and finishing beef cattle. Pro. Anim. Sci. 34:202-209.
Greenwell, H. L., J. L. Gramkow, M. L. Jolly-Breithaupt, J. C. MacDonald, and K. H.
Jenkins. 2018. Effects of field pea supplementation on digestibility and rumen
volatile fatty acid concentrations of beef-cattle diets containing high and low
quality forages. Prof. Anim. Sci. 34:631-634.
Griffin, J. L. and G. A. Jung. 1983. Leaf and Stem Forage Quality of Big Bluestem and
Switchgrass. Agron. J. 75:723-726.
Griffin, W. A., V. R. Bremer, T. J. Klopfenstein, L. A. Stalker, L. W. Lomas, J. L.
Moyer, and G. E. Erickson. 2012. A meta-analysis evaluation of supplementing
dried distillers grains plus solubles to cattle consuming forage-based diets. Prof.
Anim. Scientist. 28:306-312.
Hafley, J. L., B. E. Anderson, and T. J. Klopfenstein. 1993. Supplementation of growing
cattle grazing warm-season grass with proteins of various ruminal degradabilities.
J. Anim. Sci. 71:522-529.
Halim, R. A., D. R. Buxton, M. J. Hattendorf, and R. E. Carlson. 1989. Water-Stress
Effects on Alfalfa Forage Quality After Adjustment for Maturity Differences.
Agron. J. 81:189-194.
Haugen, H. L., S. K. Ivan, J. C. MacDonald, and T. J. Klopfenstein. 2006. Determination
of undegradable intake protein digestibility of forage using the mobile nylon bag
technique. J. Anim. Sci. 84:886-893
Huhtanen, P. and Kukkonen, U. 1995. Comparison of methods, markers, sampling sites
and models for estimating digesta passage kinetics in cattle fed at two levels of
intake. Anim. Feed Sci. and Tech. 52:141-158.

36
Jenkins, K. H., J. T. Vasconcelos, J. B. Hinkle, S. A. Furman, A. S. de Mello Jr., L. S.
Senaratne, S. Pokharel, and C. R. Calkins. 2011. Evaluation of performance,
carcass characteristics, and sensory attributes of beef from finishing steers fed
field peas. J. Anim. Sci. 89:1167-1172.
Kang-Meznarich, J. H., and G. A. Broderick. 1981. Effects of Incremental Urea
Supplementation of Ruminal Ammonia Concentration and Bacterial Protein
Formation. J. Anim. Sci. 51:422-431
Karges, K. K., T. J. Klopfenstein, V. A. Wilkerson, and D. C Clanton. 1992. Effect of
Ruminally Degradable and Escape Protein Supplements on Steers Grazing
Summer Native Range. J. Anim. Sci. 70:1957-1964.
Kirby, D. R. and M. Parman. 1986. Botanical Composition and Diet Quality of Cattle
Under a Short Duration Grazing System. J. of Range Mang. 39:509-512.
Klopfenstein, T.K. 1996. Need for escape protein by grazing cattle. Animal Feed Science
Technology. 60:191-199
Klopfenstein, T. K., R. A. Mass, K. W. Creighton, and H. H. Patterson. 2001. Estimating
forage protein degradation in the rumen. J. Anim. Sci. 79:E208-E217.
Landblom, D. G., W. W. Poland, and G. P. Lardy. 2000. Application of salt-limited
pea/weat midds creep diets in southwestern North Dakota. N. Dakota Cow/Calf
Conference and Beef Cattle Range and Res. Rep. 8-12.
Landblom, D. G., D. K. Olson, and C. J. Wachenheim. 2007. Effect of Field Pea and
Flaxseed Inclusion in Receiving Calf Diets and Carryover Effect on Finishing
Performance, Immune Response, Carcass Quality, and Economics. Amer. Soc. Of
Anim. Sci. 58
Lamothe, M, T. J. Klopfenstein. 2003. Estimation of Rumen Undegradable Protein in
Forages by Using Neutral Detergent Insoluble Nitrogen at a Single In Situ
Incubation Time Point. Nebraska Beef Report. 2003:80-83
Lapierre, H., and G. E. Lobley. 2001. Nitrogen Recycling in the Ruminant: A Review. J.
Dariy Sci. 84:E223-E236.
Lardy, G. P., D. C. Adams, T. J. Klopfenstein, and H. H. Patterson. 2004. Building beef
cow nutritional programs with the 1996 NRC beef cattle requirements model. J.
Anim. Sci. 82:E83-E92.
Lardy, G. P., B. A. Loken, V. L. Anderson, D. M. Larson, K. R. Maddock-Carlin, B. R.
Ilse, R. Maddock, J. L. Leupp, R. Clark, J. A. Paterson, and M. L. Bauer. 2009.
Effects of increasing field pea (Pisum sativum) level in high-concentrate diets on
growth performance and carcass traits in finishing steers and heifers. J. Anim. Sci.
87:3335-3341.
Liebman, M., and Dyck, E. 1993. Crop Rotation and Intercropping Strategies for Weed
Management. Ecological App. 3:92-122.

37
Loe, E. R., M. L. Bauer, G. P. Lardy, J. S. Caton, and P. T. Berg. 2003. Field Pea (Pisum
sativum) inclusion in corn-based lamb finishing diets. Small Rum. Res. 53:39-45.
Mass, R. A., G. P. Lardy, R. J. Grant, T. J. Klopfenstein. 1999. In Situ Neutral Detergent
Insoluble Nitrogen as a Method for Measuring Forage Protein Degradability. J.
Anim. Sci. 77:1565-1571
Mekonnen, M. M., C. M. U. Neale, C. Ray, G. E. Erickson, and A. Y. Hoekstra. 2019.
Changes in the water productivity of livestock products in the US from 1960 to
2016. Trans. Science. Submitted.
Melton, A. A. and Riggs, J. K. 1964. Frequency of Feeding Protein Supplement to Range
Cattle. Texas Agric. Exp. Stn. Bull. B-1025 College Station.
Menke, K. H., L. Raab, A. Salewki, H. Steingass, D. Fritz, and W. Schneider. 1979. The
estimation of the digestibility and metabolizable energy content of the ruminant
feedingstuffs from the gas production when they are incubated with rumen liquor
in vitro. J. Agric. Sci. 93:217-222.
Merchen, N. R. and Titgemeyer, E. C. 1992. Manipulation of Amino Acid Supply to the
Growing Ruminant. J. Anim. Sci. 70:3238-3247.
Musgrave, J. A., L. A. Stalker, T. J. Klopfenstein, and J. D. Volesky. 2012. Comparison
of Feeding Dry Distillers Grains in a Bunk or on the Ground to Cattle Grazing
Subirrigated Meadow. Neb. Beef Rep. 667.
Mustafa, A. F., D. A. Christensen, and J. J. McKinnon. 1998. Effects of moist heat
treatment on crude protein composition and degradability of field peas. Can. J.
Anim. Sci. 78:453-456.
NASEM (National Academics of Science, Engineering, and Medicine). 2016. Nutrient
Requirements of Beef Cattle, Eighth revised edition, Washington, D.C.: The
National Academics Press
NRC. 1984. Nutrient Requirements for Cattle, 6th Ed. Washington, DC: National
Academy Press.
NRC. 1996. Nutrient Requirements for Cattle, 6th Rev. Ed. Washington, DC: National
Academy Press.
Orskov, E. R., I. McDonald. 1970. The estimation of protein degradability in the rumen
from incubation measurements weighted according to rate of passage. J. Agric.
Sci. 92:499-503
Owens, F. N., S. Qi, and D. A. Sapienza. 2014. Invited Review: Applied protein nutrition
of ruminants-Current status and future directions. Prof. Anim. Sci. 30:150-179.
Pavlu, V., M. Hejcman, L. Pavlu, J. Gaisler, and P. Nezerkova. 2006. Effect of
continuous grazing on forage quality, quantity and animal performance. Agri.
Ecos. And Eviron. 113:349-355.

38
Reed, J.J., G. P. Lardy, M. L. Bauer, T. C. Gilbery, and J. S. Caton. 2004. Effect of field
pea level on intake, digestion, microbial efficiency, ruminal fermentation, and in
situ disappearance in beef steers fed growing diets. J. Anim. Sci. 82:2123-2130.
Reynolds, C. K., and N. B. Kristensen. 2008. Nitrogen recycling through the gut and the
nitrogen economy of ruminants: An asynchronous symbiosis. J. Anim. Sci.
86:E293-E305
Stern, M. D., A. Bach, and S. Calsamiglia. 2006. New Concepts in Protein Nutrition of
Ruminants. 21st Annual Southwest Nutr. & Mngt. Conf. 45-66
Storm, E., and E. R. Oskov. 1983. The nutritive value of rumen micro-organisms in
ruminants. British Journal of Nutrition. 50:463-470.
Uden, P., P. E. Colcucci, and P. J. Van Soest. 1980. Investigation of Chromium, Cerium
and Cobalt as Markers in Digesta. Rate of Passage Studies. J. Sci. Food Agric.
31:625-632
“USDA – National Agricultural Statistics Service”. Nass.usda.gov. N.p., 2016. Web. 12
Oct. 2016.
Van Soest, P. J. 1994. Nutritional ecology of the ruminant. Cornell University Press.
Vieira, R. A. M., L. O. Tedeschi, and A. Cannas. 2008. A generalized compartmental
model to estimate the fibre mass in the ruminoreticulum: 2. Integrating digestion
and passage.J. of Theoretical Biology. 255:357-368.
Volden, H., L. T. Mydland, and V. Olaisen. 2002. Apparent ruminal degradation and
rumen escape of soluble nitrogen fractions in grass and grass silage administered
intraruminally to lactating dairy cows. J. Anim. Sci. 80:2704-2716.
Watson, A. K., T. J. Klopfenstein, G. E. Erickson, J. C. MacDonald, and V. A.
Wilkerson. 2017. Impact of microbial efficiency to predict MP supply when
estimating protein requirements of growing beef cattle from performance. J.
Anim. Sci. 95:3184-3191.
Wickersham, T. A., E. C. Titgemeyer, R. C. Cochran, E. E. Wickersham, and D. P. Gnad.
2008. Effect of rumen-degradable intake protein supplementation on urea
kinetics and microbial use of recycled urea in steers consuming low-quality
forage. J. Anim. Sci. 86:3079-3088.
Wilkerson, V. A., T. J. Klopfenstein, R. A. Britton, R. A. Stock, and P. S. Miller. 1993.
Metabolizable Protein and Amino Acid Requirements of Growing Cattle. J.
Anim. Sci. 71:2777-2784.
Willms, W. D. and Rode, L. M. 1998. Forage selection by cattle on fescue prairie in
summer or winter. J. Range Manage. 51:496-500.

39
Chapter II. Economics of Field Pea Supplementation for Cattle
Grazing Crested Wheatgrass
B. C. Troyer*, H. L. Greenwell*, A. K. Watson*, J. C. MacDonald*, and K. H. Jenkins
*Department of Animal Science; University of Nebraska-Lincoln; Lincoln, NE 68583

40
Abstract Field peas are widely grown in the panhandle of Nebraska, however, human
consumption markets quickly become saturated. A two year experiment was conducted
comparing field peas to dry distillers grains with solubles (DDGS) as a protein
supplement for grazing cattle. The objective was to establish a price producers could pay
for field peas relative to DDGS based on performance differences. In yr. 1, 112 heifers
(294 kg; SD=34.6) grazed crested wheat grass pasture (n = 12) using a 2×2 factorial
treatment design. In yr. 2, 114 spayed heifers (306 kg; SD=16.3) were utilized.
Treatments included peas or DDGS supplemented at either 0.4% or 0.8% of BW. Pasture
was the experimental unit and cattle were blocked by BW. Two day weights were
collected and averaged to calculate beginning and ending BW. Interim BW was also
collected to adjust the amount of supplement offered. There was no interaction between
type and level of supplement (P = 0.23). Also, level of supplement was not significant (P
= 0.15), cattle fed field peas at 0.4 or 0.8% of BW gained 0.97 and 0.98 kg/d,
respectively, compared to 1.02 and 1.15 for the low and high DDGS supplemented
heifers. There was a significant difference in ADG due to type of supplement (P = 0.02).
Field pea supplemented heifers had 10% lower ADG compared to DDGS supplemented
heifers. Economically, this means if corn is priced at $124.58/ 909 kg DM, and DDGS is
priced similar to corn, a producer should pay $112.13/ 909 kg DM, or $2.89/ 27 kg, for
field peas.
key words: beef cattle, DDGs, field peas, protein supplementation

41
Introduction Calf-fed and yearling systems are the two most common production systems in
the US. One study has shown that low input grazing systems may be more economical
than high input drylot systems when animals are retained through the finishing phase
(Mathis et al., 2008). Supplementing cattle during the grazing season has been used to
increase average daily gain (ADG). Dry distillers grains plus solubles (DDGS) is one of
the most common supplements that has been used in parts of Nebraska.
The lack of DDGS availability in western Nebraska has led to a search for a
competitive alternative, such as field peas (Pisum sativum), a highly digestible legume
(Reed et al 2004). Field peas are grown in western Nebraska, and production in the US
has increased due to dryland wheat farmers’ interest in rotational cropping systems
(Fendrick et al., 2005; Titlow et al., 2014). Peas, like other legumes, offer nitrogen
fixation into the soil (Anderson et al., 2007) and help reduce weeds and pests that destroy
subsequent crops (Liebman and Dyck, 1993; Allen et al., 1970). Also peas provide the
option to either graze or harvest them prior to planting subsequent crops (Titlow et al.,
2014). Field peas are grown primarily for human consumption, but this market becomes
quickly saturated causing a surplus that is available for the livestock industry to use
(Birkelo et al., 2000; Loe et al., 2003; Fendrick et al., 2005;Lardy et al., 2009; Greenwell
et al., 2018a). Operations with limited storage availability or enterprises that grow crops
and cattle can see economic benefits from feeding field peas instead of retaining them
until markets reopen (Pesta et al., 2012). Peas are high in crude protein (CP; 20-28%)
and are around 44% starch (Fendrick et al., 2005; NASEM, 2016). Unlike DDGS, which
are 63% rumen undegradable protein (RUP; Castillo-Lopez et al., 2013), field peas

42
contain 27-35% RUP both as a percent of CP (Anderson et al., 2007; Greenwell et al.,
2018b).
The objectives of this study were to determine the value of field peas as a protein
supplement for grazing cattle, and to determine a pricing mechanism relative to DDGS.
Materials and Methods Two hundred and twenty-six yearling heifers were used in this trial. The study
was conducted over a two year period at the High Plains Ag Lab (HPAL) near Sidney,
NE. Prior to arrival at HPAL, heifers were vaccinated against respiratory and clostridial
viruses and administered a growth implant. All animals involved in this trial were
managed in accordance with the protocols approved by the Animal Care and Use
Committee at the University of Nebraska.
Animal Management
In Yr 1, 112 intact predominately British and British cross heifers (294 kg;
SD=34.6) were utilized during the summer of 2016. Grazing was initiated May 20 and
heifers were removed from grass on September 19. In Yr 2 114 spayed British and British
cross heifers (306 kg; SD=16.3) were utilized during summer of 2017. Grazing was
initiated May 23 and ended September 7. Both years heifers were individually weighed
on the morning of day 0 and 1. Heifers were weighed off of one large pasture. These
weights were averaged to determine initial BW of the heifers. Cattle were blocked by
body weight into a light, medium, and heavy body weight and then assigned randomly to
pastures. Treatments were assigned randomly to each pasture. Treatments were arranged
in a 2x2 factorial design with whole field peas or DDGS supplemented daily at either
0.4% or 0.8% of body weight (BW). Supplement amount was based on the initial BW at
the initiation of the trial, but was prorated to be delivered only six days per week.

43
Supplement was weighed into buckets and hand delivered Monday through Saturday into
bunks near each pasture’s water source. Interim weights were collected on July 13 and
July 12 during Yr 1 and Yr 2, respectively. This weight was used to adjust the
supplement amount for the duration of the trial. No supplement refusals were ever present
throughout the trial. The trial ended on day 124 and day 108 for Yr 1 and Yr 2,
respectively. Two day individual weights were taken on the morning of d 124 and 125 for
Yr 1 and d 108 and 109 for Yr 2. Heifers were weighed off of pastures and grazed a large
pasture as a group in between weigh days. These weights were averaged to calculate
ending BW. Average daily gain (ADG) was calculated using initial and ending BW.
Pasture Management
Treatment groups were assigned randomly to one of twelve pastures to start the
trial each year. Pastures were stocked such that 4.25 ha were allotted per animal and
cattle were rotated through the pastures every two weeks to minimize pasture effect on
treatment differences. Nine pastures were larger and were stocked with 10 hd and 3
pastures were smaller and were stocked with 8 hd. Animals in the larger groups rotated
through all nine pastures over the course of the trial and animals on the smaller pastures
rotated through only the smaller pastures.
Statistical & Economical Analysis
This trial was set up in a 2x2 factorial arrangement with supplement type and
level being the two factors. Cattle were blocked by initial BW into light, medium, and
heavy blocks both years. Each block had one replication per treatment per year, which
allowed for a total of six replications (3/yr) per treatment over the two year study. Groups
of cattle were used as the experimental unit and block and year were treated as fixed
effects. Data were analyzed using the MIXED procedure of SAS (SAS Inst. Inc, Cary,

44
NC) and probabilities were considered significant if P < 0.05. The economic analysis was
calculated by using percent change in performance (ADG) of the DDGS minus the ADG
of the field peas divided by the ADG of the DDGS. Corn price per bushel as-is was used
to determine DDGS price per 909 kg. Field pea price was calculated based on the
performance difference when compared to DDGS.
Results
Cattle Performance
Initial BW did not differ among treatments (P > 0.60; Table 1). There was no
interaction between level and type of supplement (P = 0.23). Level of supplement was
not statistically significant (P = 0.15), cattle fed field peas at 0.4 or 0.8% BW gained 0.97
and 0.98 kg/d respectively. Heifers supplemented with DDGS at 0.4 or 0.8% gained 1.03
and 1.14 kg/d respectively. Griffen et al. (2009) pooled 35 pasture studies and reported a
13.7% increase in ADG when DDGS supplementation increased from 0.4 to 0.8% BW.
Similarly, this study showed a 10.7% increase in ADG at the differing levels, although it
was not statistically different. Type of supplement was statistically different (P < 0.02).
Field pea supplemented heifers had 10% lower ADG compared to DDGS supplemented
heifers at 0.98 and 1.09 kg/d respectively. Ending BW was also greater for DDGS
supplemented heifers (P < 0.04) than field pea supplemented heifers. Supplementation
level was not different (P > 0.46). Greenwell et al. (2018a) reported an increased ADG
when growing cattle grazing crested wheatgrass pastures were supplemented with a dry
rolled corn (70.8%), condensed distillers solubles (24.0%), and urea (5.2%) supplement
compared to either field peas or no supplement. Supplementation occurred at 0.5% of
BW on a dry matter basis. Field pea supplemented cattle gained 0.87 kg/d whereas the
control cattle and the corn blend supplemented cattle gained 0.69 and 0.99 kg/d,

45
respectively. Performance of cattle in this study was consistent with the current study’s
results. Conversely, Landblom et al. (2007) reported no difference in ADG when field
peas replace DDGS, wheat middlings, and barley sprouts in a growing diet. Gelvin et al.
(2004) also reported no difference in calf ADG when field peas replaced soybean meal in
a creep feed.
Economic Analysis
Economically, the reduction in heifer performance means that field peas should
be worth 10% less than DDGS. Corn price is often used as the basis for pricing DDGS.
Assuming DDGS is priced equal to corn, which is priced around $124.58/ 909 kg dry
matter (DM), a producer could afford to pay $112.13/ 909 kg DM, or $2.89/ 27 kg, for
field peas. Field pea price is calculated based on the DDGS price $124.58 minus
[$124.58(0.10 reduction in ADG)]. As corn price fluctuates (Table 2), the price a
producer can afford to pay for field peas will vary as well. Currently field peas are
entering the human consumption market at $6.50/ 27 kg, however this market is quickly
saturated. Pricing of supplement calculated in the table does not include trucking costs.
Field peas are primarily grown in the western panhandle of Nebraska, which is an area
with few ethanol plants and limited access to DDGS. Assuming DDGS is hauled at
$3/loaded 1.6 km and local peas require minimal trucking, for producers in that part of
the state, the economics of supplementing field peas becomes much more relevant. One
example would be a producer located in Sidney, NE that is purchasing DDGS from an
ethanol plant in Hastings, NE. This product would be hauled 418 km and would increase
the cost of DDGS by $34.67/ 909 kg assuming a 22,700 kg load capacity per truck, 90%
DM DDGS product, and $3/loaded 1.6 km. If this producer decides to purchase DDGS
from a plant in Kearney, NE they would need to haul the product only 351 km. This

46
would reduce trucking costs to $29.07/909 kg. The reason DDGS is more appealing than
using WDGS is because the DM of DDGS is 90%, whereas the DM of WDGS is around
30%. This means that a producer is hauling less DM on each truck resulting in a higher
increase in DM cost per 909 kg.
Alternatively, using the assumption that the response from DDGS is linear,
animals receiving no supplement would have and ADG of 0.92 kg/d. This means that the
additional response in gain from feeding field peas is worth 0.06 kg/d compared to 0.17
kg/d when supplementing DDGS. This results in field peas having only 35% the response
above the control compared to DDGS when supplemented at 0.4% or 0.8% of BW.
Implications
Utilizing field peas in the panhandle of Nebraska is a viable option for producers
in need of a protein supplement for cattle. Understanding the 10% reduction in ADG
compared to DDGS is an important concept to account for when determining price
procurement of the field peas. Also factoring in trucking costs of the DDGS is key due to
the large distance from most available sources. Integrated producers may recognize
benefits on both the agronomic side and cattle performance side from growing and
feeding field peas within their current systems.

47
Literature Cited Allen, M. W., W. H. Hart, and K. Baghott. 1970. Crop rotation controls barley root-knot
nematode at Tulelake. Calif. Agri. 24:4-5
Anderson, V., G. Lardy, and B. Ilse. 2007. Field Pea Grain for Beef Cattle. NDSU
Extension Service. 1-5.
Birkelo, C. P., B. J. Johnson, and B. D. Rops. 2000. Field Peas in Finishing Cattle Diets
and the Effect of Processing. South Dakota Beef Report, 2000. Paper 5
Castillo-Lopez, E., T. J. Klopfenstien, S. C. Fernando, and P. J. Kononoff. 2013. In vivo
determination of rumen undegradable protein of dried distillers grains with
solubles and evaluation of duodenal microbial crude protein flow. J. Anim. Sci.
91:924-934.
Fendrick, E. M., I. G. Rush, D. R. Brink, G. E. Erickson, D. D. Baltensperger. 2005.
Effects of Field Peas in Beef Finishing Diets. Nebraska Beef Cattle Reports. 161
Gelvin, A. A., G. P. Lardy, S. A. Soto-Navarro, D. G. Landblom, and J. S. Caton. 2004.
Effect on Field pea-based creep feed on intake, digestibility, ruminal
fermentation, and performance by nursing calves grazing native range in western
North Dakota. J. Anim. Sci. 82:3589-3599
Greenwell, H. L., K. H. Jenkins, and J. C. MacDonald. 2018a. Evaluating field peas as an
energy source for growing and finishing cattle. Prof. Anim. Sci. 34:202-209.
Greenwell, H. L., J. L. Gramkow, M. L. Jolly-Breithaupt, J. C. MacDonald, and K. H.
Jenkins. 2018b. Effects of field pea supplementation on digestibility and rumen
volatile fatty acid concentrations of beef-cattle diets containing high and low
quality forages. Prof. Anim. Sci. 34:631-634.
Griffen, W., V. R. Bremer, T. J. Klopfenstein, L. A. Stalker, and L. Lomas. 2009.
Summary of Grazing Trials Using Dried Distillers Grains Supplementation.
Nebraska Beef Report. 35-39
Jenkins, K. H., J. T. Vasconcelos, J. B. Hinkle, S. A. Furman, A. S. de Mello Jr., L. S.
Senaratne, S. Pokharel, and C. R. Calkins. 2011. Evaluation of performance,
carcass characteristics, and sensory attributes of beef from finishing steers fed
field peas. J. Anim. Sci. 89:1167-1172.
Klopfenstein, T. J., R. Cooper, D. J. Jordan, D. Shain, T. Milton. 1999. Effects of
Backgrounding and Growing Programs on Beef Carcass Quality and Yield.
Faculty Papers and Publications in Anim. Sci. 550.
Landblom, D. G., D. K. Olson, and C. J. Wachenheim. 2007. Effect of Field Pea and
Flaxseed Inclusion in Receiving Calf Diets and Carryover Effect on Finishing
Performance, Immune Response, Carcass Quality, and Economics. Amer. Soc. Of
Anim. Sci. 58:
Lardy, G. P., B. A. Loken, V. L. Anderson, D. M. Larson, K. R. Maddock-Carlin, B. R.
Ilse, R. Maddock, J. L. Leupp, R. Clark, J. A. Paterson, and M. L. Bauer. 2009.

48
Effects of increasing field pea (Pisum sativum) level in high-concentrate diets on
growth performance and carcass traits in finishing steers and heifers. J. Anim. Sci.
87:3335-3341.
Liebman, M., and Dyck, E. 1993. Crop Rotation and Intercropping Strategies for Weed
Management. Ecological App. 3:92-122.
Loe, E. R., M. L. Bauer, G. P. Lardy, J. S. Caton, and P. T. Berg. 2003. Field Pea (Pisum
sativum) inclusion in corn-based lamb finishing diets. Small Rum. Res. 53:39-45.
Mathis, C. P., S. H. Cox, C. A. Loest, M. K. Peterson, R. L. Endecott, A. M. Encinias,
and J. C. Wenzel. 2008. Comparison of Low-Input Pasture to High-Input Drylot
Backgrounding on Performance and Profitability of Beef Calves Through
Harvest. Prof. Anim. Sci. 24:169-174.
NASEM (National Academics of Sciences, Engineering, and Medicine). 2016. Nutrient
Requirements of Beef Cattle, Eighth revised edition, Washington, D.C.: The
National Academics Press
Pesta, A. C., A. H. Titlow, J. A. Hansen, A. L. Berger, S. A. Furman, M. K. Luebbe, G.
E. Erickson, K. H. Jenkins. Effects of feeding field peas in combination with
distillers grains plus solubles in finishing and growing diets on cattle performance
and carcass characteristics. Prof. Anim. Sci. 28:534-540.
Reed, J.J., G. P. Lardy, M. L. Bauer, T. C. Gilbery, and J. S. Caton. 2004. Effect of field
pea level on intake, digestion, microbial efficiency, ruminal fermentation, and in
situ disappearance in beef steers fed growing diets. J. Anim. Sci. 82:2123-2130.
Titlow, A., M. K. Luebbe, D. J. Lyon, T. J. Klopfenstein, and K. Jenkins. 2014. Using
Dryland Annual Forage Mixtures as a Forage Option for Grazing Beef Cattle.
Forage and Grazinglands. 1-6.

49
Table 1. Performance of heifers grazing crested wheatgrass pastures supplemented with whole field peas or distillers grains plus
solubles
Treatments3 P-value
0.4 % D4 0.8% D 0.4% P5 0.8% P SEM Type Level Interaction
Initial BW1, kg 301 300 301 298 9.6 0.88 0.60 0.82
Ending BW1, kg 419 431 412 410 13.6 0.04 0.46 0.26
ADG2, kg 1.03 1.14 0.97 0.98 0.09 0.02 0.15 0.23 1BW=body weight 2ADG=average daily gain 3Treatments=amount of supplement fed based on % of body weight 4D=distillers grains plus solubles 5P=whole field peas
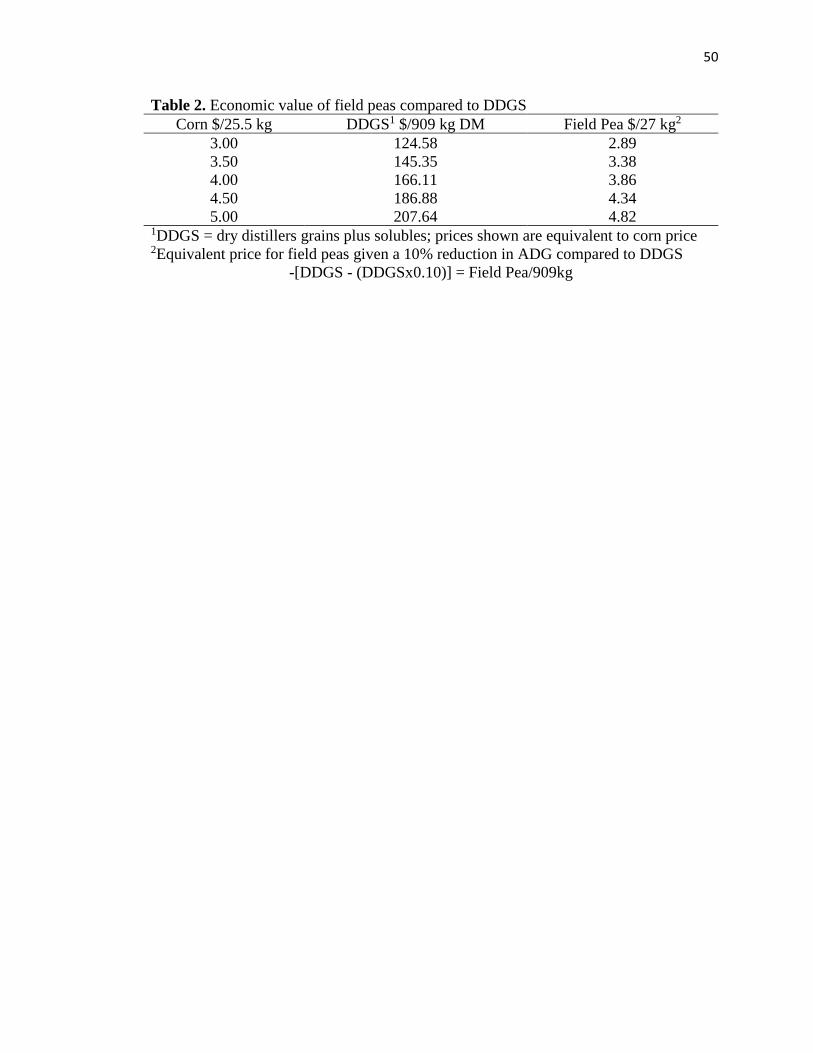
50
Table 2. Economic value of field peas compared to DDGS
Corn $/25.5 kg DDGS1 $/909 kg DM Field Pea $/27 kg2
3.00 124.58 2.89
3.50 145.35 3.38
4.00 166.11 3.86
4.50 186.88 4.34
5.00 207.64 4.82 1DDGS = dry distillers grains plus solubles; prices shown are equivalent to corn price 2Equivalent price for field peas given a 10% reduction in ADG compared to DDGS
-[DDGS - (DDGSx0.10)] = Field Pea/909kg

51
Figure 1. Performance of heifers supplemented with field peas or dry distillers grains plus solubles while grazing crested wheatgrass
pastures
1DDGS=dry distillers grains plus solubles 2Level=p-value related to level of supplement 3Type=p-value related to type of supplement 4Inter=p-value related to the interaction between level and type of supplement
0
0.2
0.4
0.6
0.8
1
1.2
1.4
0.4 0.8
AD
G (
kg/d
)
Supplement Level (%BW)
DDGS1 vs. Field Pea
DDGS
Field Pea
Level2=0.15
Type3=0.02
Inter4=0.23

52
Chapter III. Utilization of Forage Crude Protein and the Need
for Rumen Undegradable Protein Supplementation
B. C. Troyer*, M. M. Norman*, B. M. Boyd*, H. C. Wilson*, J. C. MacDonald*, T. J.
Klopfenstein*, and A. K. Watson*
*Department of Animal Science: University of Nebraska-Lincoln; Lincoln, NE 68583

53
Abstract Variable sources of grazed forages are used in cattle backgrounding systems
across the US. Often, metabolizable protein (MP) is limiting in these backgrounding
systems and rumen undegradable protein (RUP) supplements are fed to increase ADG
and G:F. The objective of this study was twofold, the first objective was to determine if
RUP is limiting when forage is immature and provides large amounts of protein to
growing cattle. The second objective was to determine if forages that have rapid passage
rates and are highly digestible allow some rumen degradable protein (RDP) to bypass the
rumen prior to utilization by the microbes and become available for absorption in the
small intestine, similar to RUP. A pooled analysis was conducted looking at RUP
supplementation of growing animals grazing a variety of forages. Average daily gain
(ADG) increased with increased RUP supplement, with the exception of animals grazing
forages that were 17% crude protein (CP) or greater. This led to a metabolism study
utilizing 4 cannulated animals ad libitum fed a low quality brome (LQB), high quality
brome (HQB), alfalfa (ALF), or an oat/alfalfa (OAT) blend (70% DM and 30% DM
respectively). Animals were fed twice daily and adapted to new diets over a period of 10
days. Results showed that animals fed LQB and HQB diets had lower intakes and lower
digestibility values compared to ALF and OAT treatments. Several internal markers were
used along with titanium dioxide as an external maker to evaluate markers in forage
based diets.
key words: RUP supplementation, digestibility markers, forage digestibility

54
Introduction Forages are the predominant source of feed used in beef production (NASEM,
2016). However, differences in digestibility, CP, and palatability are caused by changing
plant species, maturity, and management (Bohnert et al., 2011). Forages are composed of
cell wall components and cell solubles. Cell solubles are nearly 100% digestible, so
differences in forage digestibility can be attributed to cell wall differences (Deinum,
1981). Forage quality and yield are also variable throughout a grazing season, but are
closely related to plant maturity, although environmental factors and grazing
management result in changes as well (Buxton, 1996). Determining what factors are
impacting the quality and yield of the forage is difficult when there are so many
interacting factors (Deinum, 1981).
Backgrounding systems often use grazed forages to produce yearling cattle and
target higher total sale prices at the sale barn (Gillespie-Lewis et al., 2016). However,
metabolizable protein (MP) requirements are often not met when growing cattle are
grazing forages alone (Creighton et al., 2003). Metabolizable protein deficiency results
from forage protein being primarily rumen degradable protein (RDP), which is used by
the microbes in the rumen to produce microbial crude protein (MCP). Rumen degradable
protein is often the first limiting nutrient that grazing calves need to increase body weight
gain on grass (Creighton et al., 2003). Small amounts of RDP do escape the rumen due to
rate of passage and poor microbe utilization when high quality forages are consumed
(Volden et al., 2002). However, the amount of bypass soluble protein and rumen
undegradable protein (RUP) vary among plants (Klopfenstein et al., 2001).

55
The first objective of this study was to determine if cattle grazing immature
forage sources that supply large amounts of protein are limited in RUP. The second
objective was to determine if forages that have rapid passage rate and are highly
digestible allow some rumen degradable protein (RDP) to bypass the rumen prior to
utilization by the microbes and become available for absorption in the small intestine,
similar to RUP.
Materials and Methods
Experiment 1
Data were collected from 10 previously conducted studies published in the
Nebraska Beef Cattle Reports. Studies were conducted from 1987 to 1991 and included
458 steers and 210 heifers grazing a variety of pastures. All data in this analysis are from
published data and no live animals were used to conduct this study. Titles and authors are
listed in Table 1. Studies selected were all designed with growing animals grazing
pastures and individually receiving varying levels of RUP supplement. Type of RUP
supplement varied and animals received anywhere from 0 to 0.255 kg per animal daily.
Additionally, each RUP treatment was formulated to provide equivalent energy as the
control to ensure any average daily gain (ADG) response was due to RUP supplement
alone. In order to compare response across trials, ADG was regressed above the ADG of
the control treatment. Crude protein (CP) values of the grazed forage varied from 10.4%
to 21.7% and were measured by collecting forage samples via clipping or diet sampling
over the grazing period from cannulated steers.
Anderson et al. (1988) conducted two trials. Trial 1 utilized 59 steers (277 kg)
grazing smooth bromegrass from April to July. Treatments included an energy control
(corn starch and 30% molasses) and 0.08, 0.17, and 0.26 kg/animal/d of RUP

56
supplemented. This supplement consisted of corn gluten meal, bloodmeal, and 15%
molasses. Animals were supplemented individually using a Calan gate system. In trial 2
60 steers (244 kg) grazed smooth bromegrass pastures from August to November.
Treatments mirrored trial 1, but 0.23 kg/animal/d of soyhulls was added to all treatments
and molasses in the RUP treatments increased to 30% due to palatability issues. Forage
samples were collected at 2 week intervals via hand clipping approximately 2.5 cm above
ground. Forage sampled during trial 1 contained 10.4% CP and 60.1% in-vitro dry matter
digestibility (IVDMD). Forage sampled during trial 2 contained 13.4% CP and 56.4%
IVDMD.
Drouillard and Klopfenstien (1989) conducted a trial utilizing 60 steers (263 kg)
grazing smooth bromegrass pastures from May to July. Treatments consisted of two
levels of RUP supplementation and three levels of Tetronasin (ionophore) in a 2 x 3
factorial arrangement. Treatments included either control or 0.17 kg/animal/d of RUP
supplement. The RUP supplement contained corn gluten meal, bloodmeal, and 30%
molasses. Control animals received corn starch and 30% molasses in order to supply
equal amounts of energy as the RUP supplemented treatment. Tetronasin was fed at 0,
30, or 90 mg/animal/d. Forage samples showed that smooth bromegrass was 16.3% CP.
Goedeken et al. (1988) conducted a trial using 60 steers (270 kg) grazing smooth
bromegrass from April to July. Animals were supplemented cornstarch to provide energy
at either 0 or 1.36 kg/animal/d. Also animals were allocated to receive a blend of corn
gluten meal and blood meal which provided RUP at 0, 0.06, or 0.12 kg/animal/d.
Treatments were set up in a 2 x 3 factorial arrangement with energy level and RUP level

57
as the two factors. Molasses was added at 30% to help reduce any palatability issues.
Pastures in this study provided 16.3% CP.
Hafley et al. (1993) conducted two trials looking at RUP response. Trial 1 utilized
72 steers (286 kg) grazing pastures consisting of big bluestem, switchgrass, and Indian
grass from June to August. Animals were assigned to one of three treatments. Treatments
included an energy control (cornstarch and molasses) and energy control plus 0.08 or
0.15 kg/animal/d of RUP. The supplement consisted of corn gluten meal and blood meal.
Energy was equal across all treatments to ensure that gain above the control was a protein
response. Trial 2 utilized 90 heifers (240 kg) grazing the same pastures as trial 1, but
receiving one of five possible treatments. Animals grazed from June to August.
Treatments were negative control (no supplement), energy control, energy control plus
0.14 kg/animal/d RUP, energy control plus 0.22 kg/animal/d RDP, or an energy control
plus 0.36 kg/animal/d blend of RUP and RDP. Non-enzymatically browned soybean meal
plus feather meal provided the RUP supplement and corn steep liquor plus urea provided
the RDP supplement. Blending the two supplements resulted in the final treatment that
provided both RUP and RDP. For both studies pastures were sampled three times during
the grazing period using esophageally fistulated animals. Values reported for trial 1
averaged 48.57% in vitro DMD and 11.5% CP as a percent of DM. Pastures in trial 2 had
a 49.2% in vitro DMD and 10.4% CP as a percent of DM on average.
Hollingsworth et al. (1993) also conducted two trials. Trial 1 utilized 120 heifers
(240 kg) grazing either piper sudangrass or pearl millet from July to September.
Treatments included an energy control (cornstarch and molasses) or 0.09, 0.14, or 0.19
kg/animal/d RUP supplement (corn gluten meal and bloodmeal). Treatments were

58
arranged in a 2 x 4 factorial arrangement with forage source and supplement amount
being the two factors. Forage was sampled using fistulated animals and also by collecting
hand clipped samples. Sudangrass had 65.6% IVOMD and provided 18.0% CP on
average. Pearl millet had a 63.3% IVOMD and provided 15.0% CP on average. Trial 2
utilized 60 steers and 60 heifers (272 kg) grazing piper sudangrass from June to August.
Treatments were a negative control (molasses), an energy control (corn starch and
molasses), 0.09 kg/animal/d RUP (molasses, corn gluten meal, and bloodmeal), 0.09
kg/animal/d RUP plus energy (molasses, corn gluten meal, bloodmeal, and corn starch),
or 0.17 kg/animal/d RUP (molasses, corn gluten meal, and bloodmeal). Treatments 2, 4,
and 5 were all isoenergetic. Ruminally fistulated steers were used to collect forage
samples along with hand clipped samples. Piper sudangrass had 70.0% IVOMD and
provided 21.7% CP on average.
Irlbeck et al. (1990) utilized 100 steers divided into two groups. Group one grazed
127 d (274 kg) and group two grazed for 70 d (330 kg) both on smooth bromegrass
pastures. Treatments were an energy control (corn starch and molasses) or 0.04, 0.09,
0.13, or 0.18 kg/animal/d of RUP supplemented. This supplement contained molasses,
corn gluten meal, and bloodmeal. Forage samples were collected weekly with
esophageally fistulated steers. Analysis on forage samples resulted in 15.0% CP during
the 127 d grazing period and 16.3% CP during the 70 d grazing period.
Karges et al. (1992) utilized 40 steers (326 kg) grazing summer native range from
June to September. Treatments included in the analysis were an energy control (corn
starch and molasses) and 0.07, 0.14, or 0.21 kg/animal/d of RUP from molasses, soybean
meal, and feather meal. Forage samples were collected at the beginning of each month

59
from esophageally fistulated steers. Forage analysis resulted in 9.4% CP as a percent of
DM on average.
Studies were divided into several groups to look at correlations between ADG and
initial body weight (BW), type of forage, or CP of the forage. The pooled analysis
included three studies with initial BW under 250 kg, five studies with initial BW between
250 to 300 kg, and two studies with initial BW over 300 kg (in one study one-half of the
cattle were over 300 kg and half were between 250 to 300 kg and these were subdivided).
The Hollingsworth et al. (1993) trial was removed from the BW response if CP of forage
grazed was above 17.0% due to lack of response to supplement. Studies were also
divided into three types of forage being grazed. Within this analysis five studies
evaluated cattle grazing brome grass, three studies evaluated cattle grazing warm season
grasses, and two studies evaluated cattle grazing summer annuals. Once again the goal
was to see if type of forage had an effect on ADG with increasing RUP supplementation.
The last division in this analysis was based on CP of the forages. This analysis had five
studies with cattle grazing forages with less than 13.5% CP, three studies with forage CP
between 13.5 to 17%, and two studies in which the forage had over 17% CP.
Correlations and slopes of each line were analyzed using PROC REG of SAS.
Differences in slopes of lines within each category were analyzed by PROC GLM with P
< 0.05 being considered significant and P < 0.10 being considered a tendency. Treatment
within study was the experimental unit in this pooled analysis.

60
Experiment 2
Two ruminally and duodenally cannulated heifers and two ruminally cannulated
steers were utilized in a digestion trial to better understand protein utilization of
ruminants when fed different forages containing high, medium, or low amounts of
protein. Steers were housed individually in 2.4 x 1.5 m2 concrete slatted floor pens with
ad-libitum access to water. Housing rooms were temperature controlled at 25oC.
Treatments (n = 4) consisted of low quality brome (LQB), high quality brome (HQB),
high quality alfalfa (ALF), and a 70% oat and 30% alfalfa blend (OAT) fed ad-libitum.
Animals also had access to a pressed mineral block containing salt, manganese, iron,
copper, zinc, iodine, and cobalt.
Animals were fed twice daily at 0830 and 1630 h, feed refusals were collected
daily prior to feeding and weighed back on an as fed basis. Refusals were re-fed as part of
the following days feeding on d 10 to 13, but on d 14 they were sampled and removed
from the bunks to start the next diet. Refusal samples from d 14 were dried for 48 h in a
60oC forced air oven to determine DM and correct for DMI. Ingredient samples were
collected on d 10 and 12, subsampled, composited by period and frozen. One subsample
was dried for 48 h in a 60oC forced air oven to correct ingredient DM. After trial
completion, ingredient samples were ground through a 1-mm screen in a Wiley Mill
(Thomas Scientific, Swedesboro, NJ). Oat samples were freeze dried (Virtis
Freezemobile 25ES) prior to grinding.
Periods consisted of 14 d with 10 d of adaptation and 4 d of collection. Animals
were continuously dosed with 8 g of TiO2 via rumen cannula, as an indigestible marker,
twice daily at 0830 and 1630 h for a total of 16 g/d of TiO2. Collections occurred from d

61
11 to d 14, as well as a collection the morning following d 14. During collection on d 11
to d 14 fecal samples were collected at 0830, 1230, 1630, and 2030 h. Duodenal samples
were also collected d 12 to d 14 at 0830, 1230, 1630, and 2030 h. Three g of Cobalt
EDTA (0.4 g Co) dissolved in 200 mL ddH2O was dosed via rumen cannula at 0830 h on
d 11 and rumen liquid samples were collected at 0830 prior to dosing, 1030, 1230, 1430,
1630, 1830, 2030, and 2230 h. A sample of rumen liquid was also taken at 0830 h on d
12 to ensure the marker had completely passed out of the rumen. All samples were
immediately frozen at -20oC. After each period, fecal samples were composited by day
for each animal, freeze dried, and ground through a 1-mm screen using a Wiley Mill
(Thomas Scientific). Composites were formed by sub-sampling an equal weight from
each time point into the daily composites. Following grinding, samples were composited
by period for each animal. Whole rumen samples and omasal samples were collected
following a complete rumen evacuation at 0630 the morning following d 14 prior to
feeding the new diet. Samples were frozen immediately at –20oC. Following the trial,
duodenal samples were freeze dried and ground through a Tecator cyclotec sample mill
(American Instrument Exchange, Haverhill, MA). Then samples were composited into
period samples. Omasal samples were freeze dried and then ground through a 1-mm
screen using a Wiley Mill (Thomas Scientific).
Feed, orts, duodenal, omasal, and fecal samples, composited by period, were dried
at 100oC for 24 h to determine DM and then burned in a cool muffle furnace at 600oC for
6 h to determine OM (organic matter). Crude protein of feed samples were determined
for each period and averaged over the entire trial. Additionally, all samples were
analyzed for neutral detergent fiber (NDF) and acid detergent fiber (ADF) as described

62
by Van Soest et al. (1991). Sodium sulfite was added to all samples at 0.5 g. Following
ADF analysis, dried filters (GE Healthcare Whatman 541) from the ADF analysis were
placed in a cool muffle furnace at 600oC for 6 h to determine acid insoluble ash (AIA)
content. The AIA content of each sample was used to calculate fecal output and
digestibility.
An additional marker, indigestible ADF (IADF) was used to calculate digestibility
values for each treatment. Ankom F58 bags containing 0.5 g of feed, orts, duodenal, and
fecal samples were ruminally incubated in two heifers for 168 h with 2 bags / animal for
each sample type. An additional 2 bags / animal for feed samples were incubated for 240
h to confirm complete digestion within the bags. Ninety bags were placed into each mesh
bag and inserted into the ventral sac of the rumen. Weight was added to the mesh bags to
keep samples in the ventral sac of the rumen. After 168 h or 240 h, bags were removed
and analyzed for IADF using the Ankom Fiber Analyzer (Ankom Technology). Fecal
output, duodenal flow, and digestibility were calculated using IADF as a second internal
marker.
In vivo digestibility values were adjusted back to in vitro digestibility values
using the Geisert et al. (2007) adjustment. These adjustments were determined by feeding
eight animals five types of hay. Prairie hay and mature and immature alfalfa and brome
were used. These in vivo digestibility values were calculated using total fecal collection
and regressed against in vitro digestibility values on the same hay samples. Geisert et al.
(2007) determined adjustment values for each standard that was included in this in vitro
run, which allows a standard adjustment to be applied to all unknown forage samples and
help predict in vivo digestibility for the unknown. Adjusted in vitro digestibility values

63
are presented in table 4.1 and 4.2 and were compared to in vivo digestibility values
calculated using both internal and external markers.
Rumen liquid was analyzed by atomic absorption spectrophotometry to determine
ruminal liquid dilution rate. Dilution rates were calculated from ruminal cobalt
concentrations from 2 to 14 h after dosing. Lastly duodenal and omasal samples were
analyzed for purine concentration to determine microbial flow using a modified Zinn and
Owens (1986) procedure with a more dilute HClO4 to hydrolyze material containing
purines (as described by Crawford et al., 2008). Purine concentration was determined on
a spectrophotometer (Spectra Max 250 Spectrometer, Molecular Devices) at 260 nm.
Measuring purines, which are present in all DNA and RNA, and N in these samples,
allows for the amount of MCP that is flowing through the system, to be calculated based
on a common purine to N ratio found in the microbes. This study used a 0.25 purine to
nitrogen ratio (Mass et al., 2001).
Results
Experiment 1
After breaking the studies into different categories some correlations were
apparent. The first subdivision was with initial body weights to determine if cattle at
lighter weights required more RUP supplement to facilitate their rapid growth and
development (Figure 1). Within these trials smaller cattle had the lowest response to RUP
supplement, 0.44 kg/d increase in ADG for each 1.0 kg increase in RUP supplement
compared to 0.97 kg/d for larger cattle. Medium weight cattle had a 0.51 kg/d increase in
ADG for each 1.0 kg increase in RUP supplement, which was not different than the
response for the smallest cattle (P = 0.94), but both medium and small cattle had lower
responses (P < 0.02) compared to heavy cattle. This may be due to the MP being more

64
efficiently converted into net protein (NP) in the smaller animals (NASEM, 2016).
Growing cattle are using MP for maintenance and gain, larger cattle would require more
MP for maintenance leaving them more deficient and resulting in a larger response from
supplemental protein (Wilkerson et al., 1993). Correlations for ADG compared to BW
were all very strong with cattle >300 kg having the lowest correlations (r2 = 0.70). All the
cattle analyzed in these trials were between 238 and 330 kg.
Looking into the correlation between ADG and amount of RUP supplement
relative to type of forage was the next analysis (Figure 2). Warm season grasses had the
strongest correlation (r2 = 0.81) and showed an increase of 0.43 kg ADG for each 1.0 kg
increase in RUP supplement provided. Brome grass showed a similar trend with 0.63 kg
ADG increase with each additional 1.0 kg of RUP supplementation; however the
correlation was lower (r2 = 0.66). Summer annuals had no correlation (r2 = 0.00) and did
not show a response to the RUP supplementation. Response of these animals was not
different from 0 (P = 0.84). The low correlation is due to the fact that animals grazing
pearl millet (15.0% CP) had a positive response in ADG, but animals grazing sudangrass
(18.0-22.0% CP) had a negative response. No statistical difference was detected between
grass types (P > 0.43). The numerical differences observed due to type of forage may be
due to forage quality, specifically CP content.
The idea to look at the relationship between CP of the forage and ADG related to
increasing RUP supplementation (Figure 3) stemmed from the trends observed in the
types of grass. Summer annuals made up the high CP subdivision, except for pearl millet,
which had a CP of 15.0%. Studies in which cattle grazed forages with 13.5 to 17.0% CP
showed the greatest response in ADG when supplemented higher levels of RUP, 0.70 kg

65
of additional gain for each 1.0 kg of RUP supplement with a strong correlation (r2 =
0.65). Cattle grazing forages with less than 13.5% CP had a similar response (P = 0.68)
with 0.47 kg increase in ADG for each 1.0 kg increase in RUP supplement with a strong
correlation (r2 = 0.83). Amount of RUP supplement provided only reached 0.20 kg/d for
cattle on grass that had 13.5 to 17% CP, but ADG reached nearly the same level as it did
in the cattle supplemented 0.25 kg/d on grass with 13.5% CP or less, which was 0.125 kg
above their respective controls. The last group was cattle grazing forages with CP at 17%
or greater. These cattle showed a negative response to RUP supplementation which
tended to be different than low CP cattle (P = 0.09) and was significantly different than
medium CP cattle (P = 0.02). Also the slope of this group’s response was different than 0
(P = 0.003). Poppi and McLennan (1995) pooled experiments and saw a similar response
with low quality forages (< 0.55 DM digestibility) responding linearly to increasing RUP
supplementation, however high quality forages (> 0.60 DM digestibility) showed some
response to RUP supplementation, but the effect was much less. When low quality and
high quality forages were supplemented with 4 g of RUP per kg of BW per day animals
grazing low quality forages gained 0.90 kg per day more than the control whereas
animals grazing high quality forages only gained 0.25 kg per day more than the control.
Rogers et al. (1996) supplemented RUP (corn and caromeal blend) to steers grazing
warm season pasture averaging 20% CP. Compared to an energy control (corn) that
supplied equal energy as the RUP supplements and 0.08 kg/d RUP there was no
difference in ADG of the high or low (0.159 and 0.239 kg/hd/daily respectively) RUP
supplemented pastures suggesting RUP was not the first limiting nutrient. Worrell et al.
(1990) observed a similar response when 96 crossbred yearling steers grazed rye pasture.

66
This study utilized a control that received no supplement and a treatment that received
0.45 kg/d of cottonseed meal (CSM). Animals grazed a fall period from mid-December to
the end of January and a spring period from mid-February to the end of March. During
the fall period the rye ranged from 13.1 to 17.5% CP and during the spring regrowth rye
ranged from 20.0 to 28.8% CP. The CSM used in this study was 42 to 48% RUP as a
percent of CP and led to a response in ADG from 1.43 kg/d for the control to 1.72 kg/d
for the CSM treatment during the fall period when forage CP was lower. However,
during the spring period there was no difference in the control and CSM supplemented
ADG at 1.13 kg/d and 1.16 kg/d, respectively.
Yearlings grazing wheat pasture is another example of high CP forages lack of
response to supplemental CP. Vogel et al. (1989) used 256 growing animals across a
three year study grazing wheat pasture. Treatments included no supplement, a corn based
energy supplement, a meat meal based RUP source, or a cottonseed meal based RUP
source. All supplements were provided on an equal energy basis. Wheat pasture averaged
23.0% CP as a percent of DM over the three year trial. Supplemented cattle had greater
ADG than the animals that received no supplement, but additional protein supplement
resulted in similar ADG to the energy control supplemented treatment (P > 0.30).
Responses shown here could be due to large intakes and rapid passage of forage
through the rumen. This may allow undegraded RDP to pass from the rumen in the
liquid contents and enter the omasum and eventually the small intestine. The undegraded
RDP is utilized in the small intestine as RUP and increases the total metabolizable protein
available for the animal. This extra “RUP” may be why the supplemental RUP did not
improve ADG in these steers. Response during the grazing season will vary. A study in

67
2011 demonstrated a greater response to supplementation later in the grazing season,
supplementing DDGS resulted in 0.15 kg ADG increase above the control early in the
grazing season (first 60 days) and jumped to 0.34 kg ADG above the control for the
remaining 96 days of the study (Watson et al., 2012). Buckner et al. (2013) collected
samples at 5 time points across a grazing season on smooth bromegrass pastures. These
samples were collected by ruminally fistulated steers. Samples were analyzed for in-vitro
digestibility, CP, and RUP. Crude protein was 18.6% on a DM basis in May and IVDMD
was 68.1%. Values for CP dropped to around 13.7% in June and July, but returned to
around 15.5% in August and September due to fall regrowth. Values reported for RUP as
a percent of CP ranged from 11.7% to 14.4%. This means that 85% to 90% of the protein
being supplied from this pasture was RDP. Digested RUP as a percent of DM was
reported to be 1.31% in May and declined to around 0.80% during the other sampling
months. However, RUP values were measured using the mobile bag technique (Vanzant
et al., 1998) with a calculated rumen incubation time equal to 75% of mean retention time
based on in vitro dry matter digestibility (Klopfenstein et al., 2001). This technique may
not correctly assess RUP content of highly digestible forages consumed ad libitum with
rapid passage rate. In May, when the smooth bromegrass is highly digestible and
provides a large amount of RDP in a diet that has a relatively fast passage rate, chances
for bypass of soluble protein out of the rumen are at their peak. Bypass of soluble protein
coupled with digested RUP values being at their peak explain why RUP supplementation
is less effective early in the grazing season. As the forage matures and CP and IVDMD
decrease MP again becomes limiting and responses increase.

68
Experiment 2
Dry matter intakes (DMI) and organic matter intake (OMI ; Table 2) followed the
same trend, LQB and HQB treatments consumed the least, with ALF having the greatest
intake and OAT being intermediate. Intakes observed on a neutral detergent fiber basis
(Table 2) followed the opposite trend with LQB and HQB treatments having the highest
neutral detergent fiber intake (NDFI) and ALF having the lowest NDFI with OAT again
being intermediate. This trend is due to a low amount of NDF in both the ALF and OAT
diets as a percent of DM when compared to LQB and HQB treatments. Stefanon et al.
(1996) observed similar differences when looking at nutrient profiles of brome compared
to alfalfa. Brome contained much higher amounts of NDF as a percent of DM. Also as
both alfalfa and brome mature, NDF content increases. The LQB treatment was mature
brome and the HQB treatment was harvested as fall regrowth, but contained mature stems
as well. The ALF diet was immature, high quality alfalfa and the OAT diet contained
30% alfalfa and also very immature oat forage resulting in both diets being low in NDF.
Crude protein of the forages (Table 3) on a DM basis were 8.23%, 11.95%, 17.48%, and
17.44% for the LQB, HQB, ALF, and OAT treatments, respectively. Both the LQB and
HQB treatments would be expected to have very little bypass of soluble protein based on
experiment 1, but the ALF and OAT treatments were both expected to have greater
passage rates leading to bypass of some soluble protein prior to microbial utilization due
to excess RDP available in the rumen.
Total tract digestibility of DM (Table 4.1) and OM (Table 4.2) were measured
using titanium dioxide, AIA, and IADF and compared to in-vitro digestibility of the diets.
Trends were similar across all markers with respect to total tract DM and OM
digestibility. Each marker showed that OAT and ALF treatments had similar digestibility,

69
which were greater than both LQB and HQB treatments. However, using in-vitro
digestibility as a standard measure, AIA consistently overestimated both DM and OM
digestibility. Undersander et al. (1987) reported that AIA as a marker both overestimated
and underestimated DM digestibility of alfalfa grown under differing levels of water
stress. They concluded that AIA may be a useful marker in grasses but isn’t useful for
alfalfa. Sunvold and Cochran (1991) observed overestimated digestibility measures when
using AIA as an internal marker on alfalfa hay, when compared to total fecal collection
methods on the same feed. However, AIA was closely related to the brome diets within
this trial. Diets containing less than 0.75% AIA show variable results as a marker and
also contamination of dirt within feed ingredients can lead to skewed digestibility values
by increasing the amount of AIA in the feed. In this study the average AIA in the diet
across the trial was 0.72%. Due to the fact that alfalfa was fed as a complete diet and also
comprised 30% of the OAT diet, the overestimation of digestibility follows the previous
work. Both the HQB and LQB diets contained considerable amounts of small particles at
the bottom of the bunks, which could lead to sampling error and effect digestibility
values.
Using an external marker of titanium dioxide (TIO2) underestimated DM and OM
digestibility values compared to in-vitro values. However, OAT and ALF values
calculated were much closer than HQB and LQB values when TIO2 was used.
Titgemeyer et al. (2001) observed numerically lower digestibility values when using
TIO2 as a marker in forage based diets fed ad-lib compared to total fecal collections,
however marker method was not statistically different. Values for DM digestibility were

70
12% lower when calculated using TIO2 in that study. This study showed similar
differences and agreed with previous research.
When using IADF as a marker, both DM and OM digestibility values were very
close to the values determined using in-vitro techniques. Incubating feed samples for
168h and 240h helped ensure that only indigestible material was remaining. Samples
incubated for 168h and 240h had similar IADF values, which helped validate that only
indigestible material was remaining. The HQB treatment resulted in a 5.0% greater
digestibility, which was the largest deviation away from the in-vitro values for DM
digestibility. Using IADF in this study resulted in the closest digestibility values of any
marker used, when compared to in-vitro digestibility values. Conversely, Undersander et
al. (1987) reported that using IADF as a marker had a low correlation to total fecal
collection when digestibility values were calculated for alfalfa grown under differing
levels of water stress. However, they did report that recovery of IADF averaged 101.1%
and was not variable. Similarly, Sunvold and Cochran (1991) reported that IADF as a
marker underestimated OM digestibility compared to total fecal collection when diets of
alfalfa, brome, and prairie hay were limit fed to cattle housed in pens. Penning and
Johnson (1983) reported that IADF was a suitable marker when used over a variety of
forages fed to whether lambs. Using IADF as a marker had a higher correlation to in vivo
methods than using in vitro methods to predict digestibility. Overall, using IADF as a
maker in the current study resulted in values comparable to in-vitro digestibility values of
the feeds. The method used to measure IADF is important to ensure no washout of
particles from in situ bags as well as enough time for complete degradation of ADF
within the rumen.

71
Trends observed for NDF digestibility values were similar to DM and OM
digestibility values for all diets except ALF. The ALF treatment had the lowest NDF
digestibility in relation to all other treatments. Buxton and Brasche (1991) reported
similar findings during a 2 year study conducted using alfalfa, bridsfoot trefoil,
bromegrass, and orchardgrass. Forages were grown and harvested in order to determine
NDF content, lignin content, and NDF digestibility using lab procedures. Alfalfa had the
greatest lignin content at around 12.6% of DM compared to brome at 5.6% of DM.
Lignin, which is considered indigestible, reduces digestibility by chemically binding to
hemicellulose. Hemicellulose is a large portion of the NDF content of a plant, which led
to lower NDF digestibility of alfalfa (50.1%) compared to brome (62.0%). However,
alfalfa also had a lower NDF content on a dry matter basis compared to brome at 28.0%
and 47.4%, respectively. The current study showed similar results with alfalfa having a
lower NDF content and also a lower NDF digestibility compared to all other forages.
Measuring protein site of degradation in this digestion study was compromised
due to issues in duodenal sampling. T-style cannulas were utilized as duodenal cannulas,
which led to variable samples that may be inconsistent with actual duodenal flow.
Inconsistent sampling led to large amounts of variation and resulted in inconclusive
findings.
Passage rate was calculated by determining the concentration of cobalt in the
rumen at each given time point and using the natural log to determine percent passing per
hour. All treatments were statistically different (P < 0.01). Alfalfa had the highest liquid
passage rate at 13.18%/h with the LQB treatment having the lowest liquid passage rate at
6.98%/h. Passage rates of 9.29%/h and 10.84%/h were calculated for the HQB and OAT

72
treatments, respectively. These liquid passage rates align with the lack of need for
supplementation in the high CP and highly digestible forages in experiment 1. With an
increase in liquid passage rate in these highly digestible treatments like OAT and ALF
the chance for a bypass of soluble protein increases. These diets have high CP values and
soluble protein in the form of peptides and amino acids can leave the rumen in the liquid
fraction and be absorbed in the small intestine similarly to RUP.
Bypass RDP out of the rumen prior to microbe utilization was calculated based on
omasal samples that were collected. Using total CP of the omasal samples and subtracting
microbial protein, ammonia, and NDFN isolated the endogenous and bypass RDP
fractions. Calculations resulted in 10.01%, 8.19%, 4.22%, and 4.44% omasal CP of these
fractions, for ALF, OAT, HQB, and LQB, respectively. An assumption that no bypass
RDP is present in the HQB and LQB diets means that around 4.3% CP is from
endogenous sources. If this assumption is true, then animals fed the ALF and OAT
treatments have around 5.7% and 3.9% of DM bypass RDP within the omasum. Using
IVDMD to calculate fecal output and assuming 1.25 times fecal output to calculate
omasal flow allowed for calculations of total bypass RDP on a DM basis. Bypass RDP as
a percent of total forage CP was calculated to be 13.2% and 8.8% for the ALF and OAT
treatments, respectively. These values suggest some bypass of RDP occurred, however,
there are many assumptions in the calculations and the values are represented as relative
and not absolute values. For example, the microbial crude protein values based on purine
analysis appear to be low for the ALF and OAT diets.
Using omasal flows previously described multiplied by omasal CP values and
then divided by the total feed CP on a DM basis allowed for calculations of protein

73
recovery in the omasal samples. Calculations resulted in 51.0%, 39.4%, 81.7%, and
100.8% recovery for ALF, OAT, HQB, and LQB treatments, respectively. The lack of
recovery in the higher quality diets is due to ammonia absorption in the rumen and the
complete recovery of the LQB treatment helps validate calculations. Overall, results of
this trial show that some bypass RDP is present in the ALF and OAT diets and would
result in a lower MP deficiency in these diets, which would align with the results from
experiment 1.
Overall, utilizing markers to calculate digestibility of feedstuffs creates
challenges. Marker recovery is variable, dosing of external markers creates challenges,
and feed contamination from outside sources presents issues with internal markers. This
is one area that needs further research to help improve metabolism and digestion research
within our field.

74
Literature Cited Anderson, S. J., T. J. Klopfenstein, and V. A. Wilkerson. 1988. Escape Protein
Supplementation of Yearling Steers Grazing Smooth Brome Grass Pastures. J.
Anim. Sci. 66:237-242.
Bohnert, D. W., T. DelCurto, A. A. Clark, M. L. Merrill, S. J. Falck, and D. L. Harmon.
2011. Protein supplementation of ruminants consuming low-quality cool- and
warm-season forage: Differences in intake and digestibility. J. Anim. Sci.
89:3707-3717.
Buckner, C. D., T. J. Klopfenstein, K. M. Rofle, W. A. Griffin, M. J. Lamothe, A. K.
Watson, J. C. MacDonald, W. H. Schacht, and P. Schroeder. 2013. Ruminally
undegradable protein content and digestibility for forages using the mobile bag in
situ technique. J. Anim. Sci. 91:2812-2822.
Buxton, D. R. and Brasche, M. R. 1991. Digestibility of Structural Carbohydrates in Cool
Season Grass and Legume Forages. Crop. Sci. 31:1338-1345.
Buxton, D. R. 1996. Quality-related characteristics of forages as influenced by plant
environment and agronomic factors. Anim. Feed Sci. Tech. 59:37-49.
Crawford, G. I., C. D. Keeler, J. J. Wagner, C. R. Krehbiel, G. E. Erickson, M. B.
Crombie, and G. A. Nunnery. 2008. Effects of calcium magnesium carbonate and
roughage level on feedlot performance, ruminal metabolism, and site and extent
of digestion in steers fed high grain diets. J. Anim. Sci. 86:2998-3013.
Creighton, K. W., C. B. Wilson, T. J. Klopfenstein, and D. C. Adams. 2003.
Undegradable intake protein supplementation of compensating spring-born
steers and summer-born steers during summer grazing. J. Ani. Sci. 81:791-799.
Deinum, B., 1981. The Influence of Physical Factors on the Nutrient Content of Forages.
Mededelingen Landbouwhogeschool, Wageningen, The Netherlands.
Drouillard, J. and Klopfenstein, T. 1989. Protein Sparing Effects of Tetronasin in Grazing
Steers. Nebraska Beef Cattle Reports. p. 27-29.
Geisert, B. G., T. J. Klopfenstein, D. C. Adams, and J. C. MacDonald. 2007. Comparison
of In Vitro Digestibility to In Vitro Digestibility of Five Forages Fed to Steers.
Nebraska Beef Cattle Reports. 95.
Gillespie-Lewis, K. L, B. L. Nuttleman, J. D. Volesky, G. E. Erickson, T. J. Klopfenstein,
J. C. MacDonald, and A. K. Watson. 2016. Case Study: Distillers grains
supplementation in a forage system with spayed heifers. Prof. Anim. Scientist.
32:357-367.
Goedeken, F., T. Klopfenstein, and R. Stock. 1988. Protein and Energy Supplementation
of Calves Grazing Smooth Brome. Nebraska Beef Cattle Report. p. 58-59.

75
Hafley, J. L., B. E. Anderson, and T. J. Klopfenstein. 1993. Supplementation of Growing
Cattle Grazing Warm-Season Grass with Proteins of Various Ruminal
Degradabilities. J. Anim. Sci. 71:522-529.
Hollingsworth, K. J., T. J. Klopfenstein, and M. H. Sindt. 1993. Metabolizable Protein of
Summer Annuals for Growing Calves. J. Prod. Agric. 6:415-418.
Irlbeck, N., T. Klopfenstein, J. Drouillard, and D. Blasi. 1990. Corn Gluten Meal Versus
Corn Gluten Meal:Blood Meal. Nebraska Beef Cattle Reports. p. 65-67.
Karges, K. K., T. J. Klopfenstein, V. A. Wilkerson, and D. C. Clanton. 1992. Effects of
Ruminally Degradable and Escape Protein Supplements on Steers Grazing
Summer Native Range. J. Anim. Sci. 70:1957-1964.
Klopfenstein, T. K., R. A. Mass, K. W. Creighton, and H. H. Patterson. 2001. Estimating
forage protein degradation in the rumen. J. Anim. Sci. 79:E208-E217.
Mass, R., K. Creighton, and T. Klopfenstein. 2001. Changes to the Purine Assay Improve
Purine Recovery and Assay Precision. Nebraska Beef Cattle Reports. 308.
NASEM (National Academics of Science, Engineering, and Medicine). 2016. Nutrient
Requirements of Beef Cattle, Eighth revised edition, Washington, D.C.: The
National Academics Press
Penning, P. D. and Johnson, R. H. 1983. The use of internal markers to estimate herbage
digestibility and intake. J. Agric. Sci. 100:133-138.
Poppi, D. P. and McLennan, S. R. 1995. Protein and Energy Utilization by Ruminants at
Pasture. J. Anim. Sci. 73:278-290.
Rogers, J. R., R. W. Harvey, M. H. Poore, J. P. Mueller, and J. C. Barker. 1996.
Application of Nitrogen from Swine Lagoon Effluent to Bermudagrass Pastrues:
Seasonal Changes in Forage Nitrogenous Constituents and Effects of Energy and
Escape Protein Supplementation on Beef Cattle Performance. J. Anim. Sci.
74:1126-1133.
Stefanon, B., A. N. Pell, and P. Schofield. 1996. Effect of Maturity on Digestion Kinetics
of Water-Soluble and Water-Insoluble Fractions of Alfalfa and Brome Hay. J.
Anim. Sci. 74:1104-1115.
Sunvold, G. D. and Cochran, R. C. 1991. Technical Note: Evaluation of Acid Detergent
Lignin, Alkaline Peroxide Lignin, Acid Insoluble Ash, and Indigestible Acid
Detergent Fiber as Internal Markers for Prediction of Alfalfa, Bromegrass, and
Praire Hay Digestibility by Beef Steers. J. Anim. Sci. 69:4951-4955.
Titgemeyer, E. C., C. K. Armendariz, D. J. Bindel, R. H. Greenwood, and C. A. Loest.
2001. Evaluation of titanium dioxide as a digestibility marker for cattle. J. Anim.
Sci. 79:1059-1063.

76
Undersander, D. J., N. A. Cole, and C. H. Naylor. 1987. Digestibility by Lambs of Water-
Stressed Alfalfa as Determined by Total Collection or Internal Markers. J. Dairy.
Sci. 70:1719-1723.
Van Soest, P. J., J. B. Robertson, and B. A. Lewis. 1991. Methods for dietary fiber,
neutral detergent fiber, and non-starch polysaccharides in relation to animal
nutrition. J. Dairy Sci. 74:3583.
Vanzant, E. S., R. C. Cochran, E. C. Titgemeyer, S. D. Stafford, K. C. Olsen, D. E.
Johnson, and G. St Jean. 1996. In vivo and in situ measurements of forage protein
degradation in beef cattle. J. Anim. Sci. 74:2773-2784.
Vogel, G. J., G. W. Horn, W. A. Phillips, C. A. Strasia, and J. J. Martin. 1989. Effects of
Supplemental Protein on Performance of Stocker Cattle Grazing Wheat Pasture.
Anim. Sci. Res. Report. 127:208-216.
Volden, H., L. T. Mydland, and V. Olaisen. 2002. Apparent ruminal degradation and
rumen escape of soluble nitrogen fractions in grass and grass silage administered
intraruminally to lactating dairy cows. J. Anim. Sci. 80:2704-2716.
Watson, A. K., T. J. Klopfenstein, W. H. Schacht, G. E. Erickson, D. R. Mark, M. K.
Luebbe, K. R. Brink, and M. A. Greenquist. 2012. Smooth bromegrass pasture
beef growing systems: Fertilization strategies and economic analysis. Prof. Anim.
Sci. 28:443-451.
Wilkerson, V. A., T. J. Klopfenstein, R. A. Britton, R. A. Stock, and P. S. Miller. 1993.
Metabolizable Protein and Amino Acid Requirements of Growing Cattle. J.
Anim. Sci. 71:2777-2784.
Worrell, M. A., D. J. Undersander, C. E. Thompson, and W. C. Bridges, Jr. 1990. Effects
of Time of Season and Cottonseed Meal and Lasalocid Supplementation on Steers
Grazing Rye Pastures. J. Anim. Sci. 68:1151-1157.
Zinn, R. A. and Owens, F. N. 1986. A rapid procedure for purine measurement and its
use for estimating net ruminal protein synthesis. Can. J. Anim. Sci. 66:157-166.

77
Table 1. Pooled analysis papers, authors, and years.
Trial Authors Title Year
1/2 Anderson, S. J., T. J. Klopfenstein, and V. A.
Wilkerson
Escape Protein Supplementation of Yearling Steers Grazing
Smooth Brome Grass Pastures
1988
3 Drouillard, J. and Klopfenstein, T. Protein Sparing Effects of Tetronasin in Grazing Steers 1989
4 Goedeken, F., T. Klopfenstein, and R. Stock Protein and Energy Supplementation of Calves Grazing
Smooth Brome
1988
5/6 Hafley, J. L., B. E. Anderson, and T. J.
Klopfenstein
Supplementation of Growing Cattle Grazing Warm-Season
Grass with Proteins of Various Ruminal Degradabilities
1993
7/8 Hollingsworth, K. J., T. J. Klopfenstein, and
M. H. Sindt
Metabolizable Protein of Summer Annuals for Growing
Calves
1993
9 Irlbeck, N., T. Klopfenstein, J. Drouillard, and
D. Blasi
Corn Gluten Meal Versus Corn Gluten Meal:Blood Meal 1990
10 Karges, K. K., T. J. Klopfenstein, V. A.
Wilkerson, and D. C. Clanton
Effects of Ruminally Degradable and Escape Protein
Supplements on Steers Grazing Summer Native Range
1992

78
[Grab your reader’s attention with a great quote from
the document or use this space to emphasize a key
point. To place this text box anywhere on the page,
just drag it.]
[Grab your reader’s
attention with a great
quote from the
document or use this
space to emphasize a key
point. To place this text
box anywhere on the
page, just drag it.]
Figure 1. Pooled response in ADG above the control calves to RUP supplement in 10 studies subdivided by initial BW. The
additional ADG above the control supplement is graphed relative to amount of RUP supplement calves received.
Solid line: Relationship between amount of RUP supplement received and the ADG above the control animals for animals with an
initial BW of 300 kg or over (Hi).
Dashed line: Relationship between amount of RUP supplement received and the ADG above the control animals for animals with an
initial BW of 250 to 300 kg (Med).
Dotted line: Relationship between amount of RUP supplement received and the ADG above the control animals for animals with an
initial BW of 250 kg or below (Lo).
-0.200
0.000
0.200
0.400
0.000 0.050 0.100 0.150 0.200 0.250 0.300
AD
G a
bo
ve C
ntr
l (kg
)
RUP Supplementation (kg/hd/d)
y=0.97(+ 0.22)x𝑟2 = 0.70
y=0.44(+0.07)x𝑟2 = 0. . 77
y=0.51(+0.05)x𝑟2 = 0.83
P-Value
Hi vs Other < 0.02
Med vs Lo = 0.94

79
Figure 2. Pooled response in ADG above the control calves to RUP supplement in 10 studies subdivided by grazed forage type. The
additional ADG above the control supplement is graphed relative to amount of RUP supplement calves received.
Solid line: Relationship between amount of RUP supplement received and the ADG above the control animals for animals grazing
summer annual forages.
Dashed line: Relationship between amount of RUP supplement received and the ADG above the control animals for animals grazing
brome grass.
Dotted line: Relationship between amount of RUP supplement received and the ADG above the control animals for animals grazing
warm season grass.
-0.2
0
0.2
0.4
0.000 0.050 0.100 0.150 0.200 0.250 0.300
AD
G a
bo
ve C
ntr
l (kg
)
RUP Supplementation (kg/hd/d)
y=0.04(+0.17)x𝑟2 = 0.00
y=0.63(+0.08)x𝑟2 = 0.66
y=0.43(+0.07)x𝑟2 = 0.81
P-Value
Grass Type > 0.43
Annual vs 0 = 0.84
Other vs 0 < 0.01

80
Figure 3. Pooled response in ADG above the control calves to RUP supplement in 10 studies subdivided by CP of grazed forage. The
additional ADG above the control supplement is graphed relative to amount of RUP supplement calves received.
Solid line: Relationship between amount of RUP supplement received and the ADG above the control animals for animals grazing
forages containing 13.5% CP or less (Lo).
Dashed line: Relationship between amount of RUP supplement received and the ADG above the control animals for animals grazing
forages containing 13.5 to 17.0% CP (Med).
Dotted line: Relationship between amount of RUP supplement received and the ADG above the control animals for animals grazing
forages containing 17.0% CP or more (Hi).
-0.200
0.000
0.200
0.400
0.000 0.050 0.100 0.150 0.200 0.250 0.300
AD
G a
bo
ve C
ntr
l (kg
)
RUP Supplementation (kg/hd/d)
y=-0.29(+0.15)x𝑟2 = 0.38
y=0.47(+0.05)x𝑟2 = 0.83
y=0.70(+0.10)x𝑟2 = 0.65
P-Value
Hi vs Med = 0.02
Hi vs Lo = 0.09
Med vs Lo = 0.68
Hi vs 0 = 0.10

81
Table 2. Average dry matter, organic matter, and neutral detergent fiber intake of
treatments
Treatment
Intake (g/d) OATS4 ALF5 HQB6 LQB7
DMI1 8362 9199 6966 6475
OMI2 7489 8496 6899 6308
NDFI3 3810 3336 4684 4689 1DMI- dry matter intake 2OMI- organic matter intake 3NDFI- neutral detergent fiber intake 4OATS- 70% oat and 30% alfalfa treatment 5ALF- alfalfa treatment 6HQB- high quality brome treatment 7LQB- low quality brome treatment

82
Table 3 Feed nutrient analysis including NDF, ADF, and CP
Treatment
OATS4 ALF5 HQB6 LQB7
NDF1 53.24% 36.75% 61.51% 67.97%
ADF2 31.37% 29.80% 40.50% 49.34%
CP3 17.44% 17.48% 11.95% 8.23% 1NDF – neutral detergent fiber on a dry matter basis 2ADF- acid detergent fiber on a dry matter basis 3CP- crude protein on a dry matter basis 4OATS- 70% oat and 30% alfalfa treatment 5ALF- alfalfa treatment 6HQB- high quality brome treatment 7LQB- low quality brome treatment

83
Table 4.1 Dry matter digestibility values using in-vitro, AIA, TiO2, and IADF as
markers
Treatment
Marker OATS5 ALF6 HQB7 LQB8
In-Vitro1 66.62% 67.39% 49.20% 44.00%
AIA2 75.14% 79.76% 59.65% 60.50%
TiO23 62.77% 57.52% 36.69% 37.18%
IADF4 66.94% 66.85% 54.49% 45.51% 1In-Vitro- dry matter digestibility calculated using in-vitro measures 2AIA- acid insoluble ash 3TiO2- titanium dioxide 4IADF- indigestible acid detergent fiber 5OATS- 70% oat and 30% alfalfa treatment 6ALF- alfalfa treatment 7HQB- high quality brome treatment 8LQB- low quality brome treatment
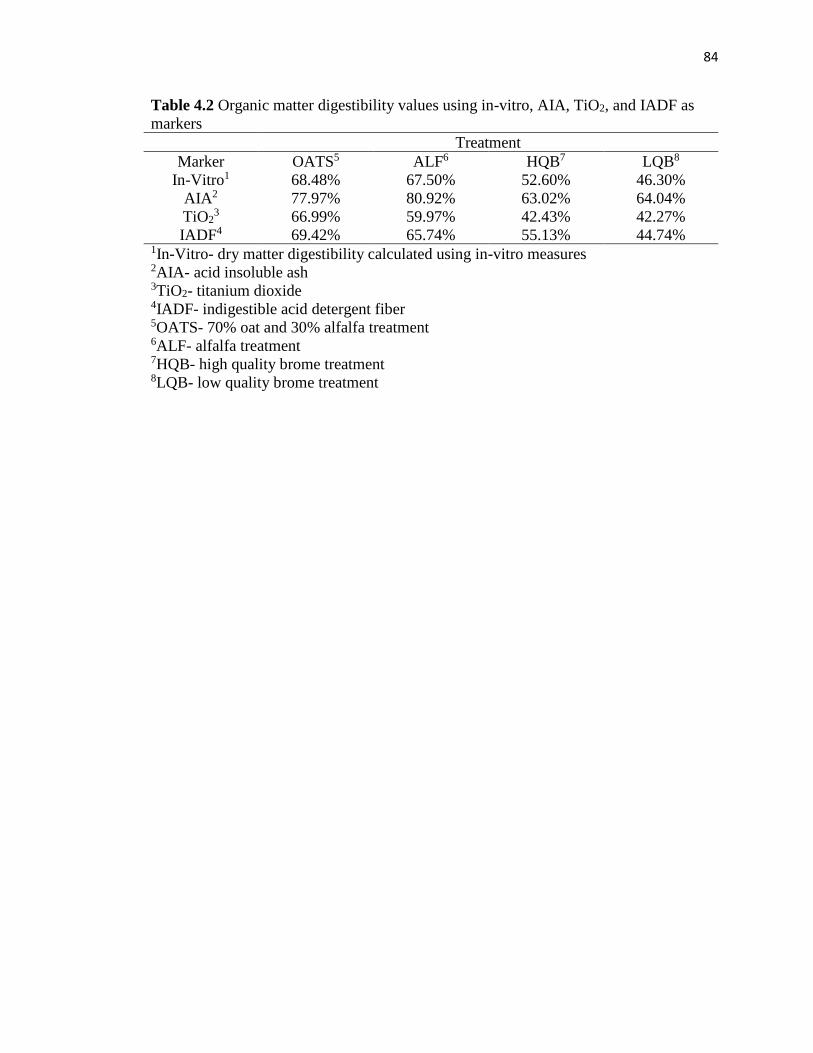
84
Table 4.2 Organic matter digestibility values using in-vitro, AIA, TiO2, and IADF as
markers
Treatment
Marker OATS5 ALF6 HQB7 LQB8
In-Vitro1 68.48% 67.50% 52.60% 46.30%
AIA2 77.97% 80.92% 63.02% 64.04%
TiO23 66.99% 59.97% 42.43% 42.27%
IADF4 69.42% 65.74% 55.13% 44.74% 1In-Vitro- dry matter digestibility calculated using in-vitro measures 2AIA- acid insoluble ash 3TiO2- titanium dioxide 4IADF- indigestible acid detergent fiber 5OATS- 70% oat and 30% alfalfa treatment 6ALF- alfalfa treatment 7HQB- high quality brome treatment 8LQB- low quality brome treatment

85
Table 4.3 Neutral detergent fiber digestibility values using AIA, TiO2, and IADF as
markers
Treatment
Marker OATS4 ALF5 HQB6 LQB7
AIA1 74.08% 67.60% 65.52% 62.44%
TiO22 61.25% 34.59% 40.31% 44.63%
IADF3 64.08% 42.75% 57.71% 47.59% 1AIA- acid insoluble ash 2TiO2- titanium dioxide 3IADF- indigestible acid detergent fiber 4OATS- 70% oat and 30% alfalfa treatment 5ALF- alfalfa treatment 6HQB- high quality brome treatment 7LQB- low quality brome treatment