EVALUATION OF POSTHARVEST QUALITY OF ICEBERG LETTUCE · EVALUATION OF POSTHARVEST QUALITY OF...
133
EVALUATION OF POSTHARVEST QUALITY OF ICEBERG LETTUCE BY CHLOROPHYLL FLUORESCENCE AND FlRMNESS A Thesis Presented to The Faculty of Graduate Studies of The University of Guelph by REX ANDREW SCHOFIELD In partial fulfilrnent of requirements for the degree of Master of Science May, 1999 O Rex Andrew Schofield, 1999
Transcript of EVALUATION OF POSTHARVEST QUALITY OF ICEBERG LETTUCE · EVALUATION OF POSTHARVEST QUALITY OF...

EVALUATION OF POSTHARVEST QUALITY OF ICEBERG LETTUCE
BY CHLOROPHYLL FLUORESCENCE AND FlRMNESS
A Thesis
Presented to
The Faculty of Graduate Studies
of
The University of Guelph
by
REX ANDREW SCHOFIELD
In partial fulfilrnent of requirements
for the degree of
Master of Science
May, 1999
O Rex Andrew Schofield, 1999

National Library of Canada
Bibliothèque nationale du Canada
Acquisitions and Acquisitions et Bibliograp hic Services services bibliographiques
395 Wellington Street 395. rue Wellington Ottawa ON KYA ON4 OttawaON K 1 A W Canada Canada
The author has granted a non- L'auteur a accordé une licence non exclusive Licence allowing the exclusive permettant à la National Library of Canada to Bibliothèque nationale du Canada de reproduce, loan, distriiute or seil reproduire, prêter, distribuer ou copies of this thesis in microform, vendre des copies de cette thèse sous paper or electronic formats. la forme de microfiche/nIm. de
reproduction sur papier ou sur format électronique.
The author retains ownership of the L'auteur conserve la propriété du copyright in this thesis. Neither the droit d'auteur qui protège cette thèse. thesis nor substantial extracts fkom it Ni la thèse ni des extraits substantiels may be printed or otherwise de celle-ci ne doivent être imprimés reproduced without the author's ou autrement reproduits sans son permission. autorisation.

ABSTRACT
EVALUATION OF POSTHARVEST QUALITY OF ICEBERG LETTUCE
BY CHLOROPHYLL FLUORESCENCE AND FlRMNESS
Rex Andrew Schofield
University of Guelph, 1999
Co-advisers:
Dr- Jennifer R DeEl1
Dr, Demis P- Murr
DBering cultivar tolerances and responses to stress during growth are
hypothesized to influence the photosynthetic apparatus and storage quality of iceberg
[ettuce. Hence chiorophyll fluorescence was measured as an indicator of the storage
potential at harvest. Chlorophyll fluorescence (Fv/F~~, qp, and q ~ ) invanably
indicated that the photosynthetic efficiency of 'Salinas' was supenor to 'Ithaca'. However,
after 14 and 21 days at 6°C- superior quality was attnbuted to either cultivar, depending
upon the harvest. Apparently, photosynthesis was only marginally infl uenced by preharvest
stresses affecting storage potential, and cultivar differences in inherent photosynthetic
capacity masked stress effects. In a second study, chforophytl fluorescence did not detect -
ethylene-induced stress of lettuce leaves held at 6°C for 1 1 days, even when stress
syrnptoms (msset spotting) were visible, suggesting the photosynthetic apparatus is
insensitive to ethylene stress. A new instrument-based defocmation test was found to
correlate highly with the traditional method of firmness evaluation of iceberg lettuce.

am tmIy gratefùl to my CO-advisors Dr. Demis Murr and Dr. Jennifer DeEU.
Demis, thanks for sharïng fiom your vast knowledge ofpostharvest physiology and len,
thanks for developing my sense ofresearch and teaching me many valuable sMls. I'm
proud to be your #1 graduate student (even though it is by default).
Mille merci aux gens du Centre de Recherche et de Dévelopement en Horticulture
à Saint-Jean-sur-Richelieu. Sylvie Jemi, sans ton expertise je n'aurais pas réussit à f i re
pousser une bonne récolte de laitue. Merci pour ton temps et pour m'avoir donner une
partie de tes champs. Merci à la coopération des producteurs Multi-Veg pour l'utilization
de leur vacuum cooler, ainsi qu'à Jean-Bernard and Léo Van Winden qui ont
génèreusement donne un partie de leur champs pour ce projet. Many thanks to the storage
kids: Tim Rennie, Anita LaMendola, Claudia Beaudry, Catherine Hui, Rita, Annie,
Stephanie, and Frederick. 1 am particularly indebted to Samantha Pol1 who contnbuted
much of her tirne to the second surnrner's experiments. Clément Vigneault, merci pour ton
exemple et tes qualités de chef Yvan Garïepy, merci pour tes conseils sages et ton
expenence. Mes chers amis Pierre "Limace" et Dominique, merci pour tout. Un beau jour,
alors que vous vous y en attendez pas, j'entrerai à toute vitesse dans votre laboratoire en
criant "1-1-Ick Dominique!" Marlene, Bernard, Amelie, Matthew, et Nicholas votre accueil
chaleureux et votre amitié sont incomparable; je vous aime tous. J'envoie mes sincères
remerciments à Thérèse Otis qui a été ma 2i"e mere à St.-Jean. Peter Toivonen and
Ikechukwu Edeogu, my feIiow overworked "graduate students", thanks for your
friendship and for spuning my love of research, someday we'll have a Guinness at

Beetoveen's. Sylvain Côté and Geneviève Roy j'espère pouvoir avoir une autre jam
session avec vous et d 'der voir Bob Walsh. Aussi j'envoie un grand salut à Sylvain Fortin
et Benoit Lacasse. Je veux remercier Gaétan Bourgeois, Shahrokh Khanizadeh, et Ashton
Statistical Consultants pour leurs conseils en statistique. Merci à Michel Fortin et tout le
monde à Ste-Clotilde qui se sont occupé de mes laitues. Merci à Guy Boulet, Lise
Lavaliée, Gaston Mercier, Gaétan Trahan, and Gilles Tremblay qui m'ont tous aidé a
plusieurs reprises.
Thanks to the staffand students in the Horticultural Science Division at Guelph.
Many blessings to my fnends Len Wiiey, Dave LlewelIyn, Jen Hobson, Roycelyn St. Hill,
Ron MueDer, and Vasantha Rupaskghe. Thanks to Dr. Souza-Machado for being on my
advisory cornmittee, and to Dr. Sullivan and Dr. Fletcher for sitting on my examination
committee-
1 am most appreciative of my family. Mom and dad, you seifiessly poured so much
of yourselves into my Life. Thank you for encouraging and enabling the growth and
education which prepared me to undertake this degree. Nick and Paula, 1 think you're
awesome and I'm proud of the people you've become. Andrea, my d e , thank you for
braving the sacrifices placed upon our [ives by this degree. You are my truest ûiend. God
and Father, I thank you for bnnging all these people into my lie, for providing the
opportunity to commence this degree, and for the granting the wisdom and grace to
complete it.

TABLE OF CONTENTS
CHAPTER 1 Introduction
1.1 Postharvest Quality Evaluation of Lettuce: Objectives . . . - . . . . . . . . . . . . . 1
1.2 Applications of Chlorophyll Fluorescence Techniques . . . . . . . . . . . . . . . . . . 2
1.3 OveMew of Photosynthesis - . . . - - - . . - . . . - - .. - . - . . . . - - , . . - - - . - _ - - . 4
1.4 Chiorophyli n Fluorescence - . . . . . . - - . . - . . . . . . . . , - . . . . - - . . . - - - 9
1 -5 Chlorophyli Fluorescence and Detection of Vegetation Stress . . - . . . . . . . . . 1 9
1.6 Iceberg Lemice: Characterization and Economic Importance . . . . . . . . . . . . 22
1.7 Iceberg Lettuce: Production - . . . - . . . . . . . . . . . . . . . . . . . . . . . . . . . . . . . . 23
L -8 Iceberg Lettuce: Postharvest HandIing and Storage . . - . . . . - . . - . - - - - - - . 25
1.9 Generation of Activated Oxygen in Chloroplasts and Coping Mechanisms . . 30
CHAPTER 2 Characterization of Variation in Chlorophyll Fluorescence
Measurements
CHAPTER 3 Effects of Field Stress on Chlorophyll Fluorescence and Storage PotentiaI of Two Lettuce Cultivars at Harvest
,.- Ill

CHAPTER 4 Chlorophyll Fluorescence as a Potential Indicator of Russet Spotting, a Disorder Induced by Ethylene Stress
CHAPTER 5 Standardized Finnness Evaluation of Iceberg Lettuce, an tnstrument-
Based Method
CHAPTER 6 Concluding Discussion . . . . . . . . . . - . . - . . . . . . . . . . . . . . . . . . . . . 109
LITERATURECITED-.r-+----.-----_-------------.-----.---------- 1 IO
LIST OF TABLES
CHAPTER 1
1.1 Chiorophyil fluorescence nomenclature (fkom DeEii et al 1999; Krause and Weis 199 1; van Kooten et al, 1997; van Kooten and Snel 1990) - . - . - - . - - . 18
1.1 Respiration rates and heat generated by respiration of head lettuce aored at vanous temperatures (fiom CantweU and SusIow 1997) . . - - . - . . . - _ . . - . . 26
CHAPTER 2
Light intensities and test times for the dark-adapted kinetic and light-adapted yield tests of chiorophyll fluorescence . , . - - - . . - - . . . .. . , - . . . - . . - - - - . - . 3 5
C Moro p hyii fluorescence measurement s of the t hree Ieaf layers, averaged over heads and subsamples - - - . . . . . - . . . - - .. . . - . . . - - - . - . . - . - - . . - . 39
Sources of experimental error in fluorescence measurernents, demonstrated by the ratio of variation among locations to variation arnong heads ( 0 2 ~ 0 2 ~ )
and the standard error ofthe mean (a) estimated for expenments of varying numbers of head and location measurements, expressed as a percentage of the mean (P..) . . . . . . . . . . . . . . . . . . . . . . . . . . . . . . . . . . . . . . . . . . . . . . . 40
Growing times and locations of the four harvests - . . - . . . - .. - - - . . . - . . . . 47
Firmness and visual quality evahation scales (eom Kader et al. 1973b) - - . - 49
Rating scales for the evaluation of extemal rot, extemal nb blight, intemal defects, intemal rot and flowerstalk development . . . . . . . . . . . . . . . . . . . . . 5 1
Evaluation of extemal rot for harvest 4 (from Kader et al. (1973b) . . . . . . . 52
Light intensities for dark-adapted kinetic test and fast actinic test, and light- adapted yield tests of chlorophyli fluorescence for harvests 1 to 3 . . . . . - . . . 53
Light intensities and test times for dark-adapted kinetic and light-adapted yield tests of chiorophyil fluorescence for harvest 4 . . . . . . . . . . . . . . . . . . . 54


LIST OF FIGURES
CHAPTER L
1.1 Kïnetics of chiorophyli a fluorescence yield, measured with a modulation fluororneter (fiom Schreiber et aL 1986; Büchel and Wilhelm 1993) - . . . . . . 1 1
CHAPTER 3
DiEerences in chlorophyli fluorescence measurements and parameters of 'Ithaca' and 'Satinas' cultivars measured at harvest , - - - - - - _ - - , , - - - . - -
Evaluation of external rot of 'Ithaca' and 'Salinas' cultivars held at 6 OC for upto2ldays ................................................
Visual quality of 'Ithaca' and 'Salinas' cultivars held at 6 OC for up to 2 1 ....................................................... days
Composite quality of 'Ithaca' and 'Salinas' cultivars held at 6 OC for up to 21 days .......................................................
Trends in initial weight and weight l o s ~ of the four harvests: harvest and cultivar dinerences in initial weight; harvest and cultivar differences in weight loss averaged over the three removal times; and progression of weight loss during storage. ~.................................-...
Cultivar differences in firmness for the four harvests and progression of firmness dunng storage ........................................
Daily maximal and minimal field temperatures (OC) recorded at Ste-Clotilde during the sumrner of 1998. The curves were fitted to plotted points of five- daymeans . . . . . . . . . . . . . . . . . . . . . . . . . . . . . . . . . . . . . . . . . . . . . . . . . .
Daily maximal and minimal field temperatures (OC) recorded at Ste-Clotilde during the summer of 1997. The curves were fitted to plotted points of five- daymeans ..................................................
Daily precipitation (rnrn*m-2- d-') and radiation (UT. m-'9 6 ' ) at S te-Clotilde during the summer of 1998. The curves were fitted to plotted points of five- d a y m e a n s , , , . , - . , . , , . . , . , , . - - - . - . - - - . - - - - - - . - - . - - . . - - - - - - - .

3. L O Daily precipitation (mmmi2*d-') and radiation ( ~ ~ . r n - ~ - d - ~ ) at S te-Clotilde during the summer of 1997. The curves were fitted to plotted points of five- d a y m e a n s _ - - - - - , , , , - , - - - - - - - - - - - - - - - - - - - - - - - - - - - - - - - - - . - - - - 70
CHAPTER 4
4.1 Progression of quaiity (A to D) and chlorophyil fluorescence (E to R) of individual iceberg lettuce leaves in repticates 1 and 2, held at 6 "C for 11 days, in air with or without (A) 50 10 ~ L - L - ~ ethylene . . . - . - - . - . - . 93
CHAPTER 5
Three-dimensional depiction of the quadratic response surface which best descnbed the relationship between the hand compression measurements and the instrument measurements of sample deformation (over the force range of 30to40N),asdescribedbyEqn.5.3 ..-........................... 104
Two-dimensional depiction of quadratic response surface which estimates h e s s values (rings) nom the deformations (mm) of top and averaged side positions, measured over the force span of 30 to 40 N ................. IO5
Slices of Fig. 5.3 at tixed values of top position deformation (mm) .. . . - . - . 106
Distribution of postulated s2 values used to calculate the number of sarnples required to estirnate the mean firmness (* O S units) of a fùture population of lettuce (with 95 % confidence), assurning firmness 22.0 ................ 108
CBGPTER 1
Introduction
1.1 Posthawest Quaiity Evaluation of Lettuce: 0 bjectives
Lettuce, Lacrtcca sativa L., is considered to be one of the most important
vegetables grown in North American. Despite its relatively low nutritional value, it has a
vety large volume of consumption per capita and is of great economic importance Peirce
1987). 'Iceberg7 cultivars are predominantly outdoor types and are by far the most widely
used in North Amerka. This type of lettuce is sometimes referred to as 'head' or
'crisphead' lettuce, descnbing the large, heavy, tightly folded heads and the leaves which
are brittle or cnsp-textured and have prominent veins (Peirce 1987).
In 1997, the farm value of commercial vegetable crops in Ontario, Québec, and a11
of Canada was approximately $462, 252, and 100 1 million, respectively (Institut de la
statistique de Québec, 1999 website, http:. ivir. iesf~gorii~~qc~ca domtot ng-iczilr
ap-ico. htm=otgro). In 1998, Ontario comrnercially produced 7 -6 million kg of icebers
Iettuce over 182 ha, averaging 29 cents-kg-', with a total farm value of $ 2-14 million
(OMAFRA Horticultural Crop Statistics, 1999 website. htp:.:ii~ncgoi~.o~z~cn On/UFRtl
e~zgfish/s~rnls~hoor-~It~dex~hfm~)~ In 1997, the total USA iceberg lettuce crop for fresh
market was harvested fiom 8 1,700 ha; yielding 62,200 million kg; and had a total value of
$1.19 billion (USDA statistics cited at Purdue University Website 1999, http:,O'
ivim v. hort.pzwdzie. e d z ~ / r h o d c v # i o r ~ -
Iceberg lettuce is a cool-season crop requiring - 85 days to grow, is harvested by
hand, pre-cooled by the vacuum method, and can be held 3 to 4 weeks at optimal

conditions (O O C and > 95 % relative humidity) (Swiader et al. 1992). Postharvest quality
evaluation is certainly an important part of this industry and irnproved evaluation methods
could result in economic gains by providing the industry with the information necessary to
make wise decisions conceming the cornmodity's maturity for harvest, healthlstress at
harvest, and storage potential-
This thesis explores two methods of postharvest quality evaluation for iceberg
lettuce through three main objectives. The Grst objective was to evaiuate t h e use of
chlorophyll fluorescence as a predictor of iceberg lettuce shelf-life, when measured at
harvest. Diffenng cultivar tolerances and responses to stress during growth were
hypothesized to intluence the photosynthetic apparatus and storage quality of iceberj
lettuce, thus enabling chlorophyll fluorescence to indicate the storage potential at harvest,
even in the absence of visible differences in quality- The second objective was to evaluate
the use of chiorophyll fluorescence measurernents as early indicators of stress induced
during the storage of iceberg lettuce. It was hypothesized that ethylene-induced stress acts
at a cellular level to cause russet spotting and that these biochemical changes may also
affect photochernistry, enabling chlorophyll fluorescence to act as an early indicator of the .
stress. The third objective was to develop an instrument-based method to detennine the
firmness of iceberg lettuce and to evaluate the practical utility of such a method.
1.2 Applications of Chlorophyll Fluorescence Techniques
Chlorophyll a fluorescence is a phenornenon that is observed in green plants, and
in algal and cyanobactenal ceiis. It is light that has been absorbed by the photosysterns and
is later re-emitted as light. This is one of the many processes which cornpetes with
2

photochernistry for the use of absorbed tight energy, and is one of the mechanisms
photosynthetic organisms use to manage absorbed energy and protect against darnage due
to excess absorption. By manipulating the conditions in which the photosynthetic tissue
receives light, chlorophyll fluorescence measurements c m provide information pertaining
to the physical status of the photosynthetic apparatus, which may in tum reflect the status
of the entire tissue. Thus the appealing aspect of these measurements is their potential to
provide information conceming cellular function on a biochemical levet, but with a
macroscopic measurement that is acquired in a nondestructive manner, within a relatively
short period of time (a few seconds to a few minutes). However. the drawback is that
chlorophyll fluorescence is a very complicated phenomenon, making it difficult to interpret
the measurements.
The information obtained by chiorophyll fluorescence concerns the biochernistry of
Iight absorption, excitation energy transfer, and the photochemical reaction in photosystem
II. Since these components are inter-co~ected with other photosynthetic events (Le.
electron transport. proton transfer across the thylakoid membranes. photophosporylation.
and CO2 assimilation) any factor acting upon one of these aspects may in tum influence
the fluorescence yield (Krause and Weis 1988). Renger and Schreiber (1 986) describe
several factors which influence a fluorescence induction curve: light intensity, temperature,
pre-illumination, light-adaptational state, gas composition, humidity, tissue age, and plant
'pre-history', possibly inciuding exposure to environmental stresses. Control curves of
chlorophyll fluorescence can be obtained by keeping al1 controllable factors at standard
values. The application of any treatment affecting the state of the p hotosynthetic apparatus
should make distinctive adjustments to the control curve (Renger and Schreiber 1986).

In research, this tool is most usefil to someone who understands the biochemical
principles of photochemistry in order to properly interpret the measurements; however,
once a protocol has been developed for a specific purpose, this technique can then be
useful to someone who has no training or comprehension ofthe processes involved. There
are many advantages to using chlorophyii fluorescence measurements to evaluate stress-
induced injuries in plant tissue (SmiUie et al. 1987): (1) the measurement is made directly
on living plant tissue, (2) the method is nondestructive, so that the same area of Ieaf or
fruit can be measured throughout an experïment, (3) some variable fluorescence
measurements take only a few seconds, thus these are suitable for screening applications
(other variable fluorescence measurements take a few minutes but may stiIl be suitable for
some applications), (4) cellular injury is detected weli in advance of the development of
visible symptoms, (5) measurernents can be recorded during treatments and can be
continued afterwards to follow recovery or deterioration, (6) portable measuring
equipment is available, and (7) hardware/software for data processing and storage may
also be integrated into the measuring equipment.
1.3 Overview of Photosynthesis
Photosynthesis is the process in which green plants, algal, and cyanobactenal cells
convert energy fkom the Sun into storable forms (simple sugars, eg. glucose and fnictose),
having the general equation:

Distributed throughout the chioroplast stroma is the thylakoid apparatus which
hamesses Iight energy and stores it temporariiy as ATP and NADPH (light reaction).
These high energy molecules are used to convert COz ïnto sugars (dark reaction) in the
stroma. The thylakoid membrane is a lipid bilayer which separates the chloroplast stroma
(a gelatinous and enzyme-rich medium) fiom the thylakoid intenor, the lumen a salty
solution containing rnost ofthe pigments and proteins vital to the dark reaction of
photosynthesis (Salisbuxy and Ross 1992). This membrane is charactented by two types
of regions: the grana and stroma lamellae. Most grana Iamellae resemble circular pouches
which are configured in stacks forming the appressed regions. The nonappressed regions
are the stroma membranes which are present in an unstacked form and are joined to the
ap pressed regions (Hankamer et aL 1997).
Photons of light energy drive the reactions which oxidize H20 and pass the
electrons along a chain of compounds to the final acceptor, NADP-, which is reduced to
NADPH, a high energy compound. This process also creates a chemical potential gradient
of protons across the thylakoid membrane which in tum drives ATP synthesis. This can be
sumrnarized by:
H20 + 4 photons + MOz + 2 + 2 e- (1 -2)
NADP' + 2K + 2 e + NADPH + HC (1-3)
HzO + 4 photons + NADP' 9 '/;.O2 + NADPH + K (1.4)
These equations give a true account of the electron and energy pathways; however, they

misrepresent what happens to the protons. For every water molecule split, two protons are
released into the Lumen, and another two are carried in from the stroma during electron
transport; the proton added to NADP* cornes 60m the stroma Thus the lumen K
concentration can become up to 1000 times as great as that of the stroma. ATP synthase
can manufacture - one ATP (corn ADP and Pi) for every three protons added to the
gradient (Salisbury and Ross 1992).
There are four main photosynthetic pigments: chlorophyii a and 6, which absorb
light most strongly at the violet, blue, orange, and red wavelengths, and p-carotene and
xanthophyll, which absorb most strongly the blue and violet wavelengths. Al1 of these
pigments absorb the yellow-green wavelengths very weakly; however, unabsorbed Iight is
reflected in the leafcausing it to strike several chloroplasts and thus increasing the chances
of absorption. In the end, half or more than halfof this Iight is absorbed (Salisbury and
Ross 1992).
A photon of light absorbed by a photosynthetic pigment causes the transition of an
electron to a higher electronic, vibrational, or rotational level, or any combination of the
three. There are a number of ways in which the electron may return to ground state.
Vibrational relaxation converts some or al1 of the energy to heat, which dissipates to the
surroundirig media. Fluarescence is a radiational transition to a lower state with the same
spin quantum number (Le. singlet to singlet), whereas phosphorescence is a radiational
transition to a different spin quantum number (i-e. triplet to singlet). The lifetimes of
fluorescence and phosphorescence are - IO-' to L O - ~ s and IO-' to 1 o2 s, respectively
(Hams 1995). However, with photosynthetic pigments exciton transfer through inductive
resonance is a common occurrence: the excited electron falls to a lower level while its

energy is transferred to an adjacent molecule which in mm excites an electron-
The thylakoid apparatus can be broken down into four main groups: photosystem CI
(PSII), cytochrome b6-cytochrome f complex (cytb6-f complex), photosystem 1 PSI), and
ATP synthase. The PSII reaction center contains two major proteins, D L and D2, which
bind certain compounds involved in the oxidation of water and the electron transport
chah. The reaction center incorporates six chiorophyll a, two p-carotene, two pheophytin,
four manganese, and two plastoquuione molecules as weli as the primary oxidant, P680,
which is thought to consist of two chlorophyll mo1ecuIeç ligated to the DL and D2
proteins (Hankamer et al. 1997). The PSII core complex contains the- reaction center
complex as weli as a number of other proteins. Among these are the 33,23, and 16 kDa
proteins which facilitate the water oxidation process by stabilizing the Mn cluaer and
binding ca2& and Cl-, and the CP47 and CP43 pigment-binding proteins which appear to
be involved in the transfer of excitation energy fkom the iight harvesting complex to the
reaction center (Hankamer et al. 1997). The tight harvesting complex of PSII (LHCU)
accornmodates 200 to 300 moIecuIes of chlorophyll a and 6 per reaction center and many
carotenoids (P-carotene, lutein, neoxanthin, violaxanthih anrteraxanthin, and zeaxanthin).
This complex acts as an antenna system which passes absorbed energy to the P680
reaction center via inductive resonance (Hankamer et al. 1997). The main protein complex
of LHCII is trimenc, Lchb 1-3, binding - 60 % of PSII chiorophyll. The minor LCHII
complexes (Lchb4-6) are rnonomenc, binding - 5 % of PSU chlorophyll and have been
suggested to Iink Lchb 1-3 to the core complex (Hankamer et al. 1997, and Horton ci al.
1996).

Once P680 of the reaction center is excited, the foilowing series of reactions occur
(Govindjee 1995) (Eq. (1 -5)):
Si Z P680* Ph QA QB
(1) r 3 PS
Si Z P680' Ph- QA QB
(2) s 200 ps
S i Z P680' Ph QA- QB
(3) r 20 ns
Si Z P680 Ph Q-4- QB
(4) 2 200 ps
Si Z- P680 Ph Q.* QB-
( 5 ) 5: 600 ps
Sz Z P680 Ph QA QB-
(6) 5: H
QB- has a long Lifetime.
Mer protonation and another
excitation, the reaction continues:
Where Sn represents the redox States of the Orevolving Mn complex, Z is the secondary
electron donor (tyrosine161 residue of the Dl protein), P680 is the primary oxidant of the
PSII reaction center ('*' indicates excition), Ph is pheophytih Q A is the one-electron
accepter-bound plastoquinone, Qs is the two-electron acceptor-bound plastoquinone, and
PQ is a mobile plastoquinone (Govhdjee 1995).
The reduction of PQ to PQH2 involves two K from the stroma, which are released
into the lumen when PQHz transfers the two electrons to the cytb6-fcomplex. The cytb6-f
complex reduces two molecules of plastocyanïn, which reduce P700' of the PSI reaction
center. When PSI receives energy tiom its light harveaing complex it will excite one of its
electrons and pass it dong to what is thought to be another chlorophyil a molecule. The
next molecule which receives the electron is believed to be phyiioquinone, which then
passes the electron to another iron-sulfùr protein (4Fe-4S protein). The iron-sulfùr portion
of ferredoxin (2Fe-2s protein) is the final intermediate. Lady, two ferredoxin molecules
are needed to reduce one NADP' (and to NADPH (Salisbury and Ross 1992).
In the chloroplast stroma, the energy hamessed by these hght reactions (NADPH
and ATP) is used in the fixation and incorporation of COz into the Calvin Cycle.
1.4 Chlorophyll a Fluorescence
Chlorophyll a fluorescence is a phenomenon observed in green plants, and in algal
and cyanobacterial cells. It is light that has been absorbed by the photosystems and is later
re-ernitted as a longer wavelength of light. This is one of the many processes which
cornpetes with p h o t o ~ h e ~ s t r y for the use of absorbed light energy. and is one of the
mechanisms photosynthetic organisms use to manage absorbed energy and protect against
damage due to excess absorption. The Iight induction kinetics of chlorophyll a
fluorescence were first described by Kautsky and Hirsh (193 1) who observed an inverse
relationship between in vivo fluorescence and photochemical activity. Under optimal
conditions of low iight ïntensity, more than 90% of absorbed light quanta are utilized by
photosynthesis (Bj6rkman and Demming 1987) and in intact plants - 3% of absorbed light
is lost as chlorophyli a fluorescence (Krause and Weis 1991)- At room temperature - 90%
of chlorophyll a fluorescence is emitted nom PSU antenna compIexes. the rest is fiom
PSI. However, only PSI1 fluorescence varies with changes in photochemistry (variable

fluorescence) (Govindjee 1995). The strongest chlorophyll a fluorescence maximum tiom
LHCII is at 685 nm, but the broad vibrational satellite bands fiom 720 to 760 nm
(Govindjee 1995) are comrnody measured by commercial fluorometers because light of
these wavelengths is more easily disthguished from that of excitation wavelengths by the
use of filten (Schreiber and Bilger 1987). It is important to remember that the
fluorescence yield reflects the coiiective status of al1 photosynthetic units in the sample, so
conclusions drawn fiom these measurements relate to the entire popuhtion of PSII units in
the tissue.
The fluorescence yield of a sarnple depends largely upon the redox state of
Since photochemistry is the major de-excitation pathway of absorbed photons, there is a
low probability of fluorescence occurring ifthe PSIl reaction center is open, i.e. QA is
oxidized and able to receive an electron (initial condition of Eq. 5- 1)- However, once Q.\
has received an electron (Eq. 5.1, reaction 2), the reaction center is considered closed
because no more electrons can pass through until QA- is reoxidized (Krause and Weis
199 1).
Dark adaptation of a leafis a common prerequisite for the determination of many
chlorophyll fluorescence measurements because the reaction centers and most of the PQ
pool are oxidized in this state. As the flow of electrons is stopped, the transthylakoid
proton gradient dissipates resulting in the inactivation of ATPase (Büchel and WilheIm
1993). ATP and NADPH formation ceases and Calvin-cycle enzymes become inactivated-
In higher plants, dark adaptation is reached within 15 to 30 min of darkness (Büchel and
Wilhelm 1993).
The typical fluorescence response of a dark-adapted leaf is represented in Fig. 1.1.

Fig. 1.1. Kinetics o f chlorophyll a fluorescence yield, measured with a modulation
Buororneter, where ML indicates the illumination of the continuous modulated light, SP
indicates a bnef (< 3 s) saturating pulse, + AL indicates the illumination o f the continuous
actinic light, - AL indicates when the actinic light is switched otf, and + FR is the
illumination of the far red light (£tom Schreiber et aL 1986; Büchel and Wilhelm 1993).
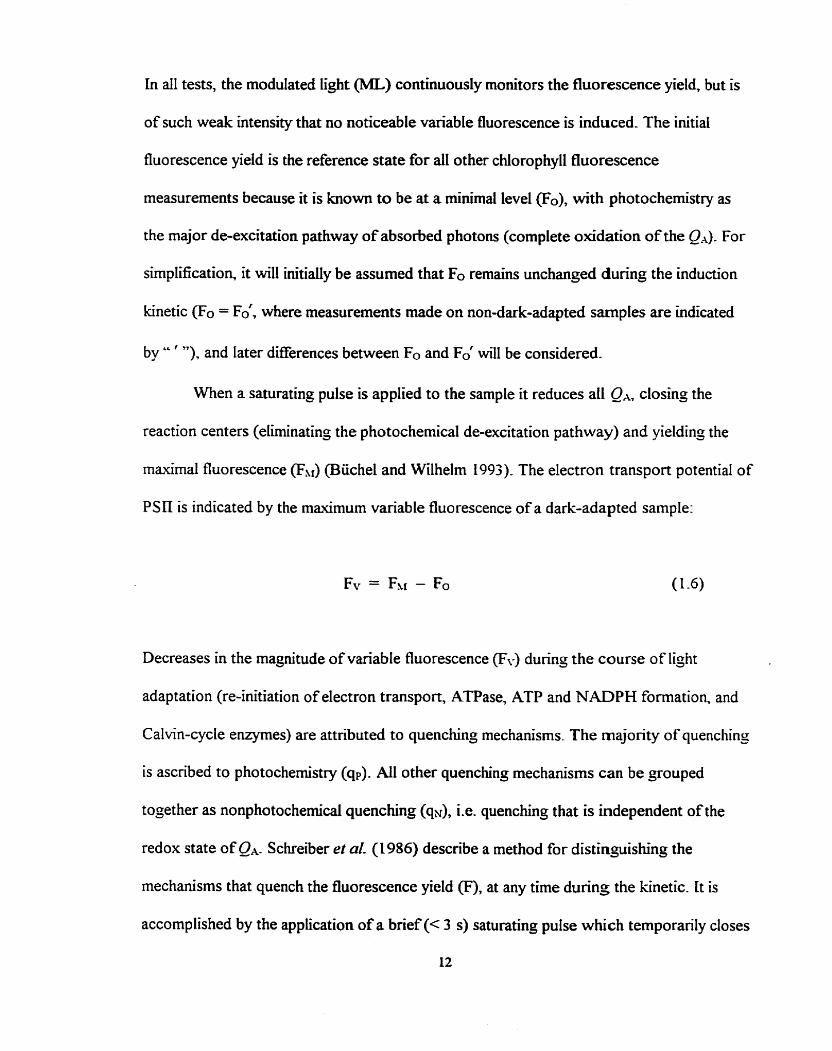
In all tests, the modulated tight (ML) continuously monitors the fluorescence yield, but is
of such weak intensity that no noticeable variable fluorescence is induced. The initiai
fluorescence yield is the reference state for al1 other chlorophyI1 fluorescence
measurements because it is known to be at a minimal level (Fo), with photochemistry as
the major de-excitation pathway of absorbed photons (complete oxidation of the @A). For
simplification, it will initially be assumed that Fo remains unchanged dut-ing the induction
kinetic (Fo = F A where measurements made on non-dark-adapted samples are indicated
by " ' "), and later differences between Fo and For will be considered.
When a saturating pulse is applied to the sample it reduces al1 QA, closing the
reaction centers (eliminating the photochemical de-excitation pathway) and yielding the
maximal fluorescence (FIr) (Büchel and Wilhelm 1993). The electron transport potential of
PSI1 is indicated by the maximum variable fluorescence of a dark-adapted sample:
Decreases in the magnitude of variable fluorescence (Fy) during the course of light
adaptation (re-initiation of electron transport, ATPase, ATP and NADPH formation, and
Calvin-cycle enzymes) are attnbuted to quenching mechanisrns. The majority of quenching
is ascribed to photochemistry (qp). AU other quenching mechanisms can be grouped
together as nonphotochernical quenching (q& i.e. quenching that is independent of the
redox state of QA. Schreiber et aL (1986) describe a method for distinguishing the
mechanisms that quench the fluorescence yield 0, at any time during the kinetic. It is
accomplished by the application of a brief(< 3 s) saturating pulse which temporarily closes
12

PSU reaction centers (qp = O), yielding the maximal fluorescence in the Iight
(Schreiber et al. 1986; Buchel and Wilhelrn 1993). The dEerence between FL; and the
original FO formulate the new (quenched) Fv.-
The coefficient qs (a number Eom O to 1) represents the decrease fiom the original, dark-
adapted FV to the light adapted F;, thus Fk! equals:
The fluorescence yield at any time (F) when nonnalized to the minimal reference (F - Fo)
is equal to:
Now rearranging Eq. 1.8 and subduting Eq. 1.7:

Similady, the coefficient q p is a number from O to 1 which represents the decrease in F\'
attributed to photochernical quenching:
q p indicates the photochernical efficiency of excitons captured by PSII reaction centers
because it is directly proportional to the percentage of oxidized ClA- Ifa saturating pulse
induces a small amount of variable fluorescence, it indicates that mon of the Q,l had
already been closed by the actinic light, and thus electron transport from PSIl to PSI was
very inefficient. However, if a saturating pulse induces a large amount of variable
fluorescence, Le. the reduction of a large percentage of QA, it suggests that electron
transport fiom PSI1 to PSI had been quite efficient. Krause and Weis (199 1) point out that
q p is presumably larger than the percentage of oxidized QA due to energy migration tiom
closed to open reaction centers. AdditionalIy, a tme Fki can be reached only when PQ is
reduced, since in its oxidized fom PQ has been shown to act as a quencher (Vemotte rr
al. 1979).
Taking into account that Fo changes dunng the induction kinetic (Büchel and
Wilhelrn 1993), the quenching coefficients are:

Non-photochernical quenching of Fkt can be quantified by a slightly different
approach. The parameter caiied NQP (non-photochernicd quenching) is based upon the
Stern-Volmer equation which expresses the ratio of "quenched" to "remaining"
fluorescence (Krause and Weis 199 1; Bilger and Bjorkman 1990):
FM - Fh;) Fsr NQP = - - - 1
Govindjee (L995) states that the quantum yield of chlorophyll -a fluorescence (mi)
of a single species is related to the rate constants (k's) of vanous pathways of de-
excitation (f = fluorescence, h = heat dissipation, t = excitation energy transfer,
q = quenching by quenchers (e-g. carotenoids, 0 2 , triplets, etc.), and p = photochemistry)
as foIlows:
Ignoring extraneous quenching processes and assuming that al1 energy transfer in PSI1
leads to p hotochemistry, and omitting terms for quenching by P680r and t hose originating
in S-state transitions, Eq. 1.16 cm be simplified to solve for <Pr and the efficiency of PStI,
0, (Govindjee 1995):
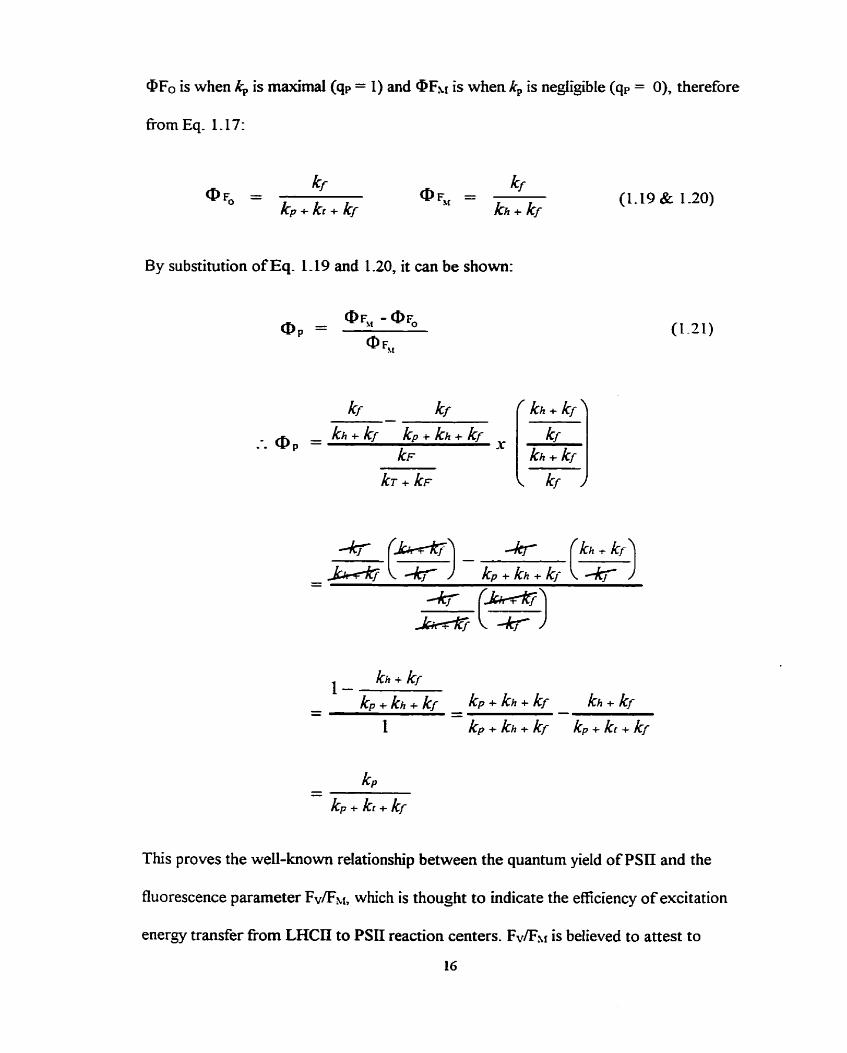
@Fo is when k, is maximal (qp = 1) and @Kr is when k, is negligible (qp = O), therefore
fiorn Eq. 1-17:
By substitution of Eq- 1 - 19 and 1-20, it can be shown:
This proves the weU-known relationship between the quantum yield of PSII and the
fluorescence parameter Fv&, which is thought to indicate the efficiency of excitation
energy transfer fi-om LHCII to PSI1 reaction centers. FV/FXI is believed to attest to
16

thylakoid membrane integrity, since LHCU and the PSI1 reaction center are joined through
dipole-dipole interactions and energy transfer between them may be sensitive to alterations
in the membrane (van Grondelle et al. 1994). Govindjee (1995) States that the relationship
between Op and Fv/Kr is limited by the assumption that the rate constants kh and k, do not
change between OFo and OFbc. H e also argues for the expansion of the relationship to
include the individuai components of quenching due to P680-, Ph-, and Oz and for the
need to base k, upon the concentration of the P680Q4 pair and not j u s QA-
Genty et al- (1989) developed a kghiy usehl fluorescence parameter, known as
the quantum yield of PSII (Opsn) (van Kooten et al. 1997; DeEll et al. 1999) because it
correlates linearly with the quantum yield of COz assimilation at steady nate, under non-
photorespiratory conditions. Seaton and Walker (1990) found the relation between @PSU
and carbon assimilation to be virtually identical for many species of plants of different
divisions and different pathways of carbon assimilation (e-g. C3, C4, and CAM). @PSU is
simply the product of Fv/Fkf in the light and q p (Eq. 1.22):
Excitation energy capture Fraction of PSII reaction
efficiency of open PSII reaction centers that are open at
centers at steady-state, steady-state.
FM'
Efficiency of tight use for
the photosynthetic
electron transport by PSII.
Table 1 sumrnarizes of al1 the chlorophyll fluorescence measurements and ratios that have
been described to this point.

Table 1.1. ChlorophyIL fluorescence nomenclature (nom DeEll et al. 1999; Krause and Weis 199 1; van Kooten et al- 1997; van Kooten and Snel 1990)-
Symbol / Name Description
F fluorescence intensity
Fo minimal fluorescence (dark)
FhI maximal fluorescence (dark)
FV variable fluorescence (dark)
Fs fluorescence in steady state
FYFM (dark)
T% tirne for rise îo half-FV
Fo' minimal fluorescence (light)
Fh( maximal fluorescence (light)
Fv' variable fluorescence (light)
FV'h' (light)
q p photochemical quenching
q~ non-photochernical quenching
NQP Stem-Volmer quenching
@Psn quantum yield of photochemistry
actual fluorescence intensity at any tirne-
fluorescence intensity with all PSKI reaction centers open whide the photosynthetic membrane is in the non- energized state, i-e. dark or Iow Iight adapted q p = 1 and q ~ = 0 -
fluorescence intensity with al1 PSII reaction centers closed (Le. q p = O), d non-photochemicai quenching processes are at a minimum (Le. q, = O). This is the classical maximum fluorescence level in the dark or low light adapted state.
maximum variable fluorescence in the state when al1 non-photochernical processes are at a minimum, i-e. ( h r - Fo).
fluorescence intensity at steady state- Steady state is defined by the author as a penod within which the fluorescence intensity does not change whiie the extemal circumstances remain constant-
exciton transfer efficiency, LHCII to PSLI reaction centers.
t h e (msec) taken for fluorescence intensity to rise fiom Fo Ievel to one-half Flf level-
fluorescence intensity with al1 PSII reaction centers open in any light adapted state, i.e. q p = 1 and q': 2 0.
fluorescence intensity with al1 PSII reaction centers -
closed in any light adapted state, i.e. q p = O and qs 1 0 .
maximum variable fluorescence in any light adapted state, Le. @&Fi).
exciton transfer efficiency, LHCII to PSII reaction centers.
1.5 Chlorophyll Fhorescence and Detection of Vegetation Stress
The first Intentationcd Symposir~m on Vegetutfôn Stress was held in Munich in
1995. Kartmut Lichtenthaler was the editor of a special issue of the JmmaC of Platzl
Physiology, titled Vegetation S . s s (1996), which was based upon papers presented at the
symposium. In the opening paper of the journal, Lichtenthaler presents the essentials of
the present stress concept in plants, referrïng to stress as "any unfavorable condition or
substance that affects or blocks a plant's metabotism, growth or development7'- He argues
that stress is induced by varïous natural factors (e.g. high irradiance, heat, water shortage,
mineral deficiency, insects, and pathogens) or anthropogenic factors (e-g. herbicides. air
pollutants, ozone, and formation of highly reactive oxygen species). He highlights the
necessity for differentiation between "short-tem and long-term stress effects as well as
between low stress events, which can be partially compensated for by acclimation,
adaptation and repair rnechanisms, and strong stress or chronic stress events causing
considerable damage that may eventually Iead to cell and plant death."
Lichtenthaler (1996) points out that most stress factors will affect the
photosynthetic process in the long term, even if they do not directly affect the composition
of the photosynthetic apparatus or its functions. Chlorophyll tluorescence and heat
emission of absorbed energy will increase as varïous stresses cause photosynthetic
quantum conversion to decline. These changes as weli as damage to the photosynthetic
apparatus can easily be detected with chlorop hyll fluorescence kinetics and associated
parameten (Lichtenthaler 1996). Changes in chiorophyll fluorescence have been
monitored to assess the response of plants to a diverse range of environmental, chernical,
and biological stresses &ause and Weis 1988; Lichtenhaier 1988; Lichtenhaler and

Rinderle 1988; Renger and Schreiber 1986; Schreiber and Bilger 1987; Simillie and
Hetherington 1983; Snel et al. 199 1). Lichtenthaler (1996) proposes the detection of
stress via two approaches. One uses ratios of fluorescence measurements Eom the four
wavelengths of maximum ernission, and the other applies chiorophyli fluorescence
measurements (690 or 740 nrn) d u ~ g induction of a dark-adapted Ieaf(Kautsky cuwe) to
derive some of the previously described fluorescence parameters (FVELI, OPSE, q p and q ~ )
as weil ratio Rfd (ratio of the fluorescence decrease to steady-state fluorescence).
Recently, laser-ïnduced fluorescence imaging has been used to measure
fluorescence at four wavelengths: red (690 nrn) and far-red (740 nm) which are attributed
to chlorophyil fluorescence, and blue (440 nrn) and green (520 nrn) fluorescence which
orïginate fiom phenolics (i-e. hydroxyl cinnamic acids. flavonols) in the plant epidermis
ce11 walls (Lichtenthaler 1996). M e r 3 weeks of water stress, the blue/red and bluelfar-
red ratios of tobacco leaves were found to increase with the decreasing water content
once it had falien below a threshold value of 84 % (Lang et al. 1996). Unfortunately, these
Ieaves were shrinking and visibly stressed. In contrast. tobacco plants which had not been
watered for 1 week and then exposed to 600 pmol quanta=rn"-s'' at 40 "C for 6 h
displayed no visible signs of stress, although fluorescence imaging showed a significant
increase of red and far-red chlorophyll fluorescence ernission on the rims of the Ieaves
(Lang et aL 1996). Ratios of fluorescence measurements fiom the four wavelengths are
used to detect a number of other stresses (Lang et al- 1996; Lichtenthaler and Rinderle
1988; Lichtenthaler 1996; Lichtenthaler et a(. 1996; Schweiger et al- 1996).
Alternatively, the ratio of the fluorescence decrease to steady-state fluorescence
(Rfd = fdlfs) is a parameter which has been applied to the evaluation of piant stress for

many years (Lichtenthaler and Rinderle 1988). It has been calculated from measurements
with a non-modulated fluorometer, where fd is the fluorescence decrease fkom fmax (P in
Kautsky curve) to the steady-state fs (T in Kautsky curve) (Lichtenthaler and Rinderle
1988). When incorporating with measurements Eom a modulated fluorometer, Md is the
fluorescence decrease fiom RI to Fs (Babani et d 1996). This ratio can be used for fast
screening of the presence of photosynthetic fùnction, and is temed vitality index
(Lic htent haler and Rinderle 198 8). It measures the potential photosynthetic capacity of a
Ieafand is correlated to net photosynthetic CO2-assimilation (Babani et al. 1996), as is the
parameter apsn (Genty et al. 1989). The only difference in calculating these parameters is
that (FhI - Fs) is divided by FLI for Opm and by Fs for Rfd.
Decreases in Rfd values parailel declines in photosynthetic activity due to
chlorophyll breakdown induced by prolonged periods of darkness, while light-induced
re~eneration of the photosynthetic apparatus is marked by a concurrent increase in Rfd
(L.ichtenthaler and Rinderle 1988). Under conditions of extreme water deficit, Md values
were found to decrease by 10 to 30 % for sun-exposed leaves. indicating the process of
photosynthesis was slowed d o m by dehydration processes within cells (Lichtenthaler and
Rinderle 1988). After damaging a leaf mechanically by pressing. which reduces the
intercellular aenal spaces and affects the reflectance and light scattering properties of the
le&, a reduction in the Rdf values was noted, indicating reduced photosynthetic quantum
conversion. Rfd d u e s appear to be fairly insensitive to temperature changes in the range
of 10 to 35 OC; however, early signs of water shortage (slight decreases in Md) are
sometimes observed (Lichtenthaier and Rinderle 198 8). These examples demonstrate the
great potential chlorophyll fluorescence parameters possess in the detection of a number

of stresses afEecting photosynthesis.
1.6 Iceberg Lettuce: Characterization and Economic Importance
Lettuce, Lactzîca sariva L. (2n = 18; diploid), is a member of the family
Compositae. The name is associated with the miUcy juice produced by the plant. The Latin
root word is 'lac' (Lactzica) which means rnilk, while the Englikh version 'lettuce' was
probably derived fiom an OId French word with sirniIar meaning: 'laitue'. Saliva rneans
gown fiom seed purdue University Website 2999,
ht@:Aimnv. ho~'t~pt~~'d~ie~ed~Urhodcvhort~iO,~Ze~t~ic)~
Lettuce is classifïed as a cool-season crop. Generally, the vegetative parts of cool
season crops are eaten, while the edible parts of warm-season crops are the mature or
immature fruits. There are several other features of cool-season vegetables which
distinguish them fiom warm-season vegetables: they are hardy or fiost tolerant (mature
lettuce plants are more sensitive to nost (-1 O C ) depending on the cultivar, these can
withstand only light fiosts which kiU the wrapper leaves (Advisory Cornmittee on
Vegetable Crops. 1999. Vegetable crops production guide for the Atlantic Provinces.
Atlantic Provinces Agriculture SeMce Co-ordinating Committee (Pub). hftp:h
agY.gov. ris. ca/pt%hor~vegetabïes/griides/~e~~z~ce~ htm)); the seeds germinate at cooler soi1
temperatures; the root systems are shallower, the plant size is smaller, they respond more
to nitrogen and phosphoms applications; they are stored near O O C ; and the harvested
product is not susceptible to chiliing injury at temperatures between O and 10 O C (Lorenz
and Maynard 1988).
1.7 Iceberg Lettuce: Production
Lettuce seedfings are ofien started in a greenhouse, and are considered half-hardy
in terms of their adaptation to field temperatures upon transplantation. Optimum
greenhouse temperatures are 13 to L8 O C during the day and 10 to 13 OC at Nght (Lorenz
and Maynard 1988). Field conditions under which Iettuce thrive are characterked by
relatively cool temperatures, ample sunlight, un i fody cool nights, and plenty of moisture
(Swiader et aL 1992)- Thus in the South and Southwestern USA it is grown prïmanly as
an early spring, €dl, and winter crop, whereas in Québec and Ontario it is grown €rom late
spring, through summer until the first fiosts of fa. Swiader et al- (1 992) report optimum
field temperatures for growth are 19 to 23 O C during the day and 7 to 1 1 OC during the
night, while Lorenz and Maynard (1988) suggest that the average monthiy temperature for
the best growth and quality of vegetable crops ranges from 16 to 18 OC with minimum and
maximum of 7 and 24 O C , respectively- Temperatures above 30 OC negatively affect the
growth, often producing bitter flavours, as well as inducing premature seedstock
development or bolting. Premature, small, and loosely fonned heads can be the result of
temperatures above 24 OC (Swiader et al, 1992).
Several disorders (e-g. tip bum, msty-brown-discoloration, and interna1 rib
necrosis) have been related to high field temperatures. Rib discoloration is sometimes
obsewed when the field temperatures exceed 27 OC in the day or when night temperatures
rise above 13 to 18 OC, and lettuce is more susceptible to russet spotting when hamested
after a 10 day period containing two or more days with temperatures above 30 O C (Lorenz
and Maynard 1988). The visual symptoms of such disorders develop or become more
severe after harvest (Kader et al. 1974).

Reproductive growth of head lemice, or bolting, begins when the stem elongates
fiom the base, through the head, producing a much-branched ff owerstalk 60 to 150 cm ta11
(Swaider et aL 1992). Lettuce is unacceptable for market once the stem breaks through
the top of the head, and even before this occurs the emerging stem can cause the shape of
the head to become oblong. Boltîng can initiate before heads obtain optimal firmness;
premature bolting is caused by exposure to extended periods of high temperature and/or
long days (Swaider et al, 1992)-
Lettuce is normaliy transplanted or seeded on raised, two-row beds which are 46
to 56 cm wide and spaced on 102 or 107 cm centers. The plant rows are 8 to 10 cm from
each edge, with 30 to 36 cm between rows and 25 cm in-row plant spacings.
Recommended soi1 pH is slightly acidic or neutral, although growth is possible on some
alkaline soils. On average, a lettuce crop will remove 90 to 13 5 kg nitrogen / hectare, 3 -5
to 17 kg phosphate / hectare, and 135 to 225 kg potassium / hectare. In some areas with
high levels of potassium in the soils and potash in the irrigation water, no potassium
fertilizer (&O) is added. Required phosphate (PZOs) applications may be as high as 390
kg / hectare on soils that strongly fix phosphorous (Swïader et al. 1992).
Water stress is another factor to be considered dunng the growinj season. A
constant and relatively abundant supply of moisture is required and fluctuations in
moisture, especially during the early and later stages of development are detrimental to
growth. Late in the season, too much moisture in combination with high temperatures can
result in poor, loose head formation (Swiader et aL 1992). Irrigation requirements are
dependent on the local climate. For example 30 acre-inches (189 crnha) are needed in
Califom*aYs Salinas Vaiiey, while humid regions may require < 15 cm of raina1 or

imgation. Once eaablished, lettuce grown on muck soils generally do not require
irrigatiûn, however during extended periods of dry weather requirements may be - 2.5 cm
of water every 10 to 14 d and every 7 to 10 d before and &er heading, respectively
(Swiader et al. 1992).
Aphids and caterpaars are cornmon insect pests which feed upon lettuce leaves,
while Erwinia carotovora is a bactena that causes soft rot. Often srna11 areas of a leafor
even multiple leaves are uifected by Envinia, reducing the tissue to a disgusting, dark-
green, slimy, gelatinous mass. Since these bacteria Live in muck soils, plants are susceptible
to infection when the leaves are in contact with wet soil. Conditions which encourage
bacterial growth are surface moisture fkom rainfall, Ungation or high humidity, and
moderately warm temperatures (Peirce 1987).
1.8 Iceberg Lettuce: Postharvest Handling and Storage
In Québec, heads are manually harvested, field-packed into boxes of 18 or 24,
vacuum cooled to - O OC (- 20 min), followed by air storage. The recomrnended storage
regime is O OC (- 0.16 O C is highest fieezing temperature) with 95 to 100% relative
humidity. Under these conditions the produce may be held for 3 to 4 weeks (Swiader ei cd
1992); however controlled atmosphere storage cm extend this penod by another two
weeks (Isenberg 1979). Respiration rates and heat of respiration for head lettuce stored at
various temperatures are listed in Table 1.2.
Iceberg lettuce are subject to a number of pre- and postharvest disorders. Rib
discoloration (also called n b blight or brown nb) occurs commonly at the curvature of the
imer (adaxial) surface of outer head leaves, but it rarely affects cap or wrapper leaves.

Table 1.2. Respiration rates and heat generated by respiration of head lettuce stored at
various temperatures (from Cantwell and Suslow 1 997).
Temperature Respiration Rate Heat Generated by Respiration
(Oc) (mg CO** kgd1- hr-') (kcal- ton-'. 6')

Discolored areas are oblong, initiaily yeUowish or tan, but later may tum brown or black
(Lipton et al. 1972). Tip bun is characterized by brown spots along the outer margins of
the leaves, which eventually turn brown and die. Low calcium levels are found in the
affected tissue, even ifsoil calcium levels are quite hi&. As previously mentioned, this
disorder is more prevalent in hot weather and during penods when the plant is growing
rapidly (Swiader et al. 1992). Both rib discoloration and tip burn develop primarily in the
field and their symptoms do not advance d u ~ g storage (Lipton et aL 1972).
Internal rib necrosis and rusty-brown discoloration are two disorders which are
observed only in the cultivar 'Climax' or in closely related cultivars. Internai rib necrosis is
diffùse, dark, gray-green or cod-black regions which may extend 7 to 10 cm along the
midrib, while rusty-brown discoloration (nisty rib) is a disorder which may affect midribs
or entire leaves. Storage temperatures do not affect the progression of interna1 rib
necrosis, while rusty-brown discoloration develops more rapidly at temperatures below
10 OC. (Lipton et a[- 1972).
Pink rïb is a disorder which often develops during storage. and is characterized by
a diffuse pink discoloration near the bases of midnbs of the outer leaves. The discoloration
usually is most intense on the imer (adaxial) surface, but cm often be seen from the outer
(abaxial) surface. The causes of this disorder have not been identified; however,
unfavorably high storage temperatures and old age seem to accelerate its development.
Low Oz atmospheres can accentuate pink rib symptoms when stored for 1 weelc at 10 O C ,
or 1 month at 2.2 O C (Lipton et al. 1972).
Brown stain is typified by 0.6 x 1.3 cm lesions whose margins are distinct and rnay
be slightly darker than their centers. These lesions are slightly sunken in the centers and

may appear water-soaked when Young, but they become tan, brown, or even black upon
developrnent (Lipton et al. 1972). Elevated CO2 concentrations (> 2.5 %) cause the
development of brown stain, especiaiiy when O2 concentrations are below 10 % (Isenberg,
1979; Brecht et aL 1973). The severity of brown stain symptoms generally increases with
decreasing storage temperature, increasing storage duration, decreasing Oz concentration,
and increasing COz concentration For exarnple, Brecht et aL (1973) found brown stain to
develop in 5 % COz when the Oz levels were ambient, or in very low CO2 levels when the
Oz was below 5 %. In this case it was suggested that accumulated respiratory CO2 (0.2 to
0.5 %) was the cause of the symptoms (Brecht et uL 1973). As well, the use of carbon
monoxide (CO - i to 5 %) in controlled atmosphere (CA) storage was is found to
increase the incidence of brown stain when COz levels were elevated above 1% (Kader et
cd. 1973a).
Russet spotting is a disorder that is characterized by reddish-tan, olive, ancilor
brown elongated, pit-like spots on the midribs of leaves of iceberg lettuce (Lipton and
Ryder 1989). This disorder can be induced by exposure to hormonal levels of ethylene
('1 p ~ * ~ - ' ) in air at 5 OC (Rood 1956), though it will develop in temperatures from 3 to
10 O C (Lipton and Ryder 1989). Russet spotting will be discussed in more detail in
Chapter 4.
Short-term CA storage of Iettuce (1 to 4 weeks) can provide improved quality
over conventional air storage by reducing respiration rates and detrimental effects of
ethylene (CantweU and Suslow 1997), guarding against moisture and flavour loss, and
suppressing the development of physiological disorders and pathogenic infections
(Isenberg 1979). CA storage also makes long-tem storage possible, extending the storage

duration of lettuce by two weeks (Isenberg 1979).
Kader et 41. (1973a) reported that 1 % atmospheric CO retarded the discoloration
of cut stems and mechanically injured areas of lettuce held in CA storage for 20 d,
especially when combinated with low Oz. These effects were transient; the benefits of
storage in elevated CO were less noticeable after holding the heads for an additional 4 d in
air at 10 OC (Kader et al. I973a)- Elevated COz and CO show some value in retarding
pathologicai disorders, as weli in decreasing pink rib when combined with 5 to 10 % 0 2
(Kader ef al. 1973a). Generally, the application of CO in CA storage is limited because of
its impIication in brown stain development. Elevated CO treatments are not recornmended
for situations where CO2 levels > 1% may development (Kader et al. 1973a).
The development of some physiological disorden can be regulated with
conventional or CA storage regimes. However, the response ultimately depends upon the
plant's susceptibility to the disorder, which varies greatly among cultivars ( e g with brown
stain and russet spotting). Cantwell and Suslow (1997) recornrnend the CA conditions of 1
to 3 % OZ and temperatures of O to 5 OC to improve shelGlife.
Stewart et ai. (1970) found that elevated concentrations of CO2 controlled pi&
rib; unfortunately this treatment was deemed unfeasible because it induced brown stain. To
minimize pink nb development, low-02 atmospheres should be avoided at warm
temperatures (- 10 "C) (Lipton et al. 1972). Unfortunately the CA conditions
recomrnended by Cantwell and Suslow (1997) (1 to 3 % Oz at O to 5 OC) have been
reported to accentuate pink rib symptoms d e r 1 month of storage (Lipton et aL 1972),
although Cantwell and Suslow (1997) mainly attribute pink rib to high storage
temperatures and overmaturity

Brecht et al. (1973) reported that Oz levels 2 5 % and CO+ levels 5 2 % do not
induce brown stain during storage at 2.5 OC. More recent recommendations caution
against CO2 levels > 2 % at low temperatures without mentioning low-O2 (Cantwell and
Suslow 1997). To mùiimize the development of msset spotting during storage ethylene
levels should not exceed 1 l i ~ * ~ - ' . It is important to preventing mixing lemice loads with
those of ethylene-producing commodities and to avoid contact with ethylene-containing
fumes from combustion engines and other sources of smoke (Cantwell and Suslow 1997).
Current recomrnendations for CA storage of lettuce are 5 % Oz and 2 % COz, at 2.5 OC,
with ethylene < 1 p ~ * ~ - ' .
1.9 Generation of Activated Oxygen in Chloroplrsts and Coping Mechanisms
The role of activated oxygen species in plant and animal health is a topic which has
received much attention in the scientSc cornrnunity. Activated oxygen species such as
singlet oxygen, superoxide, the perhydroxl radical, hydrogen peroxide, and the hydro'cyl
radical react with lipids, proteins, and DNA causing severe damage. Oxidative damaje to
cellular structure is often a secondary effect of chilling, fieezing, desiccation, and
anaerobic stresses (McKersie and Leshem 1994). Activated oxygen species are produced
in the mitochondna, endoplasmic reticulum, rnicrobodies, plasma membranes, and ce11
walls of plants (McKersie and Leshem 1994). Of particular interest to this thesis are the
major sources of activated oxygen generation in chloroplasts: (1) ferredoin of PSI can
reduce oxygen to superoxide, rather than NADP to NADPH, (2) singlet oxygen can be
produced from triplet (excited) chlorophyll molecules, especially under conditions where
electron transport is blocked, and (3) electron leakage fiom the oxidizing side of PSII

produces superoxide and hydrogen peroxide, though this is considered a minor
contribution (McKersie and Leshem 1994).
Several molecules and mechanisms are involved in the detofication of activated
oxygen species in plants. Ascorbate (vitdn C) reacts directly with superoxide to produce
dehydroascorbate and hydrogen peroxide. Further detoxification of hydrogen peroxide
may proceed via a second reaction involving ascorbate and is catalyzed by ascorbate
peroxidase (McKersie and Leshem 1994). A second mechanism for the dismutation of
superoxide to hydrogen peroxide and water is catalyzed by the enzyme superoxide
dismutase (SOD). This enzyme is present in ail aerobic organisms and in most (if not d l )
subcellular compartments that generate activated oxygen (McKersie and Leshem 1994).
Catalase is a heme-containg enzyme that catalyses the dismutation of hydrogen peroxide
into water and oxygen. Glutathione (GSH) is a tripeptide which has several antioxidant
functions: (1) it can react directly with singlet oxygen, superoxide, and hydroxyl radicals.
(2) it may stabilize membrane structure by removing acyl peroxides forrned by Iipid
peroxidation reactions, and (3) it is a reducing reaçent used in ascorbic acid recycling
(McKersie and Leshem 1994). a-Tocopherol (vitamin E) is a membrane-bound
antioxidant which stabilizes membranes by scavenging oxygen fkee radicals, lipid peroxy
radicals, and singlet oxygen. Carotenoids can protect photosystems in several ways: (1) by
reacting with lipid peroxidation products to terminate change reactions, (2) by scavenging
singlet oxygen and dissipating the energy as heat, (3) by reacting with triplet chlorophyll
molecules to prevent singlet oxygen formation, and (4) by dissipating excess excitation
energy through the xanthophyll cycle (McKersie and Leshem 1994).

The Halliweli-Asada pathway (Foyer and Haliïwefi 1976; Asada 1992) maintains
chloroplast antioxidants systems, particularly those scavenging superoxide and hydrogen
peroxide- SOD converts superoxide to hydrogen peroxide which is then scavenged by
ascorbate and the enzyme ascorbate peroxidase. Ascorbate is then regenerated via
monodehydroascorbate reductase, or via dehydroascorbate reductase and glutathione.
Both of these rnechanisms restore ascorbate andlor glutathione to their reduced (Le.
oxidant scavenging) forms, at the expense of NADPH oxidation (McKersie and Leshem
1994). Thus the Halliweii-Asada pathway detoxifies activated oxygen species and reduces
the high NADPHMAPD ratio which favours PSI electron transfer to oxygen (McKersie
and Leshem 1994).

CHAPTER 2
Characterization of Variation in Chlorophyll Fluorescence Measurernents
2.1 Introduction
The Iiterature suggests that there can be a great deal of variation among
chlorophyll fluorescence measurements within a population of plant samples. Fluorescence
measurements were the paramount cornponents of a prediction system for the keeping
quality of cucumbers developed by Schouten et al. (1997) and van Kooten et nL (1997);
however, a sirnilar attempt with leeks was not possible due to large variations in leek
quaIity and chlorophyll fluorescence measurements (DeEl1 et aL 1999)- Since the extent of
variation may depend largely upon the plant studied and the instrument used. the objective
of this expenment was to assess the sampling variation for iceberg lettuce using a
modulated fiuorometer and to determine which sampling method(s) could best deal with
that variation.
2.2 Materials and Methods
Imf7rrnzenfation
CNorop hyll fluorescence was measured using an OS-500 modulated fluororneter
(Opti-Sciences Inc., Tyngsboro, MA). This instrument is a portabIe unit that contains four
light sources (modulated, saturation, actinïc, and far red), a photodiode detector,
cornputer hardware and software, a standard 3 -5" diskette drive, user input keys and
wheel, a LCD screen, a 12 V battery and charger, and a 9-mm measuring probe comected
to the light sources and detector through a system of fiber optic cables. The modulated

light is a 655 nrn solid state source of adjustable intensity (< 1.0 pmo1-m-2-s-') which emits
radiation at wavelengths > 660 m; however, al1 radiation longer than 700 nrn is blocked
by filters. A 3 5 W haiogen Iamp provides the saturating light pulse of adjustable intensity
up to 10 000 pmol-m-2-~-L and duration €rom 0.1 to 3.0 S. The actinic light is a solid aate
source whose peak emission wavelength is - 670 nm with variable intensity up to 450
pmol*m-2-s-1. The far red Light source emits at a peak wavelength of - 735 nm and its
intensity is adjustable nom O to - 15 mw-sr-'. In ai l procedures, the measuring probe
rested flush against the sample surface, thus it may be assumed that the solid angle was
1 sr, simplifyuig the units of the far red light to &watts (mW). The PIN silicon
photodiode detector is filtered to receive radiation from 710 to 760 nm-
This fluororneter is designed to allow the user to conduct a number of automatic
or manual tests which incorporate some or ail of the light sources. The yietd test (test
mode 2) is a quick (c 3 s) and automatic test which determines Opsn of a lisht-adapted
sample with a pulse of saturating light. The kinetic test (mode 3), when manually
operated, derives an induction curve of a dark-adapted sample (Fig. 1.1). For this test. the
measuring probe was fuced to a stand and positioned perpendicular to the surface of the -
lettuce at a distance of O cm. The fast actinic test (mode 4) measures the time (ms) to rise
to !4 Fbc (T %) as well as the FV&C of a dark-adapted sample. This test was set for 5 s
using the actinic light as the sole excitation source. Tables 2.1 lists specific Iight intensities
and test times used for this experiment.
PIaizr Marerial
'Ithaca' iceberg lettuce that had been vacuum cooled and held at O OC for - one
34
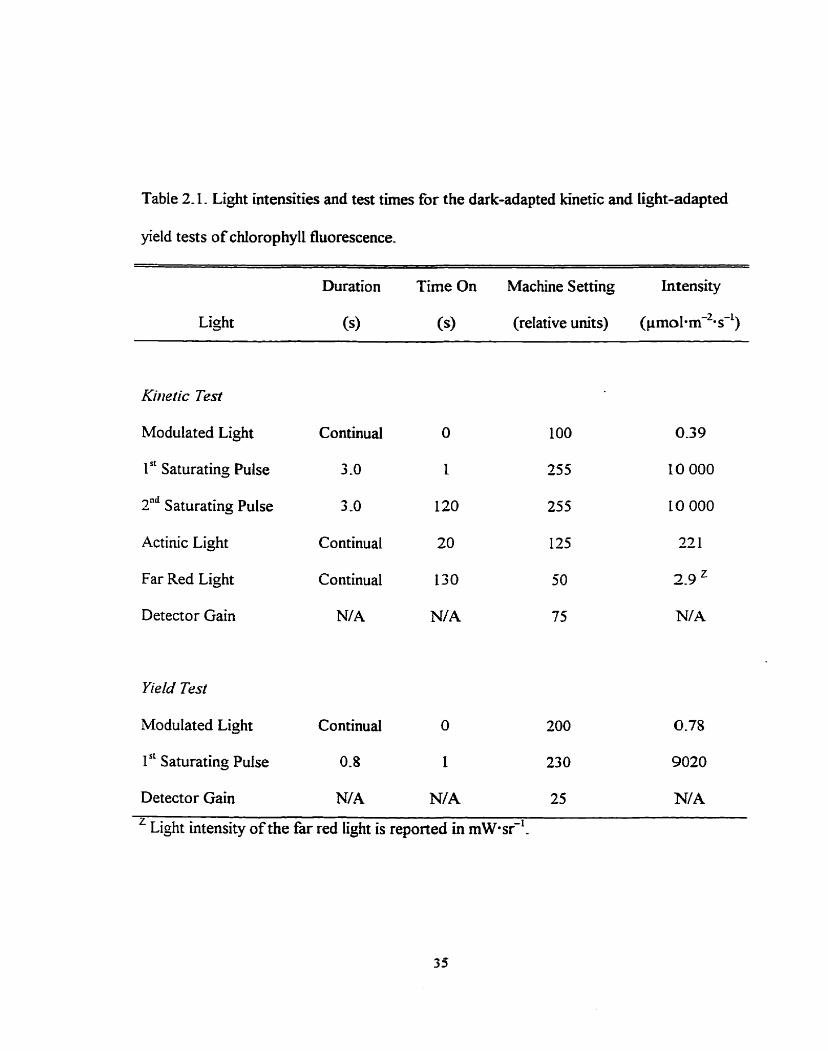
Table 2.1. Light intensities and test times for the dark-adapted kinetic and light-adapted
yield tests of chlorophyll fluorescence.
Duration Time On Machine Setting Intensity
Light (9 (9 (reIative units) (pmo1-m-2-s-1)
Kirletic Test
Modulated Light Continual O 1 O0 039
1 " Saturating Pulse 3 -0 1 255 10 O00
2" Saturating Pulse 3 -0 120 255 LO O00
Actinic Light Continua1 20 135 22 1
Far Red Light Continual 130 50 2 9 z
Detector Gain NIA N/A 75 N/A
Yield Test
Modulated Light Continua1 O 200 0.78
1" Saturating Pulse 0-8 1 230 9020
Detector Gain N/A N/A 25 N/A z Light intensity of the far red light is reported in m ~ * s r ?

week were purchased from a local distributor (Sherrington, Québec). Five heads were
acclimated to room temperature (20 OC) and darkness (> 2 h), and were stripped of
wrapper leaves to expose the first tightly-held le& The dark-adapted samples were
measured with the kinetic test. The heads were then exposed to 10 pmol quanta*m-z=s-L
PAR for - 20 min and Opso was measured with the yield test. Chiorophyll fluorescence
was measured at five dBerent locations dong the Ieafmargin (within 3 cm) of the three
outermost leaves of each head.
s lnf isf icai maiysis
The data were analyzed using the Generalized Linear Models procedure of SAS
(1985). and two separate analyses were perfonned. The first analysis determined the
effects of the heads and leaves (ignoring the subsampling effects of locations), and the
second analysis excluded the second and third leaves of each head analyzhg only the first
le& For the second analysis, the experimental variation kvas allocated to its respective
sources: sarnple (5 heads) and subsarnple (5 locations). According to Snedecor ( 1980),
under the usual assumptions of normal distributions of sample and subsample erron about
means of 0, the error of rneasurement of a single location, oZL, is estimated from the error
mean square (EMS), and the variation corn head to head, &, is estimated by head mean
square ( H M S ) . We expect the following reiations:
EMS = OzL
HMS = oZL + (1)dH

where 1 is the number oflocations (subsamples) and h (used in subsequent equations) is
the number of heads (samp1es)- Therefore:
The expected van-ation of any experimental design (Le. any combination of h and I) c m be
summarized by Variance @.-), the variance of the mean of di Y= values. Variance (Y..)
is the correct combination of the two error terms (0% & dH) to estimate the E t ~ o r
Varic~me of Mean (d) whic h is the square of t he Standard Etmr of the Meon (o) . T hus:
To estirnate the number of replicates of an expenmental design required to detect a
difference between two treatments the following equation was used (Cochran and Cos
1992):
r r 2 ( ~ r l 6 ) ~ ( t ~ + tzl2 (2-5)
where r = number of replicates, 6 = the difference to be detected, t l = significant value of t
in the test of significance, tz = t value corresponding to power of t he test.
2.3 ResuIts
The first analysis quaiïfied the variation fiom the main effects of heads and leaves.
37
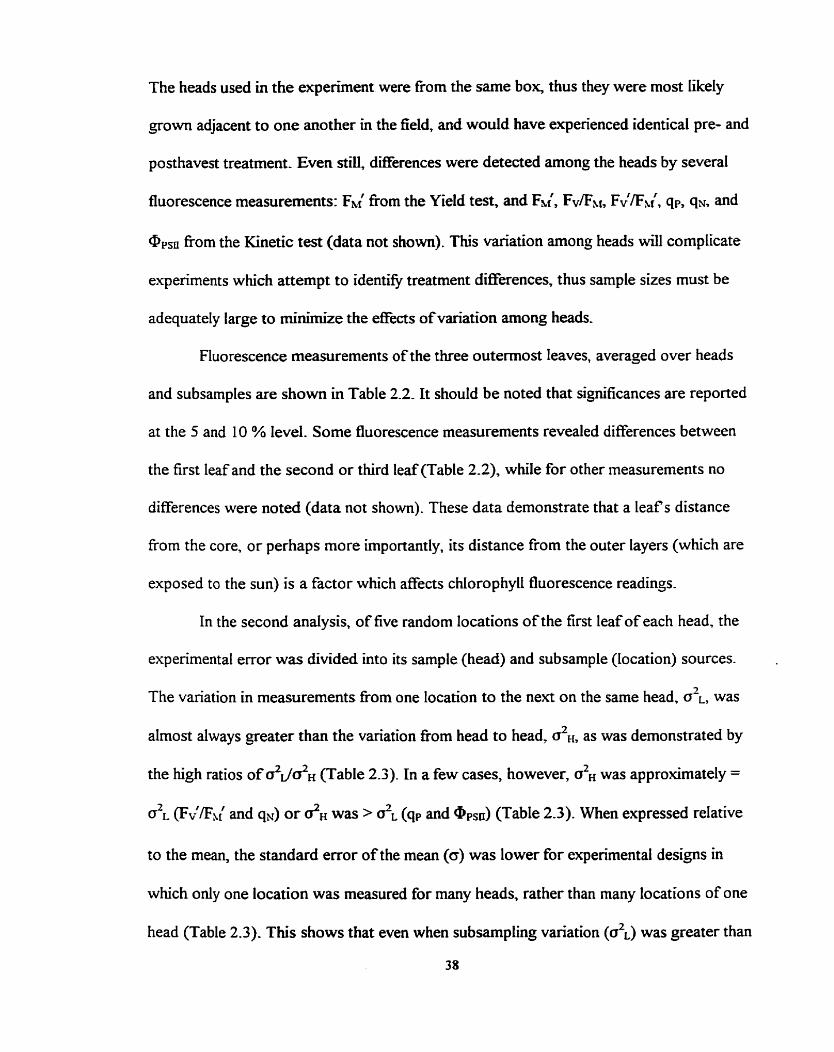
The heads used Ui the experiment were Eom the same boq thus they were most Iikely
grown adjacent to one another in the field, and would have experienced identical pre- and
posthavest treatment. Even still, differences were detected among the heads by several
fluorescence measurements: Fh; h m the Yield test, and FM', FvEM, Fv%c', qp, q ~ , and
%Sn fiom the Kinetic test (data not shown). This variation among heads will complicate
experiments which attempt to ident* treatment differences, thus sample sizes must be
adequately large to minirnize the effects ofvariation among heads.
Fluorescence measurements of the three outermost leaves, averaged over heads
and subsamples are shown in Table 2.2. It should be noted that significances are reported
at the 5 and 10 % lever- Some fluorescence measurements revealed differences between
the first leafand the second or third leaf(Tab1e 2 2 ) , while for other measurements no
differences were noted (data not shown). These data demonstrate that a leaf s distance
from the core, or perhaps more importantly, its distance from the outer layers (which are
exposed to the sun) is a factor which affects chiorophyll fluorescence readings.
In the second analysis, of five random locations of the first leaf of each head. the
expenmental error was divided into its sarnple (head) and subsample (location) sources.
The variation in rneasurements fi-om one location to the next on the same head. 02', was
almost always greater than the variation fiom head to head. 02kl , as was demonstrated by
the high ratios of $r/& (Table 2.3). In a few cases, however, ozH was approximately =
oz= @,-'Eh/ and qx) o r & was > u2= (qP and 0pS3 (Table 2.3). When expressed relative
to the mean, the standard error of the mean (o) was lower for experirnental designs in
which only one location was measured for many heads, rather than many locations of one
head (Table 2.3). This shows that even when subsampling variation (ozL) was greater than
38

Table 2.2. Chlorophyii fluorescence measurements of the three Ieaflayers, averaged over
heads and subsamples. Leaf 1 is the outermost leaffiom the core of the head-
Leaf 1
Leaf 2
Leaf 3
%CV
Sig.'
Comparing Leaves
1 & 2
1 & 3
"S = not significant, *, ** = significant at PCO. 10, Pc0.05. respectively.

Tab te 2.3. Sources o f experïmental error in fluorescence measurements, demonstrated by
the ratio of varÏation arnong locations to variation arnong heads ( d ~ / d H ) and the standard
error of the mean (o) estirnated for experiments of varying numbers of head and location
measurements, expressed as a percentage o f the mean e..).
1 Head 10 Heads
Measurement &dH 1 Location 10 Locations 1 Location 10 Locations
Yield Test
F'
Fh;
@PSU
sampling variation (&), the designs which most effectively reduced the total variation had
increased numbers of samples (heads) not subsamples (locations). The reason for this can
be observed in the caiculation of Variance e..) (Eq. 2.4), as measures repeated on the
same head reduce only & but measures on different heads affect both & and &. This
means that designs which measure oniy one location on severai heads per treatment
provide an accurate representation of aii the heads as a collective but a relatively
inaccurate measure of an individuai head-
Based upon the magnitude of variation observed at the sampling (head) and
subsampling (location) levels, it was possible to use Eq. 2.5 to estimate the number of
replicates of an experïmental design that would be required to detect a difference between
the means of two populations. Expenmental designs which measure fluorescence at one
location on 10 heads could detect a 20 % difference in the means of two populations with
four replicates for al1 fluorescence parameters, except for q p and 9 p s n (Kinetic Test)
which could only detect a 40 % difFerence fFom the mean with four replicates (data not
shown).
2.4 Discussion
Variation among samples, especially when a sample is an entire h i t or vegetable,
is ubiquitous to al1 experiments regardless of the measured parameter (chioro phyll
fluorescence, h i t color, firmness, etc). It is a problem with most experiments but
statisticai methods are capable of deaiïng with it adequately.
Decreasing chlorophyll fluorescence values as lettuce leaves progressed towards
the center of the head, may be due to decreasing leafmaturity and changes in

photosynthetic activlty related to chlorophyll content and exposure to sunlight. These
differences c m o t be overcome easily at the statistical level, as is possible with sarnpliq
variations. The best solution is to choose the sampling leafin a consistent way. In the field,
mature heads are surrounded by a varying number of older, heaithy, actively
photosynthesizing wrapper leaves. Most of them are relatively unattached to the head, but
the first leafor two adjacent to the head are held f ' l y tightly. This configuration is
relatively consistent among heads and thus it is possible to select the first tightly-held le&
It is not unreasonable to expect the e t tightly-held leafof different heads to be of similar
maturity and photosynthetic potential, and to have had similar expcsure to field conditions
and stresses. The main point discussed eartier in relation to subsampling (location) and
sampling (head) variation., applies to leaf and head variation as well. It is expected that
given a large enough sample size, the effects due to leafvariation will average out maki;in_g
it possible to provide a good estimate of the treatment effects on al1 the heads collectively.
Relatively few postharvest experïments are adversely afEecting by variation within
a sample (e-g. arnong leaves) because it is either negligible or the evaluation includes the
entire plant. Unfortunately the sampling area of fluorescence rneasurements is limited by .
the size of the probe (9 mm) and the time required per sampte.
Variation in photosynthetic activity and t hus fluorescence measurernents from
location to location on a single leafis a well-documented and expected phenornenon.
Downton et al. (1988) observed mottled areas in 14c uptake of leaves upon abscisic acid
application. These were attributed to heterogeneous stomatal closure, leaf anatorny, and
CO2 dinusion inside the le& Bro et ai. (1996) reported spatial and temporal variations in
the distribution of photosynthesis over Rosa rubiginosa L. leaf area dunng induction by

subsaturating and limîting Iight levels. Gas exchange was monitored in conjunction with
chlorophyll fluorescence imaging of Under photorespiratory conditions (2 1 % 0 2 )
imaging provides a map of the relative activity of linear electron transport, and under
non-p hotorespiratory conditions (-O % Oz) OPsn imaging provides a map of relative CO2
assimilatory activity. The apsn imaging of the induction of a dark adapted leaf(l5 h) with
subsaturating radiation (400-500 pmol quanta-m-2*s-') produced patches in aPsn
measurements which were ascribed to heterogeneous activation of metabolism and
asynchronous increases in COz availability by widening stomatal apertures. It was
proposed that dserences in OPsn measurements d u ~ g induction are attributed solely to
metabolisrn for the fùst 10 min, to metabolism and stomatal aperture fiom 10 to 30 min.
and to stomatal aperture alone beyond 30 min (the patterns were essentially homogeneous
after 1 h of induction).
Bro et aL (1996) suggest that biochemical contributions to variable CO2
assimilation may be initiaiiy due to heterogeneous storage of metabolic sinks for electron
transport products and that light activation of Rubisco or key enzymes in RubP
regeneration could account for the initial biochemical limitations. Ten to fifieen minutes of -
induction appears to overcome most biochemical limitations, since full induction of
enzymes has been reported at this time (-rschbaum and Pearcy 1988; Campbell and
Ogren 1990; and Sassenrath-Cole and Pearcy 1994)
Lichtenthaier et al. (1996) argue that various chlorophyli fluorescence parameters
and ratios denved &om single point measurements, are at an enormous disadvantage to
detect the functional state of the photosynthetic apparatus and stress to plants because
they provide uifonnation on relatively small points only. h addition, local differences in
43
the fluorescence emissim, as welI as fluorescence gradients over the leafsurface, which
represent early stress symptoms, cannot be detected by single point data measurements-
For example, tobacco plants which had not been watered for 1 week and were then
exposed to 600 pmol quanta*m-2-s-L at 40 OC for 6 h displayed no visible signs of stress.
but fluorescence imaging showed a significant increase of red and far-red chlorophyii
fluorescence emission on the rims ofthe leaves (Lang et aL 1996). Lichtenthaier et al.
(1996) argue that, even when severai Ieafpoints are measured, stress and damage can only
be detected at a relatively progressed stage. Certainiy the potentiai for early detection will
depend upon the plant and the stress. DeEll ri aL (1995 and 1998) and Mir et a(. (1997)
have demonstrated that chlorophyil fluorescence techniques c m detect low Oz stress and
high CO2 stress in apple h i t pnor to the development of the associated injuries.

CfLAPTER 3
Effects of Field Stress on Chtorophyll Fiuorescence and Storage Potential
of Two Lettuce Cultivars at Harvest
3.1 Introduction
The objective of this experïment was to evaluate the use of chlorophyll
fluorescence as a predictor of iceberg lettuce shelf-Kef when measured at harvest.
DEering cultivar tolerances and responses to stress during growt h were hypothesized to
influence the photosynthetic apparatus and storage quality of iceberg lettuce, thus enabling
chlorophyll fluorescence to indicate the storage potential at harvest, even in the absence of
visible differences in quality.
3.2 Materials and Methods
Plmit nmterial
During the summer growing season of 1997, six cultivars of iceberg (cnsphead)
lettuce were planted in Québec fields to produce a wide range of quality, based on
preferred growing conditions (e.g. temperature, photo-period, latitudinal region, and soi1
type). 'Ithaca 989' (Asgrow Seed Co.) is the standard cultivar grown in the muck soi1
fields of Québec. It matures 85 days afier forming a tightly packed head - 18 cm in
diameter, with mffled, non-unifonn leaves. In contrast, the California cultivar 'Salinas 88
Supreme' (Sakata Seed Co.) has smooth leaves which tend to be of more uniform shape-
The two extremes of quality were observed in 'Ithaca' and 'Salinas' cultivars duruig the
1997 growing season, thus only these two cultivars were included in the 1998
45

experiments. When analyzing this data, because the 1998 experimental design and
procedures were greatly improved over those applied in 1997, the three harvests of 1998
(harvests 1 to 3) were consïdered to be the main repetitions and when possible, data from
1997 was added as a supporting (4U) harvest.
Even-mental design
The seeding schedule of 1998 provided three complete repetitions of the
expenment at different t h e s during the sumrner, they are referred to as harvests 1 to 3 .
The lettuce seedlings were started in a greenhouse between late April and late lune, f i e r
- 3 weeks they were transplanted to one of three fields located within 75 km of Saint-
Jean-sur-Richelieu, Québec (Table 3.1). The field plot of each harvest was organized as a
"Randornized Complete Block Design" containing four blocks, each with two beds. The
two cultivars were allocated randomly to one of the I x 14 m beds, which were capable of
holding 80 plants (2 rows of 40 plants). Depending upon the harvest, the blocks were
arranged differently; however, beds containing experimental plants were always bordered
by beds containing other experimentai plants, or guard plants. The lettuce were harvested
- 67 days after seeding, from Iuly to August (Table 1). There were only a few slight
daerences in the design of the fourth harvest (1997): each block consisted of six cultivars
and six beds, excluding the guards; the beds were 7 m long, each containing 40 plants; and
since this original trial had more cultivars and lemice, blocks L and 2 were harvested the
day before blocks 3 and 4-

Table 3- L. Growing times and Iocations of the four harvests- The field in Sainte-Clotilde is
a sub-station o f Agriculture and AgrLFood Canada and the one in Napierviiie is of a
commercial lettuce producer.
Harvest Season Seeding Transplanting Harvest date Location
1 1998 May4 May29 July 16 Sainte-CIotiIde, Plot 1
2 1998 June3 June24 August 1 1 Napierville
3 1998 June17 July8 August 24 Sainte-Clotilde, Plot 1
4 1997 June23 Julyl6 August 29G 0 Sainte-Clotilde, Plot 2

Harvesti~zg and storage procedures
A few extra wrapper leaves were left on each head at harvest to guard against
moisture loss and damage d u ~ g transport. From each block x cultivar combination, 10
heads were promptly delivered to the lab where initial quallty measurements and
chiorophyll fluorescence measurements were performed the same day, as described below.
Another 30 heads fkom each block x cultivar combination were vacuum cooled (- 20 min
to 1 OC) and then promptly delivered to the lab for storage. Each head was tnmmed,
individually weighed, and loosely packed into plastic containers which were stacked in a
6 OC storage cbamber which maintained 80 to 90 % relative hum-dity. The refrigeration
system of the storage chamber was equipped with a HUMiCAP humidity detector (mode1
HMP 23, VAISAL& Wobuni, MA). To increase the relative humidity, the stacked
containers were covered with a plastic tarp. It was possible to accurately measure the
relative hurnidity near 95 %, with a dewpoint hygrometer (mode1 HMP 243, VAIS ALA.
Woburn, MA).
Qnniity andflt~orescence evahintio~z
After 7, 14, or 2 1 d of storage the quality was evaluated. The evaluation of
firmness and visual quality (which summarizes al1 defects including nb blight, mechanical
damage, brown nb, pink rib, and msset spotting) were based on rating scales of Kader et
al. (1973b) (Table 3.2). Simplified rating scales were devised for the other quality aspects:
extemal rot, extemal rib blight (also cailed rib discoloration by Lipton et a[, 1978),
intemal rot, intemal defects (which summarizes al1 defects including rib blight, mechanical
damage, brown rib, pink rib, and russet spotting), and flowerstalk development
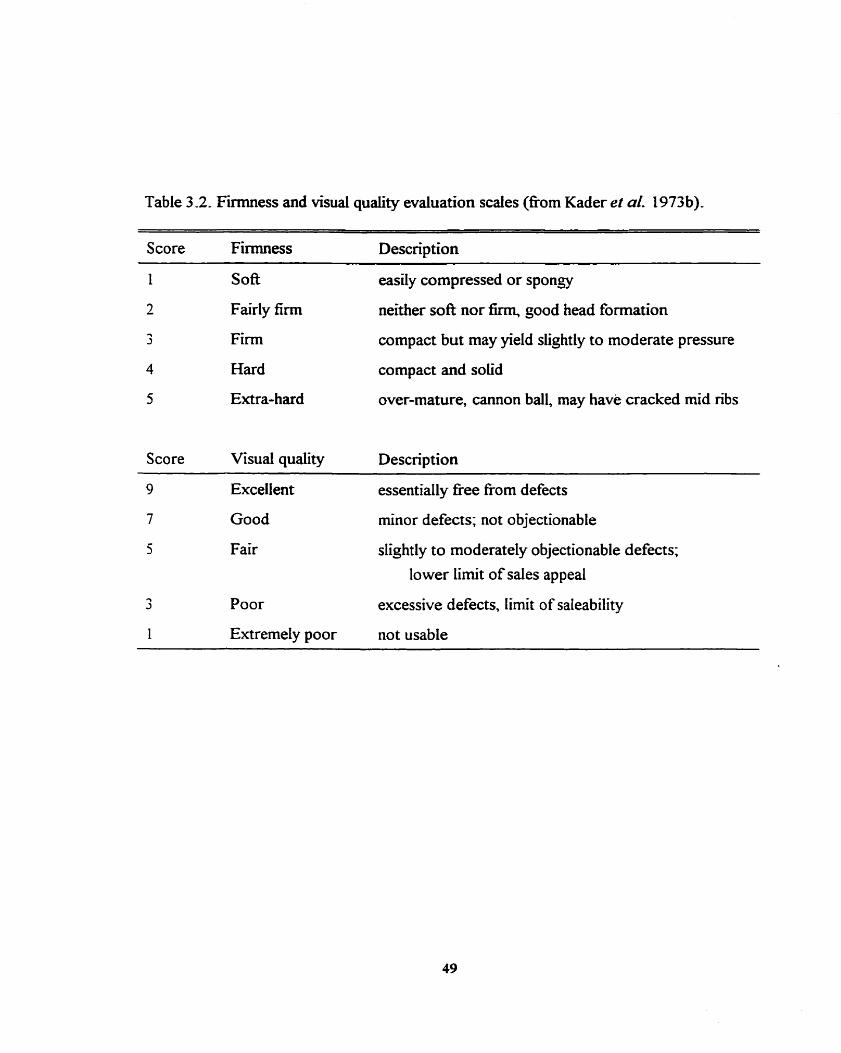
Table 3 -2. F ï e s s and visual quality evaluation scales (£tom Kader et aL 1973 b).
Score Firmness Description
1 Soft easily compressed or spongy
2 Fairly firm neither soft nor fimi, good head formation
3 Finn compact but may yield slightly to moderate pressure
4 Hard compact and sotid
5 Extra-hard over-mature, cannon ball, may have cracked mid ribs
Score Visual quality Description
9 Excellent essentiaIly fi-ee from defects
7 Good minor defects; not objectionable
5 Fair slightly to moderately objectionable defects;
lower limit of sales appeal
3 Poor excessive defects, Iimit of safeability
1 ExtremeIy poor not usable

(Table 3 -3)- The composite quality was calculated: Composite quality = Visual quality -
(Extemal rot - 1). Mer 7, 14, or 2 1 d ofstorage the weight loss (%) was caiculated as
well.
Quality evaluation of the fourth harvest was stightly different. The scale used to
evaluate external rot was that of Kader et aL (1973b) (Table 3.4), and the composite
quality was not calculated,
ChiorophyU fluorescence measurements were ody taken fiom the 10 initial heads
of each block x cultivar combination at harvest. M e r acciimation to 20 OC (> 1-5 h), and
dark-adaptation (- 30 min) chlorophyll fluorescence was measured with the kinetic test
and the fast actinic test. The yield test was measured after - 20 min exposure to 10
pmo!*m-2-s-L of P A R Tables 3.5 and 3 -6 list specific light intensities and test times; see
C hapter 2 Mc~terids mrdMethods for instrument description.
Stutisficnl A»tuiyses
Analyses were carried out using SAS (1 985). The residuals fiom some data sets of
fluorescence and quality measurements were not nomally distributed and required
transformations [ln (value * an arbitrary factor)] (Table 3 -7). Where appropriate.
transformed data were used in the statistical analyses; however, since the non-transfonned
data were more meaningfùl, they were offen presented in tabular or graphical format even
though the accompanying analyses had been performed on the transformed data.
Chlorophyll fluorescence and qualitative evaluations were analyzed separately for each
harvest and day by ANOVA (GLM) to detennine treatment dflerences.

Table 3 -3. Rat Ïng scales for the evaluation of extemai rot, extemal ni blight, intemal
defects, internai rot and flowerstalk development-
Score Externai Rot
weight of trimmed rotten plant tissue (g) x 100%
weight of whole plant (g)
Moderate ( 5 %
3 Severe 5 4 0 %
Externai Rib Blight and Interna1 Defects Score (rib blight, mechanicd damage, brown rib, pink rib, and russet spotting)
Severe
Moderate
sright
None
Score Interna1 Rot
Present
Not Present
Score Flowerstalk Development
Bolting
Not Bolting

Table 3 -4. Evaluation of extemal rot for harvest 4 (fiorn Kader et al. (1973b).
Score External Rot Description
1 None
3 Slight slightly objectionable, may impair saleability
5 Moderate objectionable, definitely impairs saleability
7 Severe salvageable but normally not saleabIe
9 Extreme not usable

Table 3 S. Light ïntensities for dark-adapted kinetic test and fast actinic test, and light-
adapted yield tests of chlorophyll fluorescence for harvests 1 to 3. Test times (switching
on of lights) are included for the h e t i c test only since the other tests are automatic with
invariable times, as described previously.
Duration Time On Machine Setting Intensity
Light (9 6) -2 -L (relative units) (pmol-m -s )
Kitzefic Test arzd Actitzic Test
Modulated Light Continua1
1" Saturating Pulse 3.0 Y
2"" Saturating Pulse 3.0'
Actinic Light Continuai
Far Red Light Continua1
Detector Gain NIA
Yield Test
Modulated Light Continual
1" Saturating Pulse 3-0'
Detector Gain N/A
Light intensity of the far red light is reported in rnw-sr-'.
Y Harvests 2 and 3 were 3 .O s but harvest 1 was oniy 0.8 S.

Table 3 -6. Light intensities and test times for dark-adapted kinetic and light-adapted yield
tests of chlorophyil fluorescence for harvest 4-
Duration T h e On Machine Setting Intensity
Light (9 6) -2. -1 (relative units) (prno1.m s )
Kinetic Test
Modulated Light
1 '' S aturating Pulse
znd Saturating Pulse
Actinic Light
Far Red Light
Detector Gain
Yield Test
Modulated Light
1" Saturating Pulse
Detector Gain
Continuai O 100 0-39
3 -0 1 255 10 O00
3 -0 120 255 10 000
Continuai 20 125 22 1
Continual L30 50 z 2.9
N/A N/A 75 N/A
Continual O 200 0-78
0.8 1 23 O 9020
N/A N/A 25 N/A
Light intensity of the far red Light is reported in rnw-sr-'.

Table 3 -7. Transformations applied to data sets to norxnalize their distribution of residuals.
Measurement Harvests 1-3 Harvest 4
Kilzetic Tesr
Fo Fm
Fv F Fm'
Fo'
NQP
Fnst Actiiiic Test
FvEm
Yield Test F
Qesn
ln (Fo - 200) in (Fm - 1000) in (Fv - 800)
In (FI In F m 7
in (For - 200)
ln CNQP)
Qucdiinfive EvaIzratÏons
Rot Rating ln (Rot - 0.5) ln (Rot - OS) Visual Quality In (9.5 - Visual) ln (9.5 - Visual)
Composite Quality In (9.75 - Quality) N / A
Weight Loss (?A) In (Weight Loss + 0-75) In (Weight Loss + 0.75) Firmness ln (6 - Firmness) Ln (6 - Firmness)
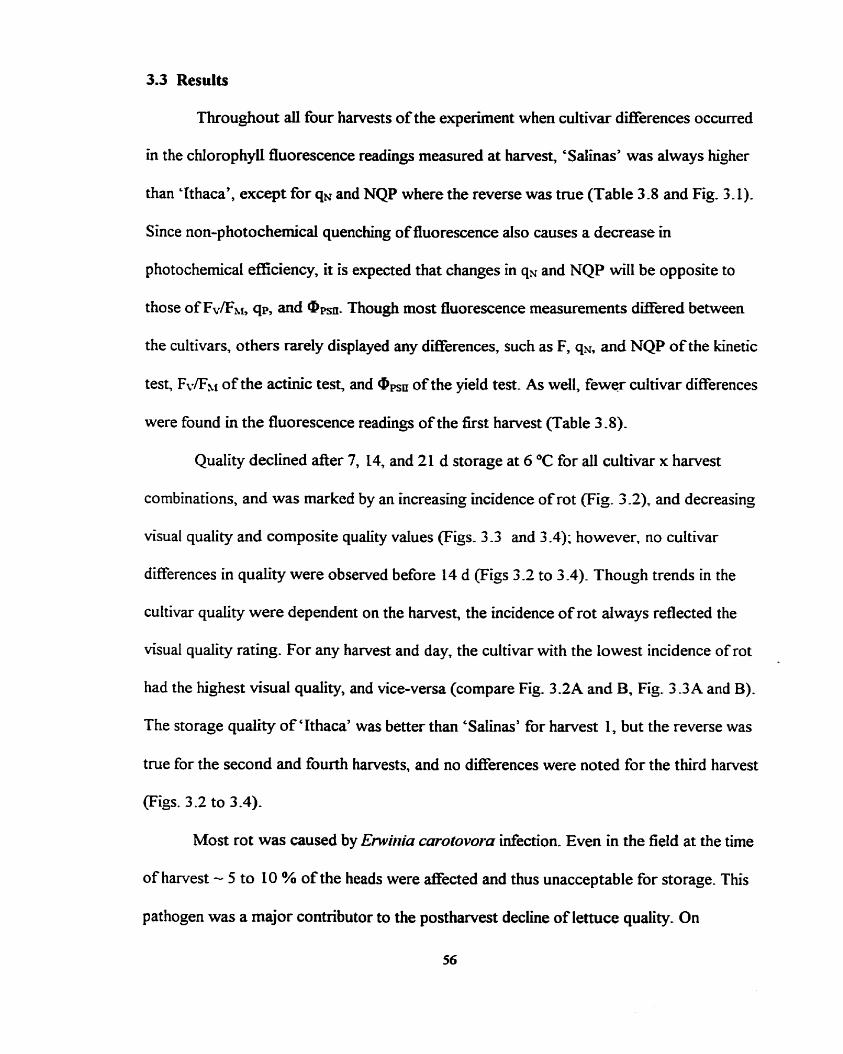
3.3 Results
Throughout aii four harveas of the experiment when cultivar differences occurred
in the chlorophyii fluorescence readings measured at harvest, 'Salinas' was always higher
than 'Ithaca', except for q~ and NQP where the reverse was true (Table 3 -8 and Fig. 3.1).
Since non-photochernicd quenching of fluorescence also causes a decrease in
photochernical effciency, it is expected that changes in q~ and NQP will be opposite to
those of FvEhf, qp, and Omo. Though most fluorescence measurements differed between
the cultivars, others rarely displayed any differences, such as F, q ~ , and NQP of the kinetic
test, Fv/Fkf of the actinic test, and <PPSII of the yield test. As weU, fewer cultivar ditrerences
were found in the fluorescence readings of the first harvest (Table 3 -8).
Quality declined after 7, 14, and 21 d storage at 6 O C for aiI cultivar x harvest
combinations, and was marked by an increasing incidence of rot (Fig 3 2 ) , and decreasing
visual quality and composite quality values (Figs. 3 -3 and 3 -4); however, no cultivar
differences in quality were observed before 14 d (Figs 3.2 to 3 -4). Though trends in the
cultivar quality were dependent on the harvest, the incidence of rot always reflected the
visual quality rating. For any harvest and day, the cultivar with the lowest incidence of rot
had the highest visual quality, and vice-versa (compare Fig. 3.2A and B. Fig. 3 -3A and B).
The storage quality of 'Ithaca' was better than 'Salinas' for harvest 1, but the reverse was
true for the second and fourth harvests, and no dserences were noted for the third harvest
(Figs. 3.2 to 3-4).
Most rot was caused by Envittia carotovora infection, Even in the field at the time
of harvest - 5 to 10 % of the heads were affected and thus unacceptable for storage. This
pathogen was a major contributor to the postharvest decline of lettuce quality. On
56

average, 30 % of heads which showed no sign ofrot at harvest developed syrnptoms
during storage (data not shown).
Harvests differed in mean weight at harvest (Fig. 3 SA), and within some of the
harvests differences even exkted between the initial weights of the cultivars (Fig. 3.58).
This is understandable as cultivars have different rates of growth and tendencies to
accumulate mass, and the different growing conditions of the harvests would be expected
to have influenced growth rates,
Harvests 1 and 4 had higher rates of weight loss during the storage period (Fig-
M C to E), probably because the stacks of containers (which held the-lettuce) were not
wrapped loosely with a plastic sheet, as were those of harvests 2 and 3. Harvest i only
had plastic draped over the containers and harvest 4 had no plastic wrap. There were no
differences in weight loss between cultivars within harvests, except for harvest 2 where
'Salinas' lost a greater percentage of moisture than 'Ithaca' (Fig. 3.5D). Compared to
'Ithaca', 'Salinas' heads tended to be more le@ and packed less densely, which would
favor moisture loss. Harvest 2 'Salinas' weights were lower at harvest as well (Fig. 3 SB).
thus a loss of moisture would incur a greater drop in the percentaçe weight for 'Salinasy .
than for 'Ithaca' .
'Ithaca' heads were usually finner than 'Salinas' by - 1.5 firmness units (on five-
point rating scale by Kader et al. 1973b) (Fig. 3.6A). Despite lower f imess ratings more
'Salinas' heads (60 %) had elongated stems (compared to 8 % for 'Ithaca') which
indicates premature initiation of flowering at harvest. Premature fiower initiation
sometimes resulted in oblong heads particularly for the cultivar 'Salinas'. Premature
bolting is caused by exposure to extended periods of high temperature and/or long days
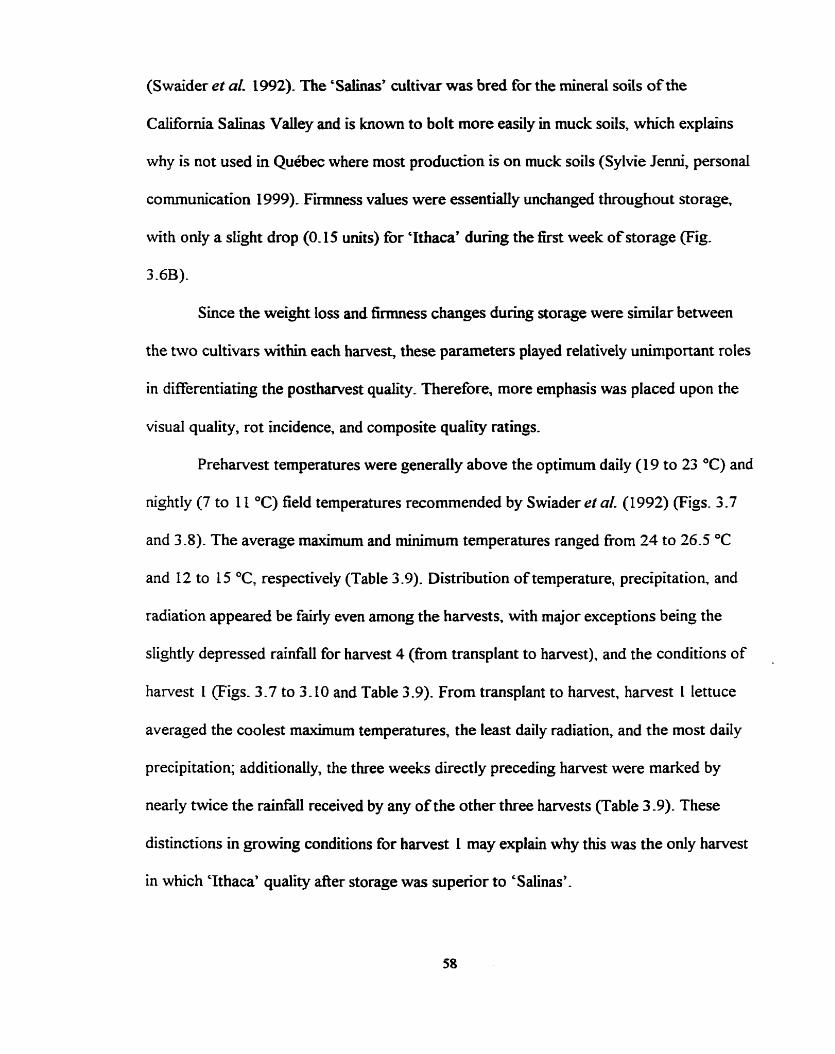
(Swaider et al, 1992)- The 'Salinas' cultivar was bred for the mineral soils of the
California Salinas Valley and is known to bolt more easily in muck soils, which explains
why is not used in Québec where most production is on muck soils (Sylvie Jemi, personal
communication 1999). Finnness values were essentidy unchanged throughout storage,
with only a slight drop (0.15 units) for 'Ithaca' d u ~ g the k t week of storage (Fig.
3.6B).
Since the weight Ioss and firmness changes during storage were similar between
the two cultivars within each harvest, these parameters piayed relatively unimportant roles
in differentiating the postharvea quality. Therefore, more emphasis was placed upon the
visual quality, rot incidence, and composite quality ratings.
Preharvest temperatures were generally above the optimum daily (19 to 23 OC) and
nightly (7 to 11 OC) field temperatures recommended by Swiader et nL (1992) (Figs. 3.7
and 3.8). The average maximum and minimum temperatures ranged fiom 24 to 26.5 OC
and 12 to 15 O C , respectively (Table 3.9). Distribution of temperature, precipitation, and
radiation appeared be fairiy even among the harvests, with major exceptions being the
slightly depressed rainfall for harvest 4 (from transplant to harvest), and the conditions of
harvest 1 (Figs. 3.7 to 3.10 and Table 3 -9). From transplant to harvest, harvest 1 Iettuce
averaged the coolest maximum temperatures, the least daily radiation, and the most daily
precipitation; additionaliy, the three weeks directly preceding harvest were marked by
nearly twice the rainfall received by any of the other three harvests (Table 3 -9). These
distinctions in growing conditions for harvest 1 may explain why this was the only harvest
in which 'Ithaca' quality after storage was superior to 'Salinas'.

Table 3 -8. Cultivar ditrences in chlorophyll fluorescence measured at harvest. In aiI cases
where the differences were significant, 'Salinas' was higher than 'Ithaca', except for qx
and NQP, where the opposite was true.
Variable
F m Actirt ic Test (dark-udqted) Fo NS **+ * Fxr NS *** * Fv NS *** * FVFM Y NS NS NS F NS *** IC
T X * ** ***
Yield Test (light-adcped) F C Z NS *** NS r(cl(c*
Fhf' ** *** *** ***
Fv' NS **(cl ** *** Qpsn Y*Z NS NS NS NS
Indicates transformation of harvest 4, [In (value * an arbitrary factor)]
Y Indicates transformation of harvests 1 to 3, [in (value * an arbitrary factor)]
NS * ** *** = not significant, or significant at PC0.05, PcO.01, or PCO-001, respectively. 7 9 ,

-$sa1 3pp JSEJ paidirpe-ynp a q uiog SEM p q ~ y, 1 ~dajxa 'isai ? g a q pa~depe-ynp aga uiog u a v j aJaM sa lqqm *(SN) luq~-@s-uou se paizxpu? uaqm ida~xa '(~0-0 > d JE) iualagp amfi s x ~ g r n aqa 'wauq qsea ~ J I M . .
-(t, i samq JOJ OZ = u pue 'E 01 1 s l sam4 JOJ op = u) maw ayl jo 3s ~ u a s a ~ d a ~ sxq Joua ay 1 - 1 - E aIqe1 u! paiexpu! a n salep . i s a m ~ -3samy JE paxmaux s ~ e n y n ~ ,seugzS, pue
pqg , JO s~aiaurend pue siuauiaJnsEau ama3sa~ong n Q d o ~ o ~ 3 sax.~a~aai - 1 - E -ZIA
- ' OOb
O
O01
002 2 OOE

S to rage Duration (d)
Fig 3 2. Evaluation of extemal rot of 'Ithaca' and 'Salinas' cultivars held at 6 O C for up to
2 1 days, where boxes A to D represent harvests I to 4. respectively. Harvest dates are
indicated in Table 3.1. The index used for harvests 1 to 3 was a four-point scale based
upon the amount of rotten plant tissue trimmed while a nine-point visual index was used
for harvest 4, (see materials and methods section). The error bars represent SE of the
mean (n = 40 for harvests 1 to 3 and n = 20 for harvest 4). Analysis of the log transformed
data set revealed cultivar dserences, where *, **, ***, indicate significance Ievels of
PC0.05, P<O.O 1, or P<0.00 1, respectively.

-' 6 8 4 f - Ithaca **
Storage Duration (d)
Fig. 3-3 - Visual quality of 'Ithaca' and 'Salinas' cultivars held at 6 "C for up to 2 1 days,
where boxes A to D represent harvests 1 to 4, respectively. Harvest dates are indicated in
Table 3 . 1 . The error bars represent SE of the mean (n = 40 for harvests 1 to 3 and n 20
for harvest 4). Analysis of the log transformed data set revealed cultivar differences, where
* Y * * Y ***, indicate significance levels of P<0.05, PcO.0 1, or P<O.OO 1. respectively.
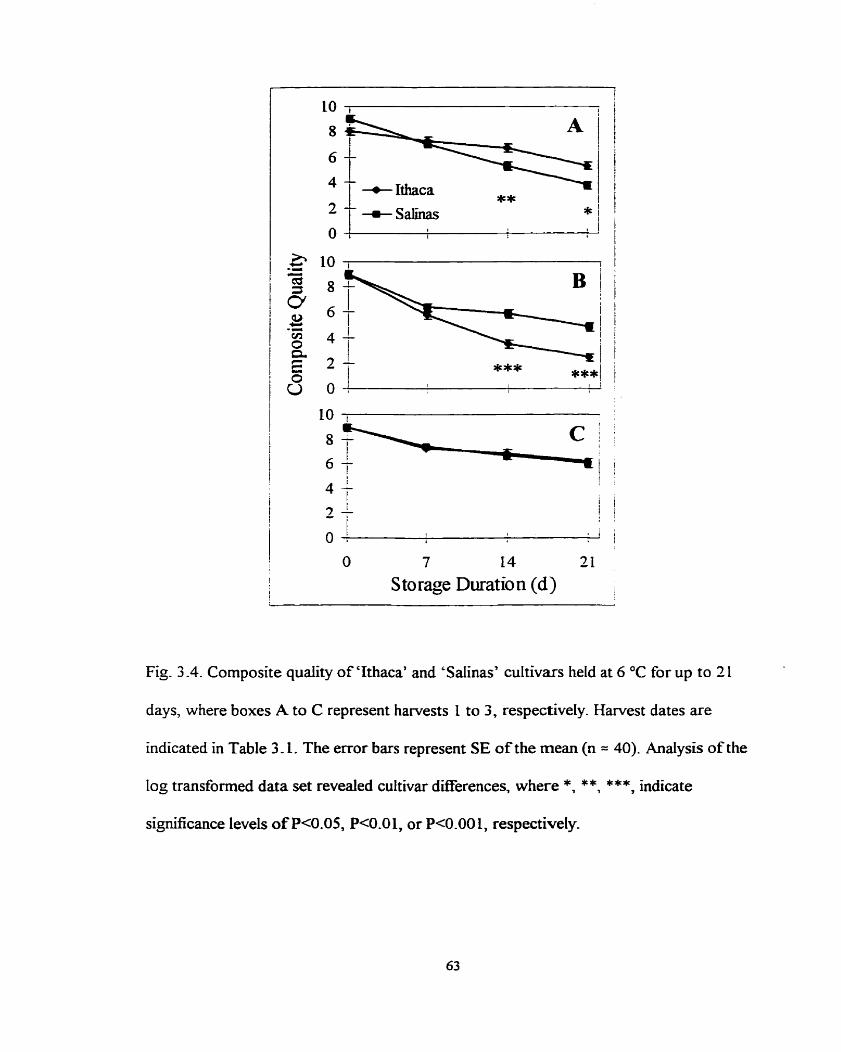
6
- - Ithaca 1 ** 1 +Salinas * /
S to rage Duratio n (d)
Fig. 3 -4. Composite quality of 'Ithaca' and 'Salinas' cultivars held at 6 O C for up to 2 1
days, where boxes A to C represent harvests 1 to 3, respectively. Harvest dates are
indicated in Table 3.1. The error bars represent SE of the mean (n = 40). Analysis o f the
log transformed data set revealed cultivar differences, where *, **, ***, indicate
significance levels of PcO.05, Pc0.0 1, or Pc0.00 1, respectively.

Fig. 3 S. Trends in initial weight and weight loss of the four harvests. Harvest dates are
indicated in Table 3.1. (A) Harvest differences in weight at harvest (initiai weight),
averaged over the two cultivars, where columns with different letters are different at
P < 0.05. (i3) Cultivar differences in weight at harvest, each harvea was anaiyzed
independently, where dserences at P < 0.05 are indicated by '*'. (C) Harvest differences
in weight loss averaged over the two cultivars and three removal tirnes (7, 14, and 21 d),
where columns with different letters are different (P < 0.05). @) Cultivar differences in
weight loss, averaged over the three removal times, with each harvest analyzed
independently, where differences (P < 0.05) are indicated by '*' . (E) Progression of
weight loss dunng storage, averaged over the two cultivars. Reported values are means
with SE (for A and C, harvests 1 to 3, n = 240; for B and D, harvests 1 to 3, n = 120; for
E, harvests 1 to 3, n = 80; and for harvest 4, n = K n of harvests 1 to 3).

2 3
Harves t
- Harves t 1 + W w e s t 4
4- Harvest 3 * Harves t 2
7 14
S torage Duration (d)
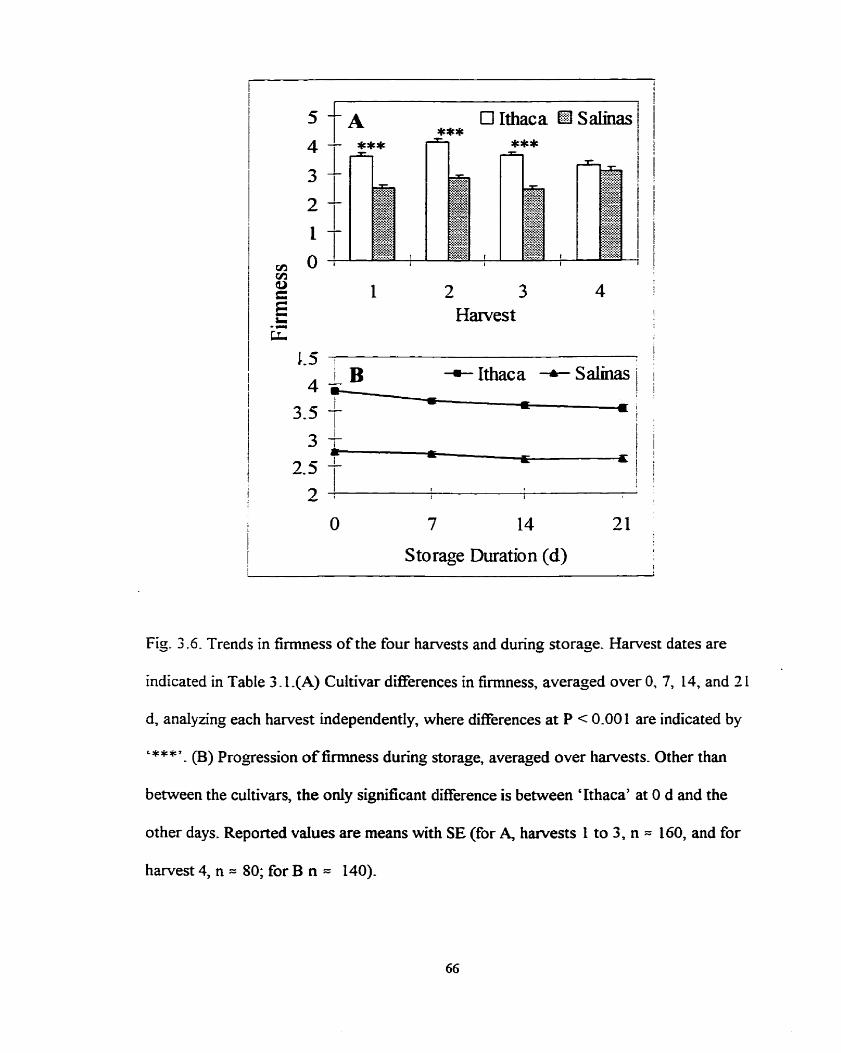
O 7 14 21
S torage Duration (d) I
Fig. 3 -6. Trends in firmness of the four harvests and during storage. Harvest dates are
indicated in Table 3. L(A) Cultivar dserences in firmness, averaged over 0, 7, 14, and 2 1
d, analyzing each harvest independently, where differences at P < 0.001 are indicated by
C * ~ ( C J L C Y (B) Progression of f imess d u ~ g storage, averaged over harvests. Other than
between the cuItivars, the only significant difference is between ïthaca7 at O d and the
other days. Reported values are means with SE (for 4 harvests 1 to 3, n = 160, and for
harvest 4, n = 80; for B n = 140).

35 max ------- min I
10 20 30 10 20 30 10 20 30 10 20 30
May June July Augist
Day of 1998
Fi;. 3 -7. Daily maximal and minimal field temperatures (OC) recorded at Ste-Clotilde
dunng the summer of 1998. The curves were fitted to plotted points o f five-day means.
The growing periods o f harvests 1 to 3 are indicated, with a vertical line demarcating
when plants were transplanted f?om the greenhouse to the field. Horizontal lines
correspond to optimum field temperatures for growth: 19 to 23 OC dunng the day and 7 to
1 1 OC during the night (Swiader et al. 1992).

rnax ----- min
Harves t 4
10 20 30 10 20 30 10 20 30
June July August
Day of 1997
Fig. 3 -8. Daily maximal and minimal field temperatures (OC) recorded at Ste-Clotilde
during the sumrner of 1997. The curves were fitted to plotted points o f five-day means.
The growing penod of harvest 4 is indicated, with a vertical Line demarcating when plants
were transplanted fiom the greenhouse to the field. Horizontal lines correspond to
optimum field temperatures for growth:
the night (Swiader et al. 1992).
19 to 23 O C d u ~ g the day and 7 to 1 1 O C dunng

t l
Harvest 1 3 B
1 1 I 8
1 I b 1 1 1 1 1 l t
t
10 20 30 10 20 30 10 20 30 10 20 30
May June July Aupst Dayof 1998
Fig. 3 -9. Daily precipitation (mm*mJ*d-L) and radiation ( ~ - r n - ~ - d - ' ) at Ste-Clotilde
during the sumrner of 1998. The curves were fitted to plotted points of five-day means.
The growing periods o f harvests 1 to 3 are indicated, with a vertical Iine demarcating
when plants were transplanted from the greenhouse to the field.

Precipitation -------Radiation 1
10 20 30 10 20 30 10 20 30 June July August
Day of 1997
Fig. 3 - 10. Daily precipitation (mrn-m-2*d-L) and radiation (MJ*mJ-d-') at Ste-Clotilde
dunng the summer of 1997. The curves were fitted to plotted points o f five-day means.
The ~rowing penod o f harvest 4 is indicated, with a vertical line demarcating when ptants
were transplanted fiom the greenhouse to the field.

Table 3 -9- Field conditions d u ~ g the growth of the four hanrests- Daily means were
averaged for the 2 1 or - 48 d periods preceding harvest.
Penod
-
Temperature (OC) Precipitation Radiation
Harvest Maximum Minimum (mm- d-') (MJ-m-2= d-')
21 d preceding harvest 1
2
3
4
48 d preceding harvest ' 1
Z. Calculated from time of transplant to time o f harvest (- 48 d).

3.4 Discussion
Patterns in chiorophyU fluorescence measured at harvest did not change with those
of storage quaiity. The higher values of Fv, FJFkf, qp, and OpSn, and Iower values of qs
and NQP suggested that the photosynthetic efficiency and thus crop health of 'Salinas7
was superior to that of 'Ithaca' (Table 3 -8 and Fig. 3.1). However. the qudity of 'Salinas'
after storage was supenor to that of 'Ithaca' ody in harvests 2 and 4, while no differences
were observed in harvest 3 and 'Salinas' quality was in€erÏor in harvest 1 (Figs. 3.2 to 3.4).
This was strong evidence against a relation between chlorophyll fluorescence measured at
harvest and the storage potential of iceberg lettuce. There were three likely explanations
of these observations as summarized in Table 3.10: (1) stresses which af5ected
photosynthesis and were reflected by chlorophyll fluorescence at harvest also iduenced
the storage potential but this relationship was masked by inherent cultivar differences in
photosynthetic capacity; (2) stresses which affiected photosynthesis and were reflected by
chIorophyl1 fluorescence at harvest were dissiMlar to those wlllch infiuenced the storage
potential; (3) stresses which affect photosynthesis and would be reflected by chlorophyll
fluorescence at harvest were not present, thus these unobserved stresses must be dissimilar .
to those which influenced the storage potential.
Ifa physiological dzerence existed between the two cultivars, the enhanced
photosynthetic efficiency of 'Salinas' could have been caused by the organization of this
cultivar's photosynthetic units, making it well-adapted to the particular field conditions. If
this were true, the large inherent cultivar differences in photosynthetic efficiencies could

Table 3.10 Likely exphnations of why no relationship was observed between chtorophyll
fluorescence and storage potential.
- -- - - - - --
Stress factors which affect Stress factors which affect p hotosynthesis and fluorescence storage potential
(1) were present - - were present but were masked by inherent cultivar differences-
( 2 ) were present # were present
(3) were not present # were present

have overshadowed smaller stress-induced changes in photosynthesis, and thus greater
photosynthetic competence was invariably attributed to 'Salinas'. Evidence supporting this
hypothesis was found in the magnitudes of differences in chlorophyll fluorescence
measurements between the cultivars, Harvest 1 was the sole harvest in which the storage
quality of 'Ithaca' was superior to 'Salinas'; fiirthermore, this harvest had the smallen
cultivar differences in chlorophyll fluorescence (Fig. 3.1). This can be seen atso in the
reduced statistical significance ofthese dxerences in cornparison with those of other
harvests (Table 3-8). It is possible that the field conditions which favored 'Ithaca' and
predisposed 'Salinas' to poorer storage quality also infiuenced the fluorescence
measurements, but that the increases in 'Ithaca' fluorescence were still smailer than the
inherent cultivar diffierences in photosynthetic potential. To carry this explanation further.
from the identical storage quality of the cultivars within harvest 3 (Figs. 3 -2 to 3.1) one
would expect sirnilar (but slightly smaller) decreases in their chlorop hyll fluorescence
. (Fig. 3.1). This is not clearly seen in al1 fluorescence parameters; however, such a response
may be too rnuch to expect given the degree of variation.
An inconsistency in methods complicates this explanation for the smaller
differences between cultivar fluorescence vdues in harvest 1. The duration of the
saturating pulse in harvest 1 was only 0.8 s of 10 000 pmol photons*m-z*s-' while in
harvests 2 and 3 it was 3.0 S. Adjustments to the duration of the pulse were in an atternpt
to ensure that it was saturating (Le. causing complete reduction of QA to obtain the FSI
level). A duration of 0.8 s appeared to be sufficient for harvest 1 but in harvests 2 and 3
the subsequent application of the actinic light (- 220 pmol photons= m-2-s-') induced a
higher peak fluorescence than the saturating pulse did. It is dinicult to imagine that a pulse

five times more intense than fiil sunlight ùwfnciently saturated at 0.8 s, but sufficiently
saturated at 3 -0 s; however this may be caused by a slow reduction of the PQ pool which
can quench fluorescence (Vemotte et a' 1979). One can only speculate upon the
differences between harvests which changed the capacity for saturation. in theory the
pulse duration and saturation are irrelevant in cornparison with the assurance that the pulse
was saturating for al1 harvests. Unfortunately, this change in rnethods rnay be c o ~ e c t e d to
the smaller dserences between cuitivar fluorescence values In harvest 1 -
Altemati~ely~ the two cultivars may have possessed similar potentid
photosynthetic efficiencies but the stress factors which affected the photosynthetic
competence and chlorophyll fluorescence at harvest were not identical to those which
influenced the storage potentid. Thus, the higher observed efficiency of 'Salinas' may
have been due to an increased tolerance to the stress conditions aEecting photosynthetic
competence (e-g. high temperature, high radiation, and water shortage) but not those
affecting storage potential. This theory is the most obvious explanation of the data, since
the patterns in chlorophyU fluorescence measurements did not parallel those of storage
quality.
A third interpretation is that the photosystems were not stressed at harvest and
thus chlorophyll fluorescence did not reflect the storage potential or the stresses which
influenced it. This interpretation implies the existence of a group of stresses which do
affect photosynthesis, can be measured by chiorophyll fluorescence, and may or may not
be related to the stresses infiuencïng storage potential.
To determine which of the three ïnterpretations best explains the data. one must
examine the factors which affect growtk chlorophyll fluorescence and postharvest quality.

In a recent review, Weston and Barth (1997) discuss preharvest factors which affect the
postharvest qu&ty of vegetables. A number of climactic conditions and cultural practices
were noted-
Ascorbic acid (vitamin C) content increases with hcreasing light intensities (Kader
1987) and, for leafy greens in particular, with increasing light exposure (Nagy and
Wardowski 1988; Shewfelt 1990). On the other hand, excluduig a few crops, high
temperatures (> 20" C) have been noted to reduce the content of vitamins C and B.
GeneraLly, lettuce is a cool crop, and the maximum daily and nightly field temperatures (on
average 26 and 13 -5 OC, respectively) were above recornmended levels (23 and 1 1 OC.
respectively; Swaider et al. 1992). It is reasonable to expect that this would have
adversely affected ascorbic acid content in the lemice.
Toivonen (1992) used ascorbic acid content to evaluate the postharvest quality of
broccoli because this measurement is considered to be a sensitive indicator of changes in
tissue condition after harvest (Perrin and Gaye, 1989; Solomos, 1983). Undoubtedly, this
is because of the ubiquitous nature and abundance of ascorbic acid, as well as its integral
roIe in oxidative protection. L-ascorbic acid (vitamin C) is an important element in hurnan
nutrition and in several physiological processes of plants including growth, differentiation,
metabolism, and protection corn oxidative stress (McKenie and Leshem 1994). Ascorbate
is contained in several cellular compartments of plants: chloroplasts, cytosol. vacuoles.
and extra cellular compartments. In green leaves, the amount of ascorbate is roughly the
same as the arnount of chlorophyli, with 20 to 40 % ascorbate in mesophyll cells located in
the chloroplasts (McKersie and Leshem 1994). This is likely related to the integral role
ascorbic acid plays in the scavenging of fkee radical species which cause oxidative stress.

Ascorbate reacts directiy with superoxide and, when catalyzed by ascorbate peroxidase, it
can deto* hydrogen peroxïde (McKenie and Leshem 1994). Ascorbate also regenerates
membrane-bound antiondants such as a-tocopherol (vitamin E) which stabilizes
membranes (McKersie and Leshem 1994). In the chloroplasts, ascorbate, SOD, and
glut athione are the major antioxïdants involved in the Hdliwell-Asada pathway, which
detoxines activated oxygen species and dirninishes the hi& redox potential that favours
superoxide formation by PSI (McKersie and Leshem 1994).
As mentioned in Section 1.9, activated oxygen species are generated in many of
the cellular organelies, and oxidative damage to cellular structures is ofien a secondary
effect of chilling, fi-eezing, desiccation, and anaerobic stresses (McKersie and Leshem
1994). Rates of senescence can be increased by activated oxygen species reacting with any
number of cellular structures, e-g. attacking celldar membranes will cause
decompartmentalization, or reactions with ce11 wall pectin will make the tissue sofl or
sponw. Thus activated oxygen scavenging systems are critical to the maintenance of
cellular structure and whole plant quality. As acorbic acid maintains postharvest quality by
preventing cellular degradation by activated oxygen species, plants with decreased
ascorbic acid content are at a disadvantage in maintaining postharvest quality.
Soi1 nitrogen is a preharvest factor associated with a lot of variation encountered in
the nutrient content of vegetables. N~trogen availability is closely linked to protein and
carotenoid biosynthesis, in particular, Ntrogen deficiencies are associated with decreased
protein levels. On the other hand, excessive nitrogen results in reduced ascorbic acid
content and the accumulation of potentially hazardous concentrations of nitrate nitrogen
which adversely affects the nutritional quality of vegetables. Shce recommended fertilizer
practices were followed for these experiments, the probability of adverse effects due to
soi1 nitrogen levels is low.
Drought stress or flooding are field stresses which can result in photosynthetic
reductions (Janoudi et ai. 1993). Drip irrigation of tomato increased water availability and
ascorbic acid content (Cevik, et al. 1981), whereas total soluble solids, sugar, acidity, and
fl avour of tomato h i t were found to increase with increasing drought stress (Bevedy et
aL 1994). However, reductions in tomato h i t yield accompanied the improvements in
fmit quality induced by moderate stress. Johnson et nL (1989) demonstrated that high
rainfall during the growing season reduced spinach storage potential by an average of 40%
while plant type (savoy vs. common) and temperature did not affect postharvest quality.
This finding may explain the iderior quality of harvest 1 'Salinas' compared to 'Ithaca'.
Three weeh directly preceding the harvest of harvest 1, the amount of rainfall received
was nearly twice that of any of the other three harvests (Table 3.9). The period directly
preceding harvest can greatly &ect the quality of the lettuce since this is when the heads
forrn. The distinctions in postharvest quality may have been related to different cultivar
responses to excess rainfall-
Matunty at harvest is reported to affect storage potential. Small cabbage heads are
higher in ascorbic acid content than larger heads, but generally, ascorbic acid of green
vegetables increases during maturation and decreases with advanced maturation (Weston
and Barth 1997). The two cultivars studied required approximately the same arnount of
time to mature under optimal conditions (85 and 88 d); however 'Salinas' was not bred for
muck soils and this aEected the maturity. Salinas heads did not usually develop to full
matunty, as evaluated by fïrmness, and ofien bolted prematurely. It is uncertain how this

may have affected the storage potential or chlorophyll fluorescence-
Since both cultivars had expenenced identical growing conditions, their contrasting
quality was likely due to dserential responses to these conditions- For example the
adverse effects of high temperature on ascorbic acid formation may have been stronger in
'Ithaca' than 'Salinas', thus imparting ïmproved quality to 'Salinas'. Weston and Barth
(1 997) report cultivar-dependent variation in antioxidant activity mong 'Granola',
'Russet Norkotah7 and 'Yukon Gold' potatoes and Lee et al. (1995) demonstrated that
Ievels of ascorbic acid in peppers varies greatly with cultivar. Other physiological and
morphological differences affect many aspects of quality, e-g., cuticle thickness and
suiface to volume ratios will influence water loss, and pathogen infection may be
influenced by leaf structure and surface feature. Cultivar variation in morphology and
physiology, particularly in tolerance and response to stress, plays an important role in
postharvest quality.
Chlorophyli n fluorescence is influenced by a number of the preharvest factors
highlighted to affect the postharvest quality of vegetables. Snvastava and Strasser ( 1996)
evaluated the individual and synergistic effects of temperature, irradiation intensity, and
water deficit on photosynthesis, particularly PSII activity Compared to pea plants at
22 OC, those which had been exposed to increased temperatures (> 35 OC) exhibited
reduced PSU activity. Decreased ratios of apso, FV/Fh; and q p were explained by
decreases in Fh[. PSII is known to be more sensitive to heat stress, with an early syrnptorn
being the loss of O2 evolution activity and deactivation of PSII due to denaturation of
certain functional proteins, dissociation of iight harvesting pigments and the PSII cornplex,
and the release of the functional Mn f?om PSII (Srivastava and Strasser 1996).
79

Stressfil light intensities (750 ~ r n - ' ) augmented decreases in photosynthetic
activity due to high temperatures. Considering that hl1 sunlight is - 440 ~ - r n - ~ (or
- 2000 pmol photons-m-2-s-', mean X = 550nm), a treatment of 750 ~ * r n - ' is very
extreme. Water deficits decreasing tissue water content by 40 %, only marginally affected
PSII activity and provided some protection against heat stress (Snvastava and Strasser
1996).
The temperatures, irradiation intensities, and water deficits required by Srkastava
and Strasser (1996) to produce a noticeable stress response in chlorophyll fluorescence
were much more extreme than any conditions experienced by the Iettuce during Our
experîments. Maximum daily averages rarely exceeded 3 0 O C , and water availability was
fairly high and consistent because of irrigation dunng dry periods. Daily fluctuations in
light intensities certainly exceeded usabIe arnounts and would have resulted in
photoinhibition. But this method of protection against high irradiation can cycle daily
between occurrence and recovery without causing long-term damage to the plant, as long
as ternperatures are not extreme- Furthermore, Snvastava and Strasser show that gradua1
exposure to moderate stress (which is the case in the field) either from temperature or low -
light or water deficit, will greatly increase the plant's tolerance to other stresses. This
strongly suggests that our field conditions were not severe enough to have stressed the
photosystems of lettuce, and thus chlorophyil fluorescence was unaected.
Biotic stress is another factor which should be considered. The most obvious
reduction in quality caused by pathogenic idections is due to wounding or discolonng of
tissue, but pathogenic ethylene production or wound-ethylene responses of plants can
increase the general senescing processes and decrease quality. Since pathogens continue to
80

actively detenorate vegetable health d e r harvest and advenely a e c t al1 aspects of
quality, and because of the high incidence of rot in storage encountered during this snidy,
this may be the preharvest factor which had the most serious effects upon posthwest
quality .
Ewir~ia corotovo~a infection was one of the major factors contributing to the
decline of lettuce quality during storage. Heads visibly affected by Envinin soft rot were
not selected for storage but - 30 % of stored heads developed sofi rot symptoms (data not
shown). Therefore at harvest some of the heads were at an early stage of infection which
preceded visible symptoms. At harvest it was not possible to determine fiom the
chlorophyll fluorescence measurements (Figs. 3.1 and 3 2) which cultivar would develop a
more severe case o f rot during storage (Fig. 3.2). Even when measunng heads that had
clearly developed symptoms of soft rot, the chlorophyll fluorescence was not always
affected. Compared to control groups of Iettuce, identically treated groups which
displayed sofi rot symptoms could sornetimes have decreased values of Fo. FM, Fv/FxI,
FI:/F~;, qp, and @PSU, significant at P < 0.05, when n = 8 for both groups (data not
shown). However, due to variation, differences were not always detectable, especially if .
few heads were sampled. Given the uncertain effects of bacterial infection upon
chlorophyll fluorescence measured when visible symptoms have clearly developed, it is not
surprising that fluorescence measured at harvest did not relate to the developrnent of rot
during storage.
The ditferential storage qualities of the two cultivars may have been caused by
their individual responses to preharvest factors such as temperature, light intensity, water
availability, soi1 nutrients, and pathogenic Section. Another possibility is that only a few
81

of these factors caused stress, e-g. favorable conditions for pathogens were created by
excess rainfall in harvest 1, a situation which may have increased the susceptibility to
pathogens of 'Saiinas' more than of 'Ithaca'. The stress conditions of our expenment were
mild in cornparison with those of Srivastava and Strasser (1996). This evidence strongly
opposes the suggestion that our conditions stressed the photosystems of the plants and
that chlorophyii fluorescence relates to the storage potential. On the other hand, smaller
differences in chlorophyll fluorescence were observed in the sole harvest whkh had
reversed trends in postharvest quality. The most viable explmation is that the preharvest
stresses which iduenced the storage potential exhibited o d y sl ight effects on
photosynthesis and chlorophyll fluorescence. As well, inherent cultivar differences in
p hotosynt hetic capacity appeared to have almost completely masked stress effects on
chioro phyll fluorescence.

CHAPTER 4
Chlorophyll Fluorescence as a Potential Indicator of Russet Spotting,
a Disorder Induced by Ethylene Stress
4.1 Introduction
Russet spotting is a disorder that is characterized by reddish-tan, olive, andor
brown elongated, pit-iike spots on the midribs of Ieaves o f iceberg Iettuce. In severe cases,
the spots can be observed on the leaf blade, though these spots tend to be rounded and
shallow (Lipton and Ryder 1989). Most commoniy, russet spotting is induced by exposure
to ethylene of hormonal levels (c 1 p ~ * ~ - L ) in air at 5 OC (Rood, 1956), although it may
develop at temperatures from 3 to 10 OC (Lipton and Ryder L989). Even without exposure
to exogenous ethylene, lettuce can develop russet spotting lesions. A number of factors
are thought to predispose lettuce to russet spotting development, such as over-maturïty
and ageing (Lipton and Ryder I989), as well as biotic and abiotic stresses durin% growth
or afier harvest (Peiser et ai. 1998). For example, lettuce is more susceptible to russet
spotting when harvested after a 10 day penod containing two or more days wïth
temperatures above 30 O C (Lorenz and Maynard 1988). Tt is suggested that stresses cause
endogenous production of stress ethylene (Ke and Saltveit 1988; Lipton et ni. 1972;
Ritenour et al. 1990) which then induce russet spotting development. Additionally, there is
a wide range of cultivar susceptibility to this disorder. Some cultivars will not develop
nisset spotting when entire heads are exposed to p ~ * ~ - L levels of ethylene at optimal
temperature (6 OC) ifthey had experienced very little stress dunng growth and had been
harvested at optimal matunty (Saltveit personal communication to DeEU 1998).

Wounding leaves by removing them fiom the head or excising midnb sections greatly
increases their susceptibility to russet spotting.
The two major anatomïcal changes associated with russet spotting are ce11 wal1
thickening and ce11 discoloration (Lipton 196 1; Ilker et aL 1977). Ke and Sa l~e i t (1988)
found ethylene treated tissue had higher lignin content than non-treated tissue, with
lignification IocaIized in the walls of cells with russet spotting. Hyodo et nl. (1978)
observed an ethylene-induced increase in phenylalanine ammonia-lyase activity (PAL, the
first cornrnitted enzyme in the phenylpropanoid pathway) which paralleled the appearance
of russet spotting syrnptoms. It is now known that ethylene induced PAL activity leads to
the formation of phenolic compounds which can f o m brown polymerized compounds
upon oxidation (Peiser et aL 1998). However, msset spotting lesions will deveiop even if
PAL is inhibited (Peiser et c d 1.998); these lesions remain olive-green in colour for several
days but will eventualiy tum their characteristic brown colour when PAL enzyme
production is enough to overcome the inhibition (Peiser et al. 1998).
The objective of this experiment was to evaluate the use of chlorophyll
fluorescence measurements as early indicators of ethylene-induced stress during the
storage iceberg lettuce. It was hypothesized that since ethylene acts at a cellular level to
cause nisset spotting, it is possible that these biochernical changes may also a e c t
photochemistry and enable chlorophyll fluorescence measurements to act as early
indicators of the stress-
4.2 Materials and Methods
Procedzrre
'Ithaca' iceberg lettuce was bought from a local produce distnbutor in
Sherrington, Québec. The lettuce had been harvested, vacuum cooled, and held at I OC for
I d. In the laboratory cold room at 6 OC, the wrapper leaves and severely broken leaves of
each head were discarded and the next two or three leaves were carefully removed for use
in the experiment. The most intact and heathiest-looking leaves were randomly divided
into two groups of five leaves and four groups of 40 leaves. The former were evaluated on
day O and the Iatter were held in air storage at 6 O C for 11 d. Each group of 40 leaves was
held in a 1 10 L cylindrical plastic storage chamber, 40 cm in diameter and 90 cm in height.
Five circular platforms (perforated to decrease their resistance to air circulation) sewed as
shelves within the chambers. Eight leaves were placed on each of the five shelves (= 40
Ieaves per chamber), 1 L of water was added to the bottom of each chamber, and the
chambers were sealed. The relative humidity of the chambers equilibrated to - 95 %
within 1 h of sealing and remained at this level throughout the storage period. Ethylene
was injected and sarnpled through septums in the lids of the chambers; the levels were
monitored several times a day. Ethylene concentration was maintained at 50 * 10 p ~ - ~ - L
within two of the chambers, while the other two chambers had no ethylene.
The chambers were opened after 1,2,3,4,5, 7, 9, and t 1 days and one leaf fiorn
each shelfwas removed for sampling. Thus there were two replicates of five leaves for
each etliylene and non-ethylene treatment. The chambers were promptly resealed and the
treatments restored to the conditions stated previously. Opering the chambers each day,
allowed COa levels within the chambers to remain below 0-30 %, which is considered a

safie level for lettuce storage. CO2 concentrations above 2.5 % have been implicated in the
development of brown stain (Isenberg, 1979). The leaves were acclimated for - 1 h in a
dark, 20 O C room. Dark-adapted fluorescence evaiuations (kinetic and fast actinic tests)
were conducted, foliowed by tight adaptation and the yield test, and finally quality
evaluations, The evaluated leaves were then held in arnbient air at 6 OC for re-evaluation of
russet spoahg and incidence of rot on day 1 1. The entire experïment was repticated hvice.
ChlorophyII Fhorescence Evalziatiorz
Leaves were removed from storage (6 OC) and acclimated in darkness at room
temperature (20 OC) for - 1 h before chlorophyll fluorescence evaluations. Fluorescence of
the dark-adapted samples was measured using the kinetic test and the fast actinic test,
fotlowed by light-adaptation (- 20 min exposure to 100 pmol-m"d of PAR) and the
yield test. Specific light intensities and test times are listed in (Table 4.1). The midnb of
each leaf was measured at two random places within the region 3 to 10 cm up from the
base. The rnidribs of lettuce leaves were vety iight green in color and had weaker
fluorescence yields than those of typical leaf samples (data not shown), presuniably due to
Iower concentrations of chlorophyll. Thetefore, it was necessary to have higher detector
gains and modulation light intensities than normally used to measure lettuce. As a
consequence, the samples reflected some of the excitation Light. When the detector gain
and modulated light settings were at - 125 and 230, respectively, an Fo reading of - 25
(relative units) was induced by reflection from a non-fluorescent paint sample of similar
gloss and color to a lettwe midrib section. Similarly, when the saturating pulse was set to
255, a reading (FhS of - 35 was induced fiom the same non-fluorescent sample. These

Table 4.1. Light intensities and test times for dark-adapted kinetic and fast actinic tests,
and light-adapted yield test of chiorophyii fluorescence measured on l e a f ~ d r i b s . Test
times (switching iights on) are included only for the kinetic test since the other tests are
automatic with invariabIe times-
Duration Time On Machine Settïng Intensity
LÏg ht (s) (s) (reiative units) (pmo1-m-2- s-')
Kirletic Test mtd Actinic Test
Modulated Light Continuai
1 " S aturating Pulse 0-8
Td Saturating Pulse 0-8
Actinic Light Continual
Far Red Light Continua1
Detector Gain N/A
Yidd Test
ModuIated Light Continual
1 " Saturating Pulse 0-8
Detector Gain N/A
O 255 1-0
1 23 0 9020
N/A 100 and 125 N/A Z Light intensity of the far red Iight is reported in rn~.sr-'.
' Two yield tests were conducted with detector gains of 100 and 125 units.

limitations of the instrument are minor in cornparison with the average Fo readings (> 200)
and Fhr readings (> 750).
QziaZify evah~afions
Leaf quality was evaluated by a number of subjective rating scales. Russet spotting
was assessed using a slightly altered version of Ke and Saltveit's (1986) O to 9 scale. A
severe injury for Our scaIe, 9, was equivalent to - 7 on Ke and Saitveit's scale and no
injuv on our scale, 1, corresponded to O on Ke and Saltveit's scale. The seventy of this
disorder was characterized for an entire l e e bearing in mind the abundance and size of
lesions. The presence of rib discoloration, also called rib biight and brown rib by Lipton et
al. (1972), was evaluated over an entire leaf, using a four-point scale: 1 = none, 2 = slight,
3 = moderate, and 4 = severe. The overall visual quality was evaluated according to the
nine-point scale devised by Kader et al (1973b) where 9 = Eucelht, essentially free from
defects; 7 = Good, minor defects, not objectionable; 5 =Fuit-, slightly to moderatety
objectionable, lower limit of sales appeal; 3 = Poor, excessive defects, limit of saleability;
and 1 = Octi-emely Poor, not usable. Other browning, discoloration, and damase to the
rnidnbs was evaluated as 1 = none, 2 = siight, 3 = moderate, and 4 = severe. Finally, the
percentage of rotten leafarea was estimated visuaily.
h s frrirnentation
Ethylene levels were monitored by gas chromatography, using an HP S890A
(Hewlett-Packard, Avondale, Pemsylvania) equipped with a flarne io~zation detector, and
a Poropak Q (2 m long) separation column. The instrument was linked to an HP 3393A
88
computing integrator (Hewlett-Packard, Avondale, Pemsylvam-a) and was calibrated with
a 1 point calibration method ushg 1 &-L-' ethylene (balance Nt). Relative humidity
inside the sealed charnbers was measured with a dewpoint hygrometer (model HMP 243,
VAISALA, Wobum, MA), which is designed to measure accurately the relative humidity
even when levels are near 95 %. The atmosphenc COz concentrations were measured math
an i&a-red analyzer (model DELTAGAS Crowco n, Abingdon, Oxfords hire, England)
which is capable of measuring O to 2000 fi-^-' COz.
Stntistical mzalysis
Analyses were carried out using SAS (1985). First the data trends of each charnber
were sumrnarized usïng l iear regression analysis, regressing each response (Y) over
storage tirne 0. Coefficients for the Iinear intercept (B) and dope (X), and quadratic
curvature (x2) of the regressions for each of the eight chambers (2 chambers [blocks] per
. treatment x 2 treatments x 2 replications over time) were obtained. Each of these
coefficients was andyzed separately by ANOVA (GLM) to determine treatrnent and
replicate differences.
A simple (perhaps incomplete) model was used with ANOVA (GLM) to determine
the mean response and standard deviation (SD) of each day x treatment x replicate
combination, and to estirnate the standard error of the mean (SE). No statistica1
significance was placed upon this second analysis as it was intended to support the initial
analysis with a visual display of the trends and estimations of the variation.
4.3 Results
The rneasured responses which appeared to exhibit the greatest treatment
differences in the coefficients ofihear intercept @), h e a r dope OC), and quadratic
curvature (x2) also possessed undesuable differences between the two replicates, as weli
as treatment x replicate interactions (Table 4.2). The treatment differences were stronger
within the kst replicate. Udominately this may have been caused by extraneous
temperature effects which were not controlied adequately. In the k s t replicate ody, the
ethylene-treated chambers were heid in a storage room that was much smalIer and had a
lower cooling capacity than the room which held the no-ethylene chambers. In the second
replicate both treatments were held in the same storage room. The il1 effects of larger
temperature fluctuations and higher overalf temperatures (due to Iower cooling capacity of
the room) most likely caused the increased differences in treatment responses of the first
replicate. As a result the two replicates were analyzed separately and more value was
placed upon the second repticate-
Within replicate 1, treatment differences were observed in the linear slopes and
intercepts of the msset spotting curves (Fig. 4. LA) and in the linear slopes and quadratic
curvatures of repticate 2 (Fig. 4. lB), but no treatment differences were noted in the visual
quality curves (Fig. 4.1 C and D) or in any of the other parameters used to describe leaf
quality: rib blight, midnb defects, and % rotten leafarea (data not shown). Thus the
ethylene treatment resulted in a greater incidence of russet spotting without otherwise
iduencing the quality- Treatment différences in replicate 1 were observed (at P < 0.05) in
one or more of the regression coefficients for kinetic test parameters Fo, F& FL;, FI:, qs,
and NQP, and yield test parameter F{ whereas no treatment differences were noted for
90

any of the fluorescence parameters in replicate 2 (data not shown). Similar findings are
evident in plots of the fluorescence data (Fig. 4.1 E to R). It is likeiy that replicate L
differences were due to temperature effects induced by the two storage rooms, since they
were not observed in the second repticate. Therefore ethylene, whde increasing the
incidence of russet spotting in detached, whole, iceberg lettuce leaves, does not appear to
influence chlorophyll fluorescence any time during storage at 6 O C .

Table 4-2. Quality measurements and chiorophyii fluorescence measurements for which
the coefficients of linear întercept (B), hear dope (X), and quadratic curvature (X2)
possessed repiicate diirences and treatment x replicate interactions.
-- -
Linear Intercept Linear Slope Quadratic Curvature
RepIicate x Repiicate x Repiicate x
Replicate Treatment Replicate Treatment Replicate Treatment Visuai Quality r l c t NS NS NS NS NS
Fo ** NS NS NS * r(c
F * NS NS NS NS NS
FM' NS NS NS NS * **
FL! NS NS *t NS * **
L This chlorophyll fluorescence measurement was from the yield test, whereas al1 others
were corn the kinetic test-

i !
I Replicite 1 Replicate 2
1 B
t/ i 1
1 O 2 4 6 8 1 0 1 2 0 2 4 6 8 1 0 1 2 I
! S to rage Duration (d) S torage Durahon (d) l
Fig. 4.1. Progression of quality (A to D) and chiorophyll fluorescence (E to R) of
individual iceberg lemice leaves in replicates 1 and 2, held at 6 OC for 11 days, in air with
or without (A) 50 * 10 C i ~ - ~ - L ethylene. Each point represents the mean of 10 leaves
(n = 10 for quality, and 20 for fluorescence). The average SE and SD are indicated.
Treatment differences (P < 0.05) were observed for one or more coefficients of linear
intercept, linear slope, and quadratic curvature in graphs A and B. FV values (E and F) are
fiom the kinetic test,

?
Replicate 2
O 2 4 6 8 1 0 1 2 S torage Duration (d)
O 2 4 6 8 1 0 1 2 S torage Duration (d)
Fig. 4.1 Conthued. Chlorophyii fluorescence measurements (G to L) are fkom the kinetic
test. No treatment differences (P < 0.05) were observed for the coefficients o f linear
intercept, linear dope, and quadratic curvature in any of the graphs.

O 2 4 6 8 1 0 1 2 S torage Duratio n (d)
Replicate 2 1
1 I S D t
1 1 I
O 2 4 6 8 1 0 1 2 S torage Duration (d)
Fig. 4.1 Continued. Chiorophyll fluorescence measurements from the kinetic test (M to P)
and fiom the yield test (Q and R). Treatment differences (i? < 0.05) were observed for one
or more coefficients of linear intercept, linear slope, and quadratic curvature in graphs O
and Q.

CaAPTER 5
Standardized Firmness Evaluation of Iceberg Lettuce, an Instrument-Based Method
5.1 Introduction
Firmness is one of the main qualities evaluated in iceberg lettuce because it denotes
the field maturity for harvest and indicates postharvest vigor. The standard method of
evaluation is a hand compression test which radcs the b e s s on a one to five scale
(Kader et aL 1973b). Correct application of this method requires the evaluator to be
trained and exposed to the range of possible f i m e s s values; however, even these
precautions do not elirninate human error due to the subjectivity of the test. Sometimes it
is difficult for two evduators to apply subjective tests consistently, as the scale can shift
with the user. This compiicates the exchange ofdata among research groups. As well. an
evaluator who is u n f d i a r with the scale requires instruction from a person who is
already skilled at the method.
Some of these problems may be resolved by an objective f i m e s s test which is
based upon an instrument and can act as a standard. Such a test is sugested by Boume
(1982) in which a flat plate is mounted on an Instron universal testing machine and a
whole head is compressed, measuring the deformation which occurs as the applied force
increases from 0.5 to 10.5 N. Expanding upon Boume's theory, the objective of this study
was to develop an instrument-based method which could distinguish the f i m e s s of
lettuce as precisely as the hand compression method and to evaluate the practical utility of
such a method,

5.2 Materials and Methods
Iceberg lettuce (Lactzica sariva L.) cv. 'Ithaca 989' (Asgrow Seeds) was used since
this cultivar manifests a wide range of h e s s , depending on the maturit- of the head. On
July 2znd, 1998, approximately 100 heads of al1 degrees of firmness were harvested fiom
the Agriculture and Agri-Food Canada muck-soil research fm in Sainte-Clotilde (Que.)
and promptly delivered to the St-Jean-sur-Richelieu lab were they where held at 6 OC (5-6
h). The lettuce were acclimated to 20 O C (1 h) and the wrapper leaves were removed,
leaving the fim tightly-held leafattached. The lettuce were sorted into categories of
firmness based upon the hand compression method (Kader et al. 1973b), which rates
firmness on a five-point scaie: 1 is easily compressed or spongy; 2 is neither soft nor firm,
but has good head formation; 3 is firm, compact, but yields slightly to rnoderate pressure:
4 is hard, compact, and solid; and 5 is extra-hard, over-mature, and may have cracked mid
nbs. The lettuce were divided into eight categories, ranging from L .O to 4.5.
A Lloyd universal testing machine (Lloyd Instruments Ltd, Fareham England) was
equipped with a 100 N load ce11 (measuring to 0.00 1 N of precision) and linked to a
cornputer which monitored the force on the load ce11 as well as the cell's vertical position .
to the precision of 0.0 I mm. A flat plate of plexiglass (25 x 25 x 0.75 cm) was fixed to the
Ioad cell in a horizontal position and the sample rested on a base plate which was parallel
to the Load ce11 plate. When the load ce11 descended, the sample was compressed between
these two pIates.
Deformation tests were performed on the sarnple while it rested in three positions:
two side positions and one top position. On the instrument's base plate, one head was
centered with its imgitudinal (that which intersected the butt and apical menstem, and

corresponded to the direction of vertical growth in the field) pardel to the surfaces of the
compression plates. Keeping the longitudinal axÏs in this syrnmetry, the head was rotated
until the outer mid n i was at a 15 degree angle to the force (Fig- 5.1). This ensured that
the load ceii plate simultaneously contacted the outer mid n i and another portion of the
sample, to avoid crushing mid rib. Mer the first side position was tested, the sample was
rotated 90 degrees (in the same direction) to the second side position, al1 the time
maintaining the longitudinal axis parallel to the compression plates Fis. 5 -1). For the final
(top) position, the longitudinal axis was rotated 90 degrees: perpendicular to the surface
of the compression plates. Immediately prior to this final test, the butt was trimmed
slightly to ensure that the sample rested securely in position. Trimm-ng usually detached
three or four leaves but tkey were not removed corn the head.
The load ce11 plate descended upon the sample at a speed of 60 mm-min-' and once
the compression force of the initial contact reached L N, the force was re-zeroed and the
actual test began. At the maximal force, 40 N, the test was completed. A computer loged
the distance (mm) when the force was 30 N and 40 N, and calculated the deformation of
the sample over the 10-N force span-
Smtisticd Analyss- The number of samples per hand firmness category varied
from 6 to 21. Regression analysis of the data was performed using the General Linear
Models procedure of SAS (1985). Hand finnness (y) was regressed on vanous
combinations of deformation (x, in mm) in first, second, and third order multiple
regression models. From a full model which comprised of al1 the variables, the least
significant were excluded one by one, readjusting the model each time. The significance of
a variable's effect upon the model was tested at the 10 % level.
98

The number of samples required to estimate the mean f i m e s s (* 0.5 units) of a
future population of lettuce (with 95 % confidence), was calculated with a t-test which
used a postulated value for the population's standard error of the mean (s2) based upon
the reIation:
( t 2 - s 2 ) / r c d ' (5- 1)
where: r = the sample size required; d = the desired difference, 0-5 firmness units; and t =
student's t, at df= n-6 and cc = 0.05. To approxirnate the postulated s2 of a tùture
population, the individual standard errors of observations [SE(y)] fiom this experiment
(n=98) were used, applying the equation:
which approximates the true relation between SEG) and s2. The range of SE(y) values
provides a range of s2 values in which one could expect to find the s2 of a future
population.
5.3 Results and Discussion
The average deformation values of the top position (2.5 mm) were lower than
those of the side positions (3.6 mm), while there was no difference between the two side
positions. As one would expect, a better mode1 was developed when the average of the
two side positions was used rather than measurements from ody one of the side positions
(data not shown).

When the appiied force ranged tiom 30 to 40 N, a quadratic response surface best
descnbed the relationship between the hand compression measurements and the
instrument rneasurements of sample deformation (mm):
(hand) = 5-85 - 0.640-(sides) - 0.674*(top) + 0.063*(sides)~ (5 -3)
+ O. 10 ~ * ( t o ~ ) ~ - 0.075*(sides-top)
where (hand) = hand compression measurements, (sides) = averaged deformations of the
side positions, (top) = deformations of the top position (Fig. 5.2). Al1 independent
van-ables were significant at p < 0.0 1, except for (sides-top) which was significant at
p < 0.1. The model fit the data quite well, as was indicated by a reasonable coefficient of
variation (1 6.1 %) and a fairly high correlation coefficient (R2 = 0.783).
When plotted, most of the experimental values seemed to fa11 along the line where
the top position deformations + 1 equaled the averaged side position deformations
(Fig. 5.3). The model estimated with most certainty the firmness of heads which had srnaIl
differences (< 3 -0 mm) between the defonnations of the top and side positions. This \vas
because the mode1 was based chiefly upon data collected frorn this region. Two-
dimensional plots at fixed top position values showed a narrowing of the 95 % confidence
interval of the mean near values where top + 1 = sides (Fig. 5.4). Very little data was
collected in the region where h e s s was < 2 and thus the 95 % confidence intervals of
the mean broadened substantially as deformation values increased past 6 mm and firmness
estimates were less than 2. (Fig 5.4). Consequently, the model's most meaningfül
estirnates were of firmness values r 2.

To measure the utillty of the model, the number of samples required to determine
the mean fïrmness (* 0.5 units) of a group of lettuce was estimated. It was assumed that
the firmness of the population was homogenous (ifnot, any method would require a large
number of samples to produce narrow confidence intervals), and heads with fïrmness < 2
are excluded. Sample sizes of20 and 30 adequately detemiined the firmness (* 0-5 units)
of samples whose s2 were - 0.10 and O. 13, respectively (Table 5.1, Fig. 5.5). When
considering samples o f h e s s of 2 or greater, 83 % and 92 % of the observations had s2
less than - 0.10 and 0.13, respectively (Table 5.1, Fig. 5.5). Therefore, it is reasonable to
assume the fhnness of future populations of lettuce couid be correctly determined with
samples sizes of 20 or 30. Similar trends and concIusions were drawn from compression
tests in which the deformation data was collected over the 20 to 30 N force span (data not
shorvn)-
Some variation in the model was attnbuted to the protocol for the universal tester.
Lettuce sometimes had regions which were sofier or harder than the rest of the head
because of uneven leafdistribution. One compression with two hands was usually
sufficient to sample an entire head so that its inconsistencies were considered in the
evaluation of the overall firmness- However, the universal tester could only compress in
one direction. It's inability to provide an overall firmness evaluation was compensated for,
but not completely elllninated, by incorporating samples fkom several positions. Since the
hand compression method was subjective, it is not unreasonable to assume its degree of
repeatability was lower than that of the universal tester. For example, during this
expenment it was possible to compare arnong the 98 heads, and even so, the task of
dividing them into the fhnness categories was difficult because the hand compression test

was subjective. Most iikely, some heads were judged erroneously by the hand compression
test as to which category they belonged. Though these errors reduced the fitness of the
model, they oniy support the need for an objective test-
The universal tester method has both weak and strong points. The model requires
more sampling of soft heads to enhance its prediction abiiity when the firmness is c 2-
Similady, the model is less Iikely to evaluate accurately a head with large inconsistencies,
which are somethnes manifêsted as large differences between the top and side
deforrnations. Unfomtnately, the safest minimal required sample size is quite large (- 20
or 30). Though this is a consequence of the method's limitations, it has likely been
exaggerated by the inconsistency of the hand compression method to which the instrument
rnethod was compared. Another disadvantage is that one sample, consisting of three
deformation tests with the instrument, requires - 1.5 min. On the other hand. the
instrumental method eliminates most human error and has improved reproducibility. When
exchanging or reporting data, the hand compression rating scale could be expressed
relative to the scale of the instrument, and in situations of multiple evaluators or when
consistency is extremely important, this method could be applied in place of the hand
compression method. As well, this method makes self-training possible for those who are
unfamiliar with the hand compression method.
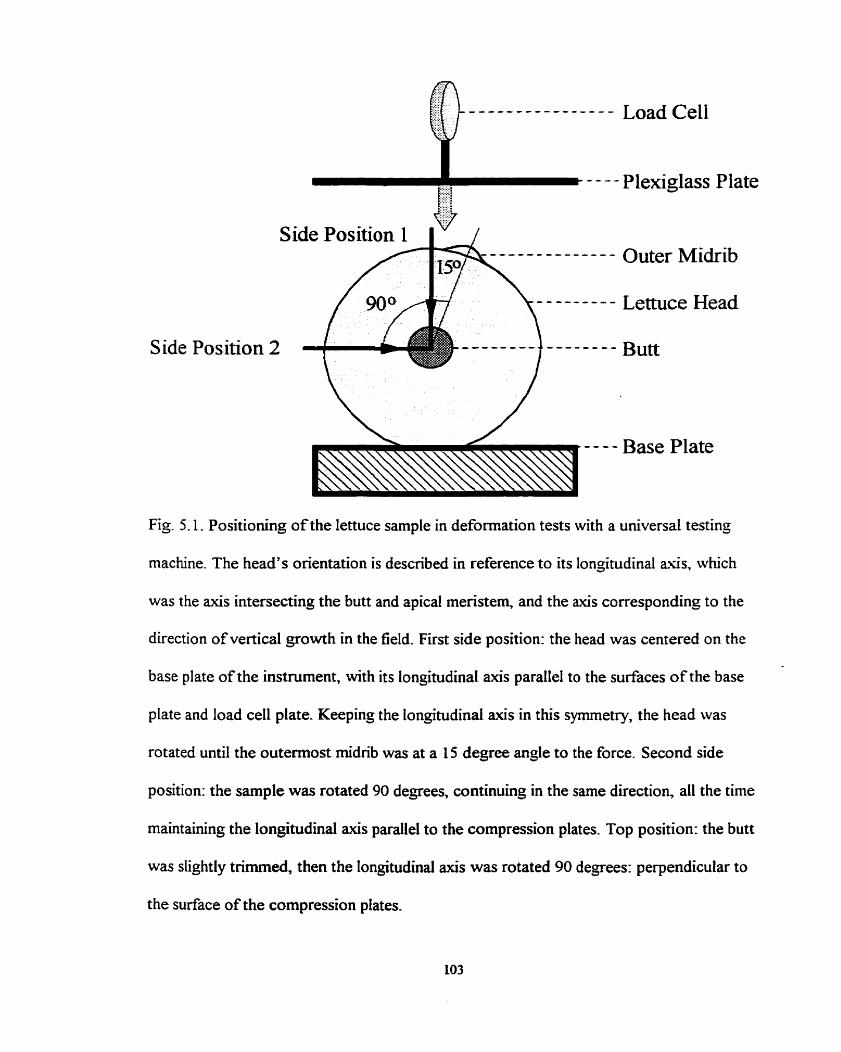
---------------- Load Ce11
- - - - Plexiglass Plate
- - - - - - - - - - - - - - Outer Midrib
--------- Lettuce Head
Side Position 2 Butt
Fig. 5.1. Positioning of the lettuce sample in deformation tests with a universal testing
machine. The head's orientation is described in reference to its longitudinal a . s . which
was the axis intersecting the butt and apical meristem, and the axis corresponding to the
direction of vertical growth in the field. First side position: the head was centered on the
base plate of the instrument, with its longitudinal axis parallel to the surfaces of the base
plate and load ce11 plate. Keeping the longitudinal axk in this symmetry, the head was
rotated until the outermost midnb was at a 15 degree angle to the force. Second side
position: the sarnple was rotated 90 degrees, continuing in the same direction, al1 the tirne
rnaintaining the longitudinal axis parallel to the compression plates. Top position: the butt
was slightly trimmed, t ben the longitudinal axis was rotated 90 degrees: perpendicular to
the surface of the compression plates.

Fig. 5.2. Three-dimensionai depiction of the quadratic response surface which best
described the relationship between the hand compression measurements and the
instrument rneasurements of sample deformation (over the force range o f 30 to 40 N), as
described by Eqn. 5.3. Ranges of firmness values are represented by rings of alternathg
shading. The region containing the data points (n = 98) is outlined by H with the
exception o f four points represented by X.
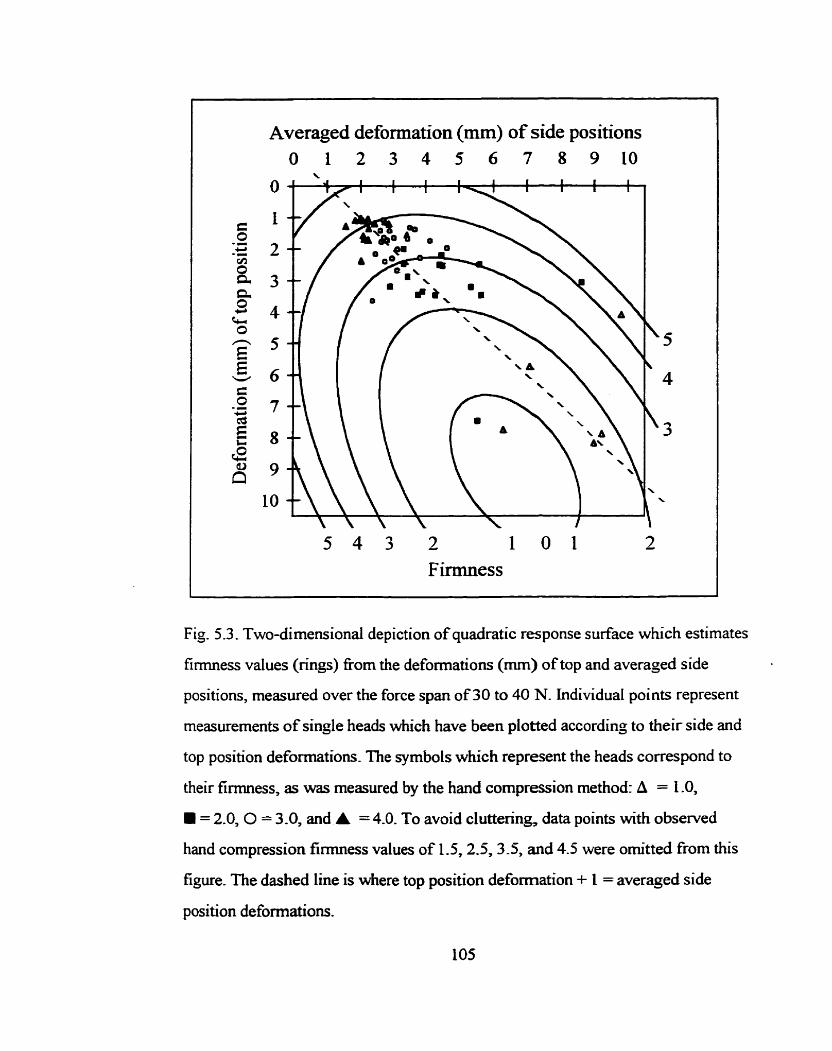
5 4 3 2 I O 1 2 Firmness
Fig. 5.3. Two-dimensional depiction of quadratic response surface which estimates
firmness values (rings) from the deformations (mm) of top and averaged side
positions, measured over the force span of 30 to 40 N. Individual points represent
rneasurements of single heads which have been plotted according to their side and
top position deforrnations. The symbols which represent the heads correspond to
their firmness, as was measured by the hand compression method: A = 1.0,
= 2.0, O = 3.0, and A = 4.0. To avoid cluttering data points with observed
hand compression firmness values of 1.5,2.5,3.5, and 4.5 were omitted from this
figure. The dashed line is where top position deformation + 1 = averaged side
position deformations.
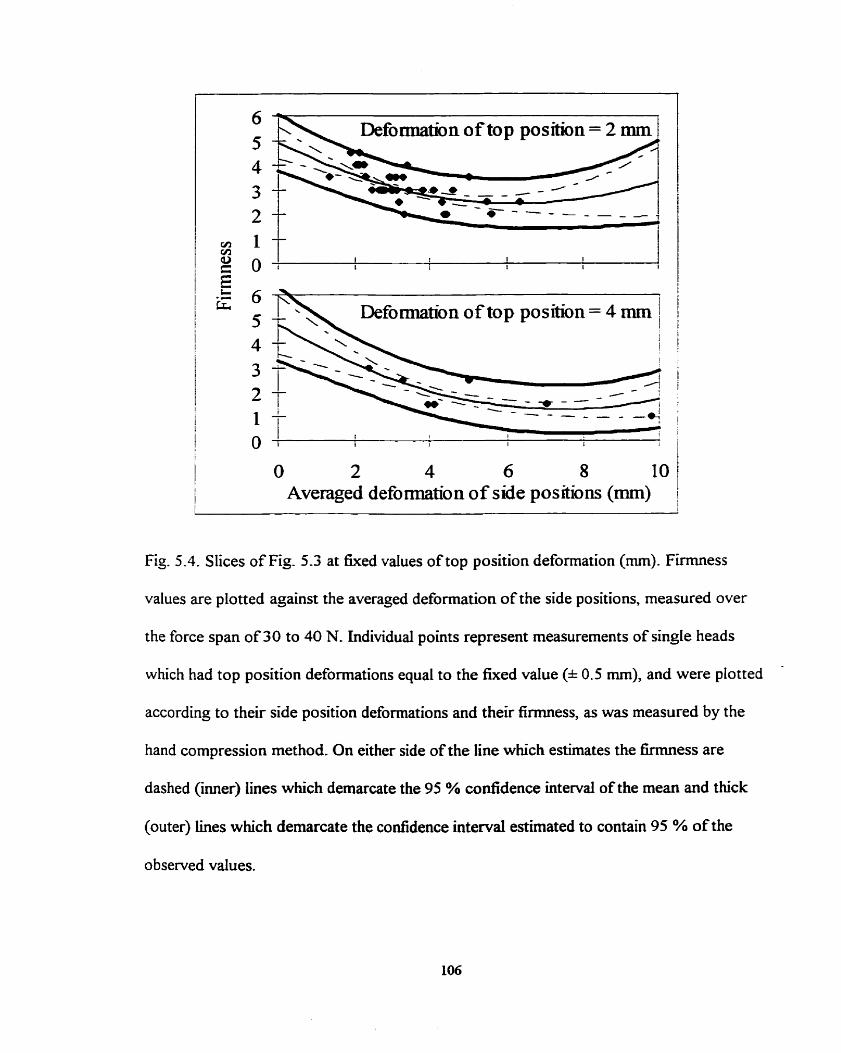
Defomiation of top posÏtïon = 4 mm 1 l I l
Averaged defomation of side positions (mm)
Fis. 5.4. Slices of Fig. 5.3 at fixed values of top position deformation (mm). Firmness
values are plotted against the averaged deformation of the side positions, measured over
the force span of 30 to 40 N. Individual points represent measurements of single heads
which had top position defonnations equal to the fked value (h 0-5 mm), and were plotted -
according to their side position deformations and their firmness, as was measured by the
hand compression method. On either side of the line which estimates the firmness are
dashed (mer) lines which demarcate the 95 % confidence interval of the mean and thick
(outer) lines which demarcate the confidence interval estimated to contain 95 % of the
observed values.

Table 5.1. The number of sarnples required to estimate the mean firmness (* O S units) of
a fùture population of lemice (with 95 % confidence), assuming finnness 22.0. The
calculation of this number was based upon a t-test which used a postulated value for the
s2. SEV)s h m this experiment (n = 98) were used to approximate the postulated s2
values. Indicated are the percentage of observations (n = 86) whose SE(i)s ap proximated
an s2 less than the one used in the t-test.
Number of samples % of observations (n = 86) which
required Postulated s2 approximated an s2 c s2 of test

-- -
Averaged defomtio n (mm) of s ide po s itio ns
O ' f l
I r o o o g l
I i D O X X X O O O ! !
I 1
I
l t 1
O O X X X X X X X X X 0 0 0 0 0
X - X - X X - x - x - X X - O O O T l '
I l 0 X X X X X X X 0 0 0 0 I ' I
I l o o x x x x x x o o o o i O D X X X X X X O O O
a o x x x x x a o o 1 - s2 < 0.105, n=20
~ D X - X X - X - I
Ï 0 0 X x X 0 0 0 I / x s2 ~0.134, n=30 o o o x o o o O O D O O O , i
f
I 7 s2 (0.162, n=40 I
Fig. 5.5. Distribution of postulated s2 values used to calculate the number of samples
required to estimate the mean firmness (* 0.5 units) of a future population of lettuce (with
95 % confidence), assurning firmness 22.0 (see Table 5.1). The number of samples
required (n) are displayed alongside their corresponding s2 values, where: n = 20 for
s2 < 0.105; n = 30 for s2 < 0.134; and n = 40 for s2 < 0.162. represents the s2 values
which were approximated corn the experimentai SE@)s of observations with
firmness 22.0 (n = 86).
CHAPTER 6
Concluding Discussion
This thesis documents two unsuccessfül attempts to use chlorophyll fluorescence
as an early indicator of stress in iceberg lettuce, particularly before stress symptoms
become visible. The hypothesis of the first study was that similar stress factors affect the
storage potential and photosynthetic apparatus of iceberg lettuce, thus chlorophyli
fluorescence measurements at harvest could predict the sheiGlife. It was assumed that
cultivars were similar in most respects but that they ditfeed in their tolerances and
responses to stress. Thus two cultivars, grown under the same conditions, were expected
to experience dEerent levels of stress which could be seen early in chlorophyll
fluorescence and then confhned in storage quaiity. The hypothesis of the second
experiment was that ethylene-induced stress in iceberg lettuce causes changes at the
cellular level which rnay affect photosynthesis, thus enabling chlorophyll fluorescence to
detect the stress before the development of visible symptoms.
The cultivar experiment had some inherent flaws in its design. It was assumed that -
cultivars dBered in their tolerance to stress conditions but that they were similar in most
other respects. In hindsight this assumption may have been invalid on two counts. (1) The
inherent p hotosynt hetic efficiencies of the cultivars appeared to be different, t hus
explainhg why 'Salinas' was invariably more efficient than 'lthaca'. An alternative
explanation is that the photosynthetic apparatus of 'Salinas' was less stressed in each of
the four harvests. Unfominately the correct explanation cannot be determined because
there was no quantification of the actual level of photosynthetic stress. (2) The
relationship between photosynthesis and storage potential may not have been the same for
both cultivars. For example, a stress factor which reduces photosynthesis by 10 % and
storage potential by 30 % ( m g a ratio of 13) should elicit a simiiar ratio in another
cultivar. Therefore, the same stress acting upon another cultivar would not reduce
photosynthesis by 10 % and storage potential by 15 % (ratio = 2 3 , but it Mght reduce
photosynthesis by 5 % and storage potentiai by 15 % (ratio = 1 :3). It is possible that any
&en stress factor may affect photosynthesis and storage potential at different ratios for
different cultivars. This means that a 10 % hi& temperature-induced reduction in
photosynthesis of both cultivars could translate into a 25 % reduction in storage potential
for one but a 50 % reduction for the other. This unknown factor makes companson
between cultivars tricb.
A third complication is the reason the previously mentioned problems have
remained a mystery. It was assumed that different cultivars would be tolerant to different
levels of stress. The stress affecting postharvest quality was quantified by following the
decline in quality after harvest. However, it was not possible to quanti@ the stress
affecting the photosynthetic apparatus because there was no standard measure of
chlorophyll fluorescence fiom the photosystems of 'unstressed' lettuce. The first problem
could have been solved by knowing how the chlorophyll fluorescence of 'unstressed'
photosystems compared between the cultivars. Additionaüy, a standard value of
chlorophyil fluorescence fiom 'unstressed' photosystems for each cultivar couid have shed
light upon the second problem, making it possible to determine the ratios in which stresses
affect the photosynthesis and storage potential.

Variation in inherent photosynthetic efficiencies of cultivars was a factor which
was not anticipated fkom the onset of this experünent. Due to the previously mentioned
limitations it is impossible to atnrm with complete certahty; however, the evidence
suggests that fairly large differences in inherent photosynthetic efficiencies existed between
the cultivars. To avoid the masking of stress-related effects by the uiherent photosynthetic
efficiencies of cultivars, an experiment involving oniy one cultivar, several treatments, and
a control (perhaps in a greenhouse) would be an ïmproved design.
The design of the ethylene-stress study was very good, except for the separation of
the ethylene and non-ethylene chambers in the first replicate. This proves the importance
of attention to seemlligly minor details, since a difference of - 1 O C was enough to taint the
results.
In several other studies chlorophyll fluorescence has successfiilly acted as an early
indicator of stress, oflen before the development of symptoms. For example, van Kooten
et ai- (1992) found decreases in Fv/Fjr of cucumber h i t (C~~armÏs scrtivrrs L.) stored at
temperatures s 7 OC for two weeks, while FLI/Fxl was invariable for those stored at higher
temperatures. Symptoms of chilling injury developed at temperatures 5 7 OC but not at
those 2 LO OC. Changes in Fv&~ were apparent before the development of chilling
symptoms, making this parameter an early predictor of chilling injury.
Chlorophyll fluorescence techniques were able to idente low O2 stress in stored
apple bit, pnor to the development of off-flavours and s h discoloration, purpling and
bronzing, which are associated with low Oz injury. DeEU et al- (1995) found Fv,
(Fp - Ft) I Fp x 100 ftom a non-modulated fluororneter, decreased from 1 1.5 to 7. L &er
5 d of exposure to low 0 2 (1-1.5 kPa) storage- Apple fniit stressed with high CO2 (20
111

kPa) or low O2 (1-2 kPa) were found to have lower FdFM and higher T!4 compared to
apples in standard CA regimes (DeEll et al. 1998).
The reason chiorophyll fluorescence cm act as an early indicator of stress may
relate largely to the nature and htensity of the stress. Chilling injury symptoms are
attributed to membrane leakage caused by insufficïent scavenging of radicals that form
during or d e r the cold treatment (Hariyadi and Parkin 199 1). Changes in the thylakoid
membranes are thought to reduce the electron transfer efficiency of PSII, which is
reflected by reduced FV/Fhf (Shen et nL 1990). Initial decreases in F ~ F M dunng storage at
chilling temperatures is caused by a reduction in FxfT which may indicate nonfundional
oxygen evolving complexes (Shen et aL 1990). van Kooten et aL (1992) reponed that
holding cucumbers for a subsequent 6 d at 20 O C caused further decreases in F~dFxi.
resulting from an increase in Fo, which rnay indicate dissociation of the light harvesting
complexes and the reaction centers. When products are held at chilling temperatures free
radical damage of the thylakoid membranes will directly influence chlorophyll fluorescence
measurements but the symptoms of chilling injury may actually be due to damage of other
membranes,
Low Oz andor hîgh CO2 stress leads to the buildup of acetaldehyde and ethanol,
toxic metabolites which disrupt cellular organization (e-g. ethanol may act upon cellular
membranes) (Kays 1991). Clearly, a major effect of chiilhg and atmospheric stresses is the
generation of toxic compounds which darnage many cellular components. The capability
of these stresses to cause universal cellular damage, as opposed to damaging or eliciting a
response from an isolated ceilular component, will greatly influence the potential for their
detection by chlorophyii fluorescence.

Snvastava and Strasser's (1996) conditions of light intensity, water deficit, and
high temperature, which induced changes in chlorophyll fluorescence, were more extreme
than those ofour cultivar study. Possibly, chlorophyll fluorescence was unable to detect
differences in levels of stress for this reason. Conditions which induce chilling and
atmospheric injury are quite severe and treatments are oeen maintained for many days.
Thus future experimentation may provide more infiormation if varying degrees of stresses,
even extremes of those encountered in a natural setting, were incorporated-
The ethylene stress of the second experiment is known to induce a set of specific
responses. Particularly increased lignin content, with lignincation localized in the walls of
cells with russet spotting (Ke and Saltveit 1988) and an increase in phenylalanine
arnmonia-lyase activity, leading to the generation of phenolic compounds which can form
brown polymerized compounds upon oxidation peiser et al. 1998). As well, ethylene is
known to accelerate the process of senescence by increasing respiration, altenng the
activity of a number of enzymes, increasing membrane permeability, altering cellular
compartmentalization, acceierating the degradation of chlorop hyll. and altering auxin
transport and/or metabolism (Kays 199 1). The et hylene treatment induced russet spo ttinj
without othenvise atfecting the quality and senescence process. However, the evaluation
of leafquality was visual and subjective, and no gas exchange measurements of respiration
were conducted. It is possible that ethylene siightly accelerated senescence but this
rernained undetected by visual evaluations as weU as chlorophyll fluorescence evaluations.
Most likely chlorophyll fluorescence did not detect the ethylene-induced stress because it
did not act prùnariiy upon the photosystems. Furthemore, any ethylene effects on the
photosynthetic apparatus, such as increased thylakoid membrane permeability and

accelerated chlorophyii degradation, must have been minor-
Chapter 2 outlines an experiment which quantifies the variation in chlorophyll
fluorescence. It was concluded that experimental designs which measure fluorescence at
one location on 10 heads could detect a 20 % difference in the means of two populations
with s four replicates for ali fluorescence parameters, except for qp and mpsn (Kinetic
Test) which could only detect a 40 %. This recommendation was used in the first study
and the variation of the chlorophyll fluorescence measurements was simiiar to that of the
parameters used to evaluate quality (compare Fig. 3.1 with Fig. 3 -2 to 3 -6). Although
increased sampling was able to overcome the variation this is not a practical solution to
the problem as it greatly increases the sampling the . Since the greatest source of variation
is attributed to locations on the same leaf, a practical solution is for each sample to
encompass a larger leafsurface area. In such scenarïos, probes could determine the
average chlorophyll fluorescence from an entire le& The advantage of fluorescence
imaging (Lichtenthaler et al. 1996; Bro et al. 1996) is that it will provide a map of the
fluorescence corn individual areas of a IeaE Sometimes stresses are exhibited by
fluorescence gradients from the margin to the center of the leaf(Lang et al. 1996).
The final study uivestigated the utility of an instrument-based method of firmness
evaluation in lettuce. Though a strong relationship was developed between hand firmness
measurements and the deformation test of the instrument, there were some serious
drawbacks to this method. The biggest disadvantage is the tirne required to accurately
evaluate a population of heads. One sample, consisting of three deformation tests with the
instrument, requires - 1.5 min, and safest minimal required sample size is quite large (- 20
or 30). Unfortunately this experiment was never replicated, and a series of tests may

actuaily prove the safest minimal sample size to be smailer- As well there was some
ditficulty in the initial division of the lettuce into the hand firmness categories. If this part
of the process had been carried out by a more expert and consistent evaluator, there may
have been an improvement in the fitness of the model- On the other hand, the instrumentai
method eliminates most human error, haî improved reproducibility, and may be used to
standardize the reporting of firmness data.
In summary, chlorophyli fluorescence measured at harvest was not able to predict
the storage potential of iceberg lettuce. This was most Likely because the preharvest
stresses which infiuenced storage potential exhibited only dight effects on photosynthesis
and chlorophyll fluorescence, and inherent cultivar differences in photosynthetic capacity
appeared to almost completely mask the effects of stress on chiorophyll fluorescence.
Chlorophyll fluorescence did not detect ethylene-induced stress of lettuce leaves held at
6 O C for 11 d, even when stress syrnptoms (msset spotting) were visible. This suggests
that ethylene induces russet spotting by influencing other cellular organelles primarily,
rather than the chloroplasts. The instrument-based method of iceberg lemice firmness
evaluation was comparable to the traditional hand compression method, thus it may be
used to standardize the reporting of firmness data, since it eliminates most human error
and has improved reproducibiiity.

LITERATURE CLTED
Asada, K. 1 992. Ascorbate peroxidase- hydrogen peroxidase-scavenging enzyme in plant S.
Physiol. Plant- 85: 235-241 -
Babani, F., H. K- Lichtenthaler, and P. Richter. 1996- Changes of chlorophyll fluorescence signatures during greening of etiolated barley seedlings as measured with the CCD-OMA fluororneter. J. Plant Physiol. 148: 471-477.
Beverly, R.B., I. G. Latimer, and D. A Sminle. 1993. Preharvest physiologicai and cultural effects on postharvest quality. p. 73-98. In: R L. Shewfelt and S. E. Pmssia (eds.). Postharvest handlmg: A systems approach. Academic, NewYork-
Bilger, W., and 0. Bjorkman- 1990- Role of the xanthophyll cycle in photoprotection elucidated by measurements of light-induced absorbante changes, fluorescence and p hotosynthesis in leaves of Hedera canariemis. Photosynthesis Research 25: 173 - 18 5.
Bjorkman, O., and B. Demming. 1987. Photon yield of Oz evolution and chlorophyll fluorescence characteristics at 77K among vascular plants of diverse origins. Planta 170: 489-504-
Bourne, MC. 1982- Practice of objective texture measurement, p. 118-198- In: M C Bourne (ed.)- Food Texture and Viscosity: Concept and Measurement Academic Press, Toronto.
Brecht, P. E., A. A. Kader, and L. L. Moms. 1973. The effect of composition ofthe atmosphere and duration of exposure on brown stain of lettuce. I. Amer. Soc. Hot. Sci. 98: 536-538.
Bro, E., S. Meyer, and B. Genty. 1996. Heterogeneity of leaf CO2 assimilation during photosynthetic induction. Plant Ce11 and Environ. 19: 1349-1358.
Büchel, C., and C. Wilhelm. 1993. In vivo analysis of slow chlorophyll fluorescence induction kinetics in algae: progress, problems and perspectives. Photochem. Photobiol. 58: 137-148.
Campbell, W. J., and W. L. Ogren 1990. A novel role for light in the activation of nbulose bisphosphate carboxylaseloxygenase. Plant Physiol. 92: 1 10- 1 15.
Cantwell, M., and T. Suslow. 1997. Lettuce produce facts, chrisphead or iceberg, recommendations for maintainhg postharvest quality. University of California Davis, Perishables Handling Quarterly 92: 25-26.
Cevik, B., C . Kirda, and G. Ding. 198 1. Some effect of irrigation systems on yield and quality of tomato grown in plastic covered greenhouse in the south of Turkey, Acta Hort. t 19: 333-342,
Cochran, W. G., and G. M. Cox- 1992. Experirnental Designs, 2nd edition (pp 17-20). John Wiley & Sons, Inc. Toronto. pp 6 11.
DeEll, J. R, R K. Prange, and D. P. Mun: 1995. Chlorophyll fluorescence as a potential indicator of controiled-atmosphere disorders in 'Marshall' McIntosh apples. HortScience 30: 1084-1085.
DeEII. J. R, 0. van Kooten, R K. Prange, and D. P. Muni 1999. Applications of chlorophyll fluorescence techniques in postharvest physiology. Hort. Rev. 23: 69407.
Downton, W. J. S., B. R Loveys, and W. I. R Grant. 1988. Stomatal closure tùlly accounts for the inhibition of photosynthesis by abscisic acid. New Phytol. 108: 263-266.
Foyer, CH., and B. Halliwell. 1976. The presence of glutathione reductase in chloroplasts: a role in ascorbic acid metabolism Planta 133 : 21-25
Genty, B., J.-M. Bnantais, and N. R. Baker. 1989. The relationship between the quantum yield of photosynthetic electron transport and quenching of chlorophyll fluorescence. Biochim. Biophys. Acta. 990: 87-92.
Govindjee. 1995. Sucty-three years since Kautsky: chlorop hyll a fluorescence. Aun. S. Plant Physiol. 22: 13 1-60.
Hankamer B., J. Barber, and E. J. Boekema 1997. Structure and membrane organization of photosystern II in green plants. AMU. Rev. Plant Physiol. Plant Mol. Biol. 48: 64 1-7 1.
Hanyadi, P. and K. L. Parkin. 1991. Chilling-induced oxidative stress in cumbers fruits Posthawest Biol, Technol, 1:33-45
Hams, D. C. 1995. Applications of Spectrophotometry, chapter 19, p. 523-557. In: D. C . Harris (ed.) Quantitative Chernical Analysis, 4* edition. WH. Freeman and Company, New York,
Honon, P., A V. Ruban, and R G. Walters. 1996. Regdation of light harvestïng in green plants. AMU. Rev. Plant Physiol. Plant Mol. Biol. 47: 655-84.
Hyodo, H., H. Kuroda, and S. F. Yang. 1978. Induction of phenylaianine ammonia-lyase and increase in phenolics in lettuce leaves in relation to the development of russet spotting caused by ethylene. Plant Physiol. 2: 3 1-3 5 .
Ilker Y., k k Kader, R, mer, and L. L- Morris. 1977- Anatomy of lettuce tissue afZected by three physiological disorders. J. Amer. Soc. Hort. Sci. 102: 426428.
Isenberg, F. M. R 1979. Controlled atmosphere storage of vegetables. Hort. Rev. 1: 338- 379,
Janoudi. AX-, I.E. Widders, and J. A Flore. 1993- Water deficits and environmental factors affect photosythesis in leaves of cucumber- (Cucurnis sativus.) J. Amer. Soc. Hort- Sci. 118: 366-370.
Johnson I. R , J. R McGuinn, and J. W. Rushuig. 1989. Muence of preharvest factors on postharvest quality of prepackaged fresh market spinach Appl. Ag. Res. 4: 14 1 - 143.
Kader, A A 1987. Influence of preharvest and postharvest environment on nutritional composition of fiuits and vegetables. Proc. 1st Int. Syrnp. Hort. & Human Health. ASHS Syrnp. Ser. 1:18-32.
Kader, A. A, P. E, Brecht, R. Woodruq and L, L- Monis, 1973a- Influence of carbon monoxide, carbon dioxide, and oxygen levels on brown stain, respiration rate, and visual quality of lettuce. J- Amer- Soc- Hort. Sci. 98: 485488.
Kader, A A., W. J. Lipton, and L. L. Morris. 1973b. Systems for scoring quality of harvested lettuce- HortScience 8: 408-409.
Kader, A. A, J. M. Lyons, and L. L. Moms. 1974. Postharvest responses of vegetables to preharvest field temperatures. HortScience 9: 523-529.
Kautsky, H., and A. Hirsch 193 1. Neue Versuche m r Kohlensaureassimilation~ Natunvissenschaften. 19, 964.
Kays, S. E. 199 1. Stress in harvested products. In: S. E. Kays (ed.). Postharvest Physiology of perishable plant products. Van Nostrand Reinhold. New York.
Ke , D., and M. E. Saltveit. 1988. Plant hormone interaction and phenolic metabolism in the regulation of russet spotting in iceberg lettuce. Plant Physiol. 88: 1 136- 1 140.
Ke , D., and M. E. Saltveit. 1986. Effects of calcium and auxin on nsset spotting and p henylalanine ammonia-lyase activity in iceberg lemice. Hort Science 2 1 : 1 169- 1 1 7 1. Kirschbaum, M.U.F., and R W. Pearcy. 1988. Gas exchange analysis of the relative importance of stomatal and biochemical factors in photosynthetic induction in Alocasin macromhiza. Plant Physiol. 86: 782-785.
Krause, G. H-, and E. Weis. 199 1. Chiorophyll fluorescence and photosynthesis: the bzsics. Annu. Rev. Plant Physiol. Plant Mol. Biol. 42: 3 13-349.
Krause, G. K, and E. Weis. 1988. The photosynthetic apparatus and chlorophyll fluorescence: an introduction, p. 3-1 1. In: H. K. Lichtenhaler (ed.), Applications of chlorophylï fluorescence in photosynthesis research, stress physiology, hydrobiology and remote sensing. Kluwer Academic, Dordrecht, The Nethedands.
Lang, M., H. K. Lichtenthater, ha- Sowinska, F. Heisel, and J. A Miehé- 1996- Fluorescence imaging of water and temperature stress in plant leaves. J. Plant Physiol. 148: 613-621.
Lee, Y., L. R Howard, and B- VillaLon. Flavonoids and antioxidant activity of fiesh pepper (Capsiczïm m~rncznn) cultivars. J. Food Sci. 60: 473-476.
Lichtenthaler, H. K. 1996. Vegetation stress: an introduction to the stress concept in plants. J. Plant Physiol. 148: 4-14.
Lichtenhaler, H. K. 1988. In vivo chlorophyll fluorescence as a tool for stress detection in plants, p. 129- 142. ln: EL K. Lichtenhaler (ed.), Applications of chlorophyll fluorescence in photosynthesis research, stress physiology, hydrobiology and remote sensing. Kluwer Academic, Dordrecht, The Netherlands.
Lichtenthaler, H. K., M. Lang, M. Sowinska, F. Heisel, and J. A Miehé. 1996. Detection of vegetation stress via a new high resolution fluorescence imaging system. J. Plant PhysioI. 148: 599-612.
Lichtenthaler, H. K., and U. Rinderle. 1988. The role of cldorophyl fluorescence in the detection of stress conditions in plants. CRC Cntical Rev. Anal- Chem. 19 (Suppl. 0. 29- 85.
Lipton. W. J. 196 1. Anatomical observations on msset spotting and pink nb of lettuce. J. Amer. Soc. Hort. Sci. 78: 367-374,
Lipton, W. J., and E- J. Ryder. 1989. Lettuce. In: N. H. M- Askin (ed.). Quality and Preservation of Vegetables. CRC Press.
Lipton W. J., J. K. Stewart, and T. W. Whitaker. 1972. An iliustrated guide to the identification of some market disorders of head lettuce. USDA Marketing Research Report No. 950.
Lorenz, O. A., and D. N. Maynard. 1988. Knott's handbook for vegetable growers, 3* edition. John Wiley & Sons, Inc. Toronto. 456 pp.
McKersie, B. D., and Y, Y. Leshem, 1994. Oxidative stress. In B. D. McKersie and Y- Y- Leshem (eds) Stress and Stress Coping in Cultivated Plants. Kulwer Academic Pubiishers, Boston.

Mir, N., M- Wendoe R Pereq and R M Beaudry. 1997. Vanable fluorescence quenching in apple storage is a function ofoz. Proc. Seventh Int. Controlled Atmosphere Res. Conference 2: 162467,
Nagy, S. and W. F. Wardowski. 1988. Effects of agricultural practices handling and storage on nuits. p. 73-100. In: E. Karmas and R S. Harris (eds.). Nutritional evaluation of food processing. Van Nostrand Reinhold New York.
Peirce, L. C. 1987. Vegetables Characteristics Production, and Marketing. John Wiley & Sons, Inc. Toronto. 432 pp.
Peiser, G., G. Liipez-avez, M. CantweL1, and M- E. Saltveit. 1998. Phenylalanine ammonia-lyase inhibit ors do not prevent russet spotting lesion development in Iettuce midribs. J- Amer, Soc- Hort. Sci. 123 : 687-69 1 -
Perrin. P. W., and M. M. Gaye. 1986. Effects of simulated retail display and overnight storage treatments on quality maintenance in fiesh broccoti. J. Food Sci. 5 1 : 146-149.
Renger, G., and U. Schreiber. 1986. Practicai applications of fluorornetric methods to algae and higher plant research, p. 587-6 19. In: GoWidjee, J. Amesz, and D. Fork (eds.), Light ernission by plants and bacteria. Academïc Press. Orlando, K.
Rood, P. 1956. Relation of ethylene and postharvest temperature to brown spot of Iettuce. Proc- Amer, Soc. Hort. Sci, 68: 296-303,
Salisbury, F. B., and C . W. Ross. 1992. Chapter 10, photosynthesis: chforoplasts and light. p 207-224. In: F. B. Salisbury, and C. W. Ross (eds.) Plant Physiology, Wadsworth Publishing Company, Belmont California. hc.
SAS Institute. 1985. SAS user's guide: statistics. Version 5. Cary, N.C.
Sassenrath-Cole G. F., and R W. Pearcy 1994. Regdation ofphotosynthetic induction state by the magnitude and duration of low light exposure. Plant Physiol. 1051 1 1 L 5- 1 123 -
Schouten, R. E., E. C. Otma, 0, van Kooten, and L. M. M. Tijskens. 1997- Keeping quality of cucumber fiuits predicted by bioiogical age. Postharvest Biol. Technol. 12: 175- 181.
Schreiber, U., and W. Bilger. 1987. Rapid assessrnent of stress effects on plant leaves by chlorophyll fluorescence measurements p. 27-53. In: J. D. Tenhunen, F. M. Catarina, O. L. Lange and W. C . Oechel (eds.), Plant response to stress; fiinctional analysis in Mediterranean ecosystems. Nato AS1 Series, Vol. G1 S. Springer-Verlag, Berlin, Germany.

Schreiber, U., U. Schliwa, and W. Bilger. 1986. Continuous recording of photochernical and non-photochemical chiorophyU fluorescence quenchg with a new type of modulation fluororneter. Photosyn. Res. 105 1-62.
Schweiger, J., M. Lang, and H- K. Lichtenthaler. 1996. Differences in fluorescence excitation spectra of leaves between stressed and non-stressed plants. J. Plant Physiol. 148: 536-547.
Seaton, G. G., and D. D. Walker 1990. ChiorophyU fluorescence as a measure of photosynthetic carbon metabolism. Proc. Roy. Soc. Lond. Ser. B 242: 29-35.
Shen, J. R., 1. Terashima and S, Katoh. 1990. Cause for dark chilling-induced inactivation of photosynthetic oxygen-evolving system in cucumber leaves- Plant Physiol. 93: 1354- 1357,
Shewfelt, R. L. 1990. Sources of variation in the nutrient content of agriculturai comrnodities fkom the f m to the consumer- J. Food, Qual- 13: 37-54.
Smillie, R M. and S. E. Hetherington. 1983. Stress tolerance and stress-induced injury in crop plants measured by chlorophyil fluorescence in vivo. Chilling, freezing, ice cover, heat and high light. Plant Physiol. 72: 1043-1050.
Smillie, R. M., S. E. Hetherington, R. Nott, G. R Chaplin, and N. L. Wade. 1987. Applications of chlorophyll fluorescence to the postharvest physiology and storage of mango and banana h i t and the chilling tolerance of mango cultivars. Asean Food 1. 3 : 55- 59-
Snedecor, G- W. 1980. Statistical methods. 239-240- QA 276.12 S59
Snel, J., O. van Kooten, and L. van Hove. 199 1. Assessrnent of stress in plants by andysis of p ho tosynthetic performance. Trends Anal. Chem. 10: 26-30.
Solomos, T. 1983. Respiration and energy metabolism in senescing plant tissues, p. 64-98. In: M. Lieberman (ed.). Post-harvest physiology and crop preservation. Plenum, New York.
Srivastava, A., and R J. Strasser. 1996. Stress and stress management of land plants during a regular day. Plant Physiol. 148: 445455.
Steward, J.K., M.J. Ceponis, and L. Beraha 1970. Modified-atmosphere effects on the market quality of lemice shipped by rail. USDA Marketing Research Report 863, 10 p.
Swiader, J. M., G. W. Ware, and J. P. McColIum. 1992. Producing vegetable crops. Interstate Publishers, Inc., Dande IL. 626 pp.

Tijskens, L- M- M-, E- C- Otma and 0- van Kooten- 1994- Photosystem II quantum yield as a measure of radical scavengers in chilhg injury in cucumber bits and beU peppers. A static, dynamic and statistical model- Planta 194:478-486.
Toivonen, P. M. k 1992- Chorophyil fluorescence as a nondestructive indicator of fieshness in harvested broccoli- HortScience 27: 10 14-10 15,
van Grondelle, R, J. P. Dekker, T. Gillbro, and V. Sundstrom. 1994. Energy-transfer and trapping in photosynthesis- Biochim Biophys. Acta 1 187: 1-65.
van Kooten, O., R E. Schouten and L. M. M. Tijskens. 1997. Predicting shelf-life of cucurnbers (Cunmris sarivus L-) by measuring color and photosynthesis. Proc. of the International Conference on Sensors for Non-destructive Testing: Measuring the Quality of Fresh Fruits and Vegetables, pp 45-55.
van Kooten, O., and J. F. H- Snel. 1990- The use of chlorophyll fluorescence nomenclature in plant stress physiology. Photosyn. Res. 25 r 147- 150. .
Vemotte, C., and k L. Etienne, and J. M. Briantais 1979. Quenching of the system II chlorophyll fluorescence by the plastoquinone pool. Biochirn. Biophys. Acta. 545: 5 19- 527.
Weston, L. A- and M- M. Barth- 1997- Preharvest factors af3ecting postharvest quality of vegetables- HortScience 32: 8 12-8 16-