Evaluation of Portable Non-Intrusive Traffic Detection System
58
2005-37 Final Report Evaluation of Portable Non-Intrusive Traffic Detection System
Transcript of Evaluation of Portable Non-Intrusive Traffic Detection System

2005-37Final Report
Evaluation of Portable Non-Intrusive Traffic Detection System

Technical Report Documentation Page 1. Report No. 2. 3. Recipients Accession No. MN-RC-2005-37 4. Title and Subtitle 5. Report Date
September 2005 6.
Evaluation of Portable Non-Intrusive Traffic Detection System
7. Author(s) 8. Performing Organization Report No. Jerry Kotzenmacher, Erik Minge, Bingwen Hao 9. Performing Organization Name and Address 10. Project/Task/Work Unit No.
11. Contract (C) or Grant (G) No.
SRF Consulting Group Inc. One Carlson Parkway N., Suite 150 Minneapolis, MN 55447 (c) 82139 (wo) 5
12. Sponsoring Organization Name and Address 13. Type of Report and Period Covered
Final Report 14. Sponsoring Agency Code
Minnesota Department of Transportation Research Services Section 395 John Ireland Boulevard Mail Stop 330 St. Paul, Minnesota 55155
15. Supplementary Notes http://www.lrrb.org/PDF/200537.pdf 16. Abstract (Limit: 200 words) Traditional traffic data-collection methods, such as inductive loops and road tube counters, require intrusion into the roadway to install. This creates traffic interruptions and safety concerns as personnel are exposed to traffic during installation. This project developed an accurate, simple, cost-effective, portable and safe method of collecting traffic. The “Portable Non-Intrusive Traffic Detection System” (PNITDS) provides an alternative to conventional methods by allowing agencies to collect data in high-traffic locations without compromising traffic flow or personnel safety. The Minnesota Department of Transportation (Mn/DOT) is the lead state in conducting the PNITDS evaluation test. The project is supported by 16 other participating state DOTs through a pooled-fund effort. The purpose of this project is to provide data-collection practitioners with a cost-effective PNITDS system design. The project fabricated and field-tested a prototype system. This system was then demonstrated to participating pooled fund states for onsite training. The selected design consists of a battery-powered, pole-mounted system that serves as a platform for mounting side-fired non-intrusive traffic sensors. Three sensors were evaluated: the RTMS by EIS, the SAS-1 by SmarTek, and the SmartSensor by Wavetronix. Field-test results were obtained for volume, speed and length-based vehicle classification under a variety of mounting configurations. The project also examined the ease of system setup, system reliability and flexibility. An additional test was conducted to assess a newly developed sensor, The Infra-Red Traffic Logger (TRITL), for its ability to collect axle-based vehicle classification data. Test method and results are included in the project’s final report.
17. Document Analysis/Descriptors 18. Availability Statement Traffic Detector
Detection Non-intrusive Portable
No restrictions. Document available from: National Technical Information Services, Springfield, Virginia 22161
19. Security Class (this report) 20. Security Class (this page) 21. No. of Pages 22. Price Unclassified Unclassified 58

Evaluation of Portable Non-Intrusive Traffic Detection System
Final Report
Prepared by:
Jerry Kotzenmacher MN/DOT - Office of Traffic, Security & Operations
Erik D. Minge, P.E. Bingwen Hao, P.E.
SRF Consulting Group, Inc.
September 2005
Published by:
Minnesota Department of Transportation Research Services Section
395 John Ireland Boulevard, MS 330 St. Paul, Minnesota 55155-1899
This report represents the results of research conducted by the authors and does not necessarily represent the views or policies of the Minnesota Department of Transportation and/or the Center for Transportation Studies. This report does not contain a standard or specified technique. The authors and the Minnesota Department of Transportation and/or Center for Transportation Studies do not endorse products or manufacturers. Trade or manufacturers’ names appear herein solely because they are considered essential to this report.

TABLE OF CONTENTS Chapter 1 Introduction......................................................................................................1 1.1 Background...........................................................................................................1 1.2 Project Team Description.....................................................................................2 1.3 Goals and Objectives............................................................................................2 1.4 Report Organization..............................................................................................3 Chapter 2 Existing PNITDS Systems...............................................................................4 Chapter 3 PNITDS System Description...........................................................................7 3.1 Attachable Pole-Mounted System........................................................................7 3.2 Non-Intrusive Traffic Sensors ..............................................................................8 Chapter 4 PNITDS Test Site............................................................................................9 Chapter 5 Test Methodology..........................................................................................11 5.1 Sensor Performance............................................................................................11 5.1.1 Traffic Parameters...............................................................................................11 5.1.2 Baseline Data......................................................................................................11 5.1.3 Performance Measurements................................................................................12 5.1.4 Testing Conditions..............................................................................................13 5.2 System Deployment............................................................................................14 Chapter 6 Test Results....................................................................................................15 6.1 Sensor Performance............................................................................................15 6.1.1 Eight-Lane Freeway............................................................................................15 6.1.2 Four-Lane Freeway.............................................................................................18 6.1.3 Four-Lane Arterial..............................................................................................19 6.1.4 Two-lane Roadway with a Side Wall.................................................................20 6.1.5 Unparallel Lanes at an Exit Ramp......................................................................21 6.1.6 Narrow Street without Center Striping...............................................................22 6.2 System Assessment.............................................................................................23 6.2.1 System Installation..............................................................................................23 6.2.2 Improvement in System Design..........................................................................24 6.2.3 System Maintenance...........................................................................................26 6.2.4 System Cost........................................................................................................26 Chapter 7 Trailer Platform PNITDS...............................................................................27 Chapter 8 TIRTL Test....................................................................................................29 8.1 Sensor Description..............................................................................................29 8.2 Test Description..................................................................................................30 8.3 Data Analysis......................................................................................................31 8.4 Test Results.........................................................................................................31 Chapter 9 Conclusions....................................................................................................33 Chapter 10 Future Studies...............................................................................................35 References.......................................................................................................................36 Appendix A Sensor Sample Data..............................................................................A-1 Appendix B RTMS and Wavetronix Length-based Classification Test Data...........B-1

Appendix C Mn/DOT Axle-based Classification Definition and Scheme................C-1 Appendix D TIRTL Classification Test Results........................................................D-1

LIST OF TABLES
Table 1.1 Project Team Members ............................................................................................... 2 Table 5.1 Vehicle Length-based Classification Groups.............................................................. 12 Table 5.2 Sensor Mounting Configurations .............................................................................. 13 Table 6.1 Overall Result Summary for Volume and Speed Detections ...................................... 15 Table 6.2 Result Summary for Length-based Class Detection ................................................... 18 Table 6.3 RTMS Test Results ..................................................................................................... 20 Table 6.4 Wavetronix Test Results ............................................................................................. 21 Table 6.5 System Cost................................................................................................................. 26
LIST OF FIGURES
Figure 2.1 Portable Tripod System............................................................................................... 6 Figure 2.2 System developed by Virginia DOT ........................................................................... 6 Figure 2.3 System Developed by Minnesota DOT....................................................................... 6 Figure 2.4 Trafcon “PEP” System................................................................................................ 6 Figure 2.5 Trailer System Used in Florida ................................................................................... 6Figure 2.6 Mobile Traffic Surveillance System ........................................................................... 6Figure 3.1 Attachable Pole-mounted PNITDS System ................................................................ 7Figure 3.2 Traffic Sensors ............................................................................................................. 8 Figure 4.1 PNITDS Test Site ........................................................................................................ 9 Figure 5.1 Reference Marks for Vehicle Classification ............................................................... 12 Figure 5.2 Test Locations ............................................................................................................. 13 Figure 6.1 Four-Lane Freeway Test Site ...................................................................................... 18 Figure 6.2 Four-Lane Arterial Test Site ..................................................................................... 19 Figure 6.3 Test Site of a 2-lane Roadway with a Side Wall......................................................... 20Figure 6.4 Test Site for Unparalleled Lanes at I-94 Exit Ramp ................................................... 21 Figure 6.5 Test Site of a Narrow Street without a Center Striping............................................... 22 Figure 6.6 Round Light-Pole Installation .................................................................................... 24 Figure 6.7 WisDOT System Design ............................................................................................. 24Figure 6.8 KDOT System Design................................................................................................. 25 Figure 6.9 Gear-Motor Angle Adjustment Unit ........................................................................... 26 Figure 7.1 Mobile Trailer and Test Site ....................................................................................... 27 Figure 8.1 TIRTL Components .................................................................................................... 29 Figure 8.2 TIRTL Test Site .......................................................................................................... 30 Figure 8.3 TIRTL Unit on Platform ............................................................................................. 30

EXECUTIVE SUMMARY Introduction Traditional traffic data-collection methods, such as tube counters or inductive loops, cause traffic interruption during installation and create safety concerns due to the exposure of data-collection personnel to traffic. The “Portable Non-Intrusive Traffic Detection System” (PNITDS) has been developed to collect short-term traffic data at high-volume and high-speed locations without compromising traffic flow or personnel safety. This system is designed to attach to various types of signposts along freeways and arterials, and support a side-fire installed traffic sensor. The PNITDS study includes a comprehensive evaluation of an attachable pole-mounted PNITDS including the assessment of sensor performance and system installation under various testing conditions. This report provides readers with an in-depth understanding of system’s capabilities and applications. The test results and conclusions are expected to benefit both public and private agencies for future data collection efforts. In addition to the pole-mounted PNITDS system, this report also includes a summary of observations obtained from a trailer-based portable system and from a test of a newly developed non-intrusive sensor, The-Infra-Red Traffic Logger (TIRTL). The TIRTL sensor is a self-contained portable traffic data collection system. It has the ability to provide axle-based vehicle classification data that makes it different from many other non-intrusive sensors. Results Following are the summarized test results: PNITDS System The PNITDS system is a simple and safe method for short-term traffic data
collection. System installation can be conducted without interrupting traffic flow.
The PNITDS is easy to install. According to the field experience, one person is able to install the system within 30 minutes.
The PNITDS system is flexible to install. It can be attached to various types of poles or signposts, including U-channels, I-beams (commonly used for freeways signs), and round poles. The system has the ability to detect multiple lanes of traffic (maximum eight lanes) in various mounting configurations.
The trailer-based PNITDS is easy to set up and provides flexibility in data collection location and sensor mounting configuration because of its mobility. The system examined in this project supports a traffic sensor, camera, and dynamic message sign (DMS) to provide traffic management capabilities for traffic studies, construction, special events, and emergencies. The communication equipment built on the system allows a traffic management center to monitor and manage the traffic remotely from any locations along the freeway corridor.

PNITDS Sensors
The PNITDS sensors can collect accurate volume and speed data and reasonable vehicle length-based classification under both free-flow and moderately congested traffic levels when the sensors are optimally calibrated. The absolute percent errors are within 5% for volume detection and 10% for speed detection. Congestion traffic increases detection errors; the minimum speed for the sensors being able to differentiate vehicles is 3 MPH to 5 MPH based on field observations. Normal weather conditions (rain, snow and fog) have no impact to sensor performance.
At some locations, trucks were observed to cause over-counting for the closest lane and the lane next to it. The sensors double count a truck as two vehicles (breakup) and miscount a truck in the closest lane to the lane next to it (spillover). These phenomena can be minimized by adjusting sensor parameters or lane configuration through the sensors’ interface or changing sensor mounting configurations when necessary.
All three of the sensors evaluated have user-friendly interfaces. The auto-calibration feature facilitates volume calibration while the speed and classification calibrations require manual adjustments. Speed and classification calibration are an iterative process that takes time to obtain optimal settings. A high quality radar gun is the most effective tool to collect sample speed data for field calibration. Reference lines painted on the pavement can be used to assist classification calibration. Historical settings obtained through field experience can be used as references to expedite field calibration.
TIRTL Sensor A brief field investigation found that the TIRTL sensor provides accurate results for
axle-based vehicle classification detection. The aggregated error for all classification detections is within 5%. The sensor interface is user-friendly and allows the user to define a vehicle classification scheme. The auto-calibration feature facilitates sensor calibration and does not need manual calibration. System security is a concern when the TIRTL units are used for a temporary application without having a permanent enclosure to protect them. Further investigations are needed to fully assess sensor’s capabilities.
Conclusions The PNITDS provides a safe and simple method for short-term traffic data collection. The system provides accurate traffic data when the sensors are optimally calibrated. The system is flexible enough to allow installation on a variety of existing infrastructures along freeways and local arterials. Wavetronix, RTMS and SmarTek sensors provide three length-based classifications. Classification accuracy is dependant on proper speed and volume calibration. The TIRTL provides accurate volume and axle-based classification with many more classes.

The PNITDS is an excellent step towards making traffic data collection efficient and safe. It allows data collection personnel to gather data in locations where it was previously difficult or impossible to do so. The detailed design documents that were prepared for the system will allow participating states to build systems that will meet their agency’s needs.

1
Chapter 1 Introduction
1.1 Background Traditional short-term traffic data collection methods, such as road tube counters, cause traffic interruption and create safety concerns because data collection personnel are exposed to traffic during the system installation, calibration, and maintenance. This study seeks to develop and evaluate a safe, simple, and cost-effective system that can accurately collect traffic data by using a “Portable Non-Intrusive Traffic Detection System” (PNITDS). This system is designed to attach to various types of signposts along freeways and arterials, and support a side-fire installed traffic sensor to conduct temporary traffic data collection. The system provides an alternative to conventional traffic data collection methods by allowing agencies to collect traffic data at high-volume and high-speed locations without compromising traffic flow or personnel safety. The idea of developing and evaluating the PNITDS was conceived at the 2002 North American Travel Monitoring Exhibition & Conference (NATMEC). The Minnesota Department of Transportation (Mn/DOT) elected to lead the project that was supported by 16 other participating State Departments of (DOTs) through a pooled-fund effort. A prototype system was fabricated in December 2003. Primary field tests were conducted from February to June of 2004 and preliminary test results were presented to technical committee members on June 27th at the 2004 NATMEC conference. After a traveling demonstration to thirteen participating states between September and October 2004, additional field tests were identified based on survey results to further explore sensors’ performance both in length-based vehicle classification detection and under various special roadway conditions. These additional tests were conducted in April 2005. This report also includes a test to assess a newly developed non-intrusive sensor, The-Infra-Red Traffic Logger (TIRTL). The test was co-conducted by SRF Consulting Group and the Mn/DOT Office of Transportation Data and Analysis in May 2005. The TIRTL sensor is a self-contained traffic data collection system that is considered independent from a typical pole-mounted PNITDS. The ability to provide axle-based vehicle classification data gives it additional functionality compared to other NIT sensors. The evaluation focused on its performance in axle-based vehicle classification detections. The evaluation details including the system description, test methods and results are discussed in Chapter 8. All project related documents are available at the PNITDS project website: http://www.dot.state.mn.us/guidestar/projects/pnitds.html.

2
1.2 Project Team Description The project team is comprised of individuals from the following agencies and organizations: FHWA, Mn/DOT Office of Traffic Security and Operations, 16 other participating state DOTs, and SRF Consulting Group, Inc. Project Team members are listed in Table 1.1. Table 1.1 Project Team Members Agency Name Representative Alaska DOT Mary Ann Dierckman Team Member California DOT Gurprit Hansra Team Member Connecticut DOT Anne-Marie McDonnell Team Member Florida DOT Richard Reel Team Member Idaho DOT Brian Hagen Team Member Illinois DOT Rob Robinson Team Member Kentucky DOT David Franke Team Member Louisiana DOT Mark Martinez Team Member Minnesota DOT Jerry Kotzenmacher Mn/DOT Project Manager Mississippi DOT Jeff Altman Team Member Missouri DOT John Miller Team Member Montana DOT Dan Bisom Team Member North Carolina DOT Kent Taylor Team Member North Dakota DOT Terry Woehl Team Member Oregon DOT Don Crownover Team Member Pennsylvania DOT Kim Ferroni Team Member Wisconsin DOT Paul Stein Team Member FHWA Ralph Gillmann Federal Representative SRF Consulting Group Brian Scott Team Member SRF Consulting Group Erik Minge SRF Project Manager SRF Consulting Group Bingwen Hao Team Member
1.3 Goals and Objectives The primary goal of the project was to design, build, and evaluate a PNITDS that is capable of detecting traffic in multiple lanes under various mounting conditions. Both the attachable pole mounting platform and the non-intrusive traffic sensors were assessed for their abilities to perform temporary data collection functions. Specific goals and supporting objectives are listed below: Goal 1: Assess the Performance of Non-Intrusive Sensors Objective 1-1: Assess performance of volume, speed, and length-based vehicle
classification data collection Objective 1-2: Assess performance in various traffic levels Objective 1-3: Assess performance in various mounting configurations Objective 1-4: Assess performance in various weather conditions

3
Goal 2: Document Attachable Pole-Mounted System Attributes Objective 2-1: Document deployment on various signpost types Objective 2-2: Document calibration issues Objective 2-3: Document maintenance issues Objective 2-4: Document system costs 1.4 Report Organization Chapter 2 lists the existing PNITDS systems researched at the beginning of the project. Chapter 3 introduces the PNITDS systems selected for this study. Chapter 4 describes the test site for the evaluation. Chapter 5 presents the test methodology used to assess the sensors’ performance and the criteria developed for documenting system attributes. Chapters 6 and 7 present all the test results and summarized conclusions extracted from the tests. Chapter 8 documents the test in assessing the TIRTL sensor. Chapter 9 summaries the conclusions drawn from the study. Finally, Chapter 10 briefly discusses some future studies.

4
Chapter 2 Existing PNITDS Systems
For the purposes of this study, a PNITDS is defined as a traffic detection system that can be easily transported and quickly set up on the side of roadway to support a non-intrusive sensor for a temporary traffic data collection. A typical PNITDS consists of the following components:
• A portable platform • A traffic sensor • A battery package • Communication and security accessories
The literature search for existing PNITDS indicated that various types of systems have been developed and used by both public and private agencies. A review of existing PNITDS reveals some common attributes for the system: 1. Portable: The system has a simple lightweight structure that can be either carried inside a
vehicle or easily transported by a vehicle.
2. Ease of Use: The system allows one person to set up the system and calibrate the sensor within a reasonable amount of time. The setup procedure is straightforward and repeatable.
3. Flexible: The system is flexible enough to support the installation of various types of non-intrusive traffic detection sensors.
4. Reliable: The system has a reliable power supply and data storage system to facilitate onsite system operation and/or remote data collection.
Research of existing PNITDS reveals that the following four mounting platforms have been developed and commonly used: Lightweight Tripod System The lightweight tripod is a stand alone unit that can be transported inside a vehicle and easily set up in the field by one person. A typical tripod system consists of an aluminum tripod base and an extendable fiberglass telescoping pole. The telescoping pole is used to support the traffic sensor and can be extended up to 35 feet. The tripod allows the system to be transported and set up in locations that a vehicle cannot access. However, stability can be an issue for such a system, particularly during windy conditions. A separate battery compartment is typically needed to provide a power supply. Figure 2.1 shows a tripod system supporting a Wavetronix sensor.

5
Lightweight Attachable Pole-Mounted System This system consists of two aluminum poles, a coupler and a set of clamps. The poles are connected by a coupler that forms a platform to support a traffic sensor on top of the pole. The assembled pole system must be attached to an existing signpost or similar structure on the side of the roadway. The system can be attached to various existing infrastructure such as U-channel signposts, round poles and I-beam signposts. Multiple systems can be transported inside a vehicle and set up at different locations by one person in the field. The system has good stability, but system installation is completely dependant on the availability and location of existing infrastructure. A separate battery compartment is required to provide a power supply for the sensor. Figures 2.2 and 2.3 show two similar “attachable pole-mounted” systems that were developed by Virginia DOT and Mn/DOT prior to this study. Lightweight Self-Contained Trailer System A lightweight trailer system is towed to the field location by a vehicle. The trailer provides good stability and can be easily deployed. The trailer is “self-contained” in that it incorporates compartments to house power supplies and any necessary data collection equipment, providing protection from the environment. The New York DOT has been using this type of trailer to support SmarTek sensors for short term data collection. Figure 2.4 shows a portable equipment platform (PEP) designed and manufactured by Trafcon Industries and Figure 2.5 shows a portable trailer system used by the New York DOT. Heavy-Duty Self-Contained Trailer System Compared to the lightweight trailer systems, this system is normally used to support heavier equipment such as a DMS or for any detection applications that require a high sensor mounting location. Figure 2.6 shows a trailer-based mobile traffic surveillance system developed by SRF Consulting Group and ADDCO for the Minnesota DOT. The system uses a hydraulic telescoping tower to support a sensor, camera, DMS and communication equipment to provide traffic operations management for emergences and special events.

6
Figure 2.1: Portable Tripod System
Figure 2.2: System Developed by Virginia DOT
Figure 2.3: System Developed by Minnesota DOT
Figure 2.4: Trafcon “PEP” System
Figure 2.5: Trailer System Used in New York
Figure 2.6: Mobile Traffic Surveillance System

7
Chapter 3 PNITDS System Description
3.1 Attachable Pole-Mounted System After reviewing the existing portable traffic data collection systems, the PNITDS technical committee agreed to select the lightweight “attachable pole-mounted” system for design, fabrication and field evaluation. The decision was made based on system attributes and cost. The concept of such a system was originally conceived and used by Virginia DOT in 1999. Several other states including Mn/DOT have used a variation of this concept to support non-intrusive sensors for short-term data collection. The pole-mounted system designed for this study consists of two eight-foot aluminum poles (one with an angle adjustment unit), a coupler, two sets of base units, and post clamps that can be attached to various types of signposts (see Figure 3.1). Other key components include a telescoping pole used to adjust the vertical aiming angle of the sensor via the angle adjustment unit on the top of the pole, a deep cycle marine battery, and a traffic sensor. A laptop is required to calibrate the sensor and download archived data from the sensor. Battery size was selected by considering traffic sensor power draw and the length of the traffic study. A 55 amp-hour deep cycle marine battery was selected for this study in order to power any of the sensors for a minimum of three days.
Figure 3.1: Attachable Pole-mounted PNITDS System

8
A battery box is needed to house the battery and deter theft. According to the American Association of State Highway and Transportation Officials (AASHTO) roadway design guidelines, the height of roadway obstructions should be less than four inches when located within a roadway’s clear zone. Larger obstructions should be protected (e.g. guardrail) or moved outside the clear zone. This height requirement specifies that the battery box be no more than 4 inches tall. In addition, the crashworthiness of the poles and sensors should be evaluated if the system is deployed within a roadway’s clear zone. 3.2 Non-Intrusive Traffic Sensors Three sensors were selected for the evaluation: the RTMS by EIS, the SAS-1 by SmarTek, and the SmartSensor by Wavetronix. Refer to Figure 3.2 for images of the sensors mounted in the field. All three sensors use different technologies. While both the SmartSensor and RTMS sensors use radar technologies, the RTMS uses analog radar and the SmartSensor uses digital radar. The SmarTek SAS-1 is a passive acoustic sensor. The three sensors have similar detection capabilities: sidefire installation, multiple lane detection, volume, speed, length-based vehicle class, and auto configuration.
EIS – RTMS Wavetronix – SmartSensor SmarTek – SAS 1 (Radar) (Digital Radar) (Passive Acoustic) Figure 3.2: Traffic Sensors

9
Chapter 4 PNITDS Test Site
The PNITDS tests were primarily conducted at the Mn/DOT Non-Intrusive Technology (NIT) test site on I-394 Eastbound at Penn Avenue in Minneapolis, Minnesota. A data collection shelter located on the southeast corner of the interchange was designed and built in 2000 for the NIT project (http://projects.dot.state.mn.us/nit/) and for future studies. Several features of this site make it a good location for the PNITDS test. First, the site overlooks an eight-lane freeway with three lanes in each direction and two reversible High Occupancy Vehicle (HOV) lanes in between. This configuration provides an opportunity to fully assess traffic sensor detection capabilities. Second, a round-shaped light pole and two U-channel freeway signposts on the north and south side of I-394 provide mounting options to evaluate system mounting flexibility. Third, in-place inductive loops in the three eastbound lanes are wired into an Automated Data Recorder (ADR) installed inside the data collection shelter. These loops provide baseline data for the three eastbound lanes in the test. In addition, a camera, monitor, VCR, and other communication equipment in the shelter provide a video record of traffic for all eight lanes. While the videotaped traffic records are primarily used to verify baseline loop data, they can also provide baseline data for those lanes that do not have loops installed. Additionally, the security fence and the alarm system inside the shelter increase security for the testing equipment. See Figure 4.1 for a photo of the test site.
Figure 4.1: PNITDS Test Site

10
In addition to this test site, the Wavetronix and RTMS sensors were also tested at various satellite locations to better explore the sensors’ performance under different roadway geometries and conditions. These test sites are described within the respective test results in Chapter 6. The SmarTek sensor was not tested at those supplemental testing sites because the recommended sensor mounting height requires at least three poles (most locations require two poles). Three poles make the system difficult for one person to install.

11
Chapter 5 Test Methodology
The evaluation assessed sensor performance and ease of system use. Appropriate methods and statistical measures were selected to identify sensor accuracy and document system deployment issues. 5.1 Sensor Performance Sensor performance is assessed by comparing sensor data against baseline data for various traffic parameters. Detailed test methods include defining traffic parameters, verifying baseline data, identifying performance measures and testing scenarios. 5.1.1 Traffic Parameters Traffic parameters selected for the evaluation included volume, speed, and length-based vehicle classification. Volume is defined as the total number of vehicles counted during each 15-minute interval. Speed is defined as the average aggregate speed of all vehicles detected within a 15-minute interval. Vehicle classification is defined as the total number of vehicles counted for each predefined vehicle length group within each 15-minute interval. 5.1.2 Baseline Data Baseline data at the I-394 test site includes both loop and manual counts because the loops were only installed in the three eastbound lanes. Traffic in the lanes without loops was videotaped. One peak hour and one off-peak hour traffic were manually counted from the video and used as the baseline. Because the two HOV lanes are usually closed during the off-peak hours, two hours of traffic during peak periods were videotaped and counted as the baseline in order to get enough samples. Baseline Volume Data – Inductive loop volume data was collected by the ADR. By collecting the loop emulation relay outputs, the ADR processes volume into 15-minute intervals. The baseline volume obtained from the loops was carefully verified by comparing it to manual observations for two peak hours and two off-peak hours. The results show that the baseline volume detection error ranges from 1.3% to 3.0%. Baseline Speed Data – Loop detectors configured in a two-loop speed trap configuration were used as a baseline for vehicle speed evaluation. The ADR collected per-vehicle speed records that can be compared to manual observations. The speed observations were conducted with a probe vehicle driven through the detection zone at different predetermined speeds. A total of seven sample speed detections were collected for each lane. The baseline speed error ranged from 1.9% to 3.8%. Baseline Vehicle Class Data – Baseline vehicle class data was collected by manual observations. Table 5.1 shows the three length-based vehicle classes defined for this study. The small vehicle group includes mostly passenger cars, sport/utility vehicles and vans. The medium vehicle group

12
includes single unit trucks, commercial vehicles, large utility vehicles and standard transit buses. The large vehicle group includes combination trucks, large transit buses and typical semi-trailer trucks. Table 5.1 Vehicle Length-based Classification Groups Vehicle Class Length Small Vehicles 0 – 25 ft Medium Vehicles 25 – 45 ft Large Vehicles 45 – 120 ft
Three reference lines (0, 25 and 45 feet) were measured and painted across all three eastbound lanes of the freeway for the vehicle class study (see Figure 5.1). Traffic passing through the painted area was videotaped from the side of the freeway. The video was reviewed and served as the baseline data for evaluating sensor classification detection. The vehicle class was identified by manual observation using the painted marks as a scale. The video camera inserted a time stamp on the screen and the camera timer was synchronized with the sensor timer. This assured that the traffic detected by the sensor was consistent with the traffic recorded by the camera.
Figure 5.1 Reference Marks for Vehicle Classification 5.1.3 Performance Measurements Absolute percent difference was selected as the statistical measure to identify sensor performance in volume, speed and class detections. The absolute value avoids error compensation caused by over and undercounting when positive and negative errors cancel each other out.

13
For volume, the percentage difference is defined as the ratio of accumulated absolute errors of each interval over the total baseline volume for a complete test period for each lane. For speed, the absolute percent difference is defined as the mean of the weighted absolute errors for each interval for a complete test period for each lane. The absolute error of each interval was weighted according to the speed of that interval over the entire test period to avoid the bias caused by the low speed values collected during peak periods. The absolute percentage for class detection is the ratio of total misclassified vehicles over the total baseline volume for a complete test period. 5.1.4 Testing Conditions Each sensor was mounted under various offsets and heights based on the vendor-recommended mounting configurations in order to evaluate each sensor’s detection range. Three locations at the NIT test site were identified to support system installation and sensor performance evaluations. Table 5.2 lists sensor mounting configurations. Figure 5.2 shows these three locations at the test site. Table 5.2 Sensor Mounting Configurations Location Pole Type Offset (Ft) Height (Ft) Sensor Tested
1 Shelter Railing 50 25 Wavetronix, RTMS 2 Round Light Pole 22 17/25 Wavetronix, RTMS, SmarTek 3 U-Channel Signpost 20 16/24 Wavetronix
Figure 5.2 Test Locations

14
This test site also provides both high-speed free-flow conditions and congested conditions on a recurring basis (such as during peak periods). Sensors were evaluated during 24-hour test periods in order to observe performance in varying traffic levels. Each 24-hour dataset was collected for the three eastbound lanes because these three lanes have loop detectors that automatically record baseline data. Two-hour manual counts (one peak and one off-peak) were used as baseline for the three westbound lanes and two-hour peak traffic counts were used as the baseline for the two HOV lanes. Weather records were archived to verify sensor performance under different weather conditions. Additional tests were conducted to further investigate sensors’ performance at several satellite locations. These locations are described in conjunction with the test results in Chapter 6. 5.2 System Deployment System deployment was assessed based on the field experience accumulated over the course of the test. The time spent on system installation and sensor calibration were recorded during each test and used as references to measure the ease of system installation and calibration. Subjective opinions were collected from test personnel as additional input. System cost and maintenance requirements are presented to provide readers with a comprehensive understanding of the system.

15
Chapter 6 Test Results
This section presents test results for sensor performance and system deployment according to the evaluation goals and objectives specified in Section 1.3. Sensor performance includes sensor accuracy for volume, speed, and classification detection under various testing conditions. The results are presented in the following order: an eight-lane freeway, a four-lane freeway, a four-lane arterial, a two-lane roadway with a side wall, an unparallel lane at a freeway exit ramp, and a narrow local street without center striping. The advantages and disadvantages for using a trailer-based mobile platform to support sensor detections are also discussed. System deployment assessment includes the field system installation experiences recorded in a log file during testing. In addition, the efforts made by other state agencies to improve system deployment are documented. System maintenance requirements and cost information are summarized in this section. 6.1 Sensor Performance 6.1.1 Eight-Lane Freeway Volume and Speed Sensor performance in freeway detection was tested and summarized from 24-hour test data under various mounting configurations. The following results highlight key features and findings of the field evaluation. The overall result summary for the tests conducted at this test site is listed in Table 6.1.
Table 6.1 Overall Result Summary for Volume and Speed Detections
Wavetronix EIS SmarTek Volume Detection 1.4% - 4.9% 2.4% - 8.6% 9.9% - 11.8% Speed Detection 3.0% - 9.7% 4.4% - 9.0% 5.6% - 6.8% Heavy Traffic Impact No No Yes, Under Count Weather Impact No No No Barrier Impact Minimal Moderate Not tested
Wavetronix SmartSensor The Wavetronix SmartSensor provided accurate volume and speed results for all 24-hour test periods. The results show that the sensor can accurately detect traffic in both free-flow and various traffic levels. The sensor detected eight lanes of traffic, including the two reversible HOV lanes, in all three test locations. The overall volume detection error was between 1.0% and 4.9%, and the speed detection error was between 3.0% and 9.7%. The sensor provided a reasonable measure of the distribution of vehicle length-based classification within the traffic stream when optimally calibrated under various mounting heights and offsets.

16
Concrete barriers on the side of the HOV lanes had a slight impact on the sensor’s ability to detect the lanes behind them except at Location 1. Even though the concrete barriers caused a challenging environment for the sensor, sensor performance in detecting these lanes was acceptable. The vendor indicated that performance in these lanes would be improved by further tuning sensor configurations and settings.
Under normal conditions, adverse weather, such as rain or snow, had no impact on the sensors performance. However, severe weather conditions, such as extreme heavy precipitation or snow may impact sensor performance. It is anticipated that in order to thoroughly test the sensor under these conditions, a long-term application is required. It was observed that the stop-and-go traffic caused under- or over-counting of traffic during peak periods. The observed minimum speed for the sensor to differentiate the vehicles was 3 MPH.
The Wavetronix SmartSensor was easy to calibrate. The interface is user friendly and the auto-configuration feature expedited the calibration process. During free-flow traffic conditions, it took from 5 to 10 minutes to complete the lane configuration by using auto-configuration function. The total amount of time it takes to complete sensor count verification also depends on the number of lanes and the traffic levels. For example, a multiple-lane facility with little traffic would take the longest to calibrate because detection records must be observed on a lane-by-lane basis. This finding is true for the other sensors as well. Sensor speed and vehicle class detection require additional time to calibrate. Calibration can be done by adjusting the emulated loop scale factors (size and space) for each lane. Calibration in this manner is an iterative process. The interface allows users to specify three vehicle length-based classifications. Both speed and vehicle length calibration is an iterative process, which takes significant time to finalize the optimal settings.
The sensor can store 2,978 intervals of data in flash memory, which is equivalent to 31 days for a 15-minute interval. When the memory is full, the sensor will stop collecting data. See Appendix A for a set of sample raw data.
EIS RTMS
The EIS RTMS sensor provided accurate volume and speed results for all 24-hour test periods. The results showed that the sensor can accurately detect traffic for free flow and various traffic levels when installed in vendor-recommended mounting configurations. Of the three locations tested, the sensor detected all eight lanes at Location 1 mounted at a height of 25 feet and at an offset of 50 feet.
At the other locations, concrete barriers on the side of the HOV lanes had an impact on the sensor’s ability to detect the lanes behind them. It is important to note that the concrete barriers present a challenging data collection location for the sensor. The barrier impact can be minimized by mounting the sensor at a location with a larger offset, or by using two sensors, one on each side of the roadway. Also, note that Location 2 is outside the vendor-recommended mounting range. The overall volume detection error was between 2.4% and 8.6%, and the speed detection error was between 4.4% and 9.0%. The sensor provided a reasonable measure of the distribution of vehicle lengths within the traffic stream when optimally calibrated.

17
Under normal conditions, adverse weather, such as rain or snow, had no impact on the sensors performance. However, severe weather conditions, such as extreme heavy precipitation or snow may impact sensor performance. It is anticipated that in order to thoroughly test the sensor under these conditions, a long-term application is required. It was observed that the stop-and-go traffic caused under- or over-counting of traffic during peak periods. The observed minimum speed for the sensor to differentiate the vehicles was 5 MPH.
The RTMS sensor was easy to calibrate. The auto-configuration feature provides a good starting point for the calibration process. Under free-flow traffic conditions, it took 10 to 15 minutes to complete lane configuration by using the auto-configuration function. The sensor requires additional manual adjustments to finalize calibration depending on the mounting configuration, the number of lanes detected and the traffic levels. In addition, speed and class calibrations are an iterative process, which requires additional time. Calibration can be done by adjusting speed factors and vehicle length multipliers for each lane. The sensor provides vehicle types (Small, Medium, Long and Extra Long) that were verified with manual observations.
The sensor unit does not store the collected data. An additional remote traffic counter (RTC) unit is required to store the accumulated RTMS messages. The RTC unit can be stored inside a battery box. The device has a capacity of 4 megabytes and allows a maximum storage of 64000 traffic measurements that are equivalent to over seven months of data for a 5-minute interval. See Appendix A for a set of sample raw data.
SmarTek SAS-1
The SmarTek SAS-1 sensor provided accurate speed and volume results at the freeway test site. However, volume performance was not as accurate as the other sensors during heavy traffic levels. The vendor indicated that the sensor should be mounted higher than the 25 feet that the pole-mounting system provided in order to minimize potential occlusion and improve results during heavy traffic. The sensor was only tested for three lanes of detection at a height of 25 feet and an offset of 22 feet. However, even at this location it was not an ideal mounting configuration. The vendor would have preferred a location closer to the roadway at this height. Readers should note that tests done in previous phase of research found better accuracy when the sensor was tested at optimal locations. The overall volume error was between 9.9% and 11.8%. During free-flow traffic, the error was typically between 0.0% and 7.7%. Errors during congested periods resulted in significant undercounting when vehicle speeds dropped below 30 MPH. The speed detection error was between 5.6% and 6.8%. The sensor provided a reasonable measure of the distribution of only small vehicle lengths within the traffic stream. The distribution of medium and large vehicles was not accurate.
The SAS-1 sensor was easy to calibrate and the interface is user friendly. The auto lane locating feature provides a good starting point for calibration. The optimal sensor setting may require manual adjustments to lane width and some default values of certain key parameters. As a result, a better understanding of the parameters’ functions can help reach an optimal setting. Under free-flow traffic conditions, it took 15 to 30 minutes to finalize the sensor configuration for a three-lane test. The sensor speed required additional time to calibrate. Calibration can be done by adjusting the speed factors for each lane with the aid of the auto speed calibration feature.

18
The interface allows users to specify three vehicle length-based classifications. There is no parameter to control vehicle class calibration.
The sensor tested has a memory of 1 megabyte that translates into about a month of data at one-hour intervals. When the sensor memory is full, it will keep collecting data by erasing the oldest data in the memory. Note: A unit with a 4 megabyte memory is also available. See Appendix A for a set of sample raw data.
Vehicle Classification Both Wavetronix and RTMS sensors were tested for their vehicle classification accuracy. The sensors were mounted at Locations 1 and 2 to detect the three eastbound lanes. Two hours of data were collected for each test. Test results show that both sensors provide accurate results. The percentage errors for Wavetronix sensor range from 0.4% to 5.6% for the two tests and for RTMS range from 0.2% to 4.4%. Table 6.2 lists the percentages errors for the two sensors. Appendices B-1 and 2 contain detailed test data. Table 6.2 Result Summary for Length-based Class Detection
Lane Wavetronix RTMS 1 0.9% to 5.6% 1.2% to 4.4% 2 0.6% to 4.7% 0.2% to 1.2% 3 0.4% to 1.5% 0.4% to 1.4%
6.1.2 Four-Lane Freeway This test was conducted to verify sensor performance in detecting a typical four-lane freeway with a 30-feet wide median (see Figure 6.1). The system was attached to an I-Beam signpost and both RTMS and Wavetronix sensors were mounted at a height of 17 feet and an offset of 17 feet.
Figure 6.1 Four-Lane Freeway Test Site
19
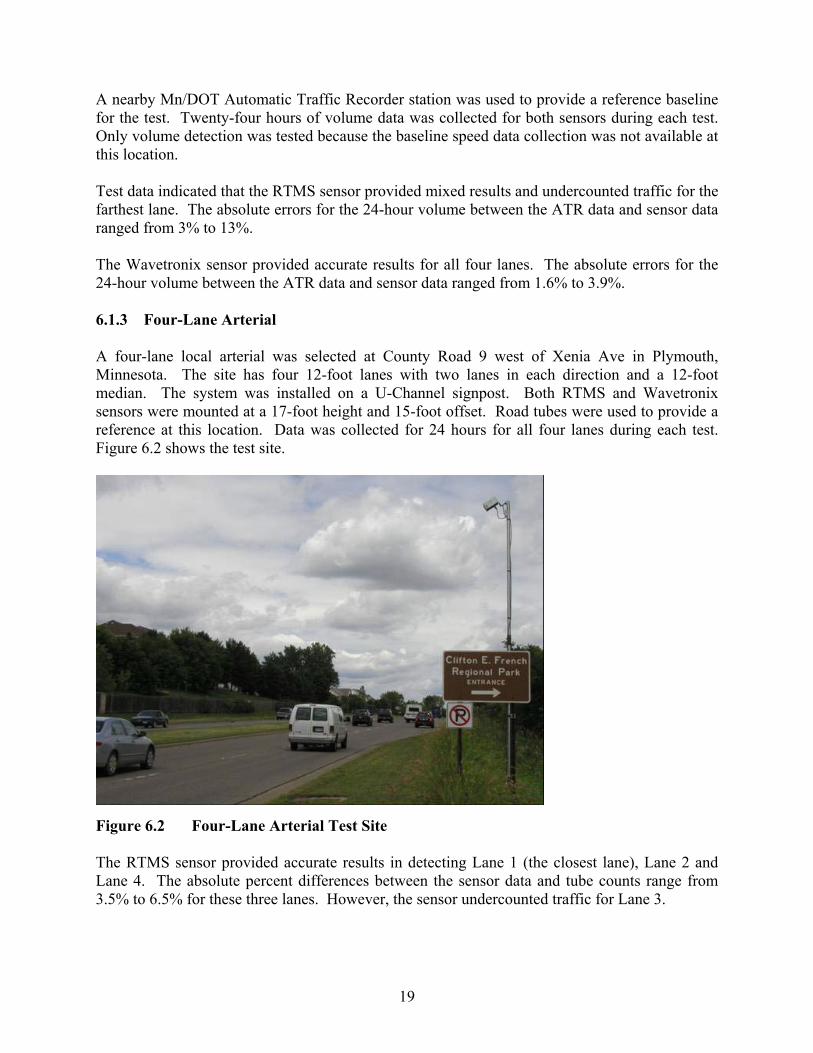
A nearby Mn/DOT Automatic Traffic Recorder station was used to provide a reference baseline for the test. Twenty-four hours of volume data was collected for both sensors during each test. Only volume detection was tested because the baseline speed data collection was not available at this location. Test data indicated that the RTMS sensor provided mixed results and undercounted traffic for the farthest lane. The absolute errors for the 24-hour volume between the ATR data and sensor data ranged from 3% to 13%. The Wavetronix sensor provided accurate results for all four lanes. The absolute errors for the 24-hour volume between the ATR data and sensor data ranged from 1.6% to 3.9%. 6.1.3 Four-Lane Arterial A four-lane local arterial was selected at County Road 9 west of Xenia Ave in Plymouth, Minnesota. The site has four 12-foot lanes with two lanes in each direction and a 12-foot median. The system was installed on a U-Channel signpost. Both RTMS and Wavetronix sensors were mounted at a 17-foot height and 15-foot offset. Road tubes were used to provide a reference at this location. Data was collected for 24 hours for all four lanes during each test. Figure 6.2 shows the test site.
Figure 6.2 Four-Lane Arterial Test Site The RTMS sensor provided accurate results in detecting Lane 1 (the closest lane), Lane 2 and Lane 4. The absolute percent differences between the sensor data and tube counts range from 3.5% to 6.5% for these three lanes. However, the sensor undercounted traffic for Lane 3.

20
The Wavetronix sensor provided good results in detecting the three farthest lanes. The absolute percent differences between the sensor data and tube data range from 0.6% to 2.7% for these three lanes. However, the sensor over-counted traffic for the closest lane especially during the peak periods. 6.1.4 Two-lane Roadway with a Side Wall The test site for this test was located at the I-394 frontage road at General Mills Boulevard in Minneapolis, Minnesota. A 15-foot tall concrete wall is located six feet from the edge of the driving lane on the south side of the roadway. The location was selected to investigate if sensors’ performance would be affected by the “echo impact” of the radar signal bouncing off the wall. The pole system was attached to a U-channel signpost located on the north side of the roadway with at an offset of 15 feet from the edge of the closest lane. The sensors were mounted at a height of 17 feet. Test personnel manually counted one hour of traffic that was used as the baseline to compare against sensor data. Figure 6.3 shows the test site.
Figure 6.3 Test Site of a 2-lane Roadway with a Side Wall The test results indicate that the RTMS sensor provided an accurate detection only for the lane close to the sensor (Lane 1) while undercounted traffic on the lane close to the wall (Lane 2). The test results are shown in Table 6.3. Table 6.3 RTMS Test Results
Lane Manual RTMS 1 129 128 2 129 103
21
However, whether the error in Lane 2 resulted from the echo impact of the wall could not be confirmed and further investigation is required to more completely understand the issue. The Wavetronix sensor provided accurate results for both lanes at this location and test data is presented in Table 6.4. Table 6.4 Wavetronix Test Results
Lane Manual Wavetronix 1 135 136 2 100 101
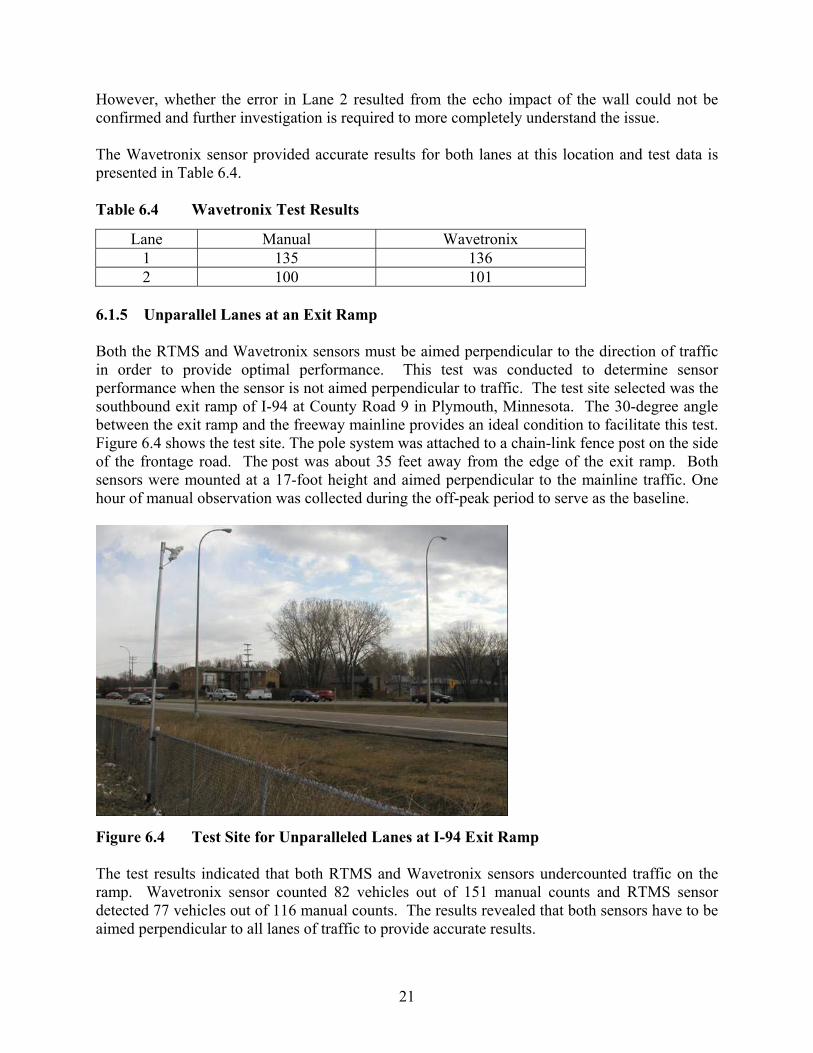
6.1.5 Unparallel Lanes at an Exit Ramp Both the RTMS and Wavetronix sensors must be aimed perpendicular to the direction of traffic in order to provide optimal performance. This test was conducted to determine sensor performance when the sensor is not aimed perpendicular to traffic. The test site selected was the southbound exit ramp of I-94 at County Road 9 in Plymouth, Minnesota. The 30-degree angle between the exit ramp and the freeway mainline provides an ideal condition to facilitate this test. Figure 6.4 shows the test site. The pole system was attached to a chain-link fence post on the side of the frontage road. The post was about 35 feet away from the edge of the exit ramp. Both sensors were mounted at a 17-foot height and aimed perpendicular to the mainline traffic. One hour of manual observation was collected during the off-peak period to serve as the baseline.
Figure 6.4 Test Site for Unparalleled Lanes at I-94 Exit Ramp The test results indicated that both RTMS and Wavetronix sensors undercounted traffic on the ramp. Wavetronix sensor counted 82 vehicles out of 151 manual counts and RTMS sensor detected 77 vehicles out of 116 manual counts. The results revealed that both sensors have to be aimed perpendicular to all lanes of traffic to provide accurate results.

22
6.1.6 Narrow Street without Center Striping This test explores sensors’ capability to detect traffic on a narrow street without center striping. The test site was selected at Ottawa Avenue, north of Highway 7 in St. Louis Park, Minnesota. This type of roadway provides a challenge to sensor performance because the portion of the roadway that a vehicle travels in varies based on the approaching traffic. Such variation causes conflicts between sensor lane configuration and vehicle locations. Specifically, at this location, vehicles were observed to drive in the center area of the roadway when there was no oncoming traffic, which resulted in a one-lane configuration in sensor’s setting. However, when two vehicles approached each other, they each moved to the right side of the roadway, which resulted in a two-lane configuration in sensor’s setting. Because the sensor can only use one setting for each detection period, the sensor performance was affected by the conflict between lane configuration and lane-use variations. The pole system was attached to an existing U-channel signpost. Both sensors were installed at a height of 17 feet and an offset of 14 feet. Manual observations were used as the baseline to evaluate sensor performance at this location. Figure 6.5 shows the test site.
Figure 6.5 Test Site of a Narrow Street without a Center Striping Test data indicated that the RTMS sensor undercounted traffic when only one emulated loop was configured as the detection setting. The field observations revealed that the sensor detected a single vehicle correctly but miscounted two approaching vehicles as one vehicle when they passed each other at the detection zone. The sensor counted 90 vehicles while the test personnel counted 97 vehicles from both directions and noticed seven swing-by situations where two vehicles crossed the sensor at the same time during the data collection period. When two emulated loops were configured, the RTMS sensor only provided accurate detection for the lane closer to the sensor, but over-counted traffic for the lane farther from the sensor. The

23
sensor counted 63 vehicles out of 63 manual counts in Lane 1, but counted 43 vehicles versus 20 manual counts in Lane 2. The field observations indicate that the over-counting in Lane 2 resulted from the sensor miscounting some high commercial vehicles or vans in Lane 1. This phenomenon can be described as the traffic in Lane 1 “spilling-over” to Lane 2. The Wavetronix sensor undercounted traffic when one-lane setting was configured due to the sensor miscounting the two passing vehicles as one. Test data indicated that the sensor counted 125 vehicles while the test personnel counted 130 vehicles from both directions and noticed that five swing-by situations occurred during the test period. The sensor was observed to only configure one-lane setting via the auto-calibration feature under this situation. A two-lane configuration was then manually configured for the purpose of the testing. The test data indicated that the sensor over-counted traffic for both lanes. The sensor counted 28 vehicles for Lane 1 while manual counts were only 21, and the sensor detected 24 vehicles for Lane 2 while manual counts were only 6. In summary, the two sensors tested are not able to accurately detect traffic in locations where vehicles travel in varied positions of the roadway. 6.2 System Assessment 6.2.1 System Installation Extensive field experience finds the pole-mounted system easy to attach to various types of poles, including round light poles, U-channel signposts and I-beam signposts. The installation procedure is straightforward and the average installation time is 15 to 20 minutes for all three types of installation. For a U-channel installation, it is recommended to attach the system to a U-channel-supported sign that has a knee brace to ensure that the system and sensor are stable. Additional accessories are required for a round light pole and I-beam installation. Metal clamps were used to connect the U-channel clamps to a round light pole and a cordless drill was used to fasten the metal clamps (Figure 6.6). This type of mounting bracket can be used for other post types, such as square-shaped pole. A pair of pliers and ratchet were used to fasten the I-beam clamps to the flange of the beam during the installation. Other mounting designs may need to be developed to facilitate the installation to other types of vertical roadway infrastructures. However, modifications can be made in system design to improve the system installation. One issue is that the wing-nut bolt on the U-channel clamp is too long. This makes it difficult to tighten in the winter when personnel wear gloves. Test personnel also noticed that the wing-nut bolt on the U-channel clamp was bent when it was used with the round pole due to the moment and shear forces generated by the system’s weight. There is a concern that a long-term application may cause this bolt to fail. It is recommended that the U-channel clamp design be modified to make installation easier and safer.

24
Figure 6.6 Round Light Pole Installation 6.2.2 Improvement in System Design In order to make the system more efficient, several state DOTs have made some modifications to the pole-mounted system prototype. Wisconsin DOT has developed a lightweight telescoping system that consists of a telescoping fiberglass pole, a universal mounting bracket and detachable structure brackets. The fiberglass telescoping pole is used to support the sensor up to a maximum height of 35 feet when it is fully extended. The universal bracket is designed to hold the telescoping pole with two clamps on one side and connect various types of structure brackets on the other side. These structure brackets are designed to accommodate different signposts or poles which allow the system to be attached to rectangular wood signposts, square guardrail posts, round poles, and I-beam signposts. Figure 6.7 shows the Wisconsin DOT design in the down position. Sensor stability is a concern for this design because the fiberglass pole is lightweight and not rigid when it is fully extended. Heavy wind can cause the sensor to swing, which may affect sensor detection accuracy. Steve Wiswell of the Wisconsin DOT can be contacted for more information (608-246-3266, [email protected]).
Figure 6.7 WisDOT System Design

25
Kentucky DOT has also developed a similar pole-mounted system. The system consists of a telescoping flagpole, two couplings, a Wavetronix sensor, a gear-motored angle adjustment unit, communication and power cables, and a power pack. The telescoping flagpole can be extended to a maximum height of 20 feet and is connected to a 5-foot antenna mast. The sensor is mounted on the top of the mast that can be lifted up to a maximum height of 24 feet. An additional 5 feet can be obtained by adding another 5-foot antenna mast to the system. The coupling is designed to hold the flagpole and can be attached to I-beams, guardrail columns, or signposts. Two wing nuts are used to secure the connections between the coupling and the flange of the column and a metal hose clamp is used to fasten the flagpole to the coupling. Figure 6.8 shows the system components.
Figure 6.8 KDOT System Design The gear-motored angle adjustment unit is a special feature developed by the Kentucky DOT. It provides a convenient approach that allows data collection practitioners to remotely adjust sensor vertical-aiming angle from the ground during the process of sensor calibration. Unlike the manual angle adjustment unit that needs to be manipulated with a telescoping pole, the gear-motored angle adjustment unit allows the user to change the sensor’s vertical-aiming angle simply by powering the unit from the ground after the system is set up. Specifically, the unit includes a small DC-powered gear-motor, a 2-inch piece of rubber road tube, and a turnbuckle. The gear-motor and turnbuckle are connected to each end of the rubber road tube that serves as a universal joint. The gear-motor is then attached to the sensor mounting bracket and the turnbuckle is connected to the back of the sensor unit with an L-shaped bracket. Once the gear-motor is powered from the ground, it will drive the rubber tube that rotates turnbuckle. The movements of the turnbuckle thread then pull or push the sensor, changing the sensor’s vertical aiming angle. A toggle switch is used to control gear rotation direction. Figure 6.9 shows the gear-motored angle adjustment unit. Gear-motors and the turnbuckles are sold at many hardware stores. Rubber tube sections can be simply cut from a regular road tube. According to the Kentucky DOT, the cost of this motor unit is less than one hundred dollars. David Franke (502-564-7183), [email protected]) or Jeff Young (502-229-0948, [email protected]) in the Division of Planning of Kentucky DOT may be contacted for further information about the system.

26
Figure 6.9 Gear-Motor Angle Adjustment Unit 6.2.3 System Maintenance All three sensors required no maintenance during the several months of testing that was conducted for this project. Normal preventative maintenance is necessary for long-term applications.
Similarly, the pole system requires minimum maintenance over long-term applications. Typical maintenance includes cleaning inside the clamps to prevent them from developing rust. Both the pole and clamps can easily be cleaned by driving a metal brush with an electric drill.
6.2.4 System Cost The total system cost includes sensor cost, pole manufacturing cost and power/communication component cost (Table 6.5). A laptop computer is also required, but not included as a cost in the table. The pole manufacturing cost varies depending on local material and labor costs. The approximate total system costs range from $5,700 to $6,200. Table 6.5 System Cost
Item Cost Notes RTMS – X3 $4,000 Does not include cable and bracket SmarTek – SAS-1 $3,500 per unit
$3,080 per 10 units
Sens
or
Wavetronix – SmartSensor $4,000 Does not include cable and bracket Two Aluminum Poles and Steel Clamps $2,000 Including labor Battery and Battery Box $ 200 TOTAL COST $5,700 to $6,200

27
Chapter 7 Trailer Platform PNITDS
An additional test was conducted to explore the advantages and limitations of a trailer-based PNITDS. The trailer-based mobile system used for this test was designed and built for Mn/DOT’s Traveler Information and Guidance Evacuation Route (TIGER) project. The system uses a heavy-duty trailer that serves as a platform to support a DMS sign, Wavetronix sensor and camera. The sensor is mounted on a retractable mast that can be extended to support the sensor to a maximum height of 19 feet. Several deep-cycle batteries power all the equipment on the mobile trailer. The system was transported to a testing location with a four-lane roadway and a 45-foot median. The sensor was mounted at 19 feet with a 15-foot offset from the edge of the lane. One hour of off-peak traffic was manually collected as a baseline to verify sensor’s performance. Figure 7.1 shows the mobile trailer system and the test site. Test data show that the sensor provided accurate results for the two far-side lanes with absolute errors ranging from 0.0% to 0.7%. However, the sensor over-counted traffic for the two lanes closest to the sensor with absolute errors ranging from 9.7% and 20%. Field observations indicated that the over-counting in the closest lane resulted from semi-truck “breakups” because the sensor double-counted the commercial trucks as two separate vehicles. The over-counting at the second closest lane to the sensor again resulted in a “spill-over” effect described in the previous section. The Wavetronix vendor released a new version of software, SmartSensor Manager 2.2. This new software includes two parameters, extension time and filter, that allow user to minimize these two errors specifically. The updated interface software effectively decreases the truck impact and improves sensor’s performance.
Figure 7.1 Mobile Trailer and Test Site

28
One of the advantages for the mobile system is that the system setup is not dependant on existing roadway facilities, providing flexibility in data-collection locations. In addition, the system provides various sensor-mounting configurations. The mobile trailer and the hydraulic extendable mast allow the sensor to be mounted at different mounting heights and offsets that assist in obtaining optimal sensor-mounting configuration. The mobile system is easy to set up. It took test personnel 10 minutes to complete the system setup, including leveling the platform and adjusting sensor’s height and offset. By adding wireless communication equipment, the mobile system is able to transmit real time traffic data and video images captured by a pan/tilt/zoom camera to a remote traffic management center, and display traffic management messages received from the center on the DMS sign to guide traffic. This self-contained mobile traffic monitoring system can be used for short-term traffic data collection or manage the traffic for special events, construction, or emergencies. Due to the weight of the trailer and equipment, a heavy-duty vehicle is required to transport the mobile system.

29
Chapter 8 TIRTL Test
8.1 Sensor Description A newly developed traffic sensor, The Infra-Red Traffic Logger (TIRTL), was also tested in this study because it is a novel approach to sidefire traffic detection. The system can detect axle-based vehicle classification from the side of the roadway. The TIRTL sensor was developed in Australia. A Florida-based vendor, Control Specialists Company, is the local distributor for the product. Figure 8.1 shows the TIRTL sensor on a temporary supporting platform.
Figure 8.1 TIRTL Sensor The TIRTL consists of a transmitter and receiver that are placed on opposite sides of a roadway above the elevation of the pavement and below the vehicles’ axles. It uses infrared technology to count, classify, and determine the lane and speed of passing vehicles for multi-lane and bi-directional traffic. The transmitter emits two parallel infrared beams that cross the roadway to the receiver. The receiver detects disturbances in the beams caused by passing tires and uses vendor-developed software to process and provide traffic data based on the relative timing of those beam-interruption events. Specifically, vehicle speeds and travel directions are determined by the time interval measured between beam-interruption events and the order of the events. Vehicle classification is determined by detecting the number of vehicle axles and spacing and compares them to the TIRTL axle group. The axle group is defined based on either the 13-class FHWA scheme or a user-defined vehicle class scheme. The 15-class Mn/DOT vehicle classification scheme was used and programmed to both the ATR and the TIRTL sensors for the test. The Mn/DOT class scheme is provided in Appendix C. A laptop or a similar device is required for field-sensor calibration and data retrieval. The interface software allows users to view real-time traffic events. According to the sensor’s vendor, the system can detect a maximum of 20 lanes of traffic. The maximum distance between the transmitter and receiver is 330 feet.

30
8.2 Test Description The test was conducted by SRF Consulting Group and Mn/DOT’s Office of Traffic Data and Analysis. The test location selected is a Mn/DOT ATR station located at Highway 8 in Lake Forest, Minnesota. The location featured high-volume traffic and a high percentage of different vehicle classifications. Three pairs of TIRTL systems were placed along the roadway with about 21 feet to 31 feet between them. All sensor transmitters and receivers were mounted on adjustable metal platforms. The height of each platform was carefully adjusted to ensure the bottoms of the units were level and 2 inches above the crown of the pavement at the test site. Figure 8.2 shows the test site and sensor units and Figure 8.3 shows the sensor unit on a metal platform.
Figure 8.2 TIRTL Test Site
Figure 8.3 TIRTL Unit on Platform The test focused on the sensor’s capability for axle-based vehicle classification detection. Traffic passing through the detection zone was videotaped from the side of the roadway. The video camera put a time stamp on the screen and the camera timer was synchronized with the sensor timer. This assured that the traffic detected by the sensors was consistent with the traffic recorded by the camera. The recorded traffic video was reviewed and the axle-based vehicle

31
classification records were identified manually by test personnel. The manual observation was then compared with the ATR data. The verification between the manual observation and ATR data minimized human factor errors and ensured the reliability of the baseline data. The verified per-vehicle records were used as the primary baseline to compare against sensor records by using time stamps as the index. The ATR data was also used to further investigate sensor errors by comparing axle-spacing data for those misclassified vehicles. 8.3 Data Analysis An analytical matrix was developed to demonstrate the detailed data analysis used to compare sensor classification data to manual observation for each class. Each value on the top-left-to bottom-right diagonal of the matrix represents the total number of vehicles that were correctly classified by the sensor for that specific classification during the complete test period. The values outside the diagonal represent the number of vehicles that are misclassified by the sensor and, as a result, are considered errors. C11 C12 … C1N
Matrix = C21 C22 … C2N . . . . . . . . . . . . CN1 CN2 … CNN Where: Cij = Sensor-detected counts in class i that actually belong to class j N = Number of classes Sensor correctly detected class i counts = Cij,i=j Sensor incorrectly detected class i counts = Cij,i≠j Total Volume = ∑j∑iCij
Therefore, the overall accuracy is defined as the ratio of the total correctly classified vehicles over the total number of vehicles within the test period.
The overall sensor accuracy in detecting all N classes = ∑j∑i,j=iCij / ∑j∑iCij 8.4 Test Results The test results were extracted based on one hour of data collected during an off-peak period. The test data indicates that the sensors provided accurate results for most vehicle classifications. The overall accuracy ranged from 94% to 97% for all three sensors. The analytical matrices in Appendix D show the detailed results. The accuracy/error for each class should be further investigated using a larger sample size of data as part of a future project.

32
The test results show that the TIRTL misclassified some five-axle, Class-9 semi-trucks into a three-axle Class-6 single-unit truck and a two-axle Class-2 passenger vehicle. This error occurred because the spacing between the last two axles of some of semi-trucks exceeds 40 feet, the spacing threshold programmed for semi-trucks. The TIRTL vendor claimed that this problem is expected to be solved with an updated scheme version. Two discrepancies between the TIRTL and ATR data were observed from the test data. The first one is that the TIRTL classified a vehicle as Class 2 while the ATR classified the same vehicle as Class 3 or vice versa. However, both the TIRTL and ATR classified the same vehicle correctly according to different axle spacings they detected. It is difficult to confirm which one is correct unless those axle spacings for the vehicle are physically measured out in the field. The second discrepancy is that the TIRTL detected the number of axles incorrectly, but classified the vehicle correctly. For example, the TIRTL classified a three-axle Class 3 pickup with a trailer as Class 3 correctly even though it only counted two axles and missed one axle for the trailer. This is because some classes, such as Classes 2 and 3, have several axle and spacing combinations in the classification scheme. It is difficult to avoid such overlaps in scheme definitions. For the purposes of this study, these vehicles were considered correct. The TIRTL sensors undercounted traffic under heavy precipitation conditions during the test. The water spray caused by the vehicle wheels and wet pavement disturbed the infrared beams and caused errors in sensor detection. Such impact needs to be further investigated. The TIRTL sensor has an auto-calibration feature that does not need manual calibration. Free flow traffic is required for sensor calibration. However, optimal performance is heavily dependant on keeping a proper balance and alignment between the transmitter and receiver. The vendor recommended both units be placed such that the infrared beams are aligned horizontally 2 to 3 inches above the crown of the pavement. The sensor interface is user friendly and provides beam strength signals to allow users to verify the sensor’s optimal settings and alignment. Manual verification is necessary to confirm optimal sensor performance before a valid data collection period can occur. Manual verification is accomplished by comparing real-time sensor records against field observations. The TIRTL sensor has 528 megabytes of memory that allows the sensor to store eight million beam-break events. When the memory is full, the sensor will stop collecting data. See Appendix A for a set of sample raw data. However, the total cost for a TIRTL system is much higher than the cost of the pole-mounted PNIT system. The price range is approximate $20,925 to $26, 925 depending on system configuration.

33
Chapter 9 Conclusions
This study has furthered the understanding of the viability of using portable non-intrusive traffic detection systems. The following conclusions can be drawn from the study: The PNITDS system is a simple and safe method for short-term traffic data collection.
System installation and data collection can be conducted without interrupting traffic flow.
The PNITDS system is easy to install. It can be attached to various types of poles or sign posts, including U-channels, I-beams (commonly used for freeways signs), and round poles.
The PNITDS sensors can collect accurate traffic data including volume and speed under both free-flow and heavy traffic levels once the sensor is optimally calibrated. The RTMS and Wavetronix sensors provide a reasonable vehicle length-based classification when the sensors are properly calibrated.
The vehicle speeds provided by the RTMS and Wavetronix sensors are aggregated based on either previous 13 to 16 vehicles or all the vehicles within a specified interval. Sensor detected speed for an interval with a high percentage of commercial trucks can be lower than the actual prevailing speed.
At some locations both the RTMS and Wavetronix sensors count semi-trucks as two vehicles for the closest lane (truck-breakup) and miscount commercial trucks that drive in the closest lane as also driving in the lane next to it (truck-spillover). These phenomena can be effectively minimized by adjusting sensor parameters or lane configuration through the sensor interface or changing sensor mounting configurations when needed.
The PNITDS system has the ability to detect multiple lanes of traffic (maximum eight lanes) in various mounting configurations. The optimal mounting height and offset depends on the vendor-recommended mounting requirements.
Calibration for speed is an iterative process that takes time to obtain optimal settings. A radar gun is the most effective tool to collect sample speed data for field calibration. Historical speed adjustment factors obtained through field experience can be used as references to expedite field calibration.
The accuracy of vehicle length-based classification data can only be confirmed by manual observation during field calibration.
A battery needs to be carefully selected in order to power sensor operations for a pre-determined data collection period. A battery’s electric charge can be calculated based on the sensor power draw, battery output voltage, and data-collection period. A low-voltage disconnect prevents the battery from running completely out of power, and as a result, lengthens battery life.

34
The battery box should be waterproof and should be lockable to protect the box from theft.
The crash-worthiness of the system was not tested in this project. Crash-worthiness concerns are left to each agency’s discretion. There is no safety concern when the system is protected (such as by a guard rail). Otherwise, objects such as the battery box should be less than four inches high when placed in the clear zone, and the pole/sensor portion of the system should be evaluated for crash-worthiness.
The trailer-based PNITDS is easy to set up and provides flexibility in data collection location and sensor mounting configuration because of its mobility. However, the system structure and operation are substantially different from the pole-mounted system. The cost of the system is much higher than that of a pole-mounted PNIT system.
The TIRTL sensor provides accurate results for axle-based vehicle classification detection. It allows the user to define a vehicle classification scheme that matches local needs. The sensor interface is user-friendly and with its auto-calibration feature it does not need manual calibration. Proper balance and alignment between the transmitter and receiver is critical to the TIRTL sensor’s performance. The beam-strength reading allows users to verify the sensor’s optimal settings and alignment.
Severe weather, such as heavy precipitation or snow, affects the TIRTL sensor’s performance and causes traffic to be undercounted. System security may be a concern when the TIRTL units are used for a temporary application without having a permanent enclosure to protect them.

35
Chapter 10 Future Studies
New technologies and devices continue to emerge as manufacturers respond to increasing needs for a variety of traffic-related data to support the implementation of Intelligent Transportation Systems (ITS) and other traffic-related applications. The increasing needs stimulate the development of new technologies and improvement of existing technologies. A comprehensive evaluation of the commercially available newly-developed and updated non-intrusive technologies and devices should be conducted as the next phase of study. The future study will benefit both private and public agencies with the most recent information of NIT sensors to help data collection practitioners select appropriate technologies for different traffic data collection applications. The future study should also focus on assessing sensor capabilities in vehicle classification detection, especially for axle-based classification. The TIRTL sensor will be further investigated for its ability to detect axle-based vehicle classification under various testing conditions. The future study should also explore the possibility of associating the vehicle length-based classification with the axle-based classification and establishing a conversion relationship between these two class schemes. Such information would assist state agencies to provide FHWA classification reports extracted from the length-based classification data collected by the loops or other NIT sensors.

36
References 1. FHWA White paper, Courtesy by Ralph Gillmann, FHWA. 2. FHWA, “Evaluation of Non-intrusive Technologies for Traffic Detection”, Final
Report, September 2002.

A-1
Appendix A Sensor Sample Data
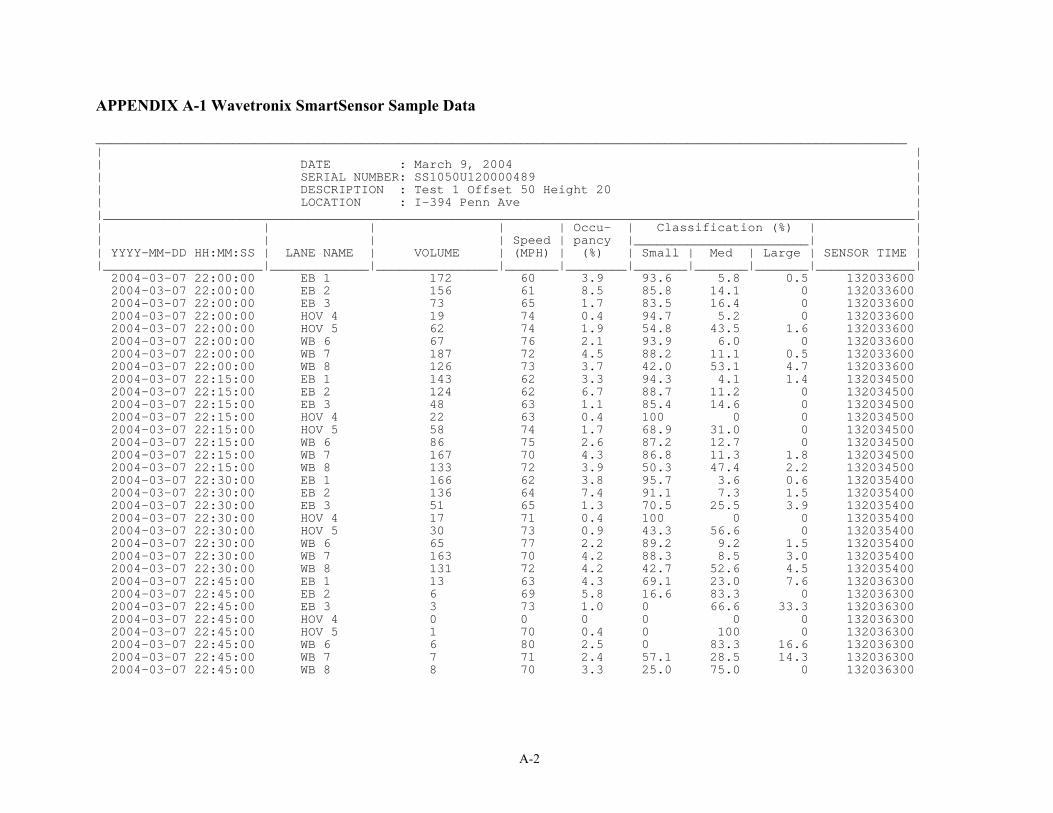
A-2
APPENDIX A-1 Wavetronix SmartSensor Sample Data ___________________________________________________________________________________________________________ | | | DATE : March 9, 2004 | | SERIAL NUMBER: SS1050U120000489 | | DESCRIPTION : Test 1 Offset 50 Height 20 | | LOCATION : I-394 Penn Ave | |___________________________________________________________________________________________________________| | | | | | Occu- | Classification (%) | | | | | | Speed | pancy |_______________________| | | YYYY-MM-DD HH:MM:SS | LANE NAME | VOLUME | (MPH) | (%) | Small | Med | Large | SENSOR TIME | |_____________________|_____________|________________|_______|________|_______|_______|_______|_____________| 2004-03-07 22:00:00 EB 1 172 60 3.9 93.6 5.8 0.5 132033600 2004-03-07 22:00:00 EB 2 156 61 8.5 85.8 14.1 0 132033600 2004-03-07 22:00:00 EB 3 73 65 1.7 83.5 16.4 0 132033600 2004-03-07 22:00:00 HOV 4 19 74 0.4 94.7 5.2 0 132033600 2004-03-07 22:00:00 HOV 5 62 74 1.9 54.8 43.5 1.6 132033600 2004-03-07 22:00:00 WB 6 67 76 2.1 93.9 6.0 0 132033600 2004-03-07 22:00:00 WB 7 187 72 4.5 88.2 11.1 0.5 132033600 2004-03-07 22:00:00 WB 8 126 73 3.7 42.0 53.1 4.7 132033600 2004-03-07 22:15:00 EB 1 143 62 3.3 94.3 4.1 1.4 132034500 2004-03-07 22:15:00 EB 2 124 62 6.7 88.7 11.2 0 132034500 2004-03-07 22:15:00 EB 3 48 63 1.1 85.4 14.6 0 132034500 2004-03-07 22:15:00 HOV 4 22 63 0.4 100 0 0 132034500 2004-03-07 22:15:00 HOV 5 58 74 1.7 68.9 31.0 0 132034500 2004-03-07 22:15:00 WB 6 86 75 2.6 87.2 12.7 0 132034500 2004-03-07 22:15:00 WB 7 167 70 4.3 86.8 11.3 1.8 132034500 2004-03-07 22:15:00 WB 8 133 72 3.9 50.3 47.4 2.2 132034500 2004-03-07 22:30:00 EB 1 166 62 3.8 95.7 3.6 0.6 132035400 2004-03-07 22:30:00 EB 2 136 64 7.4 91.1 7.3 1.5 132035400 2004-03-07 22:30:00 EB 3 51 65 1.3 70.5 25.5 3.9 132035400 2004-03-07 22:30:00 HOV 4 17 71 0.4 100 0 0 132035400 2004-03-07 22:30:00 HOV 5 30 73 0.9 43.3 56.6 0 132035400 2004-03-07 22:30:00 WB 6 65 77 2.2 89.2 9.2 1.5 132035400 2004-03-07 22:30:00 WB 7 163 70 4.2 88.3 8.5 3.0 132035400 2004-03-07 22:30:00 WB 8 131 72 4.2 42.7 52.6 4.5 132035400 2004-03-07 22:45:00 EB 1 13 63 4.3 69.1 23.0 7.6 132036300 2004-03-07 22:45:00 EB 2 6 69 5.8 16.6 83.3 0 132036300 2004-03-07 22:45:00 EB 3 3 73 1.0 0 66.6 33.3 132036300 2004-03-07 22:45:00 HOV 4 0 0 0 0 0 0 132036300 2004-03-07 22:45:00 HOV 5 1 70 0.4 0 100 0 132036300 2004-03-07 22:45:00 WB 6 6 80 2.5 0 83.3 16.6 132036300 2004-03-07 22:45:00 WB 7 7 71 2.4 57.1 28.5 14.3 132036300 2004-03-07 22:45:00 WB 8 8 70 3.3 25.0 75.0 0 132036300

A-3
APPENDIX A-2 EIS RTMS Sample Data RTMS STAT. MESSAGES ZONE: 1 2 3 4 5 6 7 8 I-394 PNIT SPEED IN Kph 09 03 2004 14:20:55 MESSAGE NO. 0 VOLUME: 131 123 114 5 23 97 102 115 LONG VEH: 1 0 3 0 0 0 0 4 STATION ID. 1 OCCUPANCY: 9 9 7 1 1 2 3 6 MID SIZE: 7 10 5 0 0 0 4 3 XLONG VEH: 0 0 0 0 0 0 0 0 FWDLK SPEED ? SIDEFRD SPD: 93 98 106 75 93 102 86 111 09 03 2004 14:25:55 MESSAGE NO. 1 VOLUME: 141 112 119 8 31 77 83 115 LONG VEH: 2 3 3 0 0 0 1 3 STATION ID. 1 OCCUPANCY: 10 8 8 1 1 2 3 5 MID SIZE: 9 6 7 0 3 1 2 0 XLONG VEH: 0 0 0 0 0 0 0 0 FWDLK SPEED ? SIDEFRD SPD: 94 102 115 81 99 109 82 114 09 03 2004 14:30:55 MESSAGE NO. 2 VOLUME: 134 111 111 10 36 85 87 126 LONG VEH: 5 6 2 0 0 1 1 3 STATION ID. 1 OCCUPANCY: 17 10 8 1 1 2 2 6 MID SIZE: 25 10 6 1 1 0 2 3 XLONG VEH: 1 0 1 0 0 0 0 0 FWDLK SPEED ? SIDEFRD SPD: 38 82 88 87 104 107 99 105 09 03 2004 14:35:55 MESSAGE NO. 3 VOLUME: 104 118 155 12 26 82 110 113 LONG VEH: 0 5 3 0 0 0 1 0 STATION ID. 1 OCCUPANCY: 39 19 17 1 1 2 2 5 MID SIZE: 12 16 20 1 0 2 1 2 XLONG VEH: 3 6 0 0 0 0 0 0 FWDLK SPEED ? SIDEFRD SPD: 17 55 71 90 94 112 100 93

A-4
APPENDIX A-3 SmarTek SAS-1 Sample Data
I-394 Station_Location_Text Date Time Lane# Cnt-All Cnt-CT Cnt-TT Occ(%) Avg-Spd Lane# Cnt-All Cnt-CT Cnt-TT Occ(%) Avg-Spd Lane# Cnt-All Cnt-CT Cnt-TT Occ(%) Avg-Spd
4/26/2004 17:30:00 1 300 81 1 6 35 2 325 259 1 6 58 3 438 383 6 8 64 4/26/2004 17:45:00 1 350 218 1 6 49 2 312 266 1 5 61 3 375 348 5 7 67 4/26/2004 18:00:00 1 363 280 0 6 53 2 299 256 0 5 63 3 388 361 2 7 68 4/26/2004 18:15:00 1 369 279 1 6 51 2 322 270 0 6 64 3 328 297 5 6 66 4/26/2004 18:30:00 1 395 295 0 7 52 2 302 259 0 5 63 3 387 353 3 7 67 4/26/2004 18:45:00 1 364 279 1 6 51 2 304 264 1 5 65 3 312 273 5 6 68 4/26/2004 19:00:00 1 320 295 1 6 56 2 302 272 3 5 66 3 250 236 1 5 69 4/26/2004 19:15:00 1 273 255 0 5 58 2 264 249 1 5 67 3 193 181 1 4 71 4/26/2004 19:30:00 1 283 265 0 5 56 2 234 224 0 4 67 3 138 129 1 3 70 4/26/2004 19:45:00 1 246 236 1 4 57 2 243 233 1 5 65 3 126 122 0 2 70 4/26/2004 20:00:00 1 235 220 1 4 54 2 199 185 0 4 65 3 124 114 0 2 66 4/26/2004 20:15:00 1 246 229 0 4 56 2 223 206 2 4 66 3 131 123 0 2 67 4/26/2004 20:30:00 1 241 225 0 4 57 2 191 180 0 4 67 3 143 136 0 3 68 4/26/2004 20:45:00 1 272 258 1 5 55 2 224 210 1 4 66 3 117 108 0 2 69 4/26/2004 21:00:00 1 242 224 0 4 53 2 209 197 0 4 65 3 137 131 0 3 69 4/26/2004 21:15:00 1 288 278 0 5 53 2 218 209 0 4 62 3 131 124 1 3 64 4/26/2004 21:30:00 1 264 221 2 5 50 2 206 195 0 4 59 3 158 147 0 3 63 4/26/2004 21:45:00 1 248 228 0 4 54 2 220 203 0 4 64 3 105 97 0 2 66 4/26/2004 22:00:00 1 219 210 1 4 56 2 173 159 0 3 68 3 114 105 0 2 66 4/26/2004 22:15:00 1 198 191 0 4 55 2 177 166 0 3 65 3 109 102 0 2 65

A-5
APPENDIX A-4 TIRTL Sample Data (Per-Vehicle Record) 5/24/2005,13:22:22,2,-57.9,2,9.96,2,Passenger Car,1116940942661581 (-57.96;18.2;Good) 119.5 (-57.85;17.8;Good) 5/24/2005,13:22:28,1,55.4,2,9.50,2,Passenger Car,1116940948576865 (55.36;17.5;Good) 114.0 (55.36;17.5;None) 5/24/2005,13:22:28,2,-48.4,2,9.83,2,Passenger Car,1116940948680869 (-47.94;0.0;Poor) 118.0 (-48.45;17.7;Good) 5/24/2005,13:22:29,1,53.7,2,9.00,2,Passenger Car,1116940949564606 (53.65;16.7;Good) 108.0 (53.71;15.9;Good) 5/24/2005,13:22:31,2,-37.8,2,10.97,3,Pickup or Van,1116940951354133 (-37.73;17.6;Good) 131.7 (-37.80;17.9;Good) 5/24/2005,13:22:37,1,54.6,2,11.62,3,Pickup or Van,1116940957589427 (54.59;19.6;Good) 139.4 (54.55;19.5;Good) 5/24/2005,13:22:38,2,-56.0,2,8.63,2,Passenger Car,1116940958590636 (-56.05;18.4;Good) 103.5 (-55.93;17.1;Good) 5/24/2005,13:22:42,1,55.3,2,9.63,2,Passenger Car,1116940962407965 (55.26;18.1;Good) 115.5 (55.28;17.4;Good) 5/24/2005,13:22:44,1,56.2,2,11.17,3,Pickup or Van,1116940964656051 (56.33;17.2;Good) 134.1 (56.03;18.0;Good) 5/24/2005,13:22:46,1,53.9,2,11.52,3,Pickup or Van,1116940966461087 (54.04;19.3;Good) 138.2 (53.72;18.4;Good) 5/24/2005,13:22:49,1,53.7,2,8.33,2,Passenger Car,1116940969699703 (53.70;17.0;Good) 100.0 (53.71;16.7;Good) 5/24/2005,13:22:54,1,57.0,2,9.54,2,Passenger Car,1116940974814160 (57.09;17.3;Good) 114.5 (56.99;17.0;Good) 5/24/2005,13:22:55,1,58.0,2,8.59,2,Passenger Car,1116940975930754 (57.78;16.2;Good) 103.1 (58.25;16.4;Good) 5/24/2005,13:22:57,1,55.9,2,8.59,2,Passenger Car,1116940977681368 (56.06;16.1;Good) 103.0 (55.73;15.3;Good) 5/24/2005,13:22:58,1,56.5,2,8.97,2,Passenger Car,1116940978722985 (56.55;15.6;Good) 107.6 (56.53;15.3;Good) 5/24/2005,13:23:01,1,56.7,2,8.84,2,Passenger Car,1116940981030629 (56.69;17.5;Good) 106.1 (56.65;17.1;Good) 5/24/2005,13:23:02,1,57.4,2,11.58,3,Pickup or Van,1116940982287788 (57.41;17.6;Good) 139.0 (57.40;18.8;Good) 5/24/2005,13:23:04,1,55.9,2,11.53,3,Pickup or Van,1116940984081203 (55.89;18.8;Good) 138.3 (55.87;17.9;Good) 5/24/2005,13:23:10,1,59.2,2,8.57,2,Passenger Car,1116940990434448 (59.31;16.7;Good) 102.8 (59.15;16.2;Good) 5/24/2005,13:23:16,2,-60.2,2,17.28,5,2 Axle Single Unit,1116940996783040 (-60.17;22.3;Good) 207.4 (-60.14;21.9;Good) 5/24/2005,13:23:20,1,54.1,2,9.08,2,Passenger Car,1116941000241488 (54.18;16.9;Good) 108.9 (54.12;15.9;Good) 5/24/2005,13:23:21,1,52.6,2,10.01,2,Passenger Car,1116941001533734 (52.60;18.3;Good) 120.1 (52.53;17.2;Good) 5/24/2005,13:23:27,2,-45.7,2,8.46,2,Passenger Car,1116941007330512 (-45.55;18.4;Good) 101.5 (-45.77;18.4;Good) 5/24/2005,13:23:28,2,-51.1,2,10.66,3,Pickup or Van,1116941008056610 (-51.65;18.6;Good) 127.9 (-50.51;17.7;Good) 5/24/2005,13:23:38,2,-53.8,2,10.55,3,Pickup or Van,1116941018176246 (-53.60;18.9;Good) 126.6 (-53.99;18.7;Good) 5/24/2005,13:23:40,2,-58.0,2,9.94,2,Passenger Car,1116941020315719 (-57.79;20.4;Good) 119.3 (-58.14;20.6;Good) 5/24/2005,13:23:43,1,40.8,2,9.53,2,Passenger Car,1116941023284476 (40.90;17.4;Good) 114.4 (40.77;16.7;Good) 5/24/2005,13:23:43,2,-57.3,2,9.37,2,Passenger Car,1116941023544095 (-57.21;18.0;Good) 112.5 (-57.33;18.0;Good) 5/24/2005,13:23:44,1,39.9,2,8.94,2,Passenger Car,1116941024257768 (39.82;17.4;Good) 107.2 (40.03;17.2;Good)

B-1
Appendix B RTMS and Wavetronix Length-based Classification Test Data

B-2
APPENDIX B-1 Wavetronix Length-based Vehicle Classification Test Results
Wawtronix 23-Jun-05 9:30 AM to 10:30 AM Height 25'
50' Offset
Small Medium Large Summary
Lane Sensor Manual Diff Sensor Manual Diff Sensor Manual Diff Total Error %
Error 1 1219 1226 -7 58 46 12 37 42 -5 1314 12 0.9% 2 924 953 -29 64 33 31 45 47 -2 1033 31 3.0% 3 1162 1172 -10 30 19 11 5 6 -1 1197 11 0.9%
Wawtronix 22-Mar-
05 10:00 AM to 11:00 AM 17' Height
22' Offset
Small Medium Large Summary
Lane Sensor Manual Diff Sensor Manual Diff Sensor Manual Diff Total Error %
Error 1 1398 1365 33 54 69 -15 32 50 -18 1484 51 3.4% 2 1148 1128 20 58 40 18 23 61 -38 1229 58 4.7% 3 1079 1093 -14 28 17 11 4 1 3 1111 17 1.5%
Wawtronix 22-Mar-
05 5:00 PM to 6:00 PM 17' Height
22' Offset
Small Medium Large Summary
Lane Sensor Manual Diff Sensor Manual Diff Sensor Manual Diff Total Error %
Error 1 1303 1368 -65 68 16 52 21 8 13 1392 78 5.6% 2 1373 1381 -8 23 14 9 10 11 -1 1406 9 0.6% 3 1643 1645 -2 40 42 -2 11 7 4 1694 6 0.4%

B-3
APPENDIX B-2 RTMS Length-based Vehicle Classification Test Results
RTMS 21-Jun-
04 9:35 AM to 10:35 AM 17' Height 22' Offset
Small Medium Large Summary
Lane Sensor Manual Diff Sensor Manual Diff Sensor Manual Diff Total Error %
Error 1 1329 1286 43 37 69 -32 36 47 -11 1402 54 3.9% 2 1277 1274 3 44 47 -3 42 42 0 1363 3 0.2% 3 1239 1240 -1 25 28 -3 13 9 4 1277 5 0.4%
RTMS 21-Jun-
04 9:35 AM to 10:35 AM 25' Height 50' Offset
Small Medium Large Summary
Lane Sensor Manual Diff Sensor Manual Diff Sensor Manual Diff Total Error %
Error 1 1349 1301 48 35 69 -34 33 47 -14 1417 62 4.4% 2 1210 1201 9 44 47 -3 36 42 -6 1290 15 1.2% 3 1212 1204 8 18 28 -10 11 9 2 1241 10 0.8%
RTMS 29-Mar-
05 10:00 AM to 11:00 AM 17' Height 22' Offset
Small Medium Large Summary
Lane Sensor Manual Diff Sensor Manual Diff Sensor Manual Diff Total Error %
Error 1 1523 1512 11 67 69 -34 44 53 -9 1634 20 1.2% 2 2025 2040 -15 113 86 -3 52 64 -12 2190 27 1.2% 3 1975 2000 -25 38 9 -10 6 10 -4 2019 29 1.4%

C-1
Appendix C Mn/DOT Axle-based Classification Definition and Scheme

C-2
APPENDIX C-1 Mn/DOT Axle-based Vehicle Classification Definition
Class No of Axles Description 1 2 Motocycles 2 2 Passenger Vehicles 3 3 Pickup Trucks 4 2,4,5,6 Buses/Trucks with Trailers 5 2 2-Axle Single Unit Trucks 6 3 3-Axle Single Unit Trucks 7 4 4-Axle Single Unit Trucks 8 3,4 3- and 4-Axle Semi Trucks 9 5 5-Axle Semi Trucks 10 6 6-Axle Semi Trucks 11 5 5-Axle Twin Trailer Semi Trucks 12 6 6-Axle Twin Trailer Semi Trucks 13 7+ 7-Axle Twin Trailer Semi Trucks 14 Others 15 Non Classified

C-3
APPENDIX C-2 Mn/DOT Axle-based Vehicle Classification Scheme
NUM_AXLE
S
CLASS
AXLE_S
PACE_1
AX_SPC_1
_END
AXLE_S
PACE_2
AX_SPC_2
_END
AXLE_S
PACE_3
AX_SPC_3
_END
AXLE_S
PACE_4
AX_SPC_4
_END
AXLE_S
PACE_5
AX_SPC_5
_END
AXLE_S
PACE_6
AX_SPC_6
_END
2 1 1 6.0 0 0 0 0 0 0 0 0 0 02 2 6 10.1 0 0 0 0 0 0 0 0 0 02 3 10.1 13.7 0 0 0 0 0 0 0 0 0 02 4 24 40.1 0 0 0 0 0 0 0 0 0 02 5 13.7 24.0 0 0 0 0 0 0 0 0 0 03 2 6 10.1 3 20.1 0 0.0 0 0.0 0 0.0 0 0.03 3 10.1 13.7 6 22.1 0 0.0 0 0.0 0 0.0 0 0.03 4 24 40.1 3 40.1 0 0.0 0 0.0 0 0.0 0 0.03 6 10.1 22.2 2 6.0 0 0.0 0 0.0 0 0.0 0 0.03 8 9 24.1 22 40.1 0 0.0 0 0.0 0 0.0 0 0.03 5 13.7 24.1 6 20.1 0 0.0 0 0.0 0 0.0 0 0.03 1 1 6.0 1 8.0 0 0.0 0 0.0 0 0.0 0 0.04 4 13.7 22.2 6 30.1 1 20.1 0 0.0 0 0.0 0 0.04 2 1 10.1 6 20.1 1 20.1 0 0.0 0 0.0 0 0.04 3 10.1 13.7 6 25.1 1 20.1 0 0.0 0 0.0 0 0.04 7 6 22.2 1 6.0 1 8.1 0 0.0 0 0.0 0 0.04 8 11 13.8 1 6.0 1 40.1 0 0.0 0 0.0 0 0.04 8 11 13.8 20.1 40.1 3.4 8.1 0 0.0 0 0.0 0 0.04 4 24 40.1 2 40.1 1 40.1 0 0.0 0 0.0 0 0.04 4 10.1 24.1 2 6.0 8.1 20.1 0 0.0 0 0.0 0 0.05 4 6 22.2 1 6.0 6 11.1 3 8.1 0 0.0 0 0.05 7 10.1 22.2 1 6.0 1 8.1 8.1 20.1 0 0.0 0 0.05 9 6 25.1 3 6.0 11.1 45.1 3 15.1 0 0.0 0 0.05 9 6 19.6 6 40.1 3 8.1 3 8.1 0 0.0 0 0.05 11 6 19.6 15.1 25.1 6 20.1 15.1 25.1 0 0.0 0 0.05 3 6 13.7 6 25.1 1 3.0 1 3.0 0 0.0 0 0.05 7 6 19.6 1 6.0 3 6.0 3 8.1 0 0.0 0 0.06 4 10.1 22.2 2 5.1 8.1 18.3 2 5.1 2 5.1 0 0.06 4 6 22.2 1 6.0 1 25.1 8 25.1 1 20.1 0 0.06 10 6 25.1 3 6.1 18.2 40.1 3 15.1 3 8.1 0 0.06 12 8 40.1 1 8.1 8 45.1 1 8.1 8.1 40.1 0 0.06 7 6 22.2 1 6.0 1 8.1 1 8.1 1 8.1 0 0.07 7 6 19.6 1 6.0 1 8.1 1 8.1 1 8.1 1 8.17 10 6 25.1 3 6.1 8 45.1 3 15.1 3 8.1 3 8.17 13 8 40.1 1 8.1 8 40.1 1 8.1 8 40.1 8.1 40.1

D-1
Appendix D TIRTL Classification Test Results

D-2
APPENDIX D TIRTL Classification Test Results TIRTL Unit 1
Summary1 2 3 4 5 6 7 8 9 10
1 5 1 1 12 568 1 1 13 274 2 3 14 25 1 226 5 878 3 19 33
10 1Not Recorded
5 568 274 2 22 5 0 3 33 1 9135 568 275 6 26 5 0 5 44 1 935
Overall Accuracy 97.6%
TIRTL 2Summary
1 2 3 4 5 6 7 8 9 101 5 1 12 569 1 1 13 275 2 2 14 25 1 226 5 878 3 19 33
10 1Not Recorded
5 569 275 2 22 5 0 3 33 1 9155 569 276 6 25 5 0 5 44 1 936
97.8%
TIRTL 3Summary
1 2 3 4 5 6 7 8 9 101 5 12 564 13 251 1 14 55 2 14 1 18 16 5 878 1 9 5 1 3 29 33
10 1Not Recorded 1
5 564 251 0 18 5 0 3 33 1 8805 570 275 6 25 5 0 5 44 1 936
94.0%
TIR
TL U
nit 1
Classifications
Manual
TIR
TLE
Uni
t 2
Classifications
Correctly ClassifiedTotal
Manual
Manual
TIR
TL U
nit 3
Classifications
Total CountCorrectly Classified
Overall Accuracy
Overall Accuracy
Correctly ClassifiedTotal Count