EVALUATION OF PHYSICAL FITNESS BEFORE AND AFTER …
14
www.wjpr.net Vol 7, Issue 15, 2018. 923 EVALUATION OF PHYSICAL FITNESS BEFORE AND AFTER WEIGHT TRAINING EXERCISE Chandrakant Jawale* Associate Professor, D. P. Bhosale College, Koregaon, Satara Maharashtra, India. ABSTRACT Regular exercise, yoga and recreation play very important role in developing and maintaining an optimal level of good health, performance and appearance. It also have beneficial effects on most of the organ system and helps to prevent many health problem and diseases. Government of India has launched the B.Sc. I students organization in 198 to Channelist the young energy in constructive works and to mould their character, spirit of sponsorship and create force of disciplined and trained manpower which help in national emergency. INTRODUCTION Exercise physiology in India is relatively new development. Teaching of physiology as a basic science was started in the year 1913 at Calcutta University preliminary research was carried out on energy metabolism, measurement of body surface area and changes in blood chemistry (Sen 1954, Banerjee & Sen 1955). During the 1960’s various scientists started research work on work physiology, respiratory physiology, metabolic changes and biochemical changes related to exercise and stress. International scientific congress of sports science was held in Patiala in 1982. Scientist from all over the world took part in discussion. The scientist on National Institute of sports discussed variety of topics related to sports performance, physical variables, influence of training load and recovery, physiology changes at altitude etc. physiology has always been the basis for clinical medicine. In the same manner, exercise physiology has provided essential knowledge for physical fitness and health promotions. The present study has been carried out to evaluate physiological profile, training and adoption in B.Sc. I students in response to exercise and their routine N.C.C. activities. The present World Journal of Pharmaceutical Research SJIF Impact Factor 8.074 Volume 7, Issue 15, 923-936. Research Article ISSN 2277– 7105 Article Received on 12 June 2018, Revised on 03 July 2018, Accepted on 24 July 2018 DOI: 10.20959/wjpr201815-13034 *Corresponding Author Chandrakant Jawale Associate Professor, D. P. Bhosale College, Koregaon, Satara Maharashtra, India.
Transcript of EVALUATION OF PHYSICAL FITNESS BEFORE AND AFTER …

www.wjpr.net Vol 7, Issue 15, 2018.
923
Jawale. World Journal of Pharmaceutical Research
EVALUATION OF PHYSICAL FITNESS BEFORE AND AFTER
WEIGHT TRAINING EXERCISE
Chandrakant Jawale*
Associate Professor, D. P. Bhosale College, Koregaon, Satara Maharashtra, India.
ABSTRACT
Regular exercise, yoga and recreation play very important role in
developing and maintaining an optimal level of good health,
performance and appearance. It also have beneficial effects on most of
the organ system and helps to prevent many health problem and
diseases. Government of India has launched the B.Sc. I students
organization in 198 to Channelist the young energy in constructive
works and to mould their character, spirit of sponsorship and create
force of disciplined and trained manpower which help in national
emergency.
INTRODUCTION
Exercise physiology in India is relatively new development. Teaching of physiology as a
basic science was started in the year 1913 at Calcutta University preliminary research was
carried out on energy metabolism, measurement of body surface area and changes in blood
chemistry (Sen 1954, Banerjee & Sen 1955). During the 1960’s various scientists started
research work on work physiology, respiratory physiology, metabolic changes and
biochemical changes related to exercise and stress. International scientific congress of sports
science was held in Patiala in 1982. Scientist from all over the world took part in discussion.
The scientist on National Institute of sports discussed variety of topics related to sports
performance, physical variables, influence of training load and recovery, physiology changes
at altitude etc. physiology has always been the basis for clinical medicine. In the same
manner, exercise physiology has provided essential knowledge for physical fitness and health
promotions.
The present study has been carried out to evaluate physiological profile, training and adoption
in B.Sc. I students in response to exercise and their routine N.C.C. activities. The present
World Journal of Pharmaceutical Research SJIF Impact Factor 8.074
Volume 7, Issue 15, 923-936. Research Article ISSN 2277– 7105
Article Received on
12 June 2018,
Revised on 03 July 2018,
Accepted on 24 July 2018
DOI: 10.20959/wjpr201815-13034
*Corresponding Author
Chandrakant Jawale
Associate Professor, D. P.
Bhosale College, Koregaon,
Satara Maharashtra, India.

www.wjpr.net Vol 7, Issue 15, 2018.
924
Jawale. World Journal of Pharmaceutical Research
investigations will be useful for all sports persons in general and for N.C.C. cadets in
particular from the point of view of assessment of physical fitness as well as specific training
present study has great physiological significance with respect to the selection criteria for
entry in all branches of non commissioned officers of all the three wings of Indian Army. The
observations made in present study will be useful for coaches, instructors int the Army and
sports training centre’s.
MATERIAL AND METHOD
The present study was undertaken from selected Sixty B.Sc. I students from our college
(D.P.Bhosale College, Koregaon.). These sixty B.Sc. I students assessed for their socio
economic information by a standard questionnaire. A questionnaire was used to collect
information of B.Sc. I students concern with age, class, habit, parents economic status and
history health status. A control subjects were also studies from same class as other students.
The B.Sc. I students selected form the 1st
year of enrolment record of their entry in N.C.C.
training. Along with weekly routing N.C.C. parade; the physical training including 2.4 km.
run, 5 meter shuttle, 20 sit up and 30 push up given to the cadet from July 2009 to March
2010.
Physical examination and laboratory investigation
A) Anthropometric measurements
Height and weight were recorded with standard techniques by measuring scale and weighing
machine.
B) Physiological Responses
The physiological responses of individual changes with the exercise. So physiological
responses were studied before and after the completion on two years N.C.C. and physical
training.
1. Lung function test: Peak expiratory flow rate (PEER) of Non B.Sc. I students recorded by
using peak flow meter. The basis of peak expiratory flow rate for monitoring of ventilator
function was established by Wright and McKerrow (1959). To find out Peak Flow Expiratory
Rate; the mouth piece was attached to mouth of cadet. The peak flow meter was brought in
front of mouth in standing posture and held in the hand with grip. Mouth piece was inserted
in mouth, lips were tightly closed and cadets was told to fill up lungs by deep breath taken

www.wjpr.net Vol 7, Issue 15, 2018.
925
Jawale. World Journal of Pharmaceutical Research
forcefully and asked to expire the air form the lungs to peak flow meter. The procedure was
repeated three time and value was recorded in liter/min.
2. Grip strength: The grips strength of right and left hand and horizontal position were
recorded.
3. Physical fitness: Physical fitness of B.Sc. I students as control were recorded by standard
Harward step test. The cadets were asked to step on up and down from the bench 30 times per
minute for 5 minute of until to fatigue by steps. Immediately after the exercise cadets were
asked to sit down. The pluses rate counted from 1 to 11/2 minute after exercise. The fitness
index (F.I.) was calculated after exercise from the following formula.
Duration of exercise in sec. X100X0.8
Fitness Index =
5.5 X pulse counted
The grading score was calculated and done as follows:
Grade Fitness Indes
Poor Below 50
Lower Average 50 – 60
High Average 65 – 80
Good 80 – 90
Excellent Above 90
D) Hematological examinations
1. Haemoglobin concentration: The haemoglobin concentration of B.Sc. I students and Non
B.Sc. I students as control was estimated before and after N.C.C. training. The haemoglobin
concentration was studied by Satili’s Haemometer.
OBSERVATIONS AND RESULTS
National cadet corps is considered as second ling of defiance; by keeping in view in mind; the
youth of the country trained and motivated to fulfill the need of nation. Mostly the N.C.C.
cadets join as commissioned and non commissioned cadet of Indian Army, Rigorous training
during their school and college life help to improve their overall body development,
personality, discipline etc. which also helpful to them in other various jobs than army. Along
with the N.C.C. training, exercise like running, push up, sit up and 5 meter shuttle help to
develop the muscles strength, flexibility and speed in body movements.

www.wjpr.net Vol 7, Issue 15, 2018.
926
Jawale. World Journal of Pharmaceutical Research
The questionnaire survey has recorded that all the B.Sc. I students are physically fit for their
weekly routine N.C.C. training. Most of the cadets are from rural area and their socio-
economic conditions are very poor.
1) Physiological profile of B.Sc. I students
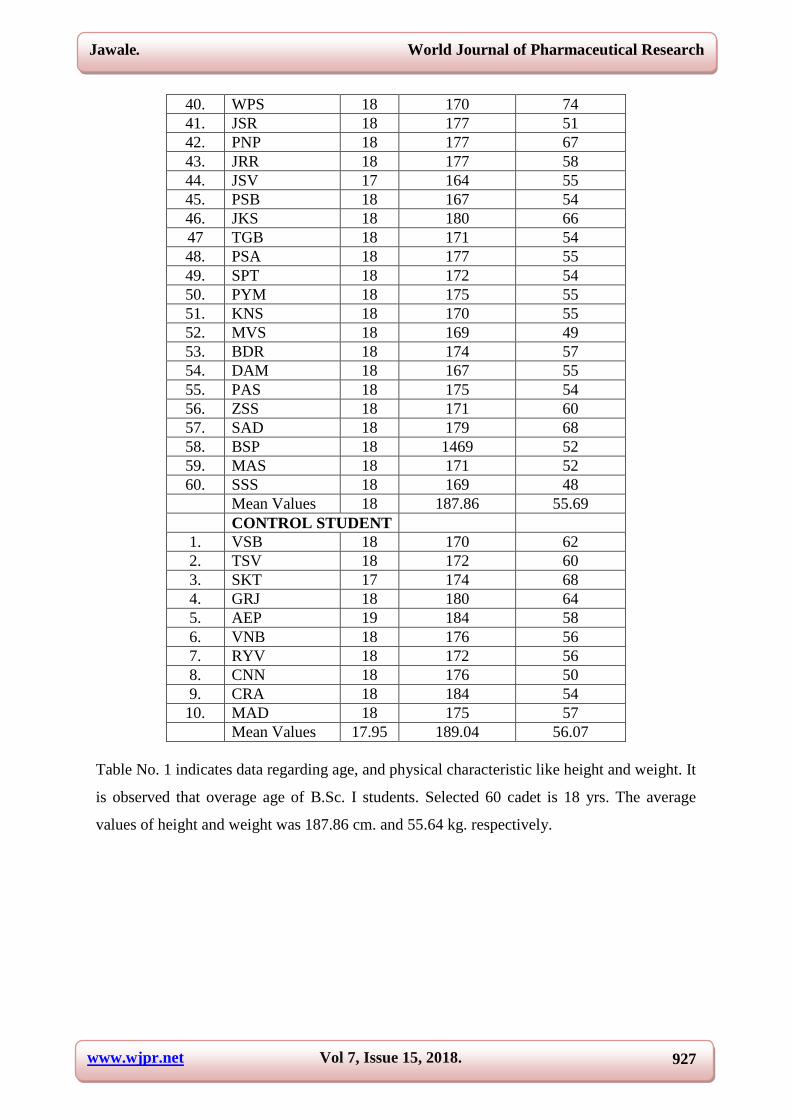
Table No.1
Sr.No. Name Age Height in Cms. Weight in Kg.
1. BNV 18 178 64
2. KMP 18 173 49
3. JSM 18 167 50
4. LJR 18 173 51
5. BMA 18 184 67
6. CMS 18 175 57
7. DSD 18 171 56
8. BAL 18 180 57
9. RNS 18 175 59
10. MVB 18 174 51
11. CRV 18 167 50
12. SAG 18 170 55
13. GAV 18 177 56
14. GGP 18 165 47
15. PBV 18 170 60
16. IRP 18 166 52
17. JDV 18 166 45
18. CVS 18 167 68
19. GVB 18 172 55
20. KPA 18 170 55
21. BVR 18 171 56
22. PAA 17 174 47
23. GVB 18 170 64
24. JMS 18 176 52
25. SAB 18 168 64
26. JSS 18 167 56
27. KPS 17 172 50
28. MSB 18 168 56
29. GSR 18 166 61
30. GRA 18 168 53
31. GVS 18 166 65
32. YMY 18 168 57
33. KVK 18 169 53
34. PDH 18 166 54
35. GKG 18 170 54
36. GSB 18 170 52
37. KAR 18 169 58
38. GSR 18 170 50
39. KSD 18 175 55
www.wjpr.net Vol 7, Issue 15, 2018.
927
Jawale. World Journal of Pharmaceutical Research
40. WPS 18 170 74
41. JSR 18 177 51
42. PNP 18 177 67
43. JRR 18 177 58
44. JSV 17 164 55
45. PSB 18 167 54
46. JKS 18 180 66
47 TGB 18 171 54
48. PSA 18 177 55
49. SPT 18 172 54
50. PYM 18 175 55
51. KNS 18 170 55
52. MVS 18 169 49
53. BDR 18 174 57
54. DAM 18 167 55
55. PAS 18 175 54
56. ZSS 18 171 60
57. SAD 18 179 68
58. BSP 18 1469 52
59. MAS 18 171 52
60. SSS 18 169 48
Mean Values 18 187.86 55.69
CONTROL STUDENT
1. VSB 18 170 62
2. TSV 18 172 60
3. SKT 17 174 68
4. GRJ 18 180 64
5. AEP 19 184 58
6. VNB 18 176 56
7. RYV 18 172 56
8. CNN 18 176 50
9. CRA 18 184 54
10. MAD 18 175 57
Mean Values 17.95 189.04 56.07
Table No. 1 indicates data regarding age, and physical characteristic like height and weight. It
is observed that overage age of B.Sc. I students. Selected 60 cadet is 18 yrs. The average
values of height and weight was 187.86 cm. and 55.64 kg. respectively.

www.wjpr.net Vol 7, Issue 15, 2018.
928
Jawale. World Journal of Pharmaceutical Research
Table No. 2: Physical fitness score of b.sc. i students before and after weight training.
Sr.No. Name Fitness before
Training Classification
Fitness after
Training Classification
1. BNV 67.13 H.A. 79.33 H.A.
2. KMP 68.18 H.A. 80.80 Good
3. JSM 58.96 Poor 68.18 H.A.
4. LJR 54.54 Poor 75.55 H.A.
5. BMA 67.13 H.A. 79.33 H.A.
6. CMS 76.55 H.A. 85.70 Good
7. DSD 66.11 H.A. 77.92 H.A.
8. BAL 63.33 L.A. 72.72 H.A.
9. RNS 69.26 H.A. 82.33 Good
10. MVB 74.00 H.A. 89.05 Good
11. CRV 71.53 H.A. 85.56 Good
12. SAG 63.33 L.A. 72.72 H.A.
13. GAV 63.24 L.A. 73.95 H.A.
14. GGP 87.27 Good 109.09 Excellent
15. PBV 67.13 H.A. 79.33 H.A.
16. IRP 66.11 H.A. 77.92 H.A.
17. JDV 85.86 Good 91.88 Excellent
18. CVS 61.00 L.A. 70.38 H.A.
19. GVB 76.55 H.A. 92.84 Excellent
20. KPA 63.33 L.A. 72.72 H.A.
21. BVR 72.72 H.A. 104.06 Excellent
22. PAA 61.00 L.A. 74.40 H.A.
23. GVB 70.38 H.A. 83.91 Good
24. JMS 62.86 L.A. 74.40 H.A.
25. SAB 72.72 H.A. 106.66 Excellent
26. JSS 67.13 H.A. 96.96 Excellent
27. KPS 62.20 L.A. 72.40 H.A.
28. MSB 66.11 H.A. 78.24 H.A.
29. GSR 63.33 L.A. 72.70 H.A.
30. GRA 64.17 L.A. 75.23 H.A.
31. GVS 62.33 L.A. 84.01 Good
32. YMY 68.74 H.A. 98.66 Excellent
33. KVK 70.72 H.A. 106.66 Excellent
34. PDH 63.33 L.A. 74.72 H.A.
35. GKG 79.33 H.A. 96.96 Excellent
36. GSB 84.01 H.A. 98.89 Excellent
37. KAR 85.56 Good 106.43 Excellent
38. GSR 72.72 H.A. 104.66 Excellent
39. KSD 77.55 H.A. 90.90 Excellent
40. WPS 70.38 H.A. 83.91 Good
41. JSR 58.96 Poor 68.18 H.A.
42. PNP 55.23 Poor 83.24 Good
43. JRR 94.86 Excellent 108.21 Excellent
44. JSV 81.00 H.A. 99.17 Excellent
45. PSB 62.33 L.A. 84.01 Good

www.wjpr.net Vol 7, Issue 15, 2018.
929
Jawale. World Journal of Pharmaceutical Research
46. JKS 75.55 H.A. 96.43 Excellent
47 TGB 70.72 H.A. 87.27 Good
48. PSA 77.55 H.A. 90.90 Excellent
49. SPT 87.27 Good 109.09 Excellent
50. PYM 66.11 H.A. 77.92 H.A.
51. KNS 71.53 H.A. 85.56 Good
52. MVS 85.56 Good 96.43 Excellent
53. BDR 72.72 H.A. 87.27 Good
54. DAM 70.38 H.A. 93.91 Excellent
55. PAS 73.02 H.A. 94.86 Excellent
56. ZSS 63.24 L.A. 72.72 H.A.
57. SAD 66.10 H.A. 78.14 H.A.
58. BSP 79.33 H.A. 96.96 Excellent
59. MAS 60.18 L.A. 74.22 H.A.
60. SSS 63.33 L.A. 72.72 H.A.
Mean Values 72.15 H.A. 88.66 Good
CONTROL STUDENT
1. VSB 67.13 H.A. 76.12 H.A.
2. TSV 63.33 L.A. 72.72 H.A.
3. SKT 85.56 Good 91.88 L.A.
4. GRJ 63.40 L.A. 74.40 H.A.
5. AEP 54.54 L.A. 64.30 H.A.
6. VNB 63.33 L.A. 72.72 L.A.
7. RYV 68.26 H.A. 72.33 H.A.
8. CNN 58.96 L.A. 64.33 Excellent
9. CRA 64.17 L.A. 75.23 H.A.
10. MAD 62.33 L.A. 74.10 H.A.
Mean Values 65.13 H.A. 73.81 H.A.
Table No. 2 shows physical fitness score before and after training, which was measured by
using Hayward step test. The average fitness score index was 72.15 which can be classified
as good fitness score, before the training. The average fitness score index observed after
training was 88.60 which can be classified as excellent.
Table No. 3: Peak expiratory fow rate of b.sc. i student before and after weight training
exercise.
Sr.No. Name PEER in 1/min
before training
PEER in 1/min
before training
1. BNV 530 600
2. KMP 440 500
3. JSM 415 520
4. LJR 560 620
5. BMA 530 600
6. CMS 540 600
7. DSD 460 510
8. BAL 545 620

www.wjpr.net Vol 7, Issue 15, 2018.
930
Jawale. World Journal of Pharmaceutical Research
9. RNS 505 540
10. MVB 555 590
11. CRV 495 540
12. SAG 465 490
13. GAV 515 550
14. GGP 480 520
15. PBV 385 450
16. IRP 530 580
17. JDV 480 520
18. CVS 565 590
19. GVB 575 620
20. KPA 460 510
21. BVR 555 610
22. PAA 460 490
23. GVB 385 430
24. JMS 415 460
25. SAB 625 650
26. JSS 520 600
27. KPS 440 500
28. MSB 450 500
29. GSR 480 540
30. GRA 545 600
31. GVS 415 495
32. YMY 510 600
33. KVK 570 610
34. PDH 400 480
35. GKG 525 580
36. GSB 475 520
37. KAR 505 560
38. GSR 460 500
39. KSD 465 490
40. WPS 5604 600
41. JSR 585 630
42. PNP 535 560
43. JRR 500 560
44. JSV 520 580
45. PSB 580 640
46. JKS 460 510
47 TGB 410 480
48. PSA 425 500
49. SPT 390 440
50. PYM 480 530
51. KNS 485 530
52. MVS 445 500
53. BDR 580 620
54. DAM 440 480
55. PAS 450 485
56. ZSS 440 490

www.wjpr.net Vol 7, Issue 15, 2018.
931
Jawale. World Journal of Pharmaceutical Research
57. SAD 460 520
58. BSP 450 500
59. MAS 445 570
60. SSS 480 530
Mean Values 494 548
CONTROL STUDENT
1. VSB 520 540
2. TSV 540 565
3. SKT 480 520
4. GRJ 405 445
5. AEP 410 564
6. VNB 515 580
7. RYV 485 540
8. CNN 420 460
9. CRA 505 520
10. MAD 545 540
Mean Values 483 518
Table No.3 indicates peak expiratory flow rate (PEER) of B.Sc. I students before and after
training. The average PEER values are 494 μ/min before training and 518 μ/min after
training.
Table No. 4: Physical fitness score of b.sc. I students before and after weight training
exercise.
Sr.No. Name
Grip Strength in kg before
Training
Grip Strength in kg after
Training
Right hand Left hand Right hand Left hand
1. BNV 36 29 44 42
2. KMP 29 29 56 58
3. JSM 26 25 38 36
4. LJR 26 34 56 53
5. BMA 40 30 58 52
6. CMS 39 38 52 52
7. DSD 36 37 52 50
8. BAL 39 41 52 48
9. RNS 26 24 40 36
10. MVB 37 35 40 42
11. CRV 39 35 48 42
12. SAG 32 24 52 48
13. GAV 32 35 45 42
14. GGP 35 28 34 41
15. PBV 35 34 42 40
16. IRP 35 31 48 42
17. JDV 30 32 48 52
18. CVS 38 40 52 48
19. GVB 29 29 56 58

www.wjpr.net Vol 7, Issue 15, 2018.
932
Jawale. World Journal of Pharmaceutical Research
20. KPA 33 34 48 47
21. BVR 31 30 42 40
22. PAA 25 25 40 38
23. GVB 34 32 49 45
24. JMS 35 35 52 50
25. SAB 42 38 54 46
26. JSS 44 45 56 54
27. KPS 30 32 40 46
28. MSB 39 34 47 44
29. GSR 41 34 52 46
30. GRA 29 27 56 53
31. GVS 31 30 42 40
32. YMY 39 39 56 58
33. KVK 29 27 44 40
34. PDH 35 33 45 49
35. GKG 38 33 47 43
36. GSB 38 30 47 45
37. KAR 41 42 56 58
38. GSR 29 26 44 42
39. KSD 33 37 44 48
40. WPS 43 42 50 48
41. JSR 32 29 44 38
42. PNP 35 30 46 42
43. JRR 30 34 40 46
44. JSV 36 39 58 56
45. PSB 35 30 49 46
46. JKS 47 44 56 54
47 TGB 38 36 47 46
48. PSA 43 43 53 52
49. SPT 4o 32 49 46
50. PYM 29 31 47 52
51. KNS 27 20 56 53
52. MVS 29 29 36 34
53. BDR 40 34 58 54
54. DAM 38 35 47 52
55. PAS 30 39 42 45
56. ZSS 47 41 54 48
57. SAD 38 40 47 52
58. BSP 31 35 44 48
59. MAS 35 26 42 34
60. SSS 35 37 54 57
Mean Values 35 33 47
CONTR30OL STUD29ENT
1. VSB 38 42 42 44
2. TSV 29 26 30 32
3. SKT 30 34 40 42
4. GRJ 30 32 36 40
5. AEP 36 37 38 44

www.wjpr.net Vol 7, Issue 15, 2018.
933
Jawale. World Journal of Pharmaceutical Research
6. VNB 26 24 36 48
7. RYV 37 35 38 46
8. CNN 31 34 38 42
9. CRA 29 20 38 40
10. MAD 35 30 40 44
Mean Values 32 31 38 42
Table No. 4 indicates the Grip strength of B.Sc. I students before and after training. The
average grip strength values for right hand left hand are 35 and 33 in kg. for before training,
while the average grip strength values for a right hand and left hand are 48 and 47 in kg for
after training.
Table No. 5: Peak expiratory fow rate of b.sc. i student before and after weight training
exercise.
Sr.No. Name PEER in 1/min
before training PEER in 1/min before training
1. BNV 12.00 13.00
2. KMP 11.80 12.40
3. JSM 11.80 13.20
4. LJR 12.80 14.20
5. BMA 12.60 13.60
6. CMS 11.80 12.60
7. DSD 12.00 13.20
8. BAL 11.80 12.40
9. RNS 13.20 14.40
10. MVB 12.80 13.00
11. CRV 11.20 13.20
12. SAG 10.80 12.20
13. GAV 11.20 13.00
14. GGP 10.80 12.60
15. PBV 11.20 13.00
16. IRP 14.20 14.00
17. JDV 11.60 12.40
18. CVS 12.40 14.20
19. GVB 11.20 12.40
20. KPA 11.20 12.40
21. BVR 12.40 13.20
22. PAA 10.80 11.40
23. GVB 12.40 13.80
24. JMS 11.60 13.20
25. SAB 13.20 14.60
26. JSS 12.80 13.20
27. KPS 13.20 13.60
28. MSB 12.40 13.80
29. GSR 12.40 13.00
30. GRA 11.20 13.80

www.wjpr.net Vol 7, Issue 15, 2018.
934
Jawale. World Journal of Pharmaceutical Research
31. GVS 12.00 13.40
32. YMY 1080 12.60
33. KVK 11.80 12.670
34. PDH 12.40 13.20
35. GKG 12.20 14.20
36. GSB 12.40 12.60
37. KAR 12.00 13.20
38. GSR 12.40 13.60
39. KSD 11.00 12.60
40. WPS 11.20 13.20
41. JSR 14.00 14.40
42. PNP 12.10 14.20
43. JRR 12.80 13.60
44. JSV 14.00 14.20
45. PSB 12.80 13.40
46. JKS 14.20 14.40
47 TGB 13.40 14.00
48. PSA 13.00 14.40
49. SPT 14.00 14.20
50. PYM 13.80 14.40
51. KNS 13.10 14.20
52. MVS 13.10 14.40
53. BDR 11.00 13.20
54. DAM 14.00 14.80
55. PAS 11.40 12.60
56. ZSS 13.00 14.20
57. SAD 14.80 16.20
58. BSP 14.00 14.20
59. MAS 12.00 13.20
60. SSS 14.20 15.60
Mean Values 12.32 13.35
Table No.5 shows haemoblobin level of B.Sc. I students before and after training. The
average haemoglobin values of B.Sc. I observed before training are 12.32 gm/dl. While the
average haemoglobion values observed after training are 13.55 gm/dl. as compare to the
normal control students.
DISCUSSION AND RECOMMENDATION
The physical exercise is an important health improving behavior which is beneficial for many
individuals in all states of health. Caster (1970) suggested that; the basic structure of body
must be present to achieve success in different sports. Pamell (1958) indicated that the choice
of sportsman for the particular event is largely determined by the inborn characteristics. The
other factors shcu as physical training and excursive can improve the performance upto a
certain limit that is set up by his genotype, Monchard & Malina (1983). The level of physical

www.wjpr.net Vol 7, Issue 15, 2018.
935
Jawale. World Journal of Pharmaceutical Research
fitness in general depends on many factors, of the these age, height and weight are very
important.
In present investigation, it has been found that; the average age is 18 years as per the the
N.C.C. selection criterion; as compared to control student is 17.95 yrs. The average height
observed among the N.C.C. cadets was 187.86 cms. As compared to that of control student
height is 189.04 cms. And the average weight observed was 55.69 cms. and the average
weight observed was 55.69 kg.
In present study average physical fitness score observed is 72.5 before training the fitness
index. It means that; the before training the fitness index of B.Sc. I student shows higher
average and after training it improves to the good level; some students showed excellent
physical fitness performance after the two years training, along with suggested exercise as
compared to the control students it has shown in Table No.2.
The mean PEER values observed are 494 1/min before training as compared to the 548 1/min
after training as compared to the control student 518 1/min after two years; so it has been
concluded that, physical exercise along with N.C.C. training lung capacities with fulfill the
need of oxygen for physical activities, it has shown in Table No.3.
The grip strength values of B.Sc. I student showed rising level from before training to after
training as compared to the control; so it has been concluded that; physical training particular
sit up will improve the muscle strength of fore arm; which ultimately help in other activities.
The red blood cells plays a vital role in transport of gases. It contains approx. 34 gm of HB
per 100 milliliters of whole blood. The composition of blood changes as the individual goes
from a resting to an exercising state. Dubal 1995. Gaikwad 1997 observed that; size of RBC
decreases as the body is exposed to prolonged exercise. Blood plasma is reduced with fluid
loss and this causes an increase in the relative no. of red blood cells which ultimately
improves the haemoglobin level of blood. In present study; the haemoglobin levels found to
be raised after the two years training with physical exercise live running, sit up, push up and
5 meter shuttle.
While concluding the present minor research project, studies on physical fitness of college
students with reference to N.C.C. training; it should be noted that, the objective of
particularly fulfilled. But future research is possible; if the following points are considered.

www.wjpr.net Vol 7, Issue 15, 2018.
936
Jawale. World Journal of Pharmaceutical Research
1) In present investigation, only some selected physiological parameters are practiced for
screening the fitness of cadets, the better pictures may explored the fitness of by modern
techniques such as tread mill test of bicycle ergo meter.
2) The research can be undertaken to formulate balanced diet for B.Sc. I student.
3) Such physical fitness index may be used for selection of Reunites in Army.
4) Newly designed training programmes can be assessed scientifically by carrying out
systematic research.
Now it is the time train our coaches about modern methods of exercise by giving information
regarding the basic training, effects of training and nutrition as well as effects of
environmental factor on training to achieve excellent results in N.C.C. training.
REFERENCES
1. Astrand P.O. & Rodahl K. Text book of work. Physiology: physiological basis of
Exercise, Third Editin; McGraw Hill Book Co. Singapore, 1986.
2. Banerjee: Studies in energy metabolism. Ind. J. Med. Res. Sp. Rep. Seris., 1962; 43:
16-29.
3. Bouchard & Malina: Ventilatory changes on exposure to severe exercise. Brit. J. Industr.
Med., 1983; 22: 295–304.
4. Cater: Occupational lung disorders; Butter worth Publication, London IInd
Edition, 1970.
5. Dubal R.S. Physiological evaluation of jobs & occupational stresses in powerloom
workers: A. M. Phil. Thesis to Shivaji University, Kolhapur 416004, India, 1995.
6. Gaikwad P. Y. Haemotologcal studies on Textile workers in Ichalkaranji. A. M. Phil.
Thesis to Shivaji University, Kolhapur, 416004, India, 1999.
7. McKerrow Respiratory function during the day in cotton Workers : A Study in Byssinosis
Brit. J. Indust. Med., 1959; 15: 75-83.
8. Parnell: Factors influencing the decline In FEW, across working shift, Chest, 1958; 79(4):
715-735.
9. Sen & Sen: Studies on energy metabolism of labours in a Spinning Mill. Ind. Jour. Res.,
1959; 47: 657-662.