EVALUATION OF ORGANIC FERTILIZERS ON SELECTED …bpi.da.gov.ph/bpi/images/PDF_file/Org Fertilizer...
25
1 EVALUATION OF ORGANIC FERTILIZERS ON SELECTED HIGHLAND VEGETABLES Divina C. Jose ABSTRACT The project was conducted in BPI-Buguias Seedfarm and BPI-Baguio experimental farm from December 2013 to March 2016 to evaluate the effects of organic fertilizers and mulching materials on selected highland vegetables; identify the best or appropriate organic fertilizer and mulching material; determine their effects on the soil; and compare the profitability of using organic fertilizers and mulching materials for selected highland vegetables. On organic fertilizers, chicken manure (4, 5 and 6 tons/ha), mushroom compost (6, 8 and 10 tons/ha), horse manure (6, 8 and 10 tons/ha) and vermicompost (8, 10 and 12 tons/ha) were applied on lettuce, broccoli and carrot, respectively, one week before transplanting/sowing. The application of chicken manure on the test crops enhanced the production of heaviest lettuce heads, broccoli curds and taproots of carrot, respectively, resulting in highest marketable yield. Its application also enhanced earliest harvest at 52 days and widest leaves on lettuce leading to widest plant canopy. This was followed by the application of mushroom compost. Control plants were latest to mature or harvest on lettuce; produced the lowest weight of lettuce heads, broccoli curds and taproots resulting in lowest marketable yield of the test crops. Meanwhile, all treatment plots decreased in pH in Baguio as well as phosphorus in both locations. Moreover, most plots planted to broccoli and carrot decreased in potassium but increased in plots planted to lettuce. The application of chicken manure on lettuce, broccoli and carrot noted the highest return on investment of 152.19, 179.42 and 148.92 %, respectively followed by the application of mushroom compost on lettuce and broccoli, and application of horse manure on carrot.
Transcript of EVALUATION OF ORGANIC FERTILIZERS ON SELECTED …bpi.da.gov.ph/bpi/images/PDF_file/Org Fertilizer...
1
EVALUATION OF ORGANIC FERTILIZERS ON SELECTED
HIGHLAND VEGETABLES
Divina C. Jose
ABSTRACT
The project was conducted in BPI-Buguias Seedfarm and BPI-Baguio experimental
farm from December 2013 to March 2016 to evaluate the effects of organic fertilizers and
mulching materials on selected highland vegetables; identify the best or appropriate organic
fertilizer and mulching material; determine their effects on the soil; and compare the
profitability of using organic fertilizers and mulching materials for selected highland
vegetables.
On organic fertilizers, chicken manure (4, 5 and 6 tons/ha), mushroom compost (6, 8
and 10 tons/ha), horse manure (6, 8 and 10 tons/ha) and vermicompost (8, 10 and 12 tons/ha)
were applied on lettuce, broccoli and carrot, respectively, one week before
transplanting/sowing. The application of chicken manure on the test crops enhanced the
production of heaviest lettuce heads, broccoli curds and taproots of carrot, respectively,
resulting in highest marketable yield. Its application also enhanced earliest harvest at 52 days
and widest leaves on lettuce leading to widest plant canopy. This was followed by the
application of mushroom compost. Control plants were latest to mature or harvest on lettuce;
produced the lowest weight of lettuce heads, broccoli curds and taproots resulting in lowest
marketable yield of the test crops. Meanwhile, all treatment plots decreased in pH in Baguio
as well as phosphorus in both locations. Moreover, most plots planted to broccoli and carrot
decreased in potassium but increased in plots planted to lettuce.
The application of chicken manure on lettuce, broccoli and carrot noted the highest
return on investment of 152.19, 179.42 and 148.92 %, respectively followed by the
application of mushroom compost on lettuce and broccoli, and application of horse manure
on carrot.
2
RATIONALE
High value vegetables are considered one of the important products which heighten
the economy of the Cordillera region. ATI-CAR (2011) mentioned that semi-temperate
vegetable contributes 30-35% of the region’s Gross Value Addition in agriculture, and
vegetable gardening is the main source of livelihood of about 97,350 farmers mostly in
Benguet province. Also, contributes about 80 to 85% of the vegetables in Metro Manila
markets (Aquino, 2012).
High value vegetables such as lettuce, broccoli and carrots are good sources of
vitamins and minerals and contain antioxidants which are important for wellness. In 2010
lettuce had a total production volume of 2,313.13 MT, broccoli with 1,928.33 MT and carrots
with 56,011.25 MT from effective production areas of 229.38, 145.75 and 3,255.95 ha,
respectively (BAS, 2011).
However, until now vegetable farmers strive to increase their production per area for
higher income. This lead them grow vegetables through inorganic farming. Therefore, the
use of synthetic pesticides, fertilizers and other chemicals flourished in the commercial
vegetable growing areas. Though improved production, the environment and the populace
are threatened compromising contamination, food safety and wellness. In the Cordillera,
farmers usually apply chicken manure with combination of inorganic fertilizers at rates more
than the recommended dosages that may contaminate the environment. According to Batt et.
al (2008) there is a considerable potential to maintain or increase quality yields through
improved cultural farm practices. Production of vegetables through the use of organic
fertilizers is a cultural practice that could improve quality of produce at the same time
maintaining healthy environment for future generations.
Application of organic fertilizers stimulates the natural cycles that ameliorate and
enrich the soil, and nutrients are released over the years for crop growth and development
(Snyder, 2009). Likewise, organic fertilizer increase water holding capacity, improve
aeration and water infiltration (Davis and Wilson, 2012). Further, Balfour (2000) stated that
organic farming preserves and enhances fertility of the soil because it encourages the activity
of beneficial insects and microorganisms and minimizes flow of toxic pesticides into
waterways. Besides, the soil and ecosystem is maintained healthy while producing safe
vegetables for the communities. According to Stephens and Kostewicz (2009) building up or
nourishing the soil with the use of organic materials is the major concept of organic
gardening which is very sustainable.
REVIEW OF LITERATURE
Several authors stated that soil amendments are any material added and mixed to the
soil in order to improve the physical properties and add nutrients into the soil for the benefit
of the plants. They mentioned further that the common organic soil amendments are weed
composts, animal manure composts, worm castings, rice hulls, wood shavings, green
manures, blood meal, fish meal, feather meal and the like.
According to Davis and Wilson (2012) soil amendments are any materials which are
mixed well to the soil and upon decomposition act as organic fertilizers. Soil with 3%
organic matter needs 3 cubic yards (2.7 m3) amendment per 1,000 square foot (295 sq.m).
Generally, the application of 5 to 10 tons/ha is used for decades in the country boosting the
3
yield of vegetable crops (DA, 2009). Moreover, DA (2013) stated that all types of lettuce
grow best in cool areas but the optimum temperature ranges from 15 to 18 oC; head types
require cooler temperatures ranging from 10 °C to 18 °C, and heading and seeding are
prevented at 21 oC and above.
Turner (2012) also mentioned that adding organic material as a soil amendment can
change soil pH levels and water retention ability, however, it is very important to know the
soil type first before applying any amendment to ensure nourishment of the soil and not
making it worse. He explained further that organic compost releases its nutrients slowly over
a period of time providing nutrition for plants far into the future. Likewise, Snyder (2009)
mentioned that organic soil amendment stimulates the natural cycles that enrich the soil.
Earthworms and soil microorganisms break down organic matter and nutrients are slowly
released over months or years for plants.
Stephens and Kostewicz (2009) stressed that composting is the microbial
decomposition of organic wastes under controlled condition and the end product is artificial
manure used as a soil amendment and a source of nutrient. Also, Abadilla (1982) described
composting as an ancient technology of piling, mixing and decaying of natural wastes in a
heap or pit to obtain a compost rich in humus. Moreover, he cited some literatures which
stated that the efficacy of animal manures lasts from one to 5 years. Others defined it as the
process by which humus is manufactured by deliberately speeding up the normal rate of
cellulose decomposition.
Gurel and Miller (2010) stressed that in order that animal manure can be used for
organic production, it must be fully composted, or incorporated into the soil 120 days prior to
the harvest of organic lettuce. Moreover, approved amendments such as blood meal, fish
meal and feather meal can also increase the marketable yield and quality of lettuce. In 2006,
Hammermeister, et. al applied different organic amendments at the rate of 200, 400 and 800
kg total nitrogen per hectare in unvegetated soil planted with lettuce and orchardgrass, and
available nitrogen was measured after six months. They found that vermicastings with
available N at 10% is safe for lettuce while high rates of poultry manure and feather meal
with available N of 50 to 70% are toxic, but produced good orchardgrass.
Okur et. al (2007) stated that the application of farmyard manure and tobacco waste
compost at 50 tons/ha as organic amendment increased lettuce yield, and may as well
increase crop yield in dryland especially in Mediterranean soil with low organic matter
content. Further, 25% farmyard manure +75% tobacco waste compost and 100% tobacco
waste compost increased soil biological properties such as soil organic C, total N, soil
respiration and certain kinds of enzyme activity. However, MSU (2010) mentioned that if
soil N supply is greater than crop demand, excessive nitrate (NO3) may enter the ground or
surface water. Moreover, Nitrogen in the vegetation of field crops is approximately 2-3% of
dry matter weight and organic matter is approximately 5%N, so total nitrogen in the topsoil
ranges from 227.27 to 909 kg/0.4 ha. Further, the optimum nutrients in soils are 50-150 ppm
NO3, 10-20 ppm P and 120-200 ppm K for crops.
Mc Gitten (2010) stated that when he applied organic amendments in desert soil low
with organic carbon and planted with legumes and lettuce, he found that yields in the first
year were low compared to that plots with inorganic fertilizer but were equal during the
second year. Also, soil respiration is related to the amount of organic carbon added as either
cover crop or compost, indicating that microbes were degrading and using the organic
residues as an energy source thus, scarce organic carbon in desert soils.

4
The addition of organic matter can aid in reducing diseases caused by soilborne
pathogens; the incidence of lettuce drop and survival rate of Sclerotinia sclerotiorum can be
reduced by adding stable manure (mixture of straw, horse dung and urine), fowl manure
(mixture of chicken droppings and wood shavings) and Lucerne hay in the field (Gurel and
Miller, 2010). Earlier, Okpala (2008) tested several organic soil amendments against
damping off of lettuce seedlings and noted that grass meal amendment was effective as
thiram seed treatment in protecting lettuce seedlings against Corticium praticola as well as
effective in reducing the survival of the fungus in the soil.
The application of soil amendments rich in potassium like wood ashes contain soluble
potassium which boost the plant quickly and promotes strong storage root development,
promoting solid and sweet carrots. Moreover, white mold on carrots caused by Sclerotinia
sclerotiorum was prevalent on stalks and roots harvested from plots applied with chemical
fertilizer but absent in roots from plots applied with raw lobster waste (Agriculture and Agri-
Food and PEI Department of Agriculture, Fisheries and Aquaculture Canada, 2004). They
added that on potato tuber yield from plots applied with raw lobster waste was found similar
to the yield from plots applied with chemical fertilizer, and the severity of black scurf caused
by Rhizoctonia solani has been lower on tubers from plots receiving lobster waste
BAS (2005) as cited by Centrosaka.org (2012) stressed that the country’s top highland
vegetable producing areas were Benguet and Mt. Province, Ilocos Sur, Bukidnon and North
Cotabato. In 2005, the country had a production volume of 16,800 MT (11.50 tons/ha) for
carrot, 1,400 MT (10.6 tons/ha) for broccoli and 1,600 MT (7.2 tons/ha) for lettuce with
Benguet and Mt. Province, Bukidnon and Cotabato are the major producers. Later, the same
author (2011) noted that the production volume of same crops are 1,233.18 MT, 1,863.96 MT
and 58,766.14 MT from production areas of 159 ha, 163 ha and 3,359 ha, respectively.
OBJECTIVES
1. To evaluate the effects of organic fertilizers on the performance of selected highland
vegetables;
2. To identify the best organic fertilizer for the selected highland vegetables;
3. To determine the effects of organic fertilizers on the properties of the soil; and
4. To compare the profitability of the different organic fertilizers for selected highland
vegetables.
5
METHODOLOGY
Lettuce (Rommaine type, var. Xanadu), broccoli (var. Legacy) and carrots (var. New
Kuroda) were planted in BPI Buguias Seedfarm and BPI-Baguio from December 2013 to
April 2014 and December 2014 to March 2015, respectively (Table 1). Lettuce and broccoli
were sown under greenhouse and transplanted in the field when three to four leaves
developed while carrots was direct seeded in plots in the field.
An area of 400 square meters was cleared and thoroughly prepared for planting. Plots
measured 1 X 6 meters for the three crops. Lettuce was spaced 20 X 30 cm between hills and
rows and broccoli at 30 X 40 cm, following the double row planting while carrots was spaced
15 X 10 cm consisting five rows in a plot (Table 1). Randomized complete block design was
used for the study. There were five treatments (Table 2) for each crop which were replicated
three times.
Table 1. The different test crops and plant spacing used in the trials
=====================================================
Test crop Planting Distance (cm)
Lettuce 20 X 30
Broccoli 30 X 40
Carrots 15 X 10
======================================================
Table 2. The different treatments and decomposed organic fertilizers and their
rates of application
===============================================================
Treatment Lettuce (t/ha) Broccoli (t/ha) Carrots (t/ha)
T0-Control (no organic fertilizer) 0 0 0
T1-Chicken manure 4 5 6
T2-Mushroom compost 6 8 10
T3-Horse manure 6 8 10
T4-Vermicompost 8 10 12
================================================================
The different fully decomposed organic fertilizers were applied basally one week
before transplanting/sowing. Chicken manure was bought from farm suppliers in the locality
and the sources are poultries from Batangas, Tarlac and Laguna. Horse manure is taken from
Lualhati barangay, Baguio with some farmers practicing organic farming. Mushroom
compost is obtained from mushroom farmers in Baguio, and vermicompost is bought from
farm suppliers where some sources are from the lowlands. Chicken manure, mushroom
compost and vermicompost are very much available.
Other cultural management practices such as weeding, watering and hilling up were
done as needed for the growth and development of the crops.
6
The data gathered were the following:
1. Initial and final chemical analysis of the soil. Before land preparation and after harvest,
soil samples were collected and submitted to the Bureau of Soils for initial and final pH, OM
(%), P (ppm) and K (ppm) analysis.
2. Chemical analysis of the different decomposed organic fertilizer. Samples were submitted
to the Bureau of Soils for analysis.
3. Lettuce
Ten (10) sample plants selected at random were used in gathering leaf length, leaf
width, plant canopy diameter, number of leaves and weight per plant one day before harvest.
a. Days to harvesting. Days were counted after transplanting to harvesting.
b. Leaf length (cm). Longest leaves were measured from sample plants.
c. Leaf width (cm). Leaf samples were measured at the widest part.
d. Plant canopy diameter (cm). Plant canopy was measured at the widest part of
sample plants.
e. Number of leaves. Loose leaves were counted excluding the inner capped portion.
f. Weight per plant (g). Ten (10) randomly selected sample plants were harvested
and weighed individually.
g. Marketable yield (kg/plot). Sound plants were harvested and weighed in kg/plot
and computed in tons per hectare.
h. Non-marketable yield (kg/plot). Diseased plants and hollow heads were harvested
and weighed in kg/ plot and computed in tons per hectare.
i. Incidence of insect pests and diseases. Occurrence of insect pests and diseases
were assessed during the crop growth duration.
4. Broccoli
Ten (10) samples selected at random were used in gathering height, curd diameter,
and weight per curd.
a. Height (cm). Ten randomly selected sample plants were measured from the base
to the tip of the developing curd (1 peso curd size).
b. Curd diameter (cm). Ten insect pest damage and disease-free curds ready for
harvesting were measured at the widest part.
c. Weight per curd (g). Ten marketable curds were harvested with three leaves and
weighed individually.
d. Marketable yield (kg/plot). Curds which are free from insect pest damage and
diseases were harvested mushroom cut with three leaves, weighed and computed
in tons per hectare.
e. Non-marketable yield (kg/plot). Very small uneven curds were harvested,
weighed and computed in tons per hectare.
f. Incidence of insect pests and diseases. Occurrence of insect pests and diseases
were assessed during the cropping period.
7
5. Carrot
Ten (10) taproot samples selected at random were used in gathering taproot
length, taproot diameter, core diameter and weight per taproot.
a. Taproot length (cm). Length of taproots was measured after harvest.
b. Shoulder diameter (cm). The shoulder part of the taproots was measured with the
use of a Vernier caliper.
c. Core diameter (cm). Taproots were cut at the shoulder then core diameter was
measured.
d. Weight per taproot (g). Taproots were weighed individually.
e. Marketable yield (kg/plot). Disease-free taproots were weighed in kg/ha and
further computed into tons per hectare.
f. Non-marketable yield (kg/plot). These are diseased, very small, cracked, spindled
and forked taproots which were weighed in kg/ha and further computed in tons
per hectare.
g. Incidence of insect pests and diseases. Occurrence of insect pests and diseases
were monitored and assessed during the cropping period.
5. Statistical Analysis
Data were analysed through analysis of variance and further analysis was done
through Duncans Multiple Range Test for mean separation.
RESULTS AND DISCUSSIONS
Description of the site
The first trial site was a transition for organic farm in Buguias Seedfarm. The area
was slightly sloping with silty loam soil which is friable, previously planted with cabbage,
experienced low temperature for as low as 50C for the months of December 2013 to January
2014, and no problem on water runoff from other farms. The second trial area in Baguio on
December 2014 to March 2015 was previously planted with squash then fallowed for two
years. The area was surrounded by a concrete irrigation canal and no water flow problem
coming from other paddies. Further, the area has a clay loam soil, and the surrounding areas
were planted with indigenous vegetables and legumes practicing organic and inorganic
farming, respectively.
Lettuce
Days to harvesting
Among the treatments, plants applied with chicken manure significantly were earliest
to mature and harvested at 52 days (Table 3). This could be due to the higher absorption of
organic matter by plants and higher potassium content in the soil after harvest (Table 6) that
was used in translocation of food leading to faster growth and maturity. Control plants were
the latest to mature and harvested at 70 days. Plants applied with mushroom compost, horse
manure and vermicompost had matured and harvested at 66 days after transplanting. Late
8
maturity was observed in Buguias than in Baguio may be due to very cold weather sometimes
to as low as 5 oC. The maturity period by the treatment plants conform with many literatures
that the commercial maturity of Rommaine lettuce is 55-70 days.
Leaf length and width
There were no significant differences on the length of leaves as affected by the
different organic fertilizers ranging from 17.99 to 20.57 cm.
Plants applied with chicken manure significantly had the widest leaves with mean of
12.32 cm. Other organic fertilizers applied plants together with the control had leaf widths
ranging from 9.26 to 10.20 cm. Wider leaves could be due to higher absorption of organic
matter and higher potassium content in the soil (Table 6) that was may be used by plants in
translocation of food to the different plant parts.
Table 3. Days to harvest, leaf length and width of lettuce as affected by organic fertilizers
================================================================== Treatment Days to harvest
Buguias Baguio
2014 2015
Mean Leaf length (cm)
Buguias Baguio
2014 2015
Mean Leaf width (cm)
Buguias Baguio
2014 2015
Mean
Control 80a 60
a 70
a 15.58
a 20.40
a 17.99
a 8.83
b 11.40
b 10.11
b
Chicken
manure
55c 49
c 52
c 17.00
a 20.60
a 18.80
a 12.13
a 12.52
a 12.32
a
Mushroom
compost
76b 55
b 66
b 17.73
a 20.60
a 19.16
a 9.30
b 11.11
b 10.20
b
Horse manure 76b 55
b 66
b 18.33
a 21.17
a 19.75
a 9.23
b 10.26
b 9.74
b
Vermicompost 76b 55
b 66
b 18.15
a 23.00
a 20.57
a 8.20
b 10.32
b 9.26
b
---------------------------------------------------------------------------------------------------------------- Significance ** ** ** ns ns ns ** ** ** CV (%) 1.60 1.59 1.55 8.02 7.93 7.99 7.06 10.54 9.02 ================================================================================== Means with the same letter in a column are not significantly different at 5% level by DMRT.
Plant canopy diameter
Table 4 shows that chicken manure applied plants significantly registered the widest
plant canopy with mean of 24.07 cm may be because of having the widest leaves while
control and other organic fertilizers applied plants had narrower plant canopy ranging from
19.41 to 20.85 cm (Table 4).
Number of leaves
There were no significant differences on the number of leaves as affected by organic
fertilizers with mean ranging from 21 to 22.
9
Table 4. Plant canopy and number of leaves of lettuce as affected by organic fertilizers
================================================================== Treatment Plt canopy dia(cm)
Buguias Baguio 2014 2015
Mean No. of leaves
Buguias Baguio 2014 2015
Mean
Control 17.03b 21.80
b 19.41
b 17
a 25
a 21
a
Chicken manure 25.06a 23.09
a 24.07
a 16
a 27
a 21
a
Mushroom compost 17.70b 23.16
a 20.43
b 18
a 26
a 22
a
Horse manure 18.23b 21.00
b 19.61
b 18
a 26
a 22
a
Vermicompost 17.33b 24.38
a 20.85
b 18
a 26
a 22
a
---------------------------------------------------------------------------------------------------------------- Significance ** ** ** ns ns ns CV (%) 5.42 6.50 6.25 4.51 2.94 3.90 ================================================================================== Means with the same letter in a column are not significantly different at 5% level by DMRT.
Weight per head
Plants applied with chicken manure were significantly the heaviest with mean of 351 grams/head followed by mushroom compost with 273.65 grams while the lowest weight was
obtained from the control plants with 216.41 grams/head (Table 5). Horse manure and
vermicompost applied plants had weights of 256.75 and 253.38 grams/head, respectively.
Heavy heads could be due to wider leaves and wider plant canopy.
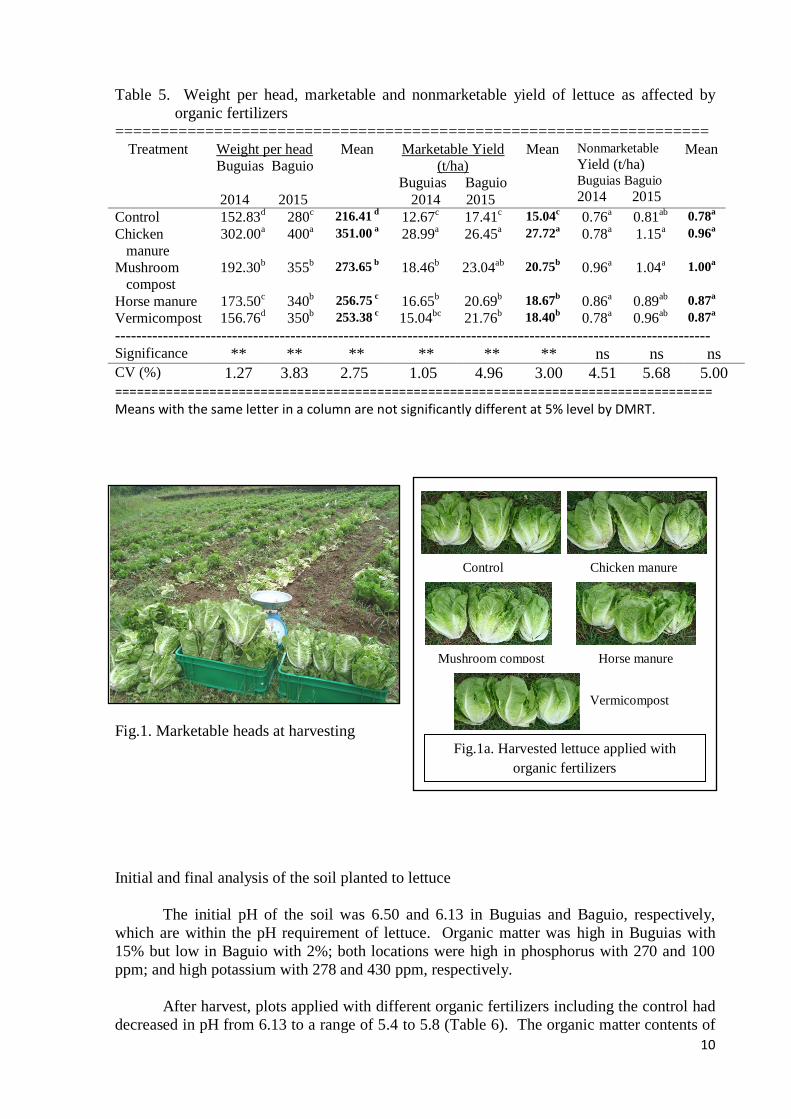
Marketable yield
The highest marketable weight was taken from plants applied with chicken manure
with mean of 27.72 tons/ha followed by plants applied with mushroom compost with 20.75
tons/ha while the lowest was from the control with 15.04 tons/ha (Table 5 and Fig.1 and Fig.
1a). Horse manure and vermicompost applied plants had mean marketable yields of 18.67
and 18.40 tons/ha, respectively. The highest marketable yield was attributed to heavier
weights of heads.
Non-marketable yield
Lettuce plants applied with different organic fertilizers and the control plants had
comparable non-marketable weights ranging from 0.78 to 1 ton/ha.
Incidence of Insect pests and diseases
There were no insects observed during the cropping period but rotting was noted
insignificantly at harvesting stage.
10
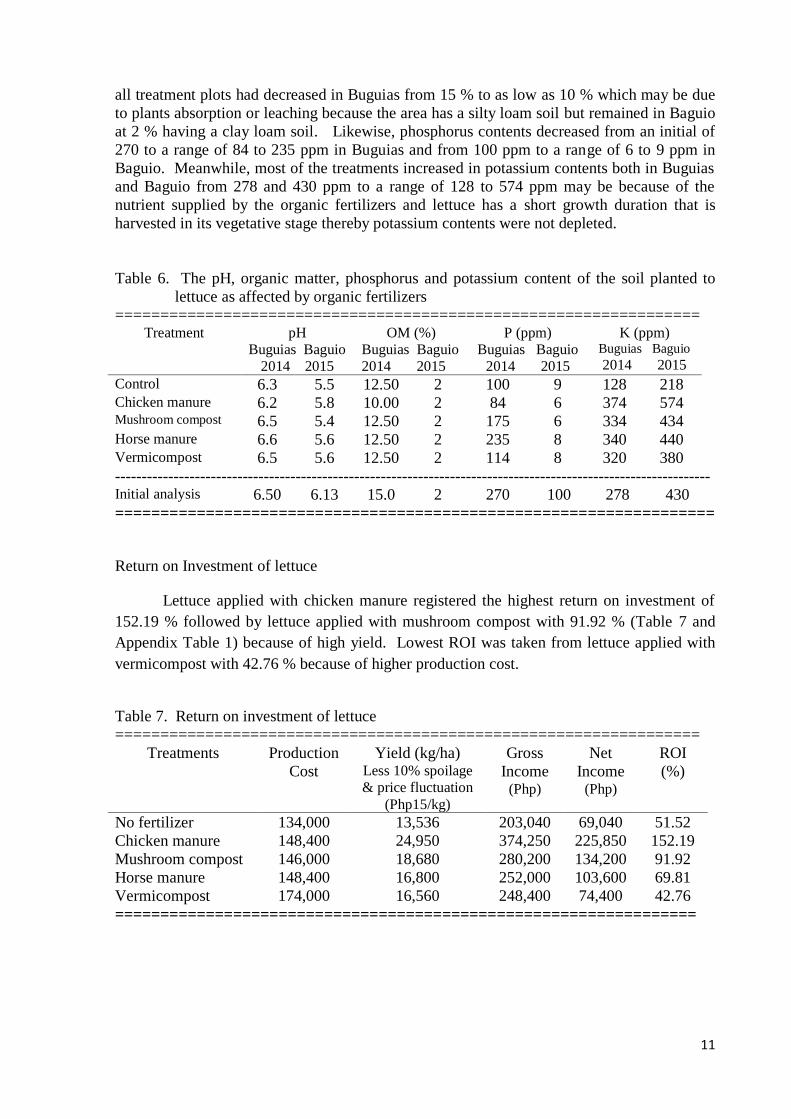
Vermicompost
Horse manure Mushroom compost
Chicken manure Control
Fig.1a. Harvested lettuce applied with
organic fertilizers
Table 5. Weight per head, marketable and nonmarketable yield of lettuce as affected by
organic fertilizers
================================================================== Treatment Weight per head
Buguias Baguio
2014 2015
Mean Marketable Yield
(t/ha)
Buguias Baguio
2014 2015
Mean Nonmarketable
Yield (t/ha) Buguias Baguio
2014 2015
Mean
Control 152.83d 280
c 216.41
d 12.67
c 17.41
c 15.04
c 0.76
a 0.81
ab 0.78
a
Chicken
manure
302.00a 400
a 351.00
a 28.99
a 26.45
a 27.72
a 0.78
a 1.15
a 0.96
a
Mushroom
compost
192.30b 355
b 273.65
b 18.46
b 23.04
ab 20.75
b 0.96
a 1.04
a 1.00
a
Horse manure 173.50c 340
b 256.75
c 16.65
b 20.69
b 18.67
b 0.86
a 0.89
ab 0.87
a
Vermicompost 156.76d 350
b 253.38
c 15.04
bc 21.76
b 18.40
b 0.78
a 0.96
ab 0.87
a
---------------------------------------------------------------------------------------------------------------- Significance ** ** ** ** ** ** ns ns ns CV (%) 1.27 3.83 2.75 1.05 4.96 3.00 4.51 5.68 5.00 ================================================================================== Means with the same letter in a column are not significantly different at 5% level by DMRT.
Fig.1. Marketable heads at harvesting
Initial and final analysis of the soil planted to lettuce
The initial pH of the soil was 6.50 and 6.13 in Buguias and Baguio, respectively,
which are within the pH requirement of lettuce. Organic matter was high in Buguias with
15% but low in Baguio with 2%; both locations were high in phosphorus with 270 and 100
ppm; and high potassium with 278 and 430 ppm, respectively.
After harvest, plots applied with different organic fertilizers including the control had
decreased in pH from 6.13 to a range of 5.4 to 5.8 (Table 6). The organic matter contents of
11
all treatment plots had decreased in Buguias from 15 % to as low as 10 % which may be due
to plants absorption or leaching because the area has a silty loam soil but remained in Baguio
at 2 % having a clay loam soil. Likewise, phosphorus contents decreased from an initial of
270 to a range of 84 to 235 ppm in Buguias and from 100 ppm to a range of 6 to 9 ppm in
Baguio. Meanwhile, most of the treatments increased in potassium contents both in Buguias
and Baguio from 278 and 430 ppm to a range of 128 to 574 ppm may be because of the
nutrient supplied by the organic fertilizers and lettuce has a short growth duration that is
harvested in its vegetative stage thereby potassium contents were not depleted.
Table 6. The pH, organic matter, phosphorus and potassium content of the soil planted to
lettuce as affected by organic fertilizers
================================================================= Treatment pH
Buguias Baguio
2014 2015
OM (%)
Buguias Baguio
2014 2015
P (ppm)
Buguias Baguio
2014 2015
K (ppm) Buguias Baguio
2014 2015
Control 6.3 5.5 12.50 2 100 9 128 218 Chicken manure 6.2 5.8 10.00 2 84 6 374 574 Mushroom compost 6.5 5.4 12.50 2 175 6 334 434 Horse manure 6.6 5.6 12.50 2 235 8 340 440 Vermicompost 6.5 5.6 12.50 2 114 8 320 380
---------------------------------------------------------------------------------------------------------------- Initial analysis 6.50 6.13 15.0 2 270 100 278 430
==================================================================
Return on Investment of lettuce
Lettuce applied with chicken manure registered the highest return on investment of
152.19 % followed by lettuce applied with mushroom compost with 91.92 % (Table 7 and
Appendix Table 1) because of high yield. Lowest ROI was taken from lettuce applied with
vermicompost with 42.76 % because of higher production cost.
Table 7. Return on investment of lettuce
=================================================================
Treatments Production
Cost
Yield (kg/ha) Less 10% spoilage
& price fluctuation
(Php15/kg)
Gross
Income (Php)
Net
Income (Php)
ROI
(%)
No fertilizer 134,000 13,536 203,040 69,040 51.52
Chicken manure 148,400 24,950 374,250 225,850 152.19
Mushroom compost 146,000 18,680 280,200 134,200 91.92
Horse manure 148,400 16,800 252,000 103,600 69.81
Vermicompost 174,000 16,560 248,400 74,400 42.76
================================================================
12
Broccoli
Plant height
Plants applied with the different organic fertilizers were comparable and taller with
mean heights ranging from 22.30 to 23.53 cm than control plants with 20.06 cm (Table 8).
Taller plants could be attributed to the nutrients supplied by the organic fertilizers in the soil
enhancing growth of plants.
Curd diameter
It was observed that plants applied with the different organic fertilizers produced
wider curds which range from 9.06 to 10.97 cm compared to the control plants with 8.13 cm.
Wider curd was may be because of nutrients supplied by the organic fertilizers which
promoted the growth of curds.
Weight per curd
Chicken manure applied plants significantly produced the heaviest curd with 306.42
grams followed by plants applied with mushroom compost with 212.61 grams which could be
brought by wider curd diameter. The lowest weight was produced by control plants with
164.58 grams. Plants applied with horse manure and vermicompost had weights of 194.68
and 185.45 grams, respectively.
Table 8. Height, curd diameter and weight per curd of broccoli as affected by organic
fertilizers
================================================================== Treatment Height (cm)
Buguias Baguio
2014 2015
Mean Curd dia. (cm)
Buguias Baguio
2014 2015
Mean Wt./ curd (g) Buguias Baguio
2014 2015
Mean
Control 15.45b 24.97
b 20.06
b 6.29
bc 9.97
b 8.13
b 179.16
d 150
c 164.58
cd
Chicken
manure
20.16a 26.90
a 23.53
a 9.90
a 11.50
a 10.97
a 312.83
a 300
a 306.42
a
Mushroom
compost
18.60a 26.07
a 22.34
a 7.25
b 10.86
a 9.06
a 225.21
b 200
b 212.61
b
Horse manure 17.73a 26.50
a 22.30
a 6.96
b 11.34
a 10.65
a 199.36
c 190
b 194.68
c
Vermicompost 18.36a 27.23
a 22.80
a 7.05
b 11.27
a 9.16
a 190.90
d 180
b 185.45
c
---------------------------------------------------------------------------------------------------------------- Significance ** ** ** ** ** ** ** ** ** CV (%) 13.64 19.67 17.65 3.53 5.75 5.25 2.91 14.14 4.26
================================================================================== Means with the same letter in a column are not significantly different at 5% level by DMRT.
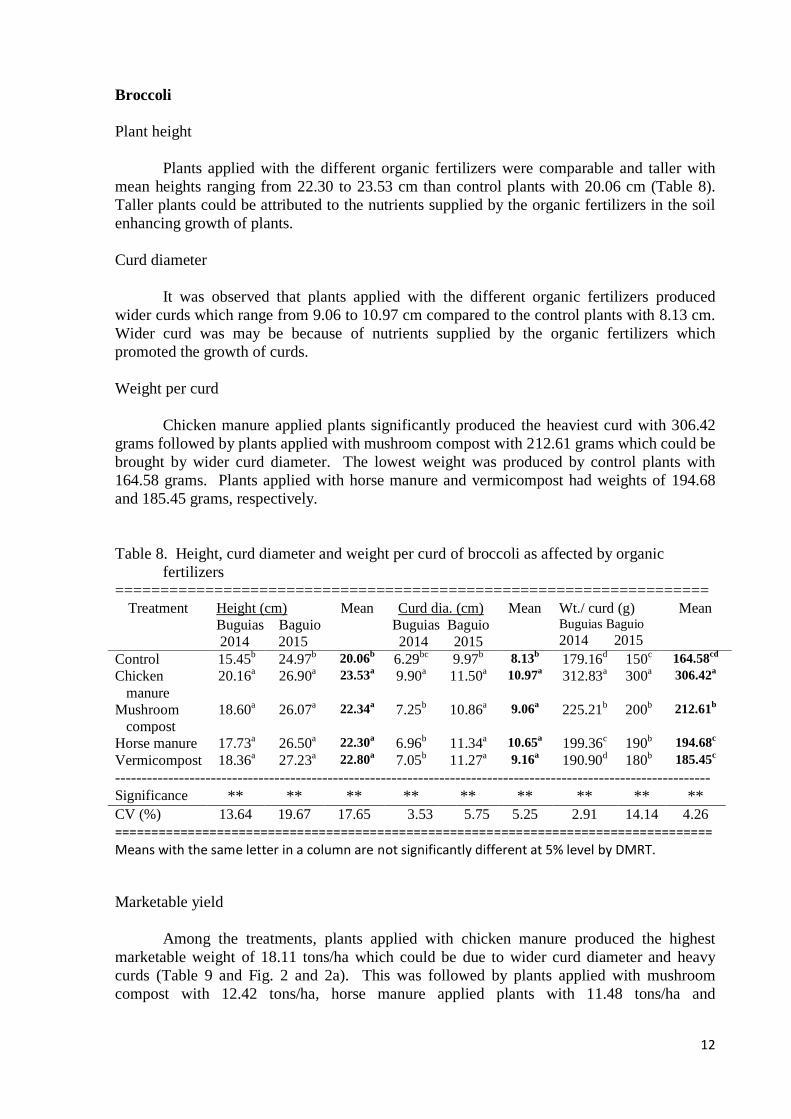
Marketable yield
Among the treatments, plants applied with chicken manure produced the highest
marketable weight of 18.11 tons/ha which could be due to wider curd diameter and heavy
curds (Table 9 and Fig. 2 and 2a). This was followed by plants applied with mushroom
compost with 12.42 tons/ha, horse manure applied plants with 11.48 tons/ha and
13
Fig.2. Harvesting of marketable broccoli curd
vermicompost applied plants with 11.17 tons/ha. Control plants produced the lowest
marketable yield of 9.64 tons/ha.
Nonmarketable yield
There were no significant differences on the nonmarketable yield ranging from 0.68
to 1.14 tons/ha.
Table 9. Marketable and nonmarketable yield of broccoli as affected by organic fertilizers
================================================================== Treatment Marketable yield (t/ha)
Buguias Baguio
2014 2015
Mean Nonmarketable yield (t/ha)
Buguias Baguio
2014 2015
Mean
Control 10.75d 8.52
c 9.64
c 1.05
c 0.30
a 0.68
ab
Chicken
manure 18.77
a 17.45
a 18.11
a 1.86
a 0.42
a 1.14
a
Mushroom
compost 13.51
b 11.33
b 12.42
b 1.40
b 0.40
a 0.90
a
Horse manure 11.96c 10.99
bc 11.48
b 1.66
b 0.48
a 1.07
a
Vermicompost 11.45c 10.88
bc 11.17
b 1.48
b 0.35
a 0.92
a
---------------------------------------------------------------------------------------------------------------- Significance ** ** ** ** ns ns CV (%) 3.9 6.59 5.25 2.53 20.98 11.17 ================================================================================== Means with the same letter in a column are not significantly different at 5% level by DMRT.
14
Vermicompost
Horse manure Mushroom compost
Chicken manure Control
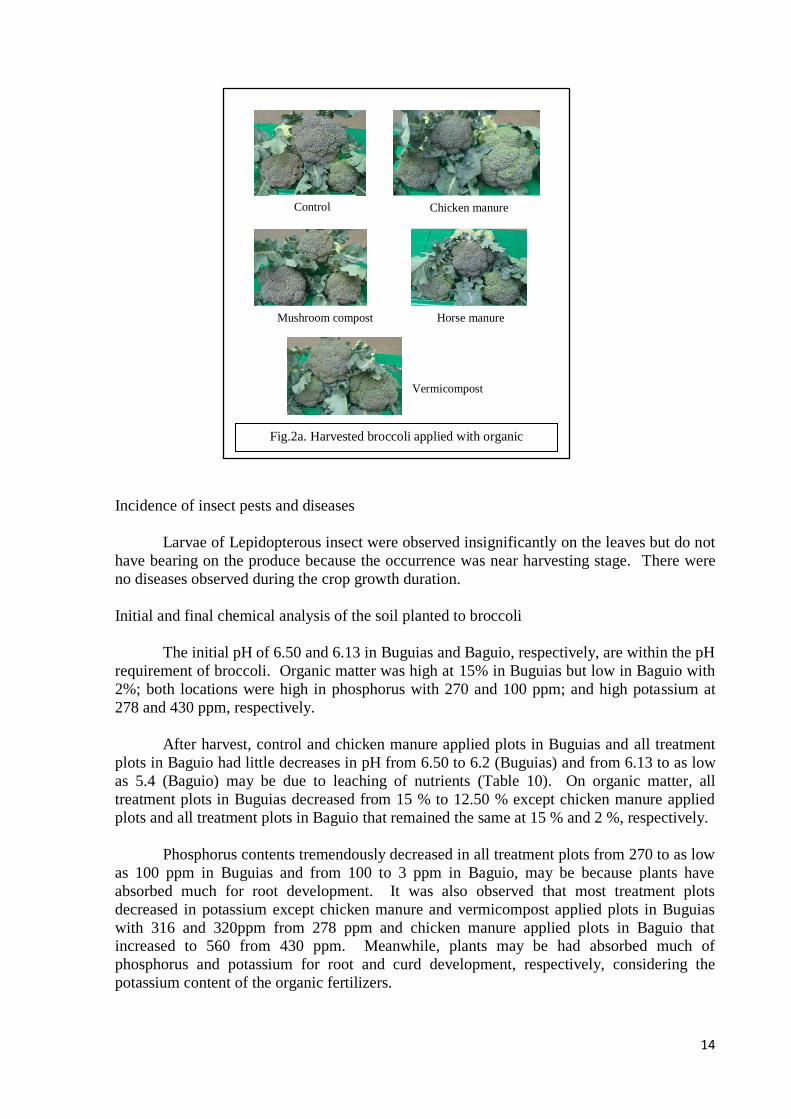
Fig.2a. Harvested broccoli applied with organic
fertilizers
Incidence of insect pests and diseases
Larvae of Lepidopterous insect were observed insignificantly on the leaves but do not
have bearing on the produce because the occurrence was near harvesting stage. There were
no diseases observed during the crop growth duration.
Initial and final chemical analysis of the soil planted to broccoli
The initial pH of 6.50 and 6.13 in Buguias and Baguio, respectively, are within the pH
requirement of broccoli. Organic matter was high at 15% in Buguias but low in Baguio with
2%; both locations were high in phosphorus with 270 and 100 ppm; and high potassium at
278 and 430 ppm, respectively.
After harvest, control and chicken manure applied plots in Buguias and all treatment
plots in Baguio had little decreases in pH from 6.50 to 6.2 (Buguias) and from 6.13 to as low
as 5.4 (Baguio) may be due to leaching of nutrients (Table 10). On organic matter, all
treatment plots in Buguias decreased from 15 % to 12.50 % except chicken manure applied
plots and all treatment plots in Baguio that remained the same at 15 % and 2 %, respectively.
Phosphorus contents tremendously decreased in all treatment plots from 270 to as low
as 100 ppm in Buguias and from 100 to 3 ppm in Baguio, may be because plants have
absorbed much for root development. It was also observed that most treatment plots
decreased in potassium except chicken manure and vermicompost applied plots in Buguias
with 316 and 320ppm from 278 ppm and chicken manure applied plots in Baguio that increased to 560 from 430 ppm. Meanwhile, plants may be had absorbed much of
phosphorus and potassium for root and curd development, respectively, considering the
potassium content of the organic fertilizers.

15
Table 10. The pH, organic matter, phosphorus and potassium content of the soil planted to
broccoli as affected by organic fertilizers
================================================================= Treatment pH
Buguias Baguio
2014 2015
OM (%)
Buguias Baguio
2014 2015
P (ppm)
Buguias Baguio
2014 2015
K (ppm) Buguias Baguio
2014 2015
Control 6.2 5.4 12.50 2 100 7 108 420 Chicken manure 6.2 5.7 15.00 2 128 5 316 560 Mushroom compost 6.6 5.7 12.50 2 200 3 270 408 Horse manure 6.5 5.7 12.50 2 245 6 320 420 Vermicompost 6.6 5.6 12.50 2 185 6 276 370
---------------------------------------------------------------------------------------------------------------- Initial analysis 6.50 6.13 15.0 2 270 100 278 430
==================================================================
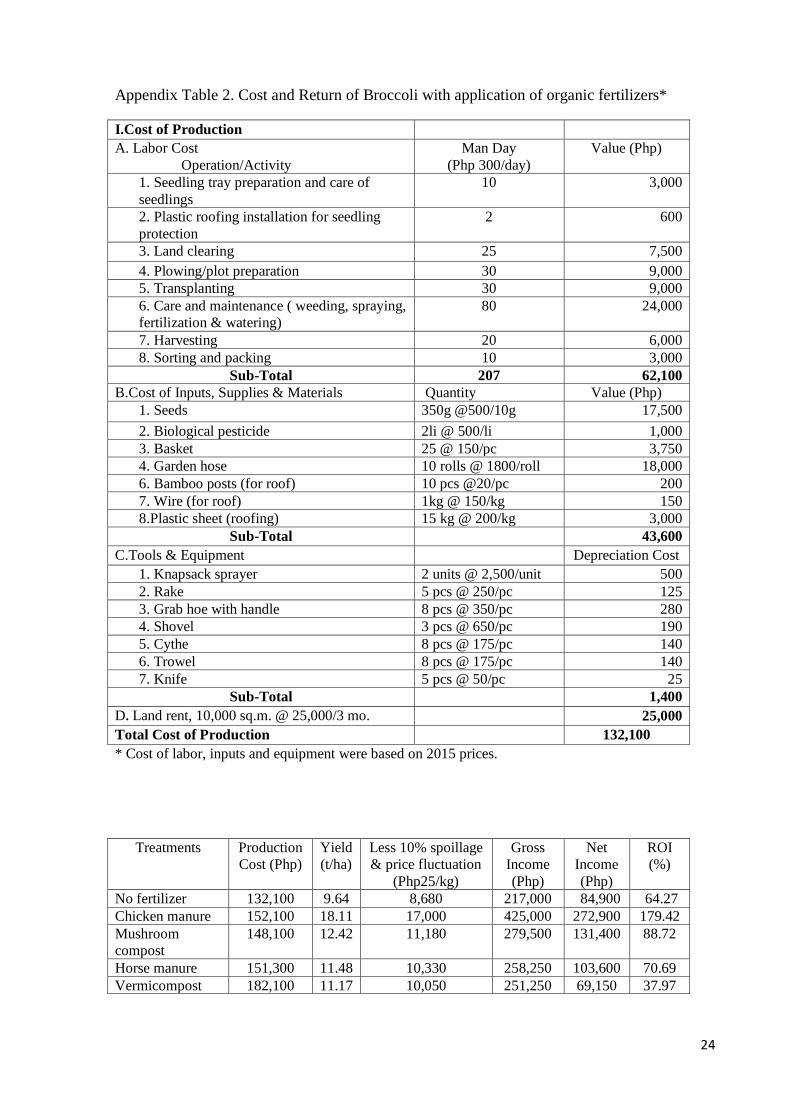
Return on Investment of broccoli
Highest return on investment was obtained from broccoli applied with chicken
manure at 179.42 % followed by broccoli applied with mushroom compost at 88.72 % (Table 11 and Appendix Table 2) because of high yield. Lowest ROI was taken from broccoli
applied with vermicompost at 37.97 % because of higher cost of the compost. Broccoli
applied with horse manure and the control plants had ROI of 70.69 and 64.27 %,
respectively.
Table 11. Return on investment of broccoli
=================================================================
Treatments Production
Cost
Yield (kg/ha) Less 10% spoilage
& price fluctuation
(Php25/kg)
Gross
Income (Php)
Net
Income (Php)
ROI (%)
No fertilizer 132,100 8,680 217,000 84,900 64.27
Chicken manure 152,100 17,000 425,000 272,900 179.42
Mushroom compost 148,100 11,180 279,500 131,400 88.72
Horse manure 151,300 10,330 258,250 103,600 70.69
Vermicompost 182,100 10,050 251,250 69,150 37.97
=================================================================
Carrot
Taproot length, taproot diameter and core diameter had no significant differences
among treatments as affected by different organic fertilizers with means ranging from 11.53
to 13.21 cm, 3.46 to 4.26 cm and 1.29 to 1.47 cm, respectively (Table 12).

16
Table 12. Taproot length, shoulder and core diameter of carrot as affected by organic
fertilizers
================================================================== Treatment Root Length (cm)
Buguias Baguio
2014 2015
Mean Shoulder dia. (cm)
Buguias Baguio
2014 2015
Mean Core dia. (cm)
Buguias Baguio
2014 2015
Mean
Control 10.32c 12.73
a 11.53
a 3.61c 3.30
a 3.46
a 0.92
a 1.69
a 1.31
a
Chicken
manure
12.00a 13.30
a 12.65
a 4.77a 3.75
a 4.26
a 1.03
a 1.88
a 1.46
a
Mushroom
compost
12.42a 13.90
a 13.21
a 4.08b 3.37
a 3.73
a 1.03
a 1.55
a 1.29
a
Horse manure 11.43b 14.03
a 12.73
a 4.70a 3.40
a 4.05
a 1.05
a 1.89
a 1.47
a
Vermicompost 11.78b 14.33
a 13.06
a 4.13b 3.46
a 3.80
a 1.03
a 1.76
a 1.40
a
---------------------------------------------------------------------------------------------------------------- Significance ** ns ns ** ns ns ns ns ns CV (%) 4.81 4.62 4.00 2.72 10.16 8.34 3.01 8.71 6.72 ================================================================================== Means with the same letter in a column are not significantly different at 5% level by DMRT.
Weight per taproot
Chicken manure applied plants remarkably produced the heaviest taproot with 87.78
grams while control plants had the lowest taproot weight of 62.78 grams (Table 13). Heavier
taproot was may be because of higher potassium in the soil that enhanced the growth and
development of the storage roots. Plants applied with other organic fertilizers had
comparable taproot weights ranging from 70.74 to 75.50 grams.
Marketable yield
The highest marketable yield was taken from plants applied with chicken manure with
23.15 tons/ha while control plants had the lowest marketable yield of 13.87 tons/ha (Table 13
and Fig. 3). Marketable yields from plants applied with other organic fertilizers were
comparable with a range of 19.11 to 20.67 tons/ha. The highest marketable yield was
attributed to heavier taproots from plants applied with chicken manure.
Nonmarketable yield
Highest nonmarketable yield was produced from plants applied with chicken manure
with 1.04 tons/ha may be due to higher weight of taproots while the lowest was obtained
from the control plants with 0.55 tons/ha. These nonmarketable taproots were the cracked,
spindled, forking and very small.
17
Vermicompost Horse manure
Mushroom compost Chicken manure Control
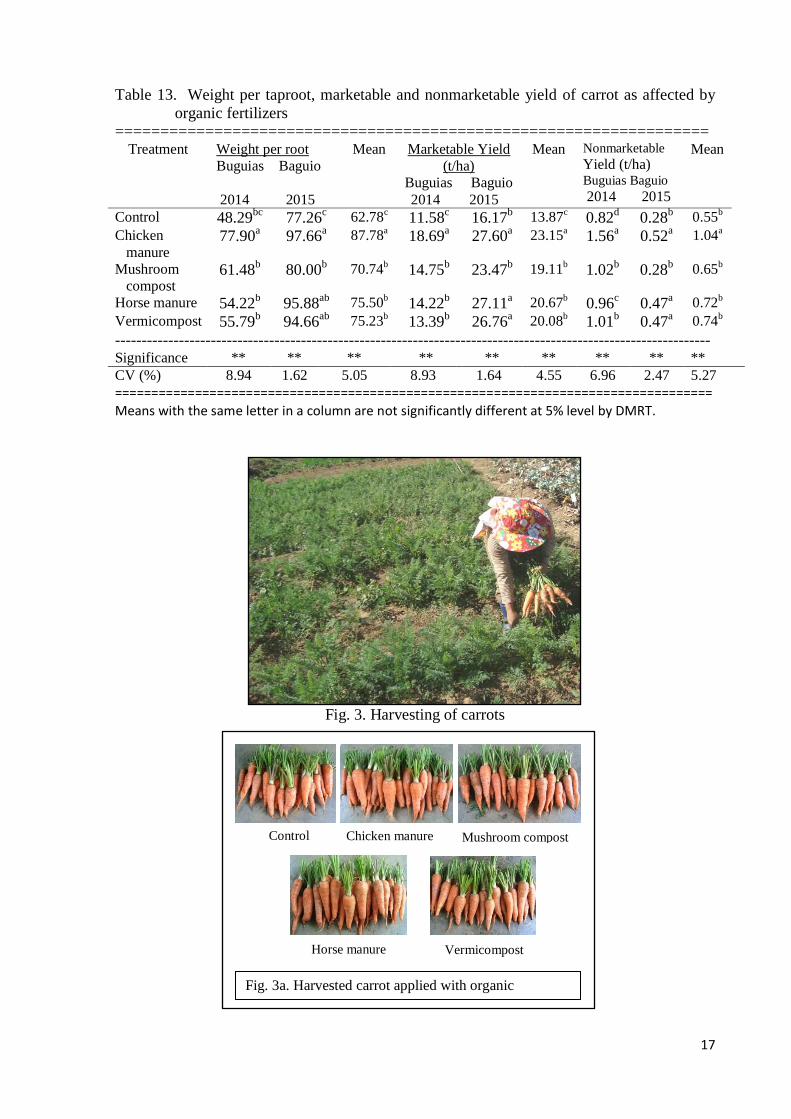
Fig. 3a. Harvested carrot applied with organic
fertilizers
Table 13. Weight per taproot, marketable and nonmarketable yield of carrot as affected by
organic fertilizers
================================================================== Treatment Weight per root
Buguias Baguio
2014 2015
Mean Marketable Yield
(t/ha)
Buguias Baguio
2014 2015
Mean Nonmarketable
Yield (t/ha) Buguias Baguio
2014 2015
Mean
Control 48.29bc
77.26c 62.78
c 11.58
c 16.17
b 13.87
c 0.82
d 0.28
b 0.55
b
Chicken
manure 77.90
a 97.66
a 87.78
a 18.69
a 27.60
a 23.15
a 1.56
a 0.52
a 1.04
a
Mushroom
compost 61.48
b 80.00
b 70.74
b 14.75
b 23.47
b 19.11
b 1.02
b 0.28
b 0.65
b
Horse manure 54.22b 95.88
ab 75.50
b 14.22
b 27.11
a 20.67
b 0.96
c 0.47
a 0.72
b
Vermicompost 55.79b 94.66
ab 75.23
b 13.39
b 26.76
a 20.08
b 1.01
b 0.47
a 0.74
b
---------------------------------------------------------------------------------------------------------------- Significance ** ** ** ** ** ** ** ** **
CV (%) 8.94 1.62 5.05 8.93 1.64 4.55 6.96 2.47 5.27
================================================================================== Means with the same letter in a column are not significantly different at 5% level by DMRT.
Fig. 3. Harvesting of carrots
18
Incidence of Insect pests
There were no insect pests and diseases observed during the cropping period.
Initial and final chemical analysis of the soil planted to carrots
Buguias and Baguio had initial pH of 6.20 and 6.13, respectively, which is good for
carrots. Organic matter was high at 15% in Buguias but low in Baguio with 2%; both
locations were high in phosphorus with 140 and 100 ppm; and high potassium content at 216
and 430 ppm, respectively.
All treatment plots in Buguias had increased in pH from 6.20 to as high as 6.98 may
be because of the added organic fertilizers and watering was not frequent as in Baguio with
decreased in pH from 6.13 to as low as 5.50 may be due to leaching enhanced by water
percolation during irrigation (Table 14).
Organic matter content of plots applied with organic fertilizers remained at 15 % in
Buguias except control plots which decreased to 13.5 % may be due to nutrient absorption
and no addition of nutrients, and in Baguio remained at 2 %. Considering the nutrients
present in the organic fertilizers, plants could have absorbed much nutrients for their growth
and development.
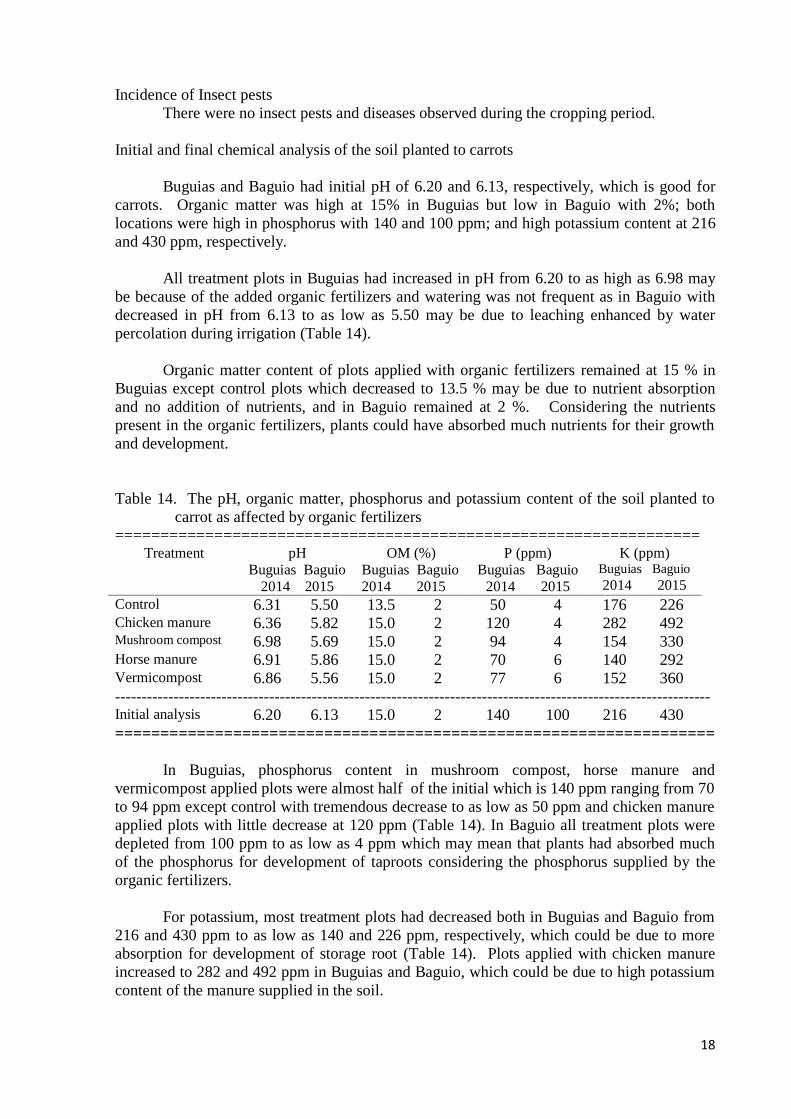
Table 14. The pH, organic matter, phosphorus and potassium content of the soil planted to
carrot as affected by organic fertilizers
================================================================= Treatment pH
Buguias Baguio
2014 2015
OM (%)
Buguias Baguio
2014 2015
P (ppm)
Buguias Baguio
2014 2015
K (ppm) Buguias Baguio
2014 2015
Control 6.31 5.50 13.5 2 50 4 176 226 Chicken manure 6.36 5.82 15.0 2 120 4 282 492 Mushroom compost 6.98 5.69 15.0 2 94 4 154 330 Horse manure 6.91 5.86 15.0 2 70 6 140 292 Vermicompost 6.86 5.56 15.0 2 77 6 152 360
---------------------------------------------------------------------------------------------------------------- Initial analysis 6.20 6.13 15.0 2 140 100 216 430
==================================================================
In Buguias, phosphorus content in mushroom compost, horse manure and
vermicompost applied plots were almost half of the initial which is 140 ppm ranging from 70
to 94 ppm except control with tremendous decrease to as low as 50 ppm and chicken manure
applied plots with little decrease at 120 ppm (Table 14). In Baguio all treatment plots were
depleted from 100 ppm to as low as 4 ppm which may mean that plants had absorbed much
of the phosphorus for development of taproots considering the phosphorus supplied by the
organic fertilizers.
For potassium, most treatment plots had decreased both in Buguias and Baguio from
216 and 430 ppm to as low as 140 and 226 ppm, respectively, which could be due to more
absorption for development of storage root (Table 14). Plots applied with chicken manure
increased to 282 and 492 ppm in Buguias and Baguio, which could be due to high potassium
content of the manure supplied in the soil.

19
Return on Investment of carrots
Carrots applied with chicken manure gave the highest ROI of 148.92 % which is
brought by high yield while control plants had the lowest with 69.45 % (Table 15 and
Appendix Table 3) due to low yield. Other treatments had ROI ranging from 80.05 to 107.41
%.
Table 15. Cost and return of carrot
======================================================================
SUMMARY, CONCLUSIONS AND RECOMMENDATIONS
Summary
Lettuce
There were significant differences observed on days to harvest, leaf width, plant
canopy, weight per head and marketable yield while insignificant differences were noted on
leaf length, number of leaves and nonmarketable yield as affected by organic fertilizers.
Lettuce applied with chicken manure were earliest to harvest, produced widest leaves
and plant canopy and produced heaviest weight per head leading to highest marketable yield.
Lettuce applied with mushroom compost also produced wider leaves and plant canopy,
produced heavier weight per head and higher marketable yield. Control plants were the latest
to harvest, produced the lowest weight of heads and marketable yield. Plants applied with
horse manure and vermicompost produced narrower leaves, narrower plant canopy, lower
weight per head and lower marketable yield.
Broccoli
Significant differences were noted on plant height, curd diameter, weight per curd and
marketable yield but no significant differences on nonmarketable yield as an effect of organic
fertilizers.
Broccoli applied with chicken manure produced the heaviest curd leading to highest
marketable yield followed by plants applied with mushroom compost. Control plants were
the shortest, gave the narrowest curd diameter, lowest weight per curd and marketable yield.
Other treatments applied with other organic fertilizers had produced lower weight of curds
and marketable yield.
Treatments Production
Cost (Php) Yield (kg/ha) Less
10% spoilage &
price fluctuation (Php18/kg)
Gross
Income
(Php)
Net Income
(Php) ROI (%)
No fertilizer 132,650 12,488 224,784 92,134 69.45 Chicken manure 156,650 20,840 375,120 218,470 148.92 Mushroom compost 152,650 17,200 309,600 156,950 102.82
Horse manure 156,650 18,050 324,900 168,250 107.41
Vermicompost 180,650 18,070 325,260 144,610 80.05
20
Carrot
There were significant differences on weight per taproot, marketable and
nonmarketable yield but no significant differences on taproot length, shoulder and core
diameter as affected by organic fertilizers.
Carrots applied with chicken manure produced the highest weight per taproot leading
to the highest marketable and nonmarketable yield. Control plants had the lowest taproot
weight, lowest marketable and nonmarketable yield. Other treatments had lower taproot
weight leading to lower marketable and nonmarketable yield.
Chemical analysis of the soil
Most of the plots applied with organic fertilizers decreased in pH in both locations
after harvest of the test crops. Also, most treatment plots decreased in organic matter in
Buguias but remained same in Baguio. Further, all treatment plots decreased in phosphorus
in both locations. Most treatment plots increased in potassium on soil planted to lettuce may
be because of less nutrients absorbed brought by harvesting in vegetative stage but decreased
on soil planted to broccoli and carrot in both locations may be due to more absorption by both
crops for curd and storage root development.
Return on Investment
Return on investment was highest in the application of chicken manure on the test
crops because of high marketable yield. This was followed by the application of mushroom
compost on lettuce and broccoli but application of horse manure on carrot. The lowest ROI
was taken from the application of vermicompost on lettuce and broccoli due to higher price
of the organic fertilizer but on carrot was from the control due to low marketable yield.
Conclusions
Based on the results the following conclusions are drawn:
1. The application of organic fertilizers affected the growth and development of lettuce,
broccoli and carrots in Buguias and Baguio.
2. The application of chicken manure enhanced the production of heaviest lettuce heads,
broccoli curds and taproot of carrots resulting in highest marketable yields.
3. The application of mushroom compost also enhanced the production of heavier
lettuce heads and broccoli curds, and application of horse manure on carrot enhanced
heavier taproot, resulting in higher marketable yields.
4. The application of chicken manure is the most profitable for having the highest ROI
on lettuce (152.19%), broccoli (179.42 %) and carrot (148.92 %) followed by the
application of mushroom compost on lettuce and broccoli, and horse manure
application on carrot.
5. Plots applied with organic fertilizers decreased in phosphorus content of the soil
planted to the test crops in both locations; most plots applied with organic fertilizers
had decreased in soil pH, decreased in potassium content of the soil planted to
broccoli and carrot but increased in potassium content of the soil planted to lettuce.
21
Recommendations
The application of chicken manure is recommended for lettuce, broccoli and carrot for
enhancing heaviest weight of produce resulting in highest yield and highest ROI. Mushroom
compost can also be an alternate organic fertilizer for the three crops.
LITERATURE CITED
ABADILLA. D. 1982. Organic farming. AFA Publications, Inc. Quezon City, Philippines
AGRI BUSENESS WEEK. 2009. Farmers, growers, institutions unite to promote organic
farming in Cordillera. Agri Business Week. www. agribusinessweek.com
AGRICULTURE AND AGRI-FOOD AND PEI DEPARTMENT OF AGRICULTURE,
FISHERIS AND AQUACULTURE CANADA. 2004. Lobster processing waste for
nutrition and disease control in potatoes and carrots. 2nd
OACC Organic Research
Workshop.
AQUINO, C. 2012. The Philippine vegetable industry almost comatose.
www.focusonpoverty.org
ATI-CAR. 2011. The vegetable industry. Agricultural Training Institute. Benguet State
University. La Trinidad, Benguet. Philippines. www.slideshare.net/aticar/vegetable-
industry
BAS. 2005. Situationer on highland vegetables. Bureau of Agricultural Statistics-Crops
Statistics Division. Quezon City. Philippines. Vol 2 http//bas.gov.ph
BAS. 2010. Regional crop statistics. Bureau of Agricultural Statistics. Baguio City.
Philippines
BAS. 2011. Situationer on highland vegetables. Bureau of Agricultural Statistics. Baguio
City. Philippines
BATT, P. J., S. CONCEPTION, K. DAGUPEN and R. M. PRIOR. The vegetable industry in
the Philippines. The final report, ACIAR, Australia.
http://www.aciar.gov.au/system/files/sites/aciar/files/node/4189/Final+report+ASEM-
2005-062.pdf
centrosaka.org/publication. 2012. Situationer on highland vegetables
DAVIS, J.G. and C. R. WILSON. 2012. Choosing a soil amendment. Colorado State
University Extension. www.ext.colostate.edu/Garden/07235.html
GUREL, F. B. and S. MILLER. 2010. Disease management in organic lettuce production in
Organic Management. Ohio State University. http:/www.extension.org/pages/30849
22
HAMMERMEISTER, A.M., T. ASTATKIE, E.A. JELIAZKOVA, P.R. WARMAN and R.C.
MARTIN. 2006. Nutrient supply from organic amendments applied to unvegetated
soil, lettuce and orchardgrass. Canadian Journal of Soil Science. 86: 21-33
MCGITTEN, M. E., I. LEBRON, M. NGOUAJIO AND C. M. HUTCHINSON. 2010. Soil
organic amendment change low organic matter agroecosystems. ISHS Acta
Horticulture 638. XXVI International Horticulture Congress: Sustainability of
Horticultureal Systems in the 21st Century
OKUR, N., H.H. KAYIKCIOLU, B. OKUR and S.DELBACAK. 2007. Organic amendment
based on tobacco waste compost and farmyard manure: Influence on soil biological
properties and butter-head lettuce. Ege University, Bornova, Turkey.
http://journals.tubitak.gov.tr/agriculture/issues/tar-08-32-2/tar-32-2-2-0707-24.pdf
OKPALA, E. U. 2008. Effect of soil amendments on damping-off of lettuce caused by
Corticium praticola. Annals of Applied Biology. Vol. 80 pp 155-162
STEPHENS, J.M. and S. R. KOSTEVICZ. 2009. Producing garden vegetables with organic
soil amendments. Horticultural Sciences Department. Cooperative Extension
Service, Institute of Food and Agricultural Sciences, University of Florida, Gainsville
FL 32611
SNYDER, M. 2009. Organic vegetable gardening blog-organic gardening tips and ideas.
TURNER, R. 2012. Soil amendments for organic vegetable gardens in Pacific Northwest.
http://www.ehow.com/list7233091soil-vegetable-gardens-pacific-
northwest.html#ixzz25fzBkPMi.

23
Appendix Table 1. Cost and Return of Lettuce applied with organic fertilizers*
I.Cost of Production A. Labor Cost
Operation/Activity
Man Day (Php 300/day)
Value (Php)
1. Seedling tray preparation and care of
seedlings
15 4,500
2. Plastic roofing installation for seedling
protection
2 600
3. Land clearing 25 7,500
4. Plowing/plot preparation 30 9,000 5. Transplanting 30 9,000 6. Care and maintenance ( weeding,
fertilization, spraying & watering)
80 24,000
7. Harvesting 20 6,000 8. Sorting and packing 10 3,000
Sub-Total 212 63,600 B.Cost of Inputs, Supplies & Materials Quantity Value (Php)
1. Seeds 200g @1,500/50g 6,000
2. Biological pesticide 2li @ 500/li 1,000 3. Carton/plastic 1,500 @ 10/pc 15,000 4. Garden hose 10 rolls @ 1800/roll 18,000 5. Plastic twine 10 rolls @65/roll 650 6. Bamboo posts (for roof) 10 pcs @20/pc 200 7. Wire (for roof) 1kg @ 150/kg 150 8. Plastic sheet (roofing) 15 kg @ 200/kg 3,000
Sub-Total 44,000
C.Tools & Equipment Depreciation Cost
1. Knapsack sprayer 2 units @ 2,500/unit 500 2. Rake 5 pcs @ 250/pc 125 3. Grab hoe 8 pcs @ 350/pc 280 4. Shovel 3 pcs @ 650/pc 190 5. Cythe 8 pcs @ 175/pc 140 6. Trowel 8 pcs @ 175/pc 140 7. Knife 5 pcs @ 50/pc 25
Sub-Total 1,400
D. Land rent, 10,000 sq.m. @ 25,000/3 mo. 25,000
Total Cost of Production 134,000
* Cost of labor, inputs and equipment were based on 2015 prices.
Treatments Production
Cost (Php) Yield
(t/ha) Less 10% spoillage
& price fluctuation (Php15/kg)
Gross
Income
(Php)
Net
Income (Php)
ROI
(%)
No fertilizer 134,000 15.04 13,536 203,040 69,040 51.52 Chicken manure 148,400 27.72 24,950 374,250 225,850 152.19 Mushroom
compost 146,000 20.75 18,680 280,200 134,200 91.92
Horse manure 148,400 18.67 16,800 252,000 103,600 69.81 Vermicompost 174,000 18.40 16,560 248,400 74,400 42.76
24
Appendix Table 2. Cost and Return of Broccoli with application of organic fertilizers*
I.Cost of Production A. Labor Cost
Operation/Activity
Man Day (Php 300/day)
Value (Php)
1. Seedling tray preparation and care of
seedlings 10 3,000
2. Plastic roofing installation for seedling
protection 2 600
3. Land clearing 25 7,500
4. Plowing/plot preparation 30 9,000 5. Transplanting 30 9,000 6. Care and maintenance ( weeding, spraying,
fertilization & watering) 80 24,000
7. Harvesting 20 6,000 8. Sorting and packing 10 3,000
Sub-Total 207 62,100 B.Cost of Inputs, Supplies & Materials Quantity Value (Php)
1. Seeds 350g @500/10g 17,500
2. Biological pesticide 2li @ 500/li 1,000 3. Basket 25 @ 150/pc 3,750 4. Garden hose 10 rolls @ 1800/roll 18,000 6. Bamboo posts (for roof) 10 pcs @20/pc 200 7. Wire (for roof) 1kg @ 150/kg 150 8.Plastic sheet (roofing) 15 kg @ 200/kg 3,000
Sub-Total 43,600
C.Tools & Equipment Depreciation Cost
1. Knapsack sprayer 2 units @ 2,500/unit 500 2. Rake 5 pcs @ 250/pc 125 3. Grab hoe with handle 8 pcs @ 350/pc 280 4. Shovel 3 pcs @ 650/pc 190 5. Cythe 8 pcs @ 175/pc 140 6. Trowel 8 pcs @ 175/pc 140 7. Knife 5 pcs @ 50/pc 25
Sub-Total 1,400
D. Land rent, 10,000 sq.m. @ 25,000/3 mo. 25,000
Total Cost of Production 132,100
* Cost of labor, inputs and equipment were based on 2015 prices.
Treatments Production
Cost (Php) Yield
(t/ha) Less 10% spoillage
& price fluctuation (Php25/kg)
Gross
Income
(Php)
Net
Income
(Php)
ROI
(%)
No fertilizer 132,100 9.64 8,680 217,000 84,900 64.27 Chicken manure 152,100 18.11 17,000 425,000 272,900 179.42 Mushroom
compost 148,100 12.42 11,180 279,500 131,400 88.72
Horse manure 151,300 11.48 10,330 258,250 103,600 70.69 Vermicompost 182,100 11.17 10,050 251,250 69,150 37.97

25
Appendix Table 3. Cost and Return of Carrot applied with organic fertilizers*
I.Cost of Production A. Labor Cost
Operation/Activity
Man Day (Php 300/day)
Value (Php)
1. Land clearing 25 7,500
2. Plowing/plot preparation 30 9,000 5. Sowing/planting (direct seeding) 30 9,000 6. Care and maintenance ( weeding, thinning
twice, spraying, fertilization & watering) 110 33,000
7. Harvesting 25 7,500 8. Sorting, packing & hauling 15 4,500
Sub-Total 235 70,500 B.Cost of Inputs, Supplies & Materials Quantity Value (Php)
1. Seeds 25 cans @450/300g 11,250
2. Biological pesticide 4 li @ 500/li 2,000 3. Sacks 450 pcs @ 10/pc 4,500 4. Garden hose 10 rolls @ 1800/roll 18,000
Sub-Total 35,750
C.Tools & Equipment Depreciation Cost
1. Knapsack sprayer 2 units @ 2,500/unit 500 2. Rake 5 pcs @ 250/pc 125 3. Grab hoe with handle 8 pcs @ 350/pc 280 4. Shovel 3 pcs @ 650/pc 190 5. Cythe 8 pcs @ 175/pc 140 6. Trowel 8 pcs @ 175/pc 140 7. Knife 5 pcs @ 50/pc 25
Sub-Total 1,400
D. Land rent, 10,000 sq.m. @ 25,000/3 mo. 25,000
Total Cost of Production 132,650
* Cost of labor, inputs and equipment were based on 2015 prices.
Cost and Return of Carrot with application of organic fertilizers
Treatments Production
Cost (Php) Yield
(t/ha) Less 10% spoilage
& price fluctuation (Php18/kg)
Gross
Income
(Php)
Net
Income
(Php)
ROI
(%)
No fertilizer 132,650 13.87 12,488 224,784 92,134 69.45 Chicken manure 156,650 23.15 20,840 375,120 218,470 148.92 Mushroom
compost 152,650 19.11 17,200 309,600 156,950 102.82
Horse manure 156,650 20.06 18,050 324,900 168,250 107.41 Vermicompost 180,650 20.08 18,070 325,260 144,610 80.05


![102 BPI v BPI Employees Union-Davao Chapter [Full Text]](https://static.fdocuments.in/doc/165x107/577cd0261a28ab9e78918703/102-bpi-v-bpi-employees-union-davao-chapter-full-text.jpg)