EVALUATION OF NEW MEASURES OF ASSISTIVE H E … · is also responsible for policy coordination and...
46
U.S. Department of Health and Human Services Assistant Secretary for Planning and Evaluation Office of Disability, Aging and Long-Term Care Policy EVALUATION OF NEW MEASURES OF ASSISTIVE TECHNOLOGY AND THE HOME ENVIRONMENT FROM THE 2005 PILOT STUDY OF TECHNOLOGY AND AGING September 2006
Transcript of EVALUATION OF NEW MEASURES OF ASSISTIVE H E … · is also responsible for policy coordination and...

U.S. Department of Health and Human Services Assistant Secretary for Planning and Evaluation
Office of Disability, Aging and Long-Term Care Policy
EVALUATION OF NEW MEASURES OF ASSISTIVE
TECHNOLOGY AND THE HOME ENVIRONMENT FROM THE 2005 PILOT STUDY OF
TECHNOLOGY AND AGING
September 2006

Office of the Assistant Secretary for Planning and Evaluation The Office of the Assistant Secretary for Planning and Evaluation (ASPE) is the principal advisor to the Secretary of the Department of Health and Human Services (HHS) on policy development issues, and is responsible for major activities in the areas of legislative and budget development, strategic planning, policy research and evaluation, and economic analysis. ASPE develops or reviews issues from the viewpoint of the Secretary, providing a perspective that is broader in scope than the specific focus of the various operating agencies. ASPE also works closely with the HHS operating divisions. It assists these agencies in developing policies, and planning policy research, evaluation and data collection within broad HHS and administration initiatives. ASPE often serves a coordinating role for crosscutting policy and administrative activities. ASPE plans and conducts evaluations and research--both in-house and through support of projects by external researchers--of current and proposed programs and topics of particular interest to the Secretary, the Administration and the Congress.
Office of Disability, Aging and Long-Term Care Policy The Office of Disability, Aging and Long-Term Care Policy (DALTCP), within ASPE, is responsible for the development, coordination, analysis, research and evaluation of HHS policies and programs which support the independence, health and long-term care of persons with disabilities--children, working aging adults, and older persons. DALTCP is also responsible for policy coordination and research to promote the economic and social well-being of the elderly. In particular, DALTCP addresses policies concerning: nursing home and community-based services, informal caregiving, the integration of acute and long-term care, Medicare post-acute services and home care, managed care for people with disabilities, long-term rehabilitation services, children’s disability, and linkages between employment and health policies. These activities are carried out through policy planning, policy and program analysis, regulatory reviews, formulation of legislative proposals, policy research, evaluation and data planning. This report was prepared under contract #HHS-100-03-0011 between HHS’s ASPE/DALTCP and the Urban Institute. For additional information about this subject, you can visit the DALTCP home page at http://aspe.hhs.gov/_/office_specific/daltcp.cfm or contact the ASPE Project Officers, William Marton and Hakan Aykan, at HHS/ASPE/DALTCP, Room 424E, H.H. Humphrey Building, 200 Independence Avenue, S.W., Washington, D.C. 20201. Their e-mail addresses are: [email protected] and [email protected].

EVALUATION OF NEW MEASURES OF ASSISTIVE TECHNOLOGY AND THE HOME ENVIRONMENT
FROM THE 2005 PILOT STUDY OF TECHNOLOGY AND AGING
Vicki A. Freedman University of Medicine and Dentistry of New Jersey
Emily M. Agree
Johns Hopkins University
Jennifer C. Cornman University of Medicine and Dentistry of New Jersey
September 27, 2006
Prepared for Office of Disability, Aging and Long-Term Care Policy
Office of the Assistant Secretary for Planning and Evaluation U.S. Department of Health and Human Services
Contract #HHS-100-03-0011 The views in this overview reflect those of the authors alone and do not represent those of the authors’ affiliations or funding agencies. The authors are solely responsible for any errors or omissions.

TABLE OF CONTENTS EXECUTIVE SUMMARY ................................................................................................ iii INTRODUCTION............................................................................................................. 1 DATA AND METHODS................................................................................................... 3
Questionnaire Development ...................................................................................... 3 Measures ................................................................................................................... 3 Pilot Test.................................................................................................................... 4 Assessing Validity and Reliability of Survey Items..................................................... 6
ANALYSIS ...................................................................................................................... 7
QUESTION 1: How Do Questions That Combine Several Environmental Features or Devices Compare with More Detailed Items? ................................... 7
QUESTION 2: How Can Measures of the Home Environment and Assistive Technology be Combined with Measures of Functioning to Enhance Understanding of Disability?............................................................................... 12
QUESTION 3: Can a Valid and Reliable Scale be Created from Questions that Link Technology Use to Quality of Life Measures?............................................. 19
DISCUSSION ................................................................................................................ 23 REFERENCES.............................................................................................................. 25 APPENDIX: SURVEY MODULES TO MEASURE ASSISTIVE TECHNOLOGY
AND THE HOME ENVIRONMENT
i
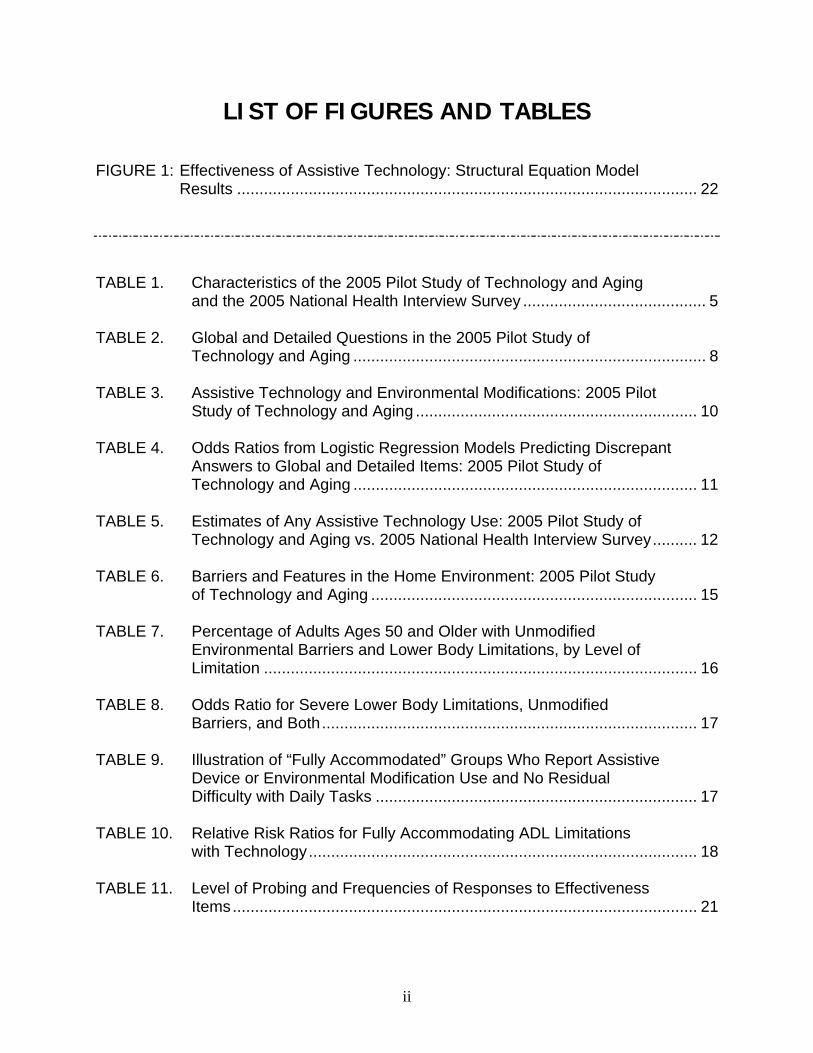
LIST OF FIGURES AND TABLES FIGURE 1: Effectiveness of Assistive Technology: Structural Equation Model Results ....................................................................................................... 22 TABLE 1. Characteristics of the 2005 Pilot Study of Technology and Aging and the 2005 National Health Interview Survey ......................................... 5 TABLE 2. Global and Detailed Questions in the 2005 Pilot Study of Technology and Aging ............................................................................... 8 TABLE 3. Assistive Technology and Environmental Modifications: 2005 Pilot Study of Technology and Aging ............................................................... 10 TABLE 4. Odds Ratios from Logistic Regression Models Predicting Discrepant
Answers to Global and Detailed Items: 2005 Pilot Study of Technology and Aging ............................................................................. 11 TABLE 5. Estimates of Any Assistive Technology Use: 2005 Pilot Study of
Technology and Aging vs. 2005 National Health Interview Survey.......... 12 TABLE 6. Barriers and Features in the Home Environment: 2005 Pilot Study of Technology and Aging ......................................................................... 15 TABLE 7. Percentage of Adults Ages 50 and Older with Unmodified Environmental Barriers and Lower Body Limitations, by Level of Limitation ................................................................................................. 16 TABLE 8. Odds Ratio for Severe Lower Body Limitations, Unmodified Barriers, and Both.................................................................................... 17 TABLE 9. Illustration of “Fully Accommodated” Groups Who Report Assistive Device or Environmental Modification Use and No Residual Difficulty with Daily Tasks ........................................................................ 17 TABLE 10. Relative Risk Ratios for Fully Accommodating ADL Limitations with Technology....................................................................................... 18 TABLE 11. Level of Probing and Frequencies of Responses to Effectiveness Items........................................................................................................ 21
ii

EXECUTIVE SUMMARY
Although not exclusively targeted at older adults, assistive technologies appear to be increasingly important in the daily lives of older adults and even may be linked to the decline during the 1990s in personal care use by older persons. These trends, along with projected increases in the number of older persons with disabilities and shortages of long-term care providers, have spurred interest among policy makers regarding how to best leverage technological solutions to reduce dependence among adults as they age. Yet there has been limited nationally focused information to guide these discussions. With current surveys it is not possible to identify groups at-risk for disability because of an environmental barrier or lack of modification to the home, to track the contributions of environmental changes to declines in late-life disability, or to assess the extent to which technology enhances the lives of older adults.
To begin to fill this void, the Office of the Assistant Secretary for Planning and
Evaluation in the U.S. Department of Health and Human Services funded the 2005 Pilot Study of Technology and Aging in cooperation with the National Institute on Aging and the National Center for Health Statistics. The purpose of that project was to develop and disseminate a set of questions on assistive technology use and the home environment for national surveys on health and aging. The project involved a review of existing measurement approaches, consultation with stakeholders in policy and national surveys, discussions with technical advisory group members, cognitive testing, and a pilot test with 360 people ages 50 and older. The final recommended instrument was designed as a series of brief modules that can be adopted into a computer-assisted telephone interview.
This report highlights the analytic properties of the new instrument. We address
three distinct but complimentary questions:
• How do questions that combine several environmental features or devices (“global measures”) compare with more detailed items?
• How can measures of the home environment be combined with measures of
functioning to enhance understanding of disability?
• Can a valid and reliable scale be created from questions that link technology use of quality of life measures?
Analyses provide several useful insights into measurement issues relevant to
discussions of policies on disability and aging. First, questions about assistive technology use that combine items into a single question provide modestly lower estimates than more detailed measures. Importantly, our analyses suggest that the single-item in the National Health Interview Survey (NHIS) and the Behavioral Risk Factor Surveillance System to assess assistive technology use, which names cane,
iii

iv
walker, special telephone, and special bed as examples of special equipment used because of a health problem, may under-estimate use by as much as 50%.
Second, we demonstrate at least two ways to combine information about the home
environment with measures of functioning to identify groups of interest to policy makers, particularly those interested in furthering declines in late-life disability prevalence. In doing so, we find that potentially as many as one in four adults ages 50 and older might be targeted for an environmental modification in their home because they have a severe lower body limitation, a physical barrier in their home, and no existing modification. We also find that approximately 27% of adults ages 50 and older currently are able to fully accommodate their personal care activities with device use. Incorporating this type of information into national surveys that track late-life disability would provide important insights into the role of environmental factors in current trends.
Third, our analysis suggests that a valid and reliable scale reflecting the
effectiveness of technology can be created from three questions designed to measure improvements in safety, control, and participation due to technology. However, for two of the three questions, over 20% of respondents in our study required clarification, suggesting that further improvement in question wording may be useful.
These analyses suggest several next steps for integrating measures of assistive
technology and the home environment into national surveys. Global items that combine multiple items into a single measure generally under-estimate use and should be avoided with one exception. A global item that combines the most commonly used mobility devices into a single measure has good measurement properties. Existing national surveys, such as the NHIS and the Behavioral Risk Factor Surveillance System, may well consider a more focused mobility-related item in place of the current approach. We further recommend the use of a list-driven set of questions to identify the existence, addition, and use of “fixed” assistive technologies (e.g., grab bars, railings, and ramps). Such technologies are quite prevalent in the homes of older persons and are used as frequently as, and in some cases more often than, portable mobility devices. The 2-3 minute module in the Appendix serves as a useful, succinct approach, while allowing analytic flexibility to identify those who have, have added, and use environmental modifications. Finally, with respect to measuring the effectiveness of assistive technology, this analysis highlighted the need to recognize the influence of technologies on other domains beyond dependency that matter for quality of life in aging. Additional pilot testing may be helpful to expand upon this approach.

INTRODUCTION Since the passage of the Americans with Disabilities Act in 1990, the Federal
Government has undertaken several initiatives to enhance access to assistive and mainstream technologies for persons with disabilities. The 1998 Assistive Technology Act and President Bush’s New Freedom Initiative, for example, have targeted the removal of environmental barriers and increased access to assistive and universally designed technologies. Accompanying these policy shifts has been an increase in the types of technologies and supportive living environments to help people with disabilities to live independently and participate in daily life. Although not exclusively targeted at older adults, several studies suggest that technologies appear to be increasingly important in the daily lives of older adults and even may be linked to the decline during the 1990s in personal care use by older adults (Spillman, 2005; Freedman, et al., 2006).
These trends, along with projected increases in the number of older adults with disabilities and shortages of long-term care providers, have spurred interest among policy makers regarding how to best leverage technologies to prevent dependence among adults as they age. Yet there has been limited nationally focused information to guide these discussions. Although many national surveys on health and aging now include some measures of assistive technology, there is little consistency across surveys (Cornman, Freedman, and Agree, 2005) and little evidence regarding the measurement properties of different approaches. For example, it is unclear whether questions about assistive technology that combine different types of devices into a single question under or over-estimate the role of technology in the lives of older adults. In addition, important gaps in content remain particularly with respect to the environments in which older adults live. For example, surveys currently do not distinguish among the existence of an environmental feature (say, a grab bar or ramp), the addition of that feature, and its use. Moreover, few survey-based items exist to measure the effectiveness of technology in the daily lives of older adults. Consequently, with current surveys it is not possible to identify groups at-risk for disability because of an environmental barrier or lack of modification to the home, to track the contributions of environmental changes to declines in late-life disability, or to assess the extent to which technology enhances the lives of older adults.
The need to incorporate valid and reliable items on assistive technology and the
environment into national surveys was highlighted at a recent meeting convened by the Office of the Assistant Secretary for Planning and Evaluation (ASPE) in the U.S. Department of Health and Human Services. In May 2005, ASPE brought together disability measurement and policy experts to re-think measurement issues around late-life disability in light of national survey efforts. (For background see Freedman and Waidmann, 2005. For a summary see Freedman, Waidmann, and Spillman, 2005). Presentations included preliminary results from the 2005 Pilot Study of Technology and Aging, a project funded by ASPE in cooperation with the National Institute on Aging and the National Center for Health Statistics to develop and disseminate a set of questions
1

on assistive technology use and the home environment for national health and aging surveys.
Development of the survey instrument involved an extensive review of existing
measurement approaches, consultation with stakeholders in policy and national surveys, discussions with technical advisory group members, cognitive testing, and a pilot test with 360 people ages 50 and older (for details see Freedman, Agree, and Cornman, 2005). Particular attention was given to creating brief items that could be administered by telephone. The final recommended instrument was designed as a series of modules that can be adopted into a computer-assisted telephone interview. The full instrument, consisting of five modules, takes approximately 8-10 minutes to administer. There is also a brief (2-3 minute) module (see Appendix).
The purpose of this report is to highlight the analytic properties of the assistive
technology and environment measures in the final recommended module. We address three distinct but complimentary questions:
• How do questions that combine several environmental features or devices
(“global measures”) compare with more detailed items?
• How can measures of the home environment be combined with measures of functioning to enhance understanding of disability?
• Can a valid and reliable scale be created from questions that link technology use
to quality of life measures?
2

DATA AND METHODS
Questionnaire Development Questionnaire development for the 2005 Pilot Study of Technology and Aging
involved several steps. After identifying and defining key concepts of interest, we reviewed existing national surveys and clinical tools designed to measure assistive technology and environmental aspects of disability as well as content related to quality of life. Through this process we identified several important gaps in content with respect to measures of the home environment, assistive technology use, and effectiveness of technology. Next we obtained input from policy makers, survey designers, and an expert panel, which guided our draft of a 30-minute instrument that could be administered by telephone. Cognitive testing of the instrument took place during July and August 2003 at the Questionnaire Design Research Laboratory (QDRL) at the National Center for Health Statistics. Testing was conducted in three rounds (N=28; ranging in age from 28 to 86 years). All interviews were videotaped. After each round, the project team viewed the tapes and the QDRL provided feedback regarding the effectiveness of the questions in eliciting the appropriate responses. The questionnaire was revised between rounds and finalized after the completion of the third round. Further details are available in Wilson et al. (2004) and Freedman, Agree, and Cornman (2005).
Measures
The final Pilot Study of Technology and Aging questionnaire consisted of an
introductory section of global items designed to succinctly identify use of common assistive technologies over a 30-day period and features of the environment that facilitate functioning (e.g., the existence, addition, and use of items such grab bars, ramps and railings). The introductory section was followed by more detailed questions on the home environment, use of mobility and other technologies, and effectiveness of technology (both in terms of quality of life and difficulty in carrying out daily activities when using the devices but without personal assistance). A final section collected basic demographic and socioeconomic information. Each of these sections is described briefly below.
Global items were tested to determine if they could accurately identify assistive
technology use with a succinct set of items. The section included seven items: 30-day use of mobility devices, 30-day use of sensory devices, three items identifying the existence of environmental features that facilitate functioning (at the entrance, to go up and down stairs, and in the bathroom), whether any of these features were added (and therefore considered environmental modifications) and 30-day use of any of these features.
3
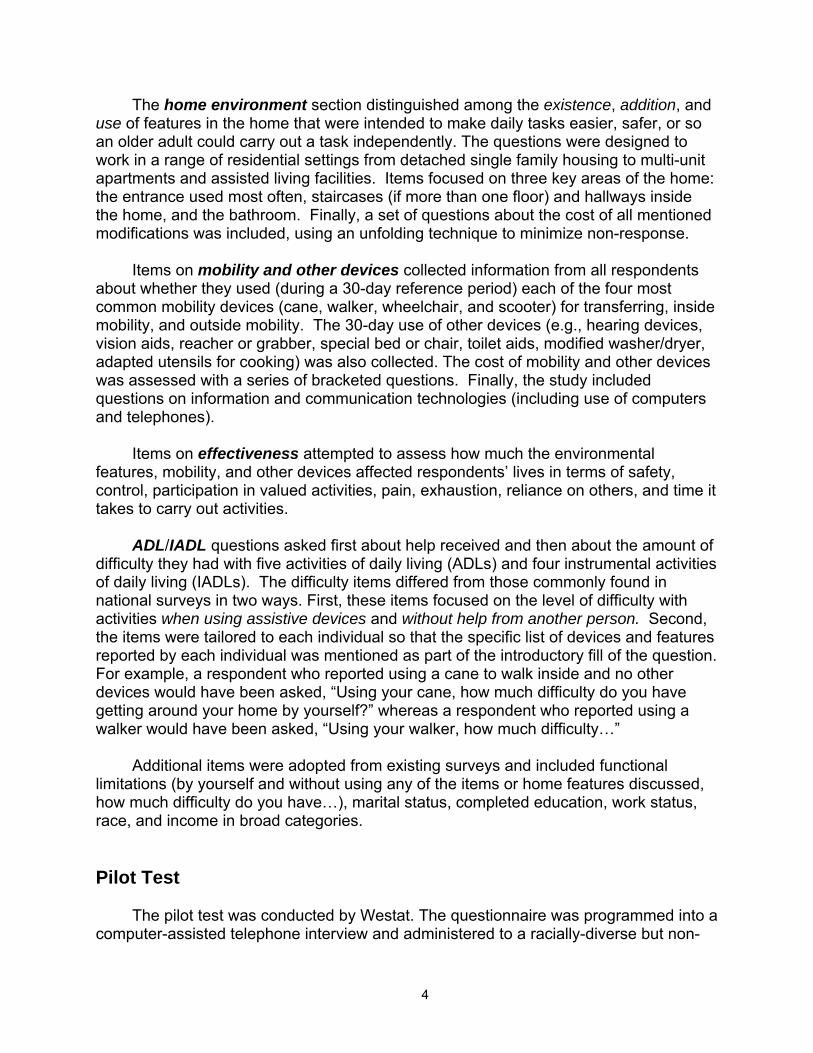
The home environment section distinguished among the existence, addition, and use of features in the home that were intended to make daily tasks easier, safer, or so an older adult could carry out a task independently. The questions were designed to work in a range of residential settings from detached single family housing to multi-unit apartments and assisted living facilities. Items focused on three key areas of the home: the entrance used most often, staircases (if more than one floor) and hallways inside the home, and the bathroom. Finally, a set of questions about the cost of all mentioned modifications was included, using an unfolding technique to minimize non-response.
Items on mobility and other devices collected information from all respondents
about whether they used (during a 30-day reference period) each of the four most common mobility devices (cane, walker, wheelchair, and scooter) for transferring, inside mobility, and outside mobility. The 30-day use of other devices (e.g., hearing devices, vision aids, reacher or grabber, special bed or chair, toilet aids, modified washer/dryer, adapted utensils for cooking) was also collected. The cost of mobility and other devices was assessed with a series of bracketed questions. Finally, the study included questions on information and communication technologies (including use of computers and telephones).
Items on effectiveness attempted to assess how much the environmental
features, mobility, and other devices affected respondents’ lives in terms of safety, control, participation in valued activities, pain, exhaustion, reliance on others, and time it takes to carry out activities.
ADL/IADL questions asked first about help received and then about the amount of
difficulty they had with five activities of daily living (ADLs) and four instrumental activities of daily living (IADLs). The difficulty items differed from those commonly found in national surveys in two ways. First, these items focused on the level of difficulty with activities when using assistive devices and without help from another person. Second, the items were tailored to each individual so that the specific list of devices and features reported by each individual was mentioned as part of the introductory fill of the question. For example, a respondent who reported using a cane to walk inside and no other devices would have been asked, “Using your cane, how much difficulty do you have getting around your home by yourself?” whereas a respondent who reported using a walker would have been asked, “Using your walker, how much difficulty…”
Additional items were adopted from existing surveys and included functional
limitations (by yourself and without using any of the items or home features discussed, how much difficulty do you have…), marital status, completed education, work status, race, and income in broad categories.
Pilot Test The pilot test was conducted by Westat. The questionnaire was programmed into a
computer-assisted telephone interview and administered to a racially-diverse but non-
4

representative sample of 360 adults ages 50 or older living in the community. The national sample, drawn from a marketing list, over-sampled individuals in older age groups as follows: 50-64 (N=124); 65-79 (N=124); and 80+ (N=112). Individuals ages 50-64 living in households with an individual reporting a disability were also over-sampled (N=78). The sample included individuals living in housing especially for older adults or those with disabilities (N=46, including 21 in assisted living facilities with nursing care and meals), Blacks (N=50), and individuals living in rural areas (N=81). No refusal conversion was attempted; the cooperation rate (completed interviews/(completed interviews + refusals)) was 39%. The interview length varied from ten minutes to one hour, with the average interview lasting 22 minutes.
We compared the unweighted sample to estimates from the 2005 National Health
Interview Survey (NHIS), which contained similar demographic and functioning indicators (Table 1). The pilot sample had fewer females and more adults with a high school education than the national sample and by design over-represented the oldest old, minorities, and those with functional limitations.
TABLE 1. Characteristics of the 2005 Pilot Study of Technology and Aging and the 2005
National Health Interview Survey 2005 Pilot Study of
Technology and Aging (N=360)
2005 National Health Interview Survey
(N=13,480)
Characteristic Unweighted Weighted Weighted Female 46.1 53.3 54.0 Age
50-64 65-79 80+
34.4 34.4 31.1
57.6 30.6 11.8
58.9 30.0 11.1
Black 13.9 13.5 9.8 Education
<12 years 12 years 13+ years
12.2 22.8 65.0
14.1 22.6 63.4
18.7 31.6 49.7
1+ Functional Limitations 78.3 52.5 50.5 1+ Severe Functional Limitations 41.7 30.3 28.7 For analytic purposes, analytic weights were constructed by taking a ratio of the
weighted population from the 2005 NHIS to the unweighted sample size from the pilot data. Weights were constructed for 36 distinct cells, based on sex (male, female), age group (50-64, 65-79, 80+), completed education level (<high school, >=high school), and level of functioning (score for difficulty stooping, reaching up, grasping, climbing stairs, standing for two hours, and walking ¼ mile). The weighted pilot data reflected national distributions in terms of sex, age, and functioning. The percentage of Blacks and those with a high school education were slightly higher in the weighted pilot data than in the national sample (p=0.02 and p<0.01, respectively).
5

Assessing Validity and Reliability of Survey Items A subset of 150 interviews reflecting the pilot sample composition were tape
recorded and coded to reflect key respondent and interviewer behaviors (e.g., reading questions other than verbatim, probing and providing definitions, providing qualified or inadequate answers, requesting clarification or definition, interrupting the question). This approach, known as “behavior coding” provides a standardized method of identifying potential problems with the validity and reliability of survey items (Fowler and Cannell, 1996).
In behavior coding analysis, the validity and reliability of an item is called into
question when 15% or more of respondents or interviewers have problems with the item. This threshold is relevant for wording changes, qualified or inadequate answers, and requests for clarification. However, for probing behaviors, the literature has generally focused on inappropriate probing as the behavior of interest. Since the pilot study did not evaluate the appropriateness of the probing, probing levels of 15% are not necessarily problematic. Similarly, interrupting behaviors are not necessarily problematic if they occur as part of a learned response pattern to a repetitive series.
Because of skip patterns in the instrument, only 29 of the 49 items recommended
in the 2-3 minute module were coded for enough respondents (N>=20) to examine item-specific behaviors. All 29 items had less than 3% of responses coded as inadequate. Most items also had a very low percentage (4% or lower) involving wording changes by interviewers, requests by respondents for clarification or definitions, and interruption of questions. These items required probing on average 6% of the time. (Not included in these estimates are items related to the effectiveness of assistive technology, described in more detail as part of Question 3, for which probing averaged 20%.)
6

ANALYSIS In this section we present analysis of the weighted pilot data. For each question
we begin with relevant background information, then discuss the analytic approach undertaken, and finally provide results. The next, and final, section of the report discusses the implications of the findings from all thee analyses.
QUESTION 1: How Do Questions That Combine Several Environmental Features or Devices (“global measures”) Compare with More Detailed Items?
Background
When crafting items for national surveys there is an unavoidable tension between
the depth of information that can be collected and the amount of time available. In general, national surveys have very limited amount of time to devote to new items. As part of the Pilot Study on Technology and Aging, several key national survey efforts were contacted to determine their preferences for collecting this information. Although most survey contacts expressed some interest in the topic, they also reported that they would be more likely to adopt an instrument that was five minutes or less.
The pilot study tested items that succinctly identify six distinct concepts: mobility
device use, sensory device use, the existence of fixed assistive technologies (e.g., ramps, handrails, stair glides, bath or shower seat, raised toilet seat), modifications made to the environment (e.g., the addition of fixed assistive technology), the use of those environmental features, and the presence of physical barriers in the home (e.g., steps into the home, living space on more than one floor, no separate walk-in shower).
One hurdle that was immediately apparent was that terms such as “assistive
technology,” “environmental features,” and “environmental modifications” were not transparent to many respondents. Language was therefore developed, cognitively tested, and ultimately adopted that asked respondents about items they have or features in their home that “make your daily activities easier, safer or so you can do them on your own.” Whenever possible specific devices that were among the most commonly used were named, and simple definitions provided to the interviewer to read as needed.
A second complication identified through cognitive testing was that respondents’
experiences with disability and technology were not static. Thus, questions about use that did not indicate a reference period elicited answers about prior behaviors as well as current experience. Orienting respondents to a recent time period (e.g., in the last 30 days) remedied this problem. A 30-day window was tested and ultimately adopted because it was wide enough to capture less frequent device use but considered narrow
7

enough not to distort memory. These principles were incorporated into both global and detailed questions (see Table 2). The main difference between global and more detailed items was that the former identified several types of technology in a single question whereas the detailed series allowed respondents to answer separately about each type of technology. To dissuade respondents from providing detailed answers to the global items we also added a simple “yes or no” at the end of the questions.
TABLE 2. Global and Detailed Questions in the 2005 Pilot Study of
Technology and Aging Global Questions Detailed Questions
30-day Use of Mobility Device
Introduction: We are interested in learning about the item you have and use to make your daily activities easier, safer, or so you can do them on your own. In the last 30 days have you used a cane, walker, wheelchair or scooter, yes or no?
In the last 30 days did you use _____ A cane? A walker? A wheelchair? A scooter?
30-day Use of Sensory Device
In the last 30 days, have you used a hearing aid or a vision aid other than glasses, yes or no?
In the last 30 days have you used _____ A hearing aid or other hearing device? Vision aids other than glasses?
Entry Features Introduction: Sometimes people have features in their home that help them to live there more easily, safely or on their own. Does your home have a ramp or handrails at the entrance?
Note: If respondent lives in a building and does not enter directly into home, this question refers to the building entrance that is used most often; otherwise the question refers to the entrance directly into the respondent’s home that is used most often. Does this entrance have _____
Handrails leading to the entrance? A ramp?
Stair and Hallway Features
[Does your home have] a stair glide, chair lift, or support rails in the hallway?
[If living space is on more than one floor:] Whether or not you use them, does your home have _____
A chair lift or stair glide? Support or grab rails in the hallway?
Bathroom Features
[Does your home have] a bath or shower seat, raised toilet seat or grab bars in the bathroom?
The next questions are about the bathroom you use most often to bathe or shower. Whether or not you use them, does this bathroom have _____
A seat, bench or stool for the shower or tub? Grab bars in the shower or tub area?
Whether nor not you use it, does the toilet you use most often have _____
Grab bars around it? A raised or modified seat?
Modification Were all these features there when you moved in or were some or all of them added?
For each of the features previously identified: Was this feature here when you moved in or was it added?
For each of the features previously identified: In the last 30 days when you [activity] did you use the [feature] every time, most times, sometimes, rarely or never.
30-day Use of Environmental Features
In the last 30 days, did you use any of these features, yes or no?
Activity left your home up and down stairs up and down hall bathed or showered bathed or showered use the toilet
Feature ramp chair lift or stair glide rails grab bars seat, bench or stool grab bars
8

Approach We first compared estimates based on the seven global items with those
calculated from detailed items, using chi-square statistics to test for differences. We then calculated the sensitivity and specificity1 of the global items assuming that the more detailed measures were the standard. Next, using logistic regression, we explored whether particular characteristics (age group, female, Black, education level, income level, and functional limitations) predicted the chances of providing discrepant answers to the global and detailed measures (vs. consistent responses).
Finally, from the pilot data we created three different summary measures reflecting
any assistive technology use: the first based on answers to the global items; the second based on answers to the more detailed items; and the third based on detailed answers to four items explicitly mentioned in the NHIS question, “Do you now have any health problem that requires you to use special equipment, such as a cane, a wheelchair, a special bed, or a special telephone?” We then compared estimates of assistive technology use from the pilot study measures to estimates obtained from the 2005 NHIS.
The analytic sample size for this sub-analysis was 342 cases,2 with a sample of
264, for analysis of bathroom features.3 The sample size for the 2005 NHIS is 13,480. All calculations with the pilot study data used sampling weights described earlier; the NHIS analysis uses the adult sample file weights.
Results
Global and detailed questions from the pilot study provided similar prevalence
estimates for four of the seven global measures (see Table 3): 30-day use of mobility devices (19.2% vs. 19.6%), presence of stair and hallway features (5.4% for both global and detailed), whether any home features were added (34.8% vs. 35.9%), and whether any home features were used in the last 30 days (36.3% vs. 39.3%). In three cases, however, the global items questions yielded significantly lower prevalence estimates than detailed items: 30-day use of sensory devices (8.4% vs. 12.1%), the existence of entry features (30.7% vs. 36.4%), and the existence of bathroom features (33.0% vs. 45.2%). In further analyses (not shown) we found that the global items most often missed vision aids other than glasses, handrails at the entrance, and grab bars in the bath or shower area.
1 Sensitivity in this case is defined as: among those who say yes to one or more detailed items, the percentage that say yes to the global item. Specificity is defined as: among those who say no to the detailed items, the percentage who say no to the global item. 2 Due to a minor CATI problem corrected early in the fieldwork, global items were missing for 18 respondents. 3 The global item on existence of bathroom features was changed after 78 respondents had already been interviewed. Respondents omitted from the analysis did not differ from the rest of the sample in terms of sex, age, education, or functional limitations; however, this group was more likely to be Black (30.2% among those omitted vs. 8.2% among those included in the analysis, p<0.01).
9

Sensitivity and specificity reached acceptable levels (>0.80 for both) for two of the global measures. The sensitivity and specificity of the global 30-day mobility device use question was extremely high relative to the detailed items: 95% of those who said yes to the detailed items responded yes to a global item and 99.4% of those who said no to all the detailed items said no to the global item. In addition, the sensitivity and specificity of the global items used to identify home modifications were 80.4 and 90.8, respectively. But for other sensory devices, entry features, stair/hallway features and bathroom features the global items appear to omit individuals who answer affirmatively to one or more detailed questions.
TABLE 3. Assistive Technology and Environmental Modifications: 2005 Pilot Study of Technology and Aging
Prevalence Validity of Global Questions
n Global
Questions Detailed
Questions Difference
Sensitivity Among Those Who Say Yes to Detailed, What % Say
Yes to Global?
Specificity Among Those Who Say No
to All Detailed Items, What %
Say No to Global?
30-day use of mobility device
342 19.2 19.6 0.4 95.0 99.4
30-day use of sensory device
342 8.4 12.1 3.7** 66.1 99.6
Entry features 342 30.7 36.4 5.3+ 69.8 91.7 Stair and hallway features 342 5.4 5.4 0.0 41.8 96.7 Bathroom features 264 33.0 45.2 12.2** 70.9 98.2 Added any entry, stair/hallway or bathroom features
264 34.8 35.9 1.1 80.4 90.8
Used any entry, stair/hallway or bathroom features in last 30 days
264 36.3 39.3 3.0 71.2 86.2
+ p < 0.10 * p<0.05 **p<0.01
Logistic models predicting discrepant answers to the global and relevant detailed items suggest that in most cases those with severe functional limitations are more likely than those with no limitations to provide inconsistent answers (see Table 4). For four of the seven global items, respondents over the age of 80 were more likely than younger respondents to provide discrepant answers. For the remaining characteristics results were either inconsistent (e.g., income) or significant for less than half of the outcomes (e.g., female, Black, high education).
Based on answers to the seven global items in the pilot study, we estimated that
41.9% of adults ages 50 and older used some form of assistive technology in the last 30 days (see Table 5). Only slightly higher estimates (46.2%) were obtained from the more detailed pilot questions.4 When the items were limited to the four types of technology mentioned in the NHIS question (cane, walker, special bed, special telephone), the estimate was reduced to 25%. In other words, limiting questions to the four items mentioned in the NHIS question could under-estimate assistive technology use by nearly 50% [(46.2-25)/46.2)=46%]. 4 Sensitivity and specificity of this summary relative to estimates from detailed questions was quite high (77.4 sensitivity and 88.6 specificity; not shown).
10

TABLE 4. Odds Ratios from Logistic Regression Models Predicting Discrepant Answers to Global and Detailed Items: 2005 Pilot Study of Technology and Aging
Outcomes
Predictors
30-Day Use of
Mobility Device
30-Day Use of
Sensory Device
Entry Features
Stair and Hallway Features
Bathroom Features
Added Any Entry,
Stair/ Hallway or Bathroom Features
Used Any Entry, Stair/ Hallway or Bathroom
Features in Last 30 Days
Female (vs. male) 0.2** Age (vs. 50-64)
65-74 80+
3.5*
3.9*
2.9*
2.5+ Income (vs. ≤$15k)
>$15k to $25k >$25k to $50k >$50k
6.1*
2.7+ 6.3*
0.2*
Black (vs. non-Black) 0.1* Education (vs. <high sch)
High school or GED More than high school
0.1*
0.2*
Functional limitation 1+ non-severe limitations 1+ severe limitations continuous scorea
1.2**
4.5+ 8.8**
2.9+ 2.7*
9.9**
2.6+
4.1* 5.4**
N 342 342 342 342 264 264 264 +p <0.10 *p<0.05 **p<0.01 a. Included instead of categorical variables only in model predicting 30-day use of mobility device (because categorical
variables were perfect predictors).
Using the NHIS sample and the single question in the survey produced an estimate of assistive technology use that was significantly and substantially lower than all estimates generated from the pilot study, amounting to only 12.2% of the population ages 50 and older. Reasons for the lower NHIS estimate include its: (1) using a global approach; (2) mentioning only four specific types of technology; (3) linking the use of assistive technology to the presence of a condition; (4) focusing on current status rather than a larger, 30-day reference period. Differences in sample composition between the NHIS and pilot study may also contribute to upwardly biased estimates in the pilot study.
All four estimates of assistive technology use are higher for women than for men
and increase with age and the presence of one or more severe functional limitations. However, for most groups estimates based upon the pilot study global questions are three to four times higher than those based upon the global NHIS question. For example, the pilot study suggests that 81.5% of those with one or more severe functional limitations have used assistive technology in the last 30 days whereas the global NHIS item generates an estimate of only 37.5%.
11

TABLE 5. Estimates of Any Assistive Technology Use: 2005 Pilot Study of Technology and Aging vs. 2005 National Health Interview Survey
Pilot Study of Technology and Aging Sample
National Health Interview Survey Sample
Global Questionsa
Detailed Questions Limited
to Items Mentioned in Pilot
Study Global Questionsa
Detailed Questions,
Limited to Items Mentioned in NHIS Global Questionb
Global Questionc pd
Total 41.9 46.2 25.0 12.2 0.00 Sex Male Female
34.2 49.2
42.3 49.9
22.8 27.0
10.6 13.6
0.00 0.00
Age 50-64 65-79 80+
34.2 48.3 67.4
35.3 59.2 70.6
18.1 32.1 43.1
7.0
14.5 34.1
0.01 0.00 0.18
Race Non-Black Black
41.8 43.3
46.2 46.3
25.0 24.2
11.8 16.8
0.00 0.33
Functional limitations (severe difficulty) 0 1+
26.5 81.5
31.5 84.1
9.6 64.6
2.0 37.5
0.00 0.00
N 264 264 264 13,480 a. Used mobility device, sensory device, entry feature, stair or hallway feature, or bathroom feature in the last 30
days. See Table 2 for global and detailed question wording. b. Used a cane, a wheelchair, a special bed, or a special telephone in the last 30 days. c. Do you now have any health problem that requires you to use special equipment, such as a cane, a wheelchair, a
special bed, or a special telephone? d. P-value from a chi-square testing for difference between NHIS global question and Pilot Study detailed questions
limited to items mentioned in the NHIS global question (columns 4 and 5).
QUESTION 2: How Can Measures of the Home Environment and Assistive Technology be Combined with Measures of Functioning to Enhance Understanding of Disability?
Background
There is growing recognition that disability cannot be assessed outside of the
physical and social environment in which activities take place (Brandt and Pope, 1997; Satariano, 1997; Keysor, 2006). The International Classification of Functioning, Disability and Health (ICF), for example, (World Health Organization, 2002) links health dimensions to participation in society and makes explicit that contextual factors--including the environment and assistive technologies--mediate this relationship.
Researchers have demonstrated the efficacy of environmental modifications and
related assistive technologies in improving functioning and quality of life (Agree and Freedman, 2003; Mann, et al., 1999; Verbrugge, et al., 1997). Indeed, home modifications have the potential to enhance the ease with which people carry out their daily activities, increase safety, promote independence, and forestall moves to more restrictive environments. Yet, surprisingly little current and generalizable information is available about the extent to which environmental barriers impede functioning or the
12

extent to which modifications are absent from the homes of individuals with compromised functioning.
National surveys typically include only limited questions about characteristics of
the home and rarely include items to distinguish among the existence, addition, or use of home modifications. Yet each of these concepts provides potentially important insights into disability. Information about the existence of modifications allows assessment of the potential to age in place. Questions regarding the use of modifications provide information on accommodations that might be otherwise overlooked by questions focused on portable assistive technology (such as canes, walkers, and wheelchairs). Information about the addition of features helps distinguish the extent to which older adults are adapting existing environments or moving into adapted environments. Finally, information on barriers in the home environment, when used in concert with information on underlying functioning, can help identify the extent to which modifications may potentially alleviate disability.
The Pilot Study of Technology and Aging included a series of questions
characterizing the home environment. Unlike home assessment instruments that are typically designed to be used by occupational or physical therapists in the home, the pilot study included items that could be answered by the respondent on the telephone. Questions were included about features in several key areas of the home including the entryway (railings, ramp), hallways and staircases (railings, stair glide), and the bathroom (grab bars, shower seat, raised toilet seat). For each feature respondents were asked if they had the feature. If so, they were asked whether it was added or there when they moved in and how frequently during the last 30 days they used it while carrying out a relevant activity (every time, most times, sometimes, rarely or never). (For question wording, see Table 2.) The pilot study also included several questions about potential barriers in the home: Thinking about the entrance you use most often, do you have to use stairs or step up to get into your home from outside?; Is your living space on more than one floor?; and Does the bathroom used most often to bathe have a stall shower separate from a tub? In addition, there were a series of questions about use of mobility devices (cane, walker, wheelchair, and scooter) in the last 30 days.
Approach
We first generated a set of descriptive statistics characterizing barriers and
safety/accessibility features in the home environment in the weighted pilot sample. As sample sizes allowed, we then estimated among those with a given feature the percentage that added the feature (representing environmental modifications) and the percentage using the feature in the last 30 days.
Next, we illustrated how measures of functioning and the environment could be
used together to identify and characterize groups potentially of interest to policy makers. The first group consists of individuals who might be targeted for environmental
13

modifications because they have severe lower body limitations5 and unmodified barriers6 in the home. The second group of interest consists of individuals who successfully accommodated their functional deficits by using technology. The latter group includes individuals who use assistive devices and environmental features and report no difficulty carrying out daily activities (leaving the house, getting around inside, bathing, and toileting) by themselves when using assistive devices.
Finally, we explored whether these new measures that incorporated both
functioning and the environment varied in predictable ways by demographic factors (age, sex, marital status, race, income, and education) and by whether the respondent lived in an age-graded community. For analyses of individuals who might be potential targets for environmental modifications, we used logistic regression to predict having a severe lower body limitation and an unmodified barrier in the home vs. not. We expected that individuals “at-risk” would be more likely to be older, female, unmarried, minority and of lower income and education and not in age-graded housing. In addition, we used multinomial logistic regression to model a three category outcome: has residual difficulty (omitted), does not have residual difficulty and does not use assistive technology, and does not have residual difficulty and uses assistive technology (“fully accommodated”). We expected that respondents who “fully accommodated” would be younger, have fewer functional limitations, be unmarried, female, White, and of higher income and educational status or in age-graded housing than those with residual difficulty.
Results
Although potential barriers are regularly found at the entrance (68.5%) and in the
bath/shower area (71.2%), features of the home environment that enhance safety and accessibility are far less common in the (weighted) pilot study sample (see Table 6). For example, about one-third of adults ages 50 and older (36.4%) have a ramp or railing at the entrance to their home or building and about one-third (37.5%) have a grab bar or seat in the bath or shower area. Even less common are safety features around the toilet (20.2%) or in the staircases or hallways (5.7%).
More than half of respondents with a given feature reported that the feature was
added after they moved into their current home (column 2 of Table 6). For example, 52.4% of respondents with ramps at the entrance, 57.4% with grab bars in the bath or shower, and 71.8% with grab bars around the toilet area reported that these features were added. As shown in the final column of Table 6, not all respondents who report having a feature in their home used that feature in that last 30 days. For example, 82.7% with grab bars in the shower area, 56.9% with a shower seat, and 82.2% with
5 An individual was considered to have severe lower body limitations if he/she reported that by him/herself and without special equipment, he/she had severe difficulty or was unable to carry out one or more of the following activities: stooping, walking up ten steps without resting, standing for two hours, or walking one-quarter of a mile. 6 Defined as an entryway requiring a step with no ramp or railings; a home with living space on more than one floor with no stair glide; a bathroom with no separate shower and no grab bars or bath seat; or a toilet without a raised or modified seat or grab bars.
14

grab bars around the toilet reported use in the last 30 days. Moreover, there was variation in the amount of use (not shown). For example, among those with grab bars in the shower or tub area, 40% used them every time they showered, 13% most times, 16% some of the times, 14% rarely and 17% never used them.
TABLE 6. Barriers and Features in the Home Environment: 2005 Pilot Study of
Technology and Aging Among Those with Feature
Percent
with Barrier/ Feature n
Percent Added Feature
Percent Used Feature in Last
30 Days ENTRY
Has to step up to get into home/ building 68.5 250
Railings at the entrance 32.3 125 49.8 a
Ramp at the entrance 9.3 27 75.5 100.0
Either railings or a ramp at entrance 36.4 138 52.4 c
INSIDE HOME Does not have bedroom, kitchen, and bathroom on one floor 18.5 47
Stair glide for going up/down stairs 0.2 3 b b
Railings for going up/down hallway 5.5 31 27.7 93.0
Either stair glide or railings 5.7 34 29.8 92.4
BATHROOM: BATH OR SHOWER AREA
Does not have a separate stall shower 71.2 238
Grab bars in the shower or tub area 29.3 142 57.4 82.7
A seat, bench, or stool for the shower or tub 19.4 103 a 56.9
Either grab bars or shower seat 37.5 190 c 76.2
BATHROOM: TOILET AREA
Grab bars around the toilet 8.0 43 71.8 82.2
Raised toilet seat 15.7 63 a a
Either grab bars or raised toilet 20.2 88 c c a. Not asked in the pilot study by design. b. Cell size too small to estimate. c. Can not be estimated because not all components asked in the pilot study.
Table 7 illustrates several groups who may be considered a potential target for an
environmental modification because they have one or more severe lower body limitations a barrier in their home, but no modifications to address the barrier. For each area of the home, two (overlapping) groups are identified: those who have an unmodified barrier and currently have a severe lower body limitation and those who have an unmodified barrier and any lower body limitation (severe or non-severe).
15

TABLE 7. Percentage of Adults Ages 50 and Older with Unmodified Environmental Barriers and Lower Body Limitations, by Level of Limitation (N=360)
Percentage with Unmodified Barrier and:
Severe Lower Body
Limitation(s)
Any Lower Body
Limitation Has to step up to get into the home/building and has no ramp or handrails 9.1 17.0
Has living space on multiple floors and has no stair glide 2.8 6.1 Does not have shower separate from bath and has no grab bars or bath seat 7.0 14.4
Has no raised toilet seat or grab bars in toilet area 19.7 36.5 Has unmodified barrier at entry, inside, shower/bath area, or toilet area 23.0 42.6
The percentage at risk for an environmental modification varies by location in the
home. For example, 9.1% have a severe lower body limitation, must use at least one step to leave home, and have no railings or ramp at the entrance; 7.0% have a severe limitation, no separate shower, and grab bar or seat in the tub. However, only a small percentage of adults ages 50 and older (2.8%) have severe body limitations, living space on multiple floors, and no stair glide. We also estimate that about one in five older adults has a severe lower body limitation but no safety features (grab bars or raised toilet seat) for the toilet area.7 Overall nearly one in four adults ages 50 and older (23.0%) could be targeted for an environmental modification. Broadening the criteria to include anyone with a lower body limitation (irrespective of severity) circumscribes a much larger group--up to 43% of adults ages 50 and older.
The group with severe lower body limitations and unmodified barriers is difficult to
characterize (see Table 8). Like those with severe lower body limitations, those at risk for modifications (column 3) are less likely to be highly educated or to have high income. But other predictors are not significantly related. Interestingly, living in age-graded housing is positively associated with having a severe lower body limitation and inversely associated with having an unmodified barrier. Consequently, living in age-graded housing does not significantly predict being at-risk for a modification (i.e., having a severe lower body limitation and an unmodified barrier).
7 Note there is no barrier per se for the toilet area. Excluding “has no raised toilet seat or grab bars in the toilet area” from that last line of Table 7 yields slightly lower estimates of 15% of the older population with severe lower body limitations and 28% with any lower body limitation at risk for a modification.
16

TABLE 8. Odds Ratio for Severe Lower Body Limitations, Unmodified Barriers, and Both
Severe Lower Body Limitation
Unmodified Barriera
Severe Lower Body Limitations and Unmodified
Barrier Age (vs. 50-64)
65-79 80+
1.31 2.20*
0.97 0.75
1.42 1.82
Female (vs. male) 1.50 0.89 1.21 Married (vs. not married) 0.87 .084 0.77 Black (vs. non-Black) 1.15 0.70 1.04 Education (vs. less than high school)
High school or GED More than high school
0.31* 0.28**
1.41 3.41+
0.38+ 0.46+
Income (vs. ≤$15k) >$15k to $25k >$25k to $50K >$50k
1.14 1.50 0.27*
1.69 0.55 2.48
1.50 1.54
0.35+ Lives in age-graded housing (vs. not) 3.46** 0.21** 1.37 (N) (360) (360) (360) + p<0.10 p<0.05 **p<0.01 a. See Table 7 for details. Table 9 illustrates how to combine information about the environment with residual
difficulty items to identify those who have resolved difficulty with ADLs through the use of technology. About 22% of respondents reported using devices when bathing or showering and had no difficulty doing so by themselves when using their device(s). Estimates of resolved difficulty were 16%-18% for leaving home and using the toilet and about 12% for getting around inside and transferring. Overall, 27% of adults ages 50 and over are able to fully accommodate their daily activities with device use. The remaining 73% consists of two groups: 46% have no residual difficulty and use no devices and another 27% use devices and have residual difficulty (not shown).
TABLE 9. Illustration of “Fully Accommodated” Groups Who Report Assistive Device or
Environmental Modification Use and No Residual Difficulty with Daily Tasks (N=360) Percentage:
Uses a mobility devicea and/or a ramp to leave home and has no residual difficulty leaving home 16.0
Uses a mobility devicea and/or railings and/or a stair lift for getting around inside and has no residual difficulty getting around inside. 12.1
Uses grab bars and/or a shower seat and has no residual difficulty bathing 21.6
Uses a raised toilet seat and/or grab bars and has no residual difficulty toileting 17.9
Uses a mobility deviceb and/or a raising seat, trapeze/sling, or special bed or chair and has no residual difficulty getting out of a bed or chair. 12.2
Has accommodated one or more ADLs and has no difficulty with any other ADLs 26.9
a. Includes cane, walker, wheelchair, crutches or a scooter. b. Includes cane, walker, or wheelchair.
17

Individuals who resolve their difficulty with technology (“fully accommodated”) are more likely than those who report residual difficulty to have higher incomes and to live in age-graded housing (Table 10). They also have on average lower functional limitation scores than those who report residual difficulty. However, compared to individuals who have no underlying difficulty, those who have fully accommodated their disability are older and have higher functional limitation scores.
The lack of education gradient was somewhat surprising so we explored this
relationship a bit further (models not shown). We found in models with only age, sex, and education that more years of education was associated with a higher risk of no underlying difficulty and of fully accommodating with technology, relative to reporting residual ADL difficulty. However, this relationship disappeared once functional limitations and income were accounted for. It is possible that education is operating through income, which in turn may increase a person’s ability to modify his or her home. Follow-up studies are needed to further investigate this hypothesis.
TABLE 10. Relative Risk Ratios for Fully Accommodating ADL
Limitations with Technology
No Underlying Difficultya
Fully Accommodated
with Technologya pb
Age (vs. 50-64) 65-79 80+
0.19** 0.50
0.50 1.13
*
Female (vs. male) 1.75 1.63 Married (vs. not married) 0.86 0.59 Black (vs. non-Black) 1.16 1.03 Education (vs. less than high school)
High school or GED More than high school
0.29 0.34
0.50 0.27
Income (vs. ≤$15k) >$15k to $25k >$25k to $50K >$50k
4.19+ 1.20 5.44*
5.66* 3.20+
11.26**
Lives in age-graded housing (vs. not) 4.79* 3.69* Functional limitation score 0.47** 0.70** ** N 360 + p<0.10 p<0.05 **p<0.01 a. Omitted category is reports residual difficulty with at least one activity. No underlying
difficulty represents respondents who report no residual difficulty and no use of technology; fully accommodated with technology represents respondents who use technology and report no residual difficulty.
b. Last column shows tests for difference between “fully accommodated” and “no underlying difficulty.”
18

QUESTION 3: Can a Valid and Reliable Scale be Created from Questions that Link Technology Use to Quality of Life Measures?
Background
As assistive technologies are increasing in prevalence, and perhaps even
substituting for personal care, the question of whether devices adequately meet the needs of adults with disabilities and improve their quality of life have been raised. Thus far the few studies focused on this topic have suggested that assistive technology may be more efficacious than personal care for reducing disability (Verbrugge, et al., 1997; Agree, 1999) and delaying functional decline (Mann, et al., 1999). However, these studies also suggest that assistive technologies may confer benefits that are distinct from personal care (Agree and Freedman, 2001; Verbrugge and Sevak, 2002). That is, devices do not always reduce difficulty in daily activities to the same extent or in the same way that help does. Agree and Freedman (2003), for example, found that with technologies, tasks did not take less time and were no less painful or tiring.
The National Institute for Disability and Rehabilitation Research has been funding
efforts to evaluate outcomes of assistive technology use (e.g., the Consortium on Assistive Technology Outcomes Research) but by and large the instruments developed through this and other initiatives have been designed to improve clinical assessments for rehabilitation clients, and have not been validated at the population level or developed for population based survey research. The few items that have been used in national surveys to evaluate effectiveness are embedded in questions about ADLs and refer to the level of difficulty residual to help and/or equipment use. Virtually no items have been used to measure the role of technologies in enhancing quality of life. One exception is the 1994-95 Supplement on Disability to the NHIS, which measured whether using technology made specific activities less tiring, less painful, or less time consuming. But whether technologies influence other aspects of quality of life--for example, by making adults feel safer or more in control or by facilitating participation in valued activities has not been measured. Approach
In order to assess the influence of assistive technologies on the lives of those who
use them, several items were included in the pilot questionnaire. Three questions--related to pain, fatigue, and the amount of time needed to carry out activities--were developed based upon questions in the NHIS’s 1994/1995 Supplement on Disability (Agree and Freedman, 2000). Additional items (related to safety, control, participation in valued activities, and dependence on others) were developed through cognitive testing of a series of open-ended questions about the influence of technology on respondents’ lives. Cognitive testing also suggested that a 5-point bi-polar response set, which allowed for both positive and negative answers, led to inadequate responses. Based on this finding and a review of the literature by Krosnick and Fabrigar (1997), we then tested and ultimately adopted a simplified unipolar 3-point response set.
19

The final set of items in the pilot questionnaire asked directly about the link between the use of technology and various dimensions of quality of life. The items were asked only of respondents reporting the use of assistive technologies or environmental features earlier in the interview (N=350 of the 360 in the study). Each question was predicated on the use of the set of items the respondent reported in the survey. The first three items asked “Because you use [list of previously mentioned items], how much safer do you feel; how much more control over daily activities do you have; and how much more are you able to participate in activities that you enjoy?.” Answers included: no more, a little more, and a lot more. The next three questions asked the extent to which activities were less painful, less tiring, and less time consuming because they used the technology. A final item assessed the extent to which the items enabled them to be less dependent on others in daily activities. Answers for the negative continuum included no less, a little less, a lot less. All questions allowed for the response of “does not apply” but cognitive testing suggested the response only be read aloud for the negative items.
We used structural equation modeling to construct an effectiveness scale and to
check the congruence of the scale to other relevant constructs. We first examined the behavioral coding and distributions of responses, including “don't know”, “refused” and “does not apply”, to determine which effectiveness variables could be included in a scale. To be included, an item had to have less than 10% "does not apply". For items that met acceptable levels of response (e.g., less than 10% “does not apply”) we constructed and then validated a summary scale using structural equation modeling using SPSS’ AMOS. To construct the scale we assumed “no more” and “does not apply”=0, “a little”=1 and “a lot”=2. We introduced the effectiveness items as a latent (unmeasured) variable and used the generally accepted cutoff of 0.40 to identify acceptable factor loadings. In addition we included measures of the amount of assistive technology use, the amount of help with daily activities, and the functional limitation score.8 We conservatively assumed in the structural equation model that all variables were not measured perfectly.9
We assessed the overall goodness-of-fit of the model using three statistics: the
normed fit index and the comparative fit index (NFI and CFI, which are generally required to be >=0.90) and the root mean square (RMS, which is generally required to be <=0.05). We assessed the statistical significance of each direct and indirect
8 The amount of assistive technology use was calculated by summing across all devices used according to the following algorithm: every time=4, most times=3, sometimes=2, rarely=1 and never=0 (mean=6.0; standard deviation=7.85; range=0,44). Devices included five bathroom features (grab bar, shower seat, grab bar around toilet, modified toilet seat, portable commode), six mobility devices (cane, walker, wheelchair, scooter, crutches, motor cart at store), seven environmental features (ramp, elevator, stair lift, railings, raising seat, trapeze, emergency call system) and six other types of assistive technology (hearing aid, vision aids other than glasses, reacher, special bed, modified washer, modified cookware). The amount of help with ADLs was calculated by summing across five ADLs every time=4, most times=3, sometimes=2, rarely=1 and never=0 (mean=0.9; standard deviation=2.3; range=0,16). Functional limitation score was calculated by summing across eight activities 0=none, 2=some, 3=a lot, 4=unable (mean 9.1; standard deviation=8.2; range=0,32). 9 Each item was converted into single-item latent variables that assumed unreliability in their measurement of about 10%.
20

relationship by examining the significance of standardized regression coefficients of each path. This approach allowed us to assess within a single framework the reliability of the effectiveness scale and the strength of the relationships among the effectiveness scale, assistive technology use, underlying functioning, and/or hands-on assistance.
Results
Only three of the seven questions appeared to yield adequate variability and broad
applicability. Items that asked if activities were less painful, tiring, or time consuming, and if respondents were less reliant on others all were answered with “does not apply” between 40%-48% of the time, depending on the item. This is not surprising because the questions with negative orientation only apply to those whose activities were painful, tiring, or time consuming, or those who were dependent in the first place. Consequently, these items did not meet our criteria for further analysis. The remaining three questions related to safety and control elicited “does not apply” in less than 2% of cases, and participation in activities did so 7.5% of the time.
Analysis of behavioral codes revealed levels of probing greater than 15% for all but
two of the items: whether the items increased control and whether they made activities less tiring (see Table 11). For two of the three items meeting inclusion criteria for further analysis, probing was over 20% (22% for safer and 27% for more participation).
TABLE 11. Level of Probing and Frequencies of Responses to Effectiveness Items
Positive Orientation Negative Orientation Safer More
ControlMore
Participation Pain Tiring Time Reliance
on OthersProbed or provided definition (%) 22.0 11.7 26.9 18.6 9.0 20.7 29.0 Responses (%)
No more 19.7 20.9 28.5 No less 12.8 18.3 23.8 18.1 A little more 25.7 22.0 18.2 A little less 15.0 16.7 17.8 13.5 A lot more 49.5 52.7 38.1 A lot less 18.9 17.1 14.8 18.5 Does not apply 1.8 1.6 7.5 Does not apply 48.0 44.2 39.8 45.8 Don’t know 1.0 0.4 5.4 Don’t know 3.0 1.4 1.4 1.7 Refused 0.1 0.1 0.1 Refused 0.1 0.1 0.1 0.1 Not asked 2.3 2.3 2.3 Not asked 2.3 2.3 2.3 2.3 Results from the final structural equation model are shown in Figure 1.10 Several
points are noteworthy. First, the three items with positive orientation scale well, with factor loadings for variables indicating safety, control, and participation of 0.75, 0.85, and 0.60, respectively. These are all sufficient factor weights to establish the effectiveness scale as a meaningful latent variable. The reliability of the latent variable was quite high at 0.94 (not shown).
Second, the left-hand side of the Figure suggests there are some very strong and
significant direct relationships among functioning, assistive technology use, and the use of help with daily activities. For example, underlying functional limitations are strongly 10 The goodness-of-fit measures suggested that this model fits well (NFI=0.98; CFI=0.99 and RMS=0.05). All regression parameters shown in bold are all significant at a p-value <0.001.
21

related to both the amount of assistive technology use and amount of help with ADLs. The standardized partial correlation between functional limitations and intensity of assistive technology use is large (0.69) and significant as is the standardized partial correlation between functional limitations and amount of help (0.53). Consistent with previous studies that have examined the joint use of help and assistive technology (Agree, et al., 2005), the residual correlation between the amount of assistive technology use and amount of help is positive (0.17).
FIGURE 1. Effectiveness of Assistive Technology: Structural Equation Model Results
NOTE: AT=assistive technology; ADL=activities of daily living. By convention, the dark oval represents a latent variable (Effectiveness of AT) and rectangles represent measured indicators from the survey. The white ovals (OSAFE, OCONTL, OENJ, OAT, OADLH, and OMORE) indicate error components for either the measured or latent variables.
Third, significant relationships exist between the effectiveness of assistive
technology and other variables in the model. For example, more intense use of assistive technology has a significant partial correlation of 0.21 with the latent indicator of effectiveness, indicating that the effectiveness scale does measure the impact of assistive technology on quality of life. In addition, the number of functional limitations is also significantly correlated with effectiveness (0.20). This implies that the worse an individual’s underlying functioning the more likely assistive technology will improve their situation. Finally, the amount of personal help had no significant correlation with the effectiveness scale, indicating that the latent variable was reflective of the impact of assistive technology without being confounded by the use of personal assistance.11
11 In a previous model, a direct path was specified between amount of help the effectiveness scale, but that coefficient was not statistically significant, and was therefore removed from the model.
22

DISCUSSION Several policy-relevant findings emerged from analysis of the 2005 Pilot Study of
Technology and Aging. First, questions about assistive technology use that combine multiple items into a single question provide modestly lower estimates than more detailed measures. Importantly, our analyses suggest that the single item used in the NHIS and the Behavioral Risk Factor Surveillance System to assess assistive technology use may under-estimate use by as much as 50%. Second, we demonstrated at least two ways to combine information about the home environment with measures of functioning to identify groups of interest to policy makers, particularly those interested in furthering declines in late-life disability prevalence. In doing so, we found that potentially as many as one in four adults ages 50 and older might be targeted for an environmental modification in their home because they have a severe lower body limitation, a physical barrier in their home, and no existing modification. We also found that approximately 27% of adults ages 50 and older currently are able to fully accommodate their personal care activities with device use. Incorporating this type of information into national surveys that track late-life disability could provide important insights into the role of environment factors in current trends. Third, our analysis suggests that a valid and reliable scale reflecting the effectiveness of technology can be created from three questions designed to measure improvements in safety, control, and participation due to technology. However, for two of the three questions, over 20% of respondents in our study required clarification, suggesting that further improvement in question wording may be useful.
The main goal of the pilot study was to design and evaluate new questions about
technology and the home and environment. As such, the sample was not designed to be nationally representative. Indeed, we found that when weighted the sample over-represents Blacks and those with 13 or more years of education. To the extent that these groups differ from other groups in terms of their assistive technology use, our estimates will be biased. Nevertheless, these findings suggest that valid questions about assistive technology and the home environment can be administered to adults living in many environments. Several next steps for integrating these measures into national surveys follow from this analysis.
With respect to existing global items on national survey, our analysis suggests
these types of questions generally be avoided with one exception. A global item that combines the most commonly used types of mobility devices into a single measure has good measurement properties. Existing national surveys, such as the NHIS and the Behavioral Risk Factor Surveillance System, may well consider a more focused mobility-related item in place of the current approach. Although this item will not identify individuals using all types of assistive technology, it appears to validly and reliably assess those using a mobility device in the last 30 days.
Surveys interested in identifying the universe of individuals using assistive devices
may want to consider supplementing the global mobility item with a list-driven set of
23

questions about “fixed” assistive technologies (e.g., grab bars, railings, and ramps). Such technologies are quite prevalent in the homes of older persons and are used as frequently as, and in some cases more often than, portable mobility devices. The existence, addition, and use of these items should be explicitly measured. The 2-3 minute module in the Appendix serves as a useful, succinct approach, while allowing analytic flexibility to identify those who have, have added, and use environmental modifications.
The addition of this information can also facilitate the identification of important,
policy-relevant groups. In particular, when used in combination with information about basic functioning, these items can help identify those at risk for disability because of an environmental barrier and those who have successfully accommodated their functional impairments with assistive technology. This information has not been systematically collected in existing national surveys. Consequently, researchers’ ability to sort out contributions of environmental changes and assistive technology to disability and trends has been greatly limited. Recently, the Health and Retirement Study included in its 2006 wave an experimental module (based upon the Pilot Study of Technology and Aging) that collects information on the existence, addition, and use of home features. Analysis of these experimental data (N=approximately 1,800 respondents ages 50 and older) will hopefully provide further insight into the environmental aspects of disability in later life.
With respect to measuring the effectiveness of assistive technology, this analysis
highlighted the need to recognize that there are different dimensions to effectiveness that go beyond the reduction of task difficulty and dependency. Three items reflecting the role of assistive technology in increasing safety, control over daily activities, and participation in enjoyable activities scaled well and were positively related to both the intensity of assistive technology use and the extent of underlying functional limitation. However, these items involved significant levels of probing (>20% for two of the three items). Other items developed to assess the role of assistive technology in lessening pain, the extent to which activities are tiring, the amount of time needed to carry out activities, and reliance on other people yielded high levels of “does not apply” responses (>40% for all four items). In general, the questions with positive orientation seem to generate valid responses, but additional pilot testing is needed to expand upon this basic approach.
In summary, this report is a first step in providing evidence to fill important gaps in
content with respect to technologies that older adults use in their daily lives. In particular we have demonstrated the validity and reliability of a brief set of items to assess assistive technology use and the presence, addition and use of home modifications for older adults. By supplementing existing surveillance tools with 2-3 minutes worth of questions on these topics, it will be possible to track groups at-risk for disability because of an environmental barrier or lack of modification to the home and to assess the contribution of environmental changes to declines in late-life disability. In doing so, policy makers may gain insights into how to best leverage technologies to prevent dependence among adults as they age.
24

REFERENCES
Agree, E, & VA Freedman. 2000. Incorporating assistive devices into long-term care arrangements: Analysis of the potential for substitution and supplementation. Journal of Aging and Health 12(3):426-450.
Agree, E, & VA Freedman. 2003. A comparison of assistive technology and personal
care in alleviating disability and unmet need. The Gerontologist 43:335-344. Agree, E, VA Freedman, J Cornman, DA Wolf, & JE Marcotte. 2005. Redefining
substitution: When do assistive devices take the place of personal care? Journals of Gerontology: Social Sciences 60(5):S272-80.
Brandt, EN, & AM Pope. 1997. Enabling America: Assessing the Role of Rehabilitation
Science and Engineering. Washington, DC: National Academy Press. Cornman, JC, VA Freedman, & EM Agree. 2005. Measurement of assistive device
use: Implications for estimates of device use and disability in late life. The Gerontologist 45:347-358.
Fowler Jr., FJ, & CF Cannell. 1996. Using behavioral coding to identify cognitive
problems with survey questions. In Schwarz & Sudman (Eds.), Answering Questions (pp.15-36). San Francisco, CA: Jossey-Bass.
Freedman, VA, & EM Agree. 2005. Linking Measures of Assistive Technology and
Disability. Paper presented at Workshop on Improving Survey Measures of Late-Life Disability, May 17, 2005. Washington, DC: The Urban Institute.
Freedman, VA, & T Waidmann. 2005. Opportunities for Improving Survey Measures of
Late-Life Disability: Workshop Overview. Report prepared for the Department of Health and Human Service’s Office of the Assistant Secretary for Planning and Evaluation, May 2005. [http://aspe.hhs.gov/daltcp/reports/2006/survmeasI.htm]
Freedman, VA, T Waidmann, & B Spillman. 2005. Opportunities for Improving Survey
Measures of Late-Life Disability: Part II. Workshop Summary. Report prepared for the Department of Health and Human Service’s Office of the Assistant Secretary for Planning and Evaluation, October 2005. [http://aspe.hhs.gov/daltcp/reports/2006/survmeasII.htm]
Freedman, VA, E Agree, & J Cornman. 2005. Development of an Assistive Technology
and Home Environment Assessment Instrument for National Surveys: Final Report. Part I. Recommended Modules and Instrument Development Process. Report prepared for the Department of Health and Human Service’s Office of the Assistant Secretary for Planning and Evaluation, December 2005. [http://aspe.hhs.gov/daltcp/reports/ATEAdevI.htm]
25

Freedman, VA, E Agree, & L Landsberg. 2005. Development of an Assistive
Technology and Home Environment Assessment Instrument for National Surveys: Final Report. Part II. Pilot Study Results for Recommended Items. Report prepared for the Department of Health and Human Service’s Office of the Assistant Secretary for Planning and Evaluation, December 2005. [http://aspe.hhs.gov/daltcp/reports/ATEAdevII.htm]
Freedman, VA, E Agree, LG Martin, & J Cornman. 2006. U.S. trends in assistive
technology and personal care for disability in late life, 1992-2001. The Gerontologist 46:124-127.
Keysor, J. 2006. How does the environment influence disability? Examining the
evidence. In Field, Jette, and Martin, Workshop on Disability in America: A New Look (pp.88-100). Washington, DC: National Academy Press.
Krosnick, JA, & LR Fabrigar. 1997. Designing rating scales for effective measurement
in surveys. In Lyberg, et al. (Eds.), Survey Measurement and Process Quality (pp.141-164). New York, NY: Wiley.
Mann, WC, KJ Ottenbacher, L Fraas, M Tomita, & CV Granger. 1999. Effectiveness of
assistive technology and environmental interventions in maintaining independence and reducing home care costs for the frail elderly. A randomized controlled trial. Archives of Family Medicine 8(3):210-7.
Mann, WC. 2003. Assistive technology. In Societal Impact on Aging (pp.177-187).
New York, NY: Springer Publishing Company. Rust, KL, & RO Smith. 2005. Assistive technology in the measurement of rehabilitation
and health outcomes: A review and analysis of instruments. Am J Phys Med Rehabil 84:780-793.
Satariano, WA. 1997. The disabilities of aging--looking to the physical environment.
American Journal of Public Health, 87(3):331-2. Spillman, BC. 2004. Changes in elderly disability rates and the implications for health
care utilization and cost. Milbank Memorial Fund Quarterly, 82(1):157-194. Verbrugge, LM, & P Sevak. 2002. Use, type, and efficacy of assistance for disability.
Journals of Gerontololgy 57(6):S366-79. Verbrugge, L, C Rennert, & J Madans. 1997. The greater efficacy of personal and
equipment assistance in reducing disability. American Journal of Public Health 87(3): 384-392.
26

27
Werts, CF, RL Linn, & KG Joreskog. 1974. Intraclass reliability estimates: Testing structural assumptions. Educational and Psychological Measurement 34:25-33.
Wilson, B, B Altman, K Whitaker, VA Freedman, J Cornman & E Agree. 2004.
Improving Person-Item Fit: Cognitive Testing Questions about Assistive Technology and the Home Environment with Older Adults. Presented at the annual meeting of the American Association of Public Opinion Research, May 15, Phoenix, AZ.
World Health Organization. 2002. Toward a Common Language for Functioning,
Disability, and Health, ICF. Geneva.

APPENDIX Final 2-3 Minute Module 12-02-05
Survey Modules to Measure Assistive Technology and the Home Environment
Recommended 2-3 Minute Module
For additional information contact:
Vicki A. Freedman, Ph.D.* University of Medicine and Dentistry of New Jersey
School of Public Health e-mail: [email protected]
Emily M. Agree, Ph.D. Johns Hopkins Bloomberg School of Public Health
e-mail: [email protected]
*This instrument was created with funding from the Department of Health and Human Service’s Office of the Assistant Secretary of Planning and Evaluation in cooperation with the National Institute on Aging (R01 AG14346) and the National Center for Health Statistics. A full report is available from the authors upon request. Address correspondence to: Vicki A. Freedman, Ph.D., Professor, Department of Health Systems and Policy, University of Medicine and Dentistry of New Jersey-School of Public Health, 335 George Street, Suite 2200, New Brunswick, NJ 08903, [email protected].
A-1

A-2
Instructions to Train Interviewers
Read only response options in lower case. If the responses to a question are typed in upper case letters, they should not be read to the respondent. Offer the interviewer the option of not reading repetitive response choices. Several of the modules involve sequences of questions with repetitive response choices. We recommend offering interviewers the option of not reading response options once respondent have demonstrated learning the response pattern, generally not before the third time. Provide definition if needed. Definitions for items that may be unfamiliar to some respondents are provided. These are intended to be read only as needed. Interviewers should be trained to read definitions only if the respondent asks for clarification or definition of a term or if the respondent conveys confusion about the meaning of the question. Read introductory phrases in parentheses as needed for clarity. In several cases, questions in a series use a similar introductory phrase. When a respondent is routed into a detailed follow-up sequence the introduction should not appear in parentheses and should be read. Where the questions are moving rapidly in a sequence (for example, where the respondent is saying “no” to all device use questions and skips past the detailed use items) the introductory phrase should appear parenthetically and may be included as needed for clarity.
Instructions for new construction and home improvement (HE module). When respondents have made improvements (e.g., upgraded a grab bar) or renovations to an existing home (e.g., remodeled a bathroom), they should code the upgraded features as “added (or upgraded).” If respondents have difficulty separating out the cost of these features from the rest of the renovation/building costs, interviewers should repeat the list of items that were added and ask them to focus on the cost of only those features. If the respondent is unable to separate the cost of the feature from the larger project then mark ‘don’t know’.
Note on Conventions Used in Instrument CATI instructions appear in white text boxes. Notes about question interdependencies across sections appear in yellow text boxes. Definitions appear in grey text boxes. Variable names used in the pilot study appear in red.

HOME ENVIRONMENT MODULE
We are interested in features of your home and items you have to make your daily activities easier, safer, or so you can do them on your own. First I have some questions about the inside of your home.
A-3
DEFINITION (IF NEEDED): A chair lift or stair glide is a motorized chair that runs up and down a staircase. You ride on a seat and get on and off at the top and bottom of the stairs.
HE-1. Is your home part of a building that has two or more apartments or units with a common or shared entrance? BLDGUNIT
NOTE TO USER HE-1 is used to fill items in the Mobility and Other Devices Module (MO-2.1b, MO-2.2b, MO-2.3b, MO-2.4b, MO-2.1c, MO-2.2c, MO-2.3c, and MO-2.4c).
1. YES 2. NO -7. REFUSED -8. DON’T KNOW
HE-11. Is your living space on more than one floor? HOMELVL
1. YES [GO TO HE-12] 2. NO -7. REFUSED READ INTRO “Whether or not you use them, does -8. DON’T KNOW your home have...” AND GO TO HE-12.5 ]
HE-12. Whether or not you use it, does your home have… HE-12.1 a bedroom, kitchen,
and bath on the same floor? FLORHOME 1. YES 2. NO -7. REFUSED -8. DON’T KNOW
HE-12.3 [Whether or not you use it, does your home have…] a chair lift or stair glide?
LIFTHOME 1. YES [GO TO HE-12.3a] 2. NO [GO TO
-7. REFUSED HE-12.4] -8. DON’T KNOW
HE-12.3a Was it there when you moved in or was it added? LIFTADD
1. THERE WHEN MOVED IN 2. ADDED (OR UPGRADED)
-7. REFUSED -8. DON’T KNOW
HE-12.3b In the last 30 days when you went upstairs or downstairs, did you use the chair lift or stair glide … LIFT30 1. every time 2. most times 3. sometimes 4. rarely, or 5. never? 6. DIDN’T GO UPSTAIRS OR
DOWNSTAIRS -7. REFUSED -8. DON’T KNOW [READ INTRO “Whether or not you use it, does your home have …“ AND FILL IN BLANK WITH ITEM IN HE-12.4 ]

HE-12.4 [Whether or not you use
them, does your home have…] handrails in any of the staircases?
SRAILHOM 1. YES [GO TO HE-12.4a]
2. NO [GO TO -7. REFUSED HE-12.5] -8. DON’T KNOW
HE-12.4a Were these rails there when you moved in or were any of them added? SRAILADD
1. THERE WHEN MOVED IN 2. ADDED (OR UPGRADED)
-7. REFUSED -8. DON’T KNOW
HE-12.4b In the last 30 days when you went upstairs or downstairs, did you use the handrails… SRAIL30 1. every time 2. most times 3. sometimes 4. rarely, or 5. never? 6. DIDN’T GO UPSTAIRS OR
DOWNSTAIRS -7. REFUSED -8. DON’T KNOW [READ INTRO “Whether or not you use it, does your home have …“ AND FILL IN BLANK WITH ITEM IN HE-12.5 ]
HE-12.5 [Whether or not you use them, does your home have...] handrails in any of the hallways?
RAILIHOM 1. YES [GO TO HE-12.5a] 2. NO [GO TO
-7. REFUSED HE-12.6] -8. DON’T KNOW
HE-12.5a Were these rails there when you moved in or were any of them added? RAILIADD
1. THERE WHEN MOVED IN 2. ADDED (OR UPGRADED)
-7. REFUSED -8. DON’T KNOW
HE-12.5b In the last 30 days, when you went down the hallway, did you use the handrails … RAILI30 1. every time 2. most times 3. sometimes 4. rarely, or 5. never? -7. REFUSED -8. DON’T KNOW [READ INTRO “Whether or not you have use it, does your home have …” AND FILL IN BLANK WITH ITEM IN HE-12.6]
A-4

HE-12.6 [Whether or not you use them, does your home have...] an emergency call or personal response system to help if you fall?
EMERHOME 1. YES (1) [GO TO HE-12.6a]
2. NO (2) -7. REFUSED [GO TO -8. DON’T KNOW HE-13]
HE-12.6a Was this system there when you moved in or was it added? EMERADD
1. THERE WHEN MOVED IN 2. ADDED (OR UPGRADED)
-7. REFUSED -8. DON’T KNOW
HE-12.6b In the last 30 days, have you used this system to call for help? EMER30 1. YES 2. NO -7. REFUSED -8. DON’T KNOW
A-5
DEFINITION (IF NEEDED): This is a system you use to call someone to come if you fall or need help. You can wear it around your neck or it can be attached to the wall.
HE-13. Whether or not you use it, does your home have…
HE-13.1 a stall shower separate from a tub? SHOWBATH
1. YES 2. NO
-7. REFUSED -8. DON’T KNOW
HE-13.2 Whether or not you use them, does your home have any grab bars in the shower or tub area?
BARBATH 1. YES [GO TO HE-13.2a] 2. NO [GO TO
-7. REFUSED HE-13.3] -8. DON’T KNOW
HE-13.2a Were these grab bar there when you moved in or were any of them added? BARADD 1. THERE WHEN MOVED IN 2. ADDED (OR UPGRADED) -7. REFUSED -8. DON’T KNOW
HE-13.2b In the last 30 days, when you bathed or showered, did you use the grab bars … BAR30 1. every time 2. most times 3. sometimes 4. rarely, or 5. never? -7. REFUSED -8. DON’T KNOW [READ INTRO “Whether or not you use it, does your home have …” AND FILL IN BLANK WITH ITEM IN HE-13.3]
DEFINITION (IF NEEDED): A grab bar is designed to help you steady yourself. It may be attached to the wall or built in to the tub or shower. Do not include towel racks.

A-6
DEFINITION (IF NEEDED): This includes a chair, bench, or stool that you put in the shower or tub, or a seat that is built in.
HE-13.3 [Whether or not you use it, does your home have...] a seat for the shower or tub?
SEATBATH 1. YES [GO TO HE-13.3a] 2. NO [GO TO -7. REFUSED HE -14] -8. DON’T KNOW
HE-13.3a Was this seat there when you moved in or was it added? SEATADD 1. THERE WHEN MOVED IN 2. ADDED (OR UPGRADED)
-7. REFUSED -8. DON’T KNOW
HE-13.3b In the last 30 days, when you bathed or showered, did you use the seat… SEAT30 1. every time 2. most times 3. sometimes 4. rarely, or 5. never? -7. REFUSED -8. DON’T KNOW [READ INTRO “Whether or not you use them, does your home have…” AND FILL IN BLANK WITH ITEM IN HE-14.1]
HE-14.1 [Whether or not you use them, does your home have…] grab bars around any of the toilets?
TOILBAR 1. YES [GO TO HE-14.1a]
2. NO [GO TO -7. REFUSED HE-14.2] -8. DON’T KNOW
HE-14.1a Were these grab bars there when you moved in or were any of them added? TOILADD 1. THERE WHEN MOVED IN 2. ADDED (OR UPGRADED)
-7. REFUSED -8. DON’T KNOW
HE-14.1b In the last 30 days, when you used the toilet, did you use the grab bars … TOIL30 1. every time 2. most times 3. sometimes 4. rarely, or 5. never? -7. REFUSED -8. DON’T KNOW [READ INTRO “Does your home have…” AND FILL IN BLANK WITH ITEM IN HE-14.2]
DEFINITION (IF NEEDED): A grab bar is designed to help you steady yourself. It may be attached to the wall or part of a frame that goes over the toilet. Do not include towel racks.

HE-14.2 [Does your home have…] a raised or modified toilet seat?
MODSEAT 1. YES [GO TO HE-14.2a] 2. NO
-7. REFUED [GO TO -8. DON’T KNOW HE-15-INTRO]
HE-14.2a Was the raised or modified seat there when you moved in or was it added? MSEATADD 1. THERE WHEN MOVED IN 2. ADDED (OR UPGRADED)
-7. REFUSED -8. DON’T KNOW
DEFINITION (IF NEEDED): This includes a seat that is up higher than usual, either because the toilet or seat is raised, or a chair that fits over the toilet. Do not include portable urinals, commodes, or bedpans, since we’ll ask about those later.
MOBILITY AND OTHER DEVICES MODULE The next questions are about getting around both outside and inside your home. MO-1. In the last 30 days, have you used a cane, walker, wheelchair, or scooter, yes or no? USECANE 1. YES [GO TO MO-2] 2. NO [GO TO MO-2.5] -7. REFUSED [GO TO MO-2] -8. DON’T KNOW [GO TO MO-2]
MO-2 CATI FILL INSTRUCTIONS IF (HE-1=1) THEN display “home or building” in MO-2.1b, MO-2.2b, MO-2.3b, MO-2.4b and “building” in MO-2.1c, MO-2.2c, MO-2.3c, and MO-2.4c ELSE IF (HE-1=2, -7, or -8) THEN display “home” in MO-2.1b, MO-2.2b, MO-2.3b, MO-2.4b, MO-2.1c, MO-2.2c, MO-2.3c, and MO-2.4c IF (MO-1=1) THEN display “Okay, I’d like to ask you a few more questions about these items.”
A-7

MO-2. In the last 30 days, did you use …
MO-2.1 a cane? CANEUSE
1. YES [GO TO MO-2.1 a] 2. NO -7. REFUSED [GO TO MO-2.2] -8. DON’T KNOW
MO-2.1a In the last 30 days, when you got out of a bed or chair, how often did you use your cane to help? Would you say … CANEBED 1. every time 2. most times 3. sometimes 4. rarely, or 5. never? -7. REFUSED -8. DON’T KNOW
MO-2.1b In the last 30 days, when you walked around inside your {home/ home or building}, how often did you use your cane? CANEWALK 1. every time 2. most times 3. sometimes 4. rarely, or 5. never? -7. REFUSED -8. DON’T KNOW
MO-2.1c In the last 30 days, when you left your {home/ building} how often did you use your cane? CANEOUT 1. every time 2. most times 3. sometimes 4. rarely, or 5. never? -7. REFUSED -8. DON’T KNOW [READ INTRO “In the last 30 days, did you use …” AND FILL IN BLANK WITH ITEM IN MO-2.2]
MO-2.2 [In the last 30 days, did you use] a walker? WALKUSE 1. YES [GO TO MO-2.2 a] 2. NO -7. REFUSED -8. DON’T KNOW [GO TO MO-2.3]
MO-2.2a In the last 30 days, when you got out of a bed or chair, how often did you use your walker to help? Would you say … WALKBED 1. every time 2. most times 3. sometimes 4. rarely, or 5. never? -7. REFUSED -8. DON’T KNOW
MO-2.2b In the last 30 days, when you walked around inside your {home/ home or building}, how often did you use your walker? WALKWALK 1. every time 2. most times 3. sometimes 4. rarely, or 5. never? -7. REFUSED -8. DON’T KNOW
MO-2.2c In the last 30 days, when you left your {home/ building} how often did you use your walker? WALKOUT 1. every time 2. most times 3. sometimes 4. rarely, or 5. never? -7. REFUSED -8. DON’T KNOW [READ INTRO “In the last 30 days, did you use …” AND FILL IN BLANK WITH ITEM IN MO-2.3]
DEFINITION (IF NEEDED): Include here straight canes,
walking sticks, and multi-pronged canes. Do not include white canes to help you walk if you are blind, since we’ll ask about vision aids like that later.
A-8

MO-2.3 [In the last 30 days, did you use] a wheelchair? WHELUSE 1. YES [GO TO MO-2.3 a] 2. NO -7. REFUSED [GO TO MO-2.4]
-8. DON’T KNOW
MO-2.3a In the last 30 days, when you got out of a bed or chair, how often did you use your wheelchair to help? Would you say … WHELBED 1. every time 2. most times 3. sometimes 4. rarely, or 5. never? -7. REFUSED -8. DON’T KNOW
MO-2.3b In the last 30 days, when you went around inside your {home/ home or building}, how often did you use your wheelchair? WHELWALK
1. every time 2. most times 3. sometimes 4. rarely, or 5. never? -7. REFUSED -8. DON’T KNOW
MO-2.3c In the last 30 days, when you left your {home/ building}, how often did you use your wheelchair? WHELOUT
1. every time 2. most times 3. sometimes 4. rarely, or 5. never? -7. REFUSED -8. DON’T KNOW [READ INTRO “In the last 30 days, did you use …” AND FILL IN BLANK WITH ITEM IN MO-2.4]
MO-2.4 [In the last 30 days, did you use] a scooter? SCTRUSE 1. YES [GO TO MO-2.4a] 2. NO -7. REFUSED [GO TO MO-2.5]
-8. DON’T KNOW
MO-2.4a Do you own or rent this scooter? SCTOWN 1. YES [GO TO MO-2.4b] 2. NO -7. REFUSED [GO TO -8. DON’T KNOW MO-2.5]
MO-2.4b In the last 30 days, when you went around inside your {home/home or building}, how often did you use your scooter? Would you say … SCTRWALK
1. every time 2. most times 3. sometimes 4. rarely, or 5. never? -7. REFUSED -8. DON’T KNOW
MO-2.4c In the last 30 days, when you left your {home/ building}, how often did you use your scooter? SCTROUT
1. every time 2. most times 3. sometimes 4. rarely, or 5. never? -7. REFUSED -8. DON’T KNOW
MO-2.5 [In the last 30 days, have you used] a motorized cart or electric scooter at the store? MOTGROC 1. YES 2. NO -7. REFUSED -8. DON’T KNOW
A-9

MO-3. The next questions are about some other items that you may use to make your daily activities easier, safer, or so that you can do them on your own. In the last 30 days, have you used …
DEFINITION (IF NEEDED): Vision aids include things like a magnifying glass or a white cane to help you walk if you are blind.
DEFINITION (IF NEEDED): A reacher or grabber is used to help reach or grasp objects.
MO-3.1 a hearing aid or other hearing device? HEARAID
1. YES 2. NO -7. REFUSED -8. DON’T KNOW
MO-3.2 [In the last 30 days, have you used …] glasses or contacts? GLASSES
1. YES 2. NO -7. REFUSED -8. DON’T KNOW
MO-3.3 [In the last 30 days, have you used …] vision aids other than glasses? VISION
1. YES 2. NO -7. REFUSED -8. DON’T KNOW
MO-3.4 [In the last 30 days, have you used …] a reacher or grabber? REACHER
1. YES 2. NO -7. REFUSED -8. DON’T KNOW
END
A-10


To obtain a printed copy of this report, send the full report title and your mailing information to:
U.S. Department of Health and Human Services Office of Disability, Aging and Long-Term Care Policy Room 424E, H.H. Humphrey Building 200 Independence Avenue, S.W. Washington, D.C. 20201 FAX: 202-401-7733 Email: [email protected]
RETURN TO:
Office of Disability, Aging and Long-Term Care Policy (DALTCP) Home [http://aspe.hhs.gov/_/office_specific/daltcp.cfm]
Assistant Secretary for Planning and Evaluation (ASPE) Home
[http://aspe.hhs.gov]
U.S. Department of Health and Human Services Home [http://www.hhs.gov]