Evaluation of methods for extraction of DNA from...
17
Stephanie Reabel M.Sc. Candidate, Pathobiology Dept., OVC Evaluation of methods for extraction of DNA from Encephalitozoon cuniculi
Transcript of Evaluation of methods for extraction of DNA from...
Stephanie Reabel M.Sc. Candidate, Pathobiology Dept., OVC
Evaluation of methods for extraction of DNA from Encephalitozoon cuniculi

Encephalitozoonosis
Disease caused by Encephalitozoon cuniculi
Fungi (Microsporidia)Unique mechanism of invasionInfective spores shed in urine
Causes subclinical infections and severe disease
Zoonotic threat to immunocompromised
http://www.ojhas.org/issue19/2006-3-2.htm
Host cell
Spore
Merogony
Sporogony
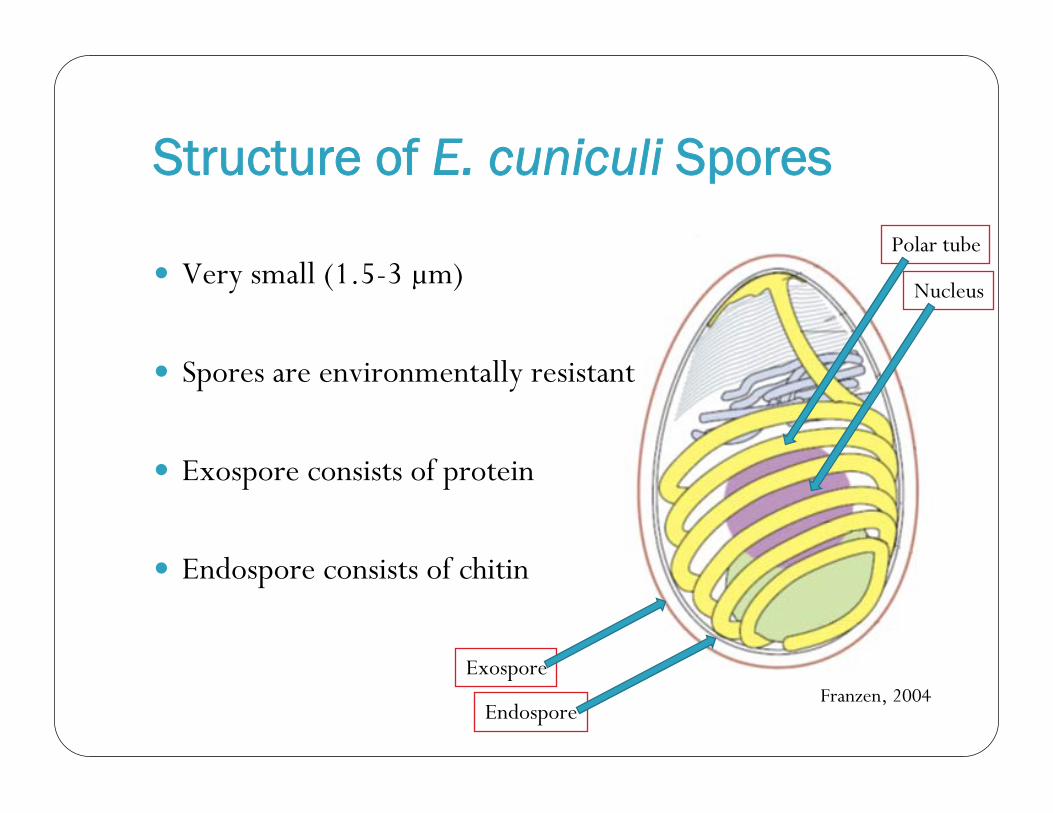
Structure of E. cuniculi Spores
Very small (1.5-3 μm)
Spores are environmentally resistant
Exospore consists of protein
Endospore consists of chitin
Franzen, 2004Endospore
Exospore
Nucleus
Polar tube

Diagnostic Techniques
Diagnostic Technique Limitations
Clinical Presentation- Non-specific signs- Differential diagnosis
Serology - Indicative of exposure only
Cell Culture - Time consuming
Microscopy- Spores may be excreted in small numbers- Small size of spores makes identification difficult

PCR
Potential to be a rapid and highly sensitive method of detection
Under-developed in veterinary medicine
Concerns regarding the sensitivityModerate sensitivity reported in literatureIntermittent shedding of spores or vs. inadequate assay design

DNA Extraction
No standardized method of DNA extraction
Sensitivity of PCR depends on the quality and quantity of DNA extraction
Must first disrupt thick spore to extract DNA
Enzymatical disruption
Mechanical disruption

Objectives and Hypothesis
Objective: To assess the efficacy of different DNA extraction methods for preparation of DNA for PCR
Hypotheses: 1) A combination of enzymatical and mechanical spore
disruption following by DNA extraction with commercially available DNA extraction kits will provide sufficient quantity of DNA to be used for PCR
2) There will be variation in the quantity of DNA extracted amongst the DNA extraction methods
Materials and Methods
Preparation of spores:Using a reference strain of E. cuniculi grown in cell culturePurified and counted (100,000 spores per sample)Enzymatical, mechanical or combination disruption of spores
DNA extraction:Using one of six commercial kitsSamples performed in triplicateQuality and quantity measured using spectrophotometry

Extraction Kits Tested
PrepGEM™ (Zygem)
DNAzol® (Invitrogen)
Maxwell® 16 Tissue DNA Purification kit (Promega)
High Pure PCR Template Preparation Kit (Roche)
DNeasy Plant Mini Kit (Qiagen)
QIAamp® DNA Stool Mini Kit (Qiagen)
Materials and Methods
PCR analysis:Using E. cuniculi specific primers50 ng of DNA per reactionQuality of DNA assessed using agarose gel electrophoresis

Results – Experiment #1Mean DNA concentration (ng/μl) ± SD:
DNeasy Maxwell QIAamp High Pure DNAzolPrepGE
M
No treatment2.18
(±0.35)2.85
(±0.03)7.56
(±1.58)9.87
(±4.35)1.67
(±2.69)8.27
(±10.31)
Mechanical1.94
(±0.50)3.67
(±1.57)4.66
(±1.13)12.81
(±5.83)1.47
(±5.92)5.00
(±4.11)
Enzymatical3.18
(±0.68)3.79
(±0.94)5.59
(±1.21)11.55
(±0.98)1.66
(±1.40)88.44
(±4.11)
Combination2.91
(±2.12)4.10
(±0.94)4.42
(±0.71)12.68
(±1.38)1.41
(±2.50)91.74
(±3.63)

Results – Experiment #2Mean DNA concentration (ng/μl) ± SD:
High Pure DNAzol PrepGEM
No treatment 10.25 (±2.93) 3.47 (±1.21) 4.16 (±1.49)
Mechanical 14.70 (±3.71) 0.79 (±0.13) 12.41 (±1.93)
Enzymatical 8.35 (±1.96) 1.69 (±0.82) 148.36 (±2.56)
Combination 23.60 (±20.08) 1.25 (±0.78) 161.63 (±0.52)
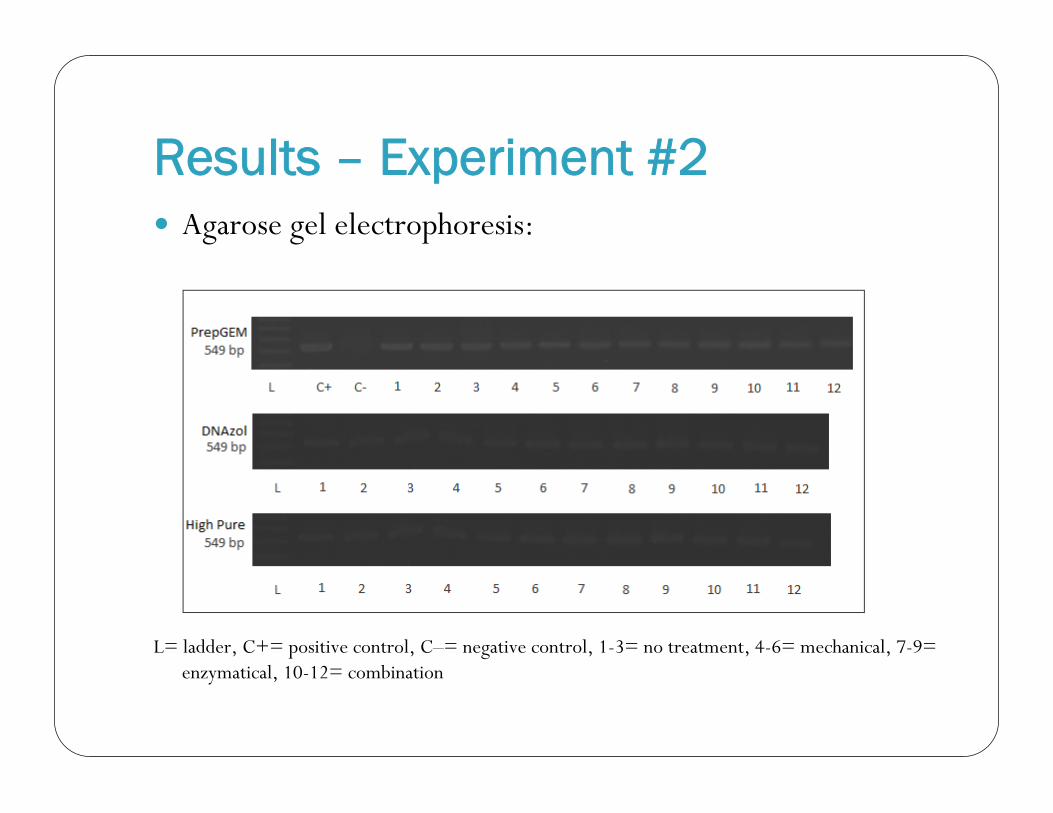
Results – Experiment #2Agarose gel electrophoresis:
L= ladder, C+= positive control, C–= negative control, 1-3= no treatment, 4-6= mechanical, 7-9= enzymatical, 10-12= combination

Overall Comparison
Extraction Efficiency
Quality (OD ratio)
Processing Time (m:s)
Difficulty of Procedure
Cost Per Sample ($)
DNeasy 0.05 2.80 42.10 Difficult 3.56
Maxwell 0.07 1.10 45:40 Easy 5.38
QIAamp 0.11 2.11 34:20 Difficult 3.54
High Pure 0.24 (0.17) 1.39 (1.54) 17:10 difficult 3.19
DNAzol 0.21 (0.02) 3.47 (1.20) 13:10 Moderate 2.45
PrepGEM 1 (1) 0.81 (0.81) 12:30 Easy 1.40
Extraction Efficiency = average yield of kit / average yield of best kit
A260/A280 of pure DNA = 1.8-2.2
Conclusions
A combination of enzymatical and mechanical disruption followed by DNA extraction using PrepGEM produced the highest quantity of DNA
There is considerable variation in the quantity of DNA extracted amongst the DNA extraction methods tested
Current methods for extraction of DNA from E. cuniculi need to be further evaluated

Future Studies
Development of a Real time PCR assay
Detection threshold study

Thank-you