1 Manufacturing Competitiveness Enhancement Programme (MCEP)
Research ArticleEvaluation of Manufacturing Competitiveness of Hubei ProvinceBased on Stochastic Frontier Analysis
Weidong Gai 1 Lei Zhou 1 and Chun Chen 23
1Accounting College Wuhan College Wuhan 430022 China2School of Literature Law and Economics Wuhan University of Science and Technology Wuhan 430081 China3Hubei Small and Medium Enterprises Research Center Wuhan 430081 China
Correspondence should be addressed to Chun Chen chenchunwusteducn
Received 12 August 2021 Revised 24 August 2021 Accepted 25 August 2021 Published 15 September 2021
Academic Editor Daqing Gong
Copyright copy 2021Weidong Gai et al is is an open access article distributed under the Creative Commons Attribution Licensewhich permits unrestricted use distribution and reproduction in any medium provided the original work is properly cited
e manufacturing level directly manifests the comprehensive strength of a country or region Production efficiency provides animportant metric of the competitiveness of the manufacturing industry Based on the data of Chinarsquos industrial enterprises of1999ndash2011 this paper estimates the production efficiency of manufacturing in Central Chinarsquos Hubei Province through stochasticfrontier analysis (SFA) and thus characterizes the differences between prefectures of Hubei in manufacturing competitivenesseresults show that on the prefecture level Xianning and Wuhan saw a decline in manufacturing competitiveness while Xiangfanand Xiaogan witnessed an increase in manufacturing competitiveness To enhance local manufacturing competitiveness andmakeHubei the forerunner and cornerstone of Central China different prefectures should adopt different industrial promotionpolicies pay attention to cultivating the technological innovation capabilities of enterprises and strengthen the integration ofproduction education and research
1 Introduction
e manufacturing level directly manifests the compre-hensive strength of a country or region e competitivenessof the manufacturing industry directly bears on the functionand depth of the country or region in the internationaldivision of labor Since the subprime mortgage crisisreshaping the manufacturing industry has become a globalcampaign to find new economic growth points is cam-paign is launched against a new round of technological andindustrial revolutions To enhance the industrial competi-tiveness of Germany Hannover Messe 2013 officiallylaunched the concept of Industry 40 based on networkentity systems and the Internet ofings (IoT) On February19 2016 the United States (US) Congress received the firststrategic plan for the National Network for ManufacturingInnovation (NNMI) which is jointly submitted by theSecretary of Commerce the Executive Office of the Presi-dent the National Science and Technology Council and theAdvanced Manufacturing National Program Office is
plan sets out an important goal enhancing the competi-tiveness of American manufacturing in an all-round way
In the meantime China has entered a new stage ofeconomic development In the traditional manufacturingindustry the supply and demand are seriously imbalancedIt is urgent to reduce production capacity inventory andleverage through structural adjustments and lower costs andsolve defects by transforming the production mode InGovernment Work Report 2019 the Chinese governmentpledged to promote the high-quality development ofmanufacturing accelerate the construction of amanufacturing power facilitate the docking of standardswith international best practices improve the quality ofproducts and services and attract more domestic and for-eign users to Chinese products and services It is telltale thatmajor economies regard enhancing manufacturing com-petitiveness as the core development strategy Hubei is alarge province in Central China e manufacturing com-petitiveness of Hubei represents the manufacturing level inthis region of the country andmakes up an important part of
HindawiDiscrete Dynamics in Nature and SocietyVolume 2021 Article ID 3364968 10 pageshttpsdoiorg10115520213364968
Made in China 2025 erefore it is of great significance tocorrectly estimate and evaluate the manufacturing com-petitiveness of Hubei e relevant results help to improvethe manufacturing competitiveness of the province and evenacross Central China promote high-end brands that aremade in China across the globe and contribute to thesustainable development of trade and economy in thecountry
Chinese and foreign researchers have explored industrialcompetitiveness extensively and reached fruitful resultsSome of the most representative studies are as follows
(1) Industrial competitiveness Porter a renownedAmerican economist proposed the famous diamondmodel and believed that the industrial competi-tiveness of a region is affected by factor endowmentsrelated industries corporate strategies externalopportunities market demand and governmentpolicies to name but a few [1]Since the turn of the century many new theorieshave emerged on industrial competitivenessrough analytic hierarchy process (AHP) Sirikraiand Tang [2] analyzed industrial competitivenessfrom two aspects strategy and operation manage-ment Fetscherin et al [3] held that the higher thedegree of industrial specialization the greater theshare of the industry in global exports Meleo [4]examined the impact of international events onregional industrial competitiveness from the per-spective of external opportunities Kleynhans [5]suggested that technology spillover has a significantpositive impact on the competitiveness of enterprisesand industries Based on relevant data in JapanPurwadi [6] found that human resource has grad-ually developed into an important influencer ofindustrial competitiveness Liu [7] constructed anevaluation index system for the industrial compet-itiveness of Changsha-Zhuzhou-Xiangtan regionand evaluated the industrial competitiveness byprincipal component analysis (PCA)
(2) Manufacturing competitiveness the foreign studieson manufacturing competitiveness can be tracedback to the 1960s Many researchers have studied thefactors affecting manufacturing competitivenessMoreno [8] established a regression model toidentify the determinants of Spanish manufacturingcompetitiveness Wong and He [9] stated thattechnological innovation plays an important role inmanufacturing development and the enhancementof manufacturing competitiveness Purwadi [6]discovered that human resource is developing into amajor impactor of manufacturing competitiveness inJapan Hannigan et al [10] learned that the com-petitiveness of different types of manufacturingenterprises varies with development strategies Singhet al [11] highlighted the importance of governmentsupport new technologies and investment tomanufacturing competitiveness Dong and You [12]
analyzed the status quo of Chinarsquos aerospacemanufacturing from the angles of competitivestrength competitive potential and competitiveenvironment and established an evaluation system
(3) Evaluation of industrial competitivenesssome re-searchers measured international competitiveness ofindustries from the macro perspective mainly usingtrade specialization coefficient (TSC) export marketshare (EMS) and revealed comparative advantage(RCA) [13ndash15] Hannan et al [16] measured in-dustrial competitiveness with the RCA and con-cluded that the competitiveness of the auto industryis positively correlated with economic performancehuman capital development urbanization and tarifflevel and negatively correlated with loan rate andcarbon emissions Carraresi and Banterle [17]adopted the EMS and RCA to measure competitiveperformance Jin et al [18] evaluated the interna-tional competitiveness of Chinarsquos manufacturingindustry in terms of market share and productprofitabilitySome researchers measured industrial competitive-ness from the meso perspective Since the 1980s theWorld Economic Forum (WEF) and the Interna-tional Institute for Management Development(IMD) in Lausanne Switzerland have beenresearching this topic and have formed a relativelycomplete competitiveness evaluation system Toevaluate industrial competitiveness many Chinesescholars have probed into the evaluation indexsystems formation mechanism and empiricalanalysis of industrial competitiveness For exampleWei and Wu [19] constructed an evaluation indexsystem for competitiveness which covers the fol-lowing dimensions industrial technological inno-vation ability rational resource allocation abilityindustrial growth potential and market influenceSome researchers measured enterprise competi-tiveness from the micro perspective On themicrolevel the enterprise competitiveness is mainlymeasured and compared in terms of productionefficiency market share and enterprise scale erelevant evaluation index systems primarily focus onproduction efficiency enterprise scale and marketgrowthscale
Firstly production efficiency of enterprises is mainlymeasured by the nonparametric methods of data envelop-ment analysis (DEA) and stochastic frontier analysis (SFA)and the semiparametric method of OlleyndashPakes (OP) pro-duction function ese methods decompose productionefficiency into an efficient part and an inefficient part beforecomparing the level or magnitude of enterprise efficienciesPapahristodoulou [20] used the DEA to analyze the costperformance of 121 different models produced by autoenterprises in different countries in 1996 and compared themarket competitiveness of auto enterprises from differentcountries With the aid of DEA Oh et al [21] evaluated the
2 Discrete Dynamics in Nature and Society
cost performance of cars produced by Korean auto enter-prises and compared the market competitiveness betweenauto enterprises in Korea
Secondly enterprise size is mainly measured by thenumber of employees gross output and per-capita output ofeach enterprise With these metrics the scale and growthrate of each enterprise are determined and used to judge thecompetitiveness at the enterprise level Considering thepositive correlation between technological innovation andenterprise output Melitz and Trefler [22] believed that alarge enterprise tends to have a strong ability to engage intechnological innovation and a strong export capacity
irdly market growthscale is mainly measured bymarket concentration and locational Gini coefficient andused to characterize enterprise competitiveness Li and Tang[23] held that market concentration has a significant positiveeffect on the competitiveness of large enterprises andevaluated the competitiveness of large enterprises from fiveaspects scale benefit operating efficiency debt repaymentand growth
In summary industrial competitiveness has been deeplyexplored in the academia yielding a wealth of literature eexisting studies mainly deal with the influencing factors andevaluation of industrial competitiveness However there areseveral defects with these studies there is not yet a consensuson how to define and estimate competitiveness how to selectthe evaluation indices and how to measure competitivenessAs a result the existing methods have limited explanatorypower on industrial competitiveness Besides there are notmany reports on the competitiveness of enterprises inCentral China not to mention the manufacturing com-petitiveness of Hubei on enterprise level Based on the dataof Chinarsquos industrial enterprises of 1999ndash2011 this paperestimates the production efficiency of manufacturing inCentral Chinarsquos Hubei Province through SFA compared thedifference between the 17 preferences of the province inmanufacturing competitiveness and fully discussed theinteractions and fluctuations between the factors affectingthe manufacturing competitiveness On this basis severalcountermeasures were proposed to enhance themanufacturing competitiveness of Hubei e research re-sults provide a solid basis for Hubei Province to transform itsmanufacturing industry enhance manufacturing competi-tiveness and realize high-quality development
e remainder of this paper is organized as followsSection 2 establishes the model explains the data sourcesand selects the variables Section 3 estimates the productionefficiency of manufacturing enterprises in Hubei Section 4sums up the findings and provides the countermeasures
2 Model Construction Data Sources andVariable Selection
21 Model Construction is paper selects the productionefficiency of enterprises to measure the manufacturingcompetitiveness of Hubei Province e measurement ofproduction efficiency was pioneered by Farrel [24] Cur-rently the popular ways to measure production efficiencyinclude nonparametric estimation methods like DEA and
parameter estimation methods like SFA e nonparametricestimation methods are generally unstable in output and inneed of high-quality data By contrast the SFA can bothcalculate the production efficiency of an enterprise with asuitable production function and reflect the impact ofbackground variables (ie various environmental factors)on the explained variable (ie the production efficiency ofthe enterprise) erefore the SFA was selected to estimateand measure the manufacturing competitiveness of Hubei
e SFA model was proposed as early as 1977 by foreignscholars like Aigner andMeeusene basic idea of SFA is asfollows
Let f(zi β) be the production function of enterprisesand qi f(zi β) be the optimal production function of thei-th enterprise without random interference and efficiencyloss However inefficiency is commonplace among enter-prises Normally the actual output of an enterprise is smallerthan its optimal output us the actual output of the i-thenterprise can be defined as
qi f zi β( 1113857ξi (1)
where ξi is the production efficiency of the i-th enterprisee ξi value inevitably falls within (0 1] If ξi 1 the en-terprise utilizes the optimal technology of the productionfunction f(zi β) in this case the enterprise can achieve theoptimal output and boast the highest competitiveness Ifξi lt 1 the enterprise cannot fully utilize the inputs zi underthe given conditions Since qi gt 0 (the output is strictlypositive) there must exists ξi gt 0 (technical efficiency mustbe positive) Assuming that the enterprise output could beaffected by random shocks the output of an enterprise underrandom shocks can be expressed as
qi f zi β( 1113857ξi exp vi( 1113857 (2)
Taking the natural logarithm of both sides
ln qi( 1113857 ln f zi β( 11138571113864 1113865 + ln ξi( 1113857 + vi (3)
Suppose there are k kinds of inputs with linear loga-rithmic form and ui minusln(ξi) en the output functionunder random shocks can be rewritten in logarithmic formas
ln qi( 1113857 β0 + 1113944k
j1βj ln zji1113872 1113873 + vi minus ui (4)
where ui is a subtracted term in the output logarithmicfunction is term must be greater than or equal to zerosuch that the enterprise efficiency meets the condition0lt ξi le 1 In this case function (4) is a stochastic frontierproduction function
On this basis Kumbhakar and Lovell derived a dualproduction cost function in 2000
ln ci( 1113857 β0 + βq ln qi( 1113857 + 1113944
k
j1βj ln pji1113872 1113873 + vi + ui (5)
where ci is cost qi is output pji is price of elements eother variables are the same as above If an enterprise is
Discrete Dynamics in Nature and Society 3
inefficient the output will decline or the production cost willincrease
22 Data Sources and Variable Selection To measure themanufacturing competitiveness of Hubei from the enter-prise level the data on manufacturing enterprises of Hubeiwere extracted from China Industrial Enterprise Database(1999ndash2011) through the following steps
Firstly rename all the variables named ldquoHubei Provincerdquoamong the ldquoprovinceautonomous regionrdquo variables as wellas the place names within the province to ldquoHubei ProvincerdquoFor example the variables named ldquoHubeirdquo ldquoHuangshirdquo andldquoWuhanrdquo were uniformly coded as ldquoHubei Provincerdquo afterchecking the ldquoAdministrative Region Coderdquo In this way allenterprises in Hubei were clearly identified as belonging tothat province
Secondly extract the enterprises from ldquoHubei Provincerdquoafter the renaming process A total of 226 variables and112034 observations were extracted
irdly screen and sort out the variables e mainpurpose is to delete the duplicate values and convert andsort out the attributes numbers and characters in thevariables
Fourthly sort out the locations of the enterprises by fourstandards in turn the ldquoArea Codesrdquo of Hubei ldquoPrefecturalCodesrdquo of Hubei ldquoCounty Codesrdquo of Hubei and ldquoEnterpriseNamerdquo In this way all enterprises in Hubei were allocated tothe 17 prefectures Table 1 lists the serial numbers of the 17prefectures ie the area codes of these prefectures
Fifthly allocate the enterprises in Hubei to the 17prefectures according to the above classification After re-moving the enterprises that cannot be allocated to anyprefecture the distribution of the enterprises is shown inTable 2
According to the theory on enterprise competitiveness(ie the stochastic frontier production function) the mainvariables were extracted as follows
(1) Enterprise output there are many ways to measureenterprise output By tradition this paper measuresoutput with gross industrial output (g1911) in itslogarithmic form (lg1911)
(2) Enterprise inputs the fixed infrastructure labor andlabor training cost were measured by the meanbalance of net fixed assets (g2123) number of em-ployees (g2515) and human capital (g2416) re-spectively these metrics were also expressed inlogarithmic forms (lg2123 lg2515 and lg2416)
Table 3 shows the descriptive statistics on the abovevariables
3 Estimation of Production Efficiency
31 EstimationMethod According to the proposed functionand variable definitions the SFA model for productionefficiency estimation can be established as
ln lg1911it( 1113857 β0 + β1lg2123it + β2lg2515it + β3lg2511it
+ β4lg2416it minus uit + vit
(6)
It was assumed that ui obeys half-normal distributionand vi obeys normal distribution
Table 4 lists the analysis results on the main variablesincluding the coefficients about how the output (lg1911) iscorrelated with number of employees (lg2515) mean bal-ance of net fixed assets (lg2123) and human capital (lg2416)e results show that the correlations are credible nullifyingthe null hypothesis (the correlation coefficients equal zero)at the significance level of 1
e production efficiency of manufacturing enterprisesin Hubei was estimated in four steps first select and analyzethe relevant variables of the production function secondestimate and test the parameters of the SFA model based onthe data of industrial enterprises in Hubei 1999ndash2011 thirdestimate the production efficiency of each enterprise in the17 prefectures and calculate the annual mean productionefficiency in each prefecture fourth compare themanufacturing competitiveness between the 17 prefectureswith the annual mean production efficiency as the metricand draw the basic conclusions
32ParameterEstimation eparameters of the SFAmodelwere estimated based on the enterprise data collected fromChina Industrial Enterprise Database (1999ndash2011) e es-timated results are recorded in Tables 5 and 6
e following can be learned from the analysis results inTable 5
First the mean balance of net fixed assets had positiveeffect on the gross industrial output of industrial enterprisese correlation coefficient was significantly different fromzero in both equations Hence fixed assets like infrastructurepromote the output of industrial enterprises Besides thecorrelation coefficient remained significant on the 1 levelsuggesting that the mean balance of net fixed assets ob-jectively influences the added value of industrial enterprises
Second labor had an immense impact on the grossindustrial output of industrial enterprises e coefficient ofnumber of employees was significant whether in ordinaryregression analysis cross-section SFA or panel data SFAus labor determines the added value of industrial en-terprises in the long run
ird human capital also had a huge impact on the grossindustrial output of industrial enterprises e cross-sectionand panel data SFAs show that human capital had a sig-nificant coefficient is means the enterprise expenditureon labor training determines the gross industrial output ofenterprises
Fourth lnsig2u _cons and mu _cons were the p valuesreflecting that ui differs from the null hypothesis erandom interference term (ui) in the SFA model was sig-nificantly different from zero As a result the random in-terference term clearly exits and objectively affects enterpriseoutput
4 Discrete Dynamics in Nature and Society
Tabl
e1
Serial
numbers
ofprefectures
Prefecture
Wuh
anXiang
fan
Ezho
uXiaogan
Yichang
Enshi
Shiyan
Suizho
uHuang
gang
Huang
shi
Xiann
ing
Jingzho
uJin
gmen
Xiantao
Qianjiang
Tianmen
Serial
number
027
0710
0711
0712
0717
0718
0719
0722
0713
0714
0715
0716
0724
0725
0726
0728
NoteXiantaoQ
ianjiang
Tianm
enand
Shenno
ngjia
ared
irectly
administersb
ythep
rovincialgovernm
entAccording
togeograph
icallocatio
nthe0
728area
code
shared
byXiantaoQ
ianjiang
and
Tianmen
was
brok
endo
wninto
0725
forXiantao0
726forQianjiang
and
0728
forTianmen
Discrete Dynamics in Nature and Society 5
Table 3 Descriptive statistics on the variables of industrial enterprises in Hubei
Variable Observation Mean Standard deviation Minimum MaximumOutput (lg1911) 89636 9753957 1444135 0 1365094Number of employees (lg2515) 96960 4542324 1256794 1098612 7889834Fixed assets (lg2123) 96956 955079 1528341 5192957 1409054Human capital (lg2416) 78315 9455429 1565896 0 1792006Data source China Industrial Enterprise Database (1999ndash2011) Notes there were huge differences between the observations of the above variables a sign ofmany missing values Subsequently the observations with lots of missing values were removed before analysis
Table 4 Correlation analysis on relevant variables of manufacturing enterprises in Hubei
lg1911 lg2515 lg2123 lg2416Output (lg1911) 10000Number of employees (lg2515) 06078 10000Fixed assets (lg2123) 06836 06325 10000Human capital (lg2416) 08241 04663 06220 10000
Table 2 Distribution of industrial enterprises in the 17 prefectures of Hubei
Prefecture Number Percentage Downward cumulative percentageWuhan 19275 1988 1988Huangshi 4500 464 2452Shiyan 4665 481 2933Yichang 7070 729 3662Xiangfan 7363 759 4421Ezhou 3227 333 4754Jingmen 5902 609 5363Xiaogan 7813 806 6168Jingzhou 7909 816 6984Huanggang 8989 927 7911Xianning 5177 534 8445Enshi 2358 243 8688Suizhou 4807 496 9183Shenglongjia 143 015 9198Xiantao 3120 322 9520Qianjiang 2328 240 9760In total 96973 100 100Data source China Industrial Enterprise Database (1999ndash2011)
Table 5 Estimations of SFA parameters for the 17 prefectures
(1) Cross-section stochastic frontierlg1911
(2) Panel data stochastic frontierlg1911
lg2515 00901lowastlowastlowast
(3095)0157lowastlowastlowast
(4321)
lg2123 0172lowastlowastlowast
(7484)0189lowastlowastlowast
(6466)
lg2416 0653lowastlowastlowast
(33314)0532lowastlowastlowast
(23160)
_cons 1060lowastlowastlowast
(2274)7105(037)
lnsig2v _cons minus1098lowastlowastlowast
(minus20825)
lnsig2u _cons minus1460(minus010)
lnsigma2_cons minus0987lowastlowastlowast
(minus11937)
ilgtgamma _cons 0332lowastlowastlowast
(1957)
mu _cons 5549(029)
N 71979 71979Annual dummy (control) variable Yes YesIndustrial dummy (control) variable Yes Yest statistics in parentheses lowastplt 1 lowastlowastplt 005 and lowastlowastlowastPlt 001
6 Discrete Dynamics in Nature and Society
Tabl
e6
Estim
ated
prod
uctio
neffi
ciencies
ofindu
strial
enterprisesin
the17
prefecturesof
Hub
ei(ann
ualm
ean)
Prefecture
1999
2000
2001
2002
2003
2005
2006
2007
2010
2011
Wuh
an000864946
000888881
000990813
001016356
00115944
001269094
00129358
001264344
001241972
001235955
Huang
shi
000912404
000906635
000928386
00092479
000927902
000965555
000994157
000949741
000930071
000923054
Shiyan
000751613
000757303
000796029
000802157
000844919
000818838
00081401
000801579
000783633
000777346
Yichang
000929037
000955172
000935373
000917235
000905062
000896731
00088519
000859723
000842023
000834386
Xiang
fan
000948962
000998555
000947397
001173034
001093264
00089419
000867732
000875403
000857594
000850064
Ezho
u001000637
001011546
001021252
001057368
00110661
001032068
000998913
000955672
000935569
000928364
Jingm
en000805834
000815295
000912962
000943033
000858202
000849949
00084705
000830046
000811671
000805716
Xiaogan
000973147
00098395
000978824
000957678
000918027
000881024
000864634
000832201
000812854
000807617
Jingzho
u000927887
000940402
000927839
000919883
000881849
000823173
000806799
000795142
000777513
00077147
Huang
gang
00102116
001024694
000980688
000989584
000982209
000847602
000872432
000844615
000826024
000819901
Xiann
ing
000870017
000973885
000943499
000949509
000927374
000875819
000861993
000838231
000822935
000816259
Enshi
000671094
000682235
000696588
000718961
00075859
000791164
000770298
000769715
000752765
000746994
Suizho
u001064086
001050217
001051528
001080381
001040744
000977538
00097586
000946632
000926008
000919313
Shenglon
gjia
000554867
000520701
000586326
000558253
000574757
000732859
000669766
000694146
000678114
000672837
Xiantao
000991318
001021604
001032507
001004784
000982655
000928097
000925784
000887959
000868365
00086191
Qianjiang
000956769
000957655
000941302
000898894
000893513
000953004
000938846
001009957
000989641
000982944
Tianmen
001062473
00105404
00104514
001055547
001026098
000991886
000970058
000924737
000906298
000897785
Discrete Dynamics in Nature and Society 7
To sum up the estimation results of the SFA modelparameters of manufacturing enterprises in Hubei are ro-bust and the selected model is suitable for this research
33 Estimated Production Efficiencies Next the authorsfurther analyzed the industrial competitiveness withinHubei Based on the selected SFA model the annual meanproduction efficiencies of industrial enterprises in the 17prefectures of Hubei 1999ndash2011 were derived on Stata(Table 6)
As shown in Table 6 the 17 prefectures differed sharplyin estimated production efficiency from 1999 to 2011 Forcomparison the 17 prefectures were divided into threegroups by the production efficiency of manufacturingcompanies low efficiency group medium efficiency groupand high efficiency group Due to the lack of space the threegroups were compared only in 1999 and 2011
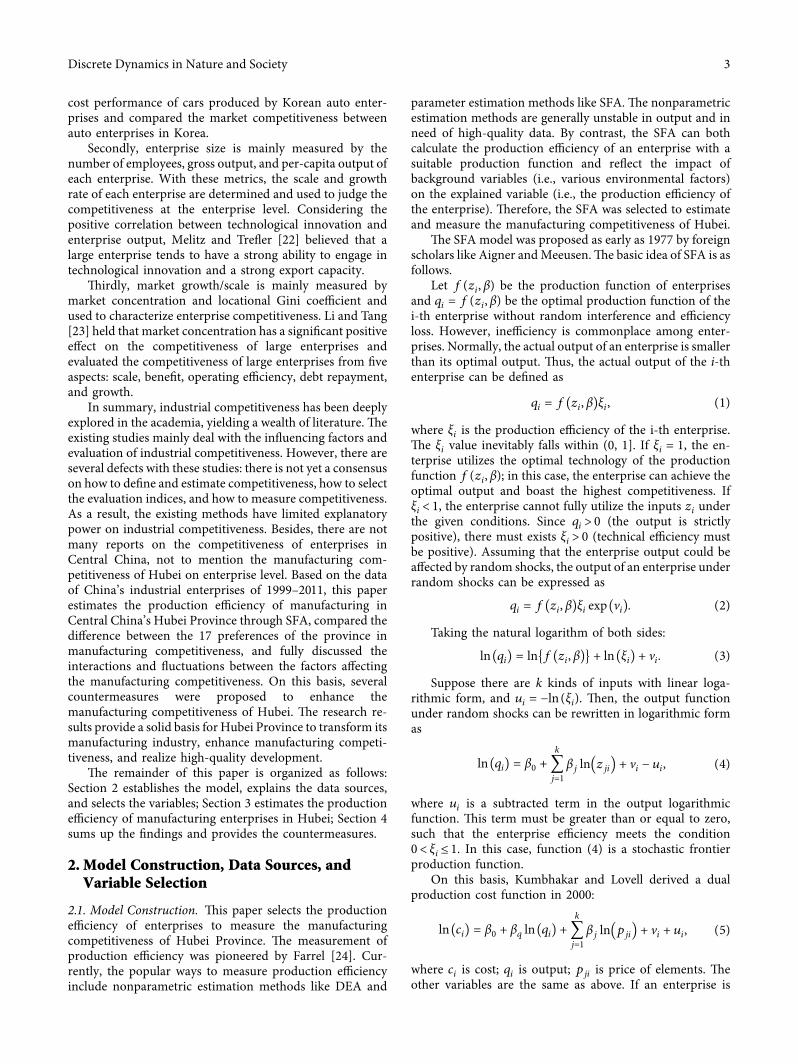
As shown in Figure 1 Hubei Province had a generallylow production efficiency of manufacturing companiesAbout 23 of all prefectures belonged to the medium effi-ciency group e production efficiency of manufacturingcompanies in Hubei had not been significantly improved inthe sample period From 1999 to 2011 the industrial pro-duction efficiency in most prefectures did not change sig-nificantly and only 4 prefectures witnessed changes in thatefficiency Specifically Xianning dropped from mediumefficiency group to low efficiency group Wuhan fell fromhigh efficiency group to medium efficiency group Xiangfanpromoted from low efficiency group to medium efficiencygroup Xiaogan climbed up frommedium efficiency group tohigh efficiency group All the other prefectures remained inthe original group
4 Conclusions
To reveal the impact of production efficiency improvementon manufacturing competitiveness this paper carries outSFA to estimate the production efficiency of manufacturingin Hubei Province based on the data of Chinese industrialenterprises from 1999 to 2011 e main conclusions are asfollows
(1) Mean balance of net fixed assets and fixed assets (eginfrastructure) both had positive impact on the grossindustrial output of manufacturing companies ismeans the added value of manufacturing companiesin Hubei depends much on the long-term invest-ment and fixed asset investment of enterpriseserefore the enterprises should actively increasethe share of fixed asset investment and long-terminvestment in corporate assets and pay particularattention to the cultivation of technological inno-vation capabilities Meanwhile the enterprisesshould digest absorb and reinnovate the introducedtechnologies and equipment manufacture highlytechnical products and enhance their owncompetitiveness
(2) Labor and human capital had relatively great impacton the gross output of manufacturing companies anddetermined the industrial added value of enterprisesin the long term erefore Hubei Province shouldattach importance to human resources andstrengthen the integration of production educationand research It is also important to encourage theinteraction between enterprises colleges and re-search institutions e province should give play to
Enshi
Xiangfan
Shiyan
Hubei
Low efficiencyMedium efficiencyHigh efficiency
1999 2011
Wuhan WuhanYichang
Xiangfan
EzhouEzhou
JingmenXiaogan
XiaoganHuanggang
Huanggang
Xianning Xianning
SuizhouShenglongjia
XiantaoXiantao
QianjiangQianjiang
Tianmen Tianmen
HuangshiHuangshi
Shiyan
YichangJingmen
Jingzhou JingzhouEnshi
SuizhouShenglongjia
Figure 1 Grouping of the 17 prefectures by production efficiency of manufacturing companies
8 Discrete Dynamics in Nature and Society
its advantages in science and education and establisha long-term cooperation platform between enter-prises colleges and research institutions
(3) From 1999 to 2011 the industrial production effi-ciency in most prefectures did not change signifi-cantly and only 4 prefectures witnessed changes inthat efficiency Specifically Xianning dropped frommedium efficiency group to low efficiency groupWuhan fell from high efficiency group to mediumefficiency group Xiangfan promoted from low ef-ficiency group to medium efficiency group Xiaoganclimbed up from medium efficiency group to highefficiency group
e above changes in production efficiency mainly arisefrom geographic relations especially the development ofWuhan Metropolitan Area For example Xiaogan has cer-tain advantages in space and transportation and mainlydevelops light industries like the production and processingof grain cotton oil animal husbandry and aquatic prod-ucts Xianning focuses its energy to build a production andprocessing base for green agriculture forestry and aquaticproducts as well as characteristic agricultural and sidelineproducts Wuhan functions as an advanced manufacturingbase and a research and industrialization base of high-techindustries Nevertheless the Wuhan Metropolitan Area hasnot grown fast enough and the relevant cities lack cleardivision of labor and cooperation
To solve the above structural problems Hubei Provinceshould make full use of its geographical advantage as ldquoathoroughfare leading to nine provincesrdquo and strive to build amodern industrial system that appeals to foreign investorsWith Wuhan playing the leading role in regional coordi-nated development the province needs to speed up theformation of a regional economic structure for mutualpromotion and development Under the structure Wuhanserves as the center six other large cities serve as the pillarand the counties serve as the basis In addition Hubei mustfurther improve the industrial chain within clusters pro-mote the integration of regional manufacturing and therebyenhance its manufacturing competitiveness
Data Availability
e data used to support the findings of this study areavailable from the corresponding author upon request
Conflicts of Interest
e authors declare that they have no conflicts of interest
Acknowledgments
e authors acknowledge that this work was supported byldquoResearch on Scene-based Financial Process ReconstructionBased on Financial Integrationrdquo Philosophy and SocialScience Research Project of Hubei Education Department(Project no 20G113) and ldquoResearch on the Impact of Fin-Tech on the Financing Capacity of SMEs under the COVID-
19rdquo Key Project of Hubei Small and Medium EnterprisesResearch Center in 2021 (Project no HBSME2021B03)
References
[1] M E Porter 1e Competitive Advantage of Nations HarvardBusiness Review Boston MA USA 1990
[2] S B Sirikrai and J C S Tang ldquoIndustrial competitivenessanalysis using the analytic hierarchy processrdquo 1e Journal ofHigh Technology Management Research vol 17 no 1pp 71ndash83 2006
[3] M Fetscherin I Alon and J P Johnson ldquoAssessing theexport competitiveness of Chinese industriesrdquo Asian Businessamp Management vol 9 no 3 pp 401ndash424 2010
[4] L Meleo ldquoOn the determinants of industrial competitivenessthe European union emission trading scheme and the Italianpaper industryrdquo Energy Policy vol 74 no 11 pp 535ndash5462014
[5] E P J Kleynhans ldquoFactors determining industrial compet-itiveness and the role of spilloversrdquo Journal of AppliedBusiness Research (JABR) vol 32 no 2 pp 527ndash540 2016
[6] D Purwadi ldquoe role of Japanese human resource planningpractices for increasing industrial competitivenessrdquo Proce-diamdashSocial and Behavioral Sciences vol 65 pp 253ndash2592012
[7] L Liu ldquoResearch on industrial competitiveness evaluationand promotion policy of Changzhutanrdquo Scientific andTechnological Progress and Countermeasures vol 27 no 1pp 65ndash67 2010
[8] L Moreno ldquoe determinants of Spanish industrial exports tothe European unionrdquo Applied Economics vol 29 no 6pp 723ndash732 1997
[9] P K Wong and Z L He ldquoA comparative study of innovationbehaviour in Singaporersquos KIBS and manufacturing firmsrdquo1eService Industries Journal vol 25 no 1 pp 23ndash42 2005
[10] T J Hannigan M Cano-Kollmann and R Mudambildquoriving innovation amidst manufacturing decline thedetroit auto cluster and the resilience of local knowledgeproductionrdquo Industrial and Corporate Change vol 24 no 3pp 613ndash634 2015
[11] M K Singh H Kumar M P Gupta and J Madaan ldquoAn-alyzing the determinants affecting the industrial competi-tiveness of electronics manufacturing in India by using TISMand AHPrdquo Global Journal of Flexible Systems Managementvol 19 no 3 pp 191ndash207 2018
[12] J Dong and Y You ldquoEmpirical Analysis on the internationalcompetitiveness of Chinarsquos aerospace manufacturing indus-tryrdquo Scientific and Technological Progress and Countermea-sures no 2 pp 55ndash58 2012
[13] A Banterle and L Carraresi ldquoCompetitive performanceanalysis and European union trade the case of the preparedswine meat sectorrdquo Food EconomicsmdashActa AgriculturaeScandinavica Section C vol 4 no 3 pp 159ndash172 2007
[14] S Lall ldquoCompetitiveness indices and developing countries aneconomic evaluation of the global competitiveness reportrdquoWorld Development vol 29 no 9 pp 1501ndash1525 2001
[15] R Sarker and S Ratnasena ldquoRevealed comparative advantageand half-a-century competitiveness of Canadian agriculture acase study of wheat beef and pork sectorsrdquo Canadian Journalof Agricultural EconomicsRevue canadienne drsquoagroeconomievol 62 no 4 pp 519ndash544 2014
[16] A Hannan F Haider N Ahmad and T Ishaq ldquoImpact ofeconomic social and environmental variables on competi-tiveness of automotive industry evidence from panel datardquo
Discrete Dynamics in Nature and Society 9
International Journal of Economic Behavior and Organizationvol 3 no 1 pp 10ndash17 2015
[17] L Carraresi and A Banterle ldquoAgri-food competitive per-formance in EU countries a fifteen-year retrospectiverdquo In-ternational Food amp Agribusiness Management Review vol 18no 2 pp 37ndash62 2015
[18] B Jin G Li and Z Chen ldquoEmpirical analysis on the inter-national competitiveness of Chinarsquos manufacturing industrysince its accession to the WTOrdquo Chinarsquos Industrial Economyvol 23 no 10 pp 5ndash14 2006
[19] H Wei and L Wu ldquoEvaluation of industrial competitivenessin Chinardquo Chinarsquos Industrial Economy vol 19 no 11pp 54ndash62 2002
[20] C Papahristodoulou ldquoA DEA model to evaluate car effi-ciencyrdquo Applied Economics vol 29 no 11 pp 1493ndash15081997
[21] I Oh J D Lee S Hwang and A Heshmati ldquoAnalysis ofproduct efficiency in the Korean automobile market from aconsumerrsquos perspectiverdquo Ratio Working Papers vol 38 no 1pp 119ndash137 2006
[22] M J Melitz and D Trefler ldquoGains from trade when firmsmatterrdquo Journal of Economic Perspectives vol 26 no 2pp 91ndash118 2012
[23] S Li and X Tang ldquoA positive analysis of the market con-centration and the competitiveness of large enterprises basedon the empirical evidence of Chinarsquos equipmentmanufacturing industryrdquo Journal of Shandong University(Philosophy and Social Sciences edition) vol 48 no 6pp 34ndash44 2013
[24] M J Farrell ldquoe measurement of productive efficiencyrdquoJournal of the Royal Statistical Society Series A (General)vol 120 no 3 pp 253ndash281 1957
10 Discrete Dynamics in Nature and Society

Made in China 2025 erefore it is of great significance tocorrectly estimate and evaluate the manufacturing com-petitiveness of Hubei e relevant results help to improvethe manufacturing competitiveness of the province and evenacross Central China promote high-end brands that aremade in China across the globe and contribute to thesustainable development of trade and economy in thecountry
Chinese and foreign researchers have explored industrialcompetitiveness extensively and reached fruitful resultsSome of the most representative studies are as follows
(1) Industrial competitiveness Porter a renownedAmerican economist proposed the famous diamondmodel and believed that the industrial competi-tiveness of a region is affected by factor endowmentsrelated industries corporate strategies externalopportunities market demand and governmentpolicies to name but a few [1]Since the turn of the century many new theorieshave emerged on industrial competitivenessrough analytic hierarchy process (AHP) Sirikraiand Tang [2] analyzed industrial competitivenessfrom two aspects strategy and operation manage-ment Fetscherin et al [3] held that the higher thedegree of industrial specialization the greater theshare of the industry in global exports Meleo [4]examined the impact of international events onregional industrial competitiveness from the per-spective of external opportunities Kleynhans [5]suggested that technology spillover has a significantpositive impact on the competitiveness of enterprisesand industries Based on relevant data in JapanPurwadi [6] found that human resource has grad-ually developed into an important influencer ofindustrial competitiveness Liu [7] constructed anevaluation index system for the industrial compet-itiveness of Changsha-Zhuzhou-Xiangtan regionand evaluated the industrial competitiveness byprincipal component analysis (PCA)
(2) Manufacturing competitiveness the foreign studieson manufacturing competitiveness can be tracedback to the 1960s Many researchers have studied thefactors affecting manufacturing competitivenessMoreno [8] established a regression model toidentify the determinants of Spanish manufacturingcompetitiveness Wong and He [9] stated thattechnological innovation plays an important role inmanufacturing development and the enhancementof manufacturing competitiveness Purwadi [6]discovered that human resource is developing into amajor impactor of manufacturing competitiveness inJapan Hannigan et al [10] learned that the com-petitiveness of different types of manufacturingenterprises varies with development strategies Singhet al [11] highlighted the importance of governmentsupport new technologies and investment tomanufacturing competitiveness Dong and You [12]
analyzed the status quo of Chinarsquos aerospacemanufacturing from the angles of competitivestrength competitive potential and competitiveenvironment and established an evaluation system
(3) Evaluation of industrial competitivenesssome re-searchers measured international competitiveness ofindustries from the macro perspective mainly usingtrade specialization coefficient (TSC) export marketshare (EMS) and revealed comparative advantage(RCA) [13ndash15] Hannan et al [16] measured in-dustrial competitiveness with the RCA and con-cluded that the competitiveness of the auto industryis positively correlated with economic performancehuman capital development urbanization and tarifflevel and negatively correlated with loan rate andcarbon emissions Carraresi and Banterle [17]adopted the EMS and RCA to measure competitiveperformance Jin et al [18] evaluated the interna-tional competitiveness of Chinarsquos manufacturingindustry in terms of market share and productprofitabilitySome researchers measured industrial competitive-ness from the meso perspective Since the 1980s theWorld Economic Forum (WEF) and the Interna-tional Institute for Management Development(IMD) in Lausanne Switzerland have beenresearching this topic and have formed a relativelycomplete competitiveness evaluation system Toevaluate industrial competitiveness many Chinesescholars have probed into the evaluation indexsystems formation mechanism and empiricalanalysis of industrial competitiveness For exampleWei and Wu [19] constructed an evaluation indexsystem for competitiveness which covers the fol-lowing dimensions industrial technological inno-vation ability rational resource allocation abilityindustrial growth potential and market influenceSome researchers measured enterprise competi-tiveness from the micro perspective On themicrolevel the enterprise competitiveness is mainlymeasured and compared in terms of productionefficiency market share and enterprise scale erelevant evaluation index systems primarily focus onproduction efficiency enterprise scale and marketgrowthscale
Firstly production efficiency of enterprises is mainlymeasured by the nonparametric methods of data envelop-ment analysis (DEA) and stochastic frontier analysis (SFA)and the semiparametric method of OlleyndashPakes (OP) pro-duction function ese methods decompose productionefficiency into an efficient part and an inefficient part beforecomparing the level or magnitude of enterprise efficienciesPapahristodoulou [20] used the DEA to analyze the costperformance of 121 different models produced by autoenterprises in different countries in 1996 and compared themarket competitiveness of auto enterprises from differentcountries With the aid of DEA Oh et al [21] evaluated the
2 Discrete Dynamics in Nature and Society
cost performance of cars produced by Korean auto enter-prises and compared the market competitiveness betweenauto enterprises in Korea
Secondly enterprise size is mainly measured by thenumber of employees gross output and per-capita output ofeach enterprise With these metrics the scale and growthrate of each enterprise are determined and used to judge thecompetitiveness at the enterprise level Considering thepositive correlation between technological innovation andenterprise output Melitz and Trefler [22] believed that alarge enterprise tends to have a strong ability to engage intechnological innovation and a strong export capacity
irdly market growthscale is mainly measured bymarket concentration and locational Gini coefficient andused to characterize enterprise competitiveness Li and Tang[23] held that market concentration has a significant positiveeffect on the competitiveness of large enterprises andevaluated the competitiveness of large enterprises from fiveaspects scale benefit operating efficiency debt repaymentand growth
In summary industrial competitiveness has been deeplyexplored in the academia yielding a wealth of literature eexisting studies mainly deal with the influencing factors andevaluation of industrial competitiveness However there areseveral defects with these studies there is not yet a consensuson how to define and estimate competitiveness how to selectthe evaluation indices and how to measure competitivenessAs a result the existing methods have limited explanatorypower on industrial competitiveness Besides there are notmany reports on the competitiveness of enterprises inCentral China not to mention the manufacturing com-petitiveness of Hubei on enterprise level Based on the dataof Chinarsquos industrial enterprises of 1999ndash2011 this paperestimates the production efficiency of manufacturing inCentral Chinarsquos Hubei Province through SFA compared thedifference between the 17 preferences of the province inmanufacturing competitiveness and fully discussed theinteractions and fluctuations between the factors affectingthe manufacturing competitiveness On this basis severalcountermeasures were proposed to enhance themanufacturing competitiveness of Hubei e research re-sults provide a solid basis for Hubei Province to transform itsmanufacturing industry enhance manufacturing competi-tiveness and realize high-quality development
e remainder of this paper is organized as followsSection 2 establishes the model explains the data sourcesand selects the variables Section 3 estimates the productionefficiency of manufacturing enterprises in Hubei Section 4sums up the findings and provides the countermeasures
2 Model Construction Data Sources andVariable Selection
21 Model Construction is paper selects the productionefficiency of enterprises to measure the manufacturingcompetitiveness of Hubei Province e measurement ofproduction efficiency was pioneered by Farrel [24] Cur-rently the popular ways to measure production efficiencyinclude nonparametric estimation methods like DEA and
parameter estimation methods like SFA e nonparametricestimation methods are generally unstable in output and inneed of high-quality data By contrast the SFA can bothcalculate the production efficiency of an enterprise with asuitable production function and reflect the impact ofbackground variables (ie various environmental factors)on the explained variable (ie the production efficiency ofthe enterprise) erefore the SFA was selected to estimateand measure the manufacturing competitiveness of Hubei
e SFA model was proposed as early as 1977 by foreignscholars like Aigner andMeeusene basic idea of SFA is asfollows
Let f(zi β) be the production function of enterprisesand qi f(zi β) be the optimal production function of thei-th enterprise without random interference and efficiencyloss However inefficiency is commonplace among enter-prises Normally the actual output of an enterprise is smallerthan its optimal output us the actual output of the i-thenterprise can be defined as
qi f zi β( 1113857ξi (1)
where ξi is the production efficiency of the i-th enterprisee ξi value inevitably falls within (0 1] If ξi 1 the en-terprise utilizes the optimal technology of the productionfunction f(zi β) in this case the enterprise can achieve theoptimal output and boast the highest competitiveness Ifξi lt 1 the enterprise cannot fully utilize the inputs zi underthe given conditions Since qi gt 0 (the output is strictlypositive) there must exists ξi gt 0 (technical efficiency mustbe positive) Assuming that the enterprise output could beaffected by random shocks the output of an enterprise underrandom shocks can be expressed as
qi f zi β( 1113857ξi exp vi( 1113857 (2)
Taking the natural logarithm of both sides
ln qi( 1113857 ln f zi β( 11138571113864 1113865 + ln ξi( 1113857 + vi (3)
Suppose there are k kinds of inputs with linear loga-rithmic form and ui minusln(ξi) en the output functionunder random shocks can be rewritten in logarithmic formas
ln qi( 1113857 β0 + 1113944k
j1βj ln zji1113872 1113873 + vi minus ui (4)
where ui is a subtracted term in the output logarithmicfunction is term must be greater than or equal to zerosuch that the enterprise efficiency meets the condition0lt ξi le 1 In this case function (4) is a stochastic frontierproduction function
On this basis Kumbhakar and Lovell derived a dualproduction cost function in 2000
ln ci( 1113857 β0 + βq ln qi( 1113857 + 1113944
k
j1βj ln pji1113872 1113873 + vi + ui (5)
where ci is cost qi is output pji is price of elements eother variables are the same as above If an enterprise is
Discrete Dynamics in Nature and Society 3
inefficient the output will decline or the production cost willincrease
22 Data Sources and Variable Selection To measure themanufacturing competitiveness of Hubei from the enter-prise level the data on manufacturing enterprises of Hubeiwere extracted from China Industrial Enterprise Database(1999ndash2011) through the following steps
Firstly rename all the variables named ldquoHubei Provincerdquoamong the ldquoprovinceautonomous regionrdquo variables as wellas the place names within the province to ldquoHubei ProvincerdquoFor example the variables named ldquoHubeirdquo ldquoHuangshirdquo andldquoWuhanrdquo were uniformly coded as ldquoHubei Provincerdquo afterchecking the ldquoAdministrative Region Coderdquo In this way allenterprises in Hubei were clearly identified as belonging tothat province
Secondly extract the enterprises from ldquoHubei Provincerdquoafter the renaming process A total of 226 variables and112034 observations were extracted
irdly screen and sort out the variables e mainpurpose is to delete the duplicate values and convert andsort out the attributes numbers and characters in thevariables
Fourthly sort out the locations of the enterprises by fourstandards in turn the ldquoArea Codesrdquo of Hubei ldquoPrefecturalCodesrdquo of Hubei ldquoCounty Codesrdquo of Hubei and ldquoEnterpriseNamerdquo In this way all enterprises in Hubei were allocated tothe 17 prefectures Table 1 lists the serial numbers of the 17prefectures ie the area codes of these prefectures
Fifthly allocate the enterprises in Hubei to the 17prefectures according to the above classification After re-moving the enterprises that cannot be allocated to anyprefecture the distribution of the enterprises is shown inTable 2
According to the theory on enterprise competitiveness(ie the stochastic frontier production function) the mainvariables were extracted as follows
(1) Enterprise output there are many ways to measureenterprise output By tradition this paper measuresoutput with gross industrial output (g1911) in itslogarithmic form (lg1911)
(2) Enterprise inputs the fixed infrastructure labor andlabor training cost were measured by the meanbalance of net fixed assets (g2123) number of em-ployees (g2515) and human capital (g2416) re-spectively these metrics were also expressed inlogarithmic forms (lg2123 lg2515 and lg2416)
Table 3 shows the descriptive statistics on the abovevariables
3 Estimation of Production Efficiency
31 EstimationMethod According to the proposed functionand variable definitions the SFA model for productionefficiency estimation can be established as
ln lg1911it( 1113857 β0 + β1lg2123it + β2lg2515it + β3lg2511it
+ β4lg2416it minus uit + vit
(6)
It was assumed that ui obeys half-normal distributionand vi obeys normal distribution
Table 4 lists the analysis results on the main variablesincluding the coefficients about how the output (lg1911) iscorrelated with number of employees (lg2515) mean bal-ance of net fixed assets (lg2123) and human capital (lg2416)e results show that the correlations are credible nullifyingthe null hypothesis (the correlation coefficients equal zero)at the significance level of 1
e production efficiency of manufacturing enterprisesin Hubei was estimated in four steps first select and analyzethe relevant variables of the production function secondestimate and test the parameters of the SFA model based onthe data of industrial enterprises in Hubei 1999ndash2011 thirdestimate the production efficiency of each enterprise in the17 prefectures and calculate the annual mean productionefficiency in each prefecture fourth compare themanufacturing competitiveness between the 17 prefectureswith the annual mean production efficiency as the metricand draw the basic conclusions
32ParameterEstimation eparameters of the SFAmodelwere estimated based on the enterprise data collected fromChina Industrial Enterprise Database (1999ndash2011) e es-timated results are recorded in Tables 5 and 6
e following can be learned from the analysis results inTable 5
First the mean balance of net fixed assets had positiveeffect on the gross industrial output of industrial enterprisese correlation coefficient was significantly different fromzero in both equations Hence fixed assets like infrastructurepromote the output of industrial enterprises Besides thecorrelation coefficient remained significant on the 1 levelsuggesting that the mean balance of net fixed assets ob-jectively influences the added value of industrial enterprises
Second labor had an immense impact on the grossindustrial output of industrial enterprises e coefficient ofnumber of employees was significant whether in ordinaryregression analysis cross-section SFA or panel data SFAus labor determines the added value of industrial en-terprises in the long run
ird human capital also had a huge impact on the grossindustrial output of industrial enterprises e cross-sectionand panel data SFAs show that human capital had a sig-nificant coefficient is means the enterprise expenditureon labor training determines the gross industrial output ofenterprises
Fourth lnsig2u _cons and mu _cons were the p valuesreflecting that ui differs from the null hypothesis erandom interference term (ui) in the SFA model was sig-nificantly different from zero As a result the random in-terference term clearly exits and objectively affects enterpriseoutput
4 Discrete Dynamics in Nature and Society
Tabl
e1
Serial
numbers
ofprefectures
Prefecture
Wuh
anXiang
fan
Ezho
uXiaogan
Yichang
Enshi
Shiyan
Suizho
uHuang
gang
Huang
shi
Xiann
ing
Jingzho
uJin
gmen
Xiantao
Qianjiang
Tianmen
Serial
number
027
0710
0711
0712
0717
0718
0719
0722
0713
0714
0715
0716
0724
0725
0726
0728
NoteXiantaoQ
ianjiang
Tianm
enand
Shenno
ngjia
ared
irectly
administersb
ythep
rovincialgovernm
entAccording
togeograph
icallocatio
nthe0
728area
code
shared
byXiantaoQ
ianjiang
and
Tianmen
was
brok
endo
wninto
0725
forXiantao0
726forQianjiang
and
0728
forTianmen
Discrete Dynamics in Nature and Society 5
Table 3 Descriptive statistics on the variables of industrial enterprises in Hubei
Variable Observation Mean Standard deviation Minimum MaximumOutput (lg1911) 89636 9753957 1444135 0 1365094Number of employees (lg2515) 96960 4542324 1256794 1098612 7889834Fixed assets (lg2123) 96956 955079 1528341 5192957 1409054Human capital (lg2416) 78315 9455429 1565896 0 1792006Data source China Industrial Enterprise Database (1999ndash2011) Notes there were huge differences between the observations of the above variables a sign ofmany missing values Subsequently the observations with lots of missing values were removed before analysis
Table 4 Correlation analysis on relevant variables of manufacturing enterprises in Hubei
lg1911 lg2515 lg2123 lg2416Output (lg1911) 10000Number of employees (lg2515) 06078 10000Fixed assets (lg2123) 06836 06325 10000Human capital (lg2416) 08241 04663 06220 10000
Table 2 Distribution of industrial enterprises in the 17 prefectures of Hubei
Prefecture Number Percentage Downward cumulative percentageWuhan 19275 1988 1988Huangshi 4500 464 2452Shiyan 4665 481 2933Yichang 7070 729 3662Xiangfan 7363 759 4421Ezhou 3227 333 4754Jingmen 5902 609 5363Xiaogan 7813 806 6168Jingzhou 7909 816 6984Huanggang 8989 927 7911Xianning 5177 534 8445Enshi 2358 243 8688Suizhou 4807 496 9183Shenglongjia 143 015 9198Xiantao 3120 322 9520Qianjiang 2328 240 9760In total 96973 100 100Data source China Industrial Enterprise Database (1999ndash2011)
Table 5 Estimations of SFA parameters for the 17 prefectures
(1) Cross-section stochastic frontierlg1911
(2) Panel data stochastic frontierlg1911
lg2515 00901lowastlowastlowast
(3095)0157lowastlowastlowast
(4321)
lg2123 0172lowastlowastlowast
(7484)0189lowastlowastlowast
(6466)
lg2416 0653lowastlowastlowast
(33314)0532lowastlowastlowast
(23160)
_cons 1060lowastlowastlowast
(2274)7105(037)
lnsig2v _cons minus1098lowastlowastlowast
(minus20825)
lnsig2u _cons minus1460(minus010)
lnsigma2_cons minus0987lowastlowastlowast
(minus11937)
ilgtgamma _cons 0332lowastlowastlowast
(1957)
mu _cons 5549(029)
N 71979 71979Annual dummy (control) variable Yes YesIndustrial dummy (control) variable Yes Yest statistics in parentheses lowastplt 1 lowastlowastplt 005 and lowastlowastlowastPlt 001
6 Discrete Dynamics in Nature and Society
Tabl
e6
Estim
ated
prod
uctio
neffi
ciencies
ofindu
strial
enterprisesin
the17
prefecturesof
Hub
ei(ann
ualm
ean)
Prefecture
1999
2000
2001
2002
2003
2005
2006
2007
2010
2011
Wuh
an000864946
000888881
000990813
001016356
00115944
001269094
00129358
001264344
001241972
001235955
Huang
shi
000912404
000906635
000928386
00092479
000927902
000965555
000994157
000949741
000930071
000923054
Shiyan
000751613
000757303
000796029
000802157
000844919
000818838
00081401
000801579
000783633
000777346
Yichang
000929037
000955172
000935373
000917235
000905062
000896731
00088519
000859723
000842023
000834386
Xiang
fan
000948962
000998555
000947397
001173034
001093264
00089419
000867732
000875403
000857594
000850064
Ezho
u001000637
001011546
001021252
001057368
00110661
001032068
000998913
000955672
000935569
000928364
Jingm
en000805834
000815295
000912962
000943033
000858202
000849949
00084705
000830046
000811671
000805716
Xiaogan
000973147
00098395
000978824
000957678
000918027
000881024
000864634
000832201
000812854
000807617
Jingzho
u000927887
000940402
000927839
000919883
000881849
000823173
000806799
000795142
000777513
00077147
Huang
gang
00102116
001024694
000980688
000989584
000982209
000847602
000872432
000844615
000826024
000819901
Xiann
ing
000870017
000973885
000943499
000949509
000927374
000875819
000861993
000838231
000822935
000816259
Enshi
000671094
000682235
000696588
000718961
00075859
000791164
000770298
000769715
000752765
000746994
Suizho
u001064086
001050217
001051528
001080381
001040744
000977538
00097586
000946632
000926008
000919313
Shenglon
gjia
000554867
000520701
000586326
000558253
000574757
000732859
000669766
000694146
000678114
000672837
Xiantao
000991318
001021604
001032507
001004784
000982655
000928097
000925784
000887959
000868365
00086191
Qianjiang
000956769
000957655
000941302
000898894
000893513
000953004
000938846
001009957
000989641
000982944
Tianmen
001062473
00105404
00104514
001055547
001026098
000991886
000970058
000924737
000906298
000897785
Discrete Dynamics in Nature and Society 7
To sum up the estimation results of the SFA modelparameters of manufacturing enterprises in Hubei are ro-bust and the selected model is suitable for this research
33 Estimated Production Efficiencies Next the authorsfurther analyzed the industrial competitiveness withinHubei Based on the selected SFA model the annual meanproduction efficiencies of industrial enterprises in the 17prefectures of Hubei 1999ndash2011 were derived on Stata(Table 6)
As shown in Table 6 the 17 prefectures differed sharplyin estimated production efficiency from 1999 to 2011 Forcomparison the 17 prefectures were divided into threegroups by the production efficiency of manufacturingcompanies low efficiency group medium efficiency groupand high efficiency group Due to the lack of space the threegroups were compared only in 1999 and 2011
As shown in Figure 1 Hubei Province had a generallylow production efficiency of manufacturing companiesAbout 23 of all prefectures belonged to the medium effi-ciency group e production efficiency of manufacturingcompanies in Hubei had not been significantly improved inthe sample period From 1999 to 2011 the industrial pro-duction efficiency in most prefectures did not change sig-nificantly and only 4 prefectures witnessed changes in thatefficiency Specifically Xianning dropped from mediumefficiency group to low efficiency group Wuhan fell fromhigh efficiency group to medium efficiency group Xiangfanpromoted from low efficiency group to medium efficiencygroup Xiaogan climbed up frommedium efficiency group tohigh efficiency group All the other prefectures remained inthe original group
4 Conclusions
To reveal the impact of production efficiency improvementon manufacturing competitiveness this paper carries outSFA to estimate the production efficiency of manufacturingin Hubei Province based on the data of Chinese industrialenterprises from 1999 to 2011 e main conclusions are asfollows
(1) Mean balance of net fixed assets and fixed assets (eginfrastructure) both had positive impact on the grossindustrial output of manufacturing companies ismeans the added value of manufacturing companiesin Hubei depends much on the long-term invest-ment and fixed asset investment of enterpriseserefore the enterprises should actively increasethe share of fixed asset investment and long-terminvestment in corporate assets and pay particularattention to the cultivation of technological inno-vation capabilities Meanwhile the enterprisesshould digest absorb and reinnovate the introducedtechnologies and equipment manufacture highlytechnical products and enhance their owncompetitiveness
(2) Labor and human capital had relatively great impacton the gross output of manufacturing companies anddetermined the industrial added value of enterprisesin the long term erefore Hubei Province shouldattach importance to human resources andstrengthen the integration of production educationand research It is also important to encourage theinteraction between enterprises colleges and re-search institutions e province should give play to
Enshi
Xiangfan
Shiyan
Hubei
Low efficiencyMedium efficiencyHigh efficiency
1999 2011
Wuhan WuhanYichang
Xiangfan
EzhouEzhou
JingmenXiaogan
XiaoganHuanggang
Huanggang
Xianning Xianning
SuizhouShenglongjia
XiantaoXiantao
QianjiangQianjiang
Tianmen Tianmen
HuangshiHuangshi
Shiyan
YichangJingmen
Jingzhou JingzhouEnshi
SuizhouShenglongjia
Figure 1 Grouping of the 17 prefectures by production efficiency of manufacturing companies
8 Discrete Dynamics in Nature and Society
its advantages in science and education and establisha long-term cooperation platform between enter-prises colleges and research institutions
(3) From 1999 to 2011 the industrial production effi-ciency in most prefectures did not change signifi-cantly and only 4 prefectures witnessed changes inthat efficiency Specifically Xianning dropped frommedium efficiency group to low efficiency groupWuhan fell from high efficiency group to mediumefficiency group Xiangfan promoted from low ef-ficiency group to medium efficiency group Xiaoganclimbed up from medium efficiency group to highefficiency group
e above changes in production efficiency mainly arisefrom geographic relations especially the development ofWuhan Metropolitan Area For example Xiaogan has cer-tain advantages in space and transportation and mainlydevelops light industries like the production and processingof grain cotton oil animal husbandry and aquatic prod-ucts Xianning focuses its energy to build a production andprocessing base for green agriculture forestry and aquaticproducts as well as characteristic agricultural and sidelineproducts Wuhan functions as an advanced manufacturingbase and a research and industrialization base of high-techindustries Nevertheless the Wuhan Metropolitan Area hasnot grown fast enough and the relevant cities lack cleardivision of labor and cooperation
To solve the above structural problems Hubei Provinceshould make full use of its geographical advantage as ldquoathoroughfare leading to nine provincesrdquo and strive to build amodern industrial system that appeals to foreign investorsWith Wuhan playing the leading role in regional coordi-nated development the province needs to speed up theformation of a regional economic structure for mutualpromotion and development Under the structure Wuhanserves as the center six other large cities serve as the pillarand the counties serve as the basis In addition Hubei mustfurther improve the industrial chain within clusters pro-mote the integration of regional manufacturing and therebyenhance its manufacturing competitiveness
Data Availability
e data used to support the findings of this study areavailable from the corresponding author upon request
Conflicts of Interest
e authors declare that they have no conflicts of interest
Acknowledgments
e authors acknowledge that this work was supported byldquoResearch on Scene-based Financial Process ReconstructionBased on Financial Integrationrdquo Philosophy and SocialScience Research Project of Hubei Education Department(Project no 20G113) and ldquoResearch on the Impact of Fin-Tech on the Financing Capacity of SMEs under the COVID-
19rdquo Key Project of Hubei Small and Medium EnterprisesResearch Center in 2021 (Project no HBSME2021B03)
References
[1] M E Porter 1e Competitive Advantage of Nations HarvardBusiness Review Boston MA USA 1990
[2] S B Sirikrai and J C S Tang ldquoIndustrial competitivenessanalysis using the analytic hierarchy processrdquo 1e Journal ofHigh Technology Management Research vol 17 no 1pp 71ndash83 2006
[3] M Fetscherin I Alon and J P Johnson ldquoAssessing theexport competitiveness of Chinese industriesrdquo Asian Businessamp Management vol 9 no 3 pp 401ndash424 2010
[4] L Meleo ldquoOn the determinants of industrial competitivenessthe European union emission trading scheme and the Italianpaper industryrdquo Energy Policy vol 74 no 11 pp 535ndash5462014
[5] E P J Kleynhans ldquoFactors determining industrial compet-itiveness and the role of spilloversrdquo Journal of AppliedBusiness Research (JABR) vol 32 no 2 pp 527ndash540 2016
[6] D Purwadi ldquoe role of Japanese human resource planningpractices for increasing industrial competitivenessrdquo Proce-diamdashSocial and Behavioral Sciences vol 65 pp 253ndash2592012
[7] L Liu ldquoResearch on industrial competitiveness evaluationand promotion policy of Changzhutanrdquo Scientific andTechnological Progress and Countermeasures vol 27 no 1pp 65ndash67 2010
[8] L Moreno ldquoe determinants of Spanish industrial exports tothe European unionrdquo Applied Economics vol 29 no 6pp 723ndash732 1997
[9] P K Wong and Z L He ldquoA comparative study of innovationbehaviour in Singaporersquos KIBS and manufacturing firmsrdquo1eService Industries Journal vol 25 no 1 pp 23ndash42 2005
[10] T J Hannigan M Cano-Kollmann and R Mudambildquoriving innovation amidst manufacturing decline thedetroit auto cluster and the resilience of local knowledgeproductionrdquo Industrial and Corporate Change vol 24 no 3pp 613ndash634 2015
[11] M K Singh H Kumar M P Gupta and J Madaan ldquoAn-alyzing the determinants affecting the industrial competi-tiveness of electronics manufacturing in India by using TISMand AHPrdquo Global Journal of Flexible Systems Managementvol 19 no 3 pp 191ndash207 2018
[12] J Dong and Y You ldquoEmpirical Analysis on the internationalcompetitiveness of Chinarsquos aerospace manufacturing indus-tryrdquo Scientific and Technological Progress and Countermea-sures no 2 pp 55ndash58 2012
[13] A Banterle and L Carraresi ldquoCompetitive performanceanalysis and European union trade the case of the preparedswine meat sectorrdquo Food EconomicsmdashActa AgriculturaeScandinavica Section C vol 4 no 3 pp 159ndash172 2007
[14] S Lall ldquoCompetitiveness indices and developing countries aneconomic evaluation of the global competitiveness reportrdquoWorld Development vol 29 no 9 pp 1501ndash1525 2001
[15] R Sarker and S Ratnasena ldquoRevealed comparative advantageand half-a-century competitiveness of Canadian agriculture acase study of wheat beef and pork sectorsrdquo Canadian Journalof Agricultural EconomicsRevue canadienne drsquoagroeconomievol 62 no 4 pp 519ndash544 2014
[16] A Hannan F Haider N Ahmad and T Ishaq ldquoImpact ofeconomic social and environmental variables on competi-tiveness of automotive industry evidence from panel datardquo
Discrete Dynamics in Nature and Society 9
International Journal of Economic Behavior and Organizationvol 3 no 1 pp 10ndash17 2015
[17] L Carraresi and A Banterle ldquoAgri-food competitive per-formance in EU countries a fifteen-year retrospectiverdquo In-ternational Food amp Agribusiness Management Review vol 18no 2 pp 37ndash62 2015
[18] B Jin G Li and Z Chen ldquoEmpirical analysis on the inter-national competitiveness of Chinarsquos manufacturing industrysince its accession to the WTOrdquo Chinarsquos Industrial Economyvol 23 no 10 pp 5ndash14 2006
[19] H Wei and L Wu ldquoEvaluation of industrial competitivenessin Chinardquo Chinarsquos Industrial Economy vol 19 no 11pp 54ndash62 2002
[20] C Papahristodoulou ldquoA DEA model to evaluate car effi-ciencyrdquo Applied Economics vol 29 no 11 pp 1493ndash15081997
[21] I Oh J D Lee S Hwang and A Heshmati ldquoAnalysis ofproduct efficiency in the Korean automobile market from aconsumerrsquos perspectiverdquo Ratio Working Papers vol 38 no 1pp 119ndash137 2006
[22] M J Melitz and D Trefler ldquoGains from trade when firmsmatterrdquo Journal of Economic Perspectives vol 26 no 2pp 91ndash118 2012
[23] S Li and X Tang ldquoA positive analysis of the market con-centration and the competitiveness of large enterprises basedon the empirical evidence of Chinarsquos equipmentmanufacturing industryrdquo Journal of Shandong University(Philosophy and Social Sciences edition) vol 48 no 6pp 34ndash44 2013
[24] M J Farrell ldquoe measurement of productive efficiencyrdquoJournal of the Royal Statistical Society Series A (General)vol 120 no 3 pp 253ndash281 1957
10 Discrete Dynamics in Nature and Society

Tabl
e1
Serial
numbers
ofprefectures
Prefecture
Wuh
anXiang
fan
Ezho
uXiaogan
Yichang
Enshi
Shiyan
Suizho
uHuang
gang
Huang
shi
Xiann
ing
Jingzho
uJin
gmen
Xiantao
Qianjiang
Tianmen
Serial
number
027
0710
0711
0712
0717
0718
0719
0722
0713
0714
0715
0716
0724
0725
0726
0728
NoteXiantaoQ
ianjiang
Tianm
enand
Shenno
ngjia
ared
irectly
administersb
ythep
rovincialgovernm
entAccording
togeograph
icallocatio
nthe0
728area
code
shared
byXiantaoQ
ianjiang
and
Tianmen
was
brok
endo
wninto
0725
forXiantao0
726forQianjiang
and
0728
forTianmen
Discrete Dynamics in Nature and Society 5
Table 3 Descriptive statistics on the variables of industrial enterprises in Hubei
Variable Observation Mean Standard deviation Minimum MaximumOutput (lg1911) 89636 9753957 1444135 0 1365094Number of employees (lg2515) 96960 4542324 1256794 1098612 7889834Fixed assets (lg2123) 96956 955079 1528341 5192957 1409054Human capital (lg2416) 78315 9455429 1565896 0 1792006Data source China Industrial Enterprise Database (1999ndash2011) Notes there were huge differences between the observations of the above variables a sign ofmany missing values Subsequently the observations with lots of missing values were removed before analysis
Table 4 Correlation analysis on relevant variables of manufacturing enterprises in Hubei
lg1911 lg2515 lg2123 lg2416Output (lg1911) 10000Number of employees (lg2515) 06078 10000Fixed assets (lg2123) 06836 06325 10000Human capital (lg2416) 08241 04663 06220 10000
Table 2 Distribution of industrial enterprises in the 17 prefectures of Hubei
Prefecture Number Percentage Downward cumulative percentageWuhan 19275 1988 1988Huangshi 4500 464 2452Shiyan 4665 481 2933Yichang 7070 729 3662Xiangfan 7363 759 4421Ezhou 3227 333 4754Jingmen 5902 609 5363Xiaogan 7813 806 6168Jingzhou 7909 816 6984Huanggang 8989 927 7911Xianning 5177 534 8445Enshi 2358 243 8688Suizhou 4807 496 9183Shenglongjia 143 015 9198Xiantao 3120 322 9520Qianjiang 2328 240 9760In total 96973 100 100Data source China Industrial Enterprise Database (1999ndash2011)
Table 5 Estimations of SFA parameters for the 17 prefectures
(1) Cross-section stochastic frontierlg1911
(2) Panel data stochastic frontierlg1911
lg2515 00901lowastlowastlowast
(3095)0157lowastlowastlowast
(4321)
lg2123 0172lowastlowastlowast
(7484)0189lowastlowastlowast
(6466)
lg2416 0653lowastlowastlowast
(33314)0532lowastlowastlowast
(23160)
_cons 1060lowastlowastlowast
(2274)7105(037)
lnsig2v _cons minus1098lowastlowastlowast
(minus20825)
lnsig2u _cons minus1460(minus010)
lnsigma2_cons minus0987lowastlowastlowast
(minus11937)
ilgtgamma _cons 0332lowastlowastlowast
(1957)
mu _cons 5549(029)
N 71979 71979Annual dummy (control) variable Yes YesIndustrial dummy (control) variable Yes Yest statistics in parentheses lowastplt 1 lowastlowastplt 005 and lowastlowastlowastPlt 001
6 Discrete Dynamics in Nature and Society
Tabl
e6
Estim
ated
prod
uctio
neffi
ciencies
ofindu
strial
enterprisesin
the17
prefecturesof
Hub
ei(ann
ualm
ean)
Prefecture
1999
2000
2001
2002
2003
2005
2006
2007
2010
2011
Wuh
an000864946
000888881
000990813
001016356
00115944
001269094
00129358
001264344
001241972
001235955
Huang
shi
000912404
000906635
000928386
00092479
000927902
000965555
000994157
000949741
000930071
000923054
Shiyan
000751613
000757303
000796029
000802157
000844919
000818838
00081401
000801579
000783633
000777346
Yichang
000929037
000955172
000935373
000917235
000905062
000896731
00088519
000859723
000842023
000834386
Xiang
fan
000948962
000998555
000947397
001173034
001093264
00089419
000867732
000875403
000857594
000850064
Ezho
u001000637
001011546
001021252
001057368
00110661
001032068
000998913
000955672
000935569
000928364
Jingm
en000805834
000815295
000912962
000943033
000858202
000849949
00084705
000830046
000811671
000805716
Xiaogan
000973147
00098395
000978824
000957678
000918027
000881024
000864634
000832201
000812854
000807617
Jingzho
u000927887
000940402
000927839
000919883
000881849
000823173
000806799
000795142
000777513
00077147
Huang
gang
00102116
001024694
000980688
000989584
000982209
000847602
000872432
000844615
000826024
000819901
Xiann
ing
000870017
000973885
000943499
000949509
000927374
000875819
000861993
000838231
000822935
000816259
Enshi
000671094
000682235
000696588
000718961
00075859
000791164
000770298
000769715
000752765
000746994
Suizho
u001064086
001050217
001051528
001080381
001040744
000977538
00097586
000946632
000926008
000919313
Shenglon
gjia
000554867
000520701
000586326
000558253
000574757
000732859
000669766
000694146
000678114
000672837
Xiantao
000991318
001021604
001032507
001004784
000982655
000928097
000925784
000887959
000868365
00086191
Qianjiang
000956769
000957655
000941302
000898894
000893513
000953004
000938846
001009957
000989641
000982944
Tianmen
001062473
00105404
00104514
001055547
001026098
000991886
000970058
000924737
000906298
000897785
Discrete Dynamics in Nature and Society 7
To sum up the estimation results of the SFA modelparameters of manufacturing enterprises in Hubei are ro-bust and the selected model is suitable for this research
33 Estimated Production Efficiencies Next the authorsfurther analyzed the industrial competitiveness withinHubei Based on the selected SFA model the annual meanproduction efficiencies of industrial enterprises in the 17prefectures of Hubei 1999ndash2011 were derived on Stata(Table 6)
As shown in Table 6 the 17 prefectures differed sharplyin estimated production efficiency from 1999 to 2011 Forcomparison the 17 prefectures were divided into threegroups by the production efficiency of manufacturingcompanies low efficiency group medium efficiency groupand high efficiency group Due to the lack of space the threegroups were compared only in 1999 and 2011
As shown in Figure 1 Hubei Province had a generallylow production efficiency of manufacturing companiesAbout 23 of all prefectures belonged to the medium effi-ciency group e production efficiency of manufacturingcompanies in Hubei had not been significantly improved inthe sample period From 1999 to 2011 the industrial pro-duction efficiency in most prefectures did not change sig-nificantly and only 4 prefectures witnessed changes in thatefficiency Specifically Xianning dropped from mediumefficiency group to low efficiency group Wuhan fell fromhigh efficiency group to medium efficiency group Xiangfanpromoted from low efficiency group to medium efficiencygroup Xiaogan climbed up frommedium efficiency group tohigh efficiency group All the other prefectures remained inthe original group
4 Conclusions
To reveal the impact of production efficiency improvementon manufacturing competitiveness this paper carries outSFA to estimate the production efficiency of manufacturingin Hubei Province based on the data of Chinese industrialenterprises from 1999 to 2011 e main conclusions are asfollows
(1) Mean balance of net fixed assets and fixed assets (eginfrastructure) both had positive impact on the grossindustrial output of manufacturing companies ismeans the added value of manufacturing companiesin Hubei depends much on the long-term invest-ment and fixed asset investment of enterpriseserefore the enterprises should actively increasethe share of fixed asset investment and long-terminvestment in corporate assets and pay particularattention to the cultivation of technological inno-vation capabilities Meanwhile the enterprisesshould digest absorb and reinnovate the introducedtechnologies and equipment manufacture highlytechnical products and enhance their owncompetitiveness
(2) Labor and human capital had relatively great impacton the gross output of manufacturing companies anddetermined the industrial added value of enterprisesin the long term erefore Hubei Province shouldattach importance to human resources andstrengthen the integration of production educationand research It is also important to encourage theinteraction between enterprises colleges and re-search institutions e province should give play to
Enshi
Xiangfan
Shiyan
Hubei
Low efficiencyMedium efficiencyHigh efficiency
1999 2011
Wuhan WuhanYichang
Xiangfan
EzhouEzhou
JingmenXiaogan
XiaoganHuanggang
Huanggang
Xianning Xianning
SuizhouShenglongjia
XiantaoXiantao
QianjiangQianjiang
Tianmen Tianmen
HuangshiHuangshi
Shiyan
YichangJingmen
Jingzhou JingzhouEnshi
SuizhouShenglongjia
Figure 1 Grouping of the 17 prefectures by production efficiency of manufacturing companies
8 Discrete Dynamics in Nature and Society
its advantages in science and education and establisha long-term cooperation platform between enter-prises colleges and research institutions
(3) From 1999 to 2011 the industrial production effi-ciency in most prefectures did not change signifi-cantly and only 4 prefectures witnessed changes inthat efficiency Specifically Xianning dropped frommedium efficiency group to low efficiency groupWuhan fell from high efficiency group to mediumefficiency group Xiangfan promoted from low ef-ficiency group to medium efficiency group Xiaoganclimbed up from medium efficiency group to highefficiency group
e above changes in production efficiency mainly arisefrom geographic relations especially the development ofWuhan Metropolitan Area For example Xiaogan has cer-tain advantages in space and transportation and mainlydevelops light industries like the production and processingof grain cotton oil animal husbandry and aquatic prod-ucts Xianning focuses its energy to build a production andprocessing base for green agriculture forestry and aquaticproducts as well as characteristic agricultural and sidelineproducts Wuhan functions as an advanced manufacturingbase and a research and industrialization base of high-techindustries Nevertheless the Wuhan Metropolitan Area hasnot grown fast enough and the relevant cities lack cleardivision of labor and cooperation
To solve the above structural problems Hubei Provinceshould make full use of its geographical advantage as ldquoathoroughfare leading to nine provincesrdquo and strive to build amodern industrial system that appeals to foreign investorsWith Wuhan playing the leading role in regional coordi-nated development the province needs to speed up theformation of a regional economic structure for mutualpromotion and development Under the structure Wuhanserves as the center six other large cities serve as the pillarand the counties serve as the basis In addition Hubei mustfurther improve the industrial chain within clusters pro-mote the integration of regional manufacturing and therebyenhance its manufacturing competitiveness
Data Availability
e data used to support the findings of this study areavailable from the corresponding author upon request
Conflicts of Interest
e authors declare that they have no conflicts of interest
Acknowledgments
e authors acknowledge that this work was supported byldquoResearch on Scene-based Financial Process ReconstructionBased on Financial Integrationrdquo Philosophy and SocialScience Research Project of Hubei Education Department(Project no 20G113) and ldquoResearch on the Impact of Fin-Tech on the Financing Capacity of SMEs under the COVID-
19rdquo Key Project of Hubei Small and Medium EnterprisesResearch Center in 2021 (Project no HBSME2021B03)
References
[1] M E Porter 1e Competitive Advantage of Nations HarvardBusiness Review Boston MA USA 1990
[2] S B Sirikrai and J C S Tang ldquoIndustrial competitivenessanalysis using the analytic hierarchy processrdquo 1e Journal ofHigh Technology Management Research vol 17 no 1pp 71ndash83 2006
[3] M Fetscherin I Alon and J P Johnson ldquoAssessing theexport competitiveness of Chinese industriesrdquo Asian Businessamp Management vol 9 no 3 pp 401ndash424 2010
[4] L Meleo ldquoOn the determinants of industrial competitivenessthe European union emission trading scheme and the Italianpaper industryrdquo Energy Policy vol 74 no 11 pp 535ndash5462014
[5] E P J Kleynhans ldquoFactors determining industrial compet-itiveness and the role of spilloversrdquo Journal of AppliedBusiness Research (JABR) vol 32 no 2 pp 527ndash540 2016
[6] D Purwadi ldquoe role of Japanese human resource planningpractices for increasing industrial competitivenessrdquo Proce-diamdashSocial and Behavioral Sciences vol 65 pp 253ndash2592012
[7] L Liu ldquoResearch on industrial competitiveness evaluationand promotion policy of Changzhutanrdquo Scientific andTechnological Progress and Countermeasures vol 27 no 1pp 65ndash67 2010
[8] L Moreno ldquoe determinants of Spanish industrial exports tothe European unionrdquo Applied Economics vol 29 no 6pp 723ndash732 1997
[9] P K Wong and Z L He ldquoA comparative study of innovationbehaviour in Singaporersquos KIBS and manufacturing firmsrdquo1eService Industries Journal vol 25 no 1 pp 23ndash42 2005
[10] T J Hannigan M Cano-Kollmann and R Mudambildquoriving innovation amidst manufacturing decline thedetroit auto cluster and the resilience of local knowledgeproductionrdquo Industrial and Corporate Change vol 24 no 3pp 613ndash634 2015
[11] M K Singh H Kumar M P Gupta and J Madaan ldquoAn-alyzing the determinants affecting the industrial competi-tiveness of electronics manufacturing in India by using TISMand AHPrdquo Global Journal of Flexible Systems Managementvol 19 no 3 pp 191ndash207 2018
[12] J Dong and Y You ldquoEmpirical Analysis on the internationalcompetitiveness of Chinarsquos aerospace manufacturing indus-tryrdquo Scientific and Technological Progress and Countermea-sures no 2 pp 55ndash58 2012
[13] A Banterle and L Carraresi ldquoCompetitive performanceanalysis and European union trade the case of the preparedswine meat sectorrdquo Food EconomicsmdashActa AgriculturaeScandinavica Section C vol 4 no 3 pp 159ndash172 2007
[14] S Lall ldquoCompetitiveness indices and developing countries aneconomic evaluation of the global competitiveness reportrdquoWorld Development vol 29 no 9 pp 1501ndash1525 2001
[15] R Sarker and S Ratnasena ldquoRevealed comparative advantageand half-a-century competitiveness of Canadian agriculture acase study of wheat beef and pork sectorsrdquo Canadian Journalof Agricultural EconomicsRevue canadienne drsquoagroeconomievol 62 no 4 pp 519ndash544 2014
[16] A Hannan F Haider N Ahmad and T Ishaq ldquoImpact ofeconomic social and environmental variables on competi-tiveness of automotive industry evidence from panel datardquo
Discrete Dynamics in Nature and Society 9
International Journal of Economic Behavior and Organizationvol 3 no 1 pp 10ndash17 2015
[17] L Carraresi and A Banterle ldquoAgri-food competitive per-formance in EU countries a fifteen-year retrospectiverdquo In-ternational Food amp Agribusiness Management Review vol 18no 2 pp 37ndash62 2015
[18] B Jin G Li and Z Chen ldquoEmpirical analysis on the inter-national competitiveness of Chinarsquos manufacturing industrysince its accession to the WTOrdquo Chinarsquos Industrial Economyvol 23 no 10 pp 5ndash14 2006
[19] H Wei and L Wu ldquoEvaluation of industrial competitivenessin Chinardquo Chinarsquos Industrial Economy vol 19 no 11pp 54ndash62 2002
[20] C Papahristodoulou ldquoA DEA model to evaluate car effi-ciencyrdquo Applied Economics vol 29 no 11 pp 1493ndash15081997
[21] I Oh J D Lee S Hwang and A Heshmati ldquoAnalysis ofproduct efficiency in the Korean automobile market from aconsumerrsquos perspectiverdquo Ratio Working Papers vol 38 no 1pp 119ndash137 2006
[22] M J Melitz and D Trefler ldquoGains from trade when firmsmatterrdquo Journal of Economic Perspectives vol 26 no 2pp 91ndash118 2012
[23] S Li and X Tang ldquoA positive analysis of the market con-centration and the competitiveness of large enterprises basedon the empirical evidence of Chinarsquos equipmentmanufacturing industryrdquo Journal of Shandong University(Philosophy and Social Sciences edition) vol 48 no 6pp 34ndash44 2013
[24] M J Farrell ldquoe measurement of productive efficiencyrdquoJournal of the Royal Statistical Society Series A (General)vol 120 no 3 pp 253ndash281 1957
10 Discrete Dynamics in Nature and Society