
Evaluation of Low Salinity Injection for the Minnelusa Formation, Powder River Basin, Wyoming
43
Evaluation of Low Salinity Injection for the Minnelusa Formation, Powder River Basin, Wyoming. Prepared for Enhanced Oil Recovery Institute Authors: Geoffrey Thyne Pubudu Gamage June 30, 2011
Transcript of Evaluation of Low Salinity Injection for the Minnelusa Formation, Powder River Basin, Wyoming

Evaluation of Low Salinity
Injection for the Minnelusa
Formation, Powder River Basin,
Wyoming.
Prepared for Enhanced Oil Recovery Institute
Authors:
Geoffrey Thyne
Pubudu Gamage
June 30, 2011

2
DISCLAIMER
THIS MATERIAL WAS PREPARED AS AN ACCOUNT OF WORK PRODUCED BY AN
AGENCY OF THE STATE OF WYOMING. NEITHER THE STATE OF WYOMING, NOR THE
UNIVERSITY OF WYOMING, NOR THE ENHANCED OIL RECOVERY INSTITUTE (EORI),
NOR ANY OF THEIR EMPLOYEES, MAKES ANY WARRANTY, EXPRESS OR IMPLIED, OR
ASSUMES ANY LEGAL LIABILITY OR RESPONSIBILITY FOR THE ACCURACY,
COMPLETENESS, OR USEFULNESS OF ANY INFORMATION, APPARATUS, PRODUCT, OR
PROCESS DISCLOSED, OR REPRESENTS THAT ITS USE WOULD NOT INFRINGE
PRIVATELY OWNED RIGHTS. THE EORI RESERVES THE RIGHT TO CHANGE, AMEND,
ALTER, ADDEND OR REMOVE THE CONTENTS OF THIS REPORT IN FUTURE EDITIONS
BOTH IN PART OR IN ITS ENTIRETY.
THIS DISCLAIMER IS MADE WITH RESPECT TO THE DOCUMENT AS WELL AS THE
ASSOCIATED DATA.
CONFIDENTIALITY NOTICE:
THIS WORK HAS BEEN PREPARED FOR THE SOLE USE OF ENHANCED OIL RECOVERY
INSTITUTE.
THIS REPORT CONTAINS INFORMATION BELONGING TO THE AUTHORS AND THE
ENHANCED OIL RECOVERY INSTITUTE WHICH MAY BE PRIVILEGED, CONFIDENTIAL
AND/OR PROTECTED FROM DISCLOSURE. THIS REPORT IS INTENDED ONLY FOR THE
USE OF THE INDIVIDUALS OR ENTITIES NAMED ABOVE, WITH WHOM A
CONFIDENTIALITY AGREEMENT OR NON-DISCLOSURE AGREEMENT HAS BEEN
FINALIZED. IF YOU ARE NOT THE INTENDED RECIPIENT, YOU ARE HEREBY NOTIFIED
THAT ANY USE, DISSEMINATION, DISTRIBUTION OR COPYING OF THIS REPORT IS
STRICTLY PROHIBITED.

Technical Report: Evaluation of Low Salinity Injection for the Minnelusa
Formation, Powder River Basin, Wyoming.
i
Table of Contents
Executive Summary i
Introduction 1
Low Salinity Background 2
Minnelusa Geology and Production 2
Field Data 5
Water Chemistry 5
Production Data 6
Preliminary Evaluation 9
Controls on Recovery 12
Further Evaluation of Field Data 13
Recovery Factor-Independent Analysis 16
Laboratory Studies 18
Experimental Procedure 18
Brine, Oil and Rock Properties 20
Brines 20
Cores 20
Crude Oils 22
Single Phase Experiment 22
Two-Phase Experiments – Secondary Mode 23
Two-Phase Experiments – Tertiary Mode 25
Summary of Experiments 26
Geochemical Modeling 27
Procedures 27
Model Calibration 27
History Matching the model 29
Field Scale Modeling 30
Discussion 31
References 34
Tables
Table 1. List of fields used in this study with accompanying data. 10
Table 2. Average value for recovery factor for Minnelusa Fields. 12
Table 3. Average value for recovery factor for Minnelusa Fields. 18
Table 4. Brine composition. 20
Table 5. Core properties. 20
Table 6. Crude oil properties. 22
Table 7. Summary of experimental results. 26
Table 8. Parameters used for calibrated model from experiment #25. 27

Technical Report: Evaluation of Low Salinity Injection for the Minnelusa
Formation, Powder River Basin, Wyoming.
ii
Figures
Figure 1: Left figure shows the stratigraphic relationships of Pennsylvannian-
Permian reservoir rocks in Wyoming, from Markert and Al-Shaieb (1984). Right
figure shows a typical Minnelusa well log with mineralogy from James (1989). 4
Figure 2: Typical production curve for a Minnelusa field showing recovery factor
and oil cut versus pore volumes (of produced fluid). Most oil production takes
place over 0.4 pore volumes. 4
Figure 3: Map of locations of selected Minnelusa oil fields with salinity contours
in color. Map was used to estimate salinity for those fields lacking water
chemistry analyses (See Table 1). Cartography by B. Reyes. 6
Figure 4: Upper histogram shows the bimodal distribution of recovery factor for
64 Minnelusa fields, while lower histogram shows the distribution for recovery
factor for fields with values greater than 30%. 7
Figure 5: Histogram of the recovery factors for fields with polymer injection and
fields with waterflooding only for fields with greater than 30% recovery. 8
Figure 6: Cumulative oil production curves for 37 Minnelusa Fields versus pore
volumes of produced fluids (oil+water). Pore volumes calculated using oil and
water production. Cool colors are waterfloods with polymer application and
warm colors are waterfloods without polymer. 9
Figure 7: Plots of API gravity, initial oil saturation, OOIP and net pay for
Minnelusa fields with different symbols for fields with polymer injection and
fields with only normal waterflooding.. 13
Figure 8: Salinity ratio versus recovery factor for 52 Minnelusa fields. Dilution
factor of 1 is for fields with no dilution (injection of formation water), shaded area
highlights fields with dilution factors equal or less than 0.1 (10-fold dilution). 14
Figure 9: Oil production versus pore volume for Minnelusa Fields. Cool colors
are saline or mixed waterfloods and warm colors are low-salinity waterfloods for
only cases with 10-fold dilution factors. Shaded area encompasses range of
waterflood recovery factors. 15
Figure 10: Typical curves of normalized cum. oil production versus oil cut (%). 16
Figure 11: XRD spectra of whole rock Minnelusa sample from core material
showing the presence of quartz, anhydrite and dolomite. 21
Figure 12: XRD spectra of clay separate fraction from the Minnelusa core sample
showing the clay is composed of illite. 21
Figure 13: Pressure drop, conductivity and the pH variation during a single phase
experiment, secondary mode experiment (core directly flooded with the low-
salinity brine) with core A. 23
Figure 14: Oil recovery, pressure drop, conductivity and the pH variation during
two phase secondary mode experiment (core directly flooded with the low-salinity
brine) with core plug E. 24
Figure 15: Oil recovery, pressure drop, conductivity and the pH variation during
two phase secondary mode experiment (core directly flooded with the low-salinity
brine) with core plug C and Raven Creek oil. 24
Figure 16: Oil recovery, pressure drop, conductivity and the pH variation during
two phase, tertiary mode experiment with core plug D and Gibbs oil. 25
Figure 17: Oil recovery, pressure drop, conductivity and the pH variation during
two phase tertiary mode experiment with core plug B and Raven Creek oil. 25

Technical Report: Evaluation of Low Salinity Injection for the Minnelusa
Formation, Powder River Basin, Wyoming.
iii
Figure 18: Effluent concentrations from experiment #25, single phase, Minnelusa
brine and core plug A. 28
Figure 19: Comparison of predicted (solid line) and measured values for Na, Cl,
Ca and SO4 from the single-phase experimen using Minnelusa brine and rock.. 28
Figure 20: Comparison of predicted (solid line) and measured values for TDS
from the single-phase experimen using Minnelusa brine and rock.. 28
Figure 21: Effluent concentrations during low-salinity brine flood of core plug D
with Gibbs oil. 29
Figure 22: Predicted versus actual TDS for two-phase experiments using
parameters from the calibrated model. Upper line is from experiment tertiary
mode experiment and lower line is for secondary mode experiment. 29
Figure 23: Predicted TDS versus time for low-salinity brine injection over two
years into the North Timber Creek field. Assumptions described in text. 30
Figure 24: Map view of distribution of predicted TDS from low-salinity brine
injection for two years into the North Timber Creek field. Assumptions described
in text. 31

Technical Report: Evaluation of Low Salinity Injection for the Minnelusa
Formation, Powder River Basin, Wyoming.
i
EXECUTIVE SUMMARY
Current oil production in Wyoming is primarily from fields under waterflood. Most
major companies are pursuing options that will change the chemistry of injected water to
improve recovery. These efforts involve a range of modifications that include lowering
overall salinity and modifying inorganic solutes. Improving knowledge of these efforts
and how they can be applied to Wyoming producers adheres to the portion of our
mandate on technology transfer.
This report summarizes the history and evaluates the effectiveness of low-salinity
flooding in the Minnelusa Formation in the Powder River Basin of Wyoming. The
Minnelusa sandstone play constitutes a resource of several hundred fields with
cumulative production of more than 600,000,000 barrels of oil. Currently there are 130
Minnelusa fields that are in active waterflood.
Fifty-five are flooded with low-salinity water, 52 with mixed salinity water and 23 with
formation brine. Recovery factors for 51 fields were compiled and used as the primary
metric to evaluate the effectiveness of low-salinity waterflooding. A second metric used
was the comparison of production curves expressed as field pore volume produced versus
recovery factor. The final metric used was normalized production versus % oil cut,
which is independent of recovery factor. None of the metrics showed any increased
production for the fields that used low-salinity injection compared to fields flooded with
reservoir brine or mixed water.
In the field cases studied, the low-salinity injection water was derived from wells in the
shallow Lance and Fox Hills Formations, which have an average salinity of 2100 ppm,
while the Minnelusa fields had initial formation water salinity ranging from 1134 to
261,000 ppm. Some fields studied did not have sufficient salinity reduction because
injected salinity was very similar to formation water salinity. In other cases where there
was sufficient dilution there was still no increase in oil production. Dilution factor was
expressed as salinity ratio to allow direct comparison of all fields. Regardless of dilution,
there was no apparent trend of increasing recovery with lower salinity injection.
To investigate the lack of increased production expected from low-salinity injection,
laboratory studies using Minnelusa oil, synthetic brine and rock were performed. The
studies showed little or no incremental oil production during low-salinity injection.
Geochemical models of water-rock interaction were constructed to help better understand
the low-salinity process in the Minnelusa Formation. These models were calibrated to
the laboratory results and then used to simulate the field scale. The modeling showed the
mineralogy of the formation will increase the salinity of the injection water by mineral
dissolution, however this increase is not significant enough to hinder dilution. It does not
appear that low-salinity injection will increase the effectiveness of waterflooding for the
Minnelusa formation.

Technical Report: Evaluation of Low Salinity Injection for the Minnelusa
Formation, Powder River Basin, Wyoming.
1
INTRODUCTION
Low Salinity Background
Low-salinity waterflooding has been widely studied during the last decade by various
research groups as one of the most inexpensive methods of enhanced oil recovery (EOR).
The level of investigation into low-salinity waterflooding has sharply increased in the
past three years as more research groups have become involved (Webb et al., 2008,
Alotaibi and Nasr_el_Din, 2009, Austad et al. 2010, Boussour et al. 2009, Cissokho et al.
2009, Kumar et al. 2010, Lager et al. 2008, Patil et al., 2008, Seccombe et al. 2008, Pu et
al. 2010, Rivet et al. 2010, RezaeiDoust et al. 2010). Laboratory studies with synthetic
formation water, reservoir and outcrop rocks and reservoir oil are injected with water
diluted by a factor ranging from 10 to 100-fold compared to formation waters. Many
studies have confirmed that this method can increase the recovery the lab scale by 2-30%
OOIP depending on the brine composition, crude oil composition and rock type used.
However, while both laboratory and field studies have had successful results, there are
examples in which low-salinity flooding does not create additional production (Sharma
and Filoco, 2000, Rivet et al 2010, Skrettingland et al. 2010).
The fundamental principle of low-salinity flooding is based on observations of laboratory
corefloods by Martin (1959) and Bernard (1967). This work was extended and brought
to wider attention by various workers over the last 15 years (Jadhunanadan and Morrow,
1995, Zhou et al., 1995a, Zhou et al., 1995b, Zhou et al., 1995, Tang and Morrow, 1997,
Yildiz et al., 1999, Morrow et al., 1998, Tang and Morrow, 1999a, Tang and Morrow,
1999b, Maas et al. 2001, Robertson et al., 2003, Lohardo et al, 2008, Morrow et al. 2008,
Pu et al., 2008, Kumar et al., 2010, Pu et al., 2010). The initial work centered on the
observation that significantly diluting the salinity of injected water produced incremental
oil after core had reached residual saturation by conventional waterflooding.
The mechanism(s) is still a matter of debate (Austad et al. 2010, Kumar et al., 2010, Lee
et al, 2010, RezaeiDoust et al. 2010, Sorbie, 2010), however, the proposed mechanisms
can be divided into two general classes. The first class is termed „physical‟ and based on
the observations of associated produced fines and the extensive work on the salinity
shock effect in sandstones, where abrupt reduction in salinity triggers release of clays
from grain surfaces with subsequent migration under flow and permeability reduction as
mobile fines plug pore throats (formation damage). Since most of the laboratory tests
were conducted in Berea Sandstone, the well-documented dilution factors required to
produce migration of fines served as the basis of later experimental protocols. The
„physical‟ mechanisms are 1) redirected flow and displacement of additional or by-passed
oil or micro-conformance (Bernard, 1967), and 2) oil associated with displaced fines
creating incremental production (Tang and Morrow, 1997, Pu et al., 2010). The second
class of mechanism is chemical in nature, and involves some variation on mineral
surface-oil interactions. This class is based on observations of incremental oil without
fines production. This includes changes in wettability, IFT, desorption of oil from

Technical Report: Evaluation of Low Salinity Injection for the Minnelusa
Formation, Powder River Basin, Wyoming.
2
mineral surfaces and similar variants (Alotaibi and Nasr-El_Din, 2009, Ligthelm et al.
2009, Rivet et al., 2010, Austad et al., 2010, Lee et al., 2010, Sorbie, 2010).
A limited number of field examples using low-salinity floods have also been reported in
the EOR literature (Webb et al. 2004, McGuire et al. 2005, Robertson, 2007, Seccombe et
al., 2008, Lager et al., 2008, Seccombe et al., 2010, Skrettingland et al., 2010, Vledder et
al., 2010). These field studies of low-salinity water flooding have been confined to single
fields, or several adjacent fields. McGuire et al., (2005) reported that single well
chemical tracer tests performed in Alaska produced favorable results in sandstone
reservoirs with increases between 6 to 12% OOIP. This was expanded to interwell field
experiments in the same interval with low-salinity injection (Lager et al., 2008,
Seccombe et al., 2010). Vledder et al. (2010) reported on successful field scale
application of low-salinity injection based on observations of dual step watercut
development and attributed the effect to changes in wettability. However, Skrettingland
et al. (2010) reported on a series of lab and single well tracer tests in the North Sea that
showed no appreciable increase in recovery with low-salinity injection.
Robinson (2007, 2009) used data from three Minnelusa fields to analyze the recovery at
0.3 pore volumes of injection. He found that the early performance as measured by
recovery factor was related to salinity ratio (ratio of initial to injected salinity) for the
fields studied. He concluded that injection of low-salinity water into Minnelusa fields
slightly increased the recovery factor, but cautioned that his results were tentative due to
limited data on water chemistry and geology. Towler and Griffith (1998) used data
production data from 20 Minnelusa fields of which 19 were flooded with low-salinity
water. They concluded that the fields flooded with low-salinity water had higher
recoveries compared to the single normal waterflood, but cautioned they lacked sufficient
control to perform a meaningful statistical analysis (Towler and Griffith, 1998). Pu et al.
(2010) reported laboratory results for Minnelusa core in which 30-fold dilution of
injected water produced 5.8% OOIP in incremental oil suggesting low-salinity injection
into the Minnelusa fields may provide additional production.
Minnelusa Geology and Production
In Wyoming, the Pennsylvanian-Permian age quartz-rich sandstones of the Minnelusa
Formation have a high degree of geologic similarity between reservoirs. The Minnelusa
production is mostly from numerous small fields (<10MMBO OOIP) that are located in
the northeastern portion of the Powder River Basin. Early data showed the average
recovery factor was 28.4% OOIP under waterflood (Basko and Mulholland, 1976), which
has increased to 53.6% OOIP with continued waterflooding based on 2008 production
data. Many of these fields were flooded with lower salinity water based on low lifting
and conditioning costs (Towler and Griffith, 1998). There was no expectation of
improved production as these fields were waterflooded before low-salinity injection was
recognized as an EOR technique. The Minnelusa formation water has highly variable
salinity, but formation water salinity is generally much higher than the shallower source

Technical Report: Evaluation of Low Salinity Injection for the Minnelusa
Formation, Powder River Basin, Wyoming.
3
of injection water (Lance and Fox Hills) and so offers an opportunity to evaluate the
potential for increased recovery by low-salinity waterflooding relevant to Wyoming.
Figure 1 shows the stratigraphic relationship between the Minnelusa and other important
Wyoming reservoir rocks and the typical reservoir geometry with the major reservoir
interval of the B sand interbedded between low porosity dolomite layers. Mack and
Duvall (1984) reported the average Dykstra-Parson coefficient for 15 Minnelusa fields
was 0.75 indicating a high level of heterogeneity in reservoir properties. The reservoir
caprock is the Opeche shale which forms the stratigraphic trap for these reservoirs
(James, 1989). Primary production is small since there is little gas in Minnelusa
reservoirs. Most oil production occurs in the first 0.4 pore volume of fluid production
after which the oil cut falls rapidly (Figure 2). Most Minnelusa fields currently in
production have water cuts above 95%.
Wyoming Oil and Gas Conservation Commission (WOGCC) records include waterflood
application date and the source formation for the injection water. Additional information
can include formation water chemistry, oil gravity, production histories and initial oil
saturation. The data were analyzed to identify and quantify any additional production
compared to fields flooded with reservoir brine. Fields were provisionally classified as
saline (waterflooded with formation water), mixed (combination of formation and low-
salinity water) and low-salinity (injection water from the Lance or Fox Hills formations).
Based on this classification, 55 fields are low-salinity, 52 mixed salinity and 23 saline. In
order to evaluate the impact of low-salinity waterflooding, we calculated the recovery
factor for fields in which oil and water production, total pore volume and original oil in
place (OOIP) were reported (Towler and Griffith, 1990, Hochanadel et al., 1990, Mack
and Duvall, 1990). Fields with recovery factors greater than 80% were removed from
further analysis as questionable leaving 61 fields with sufficient data. The location of the
fields is shown in Figure 3.

Technical Report: Evaluation of Low Salinity Injection for the Minnelusa
Formation, Powder River Basin, Wyoming.
4
Figure 1. Left figure shows the stratigraphic relationships of Pennsylvannian-Permian
reservoir rocks in Wyoming, from Markert and Al-Shaieb (1984). Right figure shows a
typical Minnelusa well log with mineralogy from James (1989).
Figure 2. Typical production curve for a Minnelusa field showing recovery factor and oil
cut versus pore volumes (of produced fluid). Most oil production takes place over 0.4
pore volumes.
Technical Report: Evaluation of Low Salinity Injection for the Minnelusa
Formation, Powder River Basin, Wyoming.
5
FIELD DATA
Water Chemistry
The USGS and WOGCC databases were queried for the chemistry of Minnelusa, Lance
and Fox Hills Formations water chemistry data (Breit, WOGCC). The samples selected
were either drill stem tests (DST) or produced water for samples that had API well
number and charge balance values of <±10%. Sample temperatures were calculated
based on the perforated interval and the geothermal gradient derived from WOGCC DST
data. When there were multiple samples from a single well, preference was given to
production over DST samples and the earliest (pre-waterflood) production sample over
later production samples. These criteria produced 518 Minnelusa and 95 Lance/Fox Hills
samples from existing fields and wildcat wells. This dataset was reduced to a single
sample per location by choosing the oldest production or DST sample for each API
number. This produced a total of 374 Minnelusa data points that were contoured for
salinity (see Figure 3).
The salinity of Minnelusa formation water ranges from 1134 to 261,982 ppm. The
distribution of salinity is strongly dependent on location with the lower salinity water
found in the northeast portion of the basin and increasing salinity to the southeastern and
deeper portions of the formation. The Minnelusa formation water is primarily composed
of Na and Cl for the higher total dissolved solids (TDS) samples with lower TDS samples
dominated by Ca and SO4. The lower salinity has been attributed to dilution of the
connate saline brine by invasion of meteoric water from the Black Hills to the east. The
other principal control on the water composition is equilibrium with the mineralogy of
the formation. The major minerals are quartz, dolomite and anhydrite and trace amounts
of clay (illite). The most soluble minerals are anhydrite (CaSO4) followed by dolomite
(CaMg(CO3)2).
In contrast, the Lance and Fox Hills Formations, which is the source of the low-salinity
injection water, is composed of Na and HCO3 with much lower TDS, (300 to 6000 ppm)
and variable amounts of Ca, Mg, Cl and SO4. The primary mineral in these formations
are quartz, carbonate cements and small amounts of clay.

Technical Report: Evaluation of Low Salinity Injection for the Minnelusa
Formation, Powder River Basin, Wyoming.
6
Figure 3. Map of locations of selected Minnelusa oil fields with salinity contours in
color. Map was used to estimate salinity for those fields lacking water chemistry
analyses (See Table 1). Cartography by B. Reyes.
Production Data
Hochanadel et al. (1990) compared 32 Minnelusa fields with polymer floods to 24 fields
with only waterflood and found that fields flooded with polymer recovered an additional
7.5% OOIP. This figure agrees with Thyne et al. (2009), who used four additional fields
and used 2008 production data to show polymer floods recovered an additional 8%
OOIP. However, as shown in Figure 4, the distribution of the recovery factors is bimodal
with a number of fields having low recovery (<30%) forming a separate group of 9 fields
(1 polymer and 8 regular waterfloods). Inclusion of the fields with lower recovery
produces an average recovery of 41% OOIP for waterflood only and 49% for fields with
polymer application, biasing prior analyses of the impact of polymer flooding. The
reason for low recovery in some fields is unknown at present, but these low recovery
fields were not included in further analysis since they do not appear to represent “typical”
behavior.

Technical Report: Evaluation of Low Salinity Injection for the Minnelusa
Formation, Powder River Basin, Wyoming.
7
Removing the low recovery fields left 51 fields (listed in Table 1 and shown in Figure 4),
which have a roughly normal distribution of recovery factors. These fields include cases
of low-salinity and regular flooding with and without polymer treatment. Thirty-one of
the 51 fields had polymer injection with relatively short periods of application (up to 1
year). These fields usually had lower API gravity oil and polymer treatments were
designed to produce a more favorable mobility ratio (Surkalo and Pitts, 1986, Hochanadel
et al., 1990, Brady et al., 1998).
Figure 5 shows the distribution of recovery factors for the fields with greater than 30%
recovery divided into fields that experienced a chemical treatment and those that did not.
The data show there is a slightly higher mean value for fields that had chemical injection
(53.4% versus 50.9% OOIP), but the difference is not significant given the standard
deviations for each group.
Figure 4. Upper histogram shows the bimodal distribution of recovery factor for 60
Minnelusa fields, while lower histogram shows the distribution of recovery factor for the
52 fields with recovery values greater than 30%.
2008 Recovery Factor (% OOIP)
Fre
qu
en
cy
706050403020
12
10
8
6
4
2
0
Mean 45.91
StDev 13.18
N 60
2008 Recovery Factor (% OOIP)
Fre
qu
en
cy
7060504030
12
10
8
6
4
2
0
Mean 52.43
StDev 9.939
N 51

Technical Report: Evaluation of Low Salinity Injection for the Minnelusa
Formation, Powder River Basin, Wyoming.
8
Figure 5. Histogram of the recovery factors for 51 fields with polymer injection and
fields with waterflooding only for fields with greater than 30% recovery.
The behavior of oil production expressed as recovery factor versus total fluid production
(as pore volume displaced) was also examined to determine typical patterns and identify
any differences between fields with polymer application and standard waterflood. Using
total produced fluid (water + oil) in terms of pore volumes allows better comparison
between fields by effectively normalizing recovery to field displacement (Towler and
Griffith, 1998). Figure 6 shows the recovery factor versus pore volume for all fields with
complete production histories. The cumulative oil and water production data for 2008
were used (formation volume factor of 1.05 for oil and 1 for produced water) to calculate
pore volume values for each field. Fields that were waterflooded prior to 1974 were not
included since there were no data on early water production making calculation of pore
volumes uncertain.
The 37 Minnelusa fields with complete production histories show differences in the slope
within 0.25 pore volumes. Fields with steeper curves reach larger recovery factors during
continued waterflooding. Most of the oil is produced in the first 0.5 pore volumes with
another 15% between 0.5 and one pore volume. After that point the increase in produced
fluids is small with a fairly flat curve out to as much as 3 pore volumes. The production
curves for this group of fields show no apparent difference between standard waterfloods
and those fields that had application of polymer. Therefore, the two groups of fields
(polymer treated and no-polymer waterfloods) will be combined for purposes of
preliminary analysis.

Technical Report: Evaluation of Low Salinity Injection for the Minnelusa
Formation, Powder River Basin, Wyoming.
9
Figure 6. Recovery factor versus pore volumes of produced fluids (oil+water) for 37
Minnelusa Fields. Cool colors are waterfloods with polymer application and warm colors
are waterfloods without polymer.
Preliminary Evaluation
Preliminary analysis was conducted by comparing the average recovery factors of various
groups of fields (Table 2). The average recovery for all fields is 52.4% OOIP, fields with
low salinity injection is 52.2%, and 52.6% OOIP for fields with saline injection (saline +
mixed classes). The data can be further evaluated by breaking the fields into other
groupings. For instance, the data from 20 fields without polymer treatment show there is
no difference between average recovery factor for fields with low-salinity injection
(50.8%) compared to saline injection (51.4%). The difference in average recovery
factors between fields that had polymer treatment and low salinity injection (54.7%)
compared to fields with polymer and saline injection (52.9%) is also very small. Given
the uncertainty in the calculation of recovery factors (discussed in more detail below),
differences of several percent are not considered significant. It appears that regardless of
what groups of fields are considered there is no significant difference in recovery factors
between fields with low salinity injection and those with saline brine injection.
Technical Report: Evaluation of Low Salinity Injection for the Minnelusa
Formation, Powder River Basin, Wyoming.
10
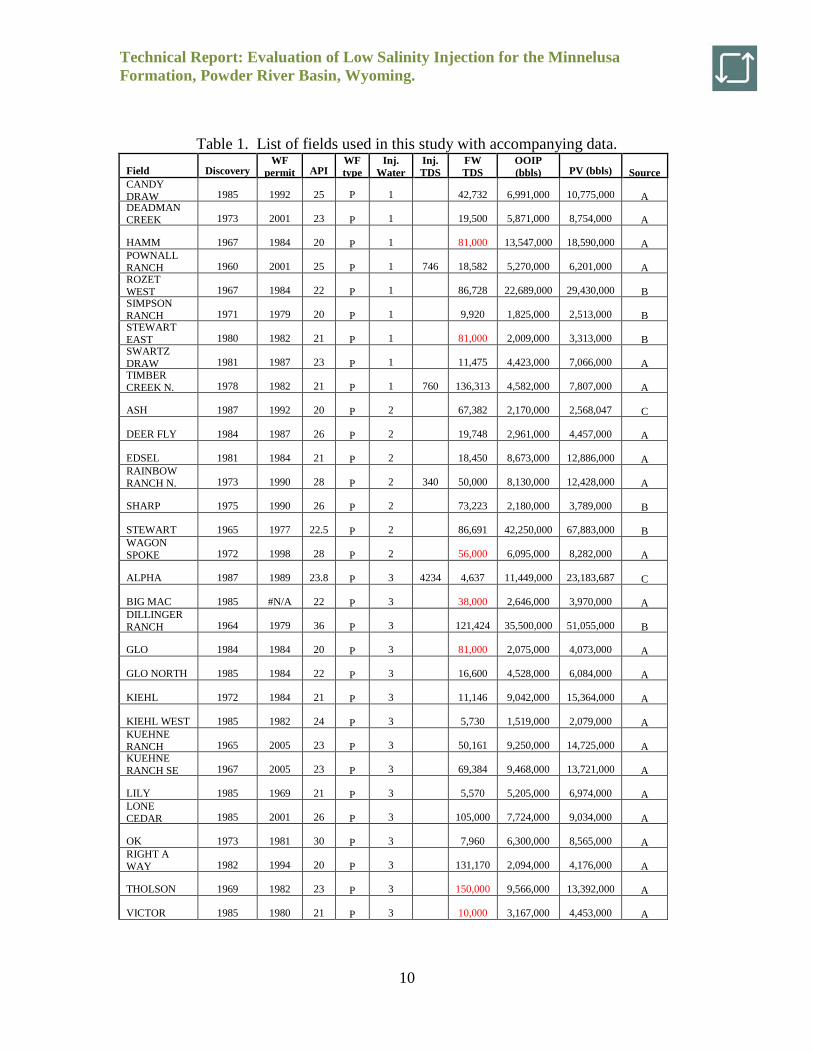
Table 1. List of fields used in this study with accompanying data.
Field Discovery WF
permit API WF
type
Inj.
Water
Inj.
TDS
FW
TDS
OOIP
(bbls) PV (bbls)
Source CANDY
DRAW 1985 1992 25 P 1 42,732 6,991,000 10,775,000
A DEADMAN
CREEK 1973 2001 23
P 1 19,500 5,871,000 8,754,000
A
HAMM 1967 1984 20
P 1 81,000 13,547,000 18,590,000
A POWNALL
RANCH 1960 2001 25
P 1 746 18,582 5,270,000 6,201,000
A ROZET
WEST 1967 1984 22
P 1 86,728 22,689,000 29,430,000
B SIMPSON
RANCH 1971 1979 20
P 1 9,920 1,825,000 2,513,000
B STEWART
EAST 1980 1982 21
P 1 81,000 2,009,000 3,313,000
B SWARTZ
DRAW 1981 1987 23
P 1 11,475 4,423,000 7,066,000
A TIMBER
CREEK N. 1978 1982 21
P 1 760 136,313 4,582,000 7,807,000
A
ASH 1987 1992 20
P 2 67,382 2,170,000 2,568,047
C
DEER FLY 1984 1987 26
P 2 19,748 2,961,000 4,457,000
A
EDSEL 1981 1984 21
P 2 18,450 8,673,000 12,886,000
A RAINBOW
RANCH N. 1973 1990 28
P 2 340 50,000 8,130,000 12,428,000
A
SHARP 1975 1990 26
P 2 73,223 2,180,000 3,789,000
B
STEWART 1965 1977 22.5
P 2 86,691 42,250,000 67,883,000
B WAGON
SPOKE 1972 1998 28
P 2 56,000 6,095,000 8,282,000
A
ALPHA 1987 1989 23.8
P 3 4234 4,637 11,449,000 23,183,687
C
BIG MAC 1985 #N/A 22
P 3 38,000 2,646,000 3,970,000
A DILLINGER
RANCH 1964 1979 36
P 3 121,424 35,500,000 51,055,000
B
GLO 1984 1984 20
P 3 81,000 2,075,000 4,073,000
A
GLO NORTH 1985 1984 22
P 3 16,600 4,528,000 6,084,000
A
KIEHL 1972 1984 21
P 3 11,146 9,042,000 15,364,000
A
KIEHL WEST 1985 1982 24
P 3 5,730 1,519,000 2,079,000
A KUEHNE
RANCH 1965 2005 23
P 3 50,161 9,250,000 14,725,000
A KUEHNE
RANCH SE 1967 2005 23
P 3 69,384 9,468,000 13,721,000
A
LILY 1985 1969 21
P 3 5,570 5,205,000 6,974,000
A LONE
CEDAR 1985 2001 26
P 3 105,000 7,724,000 9,034,000
A
OK 1973 1981 30
P 3 7,960 6,300,000 8,565,000
A RIGHT A
WAY 1982 1994 20
P 3 131,170 2,094,000 4,176,000
A
THOLSON 1969 1982 23
P 3 150,000 9,566,000 13,392,000
A
VICTOR 1985 1980 21
P 3 10,000 3,167,000 4,453,000
A

Technical Report: Evaluation of Low Salinity Injection for the Minnelusa
Formation, Powder River Basin, Wyoming.
11
Table 1. Continued.
Field Discovery WF
permit API WF
type
Inj.
Water
Inj.
TDS
FW
TDS
OOIP
(bbls) PV (bbls)
Source
BASIN NW 1965 1969 35 WF 1 2,957 4,564,000 7,611,000
A DUVALL
RANCH 1964 1971 29 WF 1 154,243 26,900,000 33,460,000
C
GUTHREY 1963 1968 27 WF 1 38,463 12,500,000 19,900,000
A
HALVERSON 1961 1971 24 WF 1 191,593 40,700,000 53,861,000
C HAWK
POINT 1986 1988 39 WF 1 2740 110,000 10,015,000 13,108,639
C
LITTLE
MITCHELL
CREEK 1967 1969 27 WF 1 46,391 21,000,000 29,480,000
B
MAYSDORF 1976 1991 38 WF 1 128,000 8,648,000 14,128,000
B MELLOTT RANCH 1960 2001 28 WF 1 4,892 15,400,000 18,890,000
B
RAVEN CREEK 1956 1992 33 WF 1 131,971 73,790,000 101,382,000
B
REEL 1962 1987 33 WF 1 87,744 20,602,000 33,968,000
B
RENO 1965 1967 37 WF 1 7,123 23,500,000 36,401,000
B ROURKE GAP 1973 1974 30 WF 1 110,000 8,859,000 10,445,000
B
SPRING HOLE 1983 1987 22 WF 1 136,313 2,661,000 3,877,000
A
WALLACE 1966 1972 29 WF 1 23,619 18,400,000 29,460,000
B
WIDGE 1988 1990 40 WF 1 150,000 3,686,000 5,850,794
C INDIAN TREE 1989 1992 20 WF 2 81,000 3,841,700 5,682,357
C
PICKREL RANCH 1965 1972 36 WF 2 195,992 4,510,000 7,393,000
B
PRAIRIE CREEK S. 1986 1987 20 WF 3 10,000 1,858,000 2,728,000
A
ROBINSON RANCH 1958 1971 26 WF 3 11,966 13,861,000 23,913,264
B
P = polymer, WF = waterflood, 1 = low-salinity, 2 = mixed, 3 = saline
Sources, A= Hochanadel et al., B= Mack and Duvall, C = Towler and Griffith
Values in red are based on interpolation from map. Timber Creek North field is listed as
Spring in cited reference.

Technical Report: Evaluation of Low Salinity Injection for the Minnelusa
Formation, Powder River Basin, Wyoming.
12
Table 2. Average value for recovery factor for Minnelusa Fields.
Category %OOIP2008 n
All fields 52.4 51
Low Sal 52.2 25
Saline 52.6 26
All WF (no polymer) 50.9 20
Saline WF 51.4 4
Low sal WF 50.8 16
All polymer 53.4 31
Saline polymer 52.9 22
Low sal polymer 54.7 9
Controls on Recovery
We recognize that using averages of recovery factors for groups of fields is only a
preliminary evaluation since there are many variables may control recovery. The 51
Minnelusa fields have a wide range of oil gravity, OOIP, initial oil saturation and net pay,
all factors that may influence recovery. Figure 7 shows the recovery factor versus the
API gravity, OOIP, initial saturation and net pay for fields with low salinity and saline
waterfloods. The data show that the application of polymer does appear to have some
positive effect on recovery for fields with oil gravity between 20 and 22, but otherwise
there is little effect. The recovery factor does appear slightly higher for smaller fields
(<5MMBO) with polymer application compared to normal waterfloods, however, as with
oil gravity the correlation is weak. Initial oil saturation appears to have no correlation
with recovery, nor does net pay. It does not appear that API oil gravity, OOIP, initial oil
saturation or net pay are correlated with recovery, nor does application of polymer
produce a significantly different response in most fields. Other factors including number
of wells, permeability, porosity, well spacing, pore volumes flooded, duration of
flooding, and depth were also evaluated to see if they influenced the recovery, however
none of these factors appeared to correlate to recovery. The variation in recovery factors
between fields must be due to other factors such as conformance or geological
heterogeneity.

Technical Report: Evaluation of Low Salinity Injection for the Minnelusa
Formation, Powder River Basin, Wyoming.
13
Figure 7. Plots of API gravity, initial oil saturation, OOIP and net pay for Minnelusa
fields with different symbols for fields with polymer injection and fields with only
normal waterflooding.
FURTHER EVALUTION OF FIELD DATA
The laboratory and field work cited in the introduction section examined many oil-brine-
rock systems over a range of dilution factors. While no minimum amount of dilution has
been established for increased oil production, the experimental data to date show
recovery can be increased with as little as 2.5-fold dilution (Pu et al., 2010) and that
increasing dilution increases incremental production (Alotaibi and Nasr-El-Din, 2010,
Loahardjo et al. 2007, Yousef et al., 2010). Robertson (2007) used the salinity ratio (SR),
defined as the ratio of salinity of injected water to salinity of formation water, to evaluate
the effect of low-salinity injection on recovery. He was able to calculate the ratio for
three Minnelusa fields, Moran, West Semlek and North Semlek at 0.3 PV. These values
ranged between 0.08 and 0.16 and plotting recovery factor versus salinity ratio showed a
weak trend of increasing recovery with lower salinity ratio (lower salinity of injection
water to formation water).

Technical Report: Evaluation of Low Salinity Injection for the Minnelusa
Formation, Powder River Basin, Wyoming.
14
Since some Minnelusa fields have fairly fresh formation water, we use the salinity ratio
to quantify the degree of dilution and better evaluate low salinity injection. These results
are plotted in Figure 8 for 51 fields (Table 1). For calculation purposes, injection water
classified as mixtures assumed injection water salinity was a 50:50 mixture of low-
salinity and formation water. In some cases the low-salinity and formation water
chemistry was known and used to more precisely calculate salinity ratio. If the low-
salinity water chemistry was not known, the average TDS of the Lance and Fox Hills
water analyses (2100 mg/L) was used as the injection salinity.
The data include fields that were waterflooded with formation water (salinity ratio =1),
fields waterflooded with a mixture of low-salinity and formation water (salinity ratio
around 0.3-0.7) and fields waterflooded with low-salinity water (salinity ratio between
0.006 and 0.2). This study had many more saline waterfloods to establish a baseline than
earlier work (Towler and Griffith, 1998). The range of recovery factors is almost exactly
the same for all three groups and the data as a whole show no correlation between degree
of dilution and recovery. Since the laboratory and field data show incremental recovery
at salinity ratios as high as 0.4, it appears there are other factors in the Minnelusa
reservoirs that make low-salinity injection ineffective.
Figure 8. Dilution factor (salinity ratio) versus recovery factor for 51 Minnelusa fields.
Dilution factor of 1 is for fields with no dilution (injection of formation water), shaded
area highlights fields with dilution factors equal or less than 0.1 (10-fold dilution).

Technical Report: Evaluation of Low Salinity Injection for the Minnelusa
Formation, Powder River Basin, Wyoming.
15
The low-salinity injection experimental work shows that the effect of low-salinity
injection in tertiary mode is relatively rapid and can produce incremental recovery after
regular waterflooding has reached residual oil saturation. In the Minnelusa fields
injection of low-salinity water was not used as an enhanced oil recovery mechanism, but
instead was employed from the start of waterflooding, or shortly after, making the
identification of incremental oil production impossible. The secondary mode
experiments are more applicable to the field examples. Experimental results in the
secondary mode have shown increased production overall compared to normal salinity
injection or normal salinity plus incremental (Loahardjo et al. 2007, Pu et al., 2010). We
have seen that higher ultimate recovery in Minnelusa fields is apparent in the slope of the
curves when plotting recovery factor versus pore volume.
The oil and water production data from the WOGCC for 2008 were used (formation
volume factor of 1.05 for oil and 1 for produced water) to calculate current pore volume
of produced fluids for each field. Figure 8 shows the production curves for Minnelusa
fields for which most or all of the production history was available and which had at least
10-fold dilution during injection of low-salinity water. We can use both the early slope
and recovery factor at the same pore volume to evaluate the effect of low-salinity
injection. The curves show that the trend of cumulative production with injection
increases as expected, but there is no evident difference based on injection salinity.
Figure 9. Recovery factor versus pore volume for selected Minnelusa Fields with at least
10-fold dilution factors. Cool colors are saline or mixed waterfloods and warm colors are
low-salinity waterfloods. Shaded area encompasses range of waterflood recovery factors.

Technical Report: Evaluation of Low Salinity Injection for the Minnelusa
Formation, Powder River Basin, Wyoming.
16
Recovery Factor-Independent Analysis
The recovery factors are based on the reported OOIP, reservoir pore volume and current
production data. All three values have some uncertainty. The largest uncertainty is in the
reported OOIP and reservoir pore volumes. These values were taken from compilations
of values reported to WOGCC during unitization hearings. The values are based on
material balance or volumetric calculations, which have uncertainties in the calculations.
In addition, these hearings are typically held early in the development of a field, and if
later development expands the extent of the field, may represent lower than actual values.
This reserve growth in discovered fields has been well documented (Schmoker and Klett,
2000). The result is that recovery factors based on OOIP and field pore volumes reported
during unitization hearings may be too high. While this study excluded recovery values
above 80%, the uncertainty still remains. Therefore, we used a metric independent of
recovery factor to evaluate low-salinity injection.
The metric chosen was the normalized cumulative production at the point of water
breakthrough. We calculated this point by plotting normalized production over field life
versus % oil cut. This analysis was restricted to fields were the complete production
history was available (22 fields). Figure 10 shows a typical plot. We chose the break
point (A) that represents water breakthrough in terms of normalized production as a
measure of performance. If low-salinity injection produces more oil by increasing oil
mobility, we anticipate the breakthrough points would have a higher value compared to
fields without dilution.
Technical Report: Evaluation of Low Salinity Injection for the Minnelusa
Formation, Powder River Basin, Wyoming.
17
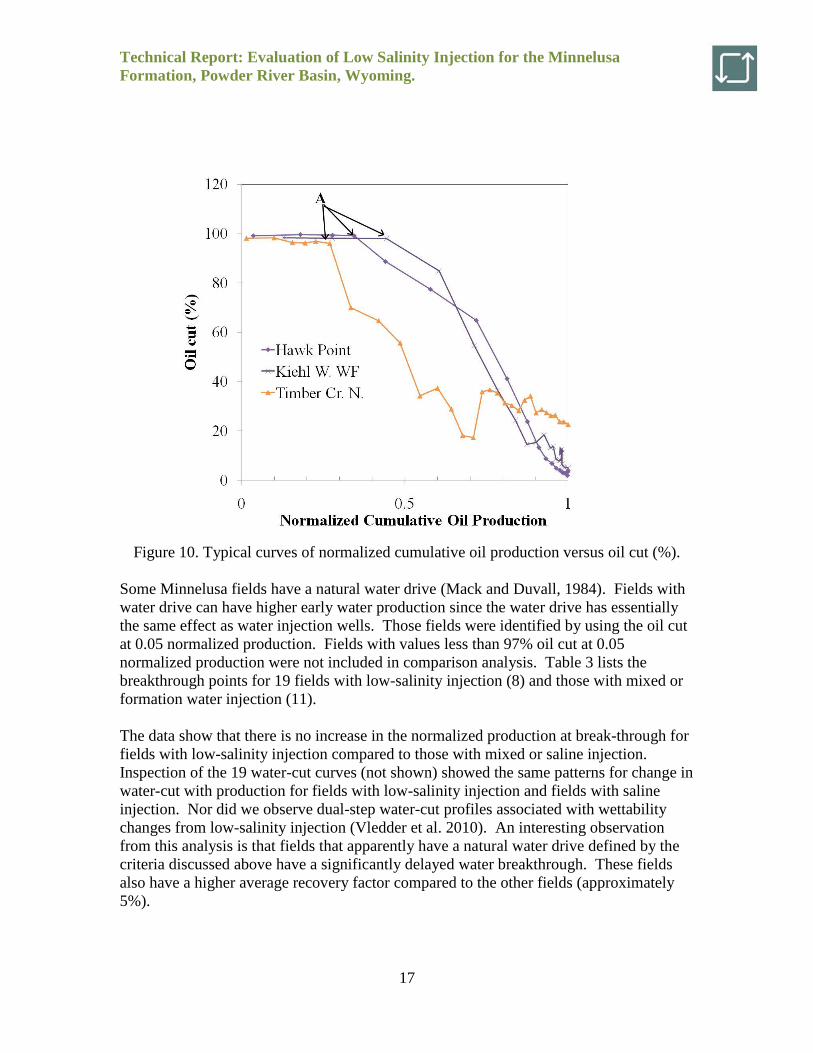
Figure 10. Typical curves of normalized cumulative oil production versus oil cut (%).
Some Minnelusa fields have a natural water drive (Mack and Duvall, 1984). Fields with
water drive can have higher early water production since the water drive has essentially
the same effect as water injection wells. Those fields were identified by using the oil cut
at 0.05 normalized production. Fields with values less than 97% oil cut at 0.05
normalized production were not included in comparison analysis. Table 3 lists the
breakthrough points for 19 fields with low-salinity injection (8) and those with mixed or
formation water injection (11).
The data show that there is no increase in the normalized production at break-through for
fields with low-salinity injection compared to those with mixed or saline injection.
Inspection of the 19 water-cut curves (not shown) showed the same patterns for change in
water-cut with production for fields with low-salinity injection and fields with saline
injection. Nor did we observe dual-step water-cut profiles associated with wettability
changes from low-salinity injection (Vledder et al. 2010). An interesting observation
from this analysis is that fields that apparently have a natural water drive defined by the
criteria discussed above have a significantly delayed water breakthrough. These fields
also have a higher average recovery factor compared to the other fields (approximately
5%).

Technical Report: Evaluation of Low Salinity Injection for the Minnelusa
Formation, Powder River Basin, Wyoming.
18
Table 3. Normalized production after water breakthrough.
Field
Inj. Water
Type
Norm. Cum. at
Breakthrough
Average
Break.
Pt.
Oil Cut
at 0.05
Hawk Point 1 0.44 99.4
Candy Draw 1 0.25 99.9
Simpson Ranch 1 0.25 99.6
Spring Hole 1 0.25 99.8
Moran 1 0.1 97
Widge 1 0.2 97
Timber Cr. N. 1 0.3
98
Swartz Draw 1 0.1 0.24 96
Ash 2 0.5 99.9
Indian Tree 2 0.25 98
Deer Fly 2 0.05 99.7
Big Mac 3 0.2 99.7
Kiehl W 3 0.6 99.9
Lily 3 0.18 99
Lone Cedar 3 0.2 99.7
Prairie Cr. S. 3 0.5 98.7
Right A Way 3 0.1 99.9
Glo N 3 0.6
96
Victor 3 0.3 0.32 99.8
Fields w/ water drive*
Stewart E. 1 0.65 80
Edsel 2 0.5 85
Alpha 3 0.8 0.65 87
*= based on lower early oil cut
LABORATORY STUDIES
We undertook laboratory studies that used Minnelusa rock, oil and synthetic brine in
order to better understand the results from the field data that showed no increase in
production in Minnelusa reservoirs using low-salinity injection water. The experimental
work used Minnelusa core and crude oil from the formation, together with synthetic
formation brine. These experiments injected synthetic formation water into oil-saturated
core. Both single and two phase experiments were performed. The single phase
experiments provide a baseline to evaluate the two phase experiments.
Experimental Procedure
Crude oils from two Minnelusa fields, Raven Creek and Gibbs, were used. The Raven
Creek reservoir bottomhole temperature is about 75 C while Gibbs is about 68 C. The
two oils cover the range of oil gravities for many Minnelusa fields. Crude oil properties
are listed in Table 1. Crude oil was centrifuged at 6000 rpm for 2 hours and filtered to

Technical Report: Evaluation of Low Salinity Injection for the Minnelusa
Formation, Powder River Basin, Wyoming.
19
remove water and sediments and vacuumed for 4 hours to remove the light ends. This
process can increase water wetness in the system benefiting the low-salinity effect (Tang
and Morrow 1997). Crude oil was stored in amber colored bottles in the dark to avoid
photochemical dissociation of the crude oil components. Minnelusa core plugs were
cleaned by soxhelet extraction for a week and dried in an oven at 100°C for 48 hours.
Core plugs were stored in a dry desiccator. Synthetic brine representing average
Minnelusa formation water composition was made from ACS grade chemicals and
distilled water, then vacuumed for two hours to remove dissolved gas before the
experiments.
Both single and two phase experiments were performed. The single phase experiments
provide the baseline to evaluate the two phase experiments. All core plugs were aged
with the synthetic brine (MNB) at room temperature for 7 days. Porosity of the core
plugs was calculated by subtracting dry weight of the core from the weight of the brine
saturated core. Next, the core plug was mounted in a Hassler core holder and synthetic
brine (2-3 PV) was injected to establish a constant pressure drop across the core, then
different flow rates (0.1, 0.2, 0.3 and 0.4 ml/min) were applied and the pressure across
the core used to calculate the brine permeability (Kb). Continuous pressure
measurements were made with Validyne transducer connected to a computer with
Labview software. Next, the cores were flooded with the crude oil (5 PV) to establish the
initial water saturation (Swi). Volume of brine displaced by the oil was used to calculate
the original oil in place (OOIP) and initial water saturation (Swi). Oil permeability was
measured at the Swi by using the same method used to measure the brine permeability.
Core plugs were removed from the core holder and aged in an aging cell for 10 days
(Tang and Morrow 1997). After aging, core plugs were re-mounted in a Hassler core
holder and flooded with fresh crude oil for about 5 PV (core was flooded in the same
direction used to establish Swi.
In the single phase experiment, the core plug was flooded with Minnelusa brine (MNB)
at 0.2 ml/min for more than 20 pore volumes (PV). The core plug was then flooded with
low-salinity brine (1%MNB) for another 10 PV at 0.2 ml/min. In tertiary mode
experiments, the oil-saturated core plug was flooded with MNB at 0.2ml/min to reach
residual saturation and then flooded with low-salinity brine until no more oil was
produced. In the secondary mode experiments, the core plug was flooded directly with
low-salinity brine (0.2ml/min) after preparation. During the experiments, the oil
production was measured at set time intervals. Effluent brine was collected as 8 ml
samples. Conductivity and pH were measured on all samples and chemical analyses were
performed on selected samples.

Technical Report: Evaluation of Low Salinity Injection for the Minnelusa
Formation, Powder River Basin, Wyoming.
20
Brine, Oil and Rock properties
Brines
Brines were made from ACS grade chemicals and distilled water. Brine compositions are
listed in Table 4. Synthetic brines were vacuumed for two hours to remove dissolved gas
before the experiments.
Table 4. Brine composition.
Compound Formation Brine
(g/l)
Low Salinity
Brine (mg/l)
NaCl 29.803 298.03
CaCl2 2.106 21.06
Na2SO4 5.903 59.03
MgSO4 0.841 8.41
NaN3 0.100 1.00
TDS 38753 387.53
Core
Core plugs were drilled from a Donkey Creek Field Minnelusa whole core and dried in
an oven at 100°C for 48 hours. Air permeability was measured (confining pressure, 500
psi) and mineralogic compositions were determined by XRD and thin section. Core plugs
were stored in a dry desiccator. The core plug lithologies are quartz-rich sandstones with
minor amounts of anhydrite and dolomite (see Figure 11). There are very small amounts
of clay, identified in XRD as illite (see Figure 12). Core properties are listed in Table 5.
Table 5. Core properties.
Name Length
(cm)
Diameter
(cm)
Permeability
(mD)
Porosity
(%)
PV (ml)
A 7.695 3.775 1.74 7.44 6.40
B 7.664 3.787 12.02 11.17 9.64
C 7.624 3.779 4.18 9.15 7.82
D 7.667 3.766 43.49 13.85 11.83
E 7.637 3.781 10.51 6.74 5.779

Technical Report: Evaluation of Low Salinity Injection for the Minnelusa
Formation, Powder River Basin, Wyoming.
21
Figure 11. XRD spectra of whole rock Minnelusa sample from core material showing the
presence of quartz, anhydrite and dolomite.
Figure 12. XRD spectra of clay separate fraction from the Minnelusa core sample
showing the clay is composed of illite.

Technical Report: Evaluation of Low Salinity Injection for the Minnelusa
Formation, Powder River Basin, Wyoming.
22
Crude Oils
Raven Creek and Gibbs crude oils were used in all the experiments. The Raven Creek
reservoir bottomhole temperature is about 75 C while Gibbs is about 68 C. The two oils
represent near end-members for the range of oil gravities in Minnelusa fields. Crude oil
properties are listed in Table 6. Crude oil was centrifuged at 6000 rpm for 2 hours to
remove water and sediments. The oil was then filtered and vacuumed for 4 hours to
remove the light ends of the crude oils. This process can increase water wetness in the
system benefiting the low-salinity effect (Tang and Morrow, 1997). Some proposed
chemical mechanisms postulate polar components of the oil binding to mineral surfaces,
so removing non-polar components concentrates these active compounds. Crude oil was
stored in amber colored bottles in the dark to avoid photochemical dissociation of the
crude oil components.
Table 6. Crude oil properties.
Oil Density API Viscosity
(cp)
S.
(%)
A.
(%)
R.
(%)
Asph.
(%)
TBN TAN
Raven
Creek
0.8578 33.5 8.0 80.2 15.8 2.6 1.4 0.92 0.074
Gibbs 0.8834 28.7 11.5 61.5 23.4 3.2 10.4 --- --- S = saturates, A = aromatics, R = resins, Asph. = Asphaltenes, TBN = total base number, TAN = total acid
number
Single Phase Experiment
Single phase experiments were performed to obtain a baseline for the two-phase
experiments. Core was prepared as described in the experimental procedures section and
aged and flooded at 60 C. Core was flooded sequentially with approximately 25 pore
volumes of high salinity brine followed by a similar amount of low-salinity brine to
represent tertiary mode application (Figure 13).
Pressure across the core increased rapidly at the start of the high salinity brine flood and
then decreased during the entire high salinity brine flood. The abrupt pressure change
coincident with change in salinity is an experimental artifact and not related to salinity of
injected water. Low-salinity brine injection resulted in continued pressure decline along
a similar slope compared to the high salinity brine flood. The single phase experiments
show that the initial pH value of about 7.8 changed after injection of low-salinity brine to
about 8. The change in pH and brine salinity, as measured by conductivity, takes place
over about 2 pore volumes. The simultaneous change of pH and brine salinity indicates
that pH is controlled by water-rock reactions. Fines were not observed during high
salinity or low-salinity brine floods.

Technical Report: Evaluation of Low Salinity Injection for the Minnelusa
Formation, Powder River Basin, Wyoming.
23
(a) (b)
Figure 13. Pressure drop, conductivity and the pH variation during a single phase
experiment, secondary mode experiment (core directly flooded with the low-salinity
brine) with core A.
Two-Phase Experiments - Secondary Mode
Gibbs and Raven Creek crude oils were used in these experiments. Cores were aged as
described in the experimental procedure. Cores were flooded with 1%MNB directly for
more than 20 PV at 0.2 cm3/min. Oil recovery, pressure drop, pH and the conductivity of
the effluent samples were measured during the floods. Figures 14, 15 and 16 show oil
recovery, pressure drop across the core, pH and the conductivity variation during the
secondary mode experiment with Gibbs and Raven Creek crude oils. Oil recovery was
observed for a longer time period during the low-salinity brine injection. The pH of the
effluent brine was lower than the pH of the effluent brine from the low-salinity flood in
the tertiary mode experiments. Conductivity of the effluent brine decreased slowly with
the low-salinity brine injection. Again, conductivity of the effluent brine is higher than
the conductivity of low-salinity brine, which indicates dissolution of minerals from the
Minnelusa cores.
The results of the secondary mode experiment with Gibbs oil is shown in Figure 14. The
pressure increase and pH change was fairly rapid. Pressure increased rapidly to almost
90 psi, then fell slowly over the course of the experiment. Oil recovery was also rapid,
over the first 2 pore volumes. The initial pH of 7 rapidly increased to about 7.8, then
remained stable. Conductivity fell rapidly over the 4 pore volumes, but did not stabilize
until about 12 pore volumes. The total production was 61.5% OOIP.

Technical Report: Evaluation of Low Salinity Injection for the Minnelusa
Formation, Powder River Basin, Wyoming.
24
(a) (b)
Figure 14. Oil recovery, pressure drop, conductivity and the pH variation during two
phase secondary mode experiment (core directly flooded with the low-salinity brine) with
core plug E.
The results from the secondary mode experiment with the lighter Raven Creek oil is
shown in Figure 15. The recovery (68.2% OOIP) is also rapid (2 pore volumes),
concurrent with the change in conductivity and pH. The pressure gradient across the core
was very similar with a slow decline that continued after oil production stopped. The pH
behavior was similar to the Gibbs oil experiment, but pH stabilized at a lower value (7.4).
It appears that the inclusion of oil in the experiments changes pH behavior, presumably
because oil has natural acid and base groups that can act as buffers.
(a) (b)
Figure 15. Oil recovery, pressure drop, conductivity and the pH variation during two
phase secondary mode experiment (core directly flooded with the low-salinity brine) with
core plug C and Raven Creek oil.

Technical Report: Evaluation of Low Salinity Injection for the Minnelusa
Formation, Powder River Basin, Wyoming.
25
Two-Phase Experiments - Tertiary Mode
Gibbs and Raven Creek crude oils were used in the tertiary mode experiments. Cores
were prepared as described in the experimental procedures section and aged and flooded
at 60 C. Cores were flooded sequentially with approximately 25 pore volumes of high
salinity brine followed by a similar amount of low-salinity brine to represent tertiary
mode application. Oil recovery, pressure drop, pH and the conductivity of the effluents
were measured during the floods. Chemical analyses of effluent were performed for
experiments and are discussed in the geochemical modeling section.
Figures 16 and 17 show the oil recovery, pressure drop, pH and the conductivity data
measured during the tertiary mode experiments with Gibbs and Raven Creek crude oil,
respectively. During the low-salinity brine injection very little to no oil recovery (0-1.2%
OOIP) was observed. Also the pH increase during the low-salinity brine injection was
small, similar to the pH increase of the single phase experiment. Conductivity of the
brine collected in the low-salinity flood is higher than that of low-salinity brine. This is
assumed to be due to dissolution of minerals from the Minnelusa cores.
(a) (b)
Figure 16. Oil recovery, pressure drop, conductivity and the pH variation during two
phase, tertiary mode experiment with core plug D and Gibbs oil.

Technical Report: Evaluation of Low Salinity Injection for the Minnelusa
Formation, Powder River Basin, Wyoming.
26
(a) (b)
Figure 17. Oil recovery, pressure drop, conductivity and the pH variation during two
phase tertiary mode experiment with core plug B and Raven Creek oil.
Summary of Experiments
Table 7 shows the summary of all the experiments. The Minnelusa core plug
experiments produced recovery between 46 and 68.2% OOIP. The range of recovery
values is not unreasonable given the heterogeneity of this reservoir rock (Hochanadel et
al. 1990). These values are also near the higher end of the field recovery values.
Secondary mode experiments generally produced more total oil (average = 64.0% OOIP)
than the tertiary mode experiments (average = 48% OOP). The incremental recovery
using heavier Minnelusa oil (Gibbs) was low (1.2% OOIP), while no incremental
recovery was observed in the experiment using the lighter Minnelusa oil (Raven Creek).
There was no fines production observed during any of the experiments. Fines migration
has been proposed as a mechanism for the low-salinity effect (Tang and Morrow, 1999a,
Pu et al. 2010), and the low incremental production during low-salinity injection is
reasonable given the paucity of clay in the Minnelusa formation.
Table 7. Summary of experimental results.
Core Type Oil Kb (mD) Swi Ro Rot RT
A SP N/A 0.1981 N/A N/A N/A N/A
B TP/TM RC 2.78 30.50 46.23 0 46.23
C TP/SM RC 1.0218 11.76 68.15 N/A 68.15
D TP/TM GBS 7.9004 28.98 49.40 1.20 50.60
E TP/SM GBS 1.136 30.50 61.54 N/A 61.54
RC= Raven Creek, GBS = Gibbs, SP= single phase, TP = two phase, TM = tertiary mode, SM = secondary
mode, Kb = brine permeability, Swi = initial water saturation, Ro = recovery from regular WF, Rot =
recovery from low-salinity injection, RT = total recovery, all recoveries in % OOIP

Technical Report: Evaluation of Low Salinity Injection for the Minnelusa
Formation, Powder River Basin, Wyoming.
27
GEOCHEMICAL MODELING
The injection of low-salinity water into the Minnelusa formation to improve recovery
depends on achieving sufficient dilution. While the dilution factor required to increase
production has never been well established, and in fact appears to be field specific, one
factor that may restrict dilution in the Minnelusa is the presence of anhydrite in the
reservoir. Anhydrite is a highly soluble salt and injection of low-salinity water is
anticipated to cause dissolution raising the salinity of the injected water and lowering the
dilution factor. In order to evaluate this effect we used geochemical modeling to
determine how much the salinity of the injected water might increase during water-rock
interaction.
Procedures
Geochemical models of water-rock interaction offer some insight into the low-salinity
process McGuire et al., 2005, Jerauld et al., 2006). The software used was Geochemist‟s
Workbench, which has been used previously for modeling low-salinity waterflooding
(McGuire et al. 2005). The model was first used in the 1D reactive-transport
configuration with the kinetic option for the three major minerals present in the
Minnelusa (quartz, anhydrite and dolomite). The model also includes a cation exchange
surface for which Ca and Na are exchangable.
Model Calibration
The model was calibrated by altering the dissolution rates from initial values (Palandri
and Kharaka, 2004) with the amounts of minerals based on thin section petrography. The
calibration was made to match effluent chemistry for the single-phase Minnelusa
waterflood conducted in tertiary mode (Figure 18). The calibrated kinetic values, mineral
abundance and cation exchange capacity are listed in Table 8. Figure 19 shows the
measured concentrations for dissolved Na, Cl, Ca and SO4 together with the predicted
concentrations (solid line). Chloride can be considered essentially conservative in this
brine-oil-rock system. These four solutes comprise 95+% of the solutes in the Minnelusa
brine. Figure 20 shows the predicted and actual TDS (salinity). The agreement is very
good and since the most important parameter is the salinity, this model is accepted.
Table 8. Parameters used for calibrated model from experiment #25.
Minerals
Volume
(%) K
calibrated
Surface
Area
(cm2/g) CEC (eq)
Quartz 82 1.00E-14 400
Anhydrite 4 5.00E-11 150
Dolomite-ord 5 1.00E-10 400
Cation exchange 6.00E-05

Technical Report: Evaluation of Low Salinity Injection for the Minnelusa
Formation, Powder River Basin, Wyoming.
28
Figure 18. Effluent concentrations from experiment #25, single phase, Minnelusa brine
and core plug A.
Figure 19. Comparison of predicted (solid line) and measured values for Na, Cl, Ca and
SO4 from the single-phase experimen using Minnelusa brine and rock.
Figure 20. Comparison of predicted (solid line) and measured values for TDS from the
single-phase experimen using Minnelusa brine and rock.
0 +200 +400 +600 +800 +1000 +1200 +14000
5000
1e4
15000
2e4
25000
3e4
35000
4e4
45000
Time (min)
Dis
solv
ed s
oli
ds
(mg
/kg
), x
= 7
.41 c
m ŸŸŸŸŸŸŸŸŸŸŸŸŸŸŸ
Ÿ
Ÿ
ŸŸŸŸŸŸŸŸ

Technical Report: Evaluation of Low Salinity Injection for the Minnelusa
Formation, Powder River Basin, Wyoming.
29
History Matching the Model
Next the calibrated model was used to history match the data from the two-phase
experiments that had analyses of the effluent water chemistry. Figure 21 shows the
measured concentrations for experiment #28 for the major solutes. Figure 22 shows the
actual and predicted concentration for TDS using the parameters from the calibrated
model. The calibrated model is a good match to experimental data, although there does
appear to be a small amount of dispersion in the tail of concentration after switching the
injected brine to low-salinity not explicitly accounted for by the model due to the
presence of two liquid phases. There are small differences between predicted and actual
Ca and SO4 data (not shown) that could be reduced by changing the anhydrite dissolution
kinetics, but the prediction of TDS is very good and is considered the most important
parameter for prediction.
Figure 21. Effluent concentrations during low-salinity brine flood of core plug D with
Gibbs oil.
Figure 22. Predicted versus actual TDS for two-phase experiments using parameters
from the calibrated model. Upper line is from experiment tertiary mode experiment and
lower line is for secondary mode experiment.
0 5 10 15 20 250
500
1000
1500
2000
2500
3000
3500
pore volume
Som
e fl
uid
com
pon
ents
(m
g/k
g)
Experiment # 28
œœœ œ œ œ œ œ œ œ œ œ œ+++ + + + + + + + + + +
,
,
,
, , , , , , , , , ,
Ca++
Mg++
Na+
0 5 10 15 20 250
500
1000
1500
2000
2500
3000
3500
pore volume
Som
e fl
uid
com
pon
ents
(m
g/k
g)
Experiment # 28
!
!! ! ! ! ! ! ! ! ! !
¢¢
¢¢ ¢ ¢ ¢ ¢ ¢ ¢ ¢ ¢ ¢
ƒƒƒ ƒ ƒ ƒ ƒ ƒ ƒ ƒ ƒ ƒ ƒ
Cl-
SO4--
SiO2(aq)

Technical Report: Evaluation of Low Salinity Injection for the Minnelusa
Formation, Powder River Basin, Wyoming.
30
Field Scale Modeling
The geochemical simulations show that the most important water-rock reaction
influencing water chemistry is the dissolution of anhydrite (CaSO4). The injected water
is usually undersaturated with respect to anhydrite, while almost all the formation is
saturated. Dissolution of anhydrite will tend to increase the salinity of injected water
from the Fox Hills and Lance Formations. To explore the degree of salinity increase a
simulation was run using the example of the North Timber Creek field (Table 1). The 2-
D simulation was made using the calibrated model values for mineral abundance,
reaction rates and cation exchange surfaces. The formation water and injection water
chemistry was taken from the North Timber Creek field. This field had very saline
formation water (136,000 mg/L) and was injected with very fresh water (766 mg/L).
Using the calibrated single phase model parameters, injection of 28,000 gallons of low-
salinity water per day (average value for 1985-91 injection rate) for two years was
simulated. The results are shown in Figures 23 and 24. Figure 23 shows the change in
TDS during the 2 years of injection at the well node. The TDS of the formation water
initially decreases rapidly over the first 75 days of injection, but then as anhydrite
dissolves the salinity rebounds and stabilizes at about 4000 mg/L. It would take many
years of injection to dissolve all the anhydrite in the single well node. Even if that
anhydrite was eventually dissolved, dissolution of all the anhydrite in the field would
require hundreds of years, so the salinity will remain buffered by dissolution over the
operational life of the field.
Figure 23. Predicted TDS versus time for low-salinity brine injection over two years into
the North Timber Creek field. Assumptions described in text.
Figure 24 shows the results of the injection after two years in map view. The model
domain is 1000X1000 meters with a single injection well fully penetrating the sandstone
0 +100 +200 +300 +400 +500 +600 +700 +800
3000
4000
5000
6000
8000
1e4
2e4
3e4
4e4
5e4
6e4
8e4
1e5
Time (days)
Dis
solv
ed s
oli
ds
(mg/k
g),
x =
475 m
, y =
475 m
Technical Report: Evaluation of Low Salinity Injection for the Minnelusa
Formation, Powder River Basin, Wyoming.
31
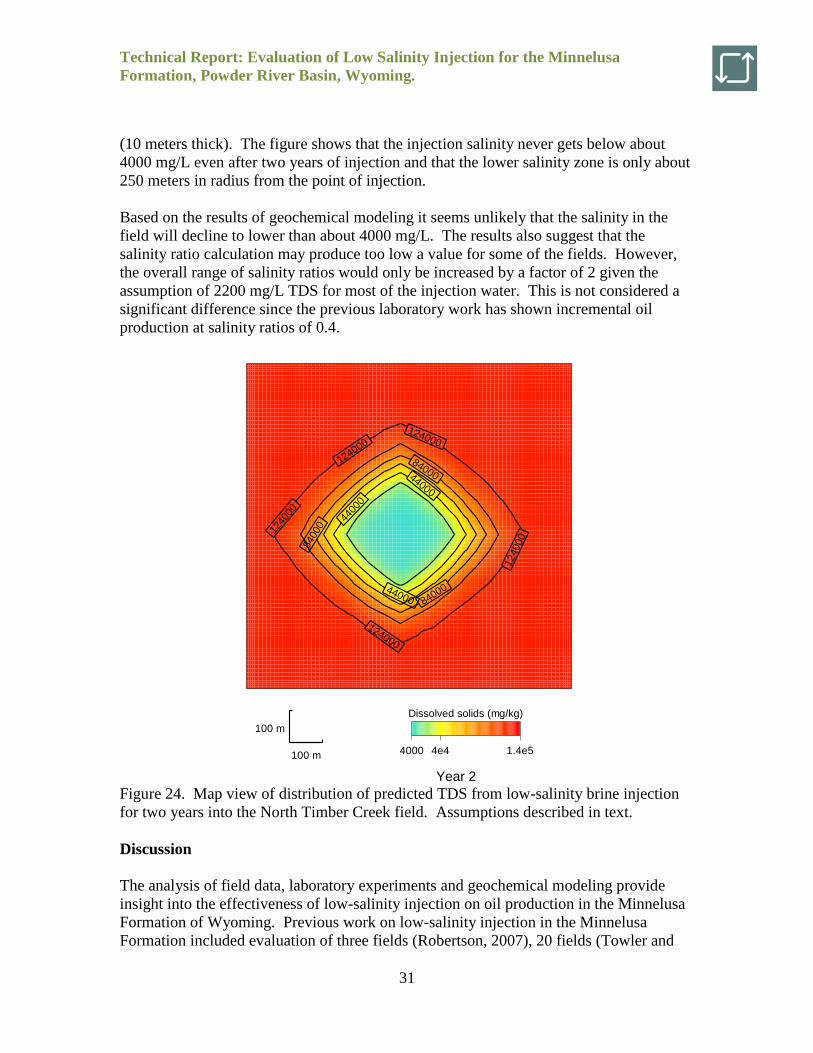
(10 meters thick). The figure shows that the injection salinity never gets below about
4000 mg/L even after two years of injection and that the lower salinity zone is only about
250 meters in radius from the point of injection.
Based on the results of geochemical modeling it seems unlikely that the salinity in the
field will decline to lower than about 4000 mg/L. The results also suggest that the
salinity ratio calculation may produce too low a value for some of the fields. However,
the overall range of salinity ratios would only be increased by a factor of 2 given the
assumption of 2200 mg/L TDS for most of the injection water. This is not considered a
significant difference since the previous laboratory work has shown incremental oil
production at salinity ratios of 0.4.
Figure 24. Map view of distribution of predicted TDS from low-salinity brine injection
for two years into the North Timber Creek field. Assumptions described in text.
Discussion
The analysis of field data, laboratory experiments and geochemical modeling provide
insight into the effectiveness of low-salinity injection on oil production in the Minnelusa
Formation of Wyoming. Previous work on low-salinity injection in the Minnelusa
Formation included evaluation of three fields (Robertson, 2007), 20 fields (Towler and
44000
44000
4400
0
84000
84000
8400
0
124000
124000
124000
1240
00
124000
Dissolved solids (mg/kg)
4000 1.4e54e4100 m
100 m
Co
lor
ma
sk D
isso
lve
d s
olid
s f
rom
6.5
19
mg
/kg
to
7.2
34
mg
/kg
with
Cya
n
Co
lor
ma
p D
isso
lve
d s
olid
s f
rom
40
00
mg
/kg
(T
urq
uo
ise
) to
1.4
e5
mg
/kg
(R
ed
) m
id 4
e4
mg
/kg
(Y
ello
w)
Co
nto
ur
Dis
so
lve
d s
olid
s f
rom
40
00
mg
/kg
to
1.4
e5
mg
/kg
by in
terv
al o
f 2
e4
Year 2

Technical Report: Evaluation of Low Salinity Injection for the Minnelusa
Formation, Powder River Basin, Wyoming.
32
Griffith, 1998) and a single laboratory core flood. This work has added six more core
floods, geochemical modeling constrained by the core flood experiments and an
expanded analysis of recovery factors for 52 fields. We used three separate metrics,
including one that was independent of recovery factors, but found no indication that low-
salinity injection produced more oil during operations in the Minnelusa fields.
The prior quantitative analysis of Minnelusa field data using 3 fields suggested a
maximum increase in recovery of <2% OOIP (Robertson, 2007). The analysis by Towler
and Griffith (1998) used twenty wells, but could not make a statistically valid analysis
because they lacked sufficient controls (saline waterfloods). In our analysis we had
sufficient control to allow meaningful statistical analysis with similar numbers of fields
with high, low and no dilution. We used 2008 recovery factors as the primary metric to
compare different fields. We also used production curves normalized by pore volumes to
compare fields over short and long term. Both analyses showed no discernable increase
in oil recovery with low-salinity injection. Nor was there any difference in water
breakthrough times between the groups of fields. The latter analysis is independent of
recovery factors.
The total recovery of three secondary mode experiments is 64.0% OOIP, while the
tertiary mode experiments produced an average of 48% OOIP. The range in total
recovery in the laboratory experiments was 46.2 to 68.2%, while field results ranged from
32 to 70% with an average of 53%. The results from prior laboratory work on a single
Minnelusa core showed an incremental increase of 5.8% OOIP using Gibbs (heavy) oil
(Pu et al. 2010), after initial production of about 45% OOIP. Our laboratory results
showed initial recovery of about 46-68% OOIP with incremental recovery of 1.2%
(Gibbs oil) in only one of two cores. The variability between experiments may be due to
the lack of homogeneity in the rock samples used. Pu et al. (2010) used core with 14.6%
porosity, 78mD permeability and Swi of 8.2% compared to core D with porosity of
13.8%, permeability of 43.5mD and Swi of 29%. Generally, laboratory floods show
higher recovery for any EOR technique (CO2, chemical, etc.) than the field application.
This was the case on average for the experiments using Minnelusa core.
The high degree of laboratory variability is mirrored by the large range in field
recoveries. This is expected given the high degree of heterogeneity reflected by the
Dykstra-Parsons coefficient for Minnelusa fields that range from 0.6 to 0.8 (Hochanadel
et al., 1990). Given the high degree of variability in recovery factors between fields (30
to 70%) and the anticipated small effect of low-salinity injection, any positive gains in
production may be obscured in the natural variability between fields. These conclusions
are applicable for this brine-oil-rock system only. Other reservoir systems in Wyoming
may benefit from low-salinity injection, but at this time insufficient data are available for
that evaluation.

Technical Report: Evaluation of Low Salinity Injection for the Minnelusa
Formation, Powder River Basin, Wyoming.
33
Conclusions
Analysis of recovery factors for fields with and without low-salinity injection
showed no significant increase in recovery due to low-salinity injection.
Comparison of recovery with pore volume showed no significant difference, as
did comparison of water breakthrough time.
Laboratory experiments showed little incremental recovery for the Minnelusa
rock-oil-brine system.
Geochemical modeling showed that while the dissolution of anhydrite found in
Minnelusa rocks will increase the salinity of injection water, the increase is not
sufficient to explain the lack of response to low-salinity injection.
The lack of increased production from low-salinity injection may be related to the
lack of mobile fines, the inherent properties of the Minnelusa brine-oil-rock
system or not apparent due to the natural variability in this reservoir system.

Technical Report: Evaluation of Low Salinity Injection for the Minnelusa
Formation, Powder River Basin, Wyoming.
34
References
Alotaibi, M.B. and Nasr-El_Din, H.A., 2010, Effect of Brine Salnity on Reservoir Fluids
Interfacial Tension. SPE 121569.
Austad, T., RezaeiDoust, A. and Puntervold, T., 2010, Chemical Mechanism of Low
Salnity Water Flooding in Sandstone Reservoirs. SPE 129767.
Basko, D. and Mulholland, E.E., 1976, Statistical summaries of the Muddy and
Minnelusa reservoirs in the Powder River Basin, Wyoming. Twenty-eighth Annual Field
Conference, Wyoming Geological Association Fieldbook, pp. 273-275.
Boussour, S., Cissokho, M., Cordier, P., Bertin, H. and Hamon, G., 2009, Oil Recovery
by Low Salnity Brine Injection: Laboratory Results on Outcrop and Reservoir Cores.
SPE 124277.
Brady, C.K. and Lee, L.P. and Lee, S.K., 1998, A comparison of forecast and actual
production after a decade of field operations in the Alpha unit polymer-augmented
waterflood. SPE 39614.
Breit, G., USGS, http://energy.cr.usgs.gov/prov/prodwat/prodwat.htm.
Cissokho, M., Boussour, S. Cordier, Ph. Bertin, H. and Hamon, G., 2009, Low Salinity
Oil Recovery on Clayey Sandstone: Experimental Study. International Symposium of the
Society of Core Analysis, SCA2009-05.
Hochanadel, S., Lunceford, M.L. and Farmer, C.W., 1990, A comparison of 31
Minnelusa polymer floods with 24 Minnelusa waterfloods. SPE 20234.
Jadhunandan, P.P. and N.R. Morrow, 1995, Effect of Wettability on Waterflood recovery
for Crude-Oil/Brine/Rock Systems. SPE Reservoir Engineering, SPE 22597, p. 40-46.
James, S.W., 1989, Diagenetic History and Reservoir Characteristics of a Deep
Minnelusa Reservoir, Hawk Point Field, Powder, River Basin, Wyoming, in E.B.
Coalson, S.S. Kaplan, C.W. Keighin, C.A. Oglesby, and J.W. Robinson, eds.,
Petrogenesis and petrophysics of selected sandstone reservoirs of the Rocky Mountain
region: Rocky Mountain Association of Geologists, Denver, CO, pp. 81-96.
Jerauld, G.R., Lin, C.Y., Webb, K.J. and Seccombe, J.C., 2006, Modeling Low-Salinity
Waterflooding. SPE 102239.
Kumar, M., Fogden, A., Morrow, N.R. and Buckley, J.S., 2010, Mechanisms Of
Improved Oil Recovery from Sandstone by Low Salinity Flooding. International
Symposium of the Society of Core Analysis, SCA2010-25.

Technical Report: Evaluation of Low Salinity Injection for the Minnelusa
Formation, Powder River Basin, Wyoming.
35
Lager, A., Webb, K.J., Collins, I.R., and Richmond, D.M. , 2008, LoSal™ Enhanced Oil
Recovery: Evidence of Enhanced Oil Recovery at the Reservoir Scale. SPE 113976.
Lager, A., Webb, K.J., Black, C.J.J., Singleton, M., and Sorbie, K.S., 2008, Low Salinity
Oil Recovery – An Experimental Investigation. Petrophysics 49(1), pp. 28-35.
Lager, A., Webb, K.J., Collins, I.R., and Richmond, D.M., 2010, LoSal™ enhanced oil
recovery: Evidence of enhanced oil recovery at the reservoir scale. SPE 113976.
Loahardjo, N, Xie, X., Yin, P., and Morrow, N.R., 2007, Low salinity waterflooding of a
reservoir rock. SCA2007-29.
Lee, S.Y., Webb, K.J., Collins, I.R., Lager, A., Clarke, S.M., O‟Sullivan, M.O., Routh,
A.F., and Wang, X., 2010, Low Salinity Oil Recovery – Increased Understanding of the
Underlying Mechanisms. SPE 129722.
Ligthelm, D.J., Gronsveld, J. Hofman, J.P., Brussee, N.J., Marcelis, F., and van der
Linde, H.A., 2009, Novel waterflooding strategy by manipulation of injection brine
composition. SPE 119835.
Maas, J. Wit, K. and Morrow, N.R., 2001, Enhanced oil recovery by dilution of injection
brine: Further interpretation of experimental results. Proceedings SCA Annual Mtg.
Markett, J.C. and Al-Shaieb, Z., 1984, Diagenesis and evolution of secondary porosity in
upper Minnelusa sandstones, Powder River basin, Wyoming, in McDonald, D.A. and
Surdam, R.C., eds. Clastic Diagenesis: AAPGG Memoir 37, pp. 367-389.
Mack, J.C. and Duvall, M.L., 1984, Performance and economics of Minnelusa polymer
floods. SPE 12929.
Morrow, N.R. Tang, G-Q., Valat, M., and Xie, X., 1998, Prospects of improved oil
recovery related to wettability and brine composition. J. Petrol. Sci. Eng. 20, p. 267-276.
Patil, S. Dandekar, A.Y., Patil, S.L. and Khataniar, S., 2008, Low salinity brine injection
for EOR on Alaska North Slope (ANS). IPTC 12004.
Pu, H., Xie, X., Yin, P., and Morrow, N.R., 2008, Application of Coalbed Methane Water
to Oil Recovery by Low Salinity Waterflooding. SPE 113410.
Pu, H., Xie, X., Yin, P. and Morrow, N.R., 2010, Low Salinity Waterflooding and
Mineral Dissolution. SPE 134042.

Technical Report: Evaluation of Low Salinity Injection for the Minnelusa
Formation, Powder River Basin, Wyoming.
36
RezaeiDoust, A., Puntervold, T., and Austad, T., 2010, A Discussion of the Low Salinity
EOR Potential for a North Sea Sandstone Field. SPE 134459.
Rivet, S.M., Lake, L.W., and Pope, G.A., 2010, A Coreflood Investigation of Low-
Salinity Enhanced Oil Recovery. SPE 134297.
Robertson, E.P., 2007, Low-Salinity Waterflooding to Improve Oil Recovery - Historical
Field Evidence. SPE 109965.
Robertson, E.P., 2009, Low-Salinity Waterflooding Improves Oil Recovery – Historical
Field Evidence. Journal of Petroleum Technology Jan., pp. 47-49.
Robertson, E.P., 2010, Oil Recovery Increases by Low-Salinity Flooding: Minnelusa and
Green River Formations. SPE 132154.
Schmoker, J.W. and Klett, T.R., 2000, Estimating potential reserve growth of known
(discovered) fields: A component of the USGS world petroleum assessment 2000. USGS
Digital Data Series #60, 37p.
Seccombe, J., Lager, A., Webb, K., Jerauld, G. and Fueg, E., 2008, Improved Waterflood
Recovery: LoSal™ EOR Field Evaluation. SPE 113480.
Sharma, M.M. and Filoco, P.R., 2000, Effect of Brine Salinity and Crude-Oil Properties
on Oil Recovery and Residual Saturations. SPE Journal 5 (3).
Skrettlingland, K., Holt, T., Tweheyo, M. T., and Skjevrak, I., 2010, Snorre low salinity
water injection – core flooding experiments and single well field pilot. SPE 129877.
Sorbie, K., 2010, A Proposed Pore-Scale Mechanism for How Low Salinity
Waterflooding Works. SPE 129833.
Surkalo, H. and Pitts, M.J., 1986, Polyacrylamide vertical conformance process improved
sweep efficiency and oil recovery in the OK Field. SPE 14155.
Tang, G-Q. and Morrow, N.R., 1997, Salinity, Temperature, Oil Composition, and Oil
Recovery by Waterflooding.SPE Reservoir Engineering, November, p. 269-276.
Tang, G-Q. and Morrow, N.R., 1999a, Influence of brine composition and fines
migration on crude oil/brine/rock interactions and oil recovery. J. Petrol. Sci. Eng. 24,
p.99-111.
Tang, G-Q. and Morrow, N.R., 1999b, Oil Recovery by Waterflooding and Imbibition -
Invading Brine Cation Valency and Salinity.Society of Core Analysts, SCA9911.

Technical Report: Evaluation of Low Salinity Injection for the Minnelusa
Formation, Powder River Basin, Wyoming.
37
Thyne, G.D., Alvarado, V. and Murrell, G., 2009, Evaluation of Chemical Flooding in
the Minnelusa Formation, Powder River Basin, Wyoming, AAPG National Meeting,
Denver, Colorado, Abstracts, p.60.
Towler, B.F. and Griffith, D. B., 1999, Comparison of 20 Minnelusa Waterfloods in the
Powder River Basin. SPE 55683.
Vledder, P., Fonseca, J. C., Wells, T. Gonzalez, I., Ligthelm, D., 2010, Low salinity
water flooding: Proof of wettability alteration on a field scale. SPE 129564.
Webb, K., Lager, A., and Black, C., 2008, Comparison of High/Low Salinity Water/Oil
Relative Permeability. International Symposium of the Society of Core Analysis,
SCA2008-39.
WOGCC, 2011. http://wogcc.state.wy.us/
Yildiz, H.O., Valat, M., and Morrow, N.R., 1999, Effect of Brine Composition on
Wettability and Oil Recovery of a Prudhoe Bay Crude Oil. J. Canadian Petrol. Technol.
38 (1).
Yousef, A.A., Al-Saleh, S., Al-Kaabi, A. and Al-Jawfi, M., 2010, Laboratory
investigation of novel oil recovery method for carbonate reservoirs. SPE 137634.
Zhou, X. Morrow, N.R. and Ma, S., 1995a, Interrelationship of Wettability, Initial Water
Saturation, Aging Time and Oil Recovery by Spontaneous Imbibition and Waterflooding.
SPE/DOE 35436.
Zhou, X., Morrow, N.R. and Ma, S., 1995b, Interrelationship of Wettability, Initial Water
Saturation, Aging Time, and Oil Recovery by Spontaneous Imbibition and
Waterflooding. SPE 35436.
Zhou, X., Torsæter, O., Xie, X. and Morrow, N.R., 1995, The Effect of Crude-Oil Aging
Time and Temperature on the Rate of Water Imbibition and Long-Term Recovery by
Imbibition. SPE Formation Eval., December 1995.