
Evaluation of Immunohistochemistry (IHC) Biomarkers in ... · Evaluation of Immunohistochemistry...
7
Evaluation of Immunohistochemistry (IHC) Biomarkers in Breast Cancer Using Digital Image Processing Prasanna G. Shete PVG’s College of Engineering and Technology, Electronics and Telecommunication Engineering dept., Pune 09, India Sinhgad College of Engineering, Savitribai Phule Pune University, Pune India Email: [email protected] Gajanan K. Kharate Matoshri College of Engineering and Research, Nasik, India Email: [email protected] Abstract—The paper discusses an approach involving digital image processing for estimating the extent of cancer in a breast tissue sample. The process aims at providing a reliable, repeatable, fast and cost effective method that could replace the traditional method of manual examination and subsequent estimation. The markers discussed in the paper are the Human Epidermal Growth Factor Receptor (HER2) and the Estrogen Receptor (ER) that give clear indications of the presence of cancer cells in the tissue sample. For ER evaluation, a modified watershed algorithm designed for eliminating errors arising due to over- segmentation in traditional watershed algorithm is proposed to provide comparatively more accurate results. Further, intensity based thresholding is performed for identifying and categorizing the cancerous cells into levels of severity of damage done to cells due to cancer. For HER2 evaluation, the ratio of extent of staining to the total size of image gives an estimate of the extent of cancer cell spread. The implementation of the algorithm is done on the MATLAB tool it is cost effective and user friendly as compared to the equipments available for the detection of breast cancer. Index Terms—cancer cells, estrogen receptor, HSV model based object-background separation, human epidermal growth factor receptor, intensity based cancer cell counting. I. INTRODUCTION Breast cancer cells have receptors on their surface, in their cytoplasm and in the nucleus. Pathologists use external chemical hormones that bind to these receptors [1], and cause visible changes in the cell. The Estrogen Receptor (ER), Progesterone Receptor (PR or PgR) and Human Epidermal Growth Factor Receptor (HER2) are the most reliable receptors which are actively used in cancer cell analysis and cell population estimation. Traditionally, the analysis is done by manually viewing the sample under microscope. As an alternate to this process, computer aided diagnosis involving image Manuscript received February 13, 2015; revised July 12, 2015. processing can be used to provide a reliable result with minimized errors [2]-[4]. The advantages of employing automation for pathological analysis over manual evaluation of cancer cell population are: Decreased time for analysis of pathological samples allowing pathologists to avoid routine scanning and focus on other more complex issues, reduced number of errors the algorithms can be made highly accurate and can avoid false positives or misses giving a highly reliable result, faster documentation of results and higher repeatability due to the fact that medical images in digital format can be stored and reused for later analysis, and finally, minimization of costs – as the entire process is automated, the cost per analysis is reduced. II. TRADITIONAL METHOD IN BREAST TISSUE ANALYSIS The method used currently involves using antigen- antibody reactions due to which cell staining takes place. The cancerous cells are stained in a dark brownish color Fig. 1, while non-cancerous cells develop a bluish shade. Figure 1. Estrogen receptor: stained tissue sample showing cancer positive/P (stained brown) and cancer negative/N (stained blue) cells. A. Receptors and Markers A marker is a predictive indicator that helps to evaluate the response of cancer cells to a particular Journal of Life Sciences and Technologies Vol. 3, No. 2, December 2015 36 © 2015 Journal of Life Sciences and Technologies doi: 10.18178/jolst.3.2.36-42
Transcript of Evaluation of Immunohistochemistry (IHC) Biomarkers in ... · Evaluation of Immunohistochemistry...
Evaluation of Immunohistochemistry (IHC)
Biomarkers in Breast Cancer Using Digital Image
Processing
Prasanna G. Shete PVG’s College of Engineering and Technology, Electronics and Telecommunication Engineering dept., Pune 09, India
Sinhgad College of Engineering, Savitribai Phule Pune University, Pune India
Email: [email protected]
Gajanan K. Kharate Matoshri College of Engineering and Research, Nasik, India
Email: [email protected]
Abstract—The paper discusses an approach involving
digital image processing for estimating the extent of cancer
in a breast tissue sample. The process aims at providing a
reliable, repeatable, fast and cost effective method that
could replace the traditional method of manual examination
and subsequent estimation. The markers discussed in the
paper are the Human Epidermal Growth Factor Receptor
(HER2) and the Estrogen Receptor (ER) that give clear
indications of the presence of cancer cells in the tissue
sample. For ER evaluation, a modified watershed algorithm
designed for eliminating errors arising due to over-
segmentation in traditional watershed algorithm is
proposed to provide comparatively more accurate results.
Further, intensity based thresholding is performed for
identifying and categorizing the cancerous cells into levels of
severity of damage done to cells due to cancer. For HER2
evaluation, the ratio of extent of staining to the total size of
image gives an estimate of the extent of cancer cell spread.
The implementation of the algorithm is done on the
MATLAB tool it is cost effective and user friendly as
compared to the equipments available for the detection of
breast cancer.
Index Terms—cancer cells, estrogen receptor, HSV model
based object-background separation, human epidermal
growth factor receptor, intensity based cancer cell counting.
I. INTRODUCTION
Breast cancer cells have receptors on their surface, in
their cytoplasm and in the nucleus. Pathologists use
external chemical hormones that bind to these receptors
[1], and cause visible changes in the cell. The Estrogen
Receptor (ER), Progesterone Receptor (PR or PgR) and
Human Epidermal Growth Factor Receptor (HER2) are
the most reliable receptors which are actively used in
cancer cell analysis and cell population estimation.
Traditionally, the analysis is done by manually viewing
the sample under microscope. As an alternate to this
process, computer aided diagnosis involving image
Manuscript received February 13, 2015; revised July 12, 2015.
processing can be used to provide a reliable result with
minimized errors [2]-[4]. The advantages of employing
automation for pathological analysis over manual
evaluation of cancer cell population are: Decreased time
for analysis of pathological samples allowing
pathologists to avoid routine scanning and focus on other
more complex issues, reduced number of errors the
algorithms can be made highly accurate and can avoid
false positives or misses giving a highly reliable result,
faster documentation of results and higher repeatability
due to the fact that medical images in digital format can
be stored and reused for later analysis, and finally,
minimization of costs – as the entire process is automated,
the cost per analysis is reduced.
II. TRADITIONAL METHOD IN BREAST TISSUE
ANALYSIS
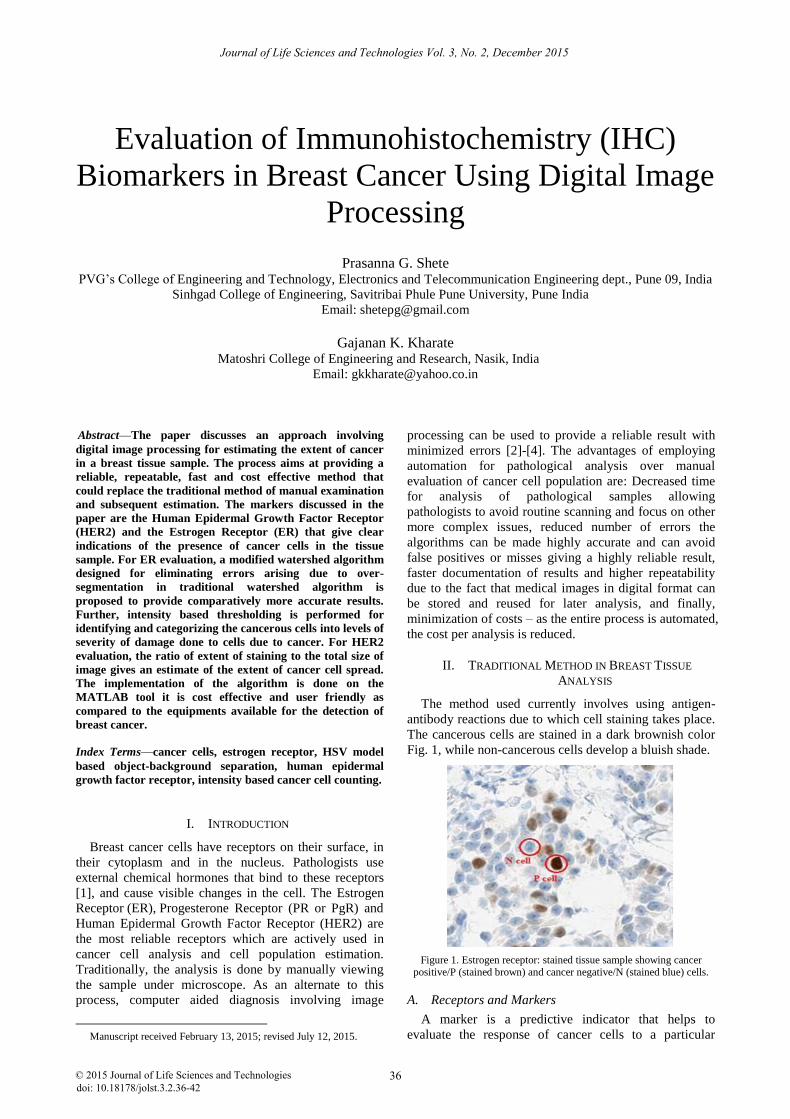
The method used currently involves using antigen-
antibody reactions due to which cell staining takes place.
The cancerous cells are stained in a dark brownish color
Fig. 1, while non-cancerous cells develop a bluish shade.
Figure 1. Estrogen receptor: stained tissue sample showing cancer positive/P (stained brown) and cancer negative/N (stained blue) cells.
A. Receptors and Markers
A marker is a predictive indicator that helps to
evaluate the response of cancer cells to a particular
Journal of Life Sciences and Technologies Vol. 3, No. 2, December 2015
36© 2015 Journal of Life Sciences and Technologiesdoi: 10.18178/jolst.3.2.36-42
treatment. Of the many receptors identified [5]-[15], the
Estrogen Receptor (ER) and Human Epidermal Growth
Factor Receptor (HER2) are of Abbreviations and
Acronyms prime importance. Table I gives a summary of
the types of receptors and their importance in cancer cell
evaluation.
TABLE I. VARIOUS MARKERS AND THEIR VALUE IN PREDICTING BREAST CANCER [15].
Established and used in routine clinical
analysis
Potentially useful for clinical use; require
refinements
Research interest, less likely to be
used clinically
Estrogen Receptor (ER) Epidermal Growth Factor Receptor
(EGFR or HER1) P53
Progesterone Receptor (PgR) Ki-67 (MIB-1) Cyclin E, Cyclin D1, p21, p27
Human Epidermal Growth Factor Receptor
(HER2) Topoisomerase II alpha Bcl2, bax, bcl-x, survivin
B. Evaluation Methods
One of the most popular evaluation methods is the
method has a lot of advantages such as its ready
availability, relative lower costs per analysis and simple
methods for preservation of stained samples [17].
The IHC method involves visual examination of cell
membrane under a microscope. In HER2, evaluation
further involves classification of tissue sample into
categories of {0, 1+, 2+, and 3+} [18] depending on the
severity of cell damage. In ER, scoring is done on the
basis of population of cells and their intensities leading to
a score called Allred score ranging from 0 to 8.
III. LITERATURE SURVEY
A number of approaches have been suggested by
various authors for developing effective algorithms. In
[19], the removal of overlapping redundancies involves
the use of Laplace of Gaussian (LoG) edge detection,
morphological operation, gradient magnitude and marker
controlled watershed algorithm. However, the
segmentation is inaccurate due to the inability of
identifying the borders of the cells.
Also, in [20], the authors made use of the marker
controlled watershed algorithm which gave a fairly high
overall percent correct agreement of 80%. However, the
process of extraction of these binary markers is very
difficult as too many of these markers cause over-
segmentation errors while too few of them cause different
objects to merge [21]. Another technique for marker extraction was proposed
by [22] based on "constrained region labeling" but again
this is a complicated process.
In [23], the authors proposed edge detection as well as
intensity based extraction of objects of interest from
background (also known as region growing). However,
the edge detection method using techniques like sobel
and canny are sensitive to noise while intensity based
algorithms are computationally time consuming as each
pixel's intensity is scanned in the image.
In our algorithm reducing the errors is a higher priority
rather than reducing the computation time and therefore
we have adopted the intensity based region growing
process. HER2 scoring has been proposed in by
membrane staining assessment but involves focusing on a
number of regions of interests and analyzing each region
separately and then combining the results of each region.
IV. IMAGE PROCESSING IMPLEMENTATION FOR ER
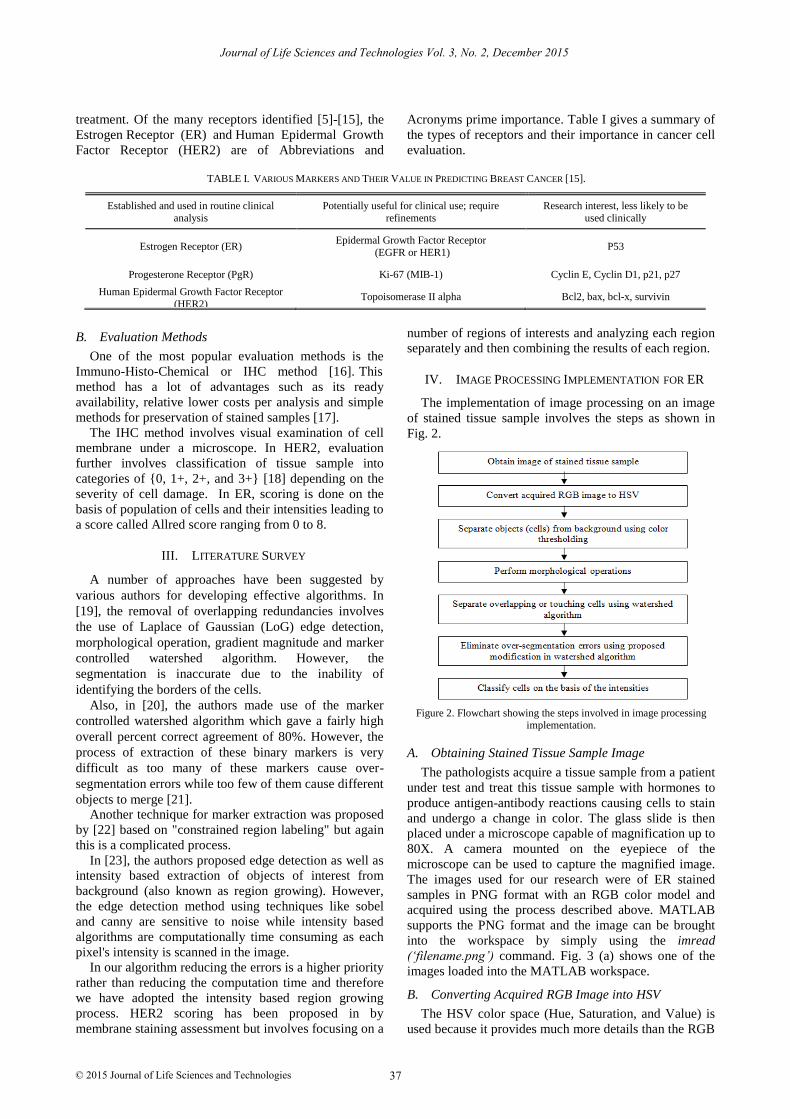
The implementation of image processing on an image
of stained tissue sample involves the steps as shown in
Fig. 2.
Figure 2. Flowchart showing the steps involved in image processing implementation.
A. Obtaining Stained Tissue Sample Image
The pathologists acquire a tissue sample from a patient
under test and treat this tissue sample with hormones to
produce antigen-antibody reactions causing cells to stain
and undergo a change in color. The glass slide is then
placed under a microscope capable of magnification up to
80X. A camera mounted on the eyepiece of the
microscope can be used to capture the magnified image.
The images used for our research were of ER stained
samples in PNG format with an RGB color model and
acquired using the process described above. MATLAB
supports the PNG format and the image can be brought
into the workspace by simply using the imread
(‘filename.png’) command. Fig. 3 (a) shows one of the
images loaded into the MATLAB workspace.
B. Converting Acquired RGB Image into HSV
The HSV color space (Hue, Saturation, and Value) is
used because it provides much more details than the RGB
Journal of Life Sciences and Technologies Vol. 3, No. 2, December 2015
37© 2015 Journal of Life Sciences and Technologies
Immuno-Histo-Chemical or IHC method [16]. This
color space does. The ‘hue’ corresponds to all the colors:
red, yellow, green, cyan, blue and magenta. With change
in the magnitude of ‘saturation’, the variation from
unsaturated (shades of gray) to fully saturated (absence of
white component) occurs. The value component
corresponds to various levels of brightness. Thus the
HSV color model provides additional information
regarding color, shade and brightness as compared to
RGB color model.
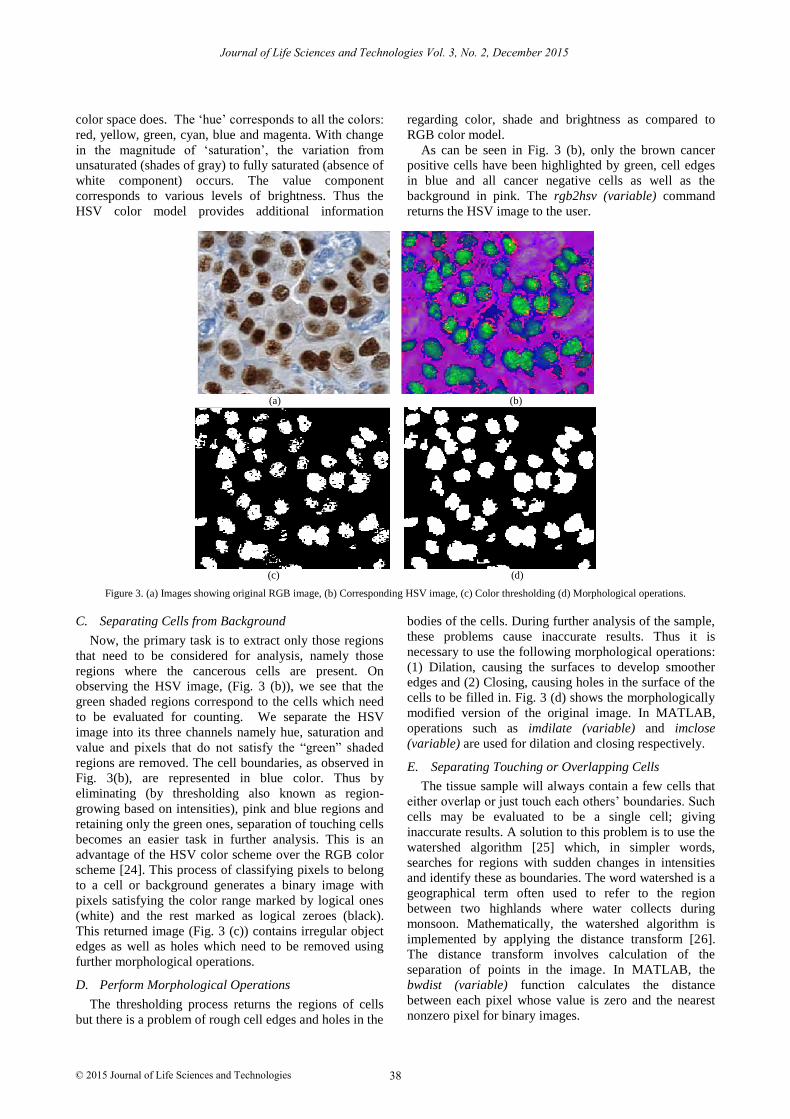
As can be seen in Fig. 3 (b), only the brown cancer
positive cells have been highlighted by green, cell edges
in blue and all cancer negative cells as well as the
background in pink. The rgb2hsv (variable) command
returns the HSV image to the user.
(a) (b)
(c) (d)
Figure 3. (a) Images showing original RGB image, (b) Corresponding HSV image, (c) Color thresholding (d) Morphological operations.
C. Separating Cells from Background
Now, the primary task is to extract only those regions
that need to be considered for analysis, namely those
regions where the cancerous cells are present. On
observing the HSV image, (Fig. 3 (b)), we see that the
green shaded regions correspond to the cells which need
to be evaluated for counting. We separate the HSV
image into its three channels namely hue, saturation and
value and pixels that do not satisfy the “green” shaded
regions are removed. The cell boundaries, as observed in
Fig. 3(b), are represented in blue color. Thus by
eliminating (by thresholding also known as region-
growing based on intensities), pink and blue regions and
retaining only the green ones, separation of touching cells
becomes an easier task in further analysis. This is an
advantage of the HSV color scheme over the RGB color
scheme [24]. This process of classifying pixels to belong
to a cell or background generates a binary image with
pixels satisfying the color range marked by logical ones
(white) and the rest marked as logical zeroes (black).
This returned image (Fig. 3 (c)) contains irregular object
edges as well as holes which need to be removed using
further morphological operations.
D. Perform Morphological Operations
The thresholding process returns the regions of cells
but there is a problem of rough cell edges and holes in the
bodies of the cells. During further analysis of the sample,
these problems cause inaccurate results. Thus it is
necessary to use the following morphological operations:
(1) Dilation, causing the surfaces to develop smoother
edges and (2) Closing, causing holes in the surface of the
cells to be filled in. Fig. 3 (d) shows the morphologically
modified version of the original image. In MATLAB,
operations such as imdilate (variable) and imclose
(variable) are used for dilation and closing respectively.
E. Separating Touching or Overlapping Cells
The tissue sample will always contain a few cells that
either overlap or just touch each others’ boundaries. Such
cells may be evaluated to be a single cell; giving
inaccurate results. A solution to this problem is to use the
watershed algorithm [25] which, in simpler words,
searches for regions with sudden changes in intensities
and identify these as boundaries. The word watershed is a
geographical term often used to refer to the region
between two highlands where water collects during
monsoon. Mathematically, the watershed algorithm is
implemented by applying the distance transform [26].
The distance transform involves calculation of the
separation of points in the image. In MATLAB, the
bwdist (variable) function calculates the distance
between each pixel whose value is zero and the nearest
nonzero pixel for binary images.
Journal of Life Sciences and Technologies Vol. 3, No. 2, December 2015
38© 2015 Journal of Life Sciences and Technologies
F. Eliminating Over-Segmentation Errors
As seen in Fig. 4 (a), there are a few errors due to
over-segmentation. These errors arise when a single cell
is divided into multiple regions due to intensity variations
within the cell. Thus a single cell might be counted more
than once due to these multiple segments. A simple
algorithm was designed by us that calculated the
distances between any two centroids of segments (Fig. 5).
A minimum distance threshold value was calculated
and all calculated distances were compared to this
threshold (Equation (1)). The distances that were below
this threshold value were identified as erroneous
segments and were eliminated. The new centroid was
calculated by averaging the coordinates of the error
centroids.
11
2
1
22
1
2 ni
iiy
iy
ix
ix
id
(1)
where ‘i’ represents the current segment under
consideration and ‘n’ represents the total number of
segments.
(a)
(b)
Figure 4. (a)Images showing segmented image with over-segmentation errors, (b) rectified over-segmentation errors as well as classification
into high intensity (red) and low intensity (blue) cells.
Figure 5. Representative image showing the concept of elimination of
over-segmentation errors
Using (1), the distances were calculated in a number of
iterations till all segments have been considered. Fig. 5
expounds, pictorially, the idea behind this algorithm.
RGB information is then compared to fixed thresholds
corresponding to different intensity levels.
G. Categorizing Cells on the Basis of Their Intensities
Pathologists often require the cells to be classified into
categories on the basis of the intensities. This can be
done by obtaining the RGB information at the center and
around it for each cell followed by thresholding, Fig. 4
(b). In MATLAB, the regionprops (variable) command is
used to obtain coordinates of recognized segments. Then
the impixel (variable, coordinates) is used to obtain RGB
information at that point from the original image. The
RGB information is then compared to fixed thresholds
corresponding to different intensity levels.
V. IMAGE PROCESSING IMPLEMENTATION FOR HER2
HER2 evaluation is generally done by estimating the
spread of stained region and hence, we can evaluate the
sample by training the color pixel classifier to recognize
only the pixels that represent the cell membrane.
Figure 6. Typical HER2 sample with 3+ staining of cell membranes.
This is done by evaluating the image at various points
on the cell membrane and obtaining a threshold for the
color pixel classifier. The resulting image after color
pixel classification is as shown in Fig. 7. The sizes of the
image used are constant and equal to 1024 x 1024 pixels.
The ratio that determines the extent of cancer is given by
Equation (2). For the above image, number of pixels in
stained region is 424062. The area or 40.44 percent. The
scoring is done as indicated in Table II. of the image are
1048576 pixels. The ratio of the two is 0.4044.
For the above image, number of pixels in stained
region is 424062. The area of the image is 1048576
pixels. The ratio of the two is 0.4044 or 40.44 percent.
The scoring is done as indicated in Table II.
Figure 7. Image after color pixel classification. The region in white corresponds to the cell membrane of cancer affected cell.
Journal of Life Sciences and Technologies Vol. 3, No. 2, December 2015
39© 2015 Journal of Life Sciences and Technologies
2pixelsofnumbertotal
pixelsstainedofnumberratio (2)
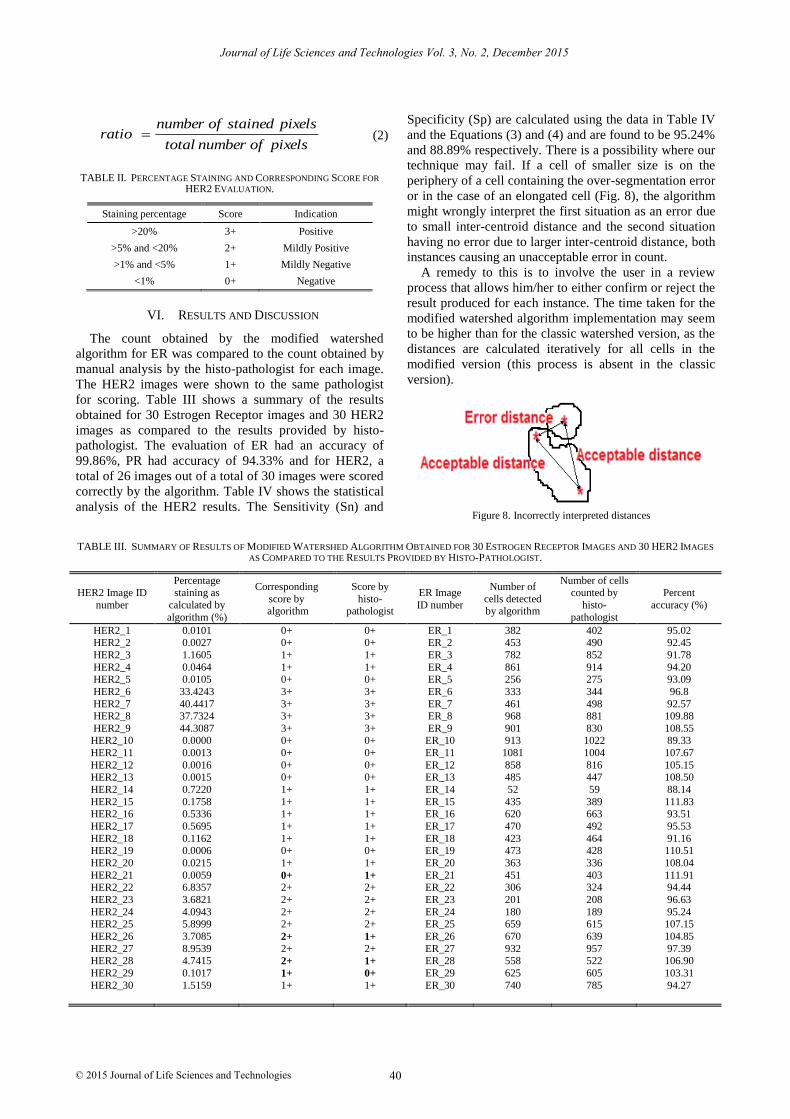
TABLE II. PERCENTAGE STAINING AND CORRESPONDING SCORE FOR
HER2 EVALUATION.
Staining percentage Score Indication
>20% 3+ Positive
>5% and <20% 2+ Mildly Positive
>1% and <5% 1+ Mildly Negative
<1% 0+ Negative
VI. RESULTS AND DISCUSSION
The count obtained by the modified watershed
algorithm for ER was compared to the count obtained by
manual analysis by the histo-pathologist for each image.
The HER2 images were shown to the same pathologist
for scoring. Table III shows a summary of the results
obtained for 30 Estrogen Receptor images and 30 HER2
images as compared to the results provided by histo-
pathologist. The evaluation of ER had an accuracy of
99.86%, PR had accuracy of 94.33% and for HER2, a
total of 26 images out of a total of 30 images were scored
correctly by the algorithm. Table IV shows the statistical
analysis of the HER2 results. The Sensitivity (Sn) and
Specificity (Sp) are calculated using the data in Table IV
and the Equations (3) and (4) and are found to be 95.24%
and 88.89% respectively. There is a possibility where our
technique may fail. If a cell of smaller size is on the
periphery of a cell containing the over-segmentation error
or in the case of an elongated cell (Fig. 8), the algorithm
might wrongly interpret the first situation as an error due
to small inter-centroid distance and the second situation
having no error due to larger inter-centroid distance, both
instances causing an unacceptable error in count.
A remedy to this is to involve the user in a review
process that allows him/her to either confirm or reject the
result produced for each instance. The time taken for the
modified watershed algorithm implementation may seem
to be higher than for the classic watershed version, as the
distances are calculated iteratively for all cells in the
modified version (this process is absent in the classic
version).
Figure 8. Incorrectly interpreted distances
TABLE III. SUMMARY OF RESULTS OF MODIFIED WATERSHED ALGORITHM OBTAINED FOR 30 ESTROGEN RECEPTOR IMAGES AND 30 HER2 IMAGES
AS COMPARED TO THE RESULTS PROVIDED BY HISTO-PATHOLOGIST.
HER2 Image ID
number
Percentage staining as
calculated by
algorithm (%)
Corresponding
score by algorithm
Score by
histo-pathologist
ER Image
ID number
Number of
cells detected by algorithm
Number of cells counted by
histo-
pathologist
Percent
accuracy (%)
HER2_1 0.0101 0+ 0+ ER_1 382 402 95.02 HER2_2 0.0027 0+ 0+ ER_2 453 490 92.45
HER2_3 1.1605 1+ 1+ ER_3 782 852 91.78
HER2_4 0.0464 1+ 1+ ER_4 861 914 94.20 HER2_5 0.0105 0+ 0+ ER_5 256 275 93.09
HER2_6 33.4243 3+ 3+ ER_6 333 344 96.8
HER2_7 40.4417 3+ 3+ ER_7 461 498 92.57 HER2_8 37.7324 3+ 3+ ER_8 968 881 109.88
HER2_9 44.3087 3+ 3+ ER_9 901 830 108.55 HER2_10 0.0000 0+ 0+ ER_10 913 1022 89.33
HER2_11 0.0013 0+ 0+ ER_11 1081 1004 107.67
HER2_12 0.0016 0+ 0+ ER_12 858 816 105.15 HER2_13 0.0015 0+ 0+ ER_13 485 447 108.50
HER2_14 0.7220 1+ 1+ ER_14 52 59 88.14
HER2_15 0.1758 1+ 1+ ER_15 435 389 111.83 HER2_16 0.5336 1+ 1+ ER_16 620 663 93.51
HER2_17 0.5695 1+ 1+ ER_17 470 492 95.53
HER2_18 0.1162 1+ 1+ ER_18 423 464 91.16 HER2_19 0.0006 0+ 0+ ER_19 473 428 110.51
HER2_20 0.0215 1+ 1+ ER_20 363 336 108.04
HER2_21 0.0059 0+ 1+ ER_21 451 403 111.91 HER2_22 6.8357 2+ 2+ ER_22 306 324 94.44
HER2_23 3.6821 2+ 2+ ER_23 201 208 96.63
HER2_24 4.0943 2+ 2+ ER_24 180 189 95.24 HER2_25 5.8999 2+ 2+ ER_25 659 615 107.15
HER2_26 3.7085 2+ 1+ ER_26 670 639 104.85
HER2_27 8.9539 2+ 2+ ER_27 932 957 97.39 HER2_28 4.7415 2+ 1+ ER_28 558 522 106.90
HER2_29 0.1017 1+ 0+ ER_29 625 605 103.31
HER2_30 1.5159 1+ 1+ ER_30 740 785 94.27
Journal of Life Sciences and Technologies Vol. 3, No. 2, December 2015
40© 2015 Journal of Life Sciences and Technologies
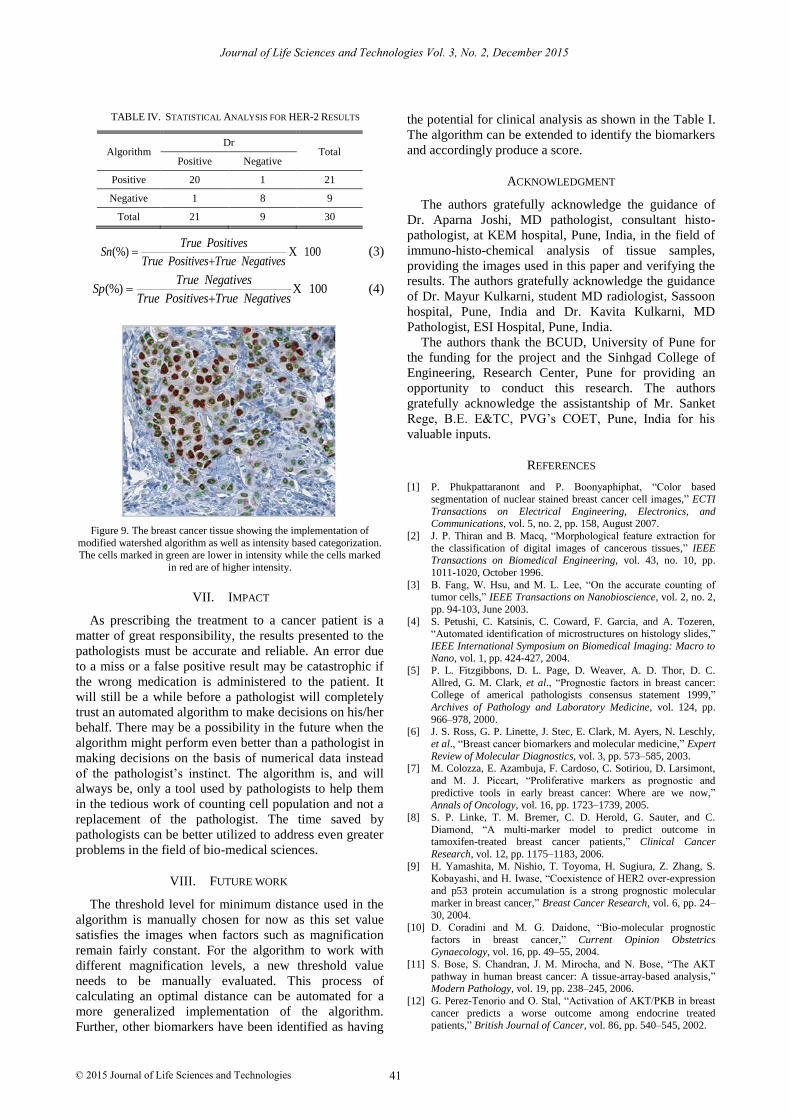
TABLE IV. STATISTICAL ANALYSIS FOR HER-2 RESULTS
Algorithm Dr
Total Positive Negative
Positive 20 1 21
Negative 1 8 9
Total 21 9 30
(%) X 100 3True Positives
SnTrue Positives True Negatives
(3)
(%) X 100 4True Negatives
SpTrue Positives True Negatives
(4)
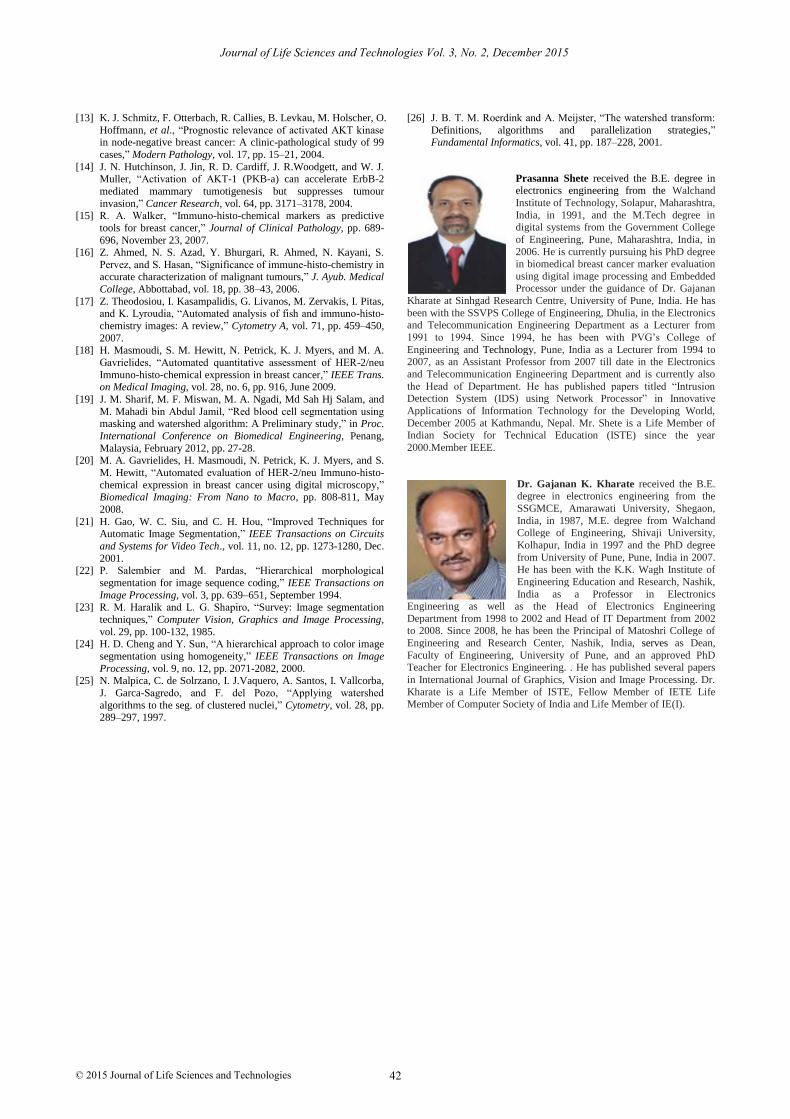
Figure 9. The breast cancer tissue showing the implementation of
modified watershed algorithm as well as intensity based categorization.
The cells marked in green are lower in intensity while the cells marked
in red are of higher intensity.
VII. IMPACT
As prescribing the treatment to a cancer patient is a
matter of great responsibility, the results presented to the
pathologists must be accurate and reliable. An error due
to a miss or a false positive result may be catastrophic if
the wrong medication is administered to the patient. It
will still be a while before a pathologist will completely
trust an automated algorithm to make decisions on his/her
behalf. There may be a possibility in the future when the
algorithm might perform even better than a pathologist in
making decisions on the basis of numerical data instead
of the pathologist’s instinct. The algorithm is, and will
always be, only a tool used by pathologists to help them
in the tedious work of counting cell population and not a
replacement of the pathologist. The time saved by
pathologists can be better utilized to address even greater
problems in the field of bio-medical sciences.
VIII. FUTURE WORK
The threshold level for minimum distance used in the
algorithm is manually chosen for now as this set value
satisfies the images when factors such as magnification
remain fairly constant. For the algorithm to work with
different magnification levels, a new threshold value
needs to be manually evaluated. This process of
calculating an optimal distance can be automated for a
more generalized implementation of the algorithm.
Further, other biomarkers have been identified as having
the potential for clinical analysis as shown in the Table I.
The algorithm can be extended to identify the biomarkers
and accordingly produce a score.
ACKNOWLEDGMENT
The authors gratefully acknowledge the guidance of
Dr. Aparna Joshi, MD pathologist, consultant histo-
pathologist, at KEM hospital, Pune, India, in the field of
immuno-histo-chemical analysis of tissue samples,
providing the images used in this paper and verifying the
results. The authors gratefully acknowledge the guidance
of Dr. Mayur Kulkarni, student MD radiologist, Sassoon
hospital, Pune, India and Dr. Kavita Kulkarni, MD
Pathologist, ESI Hospital, Pune, India.
The authors thank the BCUD, University of Pune for
the funding for the project and the Sinhgad College of
Engineering, Research Center, Pune for providing an
opportunity to conduct this research. The authors
gratefully acknowledge the assistantship of Mr. Sanket
Rege, B.E. E&TC, PVG’s COET, Pune, India for his
valuable inputs.
REFERENCES
[1] P. Phukpattaranont and P. Boonyaphiphat, “Color based
segmentation of nuclear stained breast cancer cell images,” ECTI
Transactions on Electrical Engineering, Electronics, and Communications, vol. 5, no. 2, pp. 158, August 2007.
[2] J. P. Thiran and B. Macq, “Morphological feature extraction for
the classification of digital images of cancerous tissues,” IEEE Transactions on Biomedical Engineering, vol. 43, no. 10, pp.
1011-1020, October 1996.
[3] B. Fang, W. Hsu, and M. L. Lee, “On the accurate counting of tumor cells,” IEEE Transactions on Nanobioscience, vol. 2, no. 2,
pp. 94-103, June 2003.
[4] S. Petushi, C. Katsinis, C. Coward, F. Garcia, and A. Tozeren, “Automated identification of microstructures on histology slides,”
IEEE International Symposium on Biomedical Imaging: Macro to Nano, vol. 1, pp. 424-427, 2004.
[5] P. L. Fitzgibbons, D. L. Page, D. Weaver, A. D. Thor, D. C.
Allred, G. M. Clark, et al., “Prognostic factors in breast cancer: College of americal pathologists consensus statement 1999,”
Archives of Pathology and Laboratory Medicine, vol. 124, pp.
966–978, 2000. [6] J. S. Ross, G. P. Linette, J. Stec, E. Clark, M. Ayers, N. Leschly,
et al., “Breast cancer biomarkers and molecular medicine,” Expert
Review of Molecular Diagnostics, vol. 3, pp. 573–585, 2003.
[7] M. Colozza, E. Azambuja, F. Cardoso, C. Sotiriou, D. Larsimont,
and M. J. Piccart, “Proliferative markers as prognostic and
predictive tools in early breast cancer: Where are we now,” Annals of Oncology, vol. 16, pp. 1723–1739, 2005.
[8] S. P. Linke, T. M. Bremer, C. D. Herold, G. Sauter, and C.
Diamond, “A multi-marker model to predict outcome in tamoxifen-treated breast cancer patients,” Clinical Cancer
Research, vol. 12, pp. 1175–1183, 2006.
[9] H. Yamashita, M. Nishio, T. Toyoma, H. Sugiura, Z. Zhang, S. Kobayashi, and H. Iwase, “Coexistence of HER2 over-expression
and p53 protein accumulation is a strong prognostic molecular
marker in breast cancer,” Breast Cancer Research, vol. 6, pp. 24–30, 2004.
[10] D. Coradini and M. G. Daidone, “Bio-molecular prognostic
factors in breast cancer,” Current Opinion Obstetrics Gynaecology, vol. 16, pp. 49–55, 2004.
[11] S. Bose, S. Chandran, J. M. Mirocha, and N. Bose, “The AKT
pathway in human breast cancer: A tissue-array-based analysis,”
Modern Pathology, vol. 19, pp. 238–245, 2006.
[12] G. Perez-Tenorio and O. Stal, “Activation of AKT/PKB in breast
cancer predicts a worse outcome among endocrine treated patients,” British Journal of Cancer, vol. 86, pp. 540–545, 2002.
Journal of Life Sciences and Technologies Vol. 3, No. 2, December 2015
41© 2015 Journal of Life Sciences and Technologies
[13] K. J. Schmitz, F. Otterbach, R. Callies, B. Levkau, M. Holscher, O.
Hoffmann, et al., “Prognostic relevance of activated AKT kinase in node-negative breast cancer: A clinic-pathological study of 99
cases,” Modern Pathology, vol. 17, pp. 15–21, 2004.
[14] J. N. Hutchinson, J. Jin, R. D. Cardiff, J. R.Woodgett, and W. J. Muller, “Activation of AKT-1 (PKB-a) can accelerate ErbB-2
mediated mammary tumotigenesis but suppresses tumour
invasion,” Cancer Research, vol. 64, pp. 3171–3178, 2004. [15] R. A. Walker, “Immuno-histo-chemical markers as predictive
tools for breast cancer,” Journal of Clinical Pathology, pp. 689-
696, November 23, 2007. [16] Z. Ahmed, N. S. Azad, Y. Bhurgari, R. Ahmed, N. Kayani, S.
Pervez, and S. Hasan, “Significance of immune-histo-chemistry in accurate characterization of malignant tumours,” J. Ayub. Medical
, vol. 18, pp. 38–43, 2006.
[17] Z. Theodosiou, I. Kasampalidis, G. Livanos, M. Zervakis, I. Pitas, and K. Lyroudia, “Automated analysis of fish and immuno-histo-
chemistry images: A review,” Cytometry A, vol. 71, pp. 459–450,
2007. [18] H. Masmoudi, S. M. Hewitt, N. Petrick, K. J. Myers, and M. A.
Gavrielides, “Automated quantitative assessment of HER-2/neu
Immuno-histo-chemical expression in breast cancer,” IEEE Trans. on Medical Imaging, vol. 28, no. 6, pp. 916, June 2009.
[19] J. M. Sharif, M. F. Miswan, M. A. Ngadi, Md Sah Hj Salam, and
M. Mahadi bin Abdul Jamil, “Red blood cell segmentation using masking and watershed algorithm: A Preliminary study,” in Proc.
International Conference on Biomedical Engineering, Penang,
Malaysia, February 2012, pp. 27-28. [20] M. A. Gavrielides, H. Masmoudi, N. Petrick, K. J. Myers, and S.
M. Hewitt, “Automated evaluation of HER-2/neu Immuno-histo-
chemical expression in breast cancer using digital microscopy,” Biomedical Imaging: From Nano to Macro, pp. 808-811, May
2008.
[21] H. Gao, W. C. Siu, and C. H. Hou, “Improved Techniques for Automatic Image Segmentation,” IEEE Transactions on Circuits
and Systems for Video Tech., vol. 11, no. 12, pp. 1273-1280, Dec.
2001. [22] P. Salembier and M. Pardas, “Hierarchical morphological
segmentation for image sequence coding,” IEEE Transactions on
Image Processing, vol. 3, pp. 639–651, September 1994. [23] R. M. Haralik and L. G. Shapiro, “Survey: Image segmentation
techniques,” Computer Vision, Graphics and Image Processing,
vol. 29, pp. 100-132, 1985. [24] H. D. Cheng and Y. Sun, “A hierarchical approach to color image
segmentation using homogeneity,” IEEE Transactions on Image
Processing, vol. 9, no. 12, pp. 2071-2082, 2000. [25] N. Malpica, C. de Solrzano, I. J.Vaquero, A. Santos, I. Vallcorba,
J. Garca-Sagredo, and F. del Pozo, “Applying watershed
algorithms to the seg. of clustered nuclei,” Cytometry, vol. 28, pp. 289–297, 1997.
[26] J. B. T. M. Roerdink and A. Meijster, “The watershed transform:
Definitions, algorithms and parallelization strategies,” Fundamental Informatics, vol. 41, pp. 187–228, 2001.
Prasanna Shete received the B.E. degree in electronics engineering from the Walchand
Institute of Technology, Solapur, Maharashtra,
India, in 1991, and the M.Tech degree in digital systems from the Government College
of Engineering, Pune, Maharashtra, India, in
2006. He is currently pursuing his PhD degree in biomedical breast cancer marker evaluation
using digital image processing and Embedded Processor under the guidance of Dr. Gajanan
Kharate at Sinhgad Research Centre, University of Pune, India. He has
been with the SSVPS College of Engineering, Dhulia, in the Electronics and Telecommunication Engineering Department as a Lecturer from
1991 to 1994. Since 1994, he has been with PVG’s College of
Engineering and Technology, Pune, India as a Lecturer from 1994 to 2007, as an Assistant Professor from 2007 till date in the Electronics
and Telecommunication Engineering Department and is currently also
the Head of Department. He has published papers titled “Intrusion Detection System (IDS) using Network Processor” in Innovative
Applications of Information Technology for the Developing World,
December 2005 at Kathmandu, Nepal. Mr. Shete is a Life Member of Indian Society for Technical Education (ISTE) since the year
2000.Member IEEE.
Dr. Gajanan K. Kharate
received the B.E. degree in electronics engineering from the
SSGMCE, Amarawati University, Shegaon,
India, in 1987, M.E. degree from Walchand College of Engineering, Shivaji University,
Kolhapur, India in 1997 and the PhD degree
from University of Pune, Pune, India in 2007.
He has been with the K.K. Wagh Institute of
Engineering Education and Research, Nashik,
India as a Professor in Electronics Engineering as well as the Head of Electronics Engineering
Department from 1998 to 2002 and Head of IT Department
from 2002 to 2008.
Since 2008, he has been the Principal of Matoshri College of
Engineering and Research Center, Nashik, India, serves as Dean,
Faculty of Engineering, University of Pune, and an approved PhD Teacher for Electronics Engineering.
. He has published several papers
in International Journal of Graphics, Vision and Image Processing. Dr.
Kharate is a Life Member of ISTE, Fellow Member of IETE
Life Member of Computer Society
of India and Life Member of IE(I).
Journal of Life Sciences and Technologies Vol. 3, No. 2, December 2015
42© 2015 Journal of Life Sciences and Technologies
College, Abbottabad


![Anti-PD-L1 antibody [28-8] · For IHC detection kit, Rabbit specific IHC polymer detection kit HRP/DAB (ab209101) is recommended. Immunohistochemistry (Formalin/PFA-fixed paraffin-embedded](https://static.fdocuments.in/doc/165x107/5f5a978f55ad5f6039367e63/anti-pd-l1-antibody-28-8-for-ihc-detection-kit-rabbit-specific-ihc-polymer-detection.jpg)