EVALUATION OF HATCHERY-WILD … 1995...EVALUATION OF HATCHERY-WILD COMPOSITION OF IDAHO SALMON AND...
123
By: Kent Ball, Senior Fishery Research Biologist January 1998 IDFG 98-1 EVALUATION OF HATCHERY-WILD COMPOSITION OF IDAHO SALMON AND STEELHEAD HARVEST October 1, 1994 to December 31, 1995
Transcript of EVALUATION OF HATCHERY-WILD … 1995...EVALUATION OF HATCHERY-WILD COMPOSITION OF IDAHO SALMON AND...

By:
Kent Ball, Senior Fishery Research Biologist
January 1998IDFG 98-1
EVALUATION OF HATCHERY-WILD COMPOSITION OF
IDAHO SALMON AND STEELHEAD HARVEST
October 1, 1994 to December 31, 1995
Volume 109 Article 03

iCONTENTS
TABLE OF CONTENTS
Page
ABSTRACT ...................................................................................................................................................1
INTRODUCTION .........................................................................................................................................2
OBJECTIVES ................................................................................................................................................4
DESCRIPTION OF STUDY AREA .............................................................................................................4
METHODS ....................................................................................................................................................4
Creel Survey ........................................................................................................................................4Interview Schedule ..............................................................................................................................7Data Analysis ......................................................................................................................................8Tributary Straying ...............................................................................................................................9
RESULTS ......................................................................................................................................................9
Creel Survey ........................................................................................................................................9Tributary Straying .............................................................................................................................31
DISCUSSION ..............................................................................................................................................35
Harvest of Sawtooth Hatchery Releases ............................................................................................35Harvest of East Fork Salmon River Releases ....................................................................................35Harvest of Little Salmon River Releases ...........................................................................................37Harvest of Hammer Creek Releases ..................................................................................................40Harvest of Clearwater Fish Hatchery Releases .................................................................................40Off-site Releases ................................................................................................................................40Hatchery Straying ..............................................................................................................................41Tributary Straying .............................................................................................................................42Sources of Error .................................................................................................................................42
RECOMMENDATIONS ...............................................................................................................43
ACKNOWLEDGMENTS ..............................................................................................................44
LITERATURE CITED ..................................................................................................................45
APPENDICES ..............................................................................................................................46

CONTENTS ii
LIST OF TABLES
Page
Table 1. Steelhead season dates, bag limits, and special restrictions for the Clearwater,Salmon, and Snake rivers, 1994-95 ................................................................................................3
Table 2. River location codes for Idaho's anadromous fisheries ................................................................6
Table 3. Steelhead fishery interview data (unexpanded) from lower Snake River (01),September - November 1994 ................................................................................................ 11
Table 4. Steelhead fishery interview data (unexpanded) from lower Clearwater River (03)and North Fork Clearwater River (05), September 1994 - April 1995 ................................ 12
Table 5. Steelhead fishery interview data (unexpanded) from upper Clearwater Riverand Middle Fork Clearwater rivers (04), October 1994 - April 1995 ..................................................13
Table 6. Steelhead fishery interview data (unexpanded) from South Fork ClearwaterRiver (07), October 1994 - April 1995 ................................................................................................14
Table 7. Steelhead fishery interview data (unexpanded) from Salmon River Section 10,October 1994 - February 1995 ................................................................................................15
Table 8. Steelhead fishery interview data (unexpanded) from Salmon River Section 11,October 1994 - March 1995 ................................................................................................ 16
Table 9. Steelhead fishery interview data (unexpanded) from Salmon River Section 12,October 1994 - March 1995 ................................................................................................ 17
Table 10. Steelhead fishery interview data (unexpanded) from Salmon River Section 13,October 1994 - March 1995 ................................................................................................ 18
Table 11. Steelhead fishery interview data (unexpanded) from Salmon River Section 14,October 1994 - March 1995 ................................................................................................ 19
Table 12. Steelhead fishery interview data (unexpanded) from Salmon River Section 15,October 1994 - March 1995 ................................................................................................ 20
Table 13. Steelhead fishery interview data (unexpanded) from Salmon River Section 16,October 1994 - April 1995 ....................................................................................................................21
Table 14. Steelhead fishery interview data (unexpanded) from Salmon River Section 17,October 1994 - April 1995 ....................................................................................................................22

CONTENTS iii
LIST OF TABLES (Cont.)
Page
Table 15. Steelhead fishery interview data (unexpanded) from Salmon River Section 18,March - April 1995 ...........................................................................................................................23
Table 16. Steelhead fishery interview data (unexpanded) from Salmon River Section 19,April 1995 ................................................................................................................................24
Table 17. Steelhead fishery interview data (unexpanded) from Salmon River Section 20,October 1994 - April 1995 ................................................................................................................25
Table 18. Proportion of estimated harvest by river section that was examined for marks,1994-95 ................................................................................................................................ 26
Table 19. Estimated number of hatchery steelhead harvested in the lower Snake,Clearwater, and Salmon rivers during the 1994-95 seasons ............................................................27
Table 20. Summary of 1994-95 harvest estimates and hatchery returns of steelheadproduced by LSRCP hatcheries ................................................................................................28
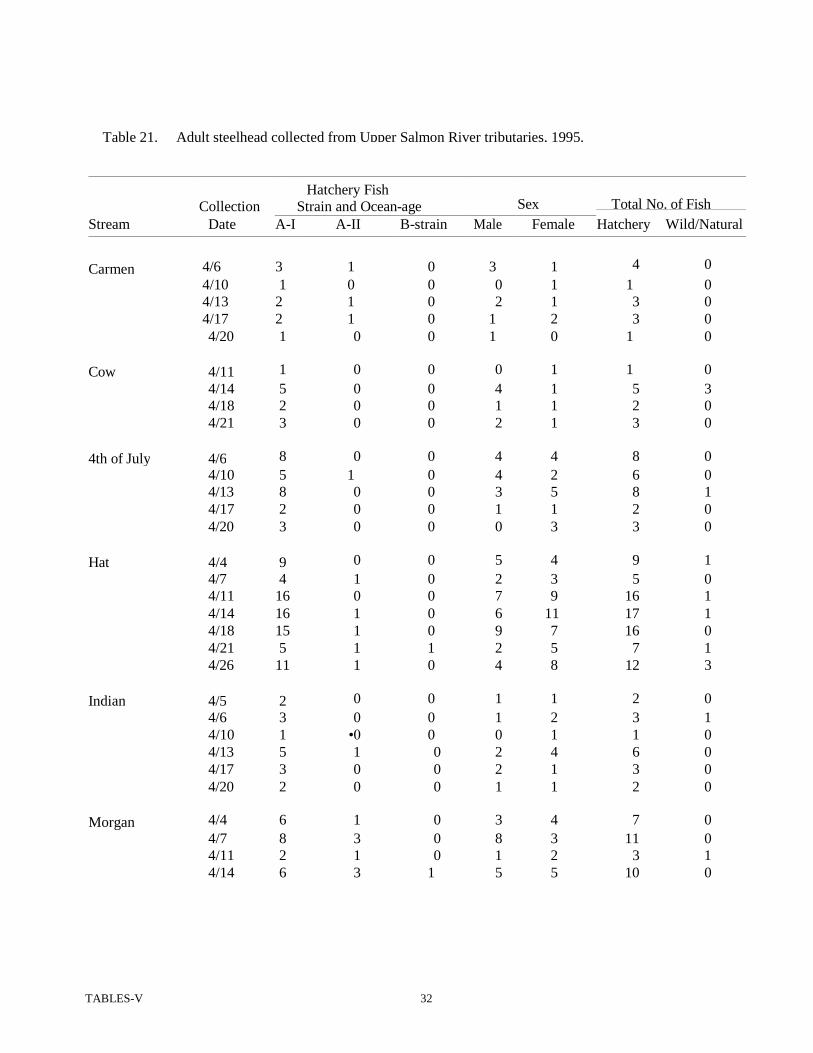
Table 21. Adult steelhead collected from upper Salmon River tributaries, 1995 ................................32
Table 22. Coded wire tag (CWT) recoveries from upper Salmon River tributaries, 1995 . . . 34
Table 23. Difference between the number of steelhead passing McNary Dam that can beaccounted for upriver at Ice Harbor and Priest Rapids dams, 1983-94a ................................................................36
Table 24. Coded wire tag (CWT) recoveries of East Fork Salmon River steelheadreleases - East Fork stock vs Dworshak stock .................................................................................38
Figure 1.
LIST OF FIGURES
Map of steelhead harvest areas in Idaho ..........................................................................................5
Figure 2. Map of upper Salmon River tributaries ............................................................................................10

CONTENTS iv
LIST OF APPENDICES
Page
Appendix A. Total number of steelhead by section and month harvested by residentand nonresident anglers, fall 1994' and spring 1995a ................................................................................................47
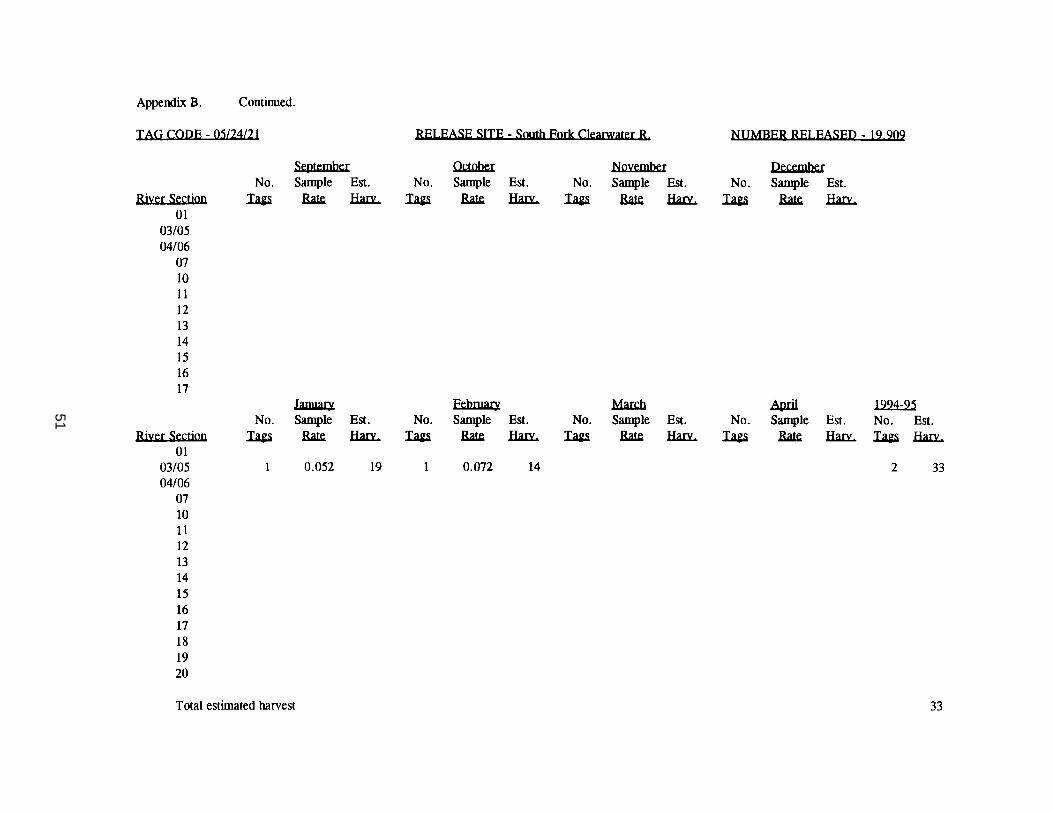
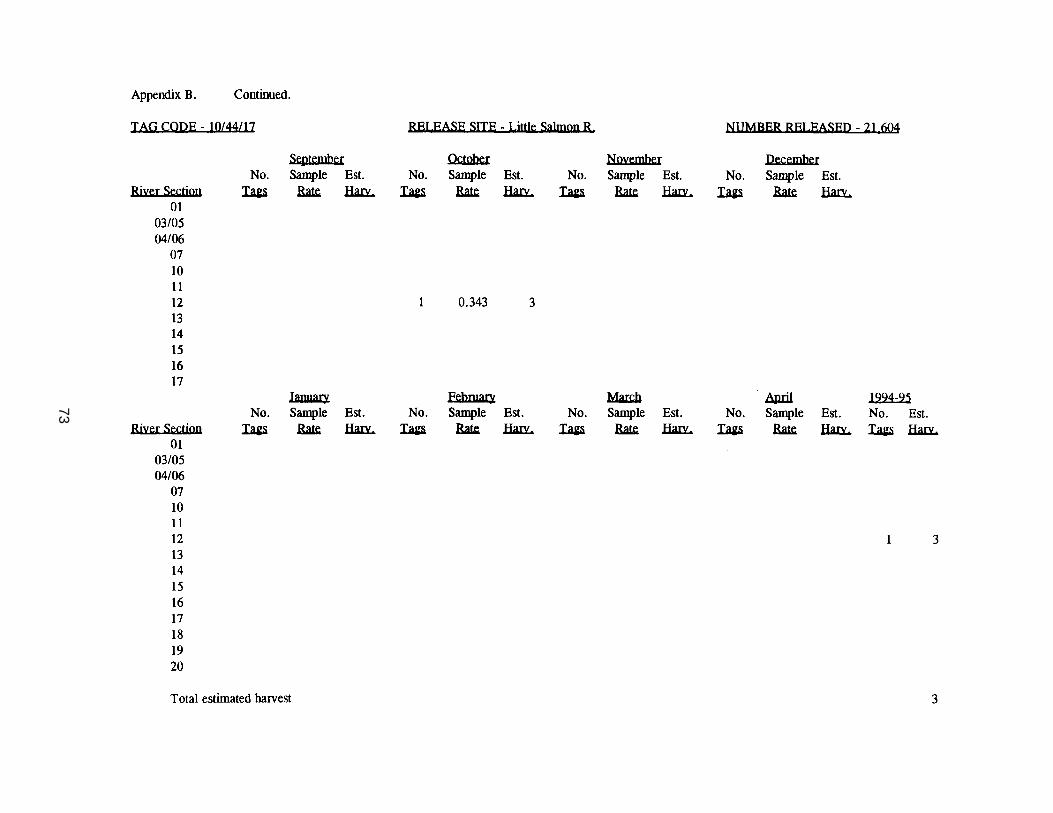
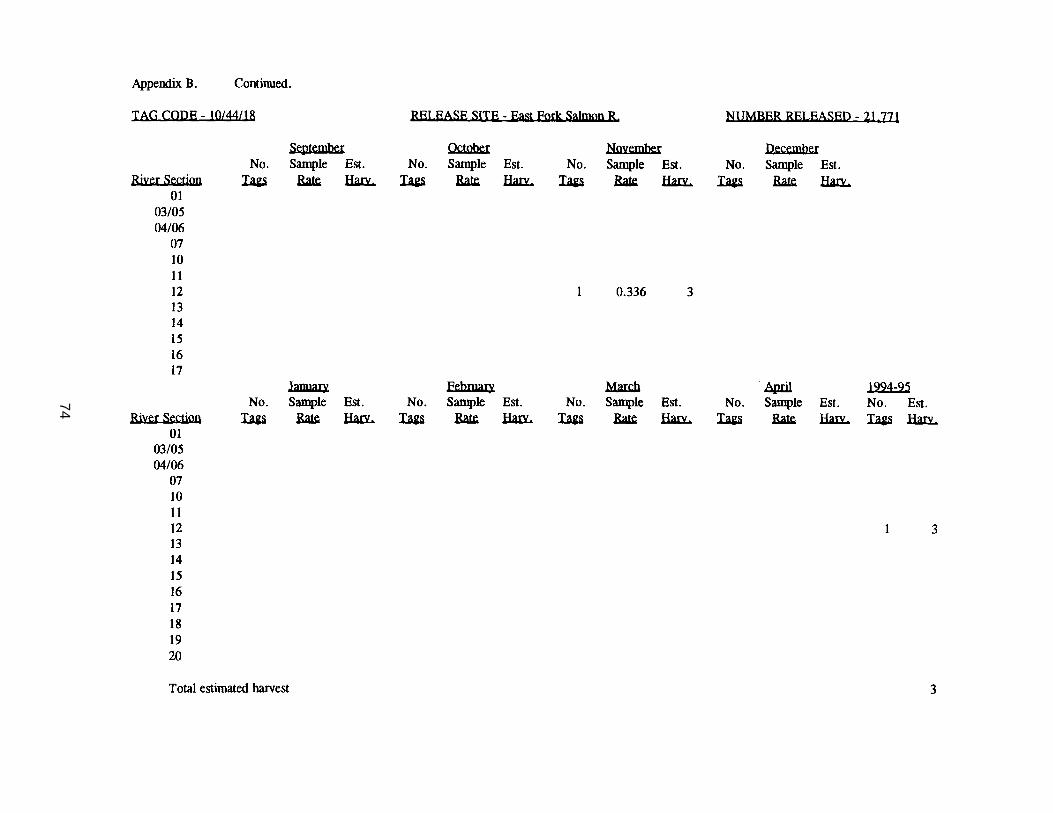
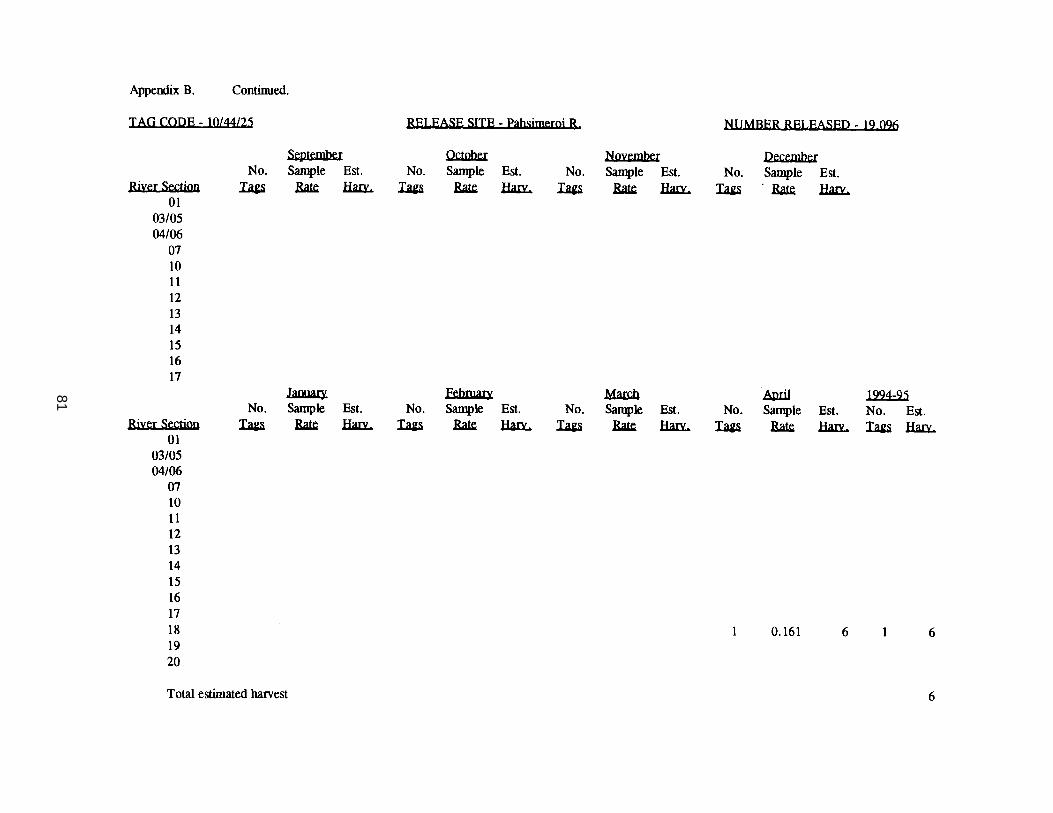
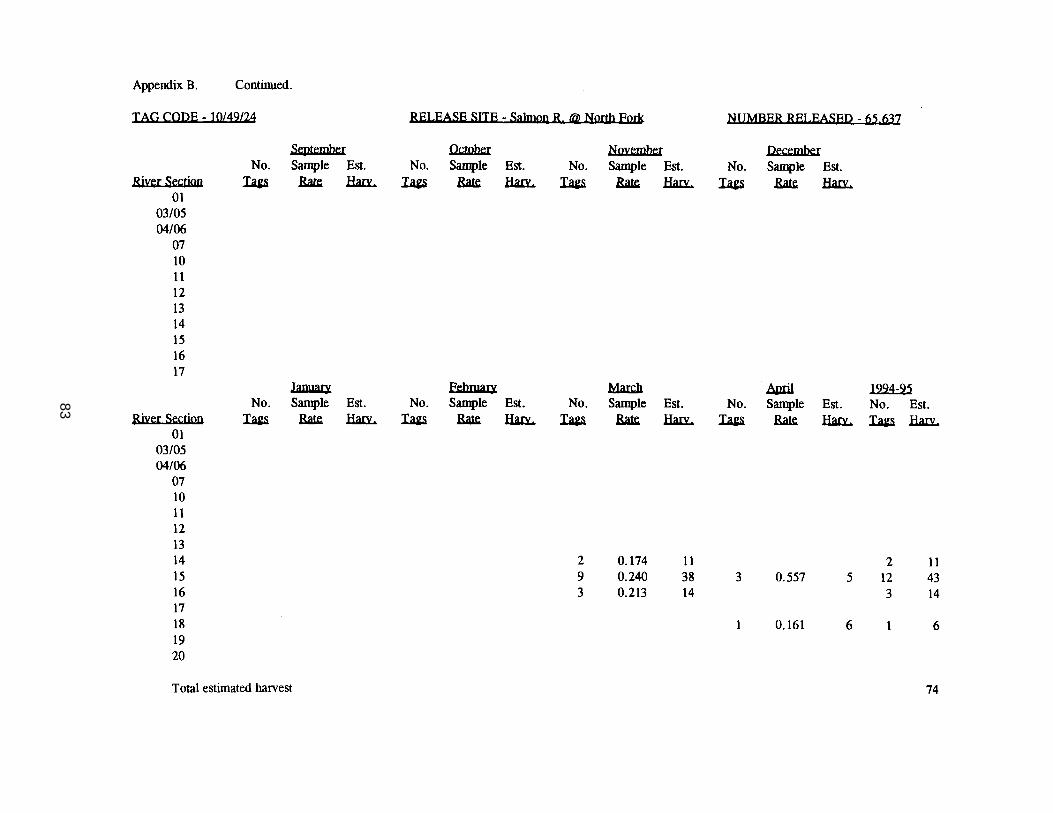
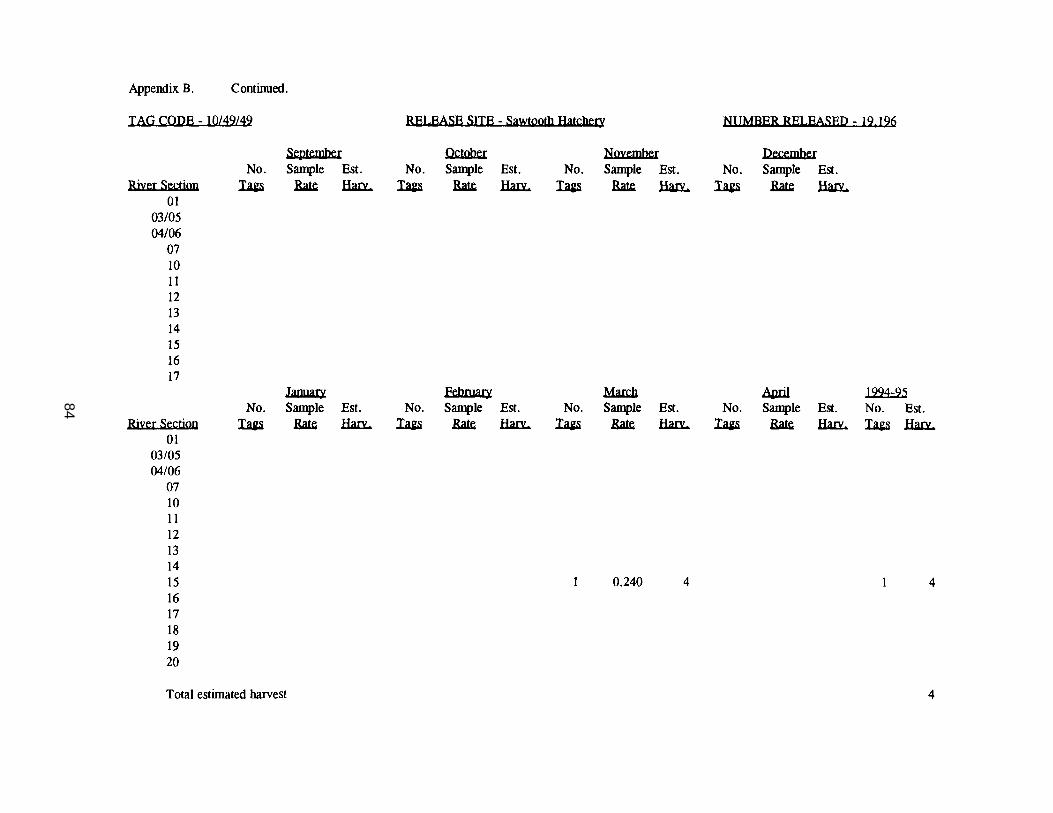
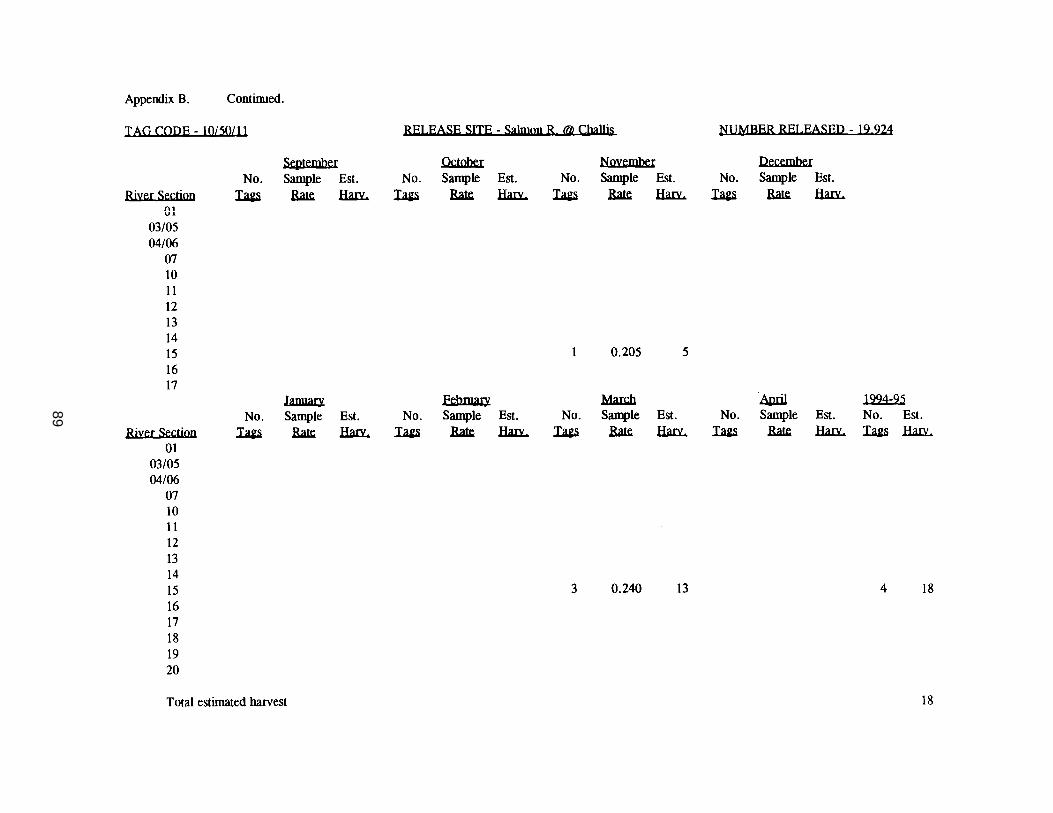
Appendix B. Coded wire tag recoveries and fm clips identified September 1994 -April 1995 harvest estimates by month and river section; and totalharvest estimates for the 1994-95 season ....................................................................................49
Appendix C. Steelhead groups returning to the Salmon River, 1994-95 .........................................................110
Appendix D. Steelhead groups returning to the Clearwater River, 1994-95 ....................................................114
Appendix E. Miscellaneous coded wire tag steelhead groups that were recoveredby Idaho anglers, 1994-95 ................................................................................................116

1
ABSTRACT
Steelhead trout Oncorhynchus mykiss and chinook salmon O. tshawytscha fisheries in Idaho aremonitored to assess hatchery contribution, distribution, and return rates. Coded wire tags (CWTs) areretrieved from fish harvested by anglers, and harvest rates are calculated by month and river section.
During the fall 1994 and spring 1995 steelhead seasons, 12,888 anglers were interviewed and 1,676adult steelhead examined, which was 8.8% of the total steelhead harvest. We retrieved 170 CWTsfrom 61 different mark groups. The total estimated harvest for the 1994-95 season was 19,027 hatcherysteelhead, of which an estimated 4,579 (24%) were produced by the U.S. Fish and Wildlife Service(USFWS) Lower Snake River Compensation Plan (LSRCP). An additional 2,302 LSRCP-reared fishreturned to hatchery racks or to off-site release locations. However, this estimate should be considered aminimum due to tributary and mainstem strays that were not accounted for. For example, we did notestimate hatchery fall-out; steelhead which spawn and die prior to reaching the weir. These fish contributeto the fishery, but not to hatchery escapement.
The estimated minimum return of A-strain adults from 739,360 smolts released at SawtoothHatchery in 1992 was 1,070 (0.14%), and 81% of these were harvested. We estimated at least 412(0.03%) B-strain adults returned after two ocean-years from 1,343,535 smolts released into the East ForkSalmon River in 1992; this group was harvested at 90%. We have accounted for 2,554 adults that returnedfrom the 1991 release of 1,507,033 smolts into the East Fork Salmon River. Ninety-six percent were wereharvested.
Progeny of East Fork parents returned 1.7 times as many adults to the Idaho fishery and 4.3 timesas many to the hatchery rack than progeny of Dworshak parents when released into the East Fork SalmonRiver.
We surveyed 23 tributaries in the upper Salmon River drainage during spring 1995 to documentthe occurrence and distribution of adult hatchery steelhead. Thirteen streams that contained adult spawningsteelhead were electrofished. We handled 251 adult steelhead, of which 15 were of natural origin. Codedwire tags were retrieved from 38 hatchery fish.
Author:
Kent BallSenior Fishery Research Biologist

2
INTRODUCTION
Chinook salmon Oncorhynchus tshawytscha and steelhead trout O. mykiss are raised in Idahohatcheries to mitigate for losses caused by the construction of hydroelectric dams. Adults returning tohatcheries in the Salmon and Clearwater River basins commingle with each other and with wild stocks.In the Snake River, fish destined for Idaho also commingle with adults returning to Oregon and Washingtonstreams.
The main purpose of this project is to determine the composition of the anadromous fish harvestin the Idaho fishery and to estimate the adult harvest contribution from juveniles produced in U.S. Fish andWildlife Service (USFWS) Lower Snake River Compensation Plan (LSRCP) hatcheries. Contribution tothe Idaho fishery is one of the measures of performance of LSRCP fish. However, there are also steelheadraised by Idaho Power Company (IPC) that are released in the Salmon River drainage. Although theharvest contribution of these fish is not included in this report, they are incorporated in the section ontributary straying. For some release groups, coded wire tagged (CWTed) fish from the IPC programprovide the basis for LSRCP evaluation.
Harvest management of steelhead in Idaho is directed toward harvest of hatchery fish andprotection of wild and naturally-produced fish. Currently, wild and naturally-produced stocks are belowescapement goals, and protection is necessary to perpetuate these fish. Beginning in 1984, all hatchery-produced steelhead smolts released in Idaho rivers and streams had their adipose fins excised before releaseso that returning adults could be selectively harvested.
During the fall 1994 and spring 1995 seasons, all age groups of hatchery steelhead returning toIdaho were marked by adipose fm clips, and regulations stated that "only steelhead with a missing adiposefin (as evidenced by a healed scar) may be kept." Consequently, the harvest of any wild (unmarked)steelhead was illegal. Table 1 lists the fall and spring regulations.
Representative groups of steelhead are marked with coded wire tags (CWTs) prior to release.Anglers are interviewed and fish snouts are retrieved in all major harvest areas to recover these tags fromthe fishery. In addition, several tributaries were surveyed in spring 1995 for the presence of hatcherysteelhead. Information is collected and used to estimate timing, straying, exploitation, harvest distribution,and relative abundance of wild and hatchery stocks. Total harvested numbers are estimated by a statewideharvest survey, and the harvest contribution for each hatchery program is derived from tag recoveries.Releasing steelhead smolts directly into the upper Salmon River is being used as a tool for spreadingharvest and increasing returns. This report documents some of the behavior and distribution of thesereturning adults.
In recent years, harvest opportunity for chinook salmon has been limited to hatchery stocks.Harvest is allowed only when returning adult numbers exceed hatchery escapement needs. The 1995chinook salmon return to the Snake River Basin was the lowest in recorded history. Consequently, noharvest was allowed for spring chinook salmon produced by LSRCP facilities in Idaho and this reportpertains only to steelhead.

3
Table 1. Steelhead season dates, bag limits and special restrictions for theClearwater, Salmon and Snake rivers, 1994-95.
River and SectionsFall
Season Dates Bag Limitsa
Snake River(01)
Clearwater River(03)b
Sept 1 - Dec 31
Clearwater River(03 - 07)cd Oct 15 - Dec 31
Salmon River(10 - 20) Sept! -Dec 31
2, 4, 10
River and SectionsSpring
Season Dates Bag Limitsa
Snake River(01)
Clearwater River(03 - 07)
Jan 1 - Apr 30
Salmon River(10 - 14)
Jan 1 - Mar 31
Salmon River(15 - 19)
Salmon River(20)
Jan l - Apr 30
2, 4, 10
a Bag limits denotes daily, possession and season totals.b Section 03 includes only that portion from its mouth upstream to Memorial Bridge
of Highway 12 at Lewiston.c Section 03 includes that portion from Memorial Bridge upstream to Clear Creek.d Catch and release fishery from September 1 through October 14.

4
OBJECTIVES
Identify in the Idaho sport fishery the number and proportion of the steelhead harvest that isproduced by LSRCP hatcheries.
Determine the escapement of LSRCP stocks in Idaho.
Document the occurrence and distribution of adult hatchery steelhead in upper Salmon Rivertributaries.
DESCRIPTION OF STUDY AREA
There are three major river systems in Idaho where steelhead are harvested: the Snake,Clearwater, and Salmon rivers (Figure 1; Table 2). All of Idaho's steelhead harvest areas are included inthis study, except the upper Snake (section 02), Oxbow (section 27), and Boise River (section 28). Thesethree sections are excluded because no steelhead produced by the LSRCP are harvested there. Steelheadare blocked from reaching the Boise River by dams on the Snake River. However, a portion of the fishreturning to Hells Canyon Dam are transplanted and released in the Boise River and Oxbow Reservoir forharvest through the IPC mitigation program.
METHODS
Creel Survey
Angler interviews were conducted at check stations and from jet boats and roving vehicles. Anglerinterview schedules and intensity were designed to observe maximum numbers of harvested fish.Techniques were tailored to sportsmens access and harvest methods. For example, on the ClearwaterRiver, a major portion of the fall and winter harvest was taken by boat fishermen, so survey effortsconcentrated on interviewing boat anglers. In late spring, the density of boats in a small area became sohigh that it was prohibitive to interview anglers on the water; therefore, survey efforts were dividedbetween major boat ramps. In the roadless area of the Salmon River, almost all of the angler access wasby boat, but most of the fishing effort was from shore. Anglers were contacted by census clerks in jetboats or at check stations located at major egress points.
During angler interviews, data collection included the number of anglers and hours fished, numberof fish kept or released, wild or hatchery origin of fish kept or released, fork length of fish kept, and dateand river section where fish were caught. Observed fish were inspected for tags and fm clips. Snouts wereremoved for CWT retrieval from all fish with abnormalities of their left ventral fms, except when anglersdesired to keep their fish intact.

5

TABLES-V 6
Table 2. River location codes for Idaho's anadromous fisheries.
River Section Location Code
Snake River, below Salmon River 01Snake River, above Salmon River 02Clearwater River, below Orofino Bridge 03Clearwater River, above Orofino Bridge 04North Fork Clearwater River 05Middle Fork Clearwater River 06South Fork Clearwater River 07Selway River 08Lochsa River 09Salmon River, below Whitebird Creek 10Salmon River, Whitebird Creek to Little Salmon 11Salmon River, Little Salmon to Vinegar Creek 12Salmon River, Vinegar Creek to South Fork 13Salmon River, South Fork to Middle Fork 14Salmon River, Middle Fork to North Fork 15Salmon River, North Fork to Lemhi River 16Salmon River, Lemhi River to Pahsimeroi River 17Salmon River, Pahsimeroi River to East Fork 18Salmon River, above East Fork 19Little Salmon River 20South Fork Salmon River 21Middle Fork Salmon River 22North Fork Salmon River 23Lemhi River 24Pahsimeroi River 25East Fork Salmon River 26Snake River, Oxbow 27Boise River 28
7
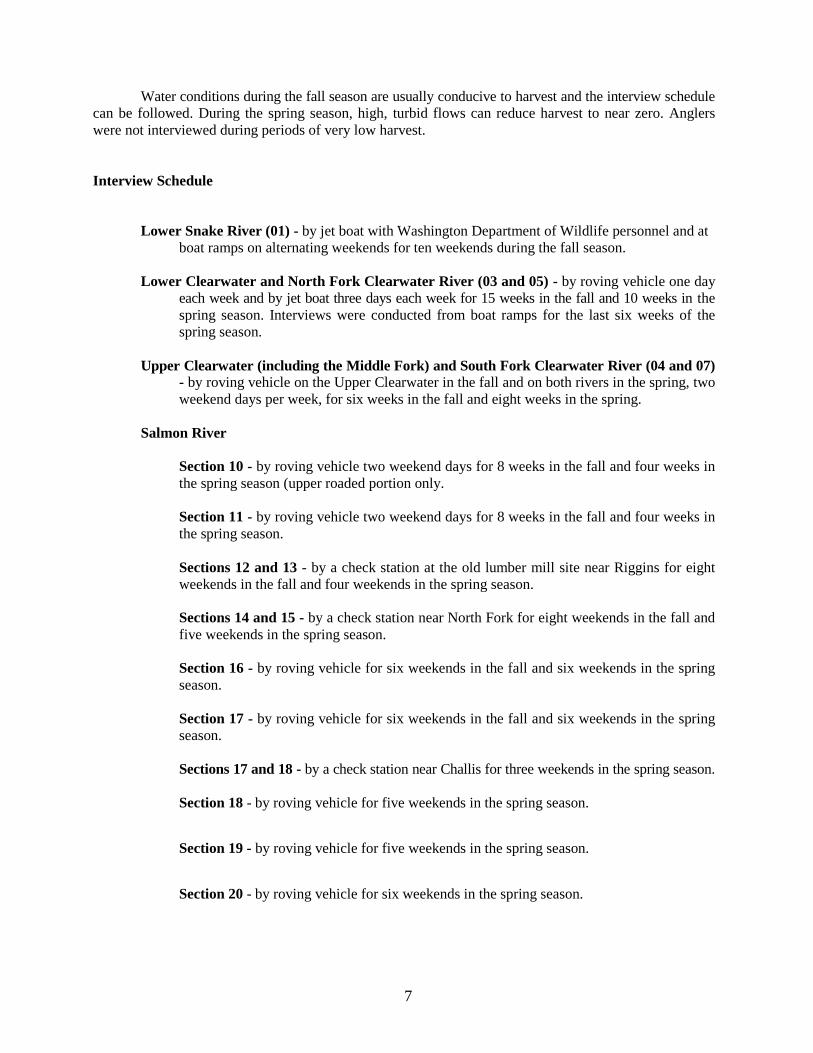
Water conditions during the fall season are usually conducive to harvest and the interview schedulecan be followed. During the spring season, high, turbid flows can reduce harvest to near zero. Anglerswere not interviewed during periods of very low harvest.
Interview Schedule
Lower Snake River (01) - by jet boat with Washington Department of Wildlife personnel and atboat ramps on alternating weekends for ten weekends during the fall season.
Lower Clearwater and North Fork Clearwater River (03 and 05) - by roving vehicle one dayeach week and by jet boat three days each week for 15 weeks in the fall and 10 weeks in thespring season. Interviews were conducted from boat ramps for the last six weeks of thespring season.
Upper Clearwater (including the Middle Fork) and South Fork Clearwater River (04 and 07)- by roving vehicle on the Upper Clearwater in the fall and on both rivers in the spring, twoweekend days per week, for six weeks in the fall and eight weeks in the spring.
Salmon River
Section 10 - by roving vehicle two weekend days for 8 weeks in the fall and four weeks inthe spring season (upper roaded portion only.
Section 11 - by roving vehicle two weekend days for 8 weeks in the fall and four weeks inthe spring season.
Sections 12 and 13 - by a check station at the old lumber mill site near Riggins for eightweekends in the fall and four weekends in the spring season.
Sections 14 and 15 - by a check station near North Fork for eight weekends in the fall andfive weekends in the spring season.
Section 16 - by roving vehicle for six weekends in the fall and six weekends in the springseason.
Section 17 - by roving vehicle for six weekends in the fall and six weekends in the springseason.
Sections 17 and 18 - by a check station near Challis for three weekends in the spring season.
Section 18 - by roving vehicle for five weekends in the spring season.
Section 19 - by roving vehicle for five weekends in the spring season.
Section 20 - by roving vehicle for six weekends in the spring season.

8
Data Analysis
Harvest estimates for each river section were obtained from statewide telephone survey results(Appendix A). Beginning with the fall 1990 season, that portion of the Clearwater River up to theMemorial Bridge of Highway 12 at Lewiston was designated river section 03 during the September 1 toOctober 15 harvest period. Previously, harvest from this section of the Clearwater River had beenincluded with river section 01 (Ball 1992a).
The number of fish checked for marks from each river section, divided by the harvest estimate,yields the sampling rate for each river section by month. Harvested fish that were not seen during theinterviews were not included when expressing the proportion of the estimated harvest that was marked.
During angler interviews, hatchery and naturally-produced proportions were recorded for fish keptand for total catch, including released fish when their origin could be determined. The harvest of hatcheryfish was the product of the hatchery proportion observed in anglers' creels and the estimated monthlyharvest from statewide surveys. Seasonal estimates of reported hatchery fish harvest were the summationof monthly estimates. Hatchery harvest estimates for months when harvest was low and no fish werechecked were calculated using the hatchery proportion calculated from the last month that data wereavailable. These methods were applied during winter months when fish movement was minimal and theproportion of hatchery fish in the harvest was constant. Harvest estimates of various CWT groups werecalculated by dividing the number of tags recovered by the sampling rate expressed as a decimal and thenrounded to whole numbers. Tag group harvest rates were calculated by dividing the estimated harvest ofthe group by the release group size. Harvest estimates for unmarked groups were calculated using harvestrates from representative mark groups or companion groups.
Hatchery returns were classified by strain (A or B) and ocean-age using length frequencies ofprevious known-age CWT returns. Marked returns to hatchery racks were subtracted from total returnsby strain and ocean-age. Total harvest of unmarked groups was assumed to parallel the performance ofmarked hatchery rack returns. Where more than one unmarked group returned to a release site, theestimates of harvest and hatchery returns were calculated on the total of the unmarked fish and assumedto apply equally to each group.
Total returns of marked groups were the summation of harvest estimates and hatchery rack returns.However, in 1994-95, CWT recoveries of some marked groups were insufficient to produce expandedharvest estimates. Returns from off-site releases at Challis, Ellis Bridge, Lemhi, and North Fork wereapproximated by using the harvest rate of the comparable age groups that returned to the PahsimeroiHatchery. Harvest rates for releases at the Lemhi and North Fork sites were increased by 5% because thefishery at these sites was more extensive. Exploitation rates were the harvest estimates divided by the sumof the harvest estimates and the number of fish that returned to the hatchery. No attempts were made toinclude fish that spawn in either tributaries or in the river. Therefore, estimated exploitation rates shouldbe considered maximum rates.

9
Tributary Straying
Upper Salmon River tributary streams were visually checked near their mouths for the presenceof adult fish in late March and through April. We identified 23 tributary streams that could have potentialfor steelhead spawning and attempted to ascertain when the first fish arrived. The range of examinedcreeks extended nearly 160 km, from Squaw Creek #1 upstream to Slate Creek (Figure 2). Initially, wewalked along creeks to locate adult fish and redd sites. Once steelhead were observed, an electrofishingcrew usually returned to the creek the same day or the next day. Starting at the creek's mouth, the crewwould usually proceed up the tributary 0.4 to 0.8 km, shocking until the number of fish dissipated or whenimpassable fish barriers were encountered.
RESULTS
Creel Survey
During the fall 1994 and spring 1995 seasons, we interviewed 12,888 anglers that had harvested1,833 hatchery fish (Tables 3-17). We physically examined 1,676 hatchery fish for marks, whichrepresented 8.8% of the total steelhead harvest (Table 18). We removed 210 snouts from fish with clippedleft ventral fms for CWT retrieval.
The composition of the hatchery steelhead harvest by river section and season was compiled inTable 19. All river sections were included except 02, 27, and 28 (Table 2). Total harvest for the riversections listed was 19,027 steelhead.
From anglers' creels, we recovered 170 CWTs from 61 different mark groups (Appendix B). Theoverall proportion of tags recovered from the number of fish checked for marks was 10.1 % (Table 18).The number of tags recovered, the estimated harvest of tag code groups by month and river section, andthe total estimated harvest of tag code groups for the fall and spring seasons are also listed in Appendix B.Of the 61 mark groups that yielded CWTs, 49 were from releases in Idaho (Appendices C and D). Therewere 17 additional CWTs from eight tag groups that returned to hatchery racks, but were not recoveredfrom the fishery.
Coded wire tags were also recovered from two Oregon, six Washington, and four National MarineFisheries Service (NMFS) tag groups (Appendices B and E). Both Oregon tag groups were from releaseson the Wallowa River. Four Washington tag groups were from releases in the Tucannon River, and oneeach from the Touchet and Walla Walla rivers. The four NMFS wire groups were from steelhead smoltstagged at Lower Granite Dam during outmigration. These fish were transported downriver to release sitesat river mile 18.2 and 141 on the Columbia River below Bonneville Dam and then released.
Estimates of total returns of LSRCP-reared fish were summarized in Table 20. Returns that wereverified by CWT recoveries from the LSRCP program returnings in 1994-95 were from releases in theSalmon River drainage. However, they were also recovered from the fishery in the Snake and Clearwaterrivers. The first returns from releases in the South Fork Clearwater River were expected, but no CWTs

10

Table 3. Steelhead fishery interview data (unexpanded) from lower Snake River (01), September - November 1994.
Total SteelheadNo. Hours Steelhead Kept Released Hours/ Percent
Dates Anglers Fished Hatchery Wild Hatchery Wild Total Fish Hatchery
September 23 86 0 0 0 0 0 0 0
October 372 1,361 31 0 1 7 39 35 82
November 392 72 0 10 28 110 14 75
Total 787 2,992 103 0 11 35 149
Average 20 77
1,545
11

TABLES-H
Table 4. Steelhead fishery interview data (unexpanded) from lower Clearwater River (03) and North Fork Clearwater River(05), September 1994 - April 1995.
Total SteelheadNo. Hours Steelhead Kept Released Hours/ Percent
Dates Anglers Fished Hatchery Wild Hatchery Wild Total Fish Hatchery
September 66 344 7 0 0 4 11 31 64
October 744 2,672 68 0 36 35 139 19 75
November 526 1,808 52 0 9 27 88 21 69
December 192 668 14 0 0 6 20 33 70
Fall total 1,528 7,020 141 0 45 72 258
Average 27 72
January 211 913 26 0 3 11 40 23 73
February 738 3,966 70 0 21 22 113 35 81
March 644 3,366 89 0 20 8 117 29 93
April 107 483 11 0 7 0 18 27 100
Springtotal 1,700 8,728 196 0 51 41 288
Average 30 86
Total 3,228 15,748 337 0 96 113 546
Average 29 79
12

Table 5. Steelhead fishery interview data (unexpanded) from upper Clearwater River and Middle Fork Clearwater rivers (04),October 1994 - April 1995.
Total SteelheadNo. Hours Steelhead Kept Released Hours/ Percent
Dates Anglers Fished Hatchery Wild Hatchery Wild Total Fish Hatchery
October 51 124 0 0 2 4 6 21 33
November 5 7 0 0 0 0 0 0 0
Fall total 56 131 0 0 2 4 6
Average 22 33
February 55 160 3 0 0 0 3 53 100
March 154 362 16 0 1 7 24 15 71
April 18 42 1 0 0 0 1 42 100
Spring total 227 564 20 0 1 7 28
Average 20 75
Total 283 695 20 0 3 11 34
Average 20 68
13

Table 6. Steelhead fishery interview data (unexpanded) from South Fork Clearwater River (07), October 1994 - April 1995.
Total SteelheadNo. Hours Steelhead Kept Released Hours/ Percent
Dates Anglers Fished Hatchery Wild Hatchery Wild Total Fish Hatchery
October 2 2 0 0 0 0 0 0 0
Fall total 2 2 0 0 0 0 0
Average 0 0
February 47 118 1 0 0 0 1 118 100
March 214 570 18 0 4 2 24 24 92
April 130 440 14 0 4 2 20 22 90
Spring total 391 1,128 33 0 8 4 45
Average 25 91
Total 393 1,130 33 0 8 4 45
Average 25 91
14

Table 7. Steelhead fishery interview data (unexpanded) from Salmon River Section 10, October 1994 - February 1995.
Total SteelheadNo. Hours Steelhead Kept Released Hours/ Percent
Dates Anglers Fished Hatchery Wild Hatchery Wild Total Fish Hatchery
October 56 254 1 0 0 0 1 254 100
November 8 14 1 0 0 0 1 14 100
Fall total 64 268 2 0 0 0 2
Average 134 100
February 20 49 2 0 0 0 2 25 100
Spring total 20 49 2 0 0 0 2
Average 25 100
Total 84 317 4 0 0 0 4
Average 79 100
15

TABLES-H
Table 8. Steelhead fishery interview data (unexpanded) from Salmon River Section 11, October 1994 - March1995.
Total SteelheadNo. Hours Steelhead Kept Released Hours/ Percent
Dates Anglers Fished Hatchery Wild Hatchery Wild
Total Fish Hatchery
October 224 866 37 0 5 20 62 14 68
November 216 651 44 0 1 21 66 10 68
Fall total 440 1,517 81 0 6 41 128
Average 12 68
February 189 657 25 0 1 4 30 22 87
March 75 177 6 0 2 3 11 16 73
Spring total 264 834 31 0 3 7 41
Average 20 83
Total 704 2,351 112 0 9 48 169
Average 14 72
16

TABLES-H
Table 9. Steelhead fishery interview data (unexpanded) from Salmon River Section 12, October 1994 - March 1995.
Total SteelheadNo. Hours Steelhead Kept Released Hours/ Percent
Dates Anglers Fished Hatchery Wild Hatchery Wild Total Fish Hatchery
October 431 1,967 83 0 15 23 121 16 81
November 350 1,373 46 0 10 10 66 21 85
Fall total 781 3,340 129 0 25 33 187
Average 18 82
February 80 244 2 0 0 0 2 122 100
March 425 1,523 13 0 6 9 28 54 68
Spring total 505 1,767 15 0 6 9 30
Average 59 70
Total 1,286 5,107 144 0 31 42 217
Average 24 81
17

Table 10. Steelhead fishery interview data (unexpanded) from Salmon River Section 13, October 1994 - March 1995.
Total SteelheadNo. Hours Steelhead Kept Released Hours/ Percent
Dates Anglers Fished Hatchery Wild Hatchery Wild Total Fish Hatchery
October 44 337 13 0 3 9 25 13 64
November 51 269 16 0 0 12 28 10 57
Fall total 95 606 29 0 3 21 53
Average 11 60
February 11 66 2 0 1 2 5 13 60
March 45 256 6 0 2 10 18 14 44
Spring total 56 322 8 0 3 12 23
Average 14 48
Total 151 928 37 0 6 33 76
Average 12 57
18

Table 11. Steelhead fishery interview data (unexpanded) from Salmon River Section 14, October 1994 - March 1995.
Total SteelheadNo. Hours Steelhead Kept Released Hours/ Percent
Dates Anglers Fished Hatchery Wild Hatchery Wild Total Fish Hatchery
October 164 3,256 11 0 2 58 71 46 18
November 149 1,967 33 0 8 37 78 25 53
Fall total 313 5,223 44 0 10 95 149
Average 35 36
February 15 149 2 0 0 2 4 37 50
March 273 4,054 32 0 1 108 141 29 23
Spring total 288 4,203 34 0 1 110 145
Average 29 24
Total 601 9,426 78 0 11 205 294
Average 32 30
19

Table 12. Steelhead fishery interview data (unexpanded) from Salmon River Section 15, October 1994 - April 1995.
Total SteelheadNo. Hours Steelhead Kept Released Hours/ Percent
Dates Anglers
Fished Hatchery Wild Hatchery Wild Total Fish Hatchery
October 305 3,635 52 0 12 10 74 49 86
November 310 3,194 50 0 8 9 67 48 87
Fall total 615 6,829 102 0 20 19 141
Average 48 87
February 124 831 47 0 20 4 71 12 94
March 1,158 11,945 296 0 284 32 612 20 95
April 191 1,417 63 0 83 1 147 10 99
Spring total 1,473 14,193 406 0 387 37 830
Average 17 96
Total 2,088 21,022 508 0 407 56 971
Average 22 94
20

Table 13. Steelhead fishery interview data (unexpanded) from Salmon River Section 16, October 1994 - April 1995.
Total SteelheadNo. Hours Steelhead Kept Released Hours/ Percent
Dates Anglers Fished Hatchery Wild Hatchery Wild Total Fish Hatchery
October 17 126 3 0 0 1 4 32 75
November 19 102 0 0 0 1 1 102 0
Fall total 36 228 3 0 0 2 5
Average 46 60
February 25 127 1 0 0 0 1 127 100
March 139 639 13 0 2 7 22 29 68
April 157 626 11 0 3 3 17 37 82
Spring total 321 1,392 25 0 5 10 40
Average 35 75
Total 357 1,620 28 0 5 12 45
Average 36 73
21

Table 14. Steelhead fishery interview data (unexpanded) from Salmon River Section 17, October 1994 - April 1995.
Total SteelheadNo. Hours Steelhead Kept Released Hours/ Percent
Dates Anglers Fished Hatchery Wild Hatchery Wild Total Fish Hatchery
October 1 6 0 0 0 0 0 0 0
Fall total 1 6 0 0 0 0 0
Average 0 0
February 1 4 0 0 0 0 0 0 0
March 274 1,388 42 0 7 3 52 27 94
April 433 4,444 97 0 27 3 127 35 98
Spring total 708 5,836 139 0 34 6 179
Average 33 97
Total 709 5,842 139 0 34 6 179
Average 33 97
22

Table 15. Steelhead fishery interview data (unexpanded) from Salmon River Section 18, March - April 1995.
Total SteelheadNo. Hours Steelhead Kept Released Hours/ Percent
Dates Anglers Fished Hatchery Wild Hatchery Wild Total Fish Hatchery
March 57 254 3 0 0 1 4 64 75
April 465 3,107 57 0 49 13 119 26 89
Total 522 3,361 60 0 49 14 123
Average 27 89
23

Table 16. Steelhead fishery interview data (unexpanded) from Salmon River Section 19, April 1995.
Total SteelheadNo. Hours Steelhead Kept Released Hours/ Percent
Dates Anglers Fished Hatchery Wild Hatchery Wild Total Fish Hatchery
April 497 1,989 36 0 25 3 64 31 95
Total 497 1,989 36 0 25 3 64
Average 31 95
24

Table 17. Steelhead fishery interview data (unexpanded) from Salmon River Section 20, October 1994 - April 1995.
Total SteelheadNo. Hours Steelhead Kept Released Hours/ Percent
Dates Anglers Fished Hatchery Wild Hatchery Wild Total Fish Hatchery
October 16 35 4 0 0 0 4 9 100
November 35 72 2 0 1 0 3 24 100
Fall total 51 107 6 0 1 0 7
Average 15 100
February 210 637 19 0 9 0 28 23 100
March 391 1,227 81 0 36 12 129 10 91
April 546 1,703 88 0 107 7 202 8 97
Spring total 1,147 3,567 188 0 152 19 359
Average 10 95
Total 1,198 3,674 194 0 153 19 366
Average 10 95
25

TABI.FS-V 26
Table 18. Proportion of estimated harvest by river section that wasexamined for marks, 1994-95.
River No. Fish Estimated SampleSection Checked Harvesta Rate (%)
01 96 1,639 5.9
03 & 05 307 5,219 5.904 20 417 4.8
07 33 318 10.4
10 3 1,384 0.2
11 93 2,091 4.4
12 138 742 18.6
13 35 251 13.9
14 74 802 9.2
15 473 2,416 19.6
16 25 135 18.5
17 129 896 14.4
18 47 652 7.2
19 33 60 55.0
20 170 2,007 8.5
Total 1,676 19,027
Average 8.8
a Data from statewide telephone survey from Thomas J. McArthur, IDFG,(unpublished).

TABLES-H
Table 19. Estimated number of hatchery steelhead harvested in the lower Snake, Clearwater and Salmon rivers during the 1994-95seasons.
Fall Season - 1994 Spring Season - 1995 Total HarvestRiver and Estimated Percent No. Hatchery Estimated Percent No. Hatchery No. HatcherySection Harvests Hatchery Fish Harvests Hatchery Fish Fish
Snake R.01 1,457 100 1,457 182 -- 182b 1,639
Clearwater R.03 & 05 3,278 100 3,278 1,941 100 1,941 5,21904 190 -- 1906 227 100 227 41707 15 -- 156 303 100 303 318
Clwtr. Total 3,482 3,482 2,471 2,471 5,953Average 100 100
Salmon River10 1,020 100 1,020 364 100 364 1,38411 1,166 100 1,166 925 100 925 2,09112 408 100 408 334 100 334 74213 160 100 160 91 100 91 25114 423 100 423 379 100 379 80215 612 100 612 1,804 100 1,804 2,41616 44 100 44 91 100 91 13517 335 -- 335b 561 100 561 89618 0 -- 0 652 100 652 65219 15 -- 156 45 100 45 6020 233 100 233 1,774 100 1,774 2,007
Salmon Total 4,415 4,415 7,020 7,020 11,435Average 100 100
1994-95Total 9,354 9,354 9,673 9,673 19,027
a From statewide harvest surveys.b Assumed to be of hatchery origin.
27

Table 20. Summary of 1994-95 harvest estimates and hatchery returns of steelhead produced by LSRCP hatcheries.
Strain No. of Estimated Number of FishRelease and Fish Hatchery HatcheryYear Ocean-Age Released Release Site Rearing Marks Harvest Returns Total
1993 A-I 19,196 Sawtooth Hatchery HNFHb CWT 10/49/49' 4 5 91993 A-I 18,168 Sawtooth Hatchery HNFH CWT 10/49/50' 0 5 51993 A-I 17,818 Sawtooth Hatchery HNFH CWT 10/49/51` 12 9 211993 A-I 8,161 Sawtooth Hatchery HNFH CWT 10/50/10 12 2 141993 A-I 20,262 Sawtooth Hatchery HNFH CWT 10/50/20 23 3 261993 A-I 18,726 Sawtooth Hatchery HNFH CWT 10/50/21 23 7 301993 A-I 18,235 Sawtooth Hatchery HNFH CWT 10/50/22 40 10 501993 A-I 4,563 Sawtooth Hatchery HNFH CWT 10/50/34 14 3 171993 A-I 604,391 Sawtooth Hatchery HNFH None` 1,689 402 2,0911993 A-I 19,924 Salmon R. @ Challis MVFH" CWT 10/50/11 18 12 301993 A-I 240,676 Salmon R. @ Challis MVFH None° 217 145 3621993 A-I 19,778 Salmon R. @ Ellis Br. MVFH CWT 10/50/14 10 8 181993 A-I 20,361 Salmon R. @ Ellis Br. MVFH CWT 10/50/16 22 18 401993 A-I 226,161 Salmon R. @ Ellis Br. MVFH None` 180 147 3271993 A-I 22,106 Salmon R. @ Lemhi R. MVFH CWT 10/50/12 18 12 301993 A-I 19,692 Salmon R. @ Lemhi R. MVFH CWT 10/50/13 31 21 521993 A-I 21,390 Salmon R. @ Lemhi R. MVFH CWT 10/50/15 11 7 181993 A-I 135,312 Salmon R. @ Lemhi R. MVFH None° 128 86 2141993 A-I 65,637 Salmon R. @ N. Fork MVFH CWT 10/49/24 74 49 1231993 A-I 124,863 Salmon R. @ N. Fork MVFH Nonec 140 94 2341993 A-I 20,045 Little Salmon R. HNFH CWT 10/50/17 20 20 401993 A-I 10,245 Little Salmon R. HNFH CWT 10/50/18 0 0 01993 A-I 19,621 Little Salmon R. HNFH CWT 10/50/19 0 0 01993 A-I 497,405 Little Salmon R. HNFH None 195 195 3901993 A-I 17,142 Salmon R. @ Hammer Cr. HNFH CWT 10/49/46 0 0 01993 A-I 19,655 Salmon R. @ Hammer Cr. HNFH CWT 10/49/47 0 0 01993 A-I 16,662 Salmon R. @ Hammer Cr. HNFH CWT 10/49/48 0 0 01993 A-I 157,547 Salmon R. @ Hammer Cr. HNFH None 0 0 0
Subtotal 2,403,742 2,881 1,260 4,141
28

Table 20. Continued.
Strain No. of Estimated Number of FishRelease and Fish Hatchery HatcheryYear Ocean-Age Released Release Site Rearing Marks Harvest Returns Total
1992 A-II 53,643 Sawtooth Hatchery HNFH CWT 10/15/30 44 2 461992 A-II 45,646 Sawtooth Hatchery HNFH CWT 10/40/07 25 4 291992 A-II 17,955 Sawtooth Hatchery HNFH CWT 10/44/21 2 0 21992 A-II 18,336 Sawtooth Hatchery HNFH CWT 10/44/22 6 0 61992 A-II 19,341 Sawtooth Hatchery HNFH CWT 10/44/23 4 0 41992 A-II 467,139 Sawtooth Hatchery HNFH None` 224 60 2841992 A-II 117,300 Sawtooth Hatchery MVFH None 55 16 711992 A-II 223,406 Pahsimeroi R. HNFH None 169 76 2451992 A-II 21,091 Little Salmon R. MVFH CWT 10/44/15 3 3 61992 A-II 22,223 Little Salmon R. MVFH CWT 10/44/16 45 45 901992 A-II 21,604 Little Salmon R. MVFH CWT 10/44/17 3 3 61992 A-II 936,982 Little Salmon R. MVFH None` 736 736 1,472
Subtotal 1,964,486 1,316 945 2,261
1993 B-I 187,100 Slate Cr. MVFH None 14 141993 B-I 16,024 E. Fork Salmon R. MVFH CWT 10/50/05 0 0 01993 B-I 18,924 E. Fork Salmon R. MVFH CWT 10/50/07 4 0 41993 B-I 19,128 E. Fork Salmon R. MVFH CWT 10/50/09 0 1 11993 B-I 87,272 E. Fork Salmon R. MVFH Nonee' 14 8 221993 B-I 356,052 E. Fork Salmon R. MVFH None`'f 26 0 261993 B-I 19,358 Little Salmon R. MVFH CWT 10/50/04 0 0 01993 B-I 19,932 Little Salmon R. MVFH CWT 10/50/06 11 11 221993 B-I 19,909 Little Salmon R. MVFH CWT 10/50/08 0 0 01993 B-I 266,101 Little Salmon R. MVFH None° 49 49 981993 B-I 25,673 S. Fk. Clearwater R. CAFHg CWT 10/29/47 0 0 01993 B-I 22,003 S. Fk. Clearwater R. CAFH CWT 10/49/37 0 0 01993 B-I 21,340 S. Fk. Clearwater R. CAFH CWT 10/49/38 0 0 01993 B-I 257,284 S. Fk. Clearwater R. CAFH None°
Subtotal 1,336,100 120 70 190
29

TABLES-H
Table 20. Continued.
Strain No. of Estimated Number of FishRelease and Fish Hatchery HatcheryYear Ocean-Age Released Release Site Rearing Marks Harvest Returna Total
1992 B-II 21,771 East Fork Salmon R. MVFH CWT 10/44/18f 3 0 31992 B-II 21,568 East Fork Salmon R. MVFH CWT 10/44/19f 2 1 31992 B-II 20,821 East Fork Salmon R. MVFH CWT 10/44/20e 4 2 61992 B-II 63,979 East Fork Salmon R. MVFH Nonec,e 2 1 31992 B-II 913,061 East Fork Salmon R. MVFH Nonec,f 35 17 521992 B-II 302,335 East Fork Salmon R. HNFH Nonef 12 6 181992 B-II 18,702 Little Salmon R. HNFH CWT 10/44/07 0 0 01992 B-II 19,835 Little Salmon R. HNFH CWT 10/44/08 0 0 01992 B-II 17,847 Little Salmon R. HNFH CWT 10/44/09 0 0 01992 B-II 244,150 Little Salmon R. HNFH None 0 0 0
Subtotal 1,644,069 58 27 85
1991 B-III 20,498 East Fork Salmon R. MVFH CWT 10/43/14f 11 0 111991 B-IIl 21,017 East Fork Salmon R. MVFH CWT 10/43/15f 0 0 01991 B-Iil 20,312 East Fork Salmon R. MVFH CWT 10/43/16f 0 0 01991 B-Iil 22,525 East Fork Salmon R. MVFH CWT 10/43/20e 0 0 01991 B-III 22,483 East Fork Salmon R. MVFH CWT 10/43/21e 0 0 01991 B-III 21,375 East Fork Salmon R. MVFH CWT 10/43/22e 18 0 181991 B-III 267,567 East Fork Salmon R. MVFH None`e 73 0 731991 B-III 570,523 East Fork Salmon R. MVFH Nonee’f 102 0 1021991 B-III 540,733 East Fork Salmon R. HNFH Noneh
1991 B-III 19,831 Little Salmon R. HNFH CWT 10/43/32 0 0 01991 B-III 19,813 Little Salmon R. HNFH CWT 10/43/39 0 0 01991 B-III 18,877 Little Salmon R. HNFH CWT 10/43/40 0 0 01991 B-III 398,589 Little Salmon R. HNFH Nonec 0 0 01991 B-III 120,323 Little Salmon R. HNFH Noneh -- -- --
Subtotal 2,084,466 204 0 204a Includes off-site escapement and strays to hatchery racks.b HNFH = Hagerman National Fish Hatchery.c Release group includes fish marked with passive integrated transponder (PIT) tags.d MVFH = Magic Valley Fish Hatchery.e East Fork Salmon River stock.f Dworshak National Fish Hatchery stock.g CAFH = Clearwater Anadromous Fish Hatchery.h Fall release of presmolts.
30
31
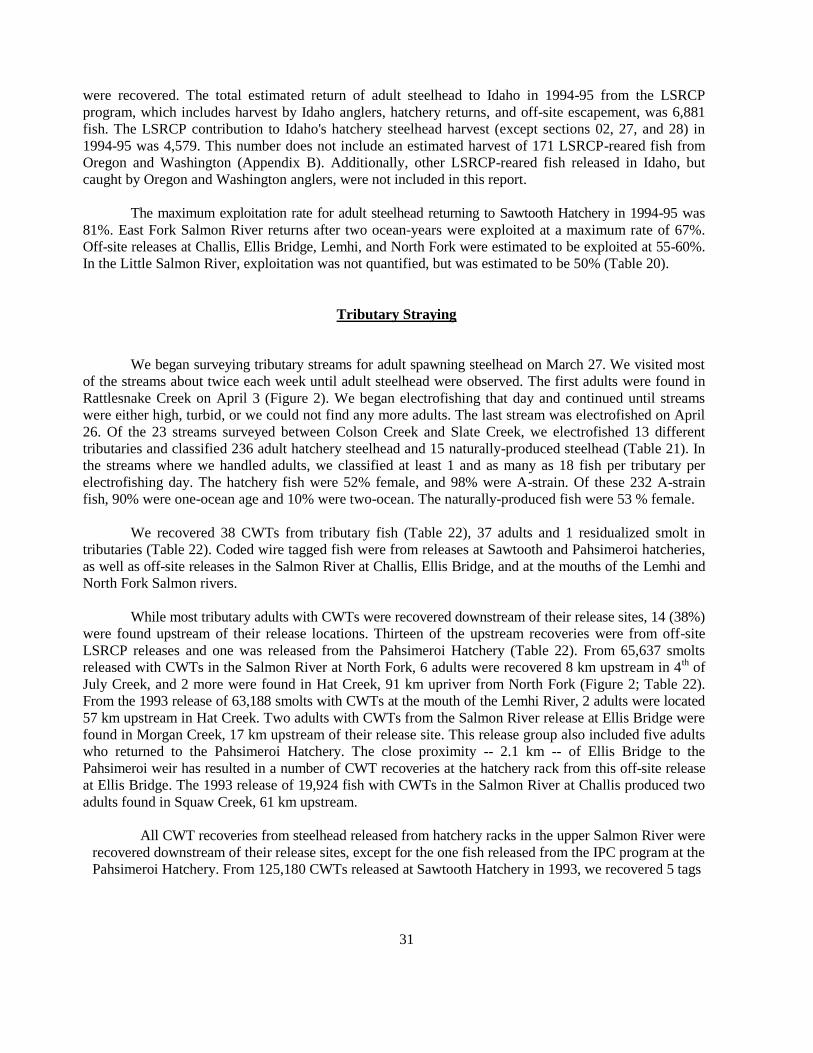
were recovered. The total estimated return of adult steelhead to Idaho in 1994-95 from the LSRCPprogram, which includes harvest by Idaho anglers, hatchery returns, and off-site escapement, was 6,881fish. The LSRCP contribution to Idaho's hatchery steelhead harvest (except sections 02, 27, and 28) in1994-95 was 4,579. This number does not include an estimated harvest of 171 LSRCP-reared fish fromOregon and Washington (Appendix B). Additionally, other LSRCP-reared fish released in Idaho, butcaught by Oregon and Washington anglers, were not included in this report.
The maximum exploitation rate for adult steelhead returning to Sawtooth Hatchery in 1994-95 was81%. East Fork Salmon River returns after two ocean-years were exploited at a maximum rate of 67%.Off-site releases at Challis, Ellis Bridge, Lemhi, and North Fork were estimated to be exploited at 55-60%.In the Little Salmon River, exploitation was not quantified, but was estimated to be 50% (Table 20).
Tributary Straying
We began surveying tributary streams for adult spawning steelhead on March 27. We visited mostof the streams about twice each week until adult steelhead were observed. The first adults were found inRattlesnake Creek on April 3 (Figure 2). We began electrofishing that day and continued until streamswere either high, turbid, or we could not find any more adults. The last stream was electrofished on April26. Of the 23 streams surveyed between Colson Creek and Slate Creek, we electrofished 13 differenttributaries and classified 236 adult hatchery steelhead and 15 naturally-produced steelhead (Table 21). Inthe streams where we handled adults, we classified at least 1 and as many as 18 fish per tributary perelectrofishing day. The hatchery fish were 52% female, and 98% were A-strain. Of these 232 A-strainfish, 90% were one-ocean age and 10% were two-ocean. The naturally-produced fish were 53 % female.
We recovered 38 CWTs from tributary fish (Table 22), 37 adults and 1 residualized smolt intributaries (Table 22). Coded wire tagged fish were from releases at Sawtooth and Pahsimeroi hatcheries,as well as off-site releases in the Salmon River at Challis, Ellis Bridge, and at the mouths of the Lemhi andNorth Fork Salmon rivers.
While most tributary adults with CWTs were recovered downstream of their release sites, 14 (38%)were found upstream of their release locations. Thirteen of the upstream recoveries were from off-siteLSRCP releases and one was released from the Pahsimeroi Hatchery (Table 22). From 65,637 smoltsreleased with CWTs in the Salmon River at North Fork, 6 adults were recovered 8 km upstream in 4th ofJuly Creek, and 2 more were found in Hat Creek, 91 km upriver from North Fork (Figure 2; Table 22).From the 1993 release of 63,188 smolts with CWTs at the mouth of the Lemhi River, 2 adults were located57 km upstream in Hat Creek. Two adults with CWTs from the Salmon River release at Ellis Bridge werefound in Morgan Creek, 17 km upstream of their release site. This release group also included five adultswho returned to the Pahsimeroi Hatchery. The close proximity -- 2.1 km -- of Ellis Bridge to thePahsimeroi weir has resulted in a number of CWT recoveries at the hatchery rack from this off-site releaseat Ellis Bridge. The 1993 release of 19,924 fish with CWTs in the Salmon River at Challis produced twoadults found in Squaw Creek, 61 km upstream.
All CWT recoveries from steelhead released from hatchery racks in the upper Salmon River wererecovered downstream of their release sites, except for the one fish released from the IPC program at thePahsimeroi Hatchery. From 125,180 CWTs released at Sawtooth Hatchery in 1993, we recovered 5 tags
TABLES-V 32
Table 21. Adult steelhead collected from Upper Salmon River tributaries, 1995.
Total No. of FishCollectionHatchery Fish
Strain and Ocean-age SexStream Date A-I A-II B-strain Male Female Hatchery Wild/Natural
Carmen 4/6 3 1 0 3 1 4 04/10 1 0 0 0 1 1 04/13 2 1 0 2 1 3 04/17 2 1 0 1 2 3 04/20 1 0 0 1 0 1 0
Cow 4/11 1 0 0 0 1 1 04/14 5 0 0 4 1 5 34/18 2 0 0 1 1 2 04/21 3 0 0 2 1 3 0
4th of July 4/6 8 0 0 4 4 8 04/10 5 1 0 4 2 6 04/13 8 0 0 3 5 8 14/17 2 0 0 1 1 2 04/20 3 0 0 0 3 3 0
Hat 4/4 9 0 0 5 4 9 14/7 4 1 0 2 3 5 04/11 16 0 0 7 9 16 14/14 16 1 0 6 11 17 14/18 15 1 0 9 7 16 04/21 5 1 1 2 5 7 14/26 11 1 0 4 8 12 3
Indian 4/5 2 0 0 1 1 2 04/6 3 0 0 1 2 3 14/10 1 •0 0 0 1 1 04/13 5 1 0 2 4 6 04/17 3 0 0 2 1 3 04/20 2 0 0 1 1 2 0
Morgan 4/4 6 1 0 3 4 7 04/7 8 3 0 8 3 11 04/11 2 1 0 1 2 3 14/14 6 3 1 5 5 10 0

TAB' .F-S-V 33
Table 21. Continued.
CollectionHatchery Fish
Strain and Ocean-age Sex Total No. of FishStream Date A-I A-II B-strain Male Female Hatchery Wild/Natural
Morgan (Cont.) 4/18 1 0 0 0 1 1 04/21 1 3 1 1 4 5 04/26 10 0 0 6 4 10 0
Rattlesnake 4/3 1 0 0 1 0 1 04/4 1 0 0 0 1 1 04/7 2 0 0 1 1 2 04/14 3 0 0 2 1 3 04/18 2 0 0 1 1 2 0
Slate 4/12 3 2 0 2 3 5 0
Squaw #1 4/20 2 0 0 0 2 2 0
Squaw #2 4/12 4 1 0 2 3 5 04/19 8 0 0 5 3 8 24/25 3 0 0 3 0 3 0
Thompson 4/19 3 0 0 1 2 3 04/25 2 0 0 2 0 2 0
Tower 4/20 1 0 0 1 0 1 0
Turner's Ditch 4/6 1 0 0 0 1 1 0
Total 208 24 4 114 122 236 15(%) (88) (10) (2) (48) (52) (94) (6)

TABLES-V 34
Table 22. Coded wire tag (CWT) recoveries from upper Salmon River tributaries, 1995.
Recovery CWT RecoveryStrainand No.of
Stream Datacode Date Release Site Ocean-age Fish
Carmen 10/44/23 4/17 Sawtooth Hatchery A-II 1d
10/50/13 4/20 Salmon R. @ Lemhi R. A-I ld
10/50/22 4/06 Sawtooth Hatchery A-I ld
Cow 10/50/14 4/14 Salmon R. @ Ellis Bridge A-I 1d
10/50/16 4/21 Salmon R. @ Ellis Bridge A-I ld
4th of July 10/49/24 4/06 Salmon R. @ North Fork A-I 3d
10/49/24 4/10 Salmon R. @ North Fork A-I ld
10/49/24 4/13 Salmon R. @ North Fork A-I 2d
Hat 10/43/12 4/14 Pahsimeroi Hatchery A-I 110/44/11 4/26 Pahsimeroi Hatchery A-I 110/44/21 4/18 Sawtooth Hatchery A-II ld
10/44/24 4/21 Pahsimeroi Hatchery A-I 110/49/24 4/11 Salmon R. @ North Fork A-I ld
10/49/24 4/17 Salmon R. @ North Fork A-I 1 d
10/49/51 4/07 Sawtooth Hatchery A-I 1 d
10/50/13 4/11 Salmon R. @ Lemhi R. A-I ld
10/50/15 4/18 Salmon R. @ Lemhi R. A-I ld
10/50/16 4/11 Salmon R. @ Ellis Bridge A-I ld
10/50/20 4/26 Sawtooth Hatchery A-I l d
Indian 10/44/05 4/13 Pahsimeroi Hatchery A-I 110/49/24 4/05 Salmon R. @ North Fork A-I 1 d
10/49/24 4/13 Salmon R. @ North Fork A-I 2d
Morgan 10/15/30 4/04 Sawtooth Hatchery A-I ld
10/40/07 4/07 Sawtooth Hatchery A-II 1d
10/50/16 4/26 Salmon R. @ Ellis Bridge A-I 2d
23/24/45 4/11 NMFSa @ Lower Granite Dam IIb 123/29/60 4/07 NMFS @ Lower Granite Dam Ib 1
Rattlesnake 10/50/16 4/14 Salmon R. @ Ellis Bridge A-I ld
Slate 10/49/25 4/12 Pahsimeroi Hatchery A-0c 1
Squaw #2 10/49/50 4/19 Sawtooth Hatchery A-I ld
10/50/10 4/19 Sawtooth Hatchery A-I ld
10/50/11 4/19 Salmon R. @ Challis A-I 2d
a NMFS = National Marine Fisheries Service.b Strain identity unknown.c Residualized smolt released in 1995.d Released by Lower Snake River Compensation Program.

35
from steelhead in tributaries and 39 fish with tags entered the trap at Sawtooth Hatchery. Two fish,released at Sawtooth in 1992 and 1993, were recovered in Carmen Creek, 210 km downstream from theirrelease site. These two fish, marked with tag codes 10/44/23 and 10/50/22, were recovered the greatestdistance away from their release site.
From the 1992 release at Sawtooth Hatchery of 155,216 fish with CWTs, four fish were recoveredfrom tributaries and six fish returned to racks at Sawtooth and Pahsimeroi hatcheries. From 118,263 A-strain steelhead with CWTs released at the Pahsimeroi Hatchery in 1993, 3 were recovered in tributariesand 113 returned to the Pahsimeroi weir. In 1992, 126,206 steelhead with CWTs were released at thePahsimeroi rack. A single two-ocean fish from this release was recovered from a tributary and 44 othersreturned to the hatchery rack.
No CWTed B-strain fish released in the East Fork Salmon River were recovered from tributariesduring spring 1995.
DISCUSSION
The number of adult steelhead that passed McNary Dam on the Columbia River in fall 1994 wasthe second lowest count of the last 12 years (Table 23). Of the 94,000 fish that passed McNary Dam,38.1 % were not accounted for upriver at Priest Rapids and Ice Harbor dams. The 52,000 adults countedpast Ice Harbor represented only 71 % of the previous year's number. This is a reflection of the pooroutmigration survival in 1993.
Harvest of Sawtooth Hatchery Releases
Returns of steelhead released from Sawtooth Hatchery in 1992 are now complete. From a totalrelease of 739,360 smolts, we estimated a return of 628 adults after one ocean-year and 442 after twoocean-years. The total return of 1,070 was 0.14% of the number released, and a maximum exploitationrate of 81 % of the adult returns were harvested (Ball 1997) (Table 20).
Adult returns from the 1993 Sawtooth Hatchery releases have returned after their first ocean-year.From 729,520 smolts released, 2,263 (0.31 %) returned to the fishery and Sawtooth Hatchery (Table 20).
Harvest of East Fork Salmon River Releases
We recovered two CWTs from B-strain adults that returned after three years in the ocean(Appendix B). From 1,507,033 smolts released in 1991, we estimated that 634 returned after one ocean-year, 1,716 returned after two ocean-years, and 204 after three ocean-years (Ball 1996, 1997) (Table 20).Adult returns from this 1991 release are now complete. There were 2,554 returning adults (0.17%), ofwhich 96% were harvested. B-strain steelhead in the Clearwater drainage commonly return a portion ofthe adults after three ocean-years (Roseberg et al. 1991). In the upper Salmon River drainage, however,

TABI.ES-V 36
Table 23. Difference between the number of steelhead passing McNary Dam that can beaccounted for upriver at Ice Harbor and Priest Rapids dams, 1983-94a.
No. of Fish (000's)
Fall ofYear
McNaryDam
IceHarborDam
PriestRapidsDam
Ice Harbor +Priest RapidsTotal Difference
1983 125.2 88.5 31.1 119.6 5.6 (4.5%)
1984 135.5 94.0 26.0 120.0 15.5 (11.4%)
1985 188.2 128.8 34.5 163.3 24.9 (13.2%)
1986 193.5 144.3 22.4 166.7 26.8 (13.9%)
1987 148.8 74.5 14.0 88.5 60.3(40.5%)
1988 151.8 99.7 10.2 109.9 41.9(27.6%)
1989 170.5 151.1 10.7 161.8 8.7 (5.1%)
1990 95.1 54.7 7.8 62.5 32.6(34.3%)
1991 169.0 123.8 14.0 137.8 31.2 (18.5%)
1992 194.0 160.6 13.7 174.3 19.7(10.2%)
1993 93.2 73.1 5.5 78.6 14.6 (15.7%)
1994 94.4 51.7 6.7 58.4 36.0 (38.1%)
a Totals from Army Corps of Engineers 1994 annual fish passage report.

37
the proportion of three-ocean returnees from East Fork B-strain releases is very small. Of the 179 known-age CWT Idaho fishery recoveries of East Fork marked fish, to date only six (3.4%) East Fork CWT fishhave been recovered as three-ocean from the fishery. An additional two (1.4%) CWT fish have beenrecovered at the East Fork trap as three-ocean returns since steelhead with CWTs were first released therebeginning in 1983.
From 1,343,535 smolts released in 1992, we estimate that 327 (0.02%) returned after one ocean-year, and 85 returned after two ocean-years (Ball 1997) (Table 20). The total return to date is 412 adults,of which 370 (90%) were harvested.
The 1993 release of 497,400 smolts into the East Fork returned an estimated 53 adults after oneocean-year. Of these one-ocean returns, 44 (83 %) were harvested.
Since 1989, smolts released into the East Fork Salmon River have been from parents that returnedto the East Fork trap and from adults from Dworshak National Fish Hatchery on the Clearwater River.Each year since 1989, each of the two stocks has been marked with CWTs to evaluate their performance(Table 24).
Through the 1993 releases, from a total of 177,571 smolts released from East Fork stock withCWTs, 56 adults were harvested in Idaho and 34 returned to hatchery racks. From 247,574 smoltsreleased with CWTs from Dworshak stock, 33 adults have been harvested in the Idaho fishery and 8returned to hatchery racks. From comparable numbers of smolts released, the East Fork stock produced1.6 times as much harvest as the Dworshak progeny. Tag code recoveries through 1994-95 show that 61% of East Fork and Dworshak stock steelhead harvest occurred downriver of the Idaho harvest areas (Table24). Downriver harvest included Oregon and Washington sport fisheries, and commercial and Indian gillnet operations. These harvest areas are from the confluence of the Clearwater and Snake riversdownstream to Bonneville Dam on the lower Columbia River. Based on CWT recoveries, comparison ofdownriver harvest between the two stocks showed a small difference. For CWT recoveries reported toIdaho through September 1996, downriver harvest accounted for 48% of East Fork stock CWT recoveries,compared to 58% for Dworshak stock CWT recoveries. By the time these stocks returned to Idaho waters,East Fork stock fish produced 1.7 times more CWT recoveries in the fishery than Dworshak stock fish.Likewise, the East Fork stock has returned 4.3 times as many spawners to the hatchery rack as theDworshak stock.
Harvest of Little Salmon River Releases
In 1992, both A-strain and B-strain smolts were released into the Little Salmon River. Adultreturns after two ocean-years are complete. Based on past performance of B-strain fish returning to theSalmon River, very few three-ocean fish are expected. From the 1,001,828 A-strain smolts released, 558adults returned after one ocean-year, and 1,574 after two ocean-years. The total return was estimated tobe 2,132 (0.21 %), which includes an escapement of 50% past the fishery. From the 300,534 B-strainsmolts released in 1992, no CWTs were recovered from adults returning after one and two ocean-years.However, in 1994-95, we observed that 23 % of the fish checked in the Little Salmon River were of B-size.The estimated harvest of hatchery fish from the Little Salmon River was 2,007 (Table 19), so including

Table 24. Coded wire tag (CWT) recoveries of East Fork Salmon River steelhead releases - East Fork stock vs Dworshak stock.
Release Year,Stock, Tag Codes, I-Ocean II-Ocean III-Ocean Totaland No. Of Fish Harvest Rack Harvest Rack Harvest Rack No.Released Downriver ID. Returns Downriver ID. Returns Downriver ID. Returns CWT's
1989
East Fork Stock:CWT 10/41/44,10/41/45, 10/41/46
n = 44,064 5 0 4 16 12 3 0 0 0 40Dworshak Stock:CWT 10/41/32,10/41/33, 10/41/34n = 43,569 0 0 1 0 6 1 0 1 0 9
1990
East Fork Stock:CWT 10/42/36,10/42/37, 10/42/38n = 46,403 1 4 4 26 22 10 3 1 0 71
Dworshak Stock:CWT 10/42/33,10/42/34, 10/42/35n = 44,763 2 1 1 15 7 1 3 0 0 30
1991
East Fork Stock:CWT 10/43/20,10/43/21, 10/43/22n = 66,383 5 1 7 23 12 3a 3 1 0 55
Dworshak Stock:CWT 10/43/14,10/43/15, 10/43/16n = 61,827 1 2 2 23 12 0 3 1 0 44
38

Table 24. Continued.
Release Year,Stock, Tag Codes, I-Ocean_____________________ II-Ocean_____________________________________________________________________________________III Ocean _____________ Totaland No. Of Fish Harvest _____ Rack ___________ Harvest Rack __________Harvest _______Rack No.Released _______________ Downriver __ID. _ Returns _____ Downriver __ID.__ Returns_____Downriver___ ID. __Returns ____CWT's
1992
East Fork Stock:CWT 10/44/20n = 20,821 0 2 1 5 1 2 11
Dworshak Stock:CWT 10/44/18,10/44/19n = 43,339 0 0 0 9 2 1" 12
1993
East Fork Stock:No CWT groups - - - --
Dworshak Stock:CWT 10/50/05,10/50/07,10/50/09n = 54,076 0c 1 1 2
a Includes one stray to Pahsimeroi Hatchery.b Includes one stray to Hells Canyon trap.c Downriver CWT recoveries received through September 1996 at Idaho Department of Fish and Game CWT lab in Lewiston.
39

40
other river sections, the total return of two-ocean adults from this release should have been between 500-1,000 fish. Apparently, there must have been a survival problem with the CWT fish.
Including 1992, there have been four release years when both A- and B-strain steelhead werereleased into the Little Salmon River. In 1984, there were 96,425 A-strain and 95,624 B-strain smoltsreleased with CWTs (Ball 1989). The estimated adult returns from these releases were 1,697 (1.76%) A-strain and 180 (0.19%) B-strain. Comparatively, the A-strain fish returned 9.3 times more adults (Ball1989). In 1990, there were 80,465 A-strain and 392,812 B-strain smolts released, but only the B-straingroup was represented by CWTs (Ball 1996). The estimated return rate of B-strain fish (0.22%) washigher than the 0.16% reported for the A-strain fish. However, the difference is a function of using thesame CWTs for both strains with different returns of one- and two-ocean numbers. Adult returns from the1991 release continued to favor A-strain releases in the Little Salmon River. From 310,000 A-strain smoltsreleased, the total return was estimated at 1,053 (0.34%), which included an estimated 50% escapementpast the fishery. The 1991 B-strain release of 577,433 produced a total estimated return of 724 (0.13 %)adults, which also includes an estimated 50% escapement past the fishery.
Harvest of Hammer Creek Releases
For the first time, smolts released into the Salmon River at Hammer Creek contained three CWTmark groups in 1993. Unfortunately, from a total release of 211,006 smolts, no adult returns have beendocumented after one ocean-year (Table 20). The primary harvest area for adults returning from HammerCreek releases is the bottom one-half of section 10 (Figure 1). Creel surveys in that area have beeneliminated. While there may have been some adult returns, we did not detect them.
Harvest of Clearwater Fish Hatchery Releases
The Clearwater Fish Hatchery, the newest LSRCP facility in Idaho, began releasing steelheadsmolts in the Clearwater River drainage in 1993. Three CWT groups were included in this first releaseof 326,300 smolts into the South Fork Clearwater River. After one ocean-year, no CWT fish wererecovered in the sport fishery or at hatchery racks at Dworshak National Fish Hatchery or KooskiaNational Fish Hatchery.
Off-site Releases
Off-site releases (smolt releases into the river or into tributaries without means or attempts tocollect spawning adults) is a technique employed to distribute the harvest and put more hatchery fish intoanglers' creels. Lower Salmon River harvest areas are corridors for all fish destined upriver. However,because these lower river sections have been unable to sustain a viable fishery after upriver fish havepassed, off-site releases have been employed there.

41
In the upper Salmon River, from North Fork upstream, off-site releases have been used in recentyears to distribute angling opportunity and harvest over more river miles. In 1988, evaluation of upperSalmon River off-site releases began with marked fish releases at Shoup Bridge, about 8 km upstream ofthe city of Salmon. Although there were no marked LSRCP releases in the upper Salmon River that year,estimated returns were derived from a companion group of marked fish from Niagara Springs FishHatchery (Ball 1992b). Beginning in 1990, the LSRCP has reared smolts for various off-site releases inthe upper Salmon River at Hagerman National Fish Hatchery and Magic Valley Fish Hatchery.
Concerns of potential interactions between steelhead smolts and emergent chinook salmon wereraised in 1993. Consequently, the scheduled number of smolts released into the East Fork Salmon Riverwas reduced. Slate Creek (23.2 km upstream from the mouth of the East Fork) was stocked with 187,100B-strain smolts, none of which were CWTed. No attempts were made to document returns since only asmall proportion of the B-strain fish return after one ocean-year.
In 1993, off-site LSRCP releases were spread over 141 km of the upper Salmon River from NorthFork upstream to Challis (Figure 1).
Hatchery Straying
Adult steelhead returning to Idaho rivers in the fall are several months away from spawning andcommonly wander into streams other than where they were released. It is not unusual for these wanderingfish to spend time in one or more rivers that are not their natal or release drainage. Adults observed orharvested during the wandering phase should not be considered strays. The majority of them wouldeventually return to their natal stream, hatchery, or release site.
In 1995, there were 334 CWTs recovered from steelhead at hatchery weirs in Idaho, excludingHells Canyon. Additionally, NMFS personnel marked smolts with CWTs during their downriveroutmigration. These smolts originated from throughout the Snake River drainage and may be encounteredas returning adults. In 1995, 27 fish tagged by NMFS returned to Idaho hatchery weirs.
Off-site releases that return to areas without spawning gravel may enter hatchery racks and areincluded in the number of CWTs recovered there. In 1995, there were five CWTs recovered at thePahsimeroi Hatchery from the LSRCP off-site release at Ellis Bridge. Although technically these markedfish strayed from their release location, we are not including them in this straying evaluation betweenhatchery racks. The Ellis Bridge release site is located 0.7 km from the mouth of the Pahsimeroi River.
Of the 226 CWTs recovered from hatchery releases in the Salmon River drainage, only two fish(0.88%) strayed from a hatchery release site to another hatchery weir. One A-strain fish marked andreleased at Sawtooth Hatchery was recovered at the Pahsimeroi rack. The second stray was a B-strain fishreleased into the East Fork Salmon River in 1992. This fish was recovered at the Hells Canyon trap onthe Snake River. This year’s straying rate is slightly higher than the range of straying rates (0.2-0.6%)reported since 1985 (Ball 1986, 1988, 1989, 1990, 1992a, 1992b, 1996, 1997). There is very littlevariation between years and little or no change over time in the years we have been calculating strayingrates between hatchery racks.

42
Tributary Straying
Electrofishing surveys in 1995 were qualitative and should not be considered a reflection of totalstraying rates of either hatchery or off-site releases. Tributary surveys this year continued to assess thepresence and relative distribution of adult steelhead in upper Salmon River tributaries. Since these surveysconcentrated on only 23 streams where adult fish were found, the results should not be considered areflection of total straying rates of either hatchery or off-site releases. A true quantitative analysis ofstraying would require weirs and very intensive electrofishing surveys over many miles of a large numberof streams. In addition to fish from off-site releases found spawning in tributaries, we also found fishreleased from hatchery-racks that were observed spawning in the river and side streams below their releasesites. This was especially evident in the upper Salmon River downstream from Sawtooth Hatchery. Theamount of straying, and possibly the distribution of steelhead, could be a function of lower flows andhigher water temperatures during the drought cycle which began in 1987. Off-site mainstem releases neartributaries may also increase the preponderance of returning adults to ascend the tributaries during theirspawning run.
Straying of hatchery fish released from Idaho racks as documented by CWTs has been consistentlylow, but it is not a good quantitative indication of the number of adult steelhead straying into tributarystreams (Ball 1986, 1989, 1992a, 1992b, 1996, 1997). Even without a quantitative straying analysis, itappears that a much larger proportion of adults are spawning in tributaries than stray to a hatchery rackother than where they were released.
Although we handled few naturally-produced steelhead, their time of arrival into the tributariescorresponded closely with hatchery fish. In 1995, we began stream surveys March 27, close to when wefirst observed adult spawners in 1993 and 1994 (Ball 1996, 1997). Since we did not fmd any fish untilApril 3, there did not appear to be very much difference between years. We also attempted to documentthe end of the spawning season, but high water impeded our ability to continue the surveys past April. Ifthere were any natural fish spawning in the streams we surveyed, they could still have been spawning inMay and June. As in 1993 and 1994, we observed both hatchery and natural fish entering the streamswhen males were ripe and females gravid. Spawning began soon after entry into the streams and the fishleft when spawning was complete. Some males returned to the river and then reentered the tributary withanother female. We did not attempt to document contribution of hatchery steelhead to natural productionin these tributaries.
Sources of Error
The primary sources of error involved in the steelhead harvest estimates have been discussedpreviously by Ball (1986), as well as the quality control of adipose clipping (Ball 1989).
Left ventral fin clips, which are used on steelhead to identify the presence of CWTs, mayregenerate but nonetheless leave the fin deformed. Since there is a high proportion of hatchery fish withdeformed fins from their life in the hatchery, we attempt to take snouts from all fish with deformed left

42
ventral fins. Although we take additional snouts with these methods, we should not be missing very manyCWTs. Spot checks at hatcheries with portable CWT detectors have confirmed that our methods detectgreater than 98 % of steelhead with CWTs.
The number of marked fish in each release group and the number of groups released each dependon many factors, but generally have been adjusted to produce adequate adult returns under averageconditions. Several consecutive low water years and poor migration survival of both juveniles migratingdownstream and adults returning upstream have resulted in several poor steelhead runs in the SalmonRiver. Consequently, the chance of recovering marked fish becomes very low and the accuracy of returninformation diminishes. Harvest patterns, exploitation rates, age at return, and other reasonably stablestatistics have been aberrant.
It is impossible to predict when poor migration conditions will occur in order to mark more fish tocompensate for poor survival. The reasoning to mark enough fish with average return expectations is stillsound, but may not produce sufficient results in very low return years.
RECOMMENDATIONS
Continue to include coded wire tags in each major smolt release that are representative in size, timeof release, and fish health.
Continue to evaluate rate of return, contribution to the sport fishery, and distribution of adultsreturning from off-site releases.
Install a weir at Slate Creek to trap returning adults from the 1993 and 1994 releases to improveadult accounting and reduce tributary entry.
Formulate a marking program for PIT tag evaluation of adult returns to Lower Granite Dam toassess LSRCP contribution.
Continue to coded wire tag 60,000 fish one more year for the release in the Salmon River atHammer Creek.

44
ACKNOWLEDGMENTS
Marsha White and Ellen Smith assisted with data compilation and word processing. RalphRoseberg provided data from Dworshak National Fish Hatchery. Mark Schuck and Art Viola, WashingtonDepartment of Fish and Wildlife, cooperated with data collection and compilation for the Snake River.The cover photo was contributed by Marsha White.

45
LITERATURE CITED
Ball, K. 1986. Evaluation of hatchery-wild steelhead harvest, December 1, 1984 to September 30, 1985.U.S. Fish and Wildlife Service Lower Snake River Compensation Plan, Contract No. 14-16-0001-85607 (RWG). Idaho Department of Fish and Game, Boise.
Ball, K. 1989. Evaluation of hatchery-wild steelhead harvest, October 1, 1986 to December 31, 1987.U.S. Fish and Wildlife Service Lower Snake River Compensation Plan, Contract No. 14-16-0001-87501 (RWG). Idaho Department of Fish and Game, Boise.
Ball, K. 1992a. Evaluation of hatchery-wild composition of Idaho salmon and steelhead harvest, October1, 1989 to December 31, 1990. U.S. Fish and Wildlife Service Lower Snake River CompensationPlan, Contract No. 14-16-0001-89501 (RWG). Idaho Department of Fish and Game, Boise.
Ball, K. 1992b. Evaluation of hatchery-wild composition of Idaho salmon and steelhead harvest, October1, 1990 to December 31, 1991. U.S. Fish and Wildlife Service Lower Snake River CompensationPlan, Contract No. 14-16-0001-89501 (RWG). Idaho Department of Fish and Game, Boise.
Ball, K. 1994. Evaluation of hatchery-wild composition of Idaho salmon and steelhead harvest, October1, 1991 to December 31, 1992. U.S. Fish and Wildlife Service Lower Snake River CompensationPlan, Idaho Department of Fish and Game, Boise.
Ball, K. 1996. Evaluation of hatchery-wild composition of Idaho salmon and steelhead harvest, October1, 1992 to December 31, 1993. U.S. Fish and Wildlife Service Lower Snake River CompensationPlan, Idaho Department of Fish and Game, Boise.
Ball, K. 1997. Evaluation of hatchery-wild composition of Idaho salmon and steelhead harvest, October1, 1993 to December 31, 1994. U.S. Fish and Wildlife Service Lower Snake River CompensationPlan, Idaho Department of Fish and Game, Boise.
Roseberg, R.B., H.L. Burge, W.H. Miller, and D. Diggs. 1991. A review of coded-wire tagged fishreleased from Dworshak, Kooskia, and Hagerman National Fish Hatcheries, 1976-1990. U.S.Fish and Wildlife Service Report. Ahsahka, Idaho.
U.S. Army Corps of Engineers, North Pacific Division. 1992. 1991 Annual Fish Passage Report,Columbia and Snake rivers for salmon, steelhead, and shad. U.S. Army Engineer Districts,Portland and Walla Walla.

46
A P P E N D I C E S

APPNDCS 47
Appendix A. Total number of steelhead by section and month harvested by resident and nonresidentanglers, fall 1994' and spring 1995a.
River Fall 1994 Steelhead HarvestSection September October November December Total
Snake R.01 29 525 525 379 1,45702 0 102 117 0 219
Subtotal 29 626 641 379 1,676
Clearwater R.03 146 1,224 1,151 699 3,22004 0 73 73 0 14605 0 29 15 15 5806 0 29 15 0 4407 0 0 15 0 15
Subtotal 146 1,355 1,268 714 3,482
Salmon R.10 15 408 364 233 1,02011 73 379 568 146 1,16612 0 233 131 44 40813 0 73 87 0 16014 0 204 219 0 42315 58 321 219 15 61216 0 15 29 0 4417 0 87 248 0 33518 0 0 0 0 019 0 15 0 0 1520 0 117 102 15 233
Subtotal 146 1,850 1,967 452 4,415
Oxbow Res. 0 44 44 73 160
Boise R. 0 0 0 0 0
Payette R. 0 0 0 0 0
StatewideTotal 321 3,876 3,919 1,617 9,732

APPNDCS 48
Appendix A. Continued.
River Spring 1995 Steelhead Harvestb
Section January February March April Total
Snake R.01 152 15 15 0 18202 15 0 45 61 121
Subtotal 167 15 61 61 303
Clearwater R.03 394 591 273 15 1,27404 0 182 30 0 21205 106 288 121 152 66706 0 0 15 0 1507 30 76 91 106 303
Subtotal 531 1,137 531 273 2,471
Salmon R.10 121 167 76 0 36411 227 379 288 30 92512 30 136 45 121 33413 0 15 45 30 9114 121 91 167 0 37915 152 394 1,152 106 1,80416 0 15 61 15 9117 0 61 394 106 56118 0 61 318 273 65219 0 0 15 30 4520 45 136 788 804 1,774
Subtotal 697 1,456 3,351 1,516 7,020
Oxbow Res. 0 0 91 0 91
Boise R. 0 0 0 0 0
Payette R. 0 0 0 0 0
StatewideTotal 1,395 2,608 4,033 1,850 9,886
a Statewide harvest survey data from Thomas J. McArthur, IDFG, (unpublished).b Statewide harvest numbers do not include steelhead harvested on Nez Perce Indian permits.

49

50
51

52

53

54

55

56

57

58

59

60

61

62

63

64

65

66

67

68

69

70

71

72
73
74

75

76

77

78

79

80
81

82
83
84

85

86

87

88
89

90

91

92

93

94

95

96

97

98

99

100

101

102

103

104

105

106

107

108

109

APPNDCS 110
Appendix C. Steelhead groups returning to the Salmon River, 1994-95.
No. of HatcheryStrain Age Fish Release Site Rearing Marks
A I 19,196 Sawtooth Hatchery HNFHa CWT 10/49/49b
A I 18,168 Sawtooth Hatchery HNFH CWT 10/49/50b
A I 17,818 Sawtooth Hatchery HNFH CWT 10/49/51b
A I 8,161 Sawtooth Hatchery HNFH CWT 10/50/10
A I 20,262 Sawtooth Hatchery HNFH CWT 10/50/20
A I 18,726 Sawtooth Hatchery HNFH CWT 10/50/21
A I 18,235 Sawtooth Hatchery HNFH CWT 10/50/22
A I 4,563 Sawtooth Hatchery HNFH CWT 10/50/34
A I 604,391 Sawtooth Hatchery HNFH Noneb
A I 19,924 Salmon R. @ Challis MVSHc CWT 10/50/11
A I 240,676 Salmon R. @ Challis MVSH Noneb
A I 20,882 Pahsimeroi R. NSPRd CWT 10/43/12
A I 19,736 Pahsimeroi R. NSPR CWT 10/44/10
A I 19,418 Pahsimeroi R. NSPR CWT 10/44/11
A I 19,547 Pahsimeroi R. NSPR CWT 10/44/24
A I 19,096 Pahsimeroi R. NSPR CWT 10/44/25
A I 19,584 Pahsimeroi R. NSPR CWT 10/44/26
A I 643,537 Pahsimeroi R. NSPR Noneb
A I 19,778 Salmon R. @ Ellis Br. MVSH CWT 10/50/14
A I 20,361 Salmon R. @ Ellis Br. MVSH CWT 10/50/16
A I 226,161 Salmon R. @ Ellis Br. MVSH Noneb
A I 22,106 Salmon R. @ Lemhi R. MVSH CWT 10/50/12
A I 19,692 Salmon R. @ Lemhi R. MVSH CWT 10/50/13
A I 21,390 Salmon R. @ Lemhi R. MVSH CWT 10/50/15
A I 135,312 Salmon R. @ Lemhi R. MVSH Noneb
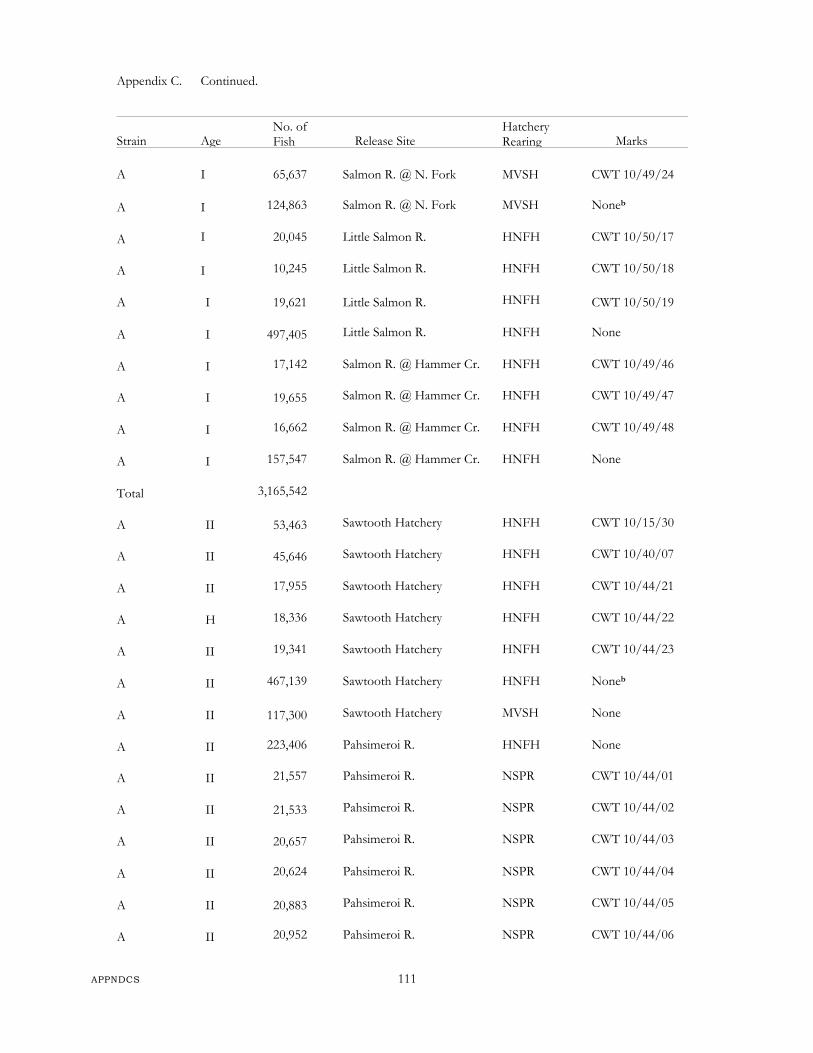
APPNDCS 111
Appendix C. Continued.
Strain AgeNo. ofFish Release Site
HatcheryRearing Marks
A I 65,637 Salmon R. @ N. Fork MVSH CWT 10/49/24
A I 124,863 Salmon R. @ N. Fork MVSH Noneb
A I 20,045 Little Salmon R. HNFH CWT 10/50/17
A I 10,245 Little Salmon R. HNFH CWT 10/50/18
A I 19,621 Little Salmon R. HNFH CWT 10/50/19
A I 497,405 Little Salmon R. HNFH None
A I 17,142 Salmon R. @ Hammer Cr. HNFH CWT 10/49/46
A I 19,655 Salmon R. @ Hammer Cr. HNFH CWT 10/49/47
A I 16,662 Salmon R. @ Hammer Cr. HNFH CWT 10/49/48
A I 157,547 Salmon R. @ Hammer Cr. HNFH None
Total 3,165,542
A II 53,463 Sawtooth Hatchery HNFH CWT 10/15/30
A II 45,646 Sawtooth Hatchery HNFH CWT 10/40/07
A II 17,955 Sawtooth Hatchery HNFH CWT 10/44/21
A H 18,336 Sawtooth Hatchery HNFH CWT 10/44/22
A II 19,341 Sawtooth Hatchery HNFH CWT 10/44/23
A II 467,139 Sawtooth Hatchery HNFH Noneb
A II 117,300 Sawtooth Hatchery MVSH None
A II 223,406 Pahsimeroi R. HNFH None
A II 21,557 Pahsimeroi R. NSPR CWT 10/44/01
A II 21,533 Pahsimeroi R. NSPR CWT 10/44/02
A II 20,657 Pahsimeroi R. NSPR CWT 10/44/03
A II 20,624 Pahsimeroi R. NSPR CWT 10/44/04
A II 20,883 Pahsimeroi R. NSPR CWT 10/44/05
A II 20,952 Pahsimeroi R. NSPR CWT 10/44/06

APPNDCS 112
Appendix C. Continued.
No. of HatcheryStrain Age Fish Release Site Rearing Marks
A II 376,974 Pahsimeroi R. NSPR Noneb
A II 21,091 Little Salmon R. MVSH CWT 10/44/15
A II 22,223 Little Salmon R. MVSH CWT 10/44/16
A II 21,604 Little Salmon R. MVSH CWT 10/44/17
A II 936,982 Little Salmon R. MVSH Noneb
A II 282,300 Salmon R. @ Hammer Cr. NSPR None
Total 2,749,966
B I 187,100 Slate Cr. MVSH None
B I 16,024 E. Fork Salmon R. MVSH CWT 10/50/05
B I 18,924 E. Fork Salmon R. MVSH CWT 10/50/07
B I 19,128 E. Fork Salmon R. MVSH CWT 10/50/09
B I 87,272 E. Fork Salmon R. MVSH Noneb,e
B I 356,052 E. Fork Salmon R. MVSH None.b,f
B I 19,358 Little Salmon R. MVSH CWT 10/50/04
B I 19,932 Little Salmon R. MVSH CWT 10/50/06
B I 19,909 Little Salmon R. MVSH CWT 10/50/08
B I 266,101 Little Salmon R. MVSH Noneb
Total 1,009,800
B II 302,335 East Fork Salmon R. HNFH None
B II 21,771 East Fork Salmon R. MVSH CWT 10/44/18f
B II 21,568 East Fork Salmon R. MVSH CWT 10/44/19f
B II 20,821 East Fork Salmon R. MVSH CWT 10/44/20e
B II 63,979 East Fork Salmon R. MVSH None.b,e
B II 913,061 East Fork Salmon R. MVSH Noneb,f

APPNDCS 113
Appendix C. Continued.
No. of HatcheryStrain Age Fish Release Site Rearing Marks
B II 18,702 Little Salmon R. HNFH CWT 10/44/07
B II 19,835 Little Salmon R. HNFH CWT 10/44/08
B II 17,847 Little Salmon R. HNFH CWT 10/44/09
B II 244,150 Little Salmon R. HNFH None
Total 1,644,069
B III 20,498 East Fork Salmon R. MVSH CWT 10/43/14f
B III 21,017 East Fork Salmon R. MVSH CWT 10/43/15f
B III 20,312 East Fork Salmon R. MVSH CWT 10/43/16f
B III 22,525 East Fork Salmon R. MVSH CWT 10/43/20e
B III 22,483 East Fork Salmon R. MVSH CWT 10/43/21e
B III 21,375 East Fork Salmon R. MVSH CWT 10/43/22e
B III 267,567 East Fork Salmon R. MVSH Nonee
B III 570,523 East Fork Salmon R. MVSH Noneb,f
B III 540,733 East Fork Salmon R. HNFH Noneg
B III 19,831 Little Salmon R. HNFH CWT 10/43/32
B III 19,813 Little Salmon R. HNFH CWT 10/43/39
B III 18,877 Little Salmon R. HNFH CWT 10/43/40
B III 398,589 Little Salmon R. HNFH Noneb
B III 120,323 Little Salmon R. HNFH Noneg
Total 2,084,466
a HNFH = Hagerman National Fish Hatchery.b Release group includes fish marked with passive integrated transponder (PIT) tags.c MVSH = Magic Valley Steelhead Hatchery.d NSPR = Niagara Springs Fish Hatchery.e East Fork Salmon River stock.f Dworshak National Fish Hatchery stock.g Fall release of subsmolts.

APPNDCS 114
Appendix D. Steelhead groups returning to the Clearwater River, 1994-95.
No. of HatcheryStrain Age Fish Release Site Rearing Marks
B I 16,214 Clearwater R. DNFHa CWT 05/20/50
B I 20,579 Clearwater R. DNFH CWT 05/20/51
B I 20,779 Clearwater R. DNFH CWT 05/20/52
B I 20,258 Clearwater R. DNFH CWT 05/21/57
B I 20,886 Clearwater R. DNFH CWT 05/21/58
B I 19,800 Clearwater R. DNFH CWT 05/21/59
B I 21,144 Clearwater R. DNFH CWT 05/21/60
B I 20,780 Clearwater R. DNFH CWT 05/21/61
B I 1,168,550 Clearwater R. DNFH None
B I 25,673 South Fork Clearwater R. CAFHb CWT 10/29/47
B I 22,003 South Fork Clearwater R. CAFH CWT 10/49/37
B I 21,340 South Fork Clearwater R. CAFH CWT 10/49/38
B I 257,284 South Fork Clearwater R. CAFH Nonec
B I 63,803 South Fork Clearwater R. DNFH CWT 05/29/37
B I 675,826 South Fork Clearwater R. DNFH None
Total 2,394,919
B II 20,645 Clearwater R. DNFH CWT 05/24/19
B II 20,705 Clearwater R. DNFH CWT 05/24/20
B II 20,709 Clearwater R. DNFH CWT 05/24/23
B II 20,039 Clearwater R. DNFH CWT 05/26/46
B II 1,141,397 Clearwater R. DNFH None
B II 349,210 Clearwater R.@ Clear Cr. DNFH None
B II 19,909 South Fork Clearwater R. DNFH CWT 05/24/21

APPNDCS 114
Appendix D. Steelhead groups returning to the Clearwater River, 1994-95.
Strain AgeNo. ofFish Release Site
HatcheryRearing Marks
B I 16,214 Clearwater R. DNFHa CWT 05/20/50
B I 20,579 Clearwater R. DNFH CWT 05/20/51
B I 20,779 Clearwater R. DNFH CWT 05/20/52
B I 20,258 Clearwater R. DNFH CWT 05/21/57
B I 20,886 Clearwater R. DNFH CWT 05/21/58
B I 19,800 Clearwater R. DNFH CWT 05/21/59
B I 21,144 Clearwater R. DNFH CWT 05/21/60
B I 20,780 Clearwater R. DNFH CWT 05/21/61
B I 1,168,550 Clearwater R. DNFH None
B I 25,673 South Fork Clearwater R. CAFHb CWT 10/29/47
B I 22,003 South Fork Clearwater R. CAFH CWT 10/49/37
B I 21,340 South Fork Clearwater R. CAFH CWT 10/49/38
B I 257,284 South Fork Clearwater R. CAFH None`
B 63,803 South Fork Clearwater R. DNFH CWT 05/29/37
B 675,826 South Fork Clearwater R. DNFH None
Total 2,394,919
B 20,645 Clearwater R. DNFH CWT 05/24/19
B H 20,705 Clearwater R. DNFH CWT 05/24/20
B II 20,709 Clearwater R. DNFH CWT 05/24/23
B II 20,039 Clearwater R. DNFH CWT 05/26/46
B II 1,141,397 Clearwater R. DNFH None
B II 349,210 Clearwater R.@ Clear Cr. DNFH None
B II 19,909 South Fork Clearwater R. DNFH CWT 05/24/21

APPNDCS 115
Appendix D. Continued.
No. of HatcheryStrain Age Fish Release Site Rearing Marks
B II 20,499 South Fork Clearwater R. DNFH CWT 05/24/22
B II 695,333 South Fork Clearwater R. DNFH None
Total 2,308,446
B III 210,874 American R. DNFH None
B III 19,773 Clearwater R. DNFH CWT 05/24/24
B III 20,320 Clearwater R. DNFH CWT 05/24/25
B III 19,858 Clearwater R. DNFH CWT 05/24/26
B III 19,515 Clearwater R. DNFH CWT 05/24/27
III 20,547 Clearwater R. DNFH CWT 05/24/28
B III 20,499 Clearwater R. DNFH CWT 05/24/29
B III 20,293 Clearwater R. DNFH CWT 05/24/30
III 1,051,698 Clearwater R. DNFH None
B III 369,190 Clearwater R.@ Clear Cr. DNFH None
B III 201,847 Eldorado Cr. (Lolo Cr.) DNFH None
B III 213,827 Red R. DNFH None
B III 467,757 South Fork Clearwater R. DNFH None
Total 2,655,998
a DNFH = Dworshak National Fish Hatchery.b CAFH = Clearwater Anadromous Fish Hatchery.c Release group includes fish marked with passive integrated transponder (PIT) tags.

APPNDCS 116
Appendix E. Miscellaneous coded wire tag steelhead groups that were recovered by Idaho anglers,1994-95.
No. of
A I 23,277 Wallowa R. @ Big Canyon ODFWa CWT 07/61/04
A I 24,821
Cr.
Wallowa R. @ Big Canyon ODFW CWT 07/61/05
bI 9,083
Cr.
Columbia R. @ RM 18.2 NMFSc CWT 23/24/45
bI 9,885 Columbia R. @ RM 141 NMFS CWT 23/30/11
A I 21,916 Curl Lake (Tucannon R.) WDFWd CWT 63/48/15
A I 29,701 Curl Lake (Tucannon R.) WDFW CWT 63/48/16
A I 29,517 Tucannon R. WDFW CWT 63/48/17
A I 19,323 Walla Walla R. WDFW CWT 63/59/42
II 9,199 Columbia R. @ RM 141 NMFS CWT 23/24/45
II 9,571 Columbia R. @ RM 141 NMFS CWT 23/24/46
A II 28,946 Curl Lake (Tucannon R.) WDFW CWT 63/42/63
A Ii 20,104 Touchet R. WDFW CWT 63/40/61
a ODFW = Oregon Department of Fish and Wildlife.b Mixed hatchery stocks released in 1993; strain unknown.c NMFS = National Marine Fisheries Service.d WDFW = Washington Department of Fish and Wildlife.e Mixed hatchery stocks released in 1992; strain unknown.f A tag recovery from the 1991 release year; the juvenile fish held in freshwater two years before
migrating to the ocean.