Evaluation of greenhouse gas emissions from municipal …Evaluation...emissions from municipal UASB...
44
Evaluation of greenhouse gas emissions from municipal UASB wastewater treatment plants Original authors: B. Heffernan, J. Blanc, H. Spanjers Jan Pereboom Biothane Systems International Tel: +31.(0).15.27.00.121 E-Mail: [email protected]
Transcript of Evaluation of greenhouse gas emissions from municipal …Evaluation...emissions from municipal UASB...

Evaluation of greenhouse gas
emissions from municipal UASB
wastewater treatment plants
Original authors: B. Heffernan, J. Blanc, H. Spanjers
Jan Pereboom
Biothane Systems InternationalTel: +31.(0).15.27.00.121E-Mail: [email protected]

Contents
1. Introduction
2. Methods
3. Carbon footprint
4. OPEX
5. Conclusions
2
Introduction
1
4
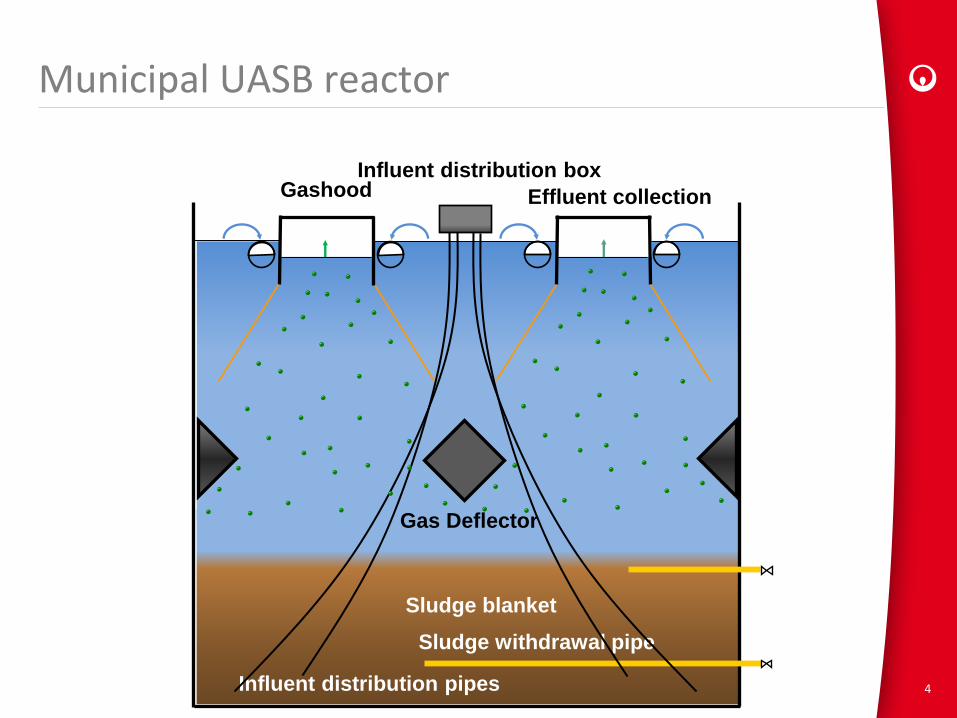
Municipal UASB reactor
Sludge withdrawal pipe
Influent distribution pipes
GashoodInfluent distribution box
Gas Deflector
Sludge blanket
Effluent collection

Typical UASB process diagram
5
Sludge thickener Anaerobic digester Centrifuge
Sludge disposal
Biogas holder Electricity
Treated waterFinal settlerActivated sludgeUASB reactor
Raw wastewater
Influent pumping Coarse and fine screens Aerated grit chamber
Biogas scrubber Biogas flare

COD Conversion – Anaerobic vs Aerobic
Carbon Dioxide
Biomass
BODAir (O2)
Aerobic100 kg COD
Sludge, 30-40 kg COD
Heat loss
2-10 kg COD
BOD(25OC – 35OC)
Anaerobic100 kg COD
Biogas50-60 kg COD
Sludge 15-20 kg COD
30-40 kg COD
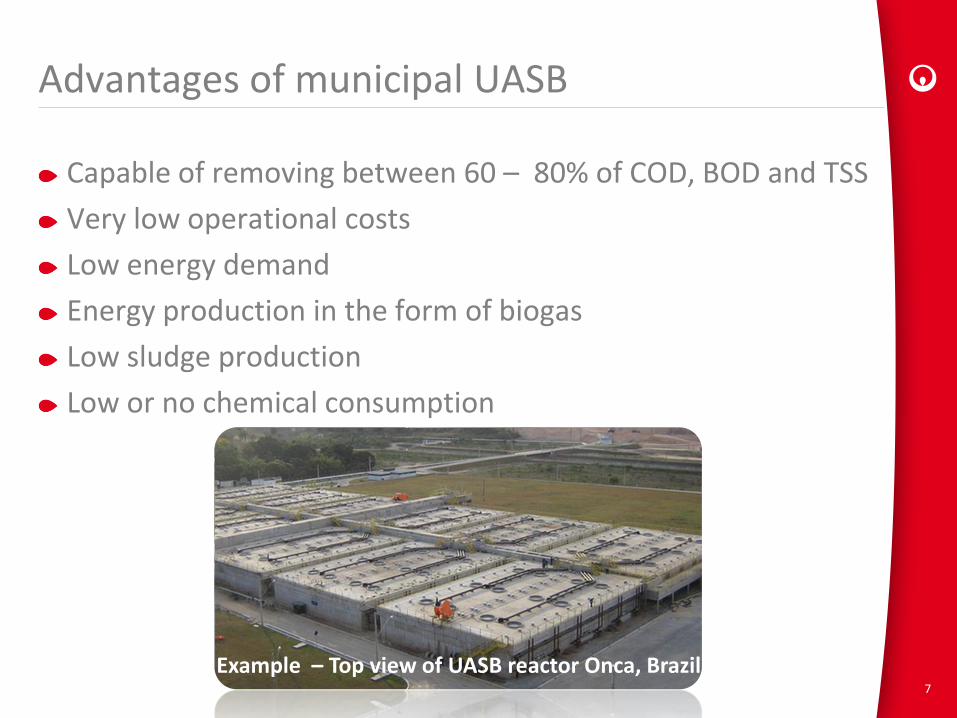
Advantages of municipal UASB
Capable of removing between 60 – 80% of COD, BOD and TSS
Very low operational costs
Low energy demand
Energy production in the form of biogas
Low sludge production
Low or no chemical consumption
7
Example – Top view of UASB reactor Onca, Brazil

SouthAmerica
Europe
North Asia
EastAsia
Southeast Asia
Oceania
South Asia
NorthAmerica
North America
South America
Africa
Middle East
12-56-50
Central Asia
Countries with municipal UASB treatment plants
The municipal UASB market
8Largest plant constructed to date 340 MLD (2009 India)

Countries with municipal UASB treatment plants
The municipal UASB market
9
74%
17%
3%
2%
1%1%
1%1%
India Brazil Mexico Columbia UAE Pakistan Honduras Indonesia Egypt
Largest plant constructed to date 340 MLD (2009 India)

10.012.014.016.018.020.022.024.026.028.030.0
5 10 15 20 25 30 35 40Dis
solv
ed
met
han
e c
on
cen
trat
ion
(m
g/l)
Temperature
Dissolved methane concentration as a function of temperature
Methane has a low solubility
Dissolved Methane estimations by Henry’s Law• Methane conc. (70 – 80%); Atmospheric 1 Bar; “Ambient” Temperature
Dissolved methane in effluent of municipal UASBs

COD determines Methane in effluent
11
Parameter Sewage Brewery Units
Flow 50,000 6,000 m3/d
COD 500 3,000 mg/l
Temperature 20 35 °C
Dissolved CH4 20 17 mg/l
Digested COD 55% 80% mg COD/l
Effluent COD 20% 15% mg COD/l
Sludge COD 25% 5% mg COD/l
Dissolved Methane in UASB effluents

COD determines Methane in effluent
12
Dissolved Methane in UASB effluents
29%
71%
Sewage
CH4 effluent CH4 gas phase
3%
97%
Brewery
CH4 effluent CH4 gas phase

Dissolved Methane in municipal UASB effluents
Up to 25 – 40% of the produced Methane in effluent• CH4 is a potent green house gas
• Valuable Energy is lost
13

Methods
2
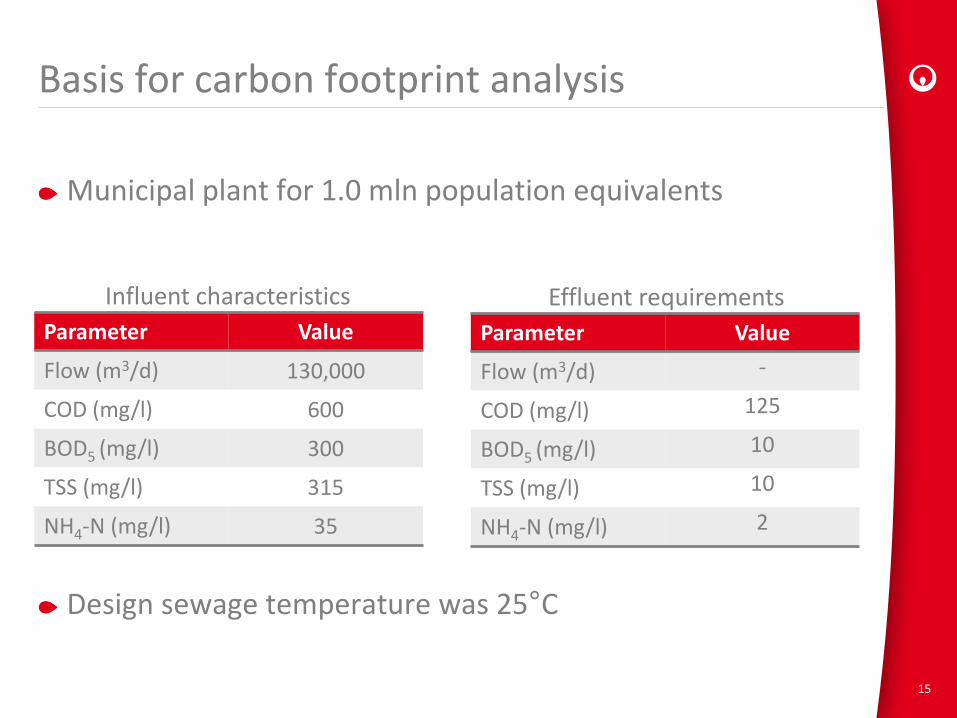
Basis for carbon footprint analysis
Municipal plant for 1.0 mln population equivalents
Design sewage temperature was 25°C
Parameter Value
Flow (m3/d) 130,000
COD (mg/l) 600
BOD5 (mg/l) 300
TSS (mg/l) 315
NH4-N (mg/l) 35
Parameter Value
Flow (m3/d) -
COD (mg/l) 125
BOD5 (mg/l) 10
TSS (mg/l) 10
NH4-N (mg/l) 2
Influent characteristics Effluent requirements
15
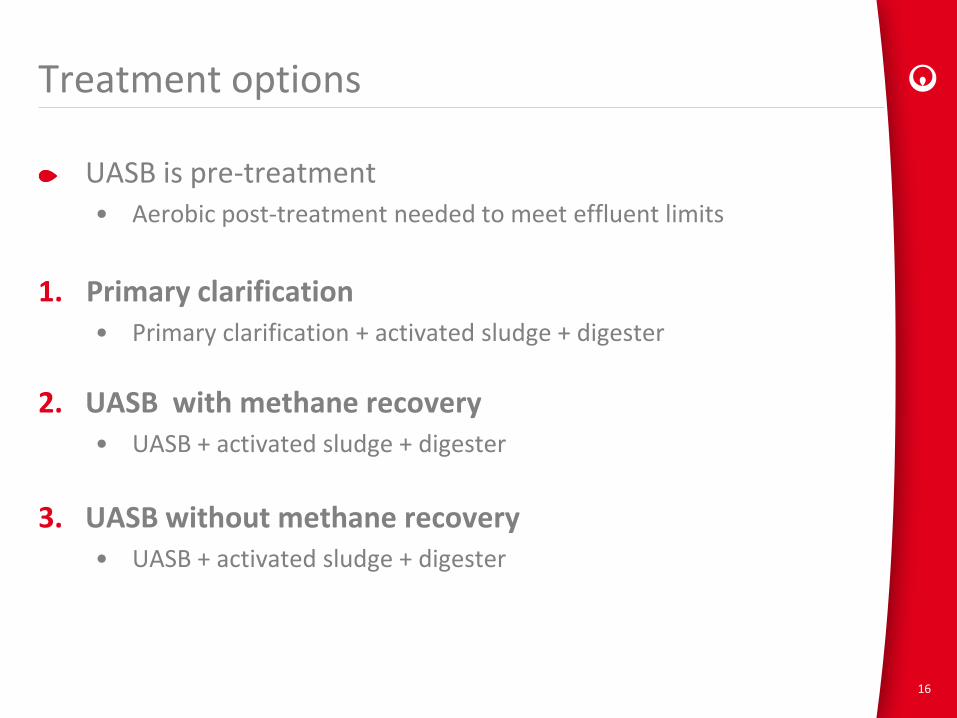
Treatment options
UASB is pre-treatment • Aerobic post-treatment needed to meet effluent limits
1. Primary clarification• Primary clarification + activated sludge + digester
2. UASB with methane recovery• UASB + activated sludge + digester
3. UASB without methane recovery• UASB + activated sludge + digester
16

Treatment options
1. Primary clarification• Primary and secondary sludge are digested anaerobic
• Biogas is used for energy production
SettlerAerobic reactor
Screened and degritted sewage
Biogas engine
Primary clarifier
Dewatering unit
Sludge digester
17
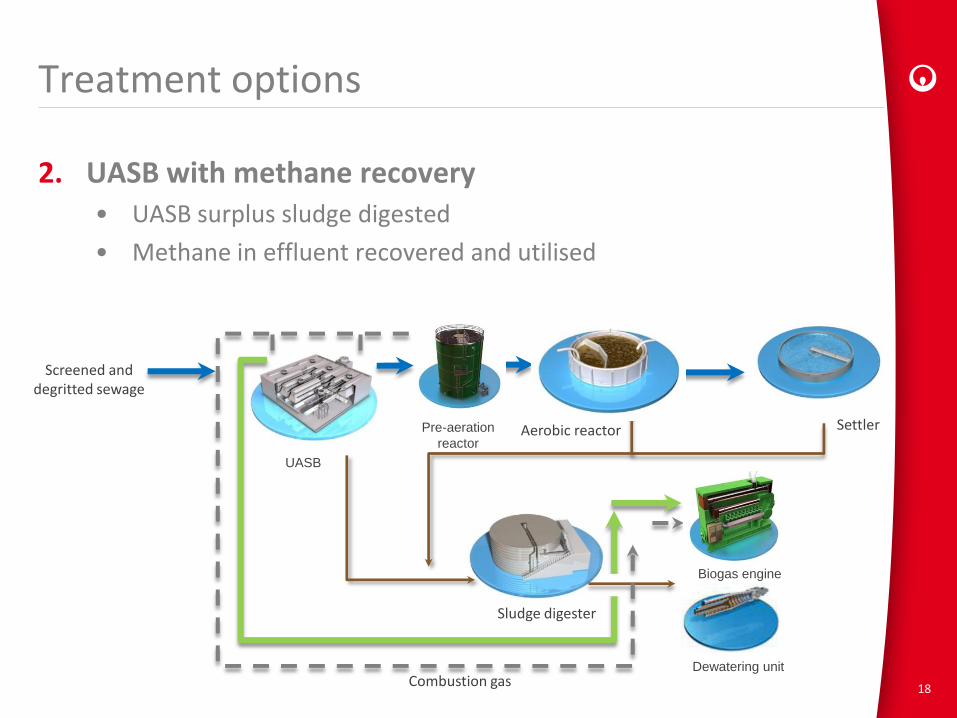
Treatment options
2. UASB with methane recovery• UASB surplus sludge digested
• Methane in effluent recovered and utilised
18
Sludge digester
SettlerAerobic reactor
Screened and degritted sewage
Biogas engine
UASB
Dewatering unit
Pre-aeration
reactor
Combustion gas
Treatment options
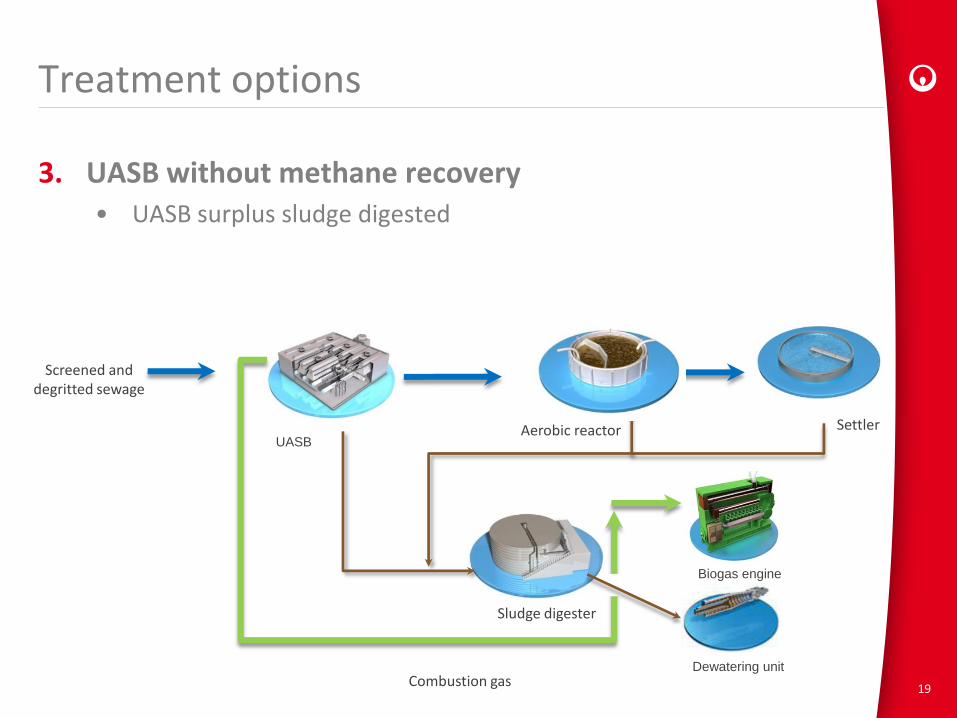
3. UASB without methane recovery• UASB surplus sludge digested
19
Sludge digester
SettlerAerobic reactor
Screened and degritted sewage
Biogas engine
UASB
Dewatering unitCombustion gas

Emissions considered in carbon footprint
Upstream activities:
• The electricity emissions factor is country specific
• The emission factor for the UAE is 0.82 kg CO2 eq/kWh
• Electricity is used on site – excess is sent to grid
Chemical consumption (polymer)
Onsite activities:
• Distributed CH4 loss estimated at 1% for all three configurations
Downstream
• Sludge disposed to landfill with no CH4 recovery
20

Emissions not considered in carbon footprint
Upstream activities :
• Plant construction ; usually > 5% of emissions over lifetime
• CO2 produced in the treatment process (short cycle)
• N2O emissions (Ahn et al., 2010)
21

Direct and avoided emissions
Direct emissions are all green house gas emissions from STP:• Electricity generation
• Chemical consumption
Avoided emissions by sold by-products• Excess electricity that is sold to the grid
• Fertilizer based on removed N+P
Direct emissions are a positive number avoided are negative
22

Results
3
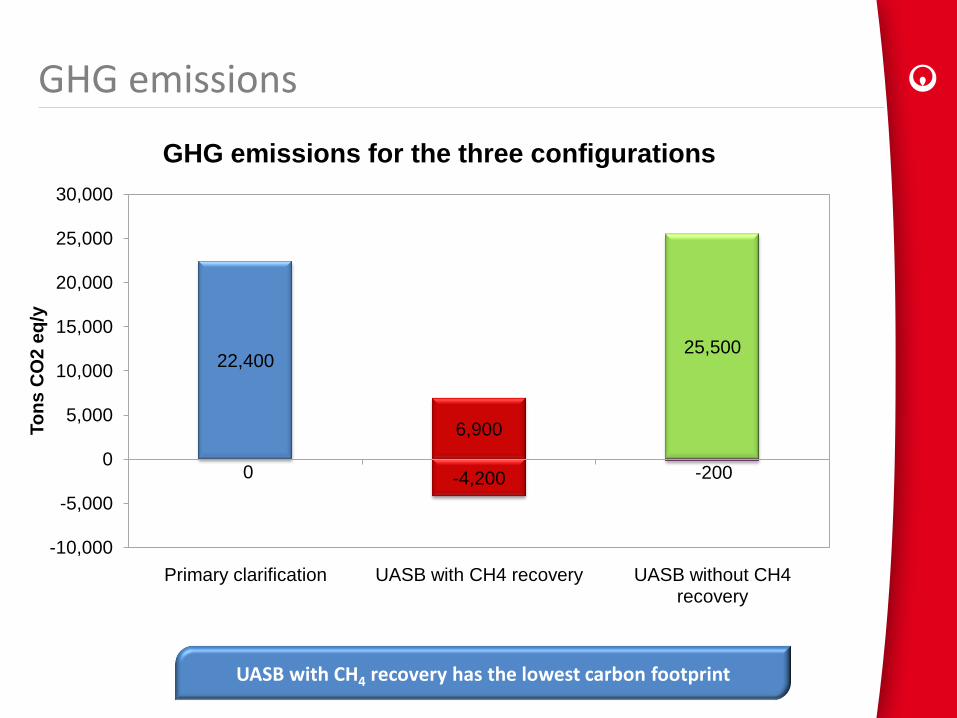
GHG emissions
UASB with CH4 recovery has the lowest carbon footprint
22,400
6,900
25,500
0 -4,200 -200
-10,000
-5,000
0
5,000
10,000
15,000
20,000
25,000
30,000
Primary clarification UASB with CH4 recovery UASB without CH4 recovery
To
ns
CO
2 e
q/y
GHG emissions for the three configurations

-10,000
-5,000
0
5,000
10,000
15,000
20,000
25,000
30,000
Primary clarification UASB with CH4 recovery UASB without CH4 recovery
To
ns C
O2
eq
/y
India - High carbon power (0.994 kg CO2 eq/kWh)
Energy Process Reagents Sludge Avoided Emissions
Influence of electrical emission factor
25

-5,000
0
5,000
10,000
15,000
20,000
25,000
30,000
Primary clarification UASB with CH4 recovery UASB without CH4 recovery
To
ns C
O2
eq
/y
Brazil - low carbon power (0.081 kg CO2 eq/kWh)
Energy Process Reagents Sludge Avoided Emissions
Influence of electrical emission factor
26

OPEX cost estimation
4

Basis for cost comparison
Cost price of electricity 0.12 $/kWh
Sales price of electricity 0.06 $/kWh
Sludge disposal cost 120 $/ton dry solids
Polymer dosing rate 10 kg PE/ton dry solids
Polymer cost 4500 $/ton PE
Technology Development
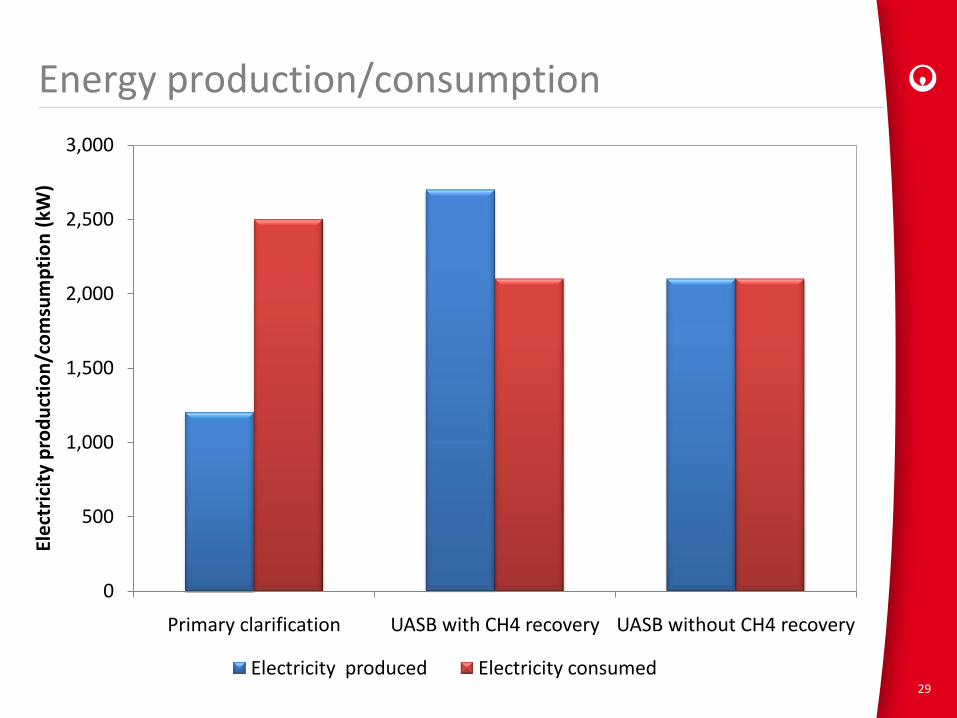
Energy production/consumption
29
0
500
1,000
1,500
2,000
2,500
3,000
Primary clarification UASB with CH4 recovery UASB without CH4 recovery
Ele
ctri
city
pro
du
ctio
n/c
om
sum
pti
on
(kW
)
Electricity produced Electricity consumed

OPEX
30
$2,390,385
-$92,528
$222,833
-$500,000
$0
$500,000
$1,000,000
$1,500,000
$2,000,000
$2,500,000
$3,000,000
Primary clarification UASB with CH4 recovery UASB without CH4 recovery
OP
EX (
US$
/yr)
Total Electricity cost Sludge disposal cost Polymer cost
Conclusions
4

Conclusions
The carbon footprint of a municipal UASB is worse than a conventional aerobic treatment plant
Methane recovery can make municipal UASB systems better than conventional aerobic treatment plants
Sludge disposal is an important consideration for the carbon footprint of a treatment plant
Methane recovery is also cost effective
32

Conclusions
Thank you for your attention
Questions
33

Limitations of municipal UASB
COD/SO4 ratio below 3 –Organic COD is converted to inorganic COD (H2S) in the UASB.
Strict nitrogen limits
Temperature –Below 15°C, the rate of anaerobic digestion is very low
Methane dissolved in effluent
34
Example – Top view of UASB reactor Onca, Brazil
SouthAmerica
NorthAmerica
UASB applicable
UASB non-applicable
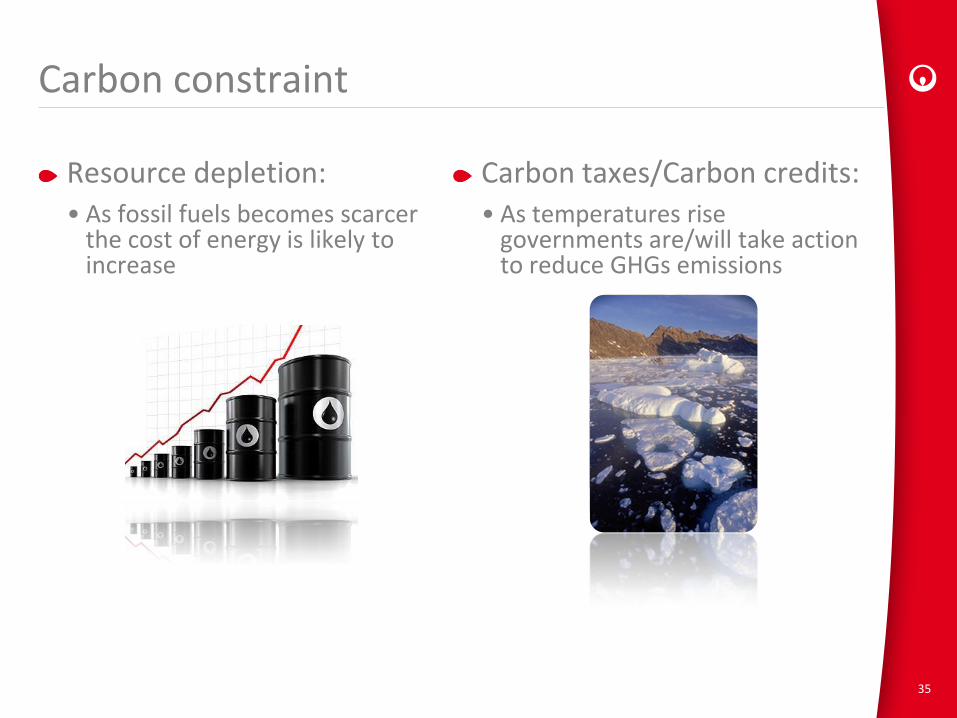
Carbon constraint
Resource depletion:• As fossil fuels becomes scarcer
the cost of energy is likely to increase
35
Carbon taxes/Carbon credits:• As temperatures rise
governments are/will take action to reduce GHGs emissions

Detailed GHG emissions
Detailed breakdown of sources of CO2 emissions
43%
2% 2%
53%
0
22,370
-5,000
0
5,000
10,000
15,000
20,000
25,000
30,000
Energy Process Reagents Sludge Avoided Emissions
Total
Ton
s C
O2
eq
/y
Primary clarification

0% 20.5% 2%
77.5%
-4,200
6,850
-5,000
0
5,000
10,000
15,000
20,000
25,000
30,000
Energy Process Reagents Sludge Avoided Emissions
Total
Ton
s C
O2
eq
/y
UASB with CH4 recovery
Detailed GHG emissions
Detailed breakdown of sources of CO2 emissions

0
79%
0.5%
20.5%
-200
25,450
-5,000
0
5,000
10,000
15,000
20,000
25,000
30,000
Energy Process Reagents Sludge Avoided Emissions
Total
To
ns C
O2
eq
/y
UASB without CH4 recovery
Detailed GHG emissions
Detailed breakdown of sources of CO2 emissions

0.79
0.24
0.90
0.00
0.20
0.40
0.60
0.80
1.00
1.20
1.40
1.60
1.80
PC+AS UASBre+AS UASBno+AS
kg C
O2
eq
/kg
CO
D
Present study Keller and Hartely
Comparison with literature results
39
0.79
0.24
0.90
1.58
1.04
1.46
0.00
0.20
0.40
0.60
0.80
1.00
1.20
1.40
1.60
1.80
PC+AS UASBre+AS UASBno+AS
kg C
O2
eq
/kg
CO
D
Present study Keller and Hartely
Influence of electrical emission factor
40
SouthAmerica
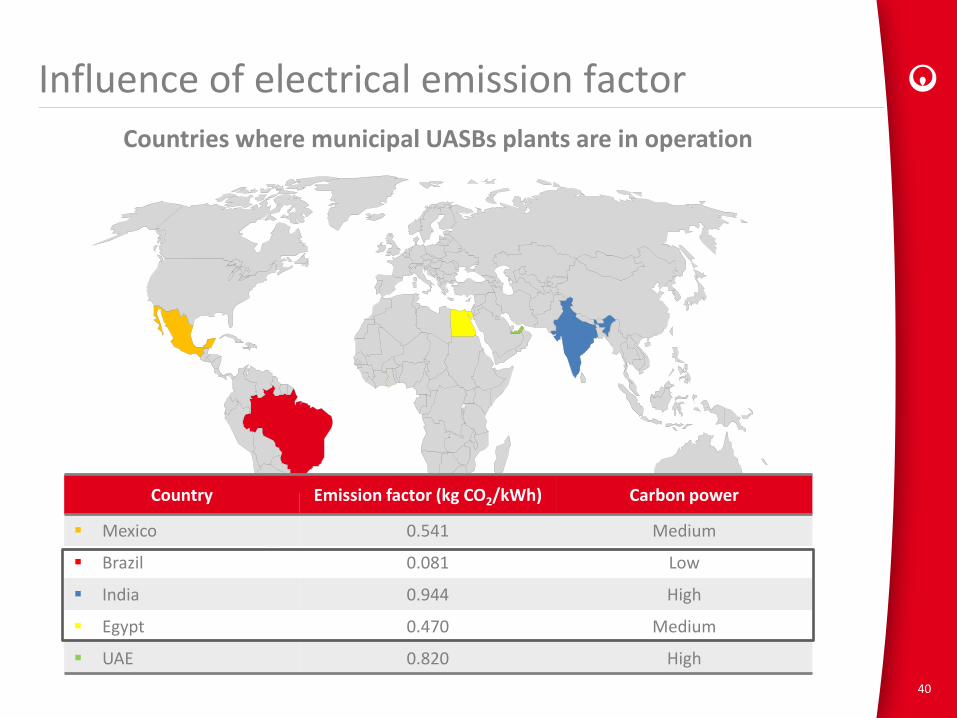
NorthAmerica
Country Emission factor (kg CO2/kWh) Carbon power
Mexico 0.541 Medium
Brazil 0.081 Low
India 0.944 High
Egypt 0.470 Medium
UAE 0.820 High
Countries where municipal UASBs plants are in operation

Influence of electrical emission factor
Electrical emission factor• Varies depending on how electricity is produced
Country fuel mix determines the electrical emission factor
Three Electrical emission factor categories:• High carbon power
• Medium carbon power
• Low carbon power
41

Influence of electrical emission factor
42
-5,000
0
5,000
10,000
15,000
20,000
25,000
30,000
Primary clarification UASB with CH4 recovery UASB without CH4 recovery
To
ns C
O2
eq
/y
Egypt - medium carbon power (0.447 kg CO2 eq/kWh)
Energy Process Reagents Sludge Avoided Emissions
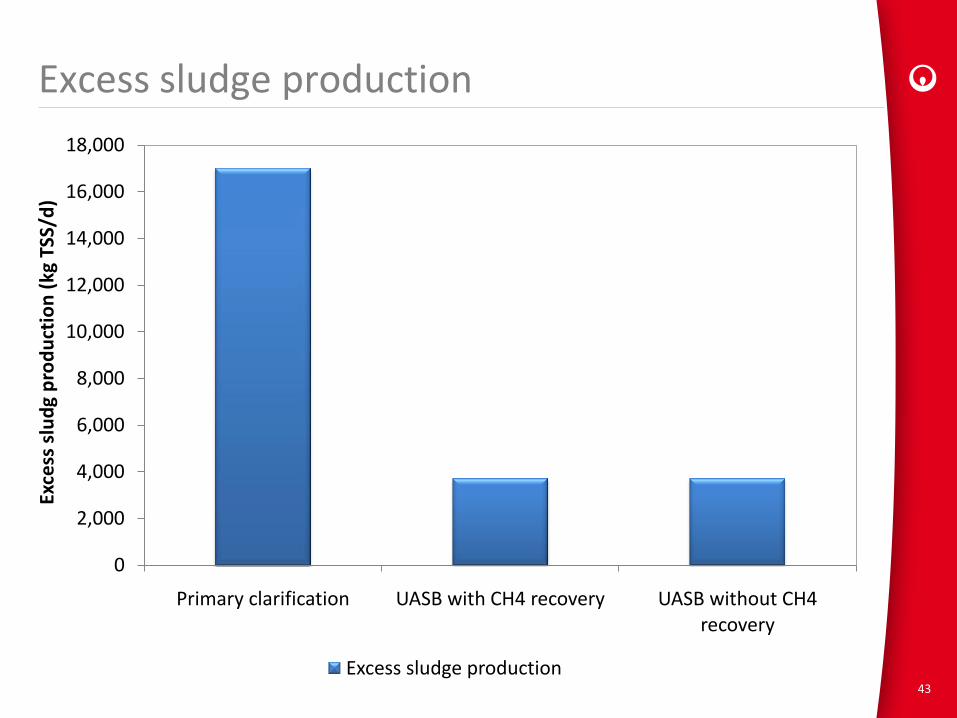
Excess sludge production
43
0
2,000
4,000
6,000
8,000
10,000
12,000
14,000
16,000
18,000
Primary clarification UASB with CH4 recovery UASB without CH4 recovery
Exce
ss s
lud
g p
rod
uct
ion
(kg
TSS
/d)
Excess sludge production

Polymer dosing
44
0
10
20
30
40
50
60
70
Primary clarification UASB with CH4 recovery UASB without CH4 recovery
Po
lym
er
do
sin
g (T
on
/y)
Polymer use