
Evaluation of FRP Repair Method for Cracked Bridge Members
68
Research, Development and Technology University of Missouri-Rolla MoDOT RDT 04-024 Evaluation of FRP Repair Method for Cracked Bridge Members January, 2005 RI 02-008
Transcript of Evaluation of FRP Repair Method for Cracked Bridge Members

Research, Development and Technology
University of Missouri-Rolla
MoDOT
RDT 04-024
Evaluation of FRP Repair Methodfor Cracked Bridge Members
January, 2005
RI 02-008

Technical Report Documentation Page 1. Report No. RDT04-024
2. Government Accession No.
3. Recipient’s Catalog No.
5. Report Date January 2005
4. Title and Subtitle Evaluation of FRP Repair Method For Cracked Bridge Members
6. Performing Organization Code UMR
7. Author/s S.E. Phillis, R. Parretti, and A. Nanni
8. Performing Organization Report No. RI02-008 10. Work Unit No. (TRAIS)
9. Performing Organization Name and Address Center for Infrastructure Engineering Studies University of Missouri - Rolla 223 ERL, Rolla, MO 65409 11. Contract or Grant No.
13. Type of report and period covered Technical Report; 2003-04
12. Sponsoring Organization Name and Address Missouri department of Transportation Jefferson City, MO University Transportation Center 223 Engineering Research Lab., Rolla, MO 65409-0710
14. Sponsoring Agency Code MODOT, UTC
15. Supplementary Notes 16. Abstract
This research program was undertaken to investigate the effects Carbon Fiber Reinforced Polymers (CFRP) have on the shear strength on under-reinforced, lab-scale prestressed concrete (PC) bridge girders. Many bridges in the states of Missouri and Kansas are structurally deficient and require either repair or replacement to ensure functionality. CFRP can offer a cost and time effective solution to these problems.
For this purpose six (6) lab-scale PC bridge tee-girders were constructed for testing. Two girders were
shear sufficient according to today’s standards. The remaining four (4) girders were shear deficient and required upgrade in order to achieve the same level of shear capacity as the "shear-sufficient girders". The shear strengthening of these girders was performed using CFRP laminates applied by manual lay-up and Near Surface Mounted (NSM) CFRP bars. All beams, with exception of the control one (i.e., a shear-deficient beam), were also strengthened in flexure using CFRP laminates.
The observed failure mode of all strengthened beams was CFRP debonding. The flexural FRP laminate
on each girder debonded before other failure modes could be experienced. Despite this, the three shear-strengthened girders did achieve a significant increase in load capacity over the control girder. Compared with the analytical prediction according to existing design guidelines, the shear-strengthened girders showed load carrying capacities equal to 1.01, 0.97 and 0.87 of the predicted value. Had flexural FRP laminate debonding not been the cause of failure, a closer match with prediction would have been possible. 17. Key Words Bridge Girder, Carbon Fibers, Debonding, Fiber Reinforced Polymers, Prestressed Concrete, Shear, Strengthening.
18. Distribution Statement No restrictions. This document is available to the public through NTIC, Springfield, VA 22161
19. Security Classification (of this report) Unclassified
20. Security Classification (of this page) Unclassified
21. No. of Pages
Form DOT F 1700.7 (8-72) Reproduction of form and completed page is authorized

RESEARCH INVESTIATION
EVALUATION OF FRP REPAIR METHOD FOR CRACKED BRIDGE
MEMBERS
PREPARED FOR THE
MISSOURI DEPARTMENT OF TRANSPORTATION
CIES
04-xxx
IN COOPERATION WITH THE
UNIVERSITY TRANSPORTATION CENTER
Written By:
Sarah E. Phillis
Renato Parretti
Antonio Nanni
CENTER FOR INFRASTRUCTURE ENGINEERING STUDIES
UNIVERSITY OF MISSOURI – ROLLA
Submitted October 2004
The opinions, findings and conclusions expressed in this report are those of the principal investigators. They are not necessarily those of the Missouri Department of Transportation, U.S. Department of Transportation, Federal
Highway Administration. This report does not constitute a standard, specification or regulation.

EVALUATION OF FRP REPAIR METHOD FOR CRACKED BRIDGE MEMBERS
Executive Summary
This research program was undertaken to investigate the effects Carbon Fiber Reinforced
Polymers (CFRP) have on the shear strength on under-reinforced, lab-scale prestressed concrete
(PC) bridge girders. Many bridges in the states of Missouri and Kansas are structurally deficient
and require either repair or replacement to ensure functionality. CFRP can offer a cost and time
effective solution to these problems.
For this purpose six (6) lab-scale PC bridge tee-girders were constructed for testing. Two
girders were shear sufficient according to today’s standards. The remaining four (4) girders were
shear deficient and required upgrade in order to achieve the same level of shear capacity as the
"shear-sufficient girders". The shear strengthening of these girders was performed using CFRP
laminates applied by manual lay-up and Near Surface Mounted (NSM) CFRP bars. All beams,
with exception of the control one (i.e., a shear-deficient beam), were also strengthened in flexure
using CFRP laminates.
The observed failure mode of all strengthened beams was CFRP debonding. The flexural
FRP laminate on each girder debonded before other failure modes could be experienced. Despite
this, the three shear-strengthened girders did achieve a significant increase in load capacity over
the control girder. Compared with the analytical prediction according to existing design
guidelines, the shear-strengthened girders showed load carrying capacities equal to 1.01, 0.97
and 0.87 of the predicted value. Had flexural FRP laminate debonding not been the cause of
failure, a closer match with prediction would have been possible.
ii

ACKNOWLEDGMENTS
The project was made possible with the financial support received from the Missouri Department
of Transportation (MoDOT) and the University Transportation Center (UTC) on Advanced
Materials, Center for Infrastructure Engineering Studies (CIES), at the University of Missouri-
Rolla (UMR).
iii

iv
TABLE OF CONTENTS
Page
1. INTRODUCTION .......................................................................................................... 1
1.1. BACKGROUND..................................................................................................... 1
1.2. OBJECTIVES ......................................................................................................... 1
1.3. RESEARCH FINDINGS ....................................................................................... 2
2. LITERATURE REVIEW ............................................................................................... 3
2.1. INTRODUCTION.................................................................................................. 3
2.2. CFRP LAMINATE STRENGTHENING .............................................................. 3
2.3. NSM CFRP STRENGTHENING .......................................................................... 3
3. MATERIAL SPECIFICATIONS ................................................................................... 4
3.1. SPECIMEN DESCRIPTION .................................................................................. 4
3.2. CARBON FIBER FABRIC..................................................................................... 5
3.3. NEAR SURFACE MOUNTED BARS................................................................... 5
3.4. WABO®MBRACE EPOXY................................................................................... 5
3.5. CONCRESIVE® 1420 EPOXY.............................................................................. 6
3.6. GFRP ANCHORS................................................................................................... 6
4. SPECIMEN PREPARATION ........................................................................................ 9
4.1. INTRODUCTION................................................................................................... 9
4.2. GIRDER STRENGTHENING................................................................................ 9
4.3. TEST SETUP ........................................................................................................ 14
5. PRELIMINARY ANALYSIS ...................................................................................... 17
5.1. INTRODUCTION................................................................................................. 17
5.2. UNSTRENGTHENED GIRDER ANALYSIS ..................................................... 17
5.3. STRENGTHENED GIRDER ANALYSIS........................................................... 19
5.4. GIRDER DEFLECTION ANALYSIS.................................................................. 21
6. EXPERIMENTAL RESULTS...................................................................................... 22
6.1. INTRODUCTION................................................................................................. 22
6.2. GENERAL OBSERVATIONS............................................................................. 22

v
6.3. TEST RESULTS ................................................................................................... 23
7. DISCUSSION............................................................................................................... 38
7.1. INTRODUCTION................................................................................................. 38
7.2. CONTROL GIRDER ............................................................................................ 38
7.3. SHEAR-SUFFICIENT GIRDERS........................................................................ 38
7.4. U-WRAPPED STRENGTHENED GIRDER ....................................................... 40
7.5. NSM CFRP BAR STRENGTHENED GIRDERS................................................ 40
7.6. DESIGN CONSIDERATIONS............................................................................. 41
8. CONCLUSIONS........................................................................................................... 42
8.1. EFFECTS OF CFRP SHEAR STRENGTHENING ............................................. 42
8.2. FUTURE WORK .................................................................................................. 42
9. REFERNCES................................................................................................................ 44
APPENDIX A................................................................................................................... 46
APPENDIX B ................................................................................................................... 51
APPENDIX C ................................................................................................................... 55

vi
LIST OF ILLUSTRATIONS
Figure Page
Figure 3-1: Girder Cross-Section........................................................................................ 4
Figure 3-2: GFRP Anchors ................................................................................................. 8
Figure 4-1: Flexural Strengthening................................................................................... 10
Figure 4-2: 1-Sufficient Strengthening ............................................................................. 10
Figure 4-3: Small Defects ................................................................................................. 11
Figure 4-4: 1-UW Strengthening ...................................................................................... 11
Figure 4-5: 1-NSM Strengthening .................................................................................... 12
Figure 4-6: NSM Applied to Girder.................................................................................. 12
Figure 4-7: 2-Sufficient Strengthening ............................................................................. 12
Figure 4-8: 2-NSM Strengthening .................................................................................... 13
Figure 4-9: Orientation and Location of GFRP Anchors.................................................. 14
Figure 4-10: GFRP Installation......................................................................................... 14
Figure 4-11: Test Set-Up .................................................................................................. 15
Figure 4-12: Schematic Test Set-Up and Shear and Moment Diagrams .......................... 15
Figure 6-1: 1-UW Shear Failure ....................................................................................... 23
Figure 6-2: FRP Debonding Failure in Four Girders....................................................... 24
Figure 6-3: Existing Defects on Flexural FRP of 1-Sufficient ........................................ 24
Figure 6-4: 1-Sufficient Shear Cracks .............................................................................. 25
Figure 6-5: Flexural FRP Strain for 1-Sufficient.............................................................. 26
Figure 6-6: Experimental Moment-Curvature Relationship for 1-Sufficient ................... 26
Figure 6-7: Load Deflection Graph for 1-Sufficient......................................................... 27
Figure 6-8: Shear U-Wrap Strain Graph for 1-UW .......................................................... 28
Figure 6-9: Load Deflection Graph for 1-UW.................................................................. 29
Figure 6-10: Debond Termination in U-Wrapped Anchored Region.............................. 30
Figure 6-11: Anchored FRP Remaining After FRP Debond ........................................... 30
Figure 6-12: Shear NSM Strain Graph for 1-NSM........................................................... 31

vii
Figure 6-13: Load Deflection Graph for 1-NSM.............................................................. 32
Figure 6-14: 2-Sufficient Shear Crack at Debond ............................................................ 32
Figure 6-15: 2-Sufficient FRP Debonding Failure ........................................................... 33
Figure 6-16: Flexural FRP Strain Readings for 2-Sufficient ............................................ 33
Figure 6-17: Load Deflection Graph for 2-Sufficient....................................................... 34
Figure 6-18: Shear Cracks ................................................................................................ 35
Figure 6-19: Flexural FRP and Shear NSM Strain Graph for 2 NSM.............................. 36
Figure 6-20: Load Deflection Graph for 2 NSM .............................................................. 37

viii
LIST OF TABLES
Table Page
Table 3-1: Wabo®MBrace CF 130 Properties (Watson Bowman Acme, 2004)................ 5
Table 3-2: Aslan 500 Bar Properties (Hughes Brothers, 2003) .......................................... 6
Table 3-3: Wabo®MBrace Primer Properties (Watson Bowman Acme, 2004)................. 7
Table 3-4: Wabo®MBrace Saturant Properties (Watson Bowman Acme, 2004) .............. 8
Table 3-5: MBT/Degussa Concresive® 1420 Epoxy Properties (Chemrex, 2003)............ 8
Table 4-1: Test Matrix ........................................................................................................ 9
Table 5-1: Strength Analysis Summary............................................................................ 18
Table 5-2: Strength Analysis Results................................................................................ 18
Table 5-3: Deflection Analysis ......................................................................................... 21
Table 6-1: Expected Versus Observed Results................................................................. 22

1. INTRODUCTION
1.1. BACKGROUND
Many of the existing bridges in the states of Missouri and Kansas were designed and constructed in the early 1970’s and today are structurally deficient. According to the Missouri Department of Transportation (MoDOT) records (MoDOT, 2004), 8,227 bridges in Missouri are structurally deficient, around 35% of all bridges in the state. Structurally deficient bridges are those that are in poor condition or have insufficient load capacity when compared to modern design standards. Replacement of the bridges would be impractical due to the large number, the inconvenience of closing during construction, and the high cost. This study is an effort to alleviate the problems of prestressed concrete (PC) bridge girder replacement by implementing a carbon fiber-reinforced polymer (CFRP) strengthening technique to upgrade existing members. Approximately 150 bridges of the PC tee-beam type are on the Missouri state system.
1.2. OBJECTIVES
This research is part of a larger project conducted at the University of Missouri-Rolla (UMR) in conjunction with Kansas State University (KSU). Due to the prevalence of structurally deficient bridges in Missouri and Kansas, a testing program was developed to determine the feasibility of using bonded CFRP composites as strengthening for PC girders. In Phase I of the study, conducted at KSU, three double-tee girders were taken from a decommissioned bridge in Graham County, KS. These girders were cut in half to produce six tee girders for testing. The focus of Phase I was to evaluate flexural and fatigue strengthening of the existing PC girders. Phase II, conducted at UMR, was to analyze flexural and shear strengthening techniques in laboratory scale girders in order to develop criteria more general for in-situ strengthening.
The UMR portion of this project involved the production of six (6) PC tee-girders that are
similar to many deficient bridges found in both states. These girders had a flexural capacity of 36.3 kip-ft (49.2 kN-m). To investigate the shear capacity added by the strengthening schemes, two different levels of internal shear reinforcement were used for the girders. Two (2) "shear-sufficient girders", which represent the desired target in strengthening of deficient girders, had a calculated shear capacity of 44.1 kips (196.2 kN). The remaining four (4) girders represented shear deficient members and had a calculated shear capacity of 24.3 kips (108.1 kN).
Knowing the shear capacities of both types of girders, a strengthening scheme was
developed in an attempt to upgrade the capacity to the sufficient level. This was done by using both CFRP U-Wraps and CFRP Near Surface Mounted (NSM) bars. The CFRP U-Wraps were attached by externally bonding strips to the web of the girder. This manual lay-up method was used because of its ease of application in the field. It can be performed with minimal, relatively unskilled manpower and does not require expensive equipment. The NSM bars were installed by cutting grooves in the web of the girders and embedding the bars in epoxy paste. This method

2
creates a more intimate bond than manual lay-up. The placement and quantity of both methods was determined based on the analysis to achieve the desired level of strengthening.
1.3. RESEARCH FINDINGS
Upon testing, both the U-Wrap and NSM bar shear-strengthened girders showed a capacity (i.e., 29.2, 34.7 and 31.3 kips) equal to or exceeding that of sufficient girders (i.e., 26.8 and 33.5 kips). This would give credence to the use of the two systems in field applications.
The observed failure mode of all strengthened beams was CFRP debonding. The flexural
FRP laminate on each girder debonded before other failure modes could be experienced. Despite this, the three shear-strengthened girders did achieve a significant increase in load capacity over the control girder. Compared with the analytical prediction according to existing design guidelines, the shear-strengthened girders showed load carrying capacities equal to 1.01, 0.97 and 0.87 of the predicted value. Had flexural FRP laminate debonding not been the cause of failure, a closer match with prediction would have been possible.
The failure of the FRP NSM and U-Wrap strengthened girders was controlled by flexural
FRP delamination. The flexural FRP laminates were used on a total of five beams to increase to the extent possible the flexural capacity. For short specimens, such as those tested, the applied moment gradient is rather steep so that FRP delamination may become the controlling failure mode. More research should be undertaken to develop design criteria to accurately predict this failure mechanism of PC members.

3
2. LITERATURE REVIEW
2.1. INTRODUCTION
Although CFRP strengthening is a relatively new technology, work has been performed in various areas to test its properties and applicability in civil engineering structures. This work has provided a background for testing in relation to bridge applications.
2.2. CFRP LAMINATE STRENGTHENING
In the past strengthening was performed by either post-tensioning or jacketing with new concrete using surface adhesives (Klaiber et al. 1987). Since then, FRP composites have been developed to replace these more expensive and cumbersome methods. Early work devising analytical models for various composite-strengthened girders was developed by Triantafillou and Plevris (1991). This work led the way to more specific research using composites to strengthen structures.
One common way of strengthening bridge girders for both flexure and shear is the use of
CFRP laminates. These laminates are lightweight and require minimal effort to install when compared with steel. In a study by Sheikh et al. (1999) girders strengthened with CFRP laminates showed an increased capacity as compared to unstrengthened girders. The unstrengthened girders in the test failed in shear while the strengthened girders failed in flexure with an increase in strength of almost 50%. Another study shows an increase of 50% when girders were strengthened in both flexure and shear with CFRP laminates (Kachlakev et al., 2000). Other studies have also been conducted by Arduini, et al. (2002) and Khalifa et al. (1998, 2002) in an attempt to quantify the flexural and shear strengthening enhancements offered by the externally bonded, CFRP laminates.
2.3. NSM CFRP STRENGTHENING
Another relatively recent development in the strengthening of deficient bridges is the use of NSM bars. These CFRP bars are lightweight and placed inside concrete grooves to create a more intimate bond than that of the CFRP laminates. Studies conducted by De Lorenzis et al. (2000) showed that a shear capacity increase of as high as 40% in flexure and 100% in shear, depending on the bond, can be achieved. De Lorenzis et al. (2001, 2002) have also conducted additional work to try to quantify these values. Another study at the Lulea University of Technology Sweden (Carolin et al., 2002) shows an increase of 57% in ultimate flexural capacity in reinforced concrete girders.
The results show the potential value that CFRP laminates and NSM strengthening have
for field applications; however, most studies performed with these systems were conducted on reinforced concrete girders. This research project is an attempt to fill in some of the gaps now present in the area of FRP strengthening as it relates to PC girders. This research is relevant to the type of girders found on many bridges throughout the states of Missouri and Kansas.

4
3. MATERIAL SPECIFICATIONS
3.1. SPECIMEN DESCRIPTION
All girders were cast by Prestressed Concrete, Inc. located in Newton, KS. Fabrication was determined based on the reinforcing ratios of the Graham County bridges tested in Phase I of the study (Kansas State University, 2000). Each girder was a 16 feet 6 ½ inches (5,042 mm) long tee-girder. The cross section was 14 inches (356 mm) deep with an average web width of 5 inches (127 mm). The flange was 18 inches (457 mm) wide with a thickness of 4 inches (102mm) (Figure 3-1). The actual concrete strength was found to be 6,207 psi (42.80 MPa) as determined from concrete cylinder breaks.
D6-4 (single leg) or D4-8 WWR
D4-4 WWR
(2) 3/8", 270 ksi Straight Strands
Jacking Stress = 202 ksi
(1 inch = 25.4 mm, 1 ksi = 6.895 MPa)
Figure 3-1: Girder Cross-Section Each girder contained two (2) 3/8-inch (9.5mm) diameter 270 ksi (1862 MPa) low
relaxation prestressing 7-wire straight strands. The tensioning jacking force started with 3,000 pounds (13,345 N) and finished with 16,600 pounds (73,840 N). The elongation of the wires after chuck slip was 13.10 inches (333 mm) with a tolerance of + 5/8 inch (16 mm) over the length of the prestressing bed. In order to determine the effects shear strengthening will have on the girders two (2) different levels of shear reinforcement were used.
Shear Sufficient, D6-4. Two (2) "shear-sufficient girders" were cast which represent the
target level of reinforcement. The shear reinforcement consisted of single–leg size D6 welded wire (area = 0.18 in2 (1.16 cm2)) spaced at 4.0 inches (102 mm) on center. These girders were used as a control to provide a reference for the desired shear strength of the upgraded, "shear-deficient girders". The steel yield strength was equal to fy=60 ksi.
Shear Deficient, D4-8. Four (4) "shear-deficient girders" were cast to represent the field
condition. The level of reinforcement consisted of double–leg size D4 welded wire (area = 0.12 in2 (0.77 cm2)) spaced at 8.0 inches (203 mm) on center. One of these girders was used as the

5
control to determine the benchmark flexural strength. The other three girders were strengthened using either CFRP U-Wraps or NSM bars. The steel yield strength was equal to fy=60 ksi
3.2. CARBON FIBER FABRIC
A unidirectional, high strength, commercially available carbon fiber fabric was used for both flexural and shear strengthening (Wabo®MBrace CF 130). CF 130 is a dry fabric constructed with high strength, aerospace grade carbon fibers (Watson Bowman Acme, 2004). The fabric is externally bonded to the epoxy-primed concrete surface of the girder and impregnated with epoxy saturant. The system offers many advantages, namely: high strength and high stiffness, lightweight, high durability, non-corrosive, and ease of installation (Table 3-1).
Table 3-1: Wabo®MBrace CF 130 Properties (Watson Bowman Acme, 2004) Wabo®MBrace CF 130High Strength Unidirectional Carbon Fiber FabricPhysical Properties:Areal Weight 0.062 lb/ft2 (300 g/m2) Fabric Width 24 in (610 mm)Nominal Thickness, tf 0.0065 in/ply (0.165 mm/ply)Longitudinal Tensile Properties:Ultimate Tensile Strength, f*
fu 550 ksi (3800 MPa)Tensile Modulus, Ef 33000 ksi (227 GPa)Ultimate Rupture Strain, epsilon*
fu 1.67%
3.3. NEAR SURFACE MOUNTED BARS
Aslan 500 CRFP bars were used for shear strengthening. Aslan 500 bars are a pultruded rectangular bar containing 700 ksi (4830 MPa), 33 Msi (227,535 GPa) modulus carbon fiber, 60% by volume, in a Bisphenol Epoxy ester resin matrix designed specifically for NSM strengthening (Hughes Brothers, 2003).
Aslan 500 bars are installed inside grooves cut into the concrete and are adhered with
epoxy. This system offers many of the same advantages as the CF 130 fabric, namely: high strength and high stiffness, lightweight, high durability, non-corrosive, and easy to install (Table 3-2).
3.4. WABO®MBRACE EPOXY
3.4.1. Primer. Wabo®MBrace Primer is a low viscosity, 100% solids, polyamine cured epoxy (Watson Bowman Acme, 2004). The primer comes in two parts and is mixed according to product labeling at the time of use. This is the first step in the epoxy system and is used to penetrate the pores of the concrete substrate and provide a high bond base coat for the saturant. The surface of the concrete must be cured, dry, and free of oils, release agents, curing agents, and dust before application. The primer is applied to the concrete using rollers. The primer’s

6
properties are designed to create proper adhesion when used with Wabo®MBrace Saturant and CF 130 fiber laminates (Table 3-3)
Table 3-2: Aslan 500 Bar Properties (Hughes Brothers, 2003) Aslan 500Carbon Fiber Reinforced Polyemer TapePhysical Properties:Tape Dimensions 0.079 in x 0.63 in (2 mm x 16 mm)Cross Sectional Area 0.05 in2 (32 mm2)Longitudinal Tensile Properties:Ultimate Tensile Strength, f*
fu 300 ksi (2068 MPa)Tensile Modulus, Ef 19000 ksi (131 GPa)Ultimate Rupture Strain, epsilon*
fu 1.70% 3.4.2. Saturant. Wabo®MBrace Saturant is a low viscosity, 100% solids, epoxy
material used to coat the fibers of the Wabo®MBrace CF 130 carbon fiber fabric (Watson Bowman Acme, 2004). Upon curing, the fabric and saturant form a high strength laminate. The saturant is applied after the application of the primer with the primer not having to have achieved full cure. The saturant is applied similarly to the primer by utilizing rollers. Once the saturant has been applied, the CF 130 laminate is immediately applied and pressed into the saturant to create an intimate bond. The saturant is designed to create adhesion between the primed concrete substrate and the fabric and has properties that aid in the high performance of the system (Table 3-4).
3.5. CONCRESIVE® 1420 EPOXY
Master Builder/Degussa Concresive® 1420 Epoxy is two-component general-purpose epoxy with 100% solids (Chemrex, 2003). The epoxy has a no sag consistency and is designed for bonding and anchorage. It is the recommended adhesive for the 500 CFRP Bar. The epoxy comes in a biaxial type cartridge with a static mixing attachment for dispensing. To use the epoxy a dry substrate is recommended. The concrete must be free of dirt, dust, oil, curing compound, and other detrimental material. Once the substrate is prepared the epoxy is injected into the concrete grooves by the use of a cartridge drop-in dispensing gun. Once applied, the NSM bars are pressed into the grooves and the epoxy smoothed and allowed to cure.
3.6. GFRP ANCHORS
In order to prevent FRP debonding glass FRP (GFRP) anchors were used to create an additional level of anchorage between the CFRP laminate and the concrete. This was done first by producing the GFRP anchors. The anchors used were approximately ½ inch (13 mm) in diameter and penetrated 1-½ inches (38 mm) into the girders.
To produce the GFRP anchors glass fiber strands were clustered into loose ¾ inch (19
mm) bundles that were 5 inches (127 mm) long. Three inches of the anchors were tightly wrapped with plastic to prevent their saturation with the epoxy. The unwrapped end of the anchors were then saturated with Wabo®MBrace Saturant and pulled through a ½ inch (13 mm)

7
diameter die. The epoxy was then allowed to cure. Upon curing the epoxied ends were cut to 2 inches (51 mm) in length and the plastic was removed from the protected ends exposing unsaturated fibers used in installation.
Table 3-3: Wabo®MBrace Primer Properties (Watson Bowman Acme, 2004) Wabo®MBrace PrimerViscosity Epoxy PrimerPhysical Properties:Installed Thickness (approx) 3 mils (0.075 mm)Density 68.8 pcf (1102 kg/m3)Tensile Properties:Yield Strength: 2100 psi (14.5 MPa)Strain at Yield 2.00%Elastic Modulus 105 ksi (717 MPa)Ultimate Strength 2500 psi (17.2 MPa)Rupture Strain 40.00%Poisson's Ratio 0.48Compressive Properties:Yield Strength: 3800 psi (26.2 MPa)Strain at Yield 4.00%Elastic Modulus 97 ksi (670 MPa)Ultimate Strength 4100 psi (28.3 MPa)Rupture Strain 10.00%Flexural Properties:Yield Strength: 3500 psi (24.1 MPa)Strain at Yield 4.00%Elastic Modulus 86.3 ksi (595 MPa)Ultimate Strength 3500 psi (24.1 MPa)
Rupture Strainlarge deformation with no rupture

8
Table 3-4: Wabo®MBrace Saturant Properties (Watson Bowman Acme, 2004) Wabo®MBrace Saturant Epoxy Encapsulation Resin Physical Properties:Density 61.3 pcf (983 kg/m3)Tensile Properties:Yield Strength: 7900 psi (54 MPa)Strain at Yield 2.50%Elastic Modulus 440 ksi (3034 MPa)Ultimate Strength 8000 psi (55.2 MPa)Rupture Strain 3.50%Poisson's Ratio 0.40Compressive Properties:Yield Strength: 12500 psi (86.2 MPa)Strain at Yield 5.00%Elastic Modulus 380 ksi (2620 MPa)Ultimate Strength 12500 psi (86.2 MPa)Rupture Strain 5.00%Flexural Properties:Yield Strength: 20000 psi (138 MPa)Strain at Yield 3.80%Elastic Modulus 540 ksi (3724 MPa)Ultimate Strength 20000 psi (138 MPa)Rupture Strain 5.00%
Table 3-5: MBT/Degussa Concresive® 1420 Epoxy Properties (Chemrex, 2003) Master Builders/ DegussaConcresive® 1420 EpoxyTensile Strength: 4000 psi (27.6 MPa)% Elongation at Break: 1.0Compressive Yield Strength: 12500 psi (86.2 MPa)Compressive Modulus: 450000 psi (3.06 GPa)Bond Strength, 2-Day Cure: >2000 psi (13.8 Mpa)
Figure 3-2: GFRP Anchors
9
4. SPECIMEN PREPARATION
4.1. INTRODUCTION
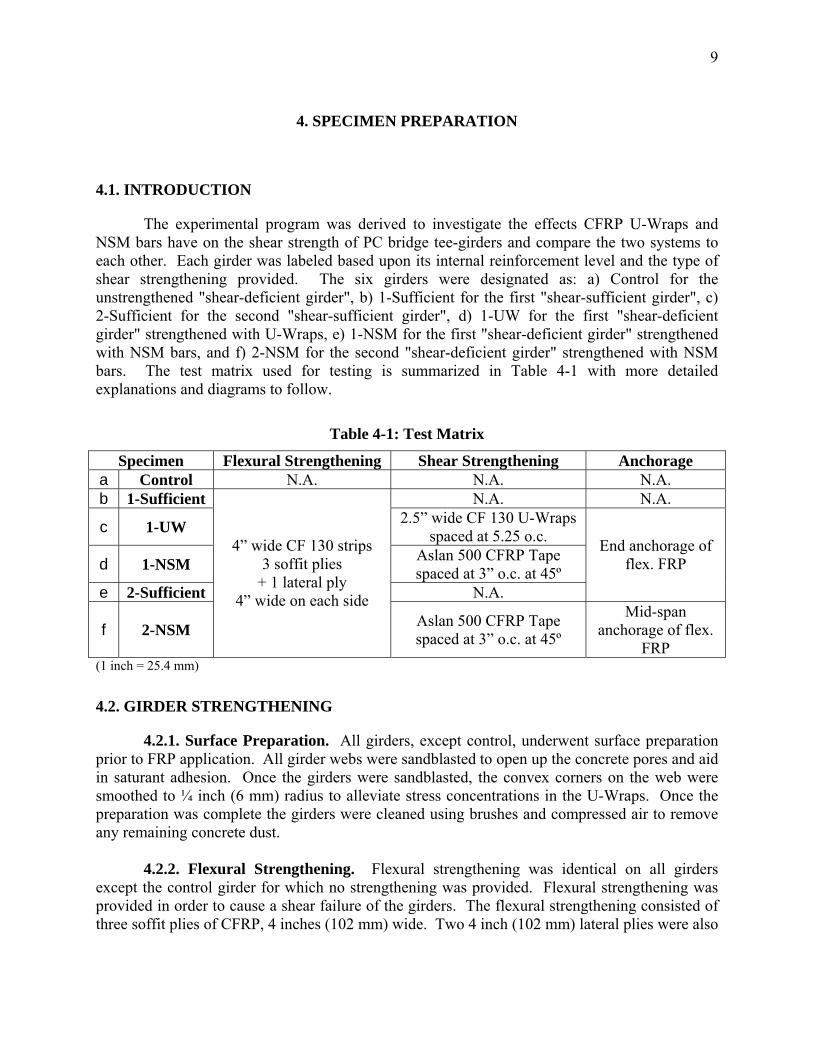
The experimental program was derived to investigate the effects CFRP U-Wraps and NSM bars have on the shear strength of PC bridge tee-girders and compare the two systems to each other. Each girder was labeled based upon its internal reinforcement level and the type of shear strengthening provided. The six girders were designated as: a) Control for the unstrengthened "shear-deficient girder", b) 1-Sufficient for the first "shear-sufficient girder", c) 2-Sufficient for the second "shear-sufficient girder", d) 1-UW for the first "shear-deficient girder" strengthened with U-Wraps, e) 1-NSM for the first "shear-deficient girder" strengthened with NSM bars, and f) 2-NSM for the second "shear-deficient girder" strengthened with NSM bars. The test matrix used for testing is summarized in Table 4-1 with more detailed explanations and diagrams to follow.
Table 4-1: Test Matrix
Specimen Flexural Strengthening Shear Strengthening Anchorage a Control N.A. N.A. N.A. b 1-Sufficient N.A. N.A.
c 1-UW 2.5” wide CF 130 U-Wraps spaced at 5.25 o.c.
d 1-NSM Aslan 500 CFRP Tape spaced at 3” o.c. at 45º
e 2-Sufficient N.A.
End anchorage of flex. FRP
f 2-NSM
4” wide CF 130 strips 3 soffit plies
+ 1 lateral ply 4” wide on each side
Aslan 500 CFRP Tape spaced at 3” o.c. at 45º
Mid-span anchorage of flex.
FRP (1 inch = 25.4 mm)
4.2. GIRDER STRENGTHENING
4.2.1. Surface Preparation. All girders, except control, underwent surface preparation prior to FRP application. All girder webs were sandblasted to open up the concrete pores and aid in saturant adhesion. Once the girders were sandblasted, the convex corners on the web were smoothed to ¼ inch (6 mm) radius to alleviate stress concentrations in the U-Wraps. Once the preparation was complete the girders were cleaned using brushes and compressed air to remove any remaining concrete dust.
4.2.2. Flexural Strengthening. Flexural strengthening was identical on all girders
except the control girder for which no strengthening was provided. Flexural strengthening was provided in order to cause a shear failure of the girders. The flexural strengthening consisted of three soffit plies of CFRP, 4 inches (102 mm) wide. Two 4 inch (102 mm) lateral plies were also

10
applied, one on each side, as illustrated in Figure 4-1. The flexural strengthening extended 11 feet (3400 mm) and completely encompassed the constant maximum moment region.
Soffit Plies 1, 2, & 3
Lateral Ply
Figure 4-1: Flexural Strengthening
4.2.3. Shear Strengthening. Shear strengthening was implemented in order to bring the
"shear-deficient girders" to the same strengthened level as that of the "shear-sufficient girders". An analysis was performed on data taken from the unstrengthened, "shear-sufficient girder" and the calculated shear strength value was found to be 26.8 kips (119kN). Using ACI 440.2R-02, the level of strengthening needed for each "shear-deficient girder" was determined based on the strengthening technique. Strengthening was performed utilizing CFRP U-Wraps or NSM bars, providing a comparison between the two systems.
Control. The girder designated as Control was a "shear-deficient girder" used to provide
a baseline strength for the strengthened girders and, therefore, had no FRP shear strengthening. 1-Sufficient. The first "shear-sufficient girder", labeled 1-Sufficient, which has been
properly designed for shear, was strengthened in flexure (Figure 4-2).
1" = 25.4 mm
Figure 4-2: 1-Sufficient Strengthening

11
The girder was strengthened in such a way as to facilitate delaminations in the FRP laminate by allowing small defects during its installation. This was done to determine the effects the quality of installation has on the bonding and failure mode of the system. No shear strengthening was performed.
Areas of Delamination
Figure 4-3: Small Defects
1-UW. 1-UW, a "shear-deficient girder", was strengthened in shear using CFRP U-Wraps (Figure 4-4). The wraps were 2.5 inches (64 mm) wide spaced at 5.25 inches (133 mm) on center in one shear region to produce the required shear strength (see test zone Figure 4-4).
Continuous U-Wrap
Test Zone
Figure 4-4: 1-UW Strengthening
The other shear region was strengthened with continuous U-Wraps in order to force the shear failure to occur at the other end.
1-NSM. 1-NSM, a "shear-deficient girder", was strengthened with NSM bars (Figure 4-5 and Figure 4-6). The NSM bars were placed at a 45o angle and spaced at 3.0 inches (76 mm) on center using twenty-six (26) bars per shear region. At one end of the girder a double U-Wrap anchor was used to force failure in the test zone. In the test zone, GFRP anchors were used to improve flexural bond without effecting shear capacity, as is the case with the U-Wraps.

12
NSM @ 3" ocDouble u-wrap
anchors
Test Zone
1" = 25.4 mm Figure 4-5: 1-NSM Strengthening
Figure 4-6: NSM Applied to Girder
2-Sufficient. 2-Sufficient, a "shear-sufficient girder", was strengthened in flexure
without the defects seen in 1-Sufficient (Figure 4-7). As in 1-NSM, 2-Sufficient GFRP anchors and CFRP U-Wraps s were used to increase bond between the FRP and concrete substrate in the shear regions of the girder. No shear strengthening was performed on this girder.
Test Zone
Double u-wrap
Figure 4-7: 2-Sufficient Strengthening
2-NSM. 2-NSM, a shear deficient, was strengthened in the same manner as 1-NSM with
added anchorage provided in the mid span-region of the girder in a further attempt to eliminate a flexural debonding failure (Figure 4-8). To prevent debonding from occurring on 2-NSM, U-Wrap anchors were used in the shear region and additionally in the constant moment region. One ply of CFRP wraps was used to continuously anchor the constant moment region. The shear

13
region was anchored using two plies with the bottom ply anchored to the girder using GFRP anchors. The other shear region was anchored using only the GFRP nails.
NSM @ 3" ocDouble u-wrap (anchors on first layer)
Single u-wrap
anchors
Test Zone
1" = 25.4 mm
Figure 4-8: 2-NSM Strengthening
This level of shear strengthening was performed in order to have a shear comparison with the debonding failure of 1-NSM.
4.2.4. Flexural Anchorage. Anchorage consisted of a combination of double CFRP U-Wraps and glass FRP anchors (Figure 4-9). The U-Wraps consisted of two CFRP plies applied to one shear region of each anchored girder. The U-Wraps were placed over the bottom soffit flexural FRP ply to provide additional bond to the concrete substrate. The remaining two soffit plies and the lateral plies were placed on top of the U-Wraps. The use of the CFRP U-Wraps provided additional anchorage with an additional shear capacity to that region of the girder.
The orientation and location of each GFRP anchor was determined based on past
experience with the anchors and the desired effects upon the girders. GFRP anchors were used at the test zone of each girder because they did not provide an increase in shear capacity. To apply the anchors holes were first drilled into the girder at the designated anchor locations. The holes were drilled slightly larger than ½ inch (13 mm) in diameter and were 2 inches (51 mm) long. The slightly larger holes allowed for ease in application of the anchors and accounted for the addition of epoxy in the holes. Once the holes were drilled they were cleaned using compressed air and were then ready for anchor application.
In order to apply the GFRP anchors first the anchor holes were filled half full with epoxy.
The flexural or shear FRP to be anchored was then applied over the anchor holes. Once this was done the holes were located and the CFRP strengthening fibers were carefully separated and the epoxied end of the anchors inserted in the hole with the loose fibers extending through the strengthening. The loose fibers were then saturated with epoxy and flattened out over the strengthening to provide the anchorage (Figure 4-10).

14
Area of Anchor Application
CL
1" = 25.4 mm
Support Point Soffit Anchors (4)
Lateral PlyAnchors (3)
Figure 4-9: Orientation and Location of GFRP Anchors
Figure 4-10: GFRP Installation
4.3. TEST SETUP
All girders were tested similarly utilizing a four-point loading configuration. To ensure the stability of the specimen during testing, each girder was flipped upside down, resting on its flanges (Figure 4-12 and Figure 4-11). As shown, the flanges rest on two central supports located symmetrically 3 feet (914 mm) from the midspan and load is applied outside the supports at a symmetrical distance of 6 feet (1829 mm) from the midspan. The clear span of the tested girder is 12 feet (3658 mm). Shear and moment diagrams are also given in Figure 4-12.

15
Direct current voltage transformers (DCVTs) were used to measure the displacement at the supports, load applications, and at the midspan. Strain gages were applied to the FRP at areas of interested to determine the strain in the girders upon loading and at failure. The girders were tested under quasi-static loading conditions. Load cells were placed on top of each hydraulic jack to carry out continuous measurements. All instrumentation was connected to a data acquisition system.
Figure 4-11: Test Set-Up
LVDT 2 LVDT 5LVDT 3 (LVDT 4 on back flange)
Load Cell
Hydraulic Jack
Roller Support
Moment Diagram
Shear Diagram
Reaction Beam 6" x6"
LVDT 1 LVDT 6
Figure 4-12: Schematic Test Set-Up and Shear and Moment Diagrams
In order to provide safety during testing and observations, the girders were loaded using
at least five cycles with observations being made in-between cycles when the load on the girder was low. Before testing, the applied load (Pcr) corresponding to the cracking moment (Mcr) of the girders was calculated to be 10.2 kips (45.4 kN) using the following formulae:

16
2cr r e
b
rM f S P ec
⎛ ⎞= + +⎜ ⎟
⎝ ⎠ (1)
3
crcr
MP = (2)
Where: fr = tensile concrete strength defined as 7.5 '
cf in psi S = section modulus Pe = effective initial prestress force e = distance between point of application of Pe and the n.a. r2 = radius of gyration cb = distance of the n.a. from the bottom fiber One cycle was to be below the cracking load. Thus, it was determined that five cycles increasing by 5 kips (22 kN) each were to be used. In between cycles, the load would be decreased and stopped at 1 kip (4.4 kN) to allow for safe crack observations and so that at no time would the girder be completely unloaded.

17
5. PRELIMINARY ANALYSIS
5.1. INTRODUCTION
Analysis was performed on the PC girders to determine the unstrengthened properties of both the shear sufficient and shear deficient specimens and served as a basis for each strengthening scheme. Once the unstrengthened girder analysis was complete, an analysis of the differing strengthening techniques was performed to determine the level of strengthening needed to obtain the sufficient shear strength level in the "shear-deficient girders". Flexural calculations are shown in terms of the applied shear needed to cause flexural failure considering the testing configuration shown in Figure 4-12.
Table 5-1 summarizes the data used to carry shear and flexural analysis. Table 5-2 shows
all the analytical results in terms of shear and flexure. The value of the total shear capacity, Vn, and the shear demand, Vu, corresponding to the moment capacity, Mn, are computed according to the equations given below:
fscn VVVV ++= (3)
3
nu
MVft
= (4)
Table 5-2 shows that except for specimen 1-UW, the strengthened girders have flexural
controlled failure modes. In the case of specimens 1-NSM and 2-NSM, a relatively small difference between flexural and shear controlled failure is negligible.
5.2. UNSTRENGTHENED GIRDER ANALYSIS
Calculations were run on the unstrengthened girders in order to determine their cracking moment and existing flexural and shear strengths using ACI 318-99. A tendon ultimate strength of 270 ksi (1862 MPa) was used based on manufacturer’s tickets. Mill certificates show all other steel to have a yield strength of 60 ksi (414 MPa). Laboratory testing gave a compressive concrete strength of 6207 psi (42.8 MPa).
5.2.1. Cracking Moment. The cracking moment of the girders was calculated in order to
determine the testing cycles. The first cycle was to be at a load lower than the girder cracking moment with the second cycle at a load close to the cracking moment. Using an estimated 20% loss in prestressing force a cracking moment of 30.6 kip-ft (41.5 kN-m) was found. This corresponds to a testing load of 10.2 kips (45.4 kN) (Equation. 2). Based on this, an incremental load increase of 5 kip (22 kN) per cycle was determined for testing.

18
Table 5-1: Strength Analysis Summary
Shear Reinforcement Flexural Reinf. Shear Strengthening Flexural Strengthening Asv s fy As fpu wf sf df αf c wB NB wL NL dL
Specimen
(in2) (in) (ksi) (in2) (ksi) (in) (in) (in) (-) (in) (in) (-) (in) (-) (in)Control 2 x 0.06 8 60 2 x 0.085 270 N.A. N.A. N.A. N.A. N.A. N.A. N.A. N.A. N.A. N.A.
1-Sufficient 1 x 0.18 4 60 2 x 0.085 270 N.A. N.A. N.A. N.A. N.A. 4 3 4 1 10 1-UW 2 x 0.06 8 60 2 x 0.085 270 2.5 5.25 6 90 N.A. 4 3 4 1 101-NSM 2 x 0.06 8 60 2 x 0.085 270 N.A. 3.0 11.3 45 1.8 4 3 4 1 10
2-Sufficient 1 x 0.18 4 60 2 x 0.085 270 N.A. N.A. N.A. N.A. N.A. 4 3 4 1 102-NSM 2 x 0.06 8 60 2 x 0.085 270 N.A. 3.0 11.3 45 1.8 4 3 4 1 10
(1 inch = 25.4 mm; 1 ksi = 6.89 MPa) List of symbols:
Asv Area of shear reinforcement αf Angle of inclination of FRP shear reinforcement s Stirrups spacing c Concrete cover fy Yield strength of nonprestressed steel reinforcement wB Width of bottom layer of FRP flexural reinforcement As Area of prestressing tendons NB Number of layers of bottom FRP reinforcement fpu Tensile strength of prestressing tendons wL Width of lateral layer of FRP flexural reinforcement wf Width of FRP shear reinforcement NL Number of layers of lateral FRP reinforcement sf Center-to-center spacing of FRP shear reinforcement dL Distance from top compression concrete to top of lateral FRP reinforcement df Depth of FRP shear reinforcement as defined in ACI 440.2R-02
Table 5-2: Strength Analysis Results
Shear FlexureVc
* Vs κv Vf Vn κm MnVu
Specimen
(kips) (kips) (-) (kips) (kips) (-) (k-ft) (kips)Control 14.4 9.9 0 0 24.3 0 40.3 13.4
1-Sufficient 14.4 29.7 0 0 44.1 0.677 110.31-UW 14.4 9.9 0.23 4.7 29.0 0.677 110.3
1-NSM 14.4 9.9 N.A. 11.6 35.9 0.677 110.32-Sufficient 14.4 29.7 0 0 44.1 0.677 110.3
36.8
2-NSM 14.4 9.9 N.A. 11.6 35.9 0.9** 115.6 38.5* Calculated as reported in ACI 318-99 Eq. (11-9) with Vu/Mu=1/a (a=shear span=3’-0’’) ** Flexural reinforcement prevented from debonding; κm set equal to 0.9

19
5.2.2. Flexural Strength. The flexural reinforcement was the same on all girders. Each
girder was reinforced using two (2) 3/8-inch (9.5 mm) diameter 270 ksi (1862 MPa) prestressing straight strands. Because low relaxation strands were used, a prestressing factor type, γ , of 0.28 was utilized. Iteration was used to determine the depth of the concrete stress block, a. With this, a moment capacity of 40.3 kip-ft (54.6 kN-m), corresponding to a load at failure of 13.4 kip (59.6 kN) was found.
p
5.2.3. Shear Strength. The shear strength of the girders was calculated based on the two
steel shear reinforcement levels provided using the following equation.
scn VVV += (5) Both girders had the same level of prestressing and concrete compressive strength. Based on these values, the Vc term was computed to be equal to 14.4 kip (64.1 kN) according to ACI 318-99. To this was added the shear strength provided by the internal reinforcement, which varied for the two different types of girders. Once the sufficient and deficient girder capacities were determined, the values were used in the strengthening calculations to determine the desired level of FRP reinforcement needed.
"Shear-Sufficient Girders". Analysis of the "shear-sufficient girders" gave a reinforcement strength of 29.7 kip 132.1 kN), giving an overall shear strength of 44.1 kip (196.2 kN) when added to the concrete contribution. This strength serves as the level of strengthening desired from the "shear-deficient girders" after strengthening.
"Shear-Deficient Girders". Analysis was performed on the "shear-deficient girders" in
order to provide a basis for determining the level of strengthening needed to reach the sufficient girder shear strength level. The analysis gave a reinforcement shear capacity of 9.9 kip (44.0 kN), giving an overall shear strength of 24.3 kip (108.1 kN).
5.3. STRENGTHENED GIRDER ANALYSIS
Upon completion of the unstrengthened girder analysis, strengthening schemes were derived for each girder. Because of the low value of flexural capacity given by the prestressing steel, each girder, except Control, was provided with flexural CFRP strengthening to force a shear failure.
The "shear-deficient girders" were analyzed to determine the level of shear strengthening
required to achieve the "shear-sufficient girder" strengths. Three of the four "shear-deficient girders" were strengthened by using either Carbon Fiber U-Wraps or NSM Bars. The fourth girder was left unstrengthened as Control.
The CFRP flexural and U-Wrap shear analysis was based on ACI 440.2R-02 guidelines.
Because testing was performed in a controlled laboratory an exposure reduction factor of 1.0 was used instead of the typical interior exposure factor, CE, of 0.95. The safety reduction for new

20
technology was also taken as 1.0 instead of 0.85 to give a more accurate account of the strengthening.
The NSM shear analysis was performed based on design software by Co-FORCE
America, Inc. An exposure factor of 1.0 was also used for the NSM. Calculations were performed given an orientation of the bars, α, of 45 degrees. An average bond stress, τb, of 1.0 ksi (6.9 MPa) was used based on Co-FORCE information.
5.3.1. Flexural Strengthening. All girders except Control were strengthened in flexure
in order to produce, when possible, a shear failure upon testing. The level of flexural strengthening was determined so that the girder’s flexural capacity would possibly reach the shear capacity of the sufficient and strengthened, deficient girders.
Through iterations, a scheme using three soffit plies with lateral plies on each side of the
web was determined to sufficiently meet the design objective. The calculations for the soffit plies were performed in conjunction with the lateral plies to account for the differences in geometry. The tensile strain at rupture for all plies was taken as 0.017 in/in (0.43 mm/mm) given by the material specifications with an exposure factor of 1.0 taken for research purposes. Obviously, because of their location, the lateral plies could not reach rupture at the same time of the soffit plies. The average strain at the middle of each lateral ply was determined by using similar triangles and the soffit ply strain. Once the tensile strain that would cause delamination or rupture was determined, ACI 440.2R-02 was used to determine the flexural capacity of the system.
The total flexural strength for the PC girders (except 2-NSM) with the flexural
reinforcement was found to be 110.3 kip-ft (149.5 kN-m) corresponding to a load to failure of 36.8 kips (163.7 kN). For the case of 2-NSM that was provided with anchoring of the flexural reinforcement, the moment capacity was found to be 115.6 kip-ft (156.7 kN-m) corresponding to a load to failure of 38.5 kips (171.3 kN). These values, listed as Vu in the last column of Table 5-2, do not exceed the shear strength, Vn, of the sufficient girders (44.1 kips (196.2 kN)), meaning that for these two beams, a flexure-controlled failure is still expected.
5.3.2. Shear Strengthening. All girders were strengthened in shear except the two "shear-sufficient girders" and the control. The first two girders to be strengthened in shear were strengthened to compare the NSM bars with the CFRP U-Wraps. After testing of these first two strengthened girders, the third and final girder was strengthened using the NSM bars, based on previous test results. The second NSM girder had the same level of shear strengthening as the first NSM girder, with additional anchorage provided for the flexural CFRP laminates.
CFRP U-Wraps. The strengthening level of the U-Wrapped girder was determined
such that the strengthened shear level would be approximately equal to that of the "shear-sufficient girders". Using the ACI shear equations, by iteration a wrap width of 2.5 inches (64 mm) and a center-to-center spacing of 5.25 inches (133 mm) were determined based on design objectives and spacing requirements required by code. This level of strengthening added an additional shear capacity of 4.7 kip (20.9 kN) giving a total expected shear capacity of 29.0 kip (129.0 kN) which is considerably below the 44.1 kip (196.2 kN) capacity given for the "shear-

21
sufficient girders," but closer to and yet below the shear corresponding to moment capacity (i.e., 36.8 kips (163.7 kN)).
NSM Bars. Since NSM technology is not covered by existing design guidelines,
strengthening using NSM was determined using a program created by Co-Force America, Inc (2003). This program takes into account the amount of concrete cover for the existing internal reinforcement, the average bond stress for the adhesive, and the angle of insertion.
Each bar was approximately 10 inches (254 mm) long and was placed at a 45-degree
angle to enhance its shear capacity. By iteration a center-to-center spacing of 3 inches (76 mm) was determined adequate for the girders giving a total shear capacity of 35.9 kip (159.7 kN). This value is smaller than that given by the "shear-sufficient girders," but greater than that given by the U-Wrapped girder. 5.4. GIRDER DEFLECTION ANALYSIS Deflection for each strengthening scheme was determined using structural analysis. Based on the expected failure load, maximum deflections were determined for all girders as shown in Table 5-3.
Table 5-3: Deflection Analysis
Specimen Theoretical
Displacements(in.)
Control 0.9 1-Sufficient 2.6
1-UW 2.0 1-NSM 2.5
2-Sufficient 2.6 2-NSM 2.5

22
6. EXPERIMENTAL RESULTS
6.1. INTRODUCTION
Following girder testing, test readings, measurements, and observations were compiled to determine the effectiveness of each testing scheme. First, actual failure loads and failure modes were compiled to compare and tabulate experimental results with calculated values (Table 6-1).
Table 6-1: Expected Versus Observed Results
Specimen PFLEX Vu,m
(kips)
PSHEAR Vn
(kips)
Expected Failure Mode
Observed Failure Load
Ve(kips)
Observed Failure Mode
Ve/ Min {Vu,m,
Vn}
Control 13.4 24.3 Flexure 19.2 Flexure 1.43 1-Sufficient 36.8 44.1 Flexure 26.8 Flexural FRP debond 0.73
1-UW 36.8 29.0 Shear 29.2 Shear w/ FRP debond 1.01 1-NSM 36.8 35.9 Shear/ Flexure 34.7 Flexural FRP debond 0.97
2-Sufficient 36.8 44.1 Flexure 33.5 Flexural FRP debond 0.91 2-NSM 38.5 35.9 Flexure 31.3 Flexural FRP debond 0.87 (1 kip = 4.448 kN)
Strain and deflection readings were also taken for each girder. Strain graphs were
constructed to compare the strain in each part of the girder to the applied load. This data provided valuable information as to the load distribution between concrete and FRP as well as the basis to evaluate failure mechanisms of the girders.
Deflection data was also recorded for each girder. Load-deflection graphs were
constructed to determine the level of deflection that occurred with subsequent increases in load. These curves provide useful information on serviceability as well as effectiveness of bond and FRP stiffness.
6.2. GENERAL OBSERVATIONS
6.2.1. Failure Modes. The expected testing failure modes were shear and flexure. To force shear failure to occur, flexural strengthening was added to each girder. Shear failure was only seen in 1-UW, however, which occurred in combination with shear FRP debonding. All other strengthened girders experienced flexural FRP debonding. Due to the debonding failure, anchorage was provided on the final girder. The introduction of the anchorage, nevertheless, did not prevent debonding failure of the girder.
Flexure. Flexural failure was experienced in the control girder. This type of failure
mode consisted of the flexural tendons elongating and breaking upon failure. This failure mode

23
was expected for all girders without any FRP strengthening according to calculations made using ACI 318-99 (1999).
Shear. 1-UW strengthened using CFRP U-Wraps was the only girder to clearly
experience shear failure, which occurred concurrently with shear U-Wrap debonding (Figure 6-1). Since debonding occurred, the added capacity of the U-Wraps could not be fully utilized. Shear failure consisted of shear cracks developing in the constant shear regions of the girders (between the load knives and the girder supports). Upon initiation, cracks propagated at a 60-degree angle, which is characteristic for prestressed girders. Once a crack propagated through the cross section of the girder, failure occurred as pictured below.
Figure 6-1: 1-UW Shear Failure
Flexural FRP Debonding. Girders 1-Sufficient, 1-NSM, 2-Sufficient, and 2-NSM all
experienced flexural FRP debonding failure (Figure 6-2). This type of failure was characterized by pieces of FRP and concrete detaching from the girders. Prior to actual failure, a popping noise could be heard giving the indication that the FRP was starting to debond from the concrete. This failure type happened at a load below that of the shear failure expected by analysis.
6.3. TEST RESULTS
6.3.1. Control. The girder failed in flexure at a load of 19.2 kips (85.5 kN), that is a bout 30% better than the expected value of 13.4 kips (59.6 kN). The girder experienced major flexural and shear cracking during testing with failure commencing with the breaking of the prestressing strands.
6.3.2. 1-Sufficient. 1-Sufficient was strengthened in such a way as to evaluate the effect
the quality of FRP installation. The expected failure mode for 1-Sufficient was flexure with a load near 36.8 kips (163.7 kN). Before this load could be reached, however, the girder failed due to FRP debonding. At a load of 26.8 kips (119.2 kN), the three soffit plies debonded from the surface of the concrete. At this point, the girder was unloaded to more closely examine delamination. Upon inspection of the debonded flexural laminates, the defects introduced during installation could clearly be seen.

24
1-Sufficient 1-NSM
2-Sufficient 2-NSM
Figure 6-2: FRP Debonding Failure in Four Girders
Figure 6-3: Existing Defects on Flexural FRP of 1-Sufficient
Once the initial debond was investigated, the girder was reloaded until debonding of the
lateral plies occurred at a load of 20 kips (89 kN). The debonding in the lateral plies occurred similarly to that of the soffit plies.
During the five loading cycles shear cracks were observed in the girder (Figure 6-4). The
cracks were marked for each load cycle. The shear cracks grew with subsequent increases in

25
load. Although shear cracks were observed they did not lead to any decrease in load. Upon final inspection of the girder, the concrete substrate showed only small shear cracks.
Figure 6-4: 1-Sufficient Shear Cracks
Strain readings were taken on the flexural FRP and the compression flange of the
concrete and plotted as shown in Figure 6-5. The concrete strain was measured in the middle of the flange at the midspan of the girder (gage E). Strain readings were gathered on the flexural FRP at midspan on the soffit plies (gage A), at the midspan both at 1.5 inches (38 mm) (gage C) and 2.5 inches (64 mm) (gage D) down on the lateral plies, and on the soffit plies in the constant moment region at a distance of 2 feet (610 mm) away from midspan (gage B) (Figure 6-5).
-2000 0 2000 4000 6000 8000Strain (µ)
0
10
20
30
App
lied
Load
(kip
s)
ABCDE

26
E
B ADC
2 Feet
Figure 6-5: Flexural FRP Strain for 1-Sufficient Since strain readings were taken in both the compression and tension sides of the girder
at the midspan, an experimental moment-curvature relationship can be established (Figure 6-6). This relationship gives valuable information as to the deflection and strain of the girder at midspan. It shows that the cracking moment occurred at a moment of 30.6 kip-ft (41.5 kN-m). This value is lower than that given in the calculations for the girder.
The maximum FRP strain found at failure was 8100µε occurring at Gage A. The strain
reading taken at Gage B gave a comparable result to that of Gage A with a maximum strain recorded of 7600µε. Readings were taken at the midspan on the lateral plies to evaluate change in strain throughout the cross section of each girder and gave values of 6105µε and 3500µε for Gages C and D, respectively. The concrete strain at failure (Gage E) was recorded to be -1100µε.
0 0.0002 0.0004 0.0006 0.0008 0.001Curvature (1/µin)
0
200
400
600
800
1000
Mom
ent (
kip-
in)
Figure 6-6: Experimental Moment-Curvature Relationship for 1-Sufficient
All readings show that for the first 10 kips of load the strain increased at a fairly rapid
rate. From there, the concrete strain at Gage E continued to climb at about the same rate with a mild degree of rate decrease.

27
DCVTs were used as shown in Figure 4-11 to record girder deflection. The DCVTs
were used to measure total deflection of the girder (Figure 6-7). This was done by taking the average of the deflections at the load points and adding the absolute value to the absolute value of the average of the deflections at the center of the girder. Looking at the results, the load-deflection graph shows that the total deflection at failure was a little over 1.7 inches (43.2mm). The deflection was lower than the analytically calculated value of 2.6 inches (66 mm). The deflection graph was linear for the first 6 kips of applied load. From there, the amount of deflection change kept increasing at a more and more rapid rate as additional load was applied until around 10 kips. From there, the deflection increased at a steady rate until failure.
0 0.4 0.8 1.2 1.6 2Deflection (in)
0
10
20
30
App
lied
Load
(kip
s)
Figure 6-7: Load Deflection Graph for 1-Sufficient
6.3.3. 1-UW. 1-UW, strengthened in shear with CFRP U-Wraps, failed in combined
shear and debonding. The girder was subjected to five cycles of increasing load and failed at a load of 29.15 kips (129.7 kN).
Observations taken upon failure show several substantial shear cracks in the girder.
These cracks started at a relatively low load and propagated with each new successive load increase. During testing, the shear U-Wraps began to debond, thus reducing their shear capacity contribution to the girder. The failure exhibited the characteristic PC cracking at a 60-degree angle. Inspection of the crack showed elongation of the prestressing strands, but no rupture occurred.

28
Strain readings were taken on 1-UW to observe the strain in the shear U-Wraps during load application up to failure. Five (5) strain gages were placed on the U-Wraps as shown in Figure 6-8 with gages A, B, and E giving reliable data. The first crack occurred at gage A. The crack was characterized by a sudden increase in strain near a load of 21 kips. After initial cracking the crack propagated with increasing load as shown on the graph until girder failure. Gage A gave the highest strain level of all three gages with a maximum strain of 3380µε. The cracking shown at gage B occurred slightly after that of gage A. The cracking for gage B initiated at a higher load than gage A and then propagated at about the same level as the strain in gage A giving a slightly lower ultimate strain. Gage E experienced a continuation of the cracking started at gage B. Crack propagation occurred slowly and culminated with the failure of the girder.
0 1000 2000 3000 4Strain (µ)
0000
10
20
30
App
lied
Load
(kip
s)
E
AB
A B
C
D
E
Figure 6-8: Shear U-Wrap Strain Graph for 1-UW
1-UW experienced an average girder deflection as compared to the other strengthened girders. The deflection started out being linear up to a load of around 10 kips. From there the deflection increased with increasing load at a steady rate up to failure. The total deflection at failure was 1.8 inches (45.7mm) falling 0.2 inches (5 mm) below that predicted by analysis.

29
6.3.4. 1-NSM. 1-NSM was strengthened in shear with NSM bars and had an expected
failure mode of shear at an ultimate load of 35.9 kips (159.7 kN). 1-NSM failed similarly to 1-Sufficient, however, experiencing flexural FRP debonding failure despite the presence of anchors in the end zones. The girder was tested up to five cycles with failure occurring at a load of 34.7 kips (154.4 kN). Shear cracks were observed during loading, but observations were hindered due to the presence of the NSM and CFRP. All observed shear cracks propagated slowly with no shear failure being imminent.
0 0.5 1 1.5 2 2De
.5flection (in)
0
10
20
30
App
lied
Load
(kip
s)
Figure 6-9: Load Deflection Graph for 1-UW
During testing, examination of the debonding failure showed the initial areas of debond
started towards the midpoint of the girder and propagated outward in both the lateral and soffit plies. The flexural anchorage acted to partially impede the propagation of debonding in the shear zone. In the U-Wrap anchored region the debond propagation terminated at the location of the U-Wrapped anchor (Figure 6-10). In the GFRP anchor region, propagation of the top two soffit plies continued while the bottom, anchored ply remained bonded to the girder (Figure 6-11).

30
Figure 6-10: Debond Termination in U-Wrapped Anchored Region
Figure 6-11: Anchored FRP Remaining After FRP Debond
Strain readings were taken on the NSM bars to observe shear behavior with gages B, D,
and E giving reliable data (Figure 6-12). Because shear failure did not clearly occur, the strain values remained relatively low. The maximum strain for the girder was 3850µε occurring in the most heavily cracked area of gage B. This high strain shows a high level of crack propagation in the girder. Gages D and E, in a lightly cracked area, showed the strain at failure to be 1800µε. Since cracking was not as extensive in this area, the maximum strain reached was less than that of the highly cracked area.
Deflection observations taken for 1-NSM showed a deflection level similar to that of 1-UW of slightly more than 1.3 inches (33.0mm). As with the 1-UW girder the deflection increased linearly up to a load of around 10 kips. From that point the deflection in the girder increased with increasing load at a steady rate. The total deflection experienced in the girder was significantly less than that predicted through analysis. According to analysis, a deflection of 2.5 inches (64 mm) was expected for the girder. Reasons for the difference in deflection are discussed in the next Chapter.
6.3.5. 2-Sufficient. 2-Sufficient was a girder strengthened in flexure only, without the
defects of 1-Sufficient. Anchors were also used as an added protection against debonding failure

31
in the end zones. As in 1-Sufficient, the expected failure mechanism for 2-Sufficient was flexure with an ultimate load of 36.8 kips (163.7 kN). Failure of 2-Sufficient occurred at a maximum load of 33.5 kips (149.1 kN), lower than the expected shear capacity. The failure mode for the girder was flexural FRP debonding; however, upon examination after failure, large shear cracks could be seen (Figure 6-15).
The debonding failure initiated at the midspan of the girder and propagated outward,
toward the U-Wrap anchored region where shear effects were greatest (Figure 6-15). Because of significant shear cracks in the U-Wrap anchored region, the debonding ripped the U-Wrapped anchors off the girder with large amounts of concrete still attached to it (Figure 6-14). The characteristic 60-degree crack can also be seen.
0 1000 2000 3000 4000Strain (µ)
0
10
20
30
40
App
lied
Load
(kip
s)
BDE
BA EDC
Figure 6-12: Shear NSM Strain Graph for 1-NSM

32
0 0.4 0.8 1.2 1.6Deflection (in)
0
10
20
30
40
App
lied
Load
(kip
s)
Figure 6-13: Load Deflection Graph for 1-NSM
Figure 6-14: 2-Sufficient Shear Crack at Debond

33
Figure 6-15: 2-Sufficient FRP Debonding Failure
Strain readings were gathered on the FRP at the midspan on the soffit plies (gage A), at the midspan both at 1.5 inches (38 mm) (gage C) and 2.5 inches (64 mm) (gage D) down on the lateral plies, and on the soffit plies in the constant moment region at a distance of 2 feet (610 mm) (gage B) away from midspan. The maximum strain at Gage A was 12100µε with a similar reading of 11000µε at Gage B. The lateral strains were 9500µε and 8600µε at Gage C and Gage D respectively. These values are greater than those obtained for 1-Sufficient and account for the increase in bond due to lack of defects and additional anchorage. The strain value stayed approximately zero up to a stress of approximately 10 kips (44.5kN). From there, a significant increase in strain was noticed as the stress increased showing the initiation and propagation of shear cracking.
0 4000 8000 12000 16000Strain (µ)
0
10
20
30
40
App
lied
Load
(kip
s)
ABCD
AC D
B
2 Feet
Figure 6-16: Flexural FRP Strain Readings for 2-Sufficient

34
Deflection readings taken for 2-Sufficient showed the highest level of deflection for all the girders being approximately 2.25 inches (57.2 mm). This value is close to the predicted value of 2.6 inches (66 mm).
6.3.6. 2-NSM. 2-NSM was strengthened with NSM bars as in 1-NSM with additional
anchorage provided at mid-span to prevent a debonding failure of the flexural FRP. Despite the additional anchorage, however, the girder failed due to flexural FRP debonding. Debonding initiated in the constant moment region with failure occurring there between the midspan and support at the U-Wrapped anchored end. No debonding propagation was evident from the midspan toward the GFRP spike-anchored region.
The expected failure mode for 1-NSM and 2-NSM was a shear failure at a load of 35.9
kips (159.7 kN). The maximum load reached before failure was 31.3 kips (139.3 kN), similar to that of 1-NSM. Significant shear cracks were present in the girder upon failure (Figure 6-18). Sections of concrete remained attached to the FRP during debonding and showed shear crack propagation through the girder.
0 0.5 1 1.5 2 2Deflec
.5tion (in)
0
10
20
30
40
App
lied
Load
(kip
s)
Figure 6-17: Load Deflection Graph for 2-Sufficient

35
Figure 6-18: Shear Cracks
Strain readings were gathered on the FRP at the midspan on the soffit plies (gage A), at
the midspan both at 1.5 inches (38 mm) (gage C) and 2.5 inches (64 mm) (gage D) down on the lateral plies, on the soffit plies in the constant moment region at a distance of 2 feet (610 mm) away from midspan (gage B), on the double U-Wrap anchor (G), and on four NSM bars as shown in Figure 6-19.
The maximum strain was 12950µε located at Gage B. This value is twice as high as
those found at the midspan of the girder. Upon further examination, it was determined that Gage B was positioned at the location of a crack. The strain reading at Gage A, midspan soffit, equaled 6750µε while the lateral strain was 5350µε and 5000µε at Gage C and Gage D respectively.
0 4000 8000 12000 16000Strain (µ)
0
10
20
30
40
A BCDEF
G A
ppliedLoad
(kips)

36
FEB A
C D
2 Feet
Figure 6-19: Flexural FRP and Shear NSM Strain Graph for 2 NSM Measurements taken on the U-Wrap anchors showed negligible strain during testing. The
maximum reading taken at failure was 350µε. Almost no strain was noticeable until an applied load of approximately 20 kips (89.0kN) was reached. From there, the strain increased as crack propagation ensued.
Strain readings taken in the NSM showed varied results. All readings were taken at the
GFRP anchored end of the girder where failure did not occur. Two readings showed negligible values of strain indicating no shear cracks present and are not shown on the graph. The remaining two readings (Gage E and Gage F), which were in contact with shear cracks, showed similar results to those of 1-NSM having strains measuring 2700µε and 2400µε respectively.
FRP debonding did not originate at the midspan. In 2-NSM the debonding failure
occurred near Gage B and propagated toward shear end where shear cracking was observed. Strain readings taken Gage B showed a value of 12950µε, significantly higher than those found at midspan.
Deflection readings taken for 2-NSM showed the lowest level of total deflection for all
the strengthened girders. The total deflection at failure for the girder was close to 0.9 inches (22.9 mm). This deflection was close to that of the 1-Sufficient girder and more than 1 inch (25.4 mm) lower than that for all other strengthened girders. As with 1-NSM, it is much lower than the predicted value of 2.5 inches (64 mm).

37
0 0.2 0.4 0.6 0.8 1Deflection (in)
0
10
20
30
40
App
lied
Load
(kip
s)
Figure 6-20: Load Deflection Graph for 2 NSM

38
7. DISCUSSION
7.1. INTRODUCTION
Utilizing girder calculations, test observations, and test data a comparison of each strengthening system's performance was determined. Based on performance, a strengthening scheme for field use can be established. These findings are applicable to the test parameters mentioned in the background and analysis sections, and provide valuable information for future in-situ strengthening programs.
7.2. CONTROL GIRDER
The control girder failed at an applied load of 19.2 kips (85.4 kN) in a flexural failure mode as expected. The Control was tested in order to have a basis to compare all other girder data. The value of 19.2 kips (85.4 kN) was higher than the calculated value of 13.4 kips (59.6 kN). Therefore, 19.2 kips (85.4 kN) as experimentally obtained, was used as the basis load for all other girders to be compared.
7.3. SHEAR-SUFFICIENT GIRDERS
The "shear-sufficient girders" were tested to provide a target shear strength for all shear strengthened girders. Each "shear-sufficient girder" was strengthened with flexural FRP to force shear to get closer to be the controlling failure mechanism. Flexural failure was calculated to occur at a load of 36.8 kips (163.7 kN), minimum. Testing of both 1-Sufficient and 2-Sufficient showed that they experienced a flexural FRP debonding failure mode. This failure occurred at 26.8 kips (119.2 kN) for 1-Sufficient and 33.5 kips (149.1 kN) for 2-Sufficient. 1-Sufficient was strengthened to show the effects of poor installation with numerous delamination defects equaling about 10% of the total bonded area. The experimental capacity of this girder was at 73% of the calculated load. To determine whether or not there is a relationship between the area of defects and decreased load capacity, more tests need to be conducted. 2-Sufficient's test values were the only ones to be used as a comparison with all other girders.
Although 2-Sufficient came closer to the calculated value, the test results show that,
because FRP debonding failure occurred, the capacity calculated according to ACI 440.2R-02 (2002) could not be achieved. In the ACI calculations the term 'km' (Equation 7 and Table 5-2) is used to apply a strain limitation to the beam to account for debonding.

39
k m1a1
60 ε fu⋅⎛⎜⎝
⎞⎠
1n 1 E f⋅ t f⋅
2000000lbfin
−⎛⎜⎜⎝
⎞
⎠
⋅⎡⎢⎢⎣
⎤⎥⎥⎦
0.9< n 1 E f⋅ t f⋅ 1000000lbfin
<if
160 ε fu⋅
⎛⎜⎝
⎞⎠
500000lbfin
n 1 E f⋅ t f⋅
⎛⎜⎜⎝
⎞
⎠⋅
⎡⎢⎢⎣
⎤⎥⎥⎦
0.9< otherwise
⎡⎢⎢⎢⎢⎢⎢⎣
⎤⎥⎥⎥⎥⎥⎥⎦
:=
(7)
This expression is based on generally recognized trends and engineering experience.
Because the coefficients in the equation are empirically derived, there is room for error in their calibration. One of the sources of that error may come from the fact that the tested girders were PC rather than reinforced concrete members as mainly used for the calibration. As more research work is conducted, the expression for the term 'km' will be improved and become more general.
The target value for the deficient girders was considered to be the experimental result of
2-Sufficient, the sufficient girder without defects. A comparison with the Control showed an increase in experimental capacity of 14.3 kips
(68.6 kN) or 74% for the 2-Sufficient girder. This increase is achieved due to the presence of more steel stirrups and the added flexural strengthening.
The amount of flexural strain in 1-Sufficient, strengthened with defects and without
anchors, was significantly less than that of 2-Sufficient. The maximum midspan flexural strain on 1-Sufficient was found to be 8100µε as compared to a maximum value on 2-Sufficient of 12100µε. The absence of defects and the addition of end anchors provided a more intimate bond between the FRP and concrete substrate of 2-Sufficient. Due to the increase of bond, more load was transferred from the concrete to the FRP causing numerous and large shear cracks corresponding to high values of FRP strain.
Because of the defects present in 1-Sufficient, fewer cracks were able to occur and were
not able to propagate at the same extent as in 2-Sufficient. The lesser extent of cracks caused the strain in 1-Sufficient to be far less than that of two sufficient.
The maximum midspan flexural strain in 2-Sufficient was the highest experienced and
surpassed that of the expected, calculated value. Based on to material properties and according to ACI 440.2R-02, the maximum strain attainable for the CFRP laminate systems is 11000µε given by Equation 8. The 12100µε value for 2-Sufficient shows that the observed strain was higher than the predicted value.
ε fe min 0.003h c−
c⎛⎜⎝
⎞⎠
⋅ ε bi−
k m ε fu⋅
⎡⎢⎢⎣
⎤⎥⎥⎦
:=
(8)

40
The maximum total deflection for 2-Sufficient was 2.03 inches (51.6 mm). This value was the highest observed from all the strengthened girders and is close the expected value of 2.6 inches (66 mm). The 1-Sufficient girder had one of the lowest deflection values seen at approximately 1 inch (25.4 mm) of deflection. This value is significantly less than that expected. 2-Sufficient carried a much higher load than 1-Sufficient and, therefore, experienced a higher level of deflection.
7.4. U-WRAPPED STRENGTHENED GIRDER
Being the only girder to fail in a combination of shear failure and shear FRP debonding, 1-UW failed at a load of 29.2 kips (129.9 kN) almost identical to the calculated value from analysis. In contrast with the sufficient girders, however, this time the delamination occurred on the shear FRP. As with the flexural debonding, the shear debonding according to ACI 440-2R.02 also depends on a knock-down factor, kv, (Equation 9 and table 5-2), giving a limit to the level of FRP strain. This value was derived based on data and knowledge from RC girders rather than PC members.
ε fe min k v ε fu⋅
0.004
⎛⎜⎝
⎞
⎠
:=
(9)
Aside from this, comparing the results of Control with those of 1-UW reveals that the use of the CFRP U-Wraps for shear strengthening increased the failure load from 19.2 kips (85.4 kN) to 29.2 kips (129.9 kN). This 10 kip (44.5 kN) increase in capacity corresponds to a 52% increase in strength for the 1-UW girder. Even though adding shear strengthening significantly increased the load carrying capacity, this increase did not equal the level of strength of the "shear-sufficient girder." 1-UW did not experience flexural FRP debonding, but rather shear FRP debonding.
The strain found in the U-Wraps at failure was a close to the calculated value given by
the cited ACI guide. The maximum strain found in the U-Wraps was 3380µε. The strain values remained zero until a load near 21 kips (93.4kN) was reached in the girder. At this load the strain gages came into contact with shear cracks and the strain level sharply increased. According to ACI 440.2R-02, the maximum strain to rupture is 3841µε, which is about 450µε higher than that seen in the girder. This shows the level of cracking in the U-Wrap region and accounts for the combined shear and FRP debonding failure modes.
The deflection in 1-UW was measured at 1.8 inches (45.7 mm) at failure. This value is
short of the predicted value of 2.0 inches (51 mm). The calculated value was found based on the predicted capacity of the girder.
7.5. NSM CFRP BAR STRENGTHENED GIRDERS
Both 1-NSM and 2-NSM experienced flexural FRP debonding failure. The expected failure mode was shear at a load of 35.9 kips (159.7 kN). Neither girder was able to carry the

41
calculated failure load with 1-NSM failing at a load of 34.7 kips (154.4 kN) and 2-NSM failing at a load 31.3 kips (139.2 kN). Because the design of NSM strengthening is not covered in ACI 440.2R-02, there is limited experience in predicting the performance of this strengthening technique.
The expected failure mode not withstanding, both girders provided an average addition in
load capacity of 14 kips (62 kN) over Control, an increase of 58%. This increase in capacity is at the level of the strength given by the "shear-sufficient girder". 2-sufficient showed a capacity of 33.5 kips (149.0 kN), which is very close to the average of 33 kips (147 kN) of the two NSM girders.
Strain readings taken from 2-NSM at midspan showed a low strain value. The midspan
strain for 2-NSM read 6750µε. This low strain value occurred due to limited cracking in the strain gage region. For 2-NSM heavy cracking did not occur at the midspan of the girder. The major cracking seen in the girder took place at strain gage B (Figure 6-19). The strain reading taken at this location showed a maximum strain value of 12950µε, which is comparable to the maximum strain of 2-Sufficient taken at the midspan where debonding initiation occurred. These comparable values indicate that debonding failure occurred at approximately the same FRP strain level.
Strain readings were also taken on the CFRP bars for both 1-NSM and 2-NSM. For 1-
NSM maximum strains of 3850µε and 1800µε were recorded. The higher reading was taken at a point near a shear crack, while the lower reading was taken at a point away from a shear crack. 2-NSM recorded maximum CFRP bar strains of 2700µε and 2400µε. Both of these reading were near a shear crack.
Deflection data was gathered for both 1-NSM and 2-NSM. The maximum value found
for 1-NSM was 1.3 inches (33.0 mm). For 2-NSM, the deflection value was 0.9 inches (22.9 mm). When compared to the expected deflections, the experimental values are smaller. The expected deflection of the two girders was 2.5 inches (64 mm).
7.6. DESIGN CONSIDERATIONS
FRP is a relatively new technology and, as such, there is a need for calibration of the interim design algorithms. It is apparent that debonding of FRP is the key issue. Since it is rather difficult to obtain an experimental situation where shear failure is the controlling failure mode even after strengthening, the validity of the algorithms proposed by ACI 440.2R-02 for shear cannot be proven unequivocally.
By considering the ratio between experimental and predicted load as shown in the last
column of Table 6-1, it is apparent that for shear-strengthened girders (would it be U-Wrap or NSM CFRP technology), there is a reasonably good match between performance and expectation. The correct formulation of the factors that account for FRP delamination and the synergism of combined mechanisms of failure need further work.

42
8. CONCLUSIONS
8.1. EFFECTS OF CFRP SHEAR STRENGTHENING
The combination of flexural and shear CFRP strengthening of the "shear-deficient girders" provided a sizeable increase in strength over the unstrengthened control girder. For the U-Wrap strengthened girder, a 52% increase occurred over Control, but it fell 13% short of the experimental target consisting of the “shear-sufficient girder.” The NSM girders faired better in comparison and had an average 75% increase in strength over Control, and their average experimental value was approximately equal to the desired target. Therefore, a performance improvement with both CFRP schemes appears to be feasible.
Although both systems had an increase in experimental load capacity, neither system
achieved their calculated strength values based on ACI 440.2R-02 recommendations. This may be due to two reasons: a) the proposed algorithms were formulated using research mainly conducted on RC rather PC members; and b) there is a negative synergism of effects when both shear and flexure failures are likely to occur.
Special attention should focus on the debonding failure for both flexure and shear
strengthening. Even though predicted strains are close to computed values at the location of cracks, it appears that the safety of the prediction should be improved.
8.2. FUTURE WORK
Both the CFRP U-Wrap and NSM strengthened girders gave a significant increase in strength over the control girder and, for the latter, results were comparable in value to the "shear-sufficient girders". Since a small number of girders was tested in this program, it is difficult to determine if the values obtained can be generalized. Hence, testing a larger number of girders would create more confidence in the technology.
The main area that should be investigated, however, is the empirically derived
formulations given in the ACI provisional guide for bond-controlled failure as it relates to its occurrence in PC girders. In order to achieve this objective, testing needs to be conducted that can characterize the failure mechanisms of prestressed members operating under various strengthening and load conditions. In particular, testing should be performed on flexurally strengthened members with various levels of FRP reinforcement to determine the load and strain found in debonding failures. As a place to begin, a level of strengthening similar to that provided in this research could be tested in order to determine an accurate value for km for PC members. Once this km factor is developed, more experimental evidence should be gathered for the validation of kv as it relates to CFRP delamination in shear.
The second area that should be investigated is the effect of NSM shear strengthening on
girders of all types, especially PC girders. Since NSM bars are slot-placed, they behave

43
distinctly from the externally bonded FRP systems. Therefore, it is desirable to develop design algorithms specifically suitable to this technique. To this end, testing should be conducted to generate a sufficient database. A design guide should then be developed similarly to that given for externally bonded CFRP reinforcement to provide uniformity and ease of implementation in practice.
Aside from these two areas of future endeavor, testing should be conducted on PC girders
that take into account field conditions. Environmental effects such as humidity, UV exposure, temperature, and the like may have negative consequences on performance and, if this were the case, would have to be included in design algorithms in a logical fashion.

44
9. REFERNCES
ACI 440.2R-02 (2002). “Guide for the Design and Construction of Externally Bonded FRP Systems for Strengthening Concrete Structures,” American Concrete Institute, Farmington Hills, MI.
ACI 318-99 (1999). “Building Code Requirements for Structural Concrete,” American Concrete Institute, Farmington Hills, MI.
Arduini, M., Nanni, A., and Romagnolo, M., “Performance of Decommissioned RC Girders Strengthened with FRP Laminates,” ACI Structures Journal, Vol. 99, No. 5, Sept.-Oct. 2002, pp. 652-659.
Carolin, A., Nordin, H., and Taljsten, B. (2001). “Concrete Beams Strengthened with Near Surface Mounted Reinforcement of CFRP”. International Conference on FRP Composites in Civil Engineering, Volume 2. Teng Editor. pp. 1059-1066.
CoForce America (2003). Personal Communication. De Lorenzis, L. and Nanni, A., “Bond Between Near Surface Mounted FRP Rods and Concrete
in Structural Strengthening,” ACI Structures Journal, Vol. 99, No. 2, March-April 2002, pp. 123-133.
De Lorenzis, L. and Nanni, A., “Characterization of FRP Rods as Near Surface Mounted Reinforcement,” Journal of Composites for Construction, Vol. 5, No. 2, May 2001, pp. 114-121.
De Lorenzis, L. and Nanni, A., “Shear Strengthening of Reinforced Concrete Beams with Near-Surface Mounted Fiber-Reinforced Polymer Rods,” ACI Structural Journal, Vol. 98, No. 1, January-February 2001, pp. 60-68.
De Lorenzis, L., Nanni, A., and La Tegola, A. (2000). “Flexural and Shear Strengthening of Reinforced Concrete Structures with Near Surface Mounted FRP Rods,” Proc., 3 Conf. On Advanced Composite Materials in Bridges and Structures. Humar and Razaqpur, Editors, pp.521-528.
Eshwar, N. (2003). Personal Communication. Harms, M. D. (2004). Missouri Department of Transportation. Personal Communication. Hughes Brothers (2004). “Carbon Fiber Reinforced Polymer (CFRP) Bar Aslan 500”.
http://www.hughesbros.com/Aslan500htmlpages/Aslan500CFRPROD.pdf Kachlakipev, D. I. and McCurry, D. D. Jr. (2000). “Testing of Full-Size Reinforced Concrete
Beams strengthened with FRP Composites: Design Methods Verification”. SPR 387 Report for Oregon Department of Transportation and Federal Highway Administration.
Khalifa, A., Gold, W. J., Nanni, A., and Aziz, M. I. Abdel, “Contribution of Externally Bonded FRP to Shear Capacity of Flexural Members,” ASCE-Journal of Composites for Construction, Vol. 2, No. 4, Nov. 1998, pp. 195-203.
Khalifa, A. and Nanni, A., “Rehabilitation of Rectangular Simply Supported RC Beams with Shear Deficiencies Using CFRP Composites,” Construction and Building Materials, Vol. 16, No. 3, 2002, pp. 135-146.
Klaiber, F. W., Dunkiper, KIP. F., Wipf, T. J., and Sanders, W. W. (1987). “Methods of Strengthening Existing Highway Bridges.” National Cooperative Highway Restoration Program Representatives No. 293, Transportation Research Board, Washington, DC.
Master Builder/ Degussa (2004). “Concresive® 1420, General Purpose Gel Epoxy Adhesive”. http://www.chemrex.com/mbt/ASsets_mbt/pdf /142_tdg.pdf.

45
Sheikh, S. A., DeRose, D., and Mardukhi, J. (1999). “Retrofitting of Concrete Structures for Shear and Flexure with Fiber-Reinforced Polymers”. ACI Structural Journal No. 99-S47.
Triantafillou, T., and Plevris, N. (1991). “Post Strengthening of R/C Beams with Epoxy Bonded Fiber Composite Materials,” Proceedings, Conference On Advanced Composite Materials in Civil Engineering Structures., ASCE, New York, N.Y., 245-256.
Watson Bowman Acme (2004). “Wabo®MBrace,” http://wbacorp.com/downloads/DataSheets/Composites/MBraceCF130.pdf.
http://wbacorp.com/downloads/DataSheets/Composites/MbracePrimer.pdf. http://wbacorp.com/downloads/DataSheets/Composites/MBracePrimer.pdf.

APPENDIX A.
FLEXURAL STRENGTHENING OF RC MEMBERS WITH FRP COMPOSITES

47
Required Information about the Existing StructureSelect Units
System 1:= Selected system:1 -- US Customary2 -- SI
bft
ddp
d'
bw
bfb
As
Ap
tfb
As'
tft
h
Depth to the mild compression steel centroid, [in] or [mm]
Ap 2 0.085⋅:= Area of prestressing steel, [in 2] or [mm2]
dp 11:= Depth to the prestressing steel centroid, [in] or [mm]
Bond 1:= Type of tendon installation (Enter 1 for bonded, 0 for unbonded)
Load and Span InformationMu 48:= Factored moment to be resisted by the strengthened element, [k-ft] or [kN-m]
Ms 0.65Mu:= Service moment to be resisted by the strengthened element, [k-ft] or [kN-m]
Mip 0.65Mu:= Moment in place at the time of FRP installation, [k-ft] or [kN-m]
Mso 0.4Mu:= Original service moment before strengthening, [k-ft] or [kN-m]
Ln 0:= Clear span (Only if unbonded prestressing steel is used), [ft] or [m]
Lr 0:= Ratio of loaded spans to total spans (e.g., 0.5 for alternate bay loading)
Section Dimensionsh 14:= Total section height, [in] or [mm]
bw 5:= Width of web, [in] or [mm]
bft 18:= Width of top flange (zero for rectangular sections), [in] or [mm]
tft 4:= Thickness of top flange (zero for rectangular sections), [in] or [mm]
bfb 0:= Width of bottom flange (zero for rectangular or T sections), [in] or [mm]
tfb 0:= Thickness of bottom flange (zero for rectangular or T sections), [in] or [mm]
Reinforcement LayoutAs 0.00000001:= Area of mild tension steel, [in2] or [mm2]
d 11:= Depth to the mild tension steel centroid, [in] or [mm]
As' 0:= Area of mild compression steel, [in2] or [mm2]
d' 0:=
Material Property Specifications
f'c 6207:= Nominal compressive strength of the concrete, [psi] or [MPa]
εcu 0.003:= Maximum compressive strain for concrete, [in/in] or [mm/mm]
fy 60:= Yield strength of the mild steel, [ksi] or [MPa]
Es 29000:= Modulus of elasticity of the mild steel, [ksi] or [MPa]

48
Choose one:1 -- Interior Exposure2 -- Exterior Exposure3 -- Aggressive Exposure
Exposure_L 1:=
Choose one:1 -- MBrace CF-130 5 -- S&P Laminate 150/2000, 0.047" thick2 -- MBrace CF-530 6 -- S&P Laminate 200/2000, 0.047" thick3 -- MBrace AK 60 7 -- S&P Laminate 150/2000, 0.055" thick4 --MBrace EG 900 8 -- S&P Laminate 200/2000, 0.055" thick
Type_L 1:=
Choose one:1 -- Carbon2 -- Aramid3 -- Glass
Fiber_L 1:=
Choose one:1 -- FRP not present2 -- FRP present
Producer_L 2:=
Lateral (L)
Choose one:1 -- Interior Exposure2 -- Exterior Exposure3 -- Aggressive Exposure
Exposure_B 1:=
Choose one:1 -- MBrace CF-130 5 -- S&P Laminate 150/2000, 0.047" thick2 -- MBrace CF-530 6 -- S&P Laminate 200/2000, 0.047" thick3 -- MBrace AK 60 7 -- S&P Laminate 150/2000, 0.055" thick4 --MBrace EG 900 8 -- S&P Laminate 200/2000, 0.055" thick
Type_B 1:=
Choose one:1 -- Carbon2 -- Aramid3 -- Glass
Fiber_B 1:=
Choose one:1 -- FRP not present2 -- FRP present
Producer_B 2:=
Bottom (B)
Number of requested iterations (30 recommended; higher numbers increase precision and time computation)
q 30:=
Required FRP Design Information
Modulus of elasticity of the prestressing steel, [ksi] or [MPa]Ep 28500:=
Yield strength of the prestressing steel, [ksi] or [MPa]fpy 0.95 fpu⋅:=
Effettive stress in the tendons due to prestress, [ksi] or [MPa]fpe 0.8 fpu⋅:=
Ultimate strength of the prestressing steel:1 -- 250 ksi 3 -- 1720 MPa2 -- 270 ksi 4 -- 1860 MPa
fpu 2:=

49
Reduction factor for environmental exposure (Table 8.1, ACI 440F)Ce_L 0.95=Ce_B 0.95=
Creep rupture stress limit (Table 9.1 ACI 440F) Ccr_L 0.55=Ccr_B 0.55=
Nominal design thickness of one ply of the FRP, [in] or [mm]tf_L 0.0065=tf_B 0.0065=
Tensile modulus of elasticity of the FRP, [ksi] or [GPa]Ef_L 33000=Ef_B 33000=
Ultimate rupture strain of the FRP, [in/in] or [mm/mm]εfu_L 0.017=εfu_B 0.017=
Ultimate tensile strength of the FRP, [ksi] or [MPa]ffu_L 550=ffu_B 550=
LateralBottom
Layout of the FRP Reinforcement (Skip this section if FRP is NOT present)wB 4:= Width of FRP Bottom sheets [in ] or [mm]
NB 3:= Number of FRP Bottom sheets
wL 4:= Width of FRP Lateral sheets, [in] or [mm]
NL 1:= Number of FRP Lateral sheets
dL 10:= Depth to the top fiber of FRP Lateral sheets, [in] or [mm]
ψf 1:= Additional reduction factor for FRP (Eq. (9-2), ACI 440F)
Number of divisions for lateral strenghtening ( 30 recommended ; higher numbers increase precision and time computation )p 30:=
Result of the Flexural Strengthening Analysis
φ 0.9= φMn 99.3= Mu 48= Design moment capacity vs. moment demand, [k-ft] or [kN-m]
0.025 0.02 0.015 0.01 0.005 0 0.005
5
10
15

50
Knock down factorκm_L 0.891=
Knock down factorκm_B 0.677=
Strain at the bottom layer of FRP levelεf 0.0207=
Strain in the tension steelεs 0.01798=
Strain in the prestressing steelεp 0.01798=
Strain in the compression steelε's 0=
Maximum strain in the concreteεc 0.003=
Depth to the neutral axis, [in] or [mm]c 1.573=
Depth to the neutral axis for balanced failure, [in] or [mm]cb 1.54=
Failure_Mode "Concrete Crushing"=

APPENDIX B.
SHEAR STRENGTHENING OF RC MEMBER WITH FRP SHEETS

52
Required Information about the Existing StructureSelect Units
System 1:= Selected System1 -- US Customary2 -- SI
dfh d
dp
bw
As
Ap FRP
hs
Asva 0:= Area of additional shear reiforcement, [in2] or [mm2]
sa 0:= Spacing of additional shear reinforcement, [in ] or [mm]
αa 0:= Slope of inclined additional stirrups [deg]; enter 90 for vertical stirrups
Load and Span InformationVu 709:= Factored shear to be resisted by the strengthened element, [kips] or [kN]
Mu 500:= Factored moment occuring in the same section of Vu, [kip-ft] or [kN-m]. Enter 0 if Mu is unknown
Material Property Specificationsf'c 6207:= Nominal compressive strength of the concrete, [psi] or [MPa]
concrete 1:= Concrete contribution; enter 0 if Vc must be zero, 1 otherwise
fy 60:= Yield strength of existing steel reinforcement, [ksi] or [MPa]
fya 0:= Yiels strength of additional steel reinforcement, [ksi] or [MPa]
Section Dimensionsh 14:= Total section height, [in] or [mm]
bw 5:= Width of web, [in] or [mm]
hs 4:= Thickness of slab, [in] or [mm]
As 0:= Area of tensile flexural reinforcement, [in2] or [mm2]. Enter 0 if not known.
d 11:= Effective depth of mild tension steel, [in] or [mm]
dp 11:= Effecctive depth of prestressing steel, [in] or [mm]. Enter 0 if prestressing is NOT present
Reinforcement LayoutAsv 0.12:= Area of existing shear reinforcement, [in2] or [mm2]
s 8:= Spacing of shear reinforcement, [in] or [mm]
α 90:= Slope of inclined stirrups [deg ]; enter 90 for vertical stirrups

53
Required FRP Design InformationFRP Material Properties
Producer 2:= Choose one of the following:1 -- No FRP present2 -- FRP present
Fiber 1:= Choose one of the following:1 -- Carbon2 -- Aramid3 -- Glass
Type 1:= Choose one of the following:1 -- MBrace CF 1302 -- MBrace CF 5503 -- MBrace AK 604 -- MBrace EG 900
Exposure 1:= Choose one of the following:1 -- Interior Exposure2 -- Exterior Exposure3 -- Aggressive Exposure
ffu 550= Ultimate tensile strength of the FRP, [ksi] or [MPa]
εfu 0.017= Ultimate rupture strain of the FRP, [in/in] or [mm/mm]
Ef 33000= Tensile modulus of elasticity of the FRP, [ksi] or [GPa]
tf 0.0065= Nominal design thickness of one ply of the FRP, [in] or [mm]
CE 0.95= Reduction factor for environmental exposure (ACI 440.2R-02, Table 8.1)
Layout of the FRP Reinforcement (Skip this section if FRP is not present)
wf 2.5:= Width of the FRP strip, [in] or [mm]
sf 5.25:= Spacing of FRP strip center to center, [in] or [mm]; for continuous ply must be wf = sf
df 6:= Effective depth of the FRP reinforcement (see figure), [in] or [mm]
N 1:= Number of plies
β 90:= Slope of FRP strips respect to the axis of the beam. Enter 90 for vertical strips.
Wrap 3:= Choose one of the following (Selection affetcs κv and ψf values as per ACI 440.2R-02):1 -- Completely Wrapped Beam2 -- U-Wrap with End-Anchor3 -- U-Wrap Beam4 -- Two Sides Bonded Beam
cs_max 5.25= Maximum clear spacig of the strips according to ACI 440F, [in] or [mm]
cs 2.75= Clear spacing between strips, [in] or [mm]; cs must be less than cs_max.
sf_used 5.25= Used value for s f, [in] or [mm]
ψf 0.85= Additional reduction factor as per ACI 440.2R-02
κv 0.23= Bond dependant coefficient as per ACI 440.2R-02
φ 1:= Shear reduction factor as per ACI 318-99

54
Result of the Strengthening Analysis
Vc 14.4= Concrete Shear Contribution, [kips] or [kN]
Vs 9.9= Steel Shear Contribution, [kips] or [kN]
Vf 4.7= FRP Shear Contribution, [kips] or [kN]
φVn 29= Vu 28= Shear capacity vs. shear demand, [kips] or [kN]

APPENDIX C.
SHEAR STRENGTHENING OF RC MEMBER WITH NSM FRP BARS

56
Required Information about the Existing StructureSelect Units
System 1:= Selected System1 -- US Customary2 -- SI
rdh d
c
bw
As
hs
NSM bars
dh d
c
bw
As
Yield strength of existing steel shear reinforcement, [ksi] or [MPa]fy 60:=
Concrete contribution; enter 0 if Vc must be zero, 1 otherwise concrete 1:=
Nominal compressive strength of concrete, [psi] or [MPa]f'c 6207:=Material Property Specifications
Factored shear force to be resisted by the strengthened element, [kips] or [kN]Vu 23:=Load Information
Slope of inclined stirrups [deg ]; enter 90 for vertical stirrups α 90:=
Spacing of shear reinforcement, [in] or [mm]s 8:=
Area of existing shear reinforcement in the form of steel stirrups, [in 2] or [mm2]Asv 0.12:=Reinforcement Layout
Effective depth of mild tension steel (use centroid if more than one layer is used), [in] or [mm]
d 11:=
Thickness of slab, [in] or [mm]hs 4:=
Width of web, [in] or [mm]bw 5:=
Total section height, [in] or [mm]h 14:=Section Dimensions

57
Required NSM Bars Design InformationFRP Bar & Condition Selection
ProducerNoneHughes
:= MaterialAslan GFRPAslan CFRP
:=
Type#4Tape
Material
:= ExposureInterior ExposureExterior ExposureAggressive Environment
:=
By selecting different Exposure conditions, the environmental reduction factor, CE, varies according to ACI 440.2R.02, Table 8.1
Design Values
ffu 300= Ultimate tensile strength of the NSM bar, [ksi] or [MPa]
εfu 0.017= Ultimate rupture strain of the NSM bar, [in/in] or [mm/mm]
Ef 18000= Tensile modulus of elasticity of the NSM bar, [ksi] or [GPa]
CE 0.95= Reduction factor for environmental exposure (ACI 440.2R-02, Table 8.1)
a 0.079=FRP dimensions when using a rectangular bar, [in] or [mm]
b 0.63=
Strength reduction factor for shear (ACI 318-99)φ 1:=
Additional strength reduction factor for NSM bars (ACI 440.2R-02)ψf 1:=
Strength Reduction Factors
Average bond stress (1.0 ksi or 6.89 MPa is recommended), ksi or [MPa](See note at the end of the program)
τb 1:=
Concrete cover for existing longitudinal steel reinforcement (see Figure), in or [mm]c 1.8:=
Slope of NSM bars, [degrees]αf 45:=
Length of NSM bars, [in] or [mm]dr 11.3:=
Spacing of NSM bars center to center, [in] or [mm]sf 3:=
Layout of the FRP Reinforcement (Skip this section if NSM bars are not present)

58
Result of the Shear Strengthening Analysis
Vc 8.7= Concrete Shear Contribution, [kips] or [kN]
Vs 9.9= Steel Shear Contribution, [kips] or [kN]
Vf 11.6= NSM Shear Contribution, [kips] or [kN]
φVn 30.2= Vu 23= Shear capacity vs. shear demand, [kips] or [kN]
Failure_Mode "Controlled by steel and NSM bars"=
Possible failure modes are:Controlled by steelControlled by steel and NSM barsConcrete crushing


