Evaluation of Food-for-Work (FFW) Component of … Grameen Rozgar Yojana (SGRY) in Selected...
56
Evaluation of Food-for-Work (FFW) Component of Sampoorna Grameen Rozgar Yojana (SGRY) in Selected Districts of Maharashtra Report Submitted to Planning Commission Manoj Panda Srijit Mishra Sangita Kamdar Mallikarjun Tondare Indira Gandhi Institute of Development Research, Mumbai April 2005
Transcript of Evaluation of Food-for-Work (FFW) Component of … Grameen Rozgar Yojana (SGRY) in Selected...
Evaluation of Food-for-Work (FFW) Component of
Sampoorna Grameen Rozgar Yojana (SGRY) in Selected Districts of Maharashtra
Report Submitted to Planning Commission
Manoj Panda
Srijit Mishra
Sangita Kamdar
Mallikarjun Tondare
Indira Gandhi Institute of Development Research, Mumbai
April 2005

FFW-SGRY/Mah/IGIDR/April 05 ii
Contents List of Tables iii List of Figures iii Acronyms iv Acknowledgements v Executive Summary vi1 Introduction 12 Objectives, Methodology and Selection of Districts 42.1 Objectives 42.2 Methodology 52.3 Selection of Districts 63 Survey of Beneficiaries 73.1 Individual/Household Characteristics of Beneficiaries Surveyed 93.1.1 Gender Distribution 93.1.2 Age Distribution 103.1.3 Social Group Distribution 103.1.4 Distribution by Size of Household 113.1.5 Distribution by Educational Status 113.1.6 Distribution by Marital Status 123.1.7 Distribution by Occupational Status 123.1.8 Distribution by Size of Land Owned 134 Efficiency and Effectiveness: Planning, Implementation and Monitoring 144.1 Planning 144.2 Implementation 144.2.1 Beneficiaries’ Views on Implementation 144.2.2 Details of Works in the Districts 154.2.3 Details of Zilla Parishad level Works 174.2.4 Details of Panchayat Samiti level Works 174.2.5 Details of Gram Panchayat level Works 184.3 Monitoring 195 Allocation, Lifting and Distribution of Foodgrains 205.1 Distribution of Foodgrains – Districts 205.2 Distribution of Foodgrains – Zilla Parishad level Works 215.3 Distribution of Foodgrains – Panchayat Samiti level Works 226 Quality, Quantity, Frequency and Timeliness of Foodgrains Distribution 226.1 Location of Wage Payment 226.2 Periodicity of Wage Payment 236.3 Satisfaction on Quality and Norm of Wage Payment 236.4 Wage Rate 247 Employment and Income of Beneficiaries 267.1 Number of Days of Employment 267.2 Income 287.3 Targeting 307.4 Individual Beneficiaries 328 Problems in Planning and Implementation and Role of PRIs 339 Recommendations 36 References 38 Annexures 39

FFW-SGRY/Mah/IGIDR/April 05 iii
List of Tables 1 List of Districts, Panchayat Samitis and Gram Panchayats Surveyed 62 Socio-Demographic Characteristics of Districts Under Study 73 Number of Schedules and Works Covered in the Districts under Study 74 Gender Distribution of Beneficiaries Interviewed (percentage) 95 Age Distribution of Beneficiaries Interviewed (percentage) 106 Caste Distribution of Beneficiaries Interviewed (percentage) 117 Distribution of Beneficiaries Interviewed by Size of Household (percentage) 118 Distribution by Educational Status of Beneficiaries Interviewed (percentage) 129 Distribution by Marital Status of Beneficiaries Interviewed (percentage) 1210 Distribution by Occupational Status of Beneficiaries Interviewed (percentage) 1311 Distribution of Beneficiaries Interviewed by Size of Land Owned (percentage) 1312 Wage Employment Beneficiary Respondents Responses on Some Aspects of Implementation
(percentage) 15
13 Details of the Stream-I Works in the Districts under Study, 2001-02 and 2002-03 1614 Details of the Stream-II Works in the Districts under Study, 2001-02 and 2002-03 1715 Details of the Zilla Parishad Works in the Districts under Study, 2001-02 and 2002-03 1716 Details of High/Low Utilization Panchayat Samitis (PSs) Works in the Districts under Study,
2001-02 and 2002-03 18
17 Details of Gram Panchayat works for High/Low Utilization Panchayat Samitis (PSs) in the Districts under Study, 2001-02 and 2002-03
19
18 Allocation, Lifting and Distribution of Foodgrains in the Districts under Study, 2001-02 and 2002-03
21
19 Allocation, Lifting and Distribution of Foodgrains in Zilla Parishad level Works of the Districts, 2001-02 and 2002-03
21
20 Allocation, Lifting and Distribution of Foodgrains in High/Low Utilization Panchayat Samitis (PSs) of the Districts, 2001-02 and 2002-03
22
21 Percentage of Wage Employment Beneficiary Respondents by Location of Wages Paid 2322 Percentage of Wage Employment Beneficiary Respondents by Periodicity of Wages Paid 2323 Percentage of Wage Employment Beneficiary Respondents by Level of Satisfaction of
Foodgrains Received 24
24 Percentage of Wage Employment Beneficiary Respondents Satisfied with Present Norm of Wages
24
25 Quantity of Foodgrains Received per Day by Wage Employment Beneficiary Respondents 2526 Agency wise Wage rate in SGRY (cash component only) 2627 Percentage Distribution of Wage Employment Beneficiary Respondents by Wage Rate
Received (all works; cash component only) 26
28 Agency wise Days of Employment Received by Wage Employment Beneficiary Respondents on SGRY Works
27
29 Percentage of Wage Employment Beneficiary Respondents by Number of Days of Employment Received on SGRY Works
27
30 Average Household Income of Beneficiaries from SGRY and Non-SGRY Sources 2831 Percentage of Wage Employment Beneficiary Respondents by Household Income from SGRY
Works 28
32 Percentage of Wage Employment Beneficiary Respondents by Household Income from Non-SGRY Sources
29
33 Percentage of Below Poverty Line (BPL) Cardholder Wage Employment Beneficiary Respondents by Social Groups
31
34 Number of Individual Asset Beneficiary Respondents by Household Income 3235 Number of Individual Asset Beneficiary Respondents by Assets Generated 33
List of Figures 1 Map of Maharashtra Highlighting Four Study Districts 22 District Poverty Incidence (%) and SGRY Income as a Percentage of Non-SGRY Income 303 Poverty Incidence among Wage Employment Beneficiary Respondent Households:
Comparison of their BPL Status and Poverty Estimates Based on Reported Income 32

FFW-SGRY/Mah/IGIDR/April 05 iv
Acronyms
APL Above Poverty Line BPL Below Poverty Line CPIAL Consumer Price Index number for Agricultural Labourers DRDA District Rural Development Agency EAS Employment Assurance Scheme EGS Employment Guarantee Scheme FFW Food For Work GP Gram Panchayat HDI Human Development Index IB Individual asset Beneficiary JGSY Jawahar Gram Samridhi Yojana NGO Non Governmental Organization PDS Public Distribution System PRI Panchayati Raj Institution PS Panchayat Samiti SC Scheduled Caste SGRY Sampoorna Grameen Rozgar Yojana ST Scheduled Tribe WB Wage employment Beneficiary ZP Zilla Parishad

FFW-SGRY/Mah/IGIDR/April 05 v
Acknowledgements
We gratefully acknowledge help received from officials at Rural Development
Department, Mantralaya, Mumbai, Zilla Parishad/DRDA of selected districts (Satara,
Aurangabad, Gadchiroli and Akola) and from the selected Panchayat Samitis and Gram
Panchayats in completing this study. While conducting field survey we took the help of
‘Matoshri Baranbai Bahuddeshiya Sanstha’ of Gadchiroli in Chamorshi, ‘Amhi Amachya
Arogyasathi’ of Kurkheda in Kurkheda and Satpuda Agriculture Society of Akot in Akola.
Raju Muddi helped in conducting fieldwork and subsequently in data entry for
Aurangabad and Satara districts. Most important is the time and cooperation (at times
during odd hours) of the respondents. Comments received from Rohini Nayyar and R.
Radhakrishna on an earlier draft and discussions with Jean Dreze by one of us have been
helpful in preparing the report. We thank all of them.

FFW-SGRY/Mah/IGIDR/April 05 vi
Evaluation of Food-for-Work (FFW) component of Sampoorna Grameen Rozgar Yojana (SGRY)
in Selected Districts of Maharashtra Manoj Panda, Srijit Mishra, Sangita Kamdar, Mallikarjun Tondare
Executive Summary
Introduction
The present study is an evaluation of the food-for-work component of Sampoorna
Grameen Rozgar Yojana (SGRY) in Satara, Aurangabad, Gadchiroli and Akola districts of
Maharashtra. SGRY was launched all over the country in 2001 with twin objectives - to
provide wage employment and food security and to create durable community, social and
economic infrastructure.
The specific objectives of the present study are:
• To assess the efficacy and effectiveness of food for work programme in terms
of planning, implementation and monitoring.
• To examine the allocation, off take and distribution of foodgrains at different
levels of implementation.
• To assess the quantity, quality, frequency and timeliness of distribution of food
grains.
• And, to identify constraints, if any, in implementation of the scheme and
suggest remedial measures.
Methodology
The objectives are analysed using primary data collected in March 2004 through a set of
structured questionnaire schedules canvassed among wage employment beneficiaries
(WBs) and individual asset beneficiaries (IBs) and secondary data collected from District
Rural Development Agency (DRDA) and Panchayati Raj Institutions (PRIs) – Zilla
Parishads (ZPs), Panchayat Samitis (PSs) and Gram Panchayats (GPs). This data analysis
has been supplemented by qualitative observations of the study team during field visits.
In each district, sampling design suggests choosing 28 works (four each from the
Zilla Parishad, two Panchayat Samitis and four Gram Panchayats) and canvassing a pre-
designed schedule to 140 wage beneficiaries, five from each of the 28 works. In addition,

FFW-SGRY/Mah/IGIDR/April 05 vii
15 individual beneficiaries, 5 from schemes of Zilla Parishad and 5 each from schemes of
the two Panchayat Samitis, are also to be canvassed. In practice, we could choose 28
works in three districts and 22 in Aurangabad. The total number beneficiaries to be
canvassed were 620 (155 in each district). We have analysed 526 schedules - 151, 101,
141 and 133 schedules from Satara, Aurangabad, Gadchiroli and Akola respectively.
Shortfall in sample coverage is partly because some beneficiaries were outsiders (in the
muster roll their address was bahargaon indicating that they were migrants and not from
villages in the vicinity) and partly because we decided to exclude the same individual in
different works and avoid multiple entries from the same family to avoid repetition in
basic information for the household.
Characteristics of Beneficiaries
Even though the sample design for the primary survey was not meant to be exactly
representative, delineating some characteristics of the sample respondents would be
helpful to understand some of the results. The beneficiaries in the sample are
predominantly male accounting for 85%. One reason for low female participation among
SGRY wage employment beneficiaries could be that males tend to replace females if
SGRY wage rate is higher than prevailing market wage rate for similar works in the same
season.
Most of the respondents belong to the 21-50 years age group. Nearly half or more
wage beneficiary respondents are scheduled castes (SCs)/scheduled tribes (STs) in all
districts except Satara. The modal family size of respondents consists of 4-5 members.
Among the wage beneficiary respondents 35% are illiterate, while 20% are
matriculates. A few of the wage beneficiary respondents are graduates. In Satara,
Aurangabad and Akola, large proportion of wage beneficiary respondents belongs to
agricultural labour class. But, in Gadchiroli wage beneficiary respondents are mostly
cultivators. About 35% of wage beneficiary respondents are landless in Gadchiroli
compared to nearly 70% in the other three districts.
Planning, Implementation and Monitoring
About 2.2% (3 of 138) respondents in Satara and 10.5% (14 of 134) respondents in
Gadchiroli mentioned about the involvement of contractors. All wage beneficiary
respondents except for 6.7% (9 of 134) in Gadchiroli agreed to muster rolls being
maintained in the programmes. However, in an ongoing work we found that the muster

FFW-SGRY/Mah/IGIDR/April 05 viii
roll was not maintained on a day to day basis and the concerned official told that as the
workers are here we will fill everything together after the work is over. All respondents
were ignorant about any beneficiary committee being set up after the completion of the
work. Most of the respondents denied villagers’ involvement in identifying works with felt
need, identifying beneficiaries and creating awareness. Larger proportion of respondents
(particularly in Akola and Gadchiroli) also said that works were not done on felt need.
Some respondents also indicated about non-availability of water, crèche and first aid at the
work site.
Compared to 2001-02 (implementation under Employment Assurance Scheme and
Jawahar Gram Samridhi Yojana (EAS/JGSY), in 2002-03 (implementation under SGRY)
Satara and Aurangabad substantially increased value of food distributed per manday under
stream-I of SGRY in 2002-03. Gadchiroli is the only district where there has been a
decline in the number of works, mandays generated and total expenditure. In Akola, the
number of works and mandays generated increased. Among the four districts, Akola has
the lowest share of foodgrains component paid as wages. In Satara and Aurangabad the
wage share on stream-II works remains more or less the same for the two years, but the
share of foodgrains component paid as wages has increased by nearly 25 percentage points
in the latter year. Mandays generated increased in the high utilization districts whereas it
decreased in the low utilization districts.
The implementing officials at the village level (gram sevaks) do not have copies of
the guidelines. They do not seem to have received any specific training in awareness
creation, beneficiary selection, record keeping and implementation.
There is a lack of proper coordination among various levels of administration in
terms of monitoring and supervision. Continuous meetings and other activities hamper
monitoring of works. There was no uniform record keeping, accounting practices and
reporting.
Foodgrains utilization
As per sampling design, Satara and Aurangabad are high utilization districts whereas
Gadchiroli and Akola are low utilization districts based on the percentage utilization of
foodgrains (distribution as per cent of allocation) in 2002-03. However, the utilization
rates vary considerably from one year to another. The percentage utilization in Satara is
considerably lower in the previous year, 2001-02. In contrast, the low utilization district of

FFW-SGRY/Mah/IGIDR/April 05 ix
Gadchiroli had much higher percentage utilization in 2001-02. Akola has the lowest
utilization in both these years.
Quality, Frequency and Timeliness
Let us now get back to the primary survey. The cash component of the wages was received
at the work site in three out of four districts. In Gadchiroli, wages were not paid at the
work site. Foodgrains component of wages was distributed at the work site in Akola, at
Public Distribution System (PDS) outlets in Gadchiroli and Satara, mostly through the
PDS outlet and a few at the work site in Aurangabad.
From wage beneficiary respondents, all in Akola and more than two-thirds in
Aurangabad received cash component of wages on a weekly basis, in Satara more than
two-fifths received it on a fortnightly basis and in Gadchiroli it was received either on a
weekly or a monthly basis and four reported receiving it after 5-6 months. Nearly 80% of
wage beneficiary respondents received foodgrains on a weekly basis in Akola and on a
fortnightly basis in Satara. In Aurangabad, the weekly and fortnightly foodgrains
distribution was equally prevalent. But, about two-thirds of the respondents in Gadchiroli,
which has law and order problem, received foodgrains on a monthly basis.
Wage beneficiary respondents received either rice or wheat or both in Satara and
Gadchiroli. All the wage beneficiary respondents received both rice and wheat in Akola,
while most respondents in Aurangabad received only wheat. The respondents were by and
large satisfied with quality of foodgrains received and reported that foodgrains received
were either of good quality or of average quality. In Aurangabad, more than 40% of the
wage employment beneficiaries reported that they were not satisfied with current norm of
wage fixation - minimum 5 kg of foodgrains per day (valued at Rs.26 for SGRY in
Maharashtra) and rest in cash.
Wage Rate, Employment and Income
More than 85% of the wage beneficiary respondents received the prescribed
minimum of 5 kg of foodgrains per day. About 8% (range 3-12%) of wage beneficiary
respondents received wages only in cash and no foodgrains. In Satara, Aurangabad and
Gadchiroli, some wage beneficiary respondents received more than 5 kg of foodgrains per
day. The maximum quantity of foodgrains received by a wage employment beneficiary
respondent was 10 kg in Gadchiroli and Satara, while it was 15 kg in Aurangabad.

FFW-SGRY/Mah/IGIDR/April 05 x
Considering all SGRY works, the average cash wage per day was on an average Rs.33 that
ranged between Rs.26 in Gadchiroli and Rs.51 in Satara.
Taking all wage beneficiary respondents, the average number of days of
employment per beneficiary was 29 and it varied between 20 in Satara district and 49 in
Akola district. About 70% of wage beneficiary respondents obtained work less than 30
days. The highest frequency is observed in the range of 16-30 days for Aurangabad and
Akola, while it was in the range of 1-15 days for Satara and Gadchiroli.
Average annual household income from SGRY at Rs.2633 ranged between
Rs.1911 in Satara and Rs.4001 in Akola. The gain in annual income was less than Rs.1000
for a quarter of the households, between Rs.1000-2000 for a little less than one-third of the
households, between Rs.2000-3000 for nearly one-fifth of the households. In Akola and
Aurangabad, 15-20% of beneficiaries had gain in annual income of more than Rs.5000.
Reported annual average household income of beneficiaries from sources other than
SGRY at Rs.11220 varied between Rs.6824 in Aurangabad and Rs.12042 in Akola.
The SGRY income as a proportion of income from sources other than SGRY
works out to 24% (14% in Gadchiroli, 18% in Satara, 33% in Akola and 43% in
Aurangabad). The income gain in percentage terms in Aurangabad is high due to
participation from relatively poorer households in SGRY in this district. The absolute
average income earned from SGRY is similar in Satara and Gadchiroli. But, the
percentage of income gain is different because the beneficiaries were from relatively
poorer households in Satara compared to Gadchiroli.
The maximum percentage of below poverty line (BPL) households in the sample
was 62% in Akola. In Gadchiroli, more than 60% of the SC/ST beneficiaries belonged to
BPL households. In Satara and Aurangabad, the proportion of BPL households was as low
as 35-38%. Due to identification and administrative problems in providing BPL cards to a
household, not having a BPL card does not necessarily mean the household is above
poverty line. In order to provide an alternative check, we estimated the poverty line for the
survey period as Rs.4037 on per person per year basis by updating the official poverty line
of the state for 1999-2000. About 85% of the beneficiaries remained below the poverty
line on the basis of their stated income from sources other than SGRY.
Individual Beneficiaries
About 38 from 47 individual asset beneficiary respondents interviewed have
annual income below Rs.15000. Given a poverty line of Rs.4000 per capita per year all

FFW-SGRY/Mah/IGIDR/April 05 xi
these are likely to be around or below the poverty line. However, there are deviations. A
bank peon in Satara having annual income of Rs.50000 is an individual beneficiary. In
some cases individual beneficiary respondents happen to own more than four hectares of
land, are not from SC/ST social groups or are close relatives of local representatives
indicating failure in targeting both in terms of income as well as social group. Most
individual beneficiary respondents (35 out of 47) benefited from open irrigation wells.
Some individual beneficiary respondents (5 out of 7) in Gadchiroli benefited from land
development whereas some in Akola (7 out of 15) benefited from a dwelling unit each.
Problems in Planning and Implementation
• The average employment available in SGRY is about 30 days per beneficiary. Some
wage employment beneficiaries have not got work for more than one week. In
particular, Gram Panchayat level works are normally small in nature, generating short-
term employment.
• There is lack of people’s involvement in identifying beneficiaries and works useful for
the village at the planning stage. The respondents also denied knowledge regarding
formation of beneficiary committees after completion of works.
• The two major complaints are not receiving foodgrains in time or not receiving cash
wages in time.
• The technical personnel have so many activities to do that they hardly have any time
for their primary work - helping in planning and monitoring.
• There were no uniform record keeping, accounting practices and reporting. The village
level officials (gram sevaks) do not have copies of the guidelines and have not been
imparted specific training that would help them in awareness creation, beneficiary
selection, record keeping and implementation. These make monitoring and supervision
a cumbersome and inefficient procedure.
• Wage bill accounts for almost all of the total cost of the works in some cases giving
rise to strong suspicion that material and equipment expenses have been clubbed in the
wage bill.
• Contractors have been involved in several works contrary to SGRY guidelines. This
might be a reflection of insufficient manpower, skill and other resources of
implementing departments.

FFW-SGRY/Mah/IGIDR/April 05 xii
• With regard to individuals who benefited from asset generation, it is observed that
some non-BPL and non-SC/ST households have also benefited indicating deviation
from SGRY guidelines.
• In some cases, the individual beneficiary spends and then receives the payment (both
in cash and kind) in phases. This provision is meant to ensure that actual work is done,
but it also means that such benefits can only be availed by those who can spend on
their own to begin with. Alternatively, providing assets to beneficiary after completion
of work can overburden government machinery, lead to involvement of contractors,
and compromise on quality.
Recommendations
• Gram Panchayats need to undertake more works to provide employment for longer
periods. This will improve food security on a sustained basis and also reduce out-
migration. Allocation should be enhanced accordingly.
• The works to be undertaken are constrained by the final allocation of funds/food at the
Zilla Parishad or Panchayat Samiti level. It is only after allocation that works are
distributed based on the bargaining power of the local representatives. To do away
with rationing and discretion there is a case for greater allocation and better utilization
of allocated funds.
• Planning for works is invariably done at the Panchayat Samiti or Zilla Parishad level.
There is hardly any people’s participation while planning for works at the village level.
To adhere to the spirit of decentralization the involvement of people through PRIs
should be effective.
• Most wage employment and individual asset beneficiaries are likely to be around or
below the poverty line, but there are some deviations indicating failure of targeting
both in terms of income and social group. Monitoring procedure need to be
strengthened to reduce/eliminate unintended beneficiaries (inclusion error). The gram
sabha should be involved in planning, implementation and monitoring. Information on
works done, amount of expenses under different heads and number of person days of
employment should be compulsorily put on the panchayat notice board during as well
as after the completion of works.
• Poor maintenance of records is a larger issue. Accurate and uniform maintenance of
records is also essential for monitoring and evaluation. Proper training of officials at

FFW-SGRY/Mah/IGIDR/April 05 xiii
Gram Panchayat and Panchayati Samiti level will improve reporting and accounting
practices.
• Government of Maharashtra intervenes through Employment Guarantee Scheme
(EGS). Since objectives of SGRY and EGS are similar, coordination in planning and
implementation of SGRY and EGS is needed in Maharashtra. Such coordination and
pooling of resources together could help in completing some of the projects (e.g.,
water conservation activities with capital and labour expenditure being met from EGS
and SGRY respectively) which are left incomplete due to lack of sufficient funds.
• Expansion of SGRY to kind of employment guarantee scheme as discussed recently in
policy circles would mean removal of any priority for any group among wage
employment beneficiaries so that it is open ended without any restrictions. However,
priorities for location of the works and individual asset beneficiary programme can
continue.
• Given the objective of supplementing the earning opportunity for the poor during lean
season and natural calamities, the size of SGRY should be flexible once it is able to
more or less cover the labour supply. The size should expand or contract as per need at
various levels depending on absorption of labour force by the normal economic
activities. Determining the required size at the local level is not an easy task and might
require close interaction of government officials, PRIs and local non-governmental
organizations (NGOs).
• Timing is crucial for success of SGRY. Demand for regular public works is high
during February to June. Unless sufficient food and funds are available during these
months, out-migration creating ‘footloose’ labour with less bargaining power becomes
a regular feature.

FFW-SGRY/Mah/IGIDR/April 05 1
Evaluation of Food-for-Work (FFW) component of Sampoorna Grameen Rozgar Yojana (SGRY)
in Selected Districts of Maharashtra
1. Introduction
The present study is an evaluation of the food-for-work (FFW) component of Sampoorna
Grameen Rozgar Yojana (SGRY) in selected districts of Maharashtra. SGRY was
launched all over the country in 2001 combining the then existing Employment Assurance
Scheme (EAS) and Jawahar Gram Samridhi Yojana (JGSY) with twin objectives - to
provide wage employment and food security and to create durable community, social and
economic infrastructure. Under SGRY, part of the wages is paid in foodgrains and this is
entirely borne by the central government. The remaining expenses comprising wages paid
in cash and other material costs are to be shared by the centre and state in 75:25 ratio. The
programme is implemented through the Panchayati Raj Institutions (PRIs) in two streams,
each stream accounting for about half the outlay. Stream-I is implemented at the Zilla
Parishad (ZP) and Panchayat Samiti (PS) level in a 40:60 ratio whereas stream-II is
implemented at the Gram Panchayat (GP) level.
SGRY guidelines emphasise on making special provision for Scheduled Castes (SCs),
Scheduled Tribes (STs), women and other vulnerable sections of the society. In particular,
22.5 per cent of annual allocations (including foodgrains) under stream-I are earmarked
for the individual beneficiaries of SC/ST families who are in the below poverty line (BPL)
category and 50 per cent of funds allocated to Gram Panchayats under stream-II are to be
utilised for creation of infrastructure in SC/ST habitats. Further, 30 per cent of
employment opportunities should be reserved for women. Given its emphasis on manual
labour intensive work, the programme is self-targeted for the poor group. Another
important guideline of SGRY works is that works have to be carried out without using
contractors. The total outlay under SGRY is about Rs.10,000 crore per year.
The Planning Commission expressed interest for an evaluation of SGRY in several states
in 2004. The Indira Gandhi Institute of Development Research (IGIDR) agreed to
undertake the evaluation in selected districts of Maharashtra state. The Planning
Commission selected four districts of Maharashtra for the study: Satara, Aurangabad,
Gadchiroli and Akola (Figure 1).

FFW-SGRY/Mah/IGIDR/April 05 2
Figure 1: Map of Maharashtra Highlighting Four Study Districts
Note: Not to scale. Source: Office of the Registrar General and Census Commissioner, Ministry of Home Affairs, India, 2001 (CensusInfo 1.0, Census 2001).
The per capita income of Maharashtra is about a third higher than the national average and
turns out to be the second highest among the major Indian states. As much as a quarter of
the industrial GDP of India originates from Maharashtra. Despite its high-income level
and industrialisation, the extent of poverty in Maharashtra has remained close to the
Jalgaon
BuldanaAkola
Washim
Amravati
Wardha
NagpurBhandara Gondiya
Gadchiroli Chandrapur Yavatmal
Nanded
Hingoli
Parbhani
JalnaAurangabad
ai (Suburban) umbai
Raigarh Pune
Ahmadnagar Bid
LaturOsmanabad
SolapurSatara
Ratnagiri
Sindhudurg Kolhapur
Sangli
Nandurbar
Dhule
Nashik
Thane
FFW-SGRY/Mah/IGIDR/April 05 3
national average. Incidence of poverty in Maharashtra has fallen at about the same rate as
all-India level. The state is, however, regarded as a pioneering state for generating
employment in public works on a large scale.
The Employment Guarantee Scheme (EGS) of Maharashtra was conceived as a major
poverty alleviation measure in 1972 to provide manual employment to all those who
registered for it. This was later turned into a kind of statutory entitlement with the
enactment of Maharashtra Employment Guarantee Act that came into force in 1979. The
act had a provision of a monetary compensation of Rs.2 per day if the State Government
failed to provide employment within two weeks. The Maharashtra EGS has been cited as a
major programme in the debate on wage employment generation type poverty reduction
programmes.1 It was considered as a success story in the 1980s despite its limited size
compared to the need and non-implementation of the compensation clause. Doubling of
wages in 1988 without adequate budgetary support led to fall in employment by one-third
(Ravallion, Datt and Chaudhuri 1993). Indeed, one major point in the debate on EGS and
similar other scheme has centred around the level of the ‘right’ wage rate - the minimum
at which the very poor group might be offering work or a higher wage rate that could be
considered ‘decent’ and lift the beneficiaries above the poverty line. One major advantage
cited by advocates of EGS or FFW programmes is the self selection nature in the sense
that it would normally attract participation from the poor group who would otherwise not
get sufficient employment opportunities in the normal economic activities. But if such a
wage rate happens to be very low, it might go against the objective of lifting the poor
above the poverty line. A higher wage rate, on the other hand, could defeat the self-
selection objective as it might attract people who are employed in normal economic
activities and increase the error in targeting. Rationing available volume of employment
would mean that poorest of the poor would have to compete with those around or above
the poverty line with the latter having greater chances of selection.
The partial payment of the wages in kind has been justified on grounds that such payments
directly help to enhance food security of the participants insuring the recipients against fall
in their purchasing power due to price rise or unavailability of foodgrains. To the extent
1 Some contributions to the debate are: Acharya 1990, Barett, Holden and Clay 2004, Basu 1981, Dandekar and Sathe 1980, Dev 1996, Dreze 1991, Gaiha and Imai 2000, Ganesh-Kumar et al 2004, Hirway and Terhal

FFW-SGRY/Mah/IGIDR/April 05 4
the programmes are meant to protect the poor households against seasonal vulnerability in
food security, timing, frequency and quantity of deliveries of foodgrains becomes crucial
aspects in programme evaluation. At the same time, the poor would not prefer full
payment of wages in kind as they need to buy non-food items from the market. Moreover,
wages in kind increase transaction costs for the funding agency.
While creation of some durable assets in rural areas is a major objective of employment
programmes, some authors have recognized a trade-off between the short run relief
objective and the long run rehabilitation and development objective (Barrett, Holden and
Clay 2004). Thus, while employment creation is the immediate urgent need in a relief
work, creation and maintenance of productive assets like roads, school buildings, soil and
water conservation structures needs more careful planning as per need of the locality.
Involvement of local community in identification and maintenance is generally required
for success of such programmes.
The objectives of providing employment and creating durable infrastructure under SGRY
or its predecessor EAS/JGSY are modelled on the lines of the EGS and other similar
programmes. Some studies of EAS/JGSY or SGRY have pointed out irregularities in the
form of fudging muster rolls, prevalence of corruption, non-availability of work in the lean
season, involvement of contractors and absence of provision for maintenance of
infrastructure created.2
2. Objectives, Methodology and Selection of Districts
2.1 Objectives
The present study has limited scope and does not deal with all aspects relevant for
evaluation of the SGRY programme. It is confined to the Food-for Work component and
the specific objectives are:
1. To assess the efficacy and effectiveness of food for work programme in terms
of planning, implementation and monitoring.
2. To examine the allocation, off take and distribution of foodgrains at different
levels of implementation.
1994, Nayyar 2002, Panda 1981, Ravallion, Datt and Chaudhuri 1993, Krishnaraj, Pandey and Kanchi 2004, and Subbarao 1989. 2 See, for example, Planning Commission 2000, Policy and Development Initiatives 2000, and Sen 2003.

FFW-SGRY/Mah/IGIDR/April 05 5
3. To assess the quantity, quality, frequency and timeliness of distribution of
foodgrains.
4. And, to identify constraints, if any, in implementation of the scheme and
suggest remedial measures.
2.2 Methodology
The first two objectives would depend on secondary data collected from District Rural
Development Agency (DRDA) and different levels of PRIs like Zilla Parishads, Panchayat
Samitis and Gram Panchayats in the districts under study. In addition, observations made
during field visits by the study team would also be of help. The last two objectives would
be based on schedules canvassed among beneficiaries, that is, those who received wage
employment for works under SGRY schemes and individuals who benefited through some
asset creation.3
Based on foodgrains utilization for 2002-03, Planning Commission selected two high
utilization and two low utilization districts. Put in descending order of utilization the
districts are Satara, Aurangabad, Gadchiroli and Akola. For conducting fieldwork in
Maharashtra the task was divided between two groups – one focusing on the high
utilization and the other on the low utilization districts. Within each district, two
Panchayat Samitis were chosen during field visits such that one is high utilization and
another is low utilization based on 2002-03 data. Table 1 gives the Panchayat Samitis with
high and low utilization and Annexure 1 gives the 2002-03 utilization for each district
across Panchayat Samitis. Again as per Planning Commission guidelines, two Gram
Panchayats were chosen from each Panchayat Samiti except for Aurangabad district where
three Gram Panchayats have been chosen in each Panchayat Samiti for logistic reasons.
3 The relevant questionnaire schedule provided by Planning Commission is attached as Annexure 3. It was translated to Marathi by us and is attached as Annexure 4. These are not included in the electronic version.

FFW-SGRY/Mah/IGIDR/April 05 6
Table 1: List of Districts, Panchayat Samitis and Gram Panchayats Surveyed District Panchayat Samitis Gram Panchayat
Ahire Khandala (High Utilisation) Ajanuj Katagun
Satara
Khatav (Low Utilisation) Pusegaon Dudhad Karmad
Aurangabad (High Utilisation)
Shendra(K) Kingaon Marsavali
Aurangabad
Phulambri (Low Utilisation)
Phulambri Chikhali Kurkheda (High Utilisation) Kurkheda Adyal
Gadchiroli
Chamorshi (Low Utilisation) Talodhi(M) Jaulke Akot (High Utilisation) Panaj Charangaon
Akola
Patur (Low Utilisation) Khanapur
Note: Districts are arranged in descending order of foodgrains utilization for 2002-03. The two Panchayat Samitis in each district are also arranged in descending order of foodgrains utilization for 2002-03. Gram Panchayats for a given Panchayat Samiti and district are arranged alphabetically.
2.3 Selection of Districts
The four districts are spread across Maharashtra. Satara is in the relatively prosperous
region of Western Maharashtra, Aurangabad is in Marathwada, Gadchiroli is in Eastern
Vidarbha and Akola is in Western Vidarbha (see Figure 1). Some characteristics of the
districts under study are given in Table 2. Relative to the state average and other districts
under study, Satara has higher sex ratio, lower urban population, higher proportion of
cultivators, and lower proportion of households below poverty line. Aurangabad has lower
sex ratio, higher gender gap in literacy. Gadchiroli has very low density, low urban
population, more than half the population is SC/ST, high urban-rural gap in literacy, more
than four-fifth of workers are either cultivators or agricultural labourers, more than half
the households are below poverty line and very low human development index (HDI).
Akola has high literacy rate, low urban-rural as well as gender gap in literacy and high
proportion of agricultural labourers.

FFW-SGRY/Mah/IGIDR/April 05 7
Table 2: Socio-Demographic Characteristics of Districts Under Study Socio-Demographic Characteristics Satara Auran-
gabad Gad-
chiroli Akola Maha-
rashtra Population, 2001 (‘000) 2796.9 2920.5 970.0 1629.3 96752.2 Sex ratio, 2001 (females per ‘000 males) 994.5 919.3 976.2 937.6 922.2 Density of Population, 2001 (per sq.km.) 266.9 289.0 67.3 300.1 314.6 Urban Population, 2001 (%) 14.2 37.2 6.9 38.5 42.4 SC population, 1991 (%) 9.5 13.8 16.9 12.0 11.1 ST population, 1991 (%) 0.8 3.8 38.7 3.0 9.3 Literacy rate, 2001 (% 7+ population) 78.5 73.6 60.3 81.8 77.3 Urban-Rural literacy gap, 2001 (%age points) 9.4 15.4 24.7 6.6 15 Gender literacy gap, 2001 (%age points) 19.7 23.8 19.1 15.4 18.8 Work participation rate, 2001 (%) 47.6 41.8 52.8 40.5 43.5 Cultivators to total workers, 2001 (%) 47.7 36.9 43.2 18.8 26.8 Agr. Labourers to total workers, 2001 (%) 22.1 26.4 38.8 49.3 28.6 Households below poverty line, 1997-98 (%) 16.2 26.0 55.2 44.5 34.6 Human Development Index, 2000 0.59 0.56 0.20 0.42 0.58 Note and Source: (a) Census 2001 data are provisional figures from CensusInfo 1.0, Census 2001 Provisional Maharashtra.mdb, Office of the Registrar General and Census Commissioner, Ministry of Home Affairs, India, 2001. (b) Other data are from Human Development Report Maharashtra 2002, Government of Maharashtra, Mumbai, 2002. (c) SC and ST denote Scheduled Caste and Scheduled Tribe respectively. Compared to 1991, in 2001 SC and ST proportions in Maharashtra have declined and stand at 10.2 per cent and 8.9 per cent respectively. District wise data for SC and ST in 2001 are not yet available.
3. Survey of Beneficiaries
In each district, sampling design suggests choosing 28 works (four each from the Zilla
Parishad, two Panchayat Samitis and four Gram Panchayats) and canvassing a pre-
designed schedule to 140 wage employment beneficiaries (WBs), five from each of the 28
works (Table 3, for details of works see Annexure 2). In addition, 15 individual asset
beneficiaries (IBs), 5 from schemes of Zilla Parishad and 5 each from schemes of the two
Panchayat Samitis, are also to be canvassed.
Table 3: Number of Schedules and Works Covered in the Districts under Study Beneficiary Sampling Design
per District Satara Auran-
gabadGadchiroli Akola Total
GP WB 80 (4*4= 16) 80 (16) 48 (10) 74 (16) 62 (16) 264 (58)PS WB 40 (2*4= 8) 38 (8) 25 (8) 40 (8) 36 (8) 139 (32)ZP WB 20 (1*4= 4) 20 (4) 16 (4) 20 (4) 20 (4) 76 (16)Total WB 140 (7*4= 28) 138 (28) 89 (22) 134 (28) 118 (28) 479 (106)PS IB 10 - 9 - 7 - 2 - 5 - 23 -ZP IB 5 - 4 - 5 - 5 - 10 - 24 -Total IB 15 - 13 - 12 - 7 - 15 - 47 -Total 155 (7*4= 28) 151 (28) 101 (22) 141 (28) 133 (28) 526 (106)Notes: (1) GP, PS and ZP denote Gram Panchayat, Panchayat Samiti and Zilla Parishad respectively. WB denotes wage employment beneficiary and IB denotes individual asset beneficiaries. (2) Figures in parentheses denote the number of works covered. Under ‘Sampling Design per District’ x and y in (x*y) indicate number of GP/PS/ZP and number of works respectively. (3) In each work, five WBs were to be selected as per sampling design. For example, the entry 80 for GP WB indicates five schedules from each of the 16 works.

FFW-SGRY/Mah/IGIDR/April 05 8
Shortfall in sample coverage is because of non-availability of beneficiaries for logistic
reasons. In Akot taluka of Akola we had to replace two Gram Panchayats – in one Gram
Panchayat we were unsuccessful after repeated visits because the gram sevak did not turn
up, in another Gram Panchayat the muster roll for all works showed that all wage
employment beneficiaries were outsiders (marked as bahargaon in the space for address
indicating that they are migrants and not from villages in the vicinity). Again, for some
Panchayat Samiti and Zilla Parishad level works we had to go to a tribal village in the
adjacent taluka, as local labourers were not involved in the work. In fact, in Akola 42.4 per
cent (50 out of 118) wage employment beneficiary respondents were residents of villages
that were more than five kilometers from the work site whereas corresponding figures for
the other three districts ranged from none in Gadchiroli to 12 per cent in Aurangabad. In
one Zilla Parishad level work we got only three wage employment beneficiaries, but did
not include them because we replaced it with another work from Patur taluka where we
got five wage employment beneficiaries. It means that while conducting fieldwork we
covered 29 works in Akola, but only 28 are used in our analysis. Further, we had difficulty
in locating individual beneficiaries who received benefits in 2001-02 and 2002-03 and
ended up interviewing beneficiaries who were receiving benefits during our visit in Akola.
Note that in Maharashtra planning for SGRY works at the district level was combined for
two years, 2002-03 and 2003-04.
It was difficult to obtain individual beneficiaries in Gadchiroli. This district has a Naxalite
base and there are law and order problems. This was a reason given for low foodgrains
utilization under SGRY and we were also informally advised against going to some
Panchayat Samitis. Despite this, we visited an additional Panchayat Samiti, Korchi, where
we had discussions with the officials and also went to see the land development work done
for an individual beneficiary.
In Aurangabad we had difficulty in selecting Gram Panchayat level works. We canvassed
the schedules to more than five beneficiaries from the 10 Gram Panchayat level works
covered. However we decided against using them in order to stick to the sample design of
five beneficiaries per work and, more importantly, to avoid repetition in some basic
household level information that arose because of multiple beneficiaries from the same
household and the same individual being in different works. This is also the reason that led
to fewer observations at the Panchayat Samiti level. Actually the number of wage

FFW-SGRY/Mah/IGIDR/April 05 9
employment beneficiaries interviewed in Aurangabad is 127 (77 Gram Panchayat level, 30
Panchayat Samiti level and 20 Zilla Parishad level), but after cleaning the number used for
analysis is 89 only. Similarly for individual beneficiaries we could not get the requisite
number at the Panchayat Samiti level in Phulambri, but covered additional numbers in
Aurangabad, but used a maximum of five from this Panchayat Samiti in our analysis to be
consistent with the sampling design.
3.1 Individual/Household Characteristics of Beneficiaries Surveyed
Even though the sample design for the primary survey was not meant to be exactly
representative, delineating some characteristics of the sample respondents would be
helpful to understand some of the results. We now discuss some basic
individual/household characteristics of wage employment beneficiaries and individual
asset beneficiaries.
3.1.1 Gender Distribution
Table 4 gives gender wise distribution. Most of the respondents turn out to be males. The
proportion of males in all the four districts taken together is as high as 85 per cent. Males
account for 97 per cent among wage employment beneficiary respondents in Akola where
only four out of 118 are females. Maximum proportions of female wage employment
beneficiary respondents are in Aurangabad (28 per cent). SGRY guidelines suggest a
target of 30 per cent for female participation. The proportion of female beneficiaries in the
sample seems to be less than the suggested target. One reason for low female participation
among SGRY wage employment beneficiaries could be that males tend to replace females
if SGRY wage rate is higher than prevailing market wage rate for similar works in the
same season. Among individual asset beneficiaries, only one respondent in Gadchiroli and
two each in the other three districts are females.
Table 4: Gender Distribution of Beneficiaries Interviewed (percentage) Gender Wage employment beneficiaries Individual asset beneficiaries
Satara Auran
gabad Gadch
iroli Akola Total Satara Auran
gabad Gadch
iroli Akola Total
Male 84.8 71.9 85.8 96.6 85.6 84.6 83.3 85.7 86.7 85.1 Female 15.2 28.1 14.2 3.4 14.4 15.4 16.7 14.3 13.3 14.9 Note: Percentages in this and several other tables below are calculated from total number of sample observations for the district as given in Table 3.

FFW-SGRY/Mah/IGIDR/April 05 10
3.1.2 Age Distribution
Age-wise distribution is in Table 5. In Satara the age groups of 21-30 years and 31-40
years have one-third wage employment beneficiary respondents each, Aurangabad and
Akola have two-fifth of wage employment beneficiary respondents in the 21-30 years age
groups whereas in Gadchiroli one third are in the 31-40 years age group. In the low
utilization districts of Gadchiroli and Akola, more than 10 per cent of wage employment
beneficiary respondents belong to the 16-20 years age group. No wage employment
beneficiary respondents were above 70 years of age. Individual beneficiaries are more
likely to be head of households and this perhaps explains the age of such respondents
being on average much older than wage employment beneficiary respondents.
Table 5: Age Distribution of Beneficiaries Interviewed (percentage) Age (years) Wage employment beneficiaries Individual asset beneficiaries Satara Auran
gabad Gadch
iroli Akola Total Satara Auran
gabad Gadch
iroli Akola Total
16-20 2.2 4.5 11.2 16.9 8.8 0.0 0.0 0.0 0.0 0.0 21-30 34.8 42.7 22.4 40.7 34.2 0.0 0.0 14.3 6.7 4.3 31-40 33.3 33.7 35.8 24.6 31.9 15.4 25.0 28.6 53.3 31.9 41-50 20.3 12.4 22.4 11.9 17.3 23.1 25.0 28.6 20.0 23.4 51-60 5.8 6.7 6.7 5.1 6.1 46.2 25.0 0.0 13.3 23.4 61-85 3.6 0.0 1.5 0.8 1.7 15.4 25.0 28.6 6.7 17.0 Min Age 18.0 18.0 17.0 16.0 16.0 38.0 32.0 26.0 28.0 26.0 Max Age 67.0 60.0 70.0 70.0 70.0 85.0 80.0 65.0 80.0 85.0 Avg Age 36.2 33.5 36.3 31.2 34.4 55.1 52.4 45.4 44.7 49.6 Note: As mentioned in Table 4.
3.1.3 Social Group Distribution
Table 6 gives social group wise proportion of respondents. Nearly half or more of wage
employment beneficiary respondents are SCs/STs in Aurangabad, Gadchiroli and Akola.
Share of SC/ST group in total district population in Satara is low (Table 2) and most of the
wage employment beneficiary respondents in this district belong to ‘others’ category. In
Akola nearly half of the respondents are STs. These respondents are mostly from works in
Charngaon Gram Panchayat of Patur and Panchayat Samiti/Zilla Parishad works in Akot.
Turning to the individual beneficiaries, they should exclusively have been from among
SC/ST households, but two of the 13 interviewed in Satara and four of the seven
interviewed in Gadchiroli are neither SC nor ST indicating a departure from SGRY
guidelines.

FFW-SGRY/Mah/IGIDR/April 05 11
Table 6: Caste Distribution of Beneficiaries Interviewed (percentage) Caste Wage employment beneficiaries Individual asset beneficiaries
Satara Auran
gabad Gadch
iroli Akola Total Satara Auran
gabad Gadch
iroli Akola Total
Sched. Castes 13.8 33.7 26.9 16.9 21.9 84.6 91.7 14.3 100.0 80.9 Sched. Tribes 0.7 14.6 21.6 46.6 20.5 0.0 8.3 28.6 0.0 6.4 Others 85.5 51.7 51.5 36.4 57.6 15.4 0.0 57.1 0.0 12.8 Note: As mentioned in Table 4.
3.1.4 Distribution by Size of Household
Table 7 gives distribution of respondents by family size. More than half of the wage
employment beneficiary respondents are from households with family size of 4-5.
Aurangabad has a substantial proportion of respondents from households with family size
of six or more. Looking into details of one-member families one observes that two in
Aurangabad and two from three in Gadchiroli are females. An individual beneficiary
respondent in Satara is also a female one-member family. All these females are either
estranged/divorced or widows or old. The other one-member families are males. From the
four wage employment beneficiary respondents in one-member family category in Akola,
three are Muslims.
Table 7: Distribution of Beneficiaries Interviewed by Size of Household (percentage) Family Size Wage employment beneficiaries Individual asset beneficiaries Satara Auran
gabad Gadch
iroli Akola Total Satara Auran
gabad Gadch
iroli Akola Total
1 0.7 2.2 2.2 3.4 2.1 7.7 0.0 14.3 0.0 4.3 2 to 3 39.9 12.4 14.2 28.8 24.8 7.7 16.7 28.6 20.0 17.0 4 to 5 47.1 44.9 65.7 61.0 55.3 46.2 33.3 42.9 60.0 46.8 6 or more 12.3 40.4 17.9 6.8 17.7 38.5 50.0 14.3 20.0 31.9 Average (No) 4.0 5.2 4.5 4.0 4.3 5.6 5.9 3.4 4.6 5.0 Note: As mentioned in Table 4.
3.1.5 Distribution by Educational Status
Table 8 gives distribution by educational status of respondents. Among wage employment
beneficiaries, about one-fourth in Akola, one-third in Satara and Gadchiroli and nearly
half in Aurangabad are illiterate. Illiteracy among beneficiaries is expected, but what is
surprising is that about 15 per cent in Satara, Aurangabad and Gadchiroli and one-third in
Akola are matriculates. As mentioned earlier, Akola had greater proportion wage
employment beneficiary respondents in the younger age group of 16-20 and it so happens
that it has more proportion of literates across the four districts (see Table 2). Further, a few
of the respondents are even graduates. Most of the respondents with 10+ years of
education are from younger ages (16-30 years age groups). As highlighted by recent media
reports, it seems that educated individuals are entering into the unskilled workforce.

FFW-SGRY/Mah/IGIDR/April 05 12
Table 8: Distribution By Educational Status of Beneficiaries Interviewed (percentage)
Wage employment beneficiaries Individual asset beneficiaries Educational Status Satara Auran
gabad Gadch
iroli Akola Total Satara Auran
gabad Gadch
iroli Akola Total
Illiterate 33.3 48.3 34.3 26.3 34.7 15.4 58.3 42.9 26.7 34.0 Lit.,<Prim 1.4 2.2 9.0 3.4 4.2 15.4 16.7 0.0 6.7 10.6 Primary 18.1 16.9 17.2 16.1 17.1 38.5 25.0 0.0 20.0 23.4 Middle 28.3 15.7 17.2 19.5 20.7 7.7 0.0 28.6 20.0 12.8 Matriculate 16.7 13.5 18.7 33.1 20.7 23.1 0.0 14.3 26.7 17.0 High Sec. 2.2 2.2 0.7 0.8 1.5 0.0 0.0 0.0 0.0 0.0 Graduate 0.0 1.1 3.0 0.8 1.3 0.0 0.0 14.3 0.0 2.1 Notes: (1) As mentioned in Table 4. (2) Lit.,<Prim denotes literate but less than primary. (3) High Sec. denotes Higher Secondary.
3.1.6 Distribution by Marital Status
Distribution by marital status of respondents is given in Table 9. Nearly 80 per cent of the
wage employment beneficiary respondents are married. Across the four districts, Akola
has more proportion of unmarried (nearly one-third) wage employment beneficiary
respondents. This is also the district with greater proportion in the 16-20 years age group
(Table 5) and with greater proportion of matriculates (Table 8). All wage employment
beneficiaries in the ‘others’ category (four in Aurangabad and one in Gadchiroli) are
widows. Among the individual beneficiaries, all except three have their current status as
married. From the three exceptions, one from Satara is an estranged female, one from
Aurangabad is widow and one from Akola is unmarried.
Table 9: Distribution by Marital Status of Beneficiaries Interviewed (percentage)
Wage employment beneficiaries Individual asset beneficiaries Marital Status Satara Auran
gabad Gadch
iroli Akola Total Satara Auran
gabad Gadch
iroli Akola Total
Married 81.9 87.6 79.9 67.8 78.9 92.3 91.7 100.0 93.3 93.6 Divorced 1.4 1.1 0.0 1.7 1.0 0.0 0.0 0.0 0.0 0.0 Unmarried 16.7 7.9 19.4 30.5 19.2 0.0 0.0 0.0 6.7 2.1 Others 0.0 3.4 0.7 0.0 0.8 7.7 8.3 0.0 0.0 4.3 Note: As mentioned in Table 4.
3.1.7 Distribution by Occupational Status
Distribution by occupational status of respondents is given in Table 10. About three-fifth
of wage employment beneficiary respondents in Gadchiroli are cultivators. In contrast,
most wage employment beneficiary respondents in the other three districts are agricultural
labourers. The proportion is about 90 per cent in Aurangabad. If we add other labour to

FFW-SGRY/Mah/IGIDR/April 05 13
agricultural labour then the proportion of respondents is about 90 per cent in Satara and
Akola also.
Table 10: Distribution by Occupational Status of Beneficiaries Interviewed (percentage)
Wage employment beneficiaries Individual asset beneficiaries Occupational Status
Satara Aurangabad
Gadchiroli
Akola Total Satara Aurangabad
Gadchiroli
Akola Total
Cultivation 12.3 2.2 61.2 1.7 21.5 53.8 41.7 100.0 0.0 40.4 Agr. Labour 57.2 87.6 5.2 72.9 52.2 23.1 50.0 0.0 100.0 51.1 Other Labour 29.0 7.9 32.1 23.7 24.6 0.0 0.0 0.0 0.0 0.0 Others 1.4 2.2 1.5 1.7 1.7 23.1 8.3 0.0 0.0 8.5 Note: As mentioned in Table 4.
3.1.8 Distribution by Size of Land Owned
Table 11 shows distribution of respondents by size of land owned. For the total sample of
wage employment beneficiaries, about 60 per cent are landless and another 20 per cent
possess land below 1 hectare. Gadchiroli with more of cultivators has less of landlessness
– 35 per cent of respondents are landless in Gadchiroli compared to nearly 70 per cent in
the other three districts. Caste break-up of respondents in Gadchiroli reveals that 44 per
cent of SCs, 41 per cent of STs and 28 per cent of ‘others’ are landless. In Gadchiroli
about 30 per cent of wage employment beneficiary respondents had more than one hectare
of land whereas it is about 10-15 per cent in the other three districts. From the remaining
wage employment beneficiary respondents the maximum land size that a respondent’s
household possesses is below four hectares except for one wage employment beneficiary
respondent and three individual beneficiary respondents in Satara who own more than four
hectares of land.
Table 11: Distribution of Beneficiaries Interviewed by Size of Land Owned (percentage)
Wage employment beneficiaries Individual asset beneficiaries Land Size (hectares)
Satara Aurangabad
Gadchiroli
Akola Total Satara Aurangabad
Gadchiroli
Akola Total
Landless 69.6 65.2 35.1 74.6 60.3 7.7 0.0 0.0 46.7 17.0 <1 19.6 23.6 35.1 11.0 22.5 38.5 25.0 28.6 33.3 31.9 1-2 8.0 7.9 18.7 11.9 11.9 23.1 41.7 42.9 13.3 27.7 2-4 2.2 3.4 11.2 2.5 5.0 7.7 33.3 28.6 6.7 17.0 >4 0.7 0.0 0.0 0.0 0.2 23.1 0.0 0.0 0.0 6.4 Average Size 0.3 0.4 0.7 0.3 0.4 2.5 1.4 1.3 0.6 1.4 Note: As mentioned in Table 4.

FFW-SGRY/Mah/IGIDR/April 05 14
4. Efficiency and Effectiveness: Planning, Implementation and Monitoring
4.1 Planning
In Maharashtra, instead of annual action plan there was a two-year action plan for 2002-03
and 2003-04. It was difficult to obtain information only for 2002-03 on many aspects
because the programmes were for the two-year combined period and were still ongoing
when we conducted our survey in March 2004. Our general observation from the field
indicated that planning of works was not done through the gram sabhas. It seems that
officials at the Panchayat Samiti or district level prepared the action plan for stream-II
works. Wage employment beneficiary respondents said ‘no’ to villagers’ involvement in
identifying works with felt need, identifying beneficiaries and creating awareness.4 In one
occasion, while looking up at a plan-cum-current status document an official crossed out
some entries before us. The entries were works like watershed development, which are not
to be taken up under SGRY.5
4.2 Implementation
In the four districts, implementing agencies for stream-I works were either line
departments of government like Agriculture, Forest, Minor Irrigation and Building &
Construction or the different levels of PRIs whereas Gram Panchayats are the sole
implementing agencies for stream-II works. All of our wage employment beneficiary
respondents also concurred with this, but what is interesting is that about 2.2 per cent
respondents in Satara and 10.5 per cent respondents in Gadchiroli also mentioned about
the involvement of contractors. Informal discussion with villagers in general and some
officials also pointed out the involvement of contractors in executing works.
4.2.1 Beneficiaries’ Views on Implementation
All wage employment beneficiary respondents except for nine (6.7 per cent) in Gadchiroli
agreed to muster rolls being maintained (Table 12), but we had difficulty in obtaining
them from line departments. The common excuse being that the documents have gone for
audit or the official-in-charge is on leave. Unavailability of muster roll also meant that we
could not select their works to interview wage employment beneficiaries. One lacuna in
4 In low utilisation districts of Gadchiroli and Akola where response was ‘no’ the term ‘villagers’ meant gaonwalon or aap log whereas in high utilisation districts where the response was ‘yes’ the term ‘villagers’ meant koi gaon ke log jaise mukhia/sarpanch. 5 There was an order from the state government, which was later withdrawn, to take up watershed development works under SGRY.

FFW-SGRY/Mah/IGIDR/April 05 15
implementation that all respondents agree to is that no beneficiary committee has been set
up after completion of works. There was a divide between high utilization and low
utilization districts in the sense that larger proportion of respondents from the latter
districts said that works done were not based on felt needs. Some respondents also
indicated about non-availability of water, crèche and first aid at the work site.
Table 12: Wage Employment Beneficiary Respondents Responses on Some Aspects of Implementation (percentage) Satara Auran-
gabad Gad-
chiroli Akola Total
Muster rolls are not maintained 0.0 0.0 6.7 0.0 1.9 Beneficiary committee not constituted 100.0 100.0 100.0 100.0 100.0 Works are not selected on felt needs 9.4 2.2 99.3 61.9 46.1 Drinking water not available at work site 25.4 13.5 15.7 0.0 14.2 Crèche not available at work site 99.3 73.0 58.2 100.0 83.1 First aid not available at work site 66.7 38.2 49.3 16.9 44.3 Note: As mentioned in Table 4.
4.2.2 Details of Works in the Districts
Based on secondary data collected on wage employment beneficiaries we discuss about
the number of works, mandays generated, expenditure details, wage share, food share in
wages and ‘implied’ wages per manday for the selected districts, Zilla Parishads,
Panchayat Samitis and Gram Panchayats. A general point to note in this context is that
SGRY started during 2001-02 and it replaced other ongoing programmes like EAS and
JGSY as stream-I and stream–II respectively. Hence, secondary data obtained for 2001-02
and 2002-03 are not exactly comparable in the tables 13-20 and we restrict the analysis to
some broad conclusions. As discussed later, wages might include material costs in some
cases, and hence, one should be cautious in interpreting the ‘implied’ wage rates given in
Tables 13-17 and we avoid detailed discussion of it. 6
Some aspects of stream-I works in the districts under study are given in Table 13. There
has been a fall in total expenditure as well as number of mandays for the four districts
taken together. Compared to 2001-02, in 2002-03 the high utilization districts of Satara
and Aurangabad substantially increased value of food distributed per manday. Satara is the
only district where value of food distributed per manday happens to be nearly double that
of the minimum prescribed (at least five kilograms of foodgrains, which has been
estimated to be equal to Rs.26/- by Government of Maharashtra). Even cash wage per
6 The wage rates obtained from the survey of wage employment beneficiaries are discussed later in section 6.

FFW-SGRY/Mah/IGIDR/April 05 16
manday is substantially higher in Satara than other districts. What is surprising is that this
increased share of wage is accompanied with decline in mandays generated. The share of
foodgrains component paid as wages has increased by almost 35 percentage points in
Aurangabad. Gadchiroli is the only district where there has been a decline in the number
of works, mandays generated as well as total expenditure. In Akola, the number of works
and mandays generated increased and from the four districts it has the lowest share of
foodgrains component paid as wages.
Table 13: Details of the Stream-I Works in the Districts under Study, 2001-02 and 2002-03 2001-02 2002-03
Satara Auran-gabad
Gad-chiroli
Akola Total Satara Auran-gabad
Gad-chiroli
Akola Total
Works (no) 153.0 200.0 288.0 226.0 867.0 410.0 698.0 271.0 332.0 1711.0Mandays (‘000) 459.9 374.0 580.0 460.7 1874.7 320.5 397.0 557.0 499.3 1773.8Wage in cash (Rs lakh) 129.0 172.2 154.5 379.4 835.1 287.1 137.1 107.8 310.7 842.7Wage in food (Rs lakh) 118.2 11.2 102.9 93.8 326.1 158.0 102.6 110.6 127.8 499.0Material costs (Rs lakh) 82.5 116.8 171.8 61.0 432.1 3.8 159.8 9.0 54.1 226.7Total expdn (Rs lakh) 329.7 300.1 429.2 534.3 1593.3 449.0 399.5 227.4 492.6 1568.4Wage share (%) 75.0 61.1 60.0 88.6 72.9 99.1 60.0 96.0 89.0 85.5Food in wage (%) 47.8 6.1 40.0 19.8 28.1 35.5 42.8 50.6 29.1 37.2Cash wage (Rs/day) 28.0 46.0 26.6 82.4 44.5 89.6 34.5 19.4 62.2 47.5Food wage (Rs/day) 25.7 3.0 17.7 20.4 17.4 49.3 25.9 19.8 25.6 28.1Total wage (Rs/day) 53.7 49.0 44.4 102.7 61.9 138.9 60.4 39.2 87.8 75.6Notes: (1) Total indicates an aggregate figure for the available data for the four districts under study. (2) Data on works, mandays, wage in cash, wage in food, material costs and total expenditure have been collected from DRDA or PRI offices. These have been used to calculate the other results. (3) ‘Wage in food’ denotes value of foodgrains paid as wages. ‘Total expdn’ denotes total expenditure, which is sum of ‘wage in cash’, ‘wage in food’ and ‘material costs’. ‘Wage share’ denotes share of wages (cash plus food) in total expenditure. ‘Food in wage’ denotes share of foodgrains component in wages paid.
Table 14 gives some aspects of stream-II works. Overall, total expenditure increased in
2002-03 compared to the previous year, while mandays generated increased less than
proportionately. In the high utilization districts of Satara and Aurangabad the wage share
remains more or less the same for the two years, but the share of foodgrains component
paid as wages has increased by nearly 25 percentage points in the latter year. One
explanation for this could be adherence to norm of paying a minimum of five kilograms of
foodgrains per manday when stream-II of SGRY replaced JGSY where payment in terms
of foodgrains was not mandatory. A differentiating aspect between the high utilization and
low utilization districts is that mandays generated increased in the former whereas it
decreased in the latter. Like stream-I works for Satara, decline in mandays is accompanied
with an increase in implied wage rate per manday in the two low utilization districts of
Gadchiroli and Akola.

FFW-SGRY/Mah/IGIDR/April 05 17
Table 14: Details of the Stream-II Works in the Districts under Study, 2001-02 and 2002-03 2001-02 2002-03
Satara Auran-gabad
Gad-chiroli
Akola Total Satara Auran-gabad
Gad-chiroli
Akola Total
Works (no) 2949.0 998.0 1218.0 3256.0 8421.0 2592.0 1521.0 1232.0 1558.0 6903.0Mandays (‘000) 253.0 497.0 518.0 647.8 1915.8 583.0 572.0 430.0 604.0 2189.0Wage in cash (Rs lakh) 133.7 228.4 127.7 539.2 1028.9 115.3 226.0 302.6 720.6 1364.4Wage in food (Rs lakh) 60.7 6.5 85.1 4.4 156.7 152.5 82.5 235.0 108.7 578.6Material costs (Rs lakh) 129.5 156.6 243.7 170.6 700.3 178.5 203.6 50.0 247.5 679.6Total expdn (Rs lakh) 323.9 391.4 456.5 714.2 1886.0 446.2 512.1 587.6 1076.8 2622.7Wage share (%) 60.0 60.0 46.6 76.1 62.9 60.0 60.2 91.5 77.0 74.1Food in wage (%) 31.2 2.8 40.0 0.8 13.2 56.9 26.7 43.7 13.1 29.8Cash wage (Rs/day) 52.9 45.9 24.6 83.2 53.7 19.8 39.5 70.4 119.3 62.3Food wage (Rs/day) 24.0 1.3 16.4 0.7 8.2 26.2 14.4 54.7 18.0 26.4Total wage (Rs/day) 76.8 47.3 41.1 83.9 61.9 45.9 53.9 125.0 137.3 88.8Notes: As in Table 13.
4.2.3 Details of Zilla Parishad level Works
Details of Zilla Parishad works, which should have 40 per cent share in stream-I outlay as
per guidelines, are given in Table 15. In the two high utilization districts of Satara and
Aurangabad the share of foodgrains in wages increased by more than 15 percentage
points. In spite of this, Aurangabad continues to have low value of food distributed per
manday. As in the case for overall stream-I works (Table 13), Gadchiroli has low wage per
manday and is the only district where food component paid as wages has declined. Akola
has the highest cash wage per manday.
Table 15: Details of the Zilla Parishad Works in the Districts under Study, 2001-02 and 2002-03 2001-02 2002-03
Satara Auran-gabad
Gad-chiroli
Akola Total Satara Auran-gabad
Gad-chiroli
Akola Total
Works (no) 61.0 75.0 32.0 71.0 239.0 163.0 155.0 98.0 106.0 522.0Mandays (‘000) 143.2 112.2 162.0 74.8 492.2 304.5 158.8 223.0 160.6 846.9Wage in cash (Rs lakh) 93.9 49.0 30.0 74.3 247.1 148.2 36.4 36.0 101.2 321.8Wage in food (Rs lakh) 18.0 1.9 44.6 18.7 83.2 85.0 8.2 43.9 41.8 178.9Material costs (Rs lakh) 15.1 31.9 18.1 12.7 77.8 3.2 29.8 8.0 17.7 58.6Total expdn (Rs lakh) 127.0 82.8 92.6 105.7 408.1 236.4 74.4 87.9 160.6 559.3Wage share (%) 88.1 61.5 80.5 88.0 80.9 98.7 60.0 90.9 89.0 89.5Food in wage (%) 16.1 3.8 59.8 20.1 25.2 36.5 18.4 54.9 29.2 35.7Cash wage (Rs/day) 65.6 43.6 18.5 99.3 50.2 48.7 22.9 16.2 63.0 38.0Food wage (Rs/day) 12.6 1.7 27.5 25.0 16.9 27.9 5.2 19.7 26.0 21.1Total wage (Rs/day) 78.2 45.3 46.0 124.3 67.1 76.6 28.1 35.8 89.0 59.1Notes: As in Table 13.
4.2.4 Details of Panchayat Samiti level Works
As mentioned earlier, the selection of high/low utilization Panchayat Samitis was based on
percentage utilization of foodgrains allocated in 2002-03 (see Table 1 and Annexure 1). It

FFW-SGRY/Mah/IGIDR/April 05 18
is perhaps because of this that the number of works, mandays generated and total
expenditure is greater for high utilization Panchayat Samitis when compared with low
utilization Panchayat Samitis in Aurangabad, Gadchiroli and Akola (Table 16).
Table 16: Details of High/Low Utilization Panchayat Samitis (PSs) Works in the Districts under Study, 2001-02 and 2002-03 2001-02 2002-03
Satara Aurangabad
Gadchiroli
Akola Total Satara Aurangabad
Gadchiroli
Akola Total
High Utilization PS Works (no) 13.0 29.0 18.0 39.0 99.0 11.0 33.0 31.0 16.0 91.0Mandays (‘000) 20.9 17.0 33.5 87.2 158.6 16.2 48.3 51.2 40.3 156.0Wage in cash (Rs lakh) 19.7 12.0 17.5 56.0 105.2 6.6 17.5 13.1 24.8 62.0Wage in food (Rs lakh) 4.9 3.3 7.0 9.9 25.1 3.1 16.2 15.2 6.5 40.9Material costs (Rs lakh) 8.8 15.9 0.7 13.9 39.3 0.0 0.0 2.5 7.1 9.5Total expdn (Rs lakh) 33.4 31.1 25.2 79.9 169.6 9.8 33.7 30.8 38.3 112.4Wage share (%) 73.7 49.1 97.2 82.6 76.8 100.0 100.0 92.0 81.6 91.5Food in wage (%) 19.9 21.5 28.6 15.1 19.3 32.0 48.1 53.6 20.7 39.8Cash wage (Rs/day) 94.2 70.5 52.3 64.2 66.3 40.9 36.2 25.6 61.5 39.7Food wage (Rs/day) 23.4 19.3 21.0 11.4 15.9 19.3 33.4 29.7 16.0 26.2Total wage (Rs/day) 117.6 89.8 73.3 75.6 82.2 60.2 69.6 55.3 77.5 66.0 Low Utilization PS Works (no) 9.0 - 36.0 7.0 52.0 23.0 17.0 15.0 10.0 65.0Mandays (‘000) 14.9 - 32.0 19.5 66.5 39.0 13.7 25.8 25.2 103.7Wage in cash (Rs lakh) 13.1 - 3.7 14.2 31.0 17.7 2.8 3.1 13.9 37.5Wage in food (Rs lakh) 0.5 - 13.2 3.0 16.7 10.2 2.5 6.0 5.5 24.1Material costs (Rs lakh) 0.0 - 0.0 3.6 3.6 0.0 0.0 0.0 4.3 4.3Total expdn (Rs lakh) 13.6 - 16.9 20.7 51.2 27.9 5.2 9.1 23.7 65.9Wage share (%) 100.0 - 100.0 82.9 93.1 100.0 100.0 100.0 81.9 93.5Food in wage (%) 3.3 - 77.9 17.5 34.9 36.4 47.5 66.3 28.1 39.2Cash wage (Rs/day) 87.9 - 11.7 72.5 46.7 45.4 20.0 11.9 55.4 36.1Food wage (Rs/day) 3.0 - 41.2 15.4 25.0 26.0 18.1 23.4 21.7 23.3Total wage (Rs/day) 90.9 - 52.9 87.9 71.7 71.4 38.2 35.2 77.1 59.4Notes: This table covers selected PSs only (see Table 1). Total for low utilization PS is for three districts only. Other notes as in Table 13.
4.2.5 Details of Gram Panchayat level Works
There was no specific basis for selection of Gram Panchayats in the sample. It is less
likely to get any discernible pattern while comparing across Gram Panchayats. It is seen
that from 2001-02 to 2002-03 wage share in total expenditure and share of foodgrains in
wages has by and large increased (Table 17).

FFW-SGRY/Mah/IGIDR/April 05 19
Table 17: Details of Gram Panchayat works for High/Low Utilization Panchayat Samitis (PSs) in the Districts under Study, 2001-02 and 2002-03 2001-02 2002-03
Satara Auran-gabad
Gad-chiroli
Akola Total Satara Auran-gabad
Gad-chiroli
Akola Total
High Utilization PS Works (no) 5.0 24.0 15.0 5.0 49.0 4.0 4.0 14.0 5.0 27.0Mandays (‘000) 0.7 1.2 3.2 1.0 6.0 1.1 1.9 2.9 3.8 9.7Wage in cash (Rs lakh) 0.3 1.5 1.0 0.5 3.3 0.3 0.5 1.4 0.1 2.3Wage in food (Rs lakh) 0.1 0.3 0.4 0.0 0.9 0.3 0.5 0.2 0.9 1.8Material costs (Rs lakh) 0.3 8.1 1.4 1.9 11.8 0.2 0.9 0.9 2.0 4.0Total expdn (Rs lakh) 0.8 9.9 2.8 2.5 16.0 0.8 1.9 2.5 3.0 8.1Wage share (%) 55.3 18.5 48.8 22.5 26.2 72.3 52.4 62.5 33.2 50.3Food in wage (%) 29.9 18.8 28.7 6.9 21.6 45.9 52.5 12.6 87.6 45.0Cash wage (Rs/day) 45.0 129.1 30.9 52.0 55.1 28.6 24.5 46.6 3.3 23.3Food wage (Rs/day) 19.2 29.9 12.4 3.9 15.2 24.3 27.1 6.7 23.0 19.0Total wage (Rs/day) 64.3 159.1 43.3 55.9 70.2 52.9 51.7 53.4 26.2 42.4 Low Utilization PS Works (no) 4.0 2.0 15.0 10.0 31.0 4.0 3.0 13.0 4.0 24.0Mandays (‘000) 0.6 1.2 - - - 1.5 2.3 - 1.9 -Wage in cash (Rs lakh) 0.5 0.4 2.2 0.8 3.8 0.5 0.7 1.7 1.2 4.1Wage in food (Rs lakh) 0.1 0.4 0.1 0.1 0.7 0.8 0.8 0.5 0.7 2.9Material costs (Rs lakh) 1.1 0.6 2.5 0.4 4.5 1.1 1.3 2.0 0.8 5.1Total expdn (Rs lakh) 1.7 1.3 4.7 1.3 9.0 2.3 2.9 4.3 2.7 12.2Wage share (%) 32.6 55.8 48.3 70.2 49.7 54.5 55.5 53.0 71.7 58.0Food in wage (%) 16.3 51.0 3.7 12.3 14.6 63.3 53.2 24.1 38.6 41.6Cash wage (Rs/day) 80.4 30.0 - - - 31.3 33.0 - 62.2 -Food wage (Rs/day) 15.7 31.1 - - - 54.0 37.5 - 39.1 -Total wage (Rs/day) 96.0 61.1 - - - 85.2 70.5 - 101.2 -Notes: As in Table 13.
Further note that the implementing officials at the village level (gram sevaks) do not have
copies of the guidelines. They are also not imparted with any specific training that would
help them in awareness creation, beneficiary selection, record keeping and
implementation.
4.3 Monitoring
The Zilla Parishad/DRDA officials are supposed to monitor Zilla Parishad, Panchayat
Samiti and Gram Panchayat works once a month and Panchayat Samiti officials are
supposed to monitor Panchayat Samiti and Gram Panchayat works once every fortnight.
Monitoring has two aspects – one physical and another financial. On the physical front,
officials from higher level are supposed to give technical guidance, but once work is in
progress the quantity and quality of work is verified. Financial review looks at
maintenance of muster rolls, overall wage expenditure and material costs. As secondary
data obtained on monitoring adhered to official guidelines, we resort to some observations
from our field visits to draw indirect inferences. In some Panchayat Samitis we did not get
any information on the works carried out by various line departments because they receive

FFW-SGRY/Mah/IGIDR/April 05 20
order from Zilla Parishad/DRDA and also report to them directly. Further, we observed
that at almost all levels the technical officials were busy in many activities and meetings.
It would be virtually impossible for them to give proper technical guidance for each and
every work and then monitor each of these. It was also observed that there was no uniform
record keeping, accounting practices and reporting. This made monitoring and supervision
a cumbersome and inefficient procedure.
5. Allocation, Lifting and Distribution of Foodgrains
5.1 Distribution of Foodgrains - Districts
As mentioned earlier, the Planning Commission selected the four districts using
percentage utilization of foodgrains (distribution as per cent of allocation) in 2002-03:
Satara and Aurangabad as high utilization districts and Gadchiroli and Akola as low
utilization districts.7 This ordering of districts is also clearly discernible from Table 18
considering streams I and II together. However, this pattern does not hold for stream-I
where percentage utilization of foodgrains in Aurangabad is lower than that in Gadchiroli.
Further, one observes that in 2001-02 the percentage utilization in the high utilization
district of Satara is considerably lower. In contrast, the low utilization district of
Gadchiroli had much higher percentage utilization in 2001-02. Note that SGRY permits
unspent allocation of foodgrains to be carried over as opening balance and utilized in the
next year. This explains more than 100 per cent utilization in Satara. This was not the case
in Gadchiroli. Akola is an interesting situation because it not only has the lowest
utilization in 2002-03 among the four districts under study, but also had even lower
percentage utilization in 2001-02. It is quite likely that in 2003-04 (the period not covered
in our study) percentage utilization will be much higher in Akola. In fact, during our visits
in March 2004 we were informed about some ongoing works where the total wage
component was being paid in foodgrains.8
7 We might note that Maharashtra’s lifting of foodgrains is only about half of allocation in recent years as pointed out in Summary record of the discussion by the Supreme Court Commissioner SR Sankaran with the Government of Maharashtra in December 2003, http://www.geocities.com/righttofood/data/srs_mahvisit.pdf. 8 Such an exercise would also help utilize unspent allocation of previous years.

FFW-SGRY/Mah/IGIDR/April 05 21
Table 18: Allocation, Lifting and Distribution of Foodgrains in the Districts under Study, 2001-02 and 2002-03 2001-02 2002-03
Satara Auran
gabadGadchi
roliAkola Total Satara Auran
gabadGadchi
roli Akola Total
Stream-I Allocation (metric ton) 1740.0 2340.0 2560.0 3440.0 10080.0 2574.0 3480.0 3190.0 3620.0 12864.0Lifting (metric ton) - - 2560.0 809.3 - - - 3165.2 4430.7 Distn (metric ton) 886.5 - 3032.9 191.2 - 3290.7 1975.0 1949.5 2056.2 9271.4Lifting/Allocation (%) - - 100.0 23.5 - - - 99.2 122.4 -Distn/Lifting (%) - - 118.5 23.6 - - - 61.6 46.4 -Distn/Allocation (%) 50.9 - 118.5 5.6 - 127.8 56.8 61.1 56.8 72.1Stream-II Allocation (metric ton) 1730.0 2330.0 2570.0 3430.0 10060.0 2195.0 2962.0 3208.0 4351.0 12716.0Lifting (metric ton) - - 2354.2 536.1 - - - 3162.2 4521.7 -Distribution (metric ton) 1166.6 - 2376.4 86.2 - 2932.0 2862.0 1713.8 1714.7 9222.5Lifting/Allocation (%) - - 91.6 15.6 - - - 98.6 103.9 -Distn/Lifting (%) - - 100.9 16.1 - - - 54.2 37.9 -Distn/Allocation (%) 67.4 - 92.5 2.5 - 133.6 96.6 53.4 39.4 72.5Total (Stream I+II) Allocation (metric ton) 3470.0 4670.0 5130.0 6870.0 20140.0 4769.0 6442.0 6398.0 7971.0 25580.0Lifting (metric ton) - 4914.2 1345.4 - - - 6327.3 8952.4 Distn (metric ton) 2053.1 - 5409.3 277.3 - 6222.7 4837.0 3663.3 3770.9 18493.8Lifting/Allocation (%) - - 95.8 19.6 - - - 98.9 112.3 Distn/Lifting (%) - - 110.1 20.6 - - - 57.9 42.1 Distn/Allocation (%) 59.2 - 105.4 4.0 - 130.5 75.1 57.3 47.3 72.3Note: Distn denotes Distribution.
5.2 Distribution of Foodgrain – Zilla Parishad level Works
Table 19 gives allocation, lifting and distribution in Zilla Parishads of the districts under
study. Overall there has been an increase in percentage utilization of foodgrains. As in the
case of stream-I, the percentage utilization of foodgrains in Aurangabad is lower than
Gadchiroli. This indicates that efforts taken up in 2002-03 in Aurangabad were more for
stream-II works.
Table 19: Allocation, Lifting and Distribution of Foodgrains in Zilla Parishad level Works of the Districts, 2001-02 and 2002-03 2001-02 2002-03
Satara Aurangabad
Gadchiroli
Akola Total Satara Aurangabad
Gadchiroli
Akola Total
Allocation (metric ton) 347.0 702.0 1024.0 1032.0 3105.0 476.9 1392.0 1276.0 1448.0 4592.9Lifting (metric ton) - - - 242.8 - - 1148.4 1266.0 1772.3 -Distn (metric ton) 205.3 - 1213.1 57.6 1476.0 622.3 793.9 779.8 822.5 3018.4Lifting/Allocation (%) - - - 23.5 - - 82.5 99.2 122.4 -Distn/Lifting (%) - - - 23.7 - - 69.1 61.6 46.4 -Distn/Allocation (%) 59.2 - 118.5 5.6 47.5 130.5 57.0 61.1 56.8 65.7Note: Distn denotes Distribution.

FFW-SGRY/Mah/IGIDR/April 05 22
5.3 Distribution of Foodgrains – Panchayat Samiti level Works
Percentage utilization in Table 20 is as expected in high/low utilization Panchayat Samitis
in 2002-03. In 2001-02 Panchayat Samitis of Aurangabad had relatively lower utilization
and that of Gadchiroli had higher utilization and it so happens that the low utilization
Panchayat Samiti of Gadchiroli did even better than the high utilization Panchayat Samiti.
Table 20: Allocation, Lifting and Distribution of Foodgrains in High/Low Utilization Panchayat Samitis (PSs) of the Districts, 2001-02 and 2002-03 2001-02 2002-03
Satara Auran
gabadGadchi
roliAkola Total Satara Auran
gabadGadchi
roli Akola Total
High Utilization PS Allocation (metric ton) 153.5 320.1 207.5 523.9 884.9 55.0 424.0 309.0 551.3 1339.3Lifting (metric ton) - - 273.7 119.7 - - - 311.1 654.0 Distn (metric ton) 77.1 - 242.2 41.1 - 127.7 276.1 279.0 331.3 1014.1Lifting/Allocation (%) - - 131.9 22.8 - - - 100.7 118.6 -Distn/Lifting (%) - - 88.5 34.3 - - - 89.7 50.7 -Distn/Allocation (%) 50.2 - 116.7 7.8 - 232.2 65.1 90.3 60.1 75.7Low Utilization PS Allocation (metric ton) 198.5 - 480.0 342.3 - 551.0 224.0 446.4 360.2 1581.6Lifting (metric ton) - - 422.7 74.4 - - - 378.8 442.5 -Distn (metric ton) 8.9 - 711.6 19.0 - 607.7 90.0 298.6 128.3 1124.6Lifting/Allocation (%) - - 88.1 21.7 - - - 84.9 122.8 -Distn/Lifting (%) - - 168.4 25.6 - - - 78.8 29.0 -Distn/Allocation (%) 4.5 - 148.3 5.6 - 110.3 40.2 66.9 35.6 71.1Note: Distn denotes Distribution.
By and large we could not obtain information on allocation for Gram Panchayats
surveyed. Further, as Gram Panchayats do not have any place for storing foodgrains they
lift in small quantities only when they have to utilize it.
6. Quality, Quantity, Frequency and Timeliness of Foodgrains Distribution
6.1 Location of Wage Payment
Location of cash and food component of wage payment is given in Table 21. The cash
component of the wages was received at the work site in three out of four districts. In
Gadchiroli, wages were not paid at the work site. Foodgrains were received either at the
work site or through a public distribution system (PDS) outlet in the selected districts. The
distribution was only at the work site in Akola, while it was only through PDS outlet in
Gadchiroli and Satara. Nearly 90 per cent of the wage employment beneficiary
respondents in Aurangabad received grains through the PDS outlet and the remaining
received it at the work site.

FFW-SGRY/Mah/IGIDR/April 05 23
Table 21: Percentage of Wage Employment Beneficiary Respondents by Location of Wages Paid Satara Auran-
gabad Gad-
chiroli Akola Total
Location of Cash payment At work site 100.0 100.0 0.0 100.0 72.0 Not at work site 0.0 0.0 100.0 0.0 28.0 Location of Foodgrains Distribution At work site 0.0 10.2 0.0 100.0 27.0 Through PDS outlets 100.0 89.7 100.0 0.0 73.0 Note: (1) As mentioned in Table 4. (2) Some wage employment beneficiary respondents received cash wages only. Hence, for information related with foodgrains distribution (not cash payment) in Tables 21-24 n=133, 78, 119, 111 and 441 for Satara, Aurangabad, Gadchiroli, Akola and Total respectively.
6.2 Periodicity of Wage Payment
There were large differences in periodicity of cash payment and distribution of foodgrain
(Table 22). More than three-fourths of the payments were either weekly or fortnightly. For
Satara, payments were mostly on a fortnightly basis. In Aurangabad, more than two-thirds
of the cash payments were weekly and distribution of foodgrains was more or less equal
between weekly and fortnightly payments. But, more than half of the wage employment
beneficiary respondents in the backward district of Gadchiroli, which is affected by law
and order problem, received payments on a monthly basis and four beneficiaries reported
receiving cash wages after 5-6 months. All respondents reported weekly cash payment in
Akola and most also received foodgrains on a weekly basis, but few reported fortnightly
payment of foodgrains.
Table 22: Percentage of Wage Employment Beneficiary Respondents by Periodicity of Wages Paid Satara Auran-
gabad Gad-
chiroli Akola Total
Periodicity of Cash Payment Weekly 27.5 67.4 44.0 100.0 57.4 Fortnightly 62.3 31.5 0.0 0.0 23.8 Monthly 10.1 1.1 53.0 0.0 18.0 5-6 months 0.0 0.0 3.0 0.0 0.8 Periodicity of Foodgrains Distribution Weekly 10.5 46.2 31.9 86.5 41.7 Fortnightly 78.9 52.6 1.7 13.5 37.0 Monthly 10.5 1.3 66.4 0.0 21.3 Note: As mentioned in Table 4 and 21.
6.3 Satisfaction on Quality and Norm of Wage Payment
Wage employment beneficiary respondents received either rice or wheat or both in Satara
and Gadchiroli. All the wage employment beneficiary respondents received both rice and
wheat in Akola, while most participants in Aurangabad received only wheat.
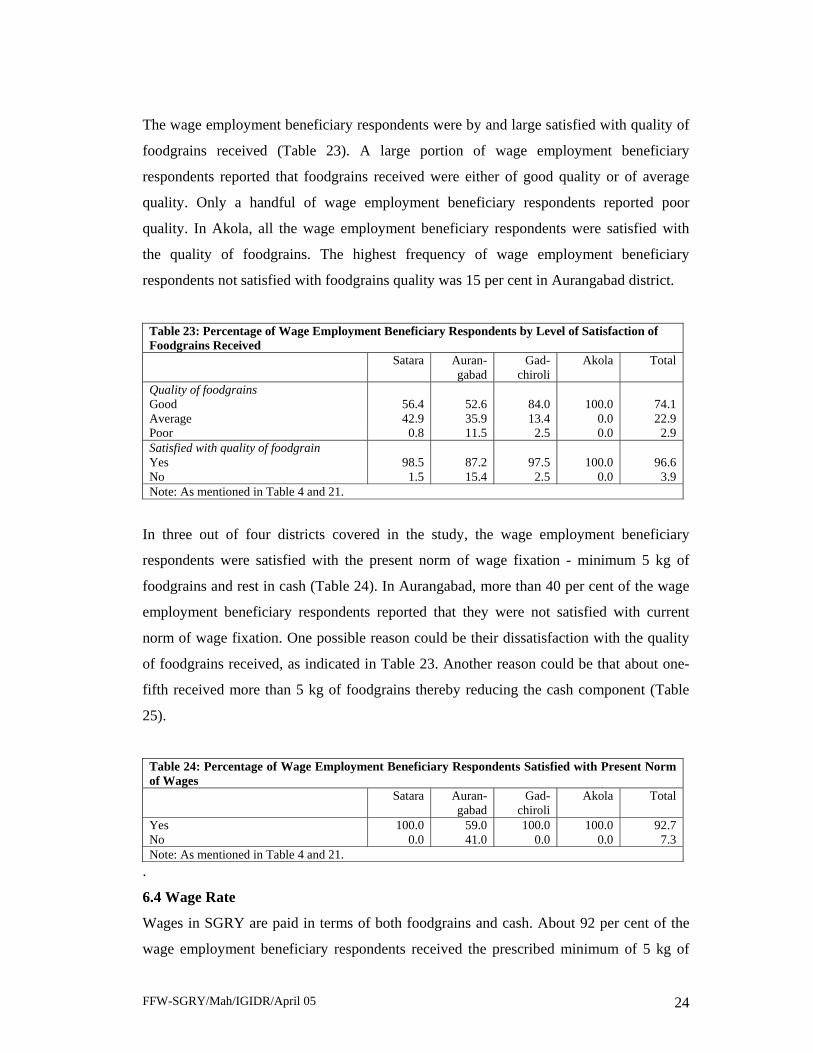
FFW-SGRY/Mah/IGIDR/April 05 24
The wage employment beneficiary respondents were by and large satisfied with quality of
foodgrains received (Table 23). A large portion of wage employment beneficiary
respondents reported that foodgrains received were either of good quality or of average
quality. Only a handful of wage employment beneficiary respondents reported poor
quality. In Akola, all the wage employment beneficiary respondents were satisfied with
the quality of foodgrains. The highest frequency of wage employment beneficiary
respondents not satisfied with foodgrains quality was 15 per cent in Aurangabad district.
Table 23: Percentage of Wage Employment Beneficiary Respondents by Level of Satisfaction of Foodgrains Received Satara Auran-
gabad Gad-
chiroli Akola Total
Quality of foodgrains Good 56.4 52.6 84.0 100.0 74.1 Average 42.9 35.9 13.4 0.0 22.9 Poor 0.8 11.5 2.5 0.0 2.9 Satisfied with quality of foodgrain Yes 98.5 87.2 97.5 100.0 96.6 No 1.5 15.4 2.5 0.0 3.9 Note: As mentioned in Table 4 and 21.
In three out of four districts covered in the study, the wage employment beneficiary
respondents were satisfied with the present norm of wage fixation - minimum 5 kg of
foodgrains and rest in cash (Table 24). In Aurangabad, more than 40 per cent of the wage
employment beneficiary respondents reported that they were not satisfied with current
norm of wage fixation. One possible reason could be their dissatisfaction with the quality
of foodgrains received, as indicated in Table 23. Another reason could be that about one-
fifth received more than 5 kg of foodgrains thereby reducing the cash component (Table
25).
Table 24: Percentage of Wage Employment Beneficiary Respondents Satisfied with Present Norm of Wages Satara Auran-
gabad Gad-
chiroli Akola Total
Yes 100.0 59.0 100.0 100.0 92.7 No 0.0 41.0 0.0 0.0 7.3 Note: As mentioned in Table 4 and 21.
.
6.4 Wage Rate
Wages in SGRY are paid in terms of both foodgrains and cash. About 92 per cent of the
wage employment beneficiary respondents received the prescribed minimum of 5 kg of

FFW-SGRY/Mah/IGIDR/April 05 25
foodgrains per day (Table 25). However, some wage employment beneficiary respondents
did not receive foodgrains at all. The proportion of wage employment beneficiary
respondents receiving wages only in cash and no grains was 8 per cent ranging from 4 per
cent in Satara to 13 per cent in Aurangabad. None of the wage employment beneficiary
respondents received more than 5 kg of foodgrains in Akola. But, in other districts some
wage employment beneficiary respondents did receive more than 5 kg of grains.
Particularly noteworthy, as mentioned earlier, is that about 21 percent of wage
employment beneficiary respondents received more than 5 kg of foodgrains in
Aurangabad. The maximum quantity of foodgrains received by a beneficiary was 10 kg in
Gadchiroli and Satara, while it was 15 kg in Aurangabad.
Table 25: Quantity of Foodgrains Received per Day by Wage Employment Beneficiary Respondents Satara Auran-
gabad Gad-
chiroli Akola Total
Minimum quantity received per day (Kg) 0 0 0 0 0 Maximum quantity received per day (Kg) 10 15 10 5 15 Average quantity received per day (Kg) 4.9 5.5 4.6 4.8 4.9 Per cent of WBs by quantity received (Kg)
0 3.6 12.5 11.2 5.9 7.9 1-4 0.0 0.0 0.0 0.0 0.0 5 95.0 67.0 83.6 94.1 86.4 6-10 1.4 18.2 5.2 0.0 5.2 >10 0.0 2.3 0.0 0.0 0.4
Notes: (1) As mentioned in Table 4. (2) WB denotes wage employment beneficiary respondent. (3) One WB respondent in Aurangabad received wage payment at the rate of Rs.700/- per day for services rendered using his tractor. He has been excluded from the analysis in Tables 25-33 and n=88 and 478 for Aurangabad and Total respectively.
There have been considerable variations across districts and agencies with regard to cash
component of wages (Table 26). The cash wage across agencies varied between Rs.20 to
Rs.63 with the average being Rs.33 that ranged between Rs.26 in Gadchiroli and Rs.51 in
Satara. The minimum cash wage rate has been Rs.15 per day in the backward district of
Godchiroli, while the maximum was Rs.165 in the relatively developed district of Satara.
Semi-skilled workers like masons are paid higher wages than others in SGRY. As Table
27 shows about 25 per cent of workers were paid more than Rs.60 per day in Satara, but
such workers in other districts were only about three to seven per cent.

FFW-SGRY/Mah/IGIDR/April 05 26
Table 26: Agency wise Wage rate in SGRY (cash component only) Satara Auran-
gabad Gad-
chiroli Akola Total
Average wage rate received Gram Panchayat 63.3 42.1 29.9 30.2 37.2 Panchayat Samiti 47.1 35.4 19.5 22.0 29.1 Zilla Parishad 44.1 33.5 20.3 35.0 34.8 All SGRY works 50.5 38.4 25.8 26.8 33.3 Minimum wage rate received Gram Panchayat 20 25 15 22 15 Panchayat Samiti 20 30 18 22 18 Zilla Parishad 35 25 15 22 15 All SGRY works 20 25 15 22 15 Maximum wage rate received Gram Panchayat 165 100 100 125 165 Panchayat Samiti 76 65 25 22 76 Zilla Parishad 65 35 50 70 70 All SGRY works 165 100 100 125 165 Note: As mentioned in Tables 4 and 25.
Table 27: Percentage Distribution of Wage Employment Beneficiary Respondents by Wage Rate Received (all works; cash component only) Wage rate Satara Auran-
gabad Gad-
chiroli Akola Total
0-20 7.2 0.0 50.7 0.0 16.3 21-40 22.5 90.9 34.3 78.0 52.1 41-60 45.7 2.3 11.9 16.9 21.1 61-80 12.3 3.4 0.0 3.4 5.0 81-100 3.6 3.4 3.0 0.0 2.5 >100 8.7 0 - 1.7 3.0 Note: As mentioned in Tables 4 and 25.
7. Employment and Income of Beneficiaries
7.1 Number of Days of Employment Table 28 gives number of days of employment under SGRY works in a year by wage
employment beneficiary respondent. The average number of days of employment per
wage employment beneficiary respondent was 29.1, which varied between 19.6 in Satara
and 49.1 in Akola. The minimum days of employment reported was just one in
Aurangabad in a Gram Panchayat level work. For other districts, the minimum was
between two and eight days. The maximum number of days of employment was 120 in
Akola, while it was between 60-62 for the other districts.

FFW-SGRY/Mah/IGIDR/April 05 27
Table 28: Agency wise Days of Employment Received by Wage Employment Beneficiary Respondents on SGRY Works Satara Auran-
gabad Gad-
chiroli Akola Total
Average days of employment Gram Panchayat 8.8 26.0 23.1 27.6 20.4 Panchayat Samiti 34.8 33.8 19.2 84.1 43.0 Zilla Parishad 34.2 27.0 20.1 52.5 33.8 All SGRY works 19.6 28.4 21.5 49.1 29.1 Minimum days of employment Gram Panchayat 2 1 3 8 1 Panchayat Samiti 16 14 10 30 10 Zilla Parishad 15 8 10 45 8 All SGRY works 2 1 3 8 1 Maximum days of employment Gram Panchayat 15 60 60 30 60 Panchayat Samiti 60 60 40 120 120 Zilla Parishad 45 62 35 60 62 All SGRY works 60 62 60 120 120 Note: As mentioned in Tables 4 and 25.
Table 29 shows percentage distribution of wage employment beneficiary respondents by
number of days of employment. About 70 per cent of the beneficiaries in all the districts
obtained work for less than 30 days. In Satara and Gadchiroli almost half the respondents
got work for less than 15 days whereas in Aurangabad and Akola three-fourth of wage
employment beneficiary respondents got work in the range of 16-30 days or more.
However, the average days of employment in Aurangabad is not as high as in Akola
(Table 28). More days of employment in Akola is particularly for Panchayat Samiti and
Zilla Parishad works, which were mostly minor irrigation (Annexure 2). Minor irrigation
works were also covered in Gadchiroli, but the size of works seem to be small in terms of
it employment potential.
Table 29: Percentage of Wage Employment Beneficiary respondents by Number of Days of Employment Received on SGRY Works Days of Employment Satara Auran-
gabad Gad-
chiroli Akola Total
1-15 days 59.4 27.3 49.3 6.8 37.7 16-30 days 19.6 43.2 28.4 47.5 33.3 31-45 days 17.4 8.0 15.7 8.5 13.0 46-60 days 3.6 18.2 6.7 17.8 10.7 61-75 days 0.0 3.4 0.0 0.0 0.6 76-90 days 0.0 0.0 0.0 8.5 2.1 >90 days 0.0 0.0 0.0 11.0 2.7 Note: As mentioned in Tables 4 and 25.

FFW-SGRY/Mah/IGIDR/April 05 28
7.2 Income
Average annual household income of wage employment beneficiary respodents from
SGRY was Rs.2633, which ranged between Rs.1911 in Satara and Rs.4001 in Akola
(Table 30). This includes imputed cost of foodgrains at the official rate of Rs.26 per 5 kg
used for SGRY programmes in Maharashtra. The gain in income was less than Rs1000 per
year for about a quarter of the households, between Rs.1000-2000 for a little less than one-
third of the households, between Rs.2000-3000 for nearly one-fifth of the households
(Table 31). In Akola and Aurangabad, 15-20 per cent of wage employment beneficiary
respondent households had income gain of more than Rs.5000. The relatively high income
for some households could be due to semi-skill nature of their work.9
Table 30: Average Household Income of Wage Employment Beneficiary Respondents from SGRY and Non-SGRY Sources Average Income
Satara Auran-
gabad Gad-
chiroli Akola Total
SGRY(Rs) 1911.0 2917.0 1984.1 4000.6 2632.6 Non-SGRY (Rs) 10720.3 6824.1 14141.7 12042.3 11219.7 Total (Rs) 12631.3 9741.1 16125.9 16043.0 13921.1 SGRY as per cent of ‘Non-SGRY’ 17.8 42.7 14.0 33.2 23.5 Note: As mentioned in Tables 4 and 25.
Table 31: Percentage of Wage Employment Beneficiary Respondents by Household Income from SGRY Works Income
Satara Auran-
gabad Gad-
chiroli Akola Total
<1000 44.2 13.6 30.6 1.7 24.3 1000-2000 23.2 26.1 35.1 41.5 31.6 2000-3000 10.9 28.4 13.4 24.6 18.2 3000-4000 8.0 14.8 8.2 0.0 7.3 4000-5000 8.7 2.3 6.0 11.9 7.5 >5000 5.1 14.8 6.7 20.3 11.1 Minimum (Rs) 150 40 288 1000 40 Maximum (Rs) 10000 9000 8640 19200 19200 Note: As mentioned in Tables 4 and 25
While discussing income earned in SGRY, we might note a few qualifications in order to
appreciate the quantitative magnitudes in the proper context. First, survey estimates of
household income are generally confronted with several well-known problems and have a
tendency towards underestimation in most countries. In addition to the standard problems,
we must remember that this survey did not primarily aim at total household income
9 We must also note that wage cost equals the total work cost in some cases. Thus, the wage bill might have been partly inflated in these cases due to apparent inclusion of material cost.
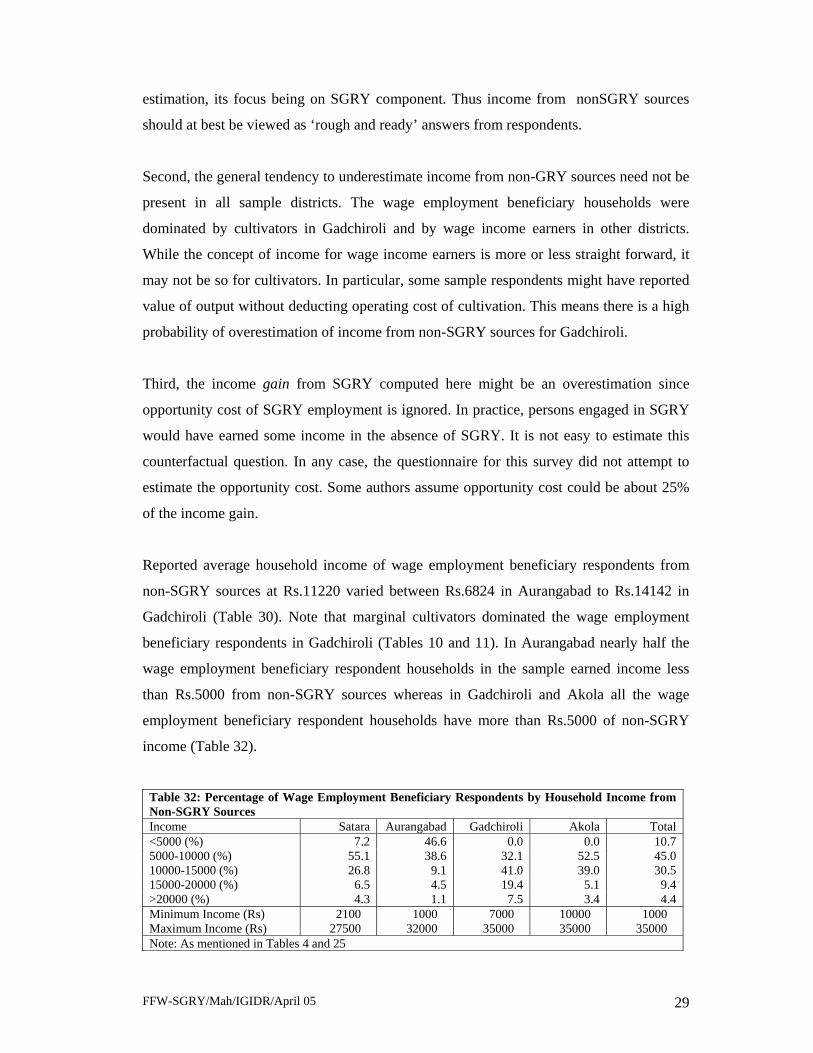
FFW-SGRY/Mah/IGIDR/April 05 29
estimation, its focus being on SGRY component. Thus income from nonSGRY sources
should at best be viewed as ‘rough and ready’ answers from respondents.
Second, the general tendency to underestimate income from non-GRY sources need not be
present in all sample districts. The wage employment beneficiary households were
dominated by cultivators in Gadchiroli and by wage income earners in other districts.
While the concept of income for wage income earners is more or less straight forward, it
may not be so for cultivators. In particular, some sample respondents might have reported
value of output without deducting operating cost of cultivation. This means there is a high
probability of overestimation of income from non-SGRY sources for Gadchiroli.
Third, the income gain from SGRY computed here might be an overestimation since
opportunity cost of SGRY employment is ignored. In practice, persons engaged in SGRY
would have earned some income in the absence of SGRY. It is not easy to estimate this
counterfactual question. In any case, the questionnaire for this survey did not attempt to
estimate the opportunity cost. Some authors assume opportunity cost could be about 25%
of the income gain.
Reported average household income of wage employment beneficiary respondents from
non-SGRY sources at Rs.11220 varied between Rs.6824 in Aurangabad to Rs.14142 in
Gadchiroli (Table 30). Note that marginal cultivators dominated the wage employment
beneficiary respondents in Gadchiroli (Tables 10 and 11). In Aurangabad nearly half the
wage employment beneficiary respondent households in the sample earned income less
than Rs.5000 from non-SGRY sources whereas in Gadchiroli and Akola all the wage
employment beneficiary respondent households have more than Rs.5000 of non-SGRY
income (Table 32).
Table 32: Percentage of Wage Employment Beneficiary Respondents by Household Income from Non-SGRY Sources Income Satara Aurangabad Gadchiroli Akola Total <5000 (%) 7.2 46.6 0.0 0.0 10.7 5000-10000 (%) 55.1 38.6 32.1 52.5 45.0 10000-15000 (%) 26.8 9.1 41.0 39.0 30.5 15000-20000 (%) 6.5 4.5 19.4 5.1 9.4 >20000 (%) 4.3 1.1 7.5 3.4 4.4 Minimum Income (Rs) 2100 1000 7000 10000 1000 Maximum Income (Rs) 27500 32000 35000 35000 35000 Note: As mentioned in Tables 4 and 25

FFW-SGRY/Mah/IGIDR/April 05 30
The SGRY income as a proportion of income from non-SGRY sources works out to 24 per
cent on an average for all the wage employment beneficiary respondent households - 14
per cent in Gadchiroli, 18 per cent in Satara, 33 per cent in Akola and 43 per cent in
Aurangabad (Table 30). Thus, SGRY did play an important supplementary role in
augmenting household income of the wage employment beneficiary respondents, though
the extent differed considerably across the four districts covered in this study. The
absolute average income earned from SGRY is similar in Satara and Gadchiroli. On an
average, the wage employment beneficiary respondents were from relatively poorer
households in Satara compared to Gadchiroli. This explains why income from SGRY as a
percentage of non-SGRY income is lower in Gadchiroli (see Figure 2). The poverty
incidence in Figure 2 refers to households below poverty line, as explained in Table 2.
Figure 2: District Poverty Incidence (%) and SGRY Income as a Percentage of Non-SGRY Income
0
20
40
60
Satara Aurangabad Gadchiroli Akola
Poverty Incidence (%) Income Rise from SGRY (%)
7.3 Targeting
An important aspect in evaluation of poverty reduction programmes is the question of
targeting. SGRY is a self-targeted programme open to any one who is willing to do the
manual work at the given wage rate. But, given the poverty alleviation objective, one
interesting question is: do wage employment beneficiaries predominantly belong to poor
households before joining the programme? One of the questions asked to the respondents

FFW-SGRY/Mah/IGIDR/April 05 31
was whether he/she was a member of BPL family. The answer does not reveal that they
predominantly belonged to BPL households in all the districts. The maximum proportion
of BPL households in the sample was 62 per cent in Akola where all the social groups
were uniformly represented (Table 33). In Gadchiroli, more than three-fifths of the SC/ST
wage employment beneficiary respondents belonged to BPL households, but about two-
fifths from the ‘others’ category. In two other districts, Satara and Aurangabad, the
proportion of BPL households was as low as 35-38 per cent. One might, however, argue
that there might be identification and administrative problems in providing BPL cards to a
household and not having a BPL card does not necessarily mean the household is above
poverty line.
Table 33: Percentage of Below Poverty Line (BPL) Cardholder Beneficiaries by Social Groups Social Groups
Satara Auran-
gabad Gad-
chiroli Akola Total
SC 42.1 70.0 63.9 60.0 61.0 ST 100.0 7.7 69.0 63.6 58.2 Others 36.8 20.0 42.0 60.5 38.5 All Beneficiaries 38.0 35.2 53.7 61.9 47.5 Note: As mentioned in Tables 4 and 25.
In order to provide an alternative check, we updated the Planning Commission’s official
poverty line for rural Maharashtra for 1999-2000 by the state’s consumer price index
number for agricultural labourers (CPIAL) for the reference period of the survey and
obtained an estimate of the poverty line as Rs.4037 on per person per year basis (that is,
Rs.336.45 per capita per month). The per capita household income without SGRY
component of the respondents is then compared with this poverty line to determine the
poverty status of the sample households prior to joining the SGRY progrmme. As Figure 3
reveals that 85 per cent ranging from 74 to 99 per cent of the beneficiaries remained below
the poverty line on the basis of their stated income from sources other than SGRY in the
four districts. These proportions are substantially high compared to corresponding
proportions of households with the BPL status. While the two alternative measures of
targeting could have their own problems, we might conclude that the self-targeting
objective has been by and large able to capture the poor.

FFW-SGRY/Mah/IGIDR/April 05 32
Figure 3: Poverty Incidence among Wage Employment Beneficiary Households: Comparison of their BPL Status and Poverty Estimates Based on Reported Income
0
20
40
60
80
100
Satara Aurangabad Gadchiroli Akola Total
Households with BPL status (%) Poverty ratio based on reported income (%)
7.4 Individual Beneficiaries
As discussed earlier, some of the sample individual asset beneficiary respondents are those who
benefited from open irrigation well, land development and dwelling units. Most of the individual
asset beneficiaries (38 out of 47) interviewed have annual income below Rs.15000 (Table 34).
Given a poverty line of around Rs.4000 per capita per year all these beneficiaries are likely to
below or around the poverty line. However, there are deviations. Field observations reveal that a
bank peon in Satara with assured annual income of about Rs.50000 is an individual beneficiary. In
some cases we observed that individual beneficiary respondents above the poverty line happen to
be close relatives of local representatives. Further, three individual beneficiary respondents in
Satara have more than four hectares of land and two are not from SC/ST. In Gadchiroli also, two
of the three individual beneficiary respondents are not SC/ST. These are clear instances of failure
in targeting both in terms of income as well as social group.
Table 34: Number of Individual Asset Beneficiaries by Household Income Income
Satara Auran-
gabad Gad-
chiroli Akola Total
5000-10000 2 1 0 1 4 10000-15000 7 9 4 14 34 15000-20000 3 0 1 0 4 >20000 1 0 2 0 3 No Information 0 2 0 0 2 Minimum (Rs) 5000 5460 12000 8000 5000 Maximum (Rs) 50000 14280 25000 15000 50000 Average (Rs) 14385 10808 17286 11867 12672 Note: As mentioned in Table 4.

FFW-SGRY/Mah/IGIDR/April 05 33
Most individual respondents benefited from open irrigation wells (Table 35). In fact, all
the respondents in Satara and Aurangabad and some in Gadchiroli and Akola got these.
Some respondents in Gadchiroli benefited from land development whereas some in Akola
benefited from a dwelling unit each.
Table 35: Number of Individual Asset Beneficiaries by Assets Generated Asset Type
Satara Auran-
gabad Gad-
chiroli Akola Total
Land development 0 0 5 0 5 Open irrigation wells 13 12 2 8 35 Dwelling units 0 0 0 7 7
During field visits we observed that some individual beneficiaries first spend from their
own resources and then receive the payment in three phases. This provision is meant to
ensure that actual work is done but it also means that such benefits can be availed by those
individuals who can spend on their own to begin with. This may partly explain why
individual beneficiaries may not always be from the BPL households.
8. Problems in Planning and Implementation and Role of PRIs
SGRY started with a twin objective of providing wage employment and food security and
creating durable community assets. The present evaluation study carried out for four
districts of Maharashtra reveals a mixed picture of success and failure. SGRY programme
has succeeded in generating several lakh of mandays of employment in each district even
after discounting for possible leakages. The wage employment beneficiaries interviewed
have by and large received the stipulated minimum quantity of five kilogram of
foodgrains. There is a large variation in the cash component of the wage. In particular, the
cash component seems to be low in the district of Gadchiroli. To the extent SGRY aimed
at supplementing the non-SGRY income of the poor, it has partly succeeded in the sample
households in generating on an average 30 days of work per wage employment beneficiary
respondent. Some of the wage employment beneficiary respondents have, however, got
work for as low as one week.
Substantial proportions of the wage employment beneficiary respondents do not belong to
the BPL category. Being a self-targeted programme, all SGRY wage employment
beneficiaries need not necessarily belong to the BPL category. However, if we compare
household income excluding that from the SGRY source with the official poverty line
used for the state, about 85 per cent of the wage employment beneficiary respondents turn

FFW-SGRY/Mah/IGIDR/April 05 34
out to be poor. Thus, one might say the self-targeting nature of the programme has by and
large covered the poor. Our survey was, of course, not intended to investigate whether all
the poor households have been able to benefit from SGRY, that is, about the so-called
exclusion errors. Informal discussions also revealed that all the people willing to do such
works did not benefit. With regard to asset generation, it is observed that some non-BPL
and non-SC/ST households have also benefited.
Some of our wage employment beneficiary respondents (particularly in Gadchiroli and
Akola) pointed out problems in effective implementation. The most common complaint is
that the beneficiaries do not receive both foodgrains and cash components of wages on
time.
In case of Maharashtra, state government also intervenes in a large way through
Employment Guarantee Scheme (EGS). There is need for coordination at planning and
implementation stages of SGRY and EGS.
Examination of secondary data reveals that wage bill accounts for almost the total cost of
the works in some districts giving rise to strong suspicion that material and equipment
expenses have been clubbed in the wage bill. We observed that one wage employment
beneficiary has received ‘wage’ for providing a tractor for the work. Another agreed
informally of not doing any work. The incidence of outsiders (bahargaon and not from
neighbouring villages) in the muster rolls is not insignificant. All such leakages raise
question about existence of ‘ghost workers’.
An important aspect that came up in informal discussions and was also mentioned by
some respondents is the involvement of contractors in several works. The implementing
agencies in Maharashtra find it easier because contractors are involved in other similar
works. The contractors will have a tendency to use labourers who are not necessarily from
the locality and have lower bargaining power. Another outcome of involvement of
contractor could be to substitute machines for labour wherever possible thus reducing the
labour intensity of the work.
Some individual beneficiaries spend from their own resources first and then receive the
payment (both in cash and kind) in phases. While this provision is meant to ensure that

FFW-SGRY/Mah/IGIDR/April 05 35
actual work is done, it also means that such benefits can only be availed by those who can
spend on their own to begin with. Alternatively, providing assets to beneficiary after
completion of work can overburden government machinery, lead to involvement of
contractors, and compromise on quality.
People’s involvement in identifying works useful for the village seems to be lacking at the
planning stage. While poor participation of the villagers at the Panchayat Samiti or Zilla
Parishad level is understandable, it is absent even at the Gram Panchayat level. Further,
after completion of durable assets no beneficiary committees have been formed. As noted
earlier, planning is mostly done by officials at the district level. The absence of
beneficiaries’ committees after completion of work also means that the involvement of
people in operation and maintenance become difficult. These go against the spirit of
decentralization under PRIs.
One constraint at the Gram Panchayat level is that works are normally small in nature and
it cannot generate employment for longer periods. This explains the earlier observation of
less than one-week of employment for some. This gives rise to discretion and rationing of
beneficiaries. This could give rise to local conflicts when the potential benefit would be
large like those to individual beneficiaries such as dwelling units and open irrigation wells.
During the field trips we had difficulty in identifying Gram Panchayats with four works
for the reference period, 2001-02 and 2002-03, to canvass schedules among five wage
employment beneficiaries in each of the four works, as per the sampling design. To
provide employment for longer periods Gram Panchayats need to undertake more works.
This will improve food security on a sustained basis and also reduce out-migration.
The assets generated by wage employment beneficiaries surveyed have been mentioned in
Annexure-2. These are assets for the community and are largely in the form of minor
irrigation, soil conservation and gutter among others. In one occasion we visited a work
completed under minor irrigation head in Akola, but there was no settlement or
agricultural land close to the scheme. It basically served the purpose of storing water for
use by livestock. We may mention that this is one of the works where no local people were
involved in the construction, as was largely observed in this district. We may reiterate that
almost all the expenditure goes for payment of wage bill (section 4.2). If the capital

FFW-SGRY/Mah/IGIDR/April 05 36
expenditure is not met through some other means the projects are not likely to be of
durable type by the very design. With such low demands on quality it is difficult to get
make an assessment when there is a time lag between completion of works and the survey.
Nevertheless, durable assets have been created and are in use by the community. For
instance, we saw a recently built concrete well that drinking water. This would not have
been possible by adhering to the SGRY norm on wage share.
9. Recommendations
SGRY started with the twin objectives of providing wage employment and food security
and creating durable community assets. The present study carried out for four districts of
Maharashtra reveals a mixed picture of success and failure. Based on the findings of this
report, our recommendations are the following:
• Some of the wage employment beneficiaries have not got work for more than one
week. In particular, Gram Panchayat level works are normally small in nature,
generating short-term employment. To provide employment for longer periods
Gram Panchayats need to undertake more works. This will improve food security
on a sustained basis and also reduce out-migration, but this may not be possible
with current levels of allocation.
• The works to be undertaken are constrained by the final allocation of funds/food at
the Zilla Parishad or Panchayat Samiti level. It is only after allocation that works
are distributed based on the bargaining power of the local representatives. To do
away with rationing and discretion there is a case for greater allocation and better
utilization of allocated funds.
• Planning for works is invariably done at the Panchayat Samiti or Zilla Parishad
level. There is hardly any people’s participation while planning for works at the
village level. To adhere to the spirit of decentralization the involvement of people
through PRIs should be effective.
• Most beneficiaries (wage employment beneficiary and individual asset beneficiary)
are likely to be below or around the poverty line, but there are some deviations
indicating failure of targeting both in terms of income and social group.
Monitoring procedure need to be strengthened to reduce/eliminate unintended
beneficiaries (inclusion error). The gram sabha should be involved in planning,
implementation and monitoring. Information on works done, amount of expenses

FFW-SGRY/Mah/IGIDR/April 05 37
under different heads and number of person days of employment should be
compulsorily put on the panchayat notice board during as well as after the
completion of works.
• Poor maintenance of records is a larger issue. Accurate and uniform maintenance
of records is also essential for monitoring and evaluation. Proper training of
officials at Gram Panchayat and Panchayat Samiti level will improve reporting and
accounting practices. For instance, it is generally the practice at an aggregate level
to divide the total wage bill by norm of wage rate to arrive at mandays. This does
not take into account the fact that some people are paid higher wage rates because
of their skill and some others are paid piece rates.
• Government of Maharashtra intervenes through Employment Guarantee Scheme
(EGS). Since objectives of SGRY and EGS are similar, coordination in planning
and implementation of SGRY and EGS is needed in Maharashtra. Such
coordination and pooling of resources together could help in completing some of
the projects (e.g., water conservation activities) which are left incomplete due to
lack of sufficient funds.
• Expansion of SGRY to kind of employment guarantee scheme as discussed
recently in policy circles would mean removal of any priority for any group in the
employment component of the programme so that it is open ended without any
restrictions. However, priorities for certain sections could continue for the
objective of creation of assets for individual beneficiaries.
• Given the objective of supplementing the earning opportunity for the poor during
lean season and natural calamities, the size of SGRY should be flexible once it is
able to more or less cover the labour supply. The size should expand or contract as
per need at various levels depending on absorption of labour force by the normal
economic activities. Determining the required size at the local level is not an easy
task and might require close interaction of government officials, PRI institutions
and local non-governmental organizations (NGOs).
• Timing is crucial for success of SGRY. Demand for regular public works is high
during February to June. Unless sufficient food and fund are available during these
months, out-migration creating ‘footloose’ labour with less bargaining power
becomes a permanent feature.

FFW-SGRY/Mah/IGIDR/April 05 38
References
Acharya, S (1990): The Maharashtra Employment Guarantee Scheme: A Study of Labour Market
Intervention, Bangkok, ILO/ARTEP. Barrett, C, Holden, S and Clay, D (2004): ‘Can Food-for-Work programmes reduce vulnerability’,
Discussion Paper, Agricultural University of Norway. Basu, K (1981): Food for Work Programmes: Beyond Roads tha Get Washed Away’, Economic and
Political Weekly, Vol.16, No.1 & 2. Dandekar, S and Sathe, M (1980): ‘Employment Guarantee Scheme and Food for Work Programme’,
Economic and Political Weekly, Vol.15, No.15. Dev, SM (1996): ‘Experience of India’s (Maharashtra) Employment Guarnatee Scheme: Lessons for
Development Policy’, Development Policy Review, Vol. 14, No.3. Dreze, J (1991): ‘Famine Prevention in India’, in J Dreze and A Sen (eds.) Political Economy of
Hunger, Vol. 2, Oxford University Press. Gaiha, R and Imai, K (2000): ‘Rural public works and poverty alleviation-The cost of the employment
guarantee scheme, Maharashtra’, Faculty of Management Studies, University of Delhi, Mimeo. Ganesh-Kumar A, Mishra S and Panda M (2004): ‘Employment Guarantee for Rural India’, Economic
and Political Weekly, Vol. 39, No. 51. Government of India (2003): Sampoorna Grameen Rozgar Yojana (SGRY): Guidelines, Ministry of
Rural Development, New Delhi. Hirway, I and Tarhal, P (1994): Towards Employment Guarantee in India, Sage, New Delhi. Krishnaraj, M, Pandey, D and Kanchi, A (2004): ‘Does EGS Require Restructuring for Poverty
Alleviation and Gender Equality’ – Parts I and II, Economic and Political Weekly, Vol. 39 (Nos. 16 and 17).
Nayyar, R (2002): ‘The contribution of public works and other labour-based infrastructure to poverty
alleviation: The Indian experience’, Issues in Employment and Poverty, Discussion Paper 3, ILO, Geneva.
Panda, M (1981): ‘Productivity Aspect of Wages in Food for Work Programme’, Economic and
Political Weekly, Vol.16, No.20. Planning Commission (2002): ‘Study on Employment Assurance Scheme (EAS)’, Programme
Evaluation Organisation, http://planningcommission.nic.in/reports/peoreport/cmpdmpeo/volume1/178.pdf.
Policy and Development Initiatives (2000): ‘Study on Assessment of Poverty Alleviation Schemes in
Maharashtra’ (submitted to Planning Commission), http://planningcommission.nic.in/reports/sereport/sereporf.htm.
Ravallion, M., Datt, G and Chaudhuri, S (1993), ‘Does Maharashtra’s Employment Guarantee Scheme
Guarantee Employment? Effects of the 1988 wage increase’, Economic Development and Cultural Change, Vol. 41, No.2.
Sen, S (2003): ‘Food and Employment Schemes in Barabanki, UP’,
http://www.geocities.com/righttofood/data/upreport.pdf. Subbarao, K (1989): ‘Interventions to Combat Household-level Food Insecurity: A Review of India’s
Experience’, World Bank, Washington DC.

FFW-SGRY/Mah/IGIDR/April 05 39
Annexure 1: Panchayat Samiti (PS) wise Utilization Rate (%) of Foodgrains, 2002-03
Districts/PSs Stream I Stream II Total Satara Man 250.6 138.8 184.9 Khandala 232.2 140.1 176.3 Koregaon 219.3 134.5 167.2 Karad 137.4 136.4 136.9 Mahabaleshwar 108.4 150.3 131.0 Javli 148.6 118.9 129.3 Patan 122.8 128.4 125.7 Khatav 110.3 132.9 116.8 Phaltan 104.6 139.6 116.6 Satara 94.2 130.3 110.6 Wai 78.3 127.3 105.6 Total 127.8 133.6 130.5 Aurangabad Sillod 80.4 110.1 94.2 Khultabad 52.3 118.3 82.7 Soygaon 30.3 141.9 81.4 Aurangabad 65.1 99.1 80.7 Vaijapur 53.9 101.7 75.9 Gangapur 51.0 93.9 70.7 Paithan 56.9 81.0 68.0 Kannad 54.6 73.2 63.2 Phulambri 40.2 78.8 57.3 Total 56.8 96.6 75.1 Gadchiroli Mulchera 36.2 137.0 87.8 Kurkheda 90.3 65.0 77.9 Wadsa 62.9 82.7 73.2 Aheri 54.0 86.3 70.1 Gadchiroli 83.2 56.4 69.2 Chamorshi 66.9 49.5 57.8 Dhanora 61.2 53.1 57.2 Armori 83.1 15.2 47.9 Etapalli 51.6 37.5 44.9 Sironcha 50.4 28.0 39.4 Korchi 33.6 40.4 36.9 Bhamragad 5.0 8.5 6.6 Total 61.1 53.4 57.3 Akola Telhara 85.8 53.4 69.2 Barshi Takli 77.8 60.0 68.8 Murtizapur 65.1 59.4 61.7 Akot 60.1 56.8 58.2 Patur 35.6 57.3 47.5 Balapur 33.3 53.6 43.2 Akola 43.5 22.2 31.5 Total 56.8 39.4 47.3 Note: Districts/Panchayat Samitis are arranged in descending order of percentage utilization for total (stream-I+II). Some figures are more than 100% due to carry over of previous year’s unutilized allocation.

FFW-SGRY/Mah/IGIDR/April 05 40
Annexure-2
Type of Works, Location and Number of Wage Employment Beneficiaries
Satara Sl.No.
Type of Work Location No of WBs
Village Gram Panchayat Panchayat Samiti
Gram Panchayat level 1 Other (Bathroom) Ahire Ahire Khandala 52 Other (Gutter) Ahire Ahire Khandala 53 Other (Gutter) Ahire Ahire Khandala 54 Other (Gutter) Ahire Ahire Khandala 55 Construction of rural link road Ajanuj Ajanuj Khandala 56 Other (Gutter) Ajanuj Ajanuj Khandala 57 Other (Gutter) Ajanuj Ajanuj Khandala 58 Other (Gutter) Ajanuj Ajanuj Khandala 59 Other (Gutter) Khatav Pusegav Khatav 5
10 Other (Gutter) Pusegav Pusegav Khatav 511 Other (Gutter) Pusegav Katagun Khatav 512 Other (Gutter) Pusegav Katagun Khatav 513 Other (Gutter) Khatav Katagun Khatav 514 Other (Gutter) Katagun Katagun Khatav 515 Other (Bathroom) Pusegav Pusegav Khatav 516 Other (House) Pusegav Pusegav Khatav 5
Panchayat Samiti level 1 Soil conservation Guthalwa. Guthalwadi Khandala 52 Soil conservation Khandala Khandala Khandala 53 Soil conservation Mhavashi Mhavashi Khandala 54 Soil conservation Padali Padali Khandala 55 Soil conservation Lalagun Vardhangad Khatav 36 Soil conservation Umbarmal Umbarmal Khatav 57 Soil conservation Lalagun Vardhangad Khatav 58 Soil conservation Kuroli(S) Kuroli(S) Khatav 5
Zilla Parishad level 1 Soil conservation Kanavhadi Kanavhadi Khandala 52 Soil conservation Baukawa. Baukalwadi Khandala 53 Soil conservation Navlewadi Lalagun Khatav 54 Soil conservation Navlewadi Lalagun Khatav 5
Note: No of WBs indicates the number of wage employment beneficiary observations used for analysis after cleaning data.
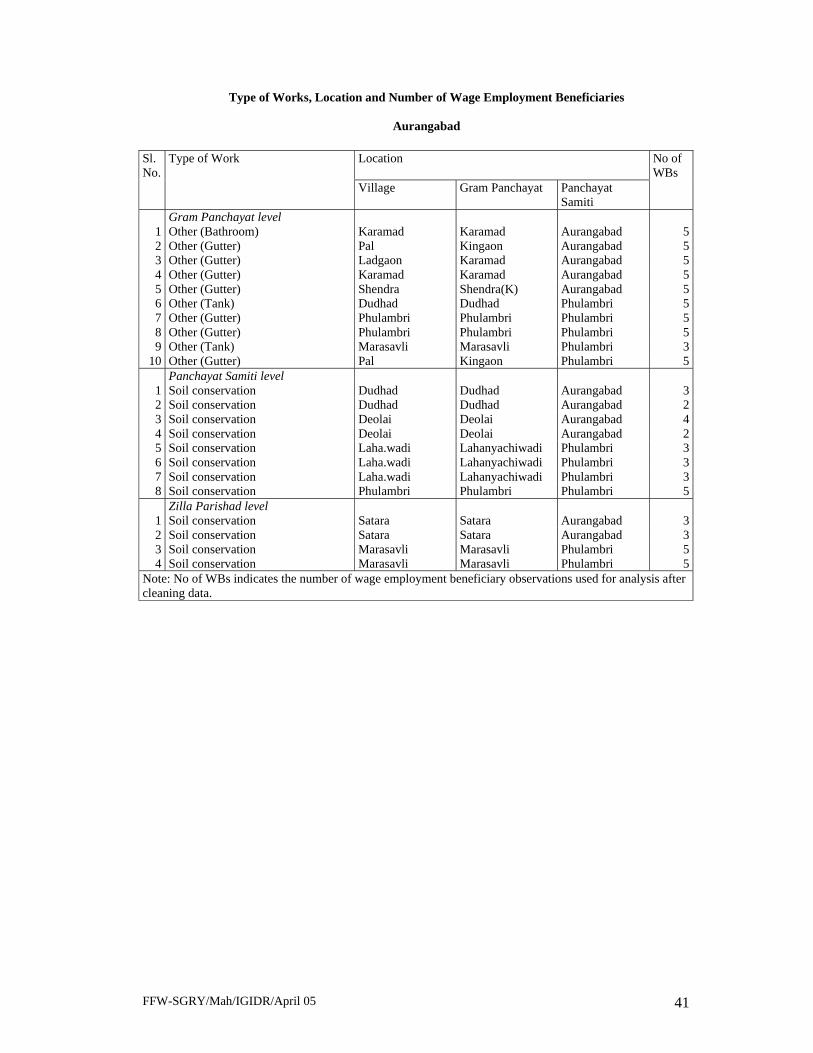
FFW-SGRY/Mah/IGIDR/April 05 41
Type of Works, Location and Number of Wage Employment Beneficiaries
Aurangabad Sl.No.
Type of Work Location No of WBs
Village Gram Panchayat Panchayat Samiti
Gram Panchayat level 1 Other (Bathroom) Karamad Karamad Aurangabad 52 Other (Gutter) Pal Kingaon Aurangabad 53 Other (Gutter) Ladgaon Karamad Aurangabad 54 Other (Gutter) Karamad Karamad Aurangabad 55 Other (Gutter) Shendra Shendra(K) Aurangabad 56 Other (Tank) Dudhad Dudhad Phulambri 57 Other (Gutter) Phulambri Phulambri Phulambri 58 Other (Gutter) Phulambri Phulambri Phulambri 59 Other (Tank) Marasavli Marasavli Phulambri 3
10 Other (Gutter) Pal Kingaon Phulambri 5 Panchayat Samiti level
1 Soil conservation Dudhad Dudhad Aurangabad 32 Soil conservation Dudhad Dudhad Aurangabad 23 Soil conservation Deolai Deolai Aurangabad 44 Soil conservation Deolai Deolai Aurangabad 25 Soil conservation Laha.wadi Lahanyachiwadi Phulambri 36 Soil conservation Laha.wadi Lahanyachiwadi Phulambri 37 Soil conservation Laha.wadi Lahanyachiwadi Phulambri 38 Soil conservation Phulambri Phulambri Phulambri 5
Zilla Parishad level 1 Soil conservation Satara Satara Aurangabad 32 Soil conservation Satara Satara Aurangabad 33 Soil conservation Marasavli Marasavli Phulambri 54 Soil conservation Marasavli Marasavli Phulambri 5
Note: No of WBs indicates the number of wage employment beneficiary observations used for analysis after cleaning data.

FFW-SGRY/Mah/IGIDR/April 05 42
Type of Works, Location and Number of Wage Employment Beneficiaries
Gadchiroli
Sl.No.
Type of Work Location No of WBs
Village Gram Panchayat Panchayat Samiti
Gram Panchayat level 1 Drinking water Adyal Adyal Chamorshi 52 Other (Gutter) Adyal Adyal Chamorshi 43 Other (Gutter) Kistapur Adyal Chamorshi 54 Construction of rural link road Kistapur Adyal Chamorshi 45 Other (Gutter) Talodhi(M) Talodhi(M) Chamorshi 56 Drinking water Talodhi(M) Talodhi(M) Chamorshi 57 Drinking water Talodhi(M) Talodhi(M) Chamorshi 48 Other (Gutter) Talodhi(M) Talodhi(M) Chamorshi 59 Other (Gutter) Kurkheda Kurkheda Kurkheda 5
10 Other (Gutter) Kurkheda Kurkheda Kurkheda 411 Soil Conservation Kurkheda Kurkheda Kurkheda 412 Soil Conservation Kurkheda Kurkheda Kurkheda 513 School building (Gate) Chikhali Chikhali Kurkheda 414 Other (Gutter) Chichtola Chikhali Kurkheda 515 Construction of rural link road Chichtola Chikhali Kurkheda 516 Construction of rural link road Chichtola Chikhali Kurkheda 5
Panchayat Samiti level 1 Soil Conservation Mudholi (Tukum) Mudholi(Tukum) Chamorshi 52 Minor irrigation Netajinagar Netajinagar Chamorshi 53 Minor irrigation Belgatta Warul Chamorshi 54 Minor irrigation Narendrapur Subhashgram Chamorshi 55 Minor irrigation Hetinagar Purada Kurkheda 56 Minor irrigation Jambhulkheda Jambhulkheda Kurkheda 57 Minor irrigation Gewardha Gewardha Kurkheda 58 Minor irrigation Wadegaon Wadegaon Kurkheda 5
Zilla Parishad level 1 Soil Conservation Kistapur Adyal Chamorshi 52 Minor irrigation Bhivapur Walsara Chamorshi 53 Minor irrigation Wakdi Talegaon Kurkheda 54 Minor irrigation Khedegaon Gewardha Kurkheda 5
Note: No of WBs indicates the number of wage employment beneficiary observations used for analysis after cleaning data.

FFW-SGRY/Mah/IGIDR/April 05 43
Type of Works, Location and Number of Wage Employment Beneficiaries
Akola
Sl.No.
Type of Work Location No of WBs
Village Gram Panchayat Panchayat Samiti
Gram Panchayat level 1 Other (Gutter) Panaj Panaj Akot 52 Other (Gutter) Panaj Panaj Akot 43 Other (Bathroom) Panaj Panaj Akot 24 Other (Gym) Panaj Panaj Akot 55 Other (Shopping Centre) Jaulka Jaulka Akot 56 Other (Gutter) Jaulka Jaulka Akot 37 Other (Gutter) Jaulka(Varur) Jaulka(Varur) Akot 38 Other (Gutter) Jaulka(Varur) Jaulka(Varur) Akot 49 Construction of rural link roads Khanapur Khanapur Patur 5
10 Construction of rural link roads Khanapur Khanapur Patur 511 Construction of rural link roads Khanapur Khanapur Patur 412 Other (Bathroom) Khanapur Khanapur Patur 213 Other Charangaon Charangaon Patur 314 Other Charangaon Charangaon Patur 215 Other (Bathroom) Charangaon Charangaon Patur 516 Other (Gutter) Charangaon Charangaon Patur 5
Panchayat Samiti level 1 Minor irrigation Chorwad Yedlapur Akot 42 Minor irrigation Hilalabad Hilalabad Akot 53 Minor irrigation Pilakwadi Pilakwadi Akot 54 Minor irrigation Panaj Panaj Akot 25 Minor irrigation Shekapur Shekapur Patur 56 Minor irrigation Vivara Vivara Patur 57 Minor irrigation Kodwaki Gondalwadi Patur 58 Minor irrigation Kosgaon Kosgaon Patur 5
Zilla Parishad level 1 Minor irrigation Bhond Nakhegaon Akot 52 School Buildings Vivara Vivara Patur 53 School Buildings Bhandaraj Bhandaraj Patur 54 School Buildings Belura Belura Patur 5
Note: No of WBs indicates the number of wage employment beneficiary observations used for analysis after cleaning data.