EVALUATION OF FLOOR VIBRATION IN AN EXISTING BUILDING A ...
121
EVALUATION OF FLOOR VIBRATION IN AN EXISTING BUILDING A THESIS SUBMITTED TO THE GRADUATE SCHOOL OF NATURAL AND APPLIED SCIENCES OF MIDDLE EAST TECHNICAL UNIVERSITY BY YAVUZ SEMERDÖKEN IN PARTIAL FULFILLMENT OF THE REQUIREMENTS FOR THE DEGREE OF MASTER OF SCIENCE IN CIVIL ENGINEERING SEPTEMBER 2019
Transcript of EVALUATION OF FLOOR VIBRATION IN AN EXISTING BUILDING A ...
EVALUATION OF FLOOR VIBRATION IN AN EXISTING BUILDING
A THESIS SUBMITTED TO
THE GRADUATE SCHOOL OF NATURAL AND APPLIED SCIENCES
OF
MIDDLE EAST TECHNICAL UNIVERSITY
BY
YAVUZ SEMERDÖKEN
IN PARTIAL FULFILLMENT OF THE REQUIREMENTS
FOR
THE DEGREE OF MASTER OF SCIENCE
IN
CIVIL ENGINEERING
SEPTEMBER 2019


Approval of the thesis:
EVALUATION OF FLOOR VIBRATION IN AN EXISTING BUILDING
submitted by YAVUZ SEMERDÖKEN in partial fulfillment of the requirements for
the degree of Master of Science in Civil Engineering Department, Middle East
Technical University by,
Prof. Dr. Halil Kalıpçılar Dean, Graduate School of Natural and Applied Sciences
Prof. Dr. Ahmet Türer Head of Department, Civil Engineering
Prof. Dr. Ahmet Yakut
Supervisor, Civil Engineering, METU
Assoc. Prof. Dr. Ozan Cem Çelik
Co-Supervisor, Civil Engineering, METU
Examining Committee Members:
Prof. Dr. Kağan Tuncay
Civil Engineering, METU
Prof. Dr. Ahmet Yakut
Civil Engineering, METU
Assoc. Prof. Dr. Ozan Cem Çelik
Civil Engineering, METU
Assoc. Prof. Dr. Alper Aldemir
Civil Engineering, Hacettepe University
Assist. Prof. Dr. Abdullah Dilsiz
Civil Engineering, Ankara Yıldırım Bayazıt University
Date: 05.09.2019

iv
I hereby declare that all information in this document has been obtained and
presented in accordance with academic rules and ethical conduct. I also declare
that, as required by these rules and conduct, I have fully cited and referenced all
material and results that are not original to this work.
Name, Surname:
Signature:
Yavuz Semerdöken

v
ABSTRACT
EVALUATION OF FLOOR VIBRATION IN AN EXISTING BUILDING
Semerdöken, Yavuz
Master of Science, Civil Engineering
Supervisor: Prof. Dr. Ahmet Yakut
Co-Supervisor: Assoc. Prof. Dr. Ozan Cem Çelik
September 2019, 105 pages
Vibration serviceability is a major concern in the design of lighter floor systems of
newer buildings. Floor vibrations due to walking and rhythmic movements of the
occupants should not exceed threshold levels for the comfort of occupants and the
protection of sensitive equipment in the buildings. The objective of this study is to
evaluate the floor vibration problem reported in a six-story reinforced concrete with
two basement floors office building. First, structural system dynamic properties of the
building were identified using its available ambient vibration records. The finite
element model of the building was developed and calibrated to match the identified
natural vibration frequencies. Then, the vibration records of the floors at which the
problem was reported were analyzed to examine if threshold levels stipulated in design
codes had been exceed. Finally, finite element simulations and the in-situ floor
vibration data for the floor response due to walking of the occupants were compared
with the threshold levels recommended in the AISC Floor Vibrations Due to Human
Activity.
Keywords: Dynamic Properties, Dynamic Tests, Existing Buildings, Floor Vibrations,
System Identification

vi

vii
ÖZ
MEVCUT BİR BİNANIN DÖŞEME TİTREŞİMİNİN DEĞERLENDİRİLMESİ
Semerdöken, Yavuz
Yüksek Lisans, İnşaat Mühendisliği Tez Danışmanı: Prof. Dr. Ahmet Yakut
Ortak Tez Danışmanı: Doç. Dr. Ozan Cem Çelik
Eylül 2019, 105 sayfa
Yeni binaların hafif döşeme sistemlerinin tasarımında titreşim esnasındaki
kullanılabilirliği önemli bir sorundur. Bina sakinlerinin yürüme ve ritmik
hareketlerinden dolayı oluşan döşeme titreşimleri, bu kişilerin konforu ve binalardaki
hassas ekipmanların korunması için limit değerleri aşmamalıdır. Bu çalışmanın amacı,
iki bodrum kata sahip altı katlı betonarme bir ofis binasında rapor edilmiş olan döşeme
titreşim probleminin değerlendirilmesidir. İlk olarak, binanın yapısal sistem dinamik
özellikleri mevcut ortam titreşim kayıtları kullanılarak belirlenmiştir. Binanın sonlu
elemanlar modeli geliştirilmiş ve belirlenmiş olan doğal titreşim frekanslarını elde
etmek için model kalibre edilmiştir. Daha sonra, problemin bildirildiği döşemelerin
titreşim kayıtları yönetmeliklerde öngörülen limit değerlerin aşılıp aşılmadığını
belirlemek için analiz edilmiştir. Son olarak, bina sakinlerinin yürümesinden dolayı
meydana gelen döşeme tepkisi için sonlu elemanlar simülasyonları ve yerinde alınan
döşeme titreşim kayıtları AISC’de tavsiye edilen limit değerler ile karşılaştırılmıştır.
Anahtar Kelimeler: Dinamik Özellikler, Dinamik Testler, Döşeme Titreşimleri,
Mevcut Binalar, Sistem Tanımlaması

viii

ix
Dedicated to the strongest persons I know: my mother and father.

x
ACKNOWLEDGEMENTS
First of all, I would like to express my sincere gratitude to my supervisor Dr. Ahmet
Yakut for his guidance, advice, criticism, encouragements, and insight throughout the
research.
Besides my advisor, I would like to thank my co-supervisor Dr. Ozan Cem Çelik for
his support, motivation, guidance, and many other things. You have set an example of
excellence as a researcher, mentor, instructor, and role model.
Moreover, I would like to thank the rest of my thesis committee: Dr. Kağan Tuncay,
Dr. Alper Aldemir, and Dr. Abdullah Dilsiz for their insightful comment, advice, and
encouragement.
I thank my friends and colleagues: Erhan Budak, İsmail Ozan Demirel, Oğuzhan
Gümüş, Okan Koçkaya, and Casim Yazıcı for their friendship and the times we spent
together.
My special thanks go to Dr. Eren Yağmur, Yunus İşıkli, and my brother Selim
Semerdöken for their supports, constant encouragements, and devoting precious
times.
Finally and most of all, I would like to thank to my family for providing me with
unfailing support and continuous encouragement throughout my life. This
accomplishment would not have been possible without you.

xi
TABLE OF CONTENTS
ABSTRACT ................................................................................................................. v
ÖZ ........................................................................................................................... vii
ACKNOWLEDGEMENTS ......................................................................................... x
TABLE OF CONTENTS ........................................................................................... xi
LIST OF TABLES ................................................................................................... xiii
LIST OF FIGURES ................................................................................................. xiv
1. INTRODUCTION ................................................................................................ 1
1.1. Background ....................................................................................................... 1
1.2. Objectives and Scope ........................................................................................ 2
1.3. Thesis Outline .................................................................................................... 3
2. LITERATURE REVIEW ..................................................................................... 5
2.1. Overview ........................................................................................................... 5
2.2. Ambient Vibration Testing ................................................................................ 5
2.3. Floor Vibrations ................................................................................................ 8
3. DESCRIPTION OF THE BUILDING AND ITS INSTRUMENTATION ....... 13
3.1. Introduction ..................................................................................................... 13
3.2. Building Description ....................................................................................... 13
3.3. Building Instrumentation ................................................................................. 25
4. SYSTEM IDENTIFICATION OF THE BUILDING ........................................ 29
4.1. Introduction ..................................................................................................... 29
4.2. Fourier Analysis of the recorded Horizontal Accelerations ............................ 30
4.3. Enhanced Frequency Domain Decomposition ................................................ 40
xii
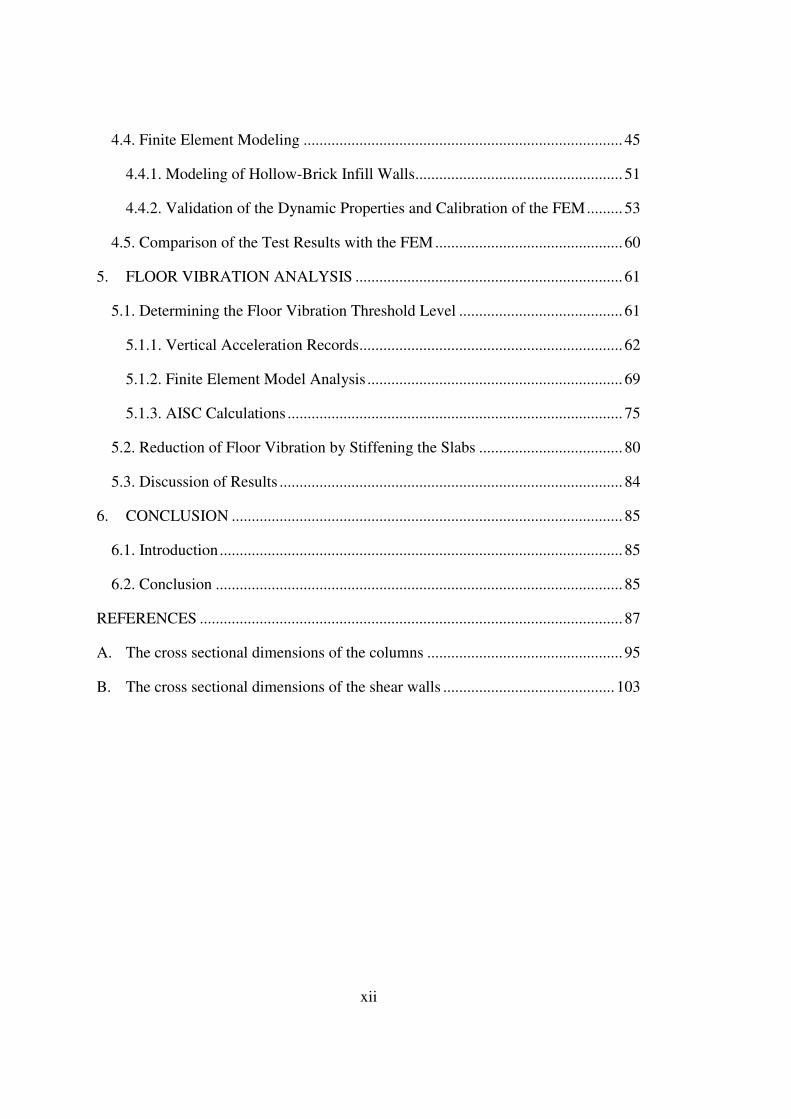
4.4. Finite Element Modeling ................................................................................ 45
4.4.1. Modeling of Hollow-Brick Infill Walls .................................................... 51
4.4.2. Validation of the Dynamic Properties and Calibration of the FEM ......... 53
4.5. Comparison of the Test Results with the FEM ............................................... 60
5. FLOOR VIBRATION ANALYSIS ................................................................... 61
5.1. Determining the Floor Vibration Threshold Level ......................................... 61
5.1.1. Vertical Acceleration Records .................................................................. 62
5.1.2. Finite Element Model Analysis ................................................................ 69
5.1.3. AISC Calculations .................................................................................... 75
5.2. Reduction of Floor Vibration by Stiffening the Slabs .................................... 80
5.3. Discussion of Results ...................................................................................... 84
6. CONCLUSION .................................................................................................. 85
6.1. Introduction ..................................................................................................... 85
6.2. Conclusion ...................................................................................................... 85
REFERENCES .......................................................................................................... 87
A. The cross sectional dimensions of the columns ................................................. 95
B. The cross sectional dimensions of the shear walls ........................................... 103
xiii
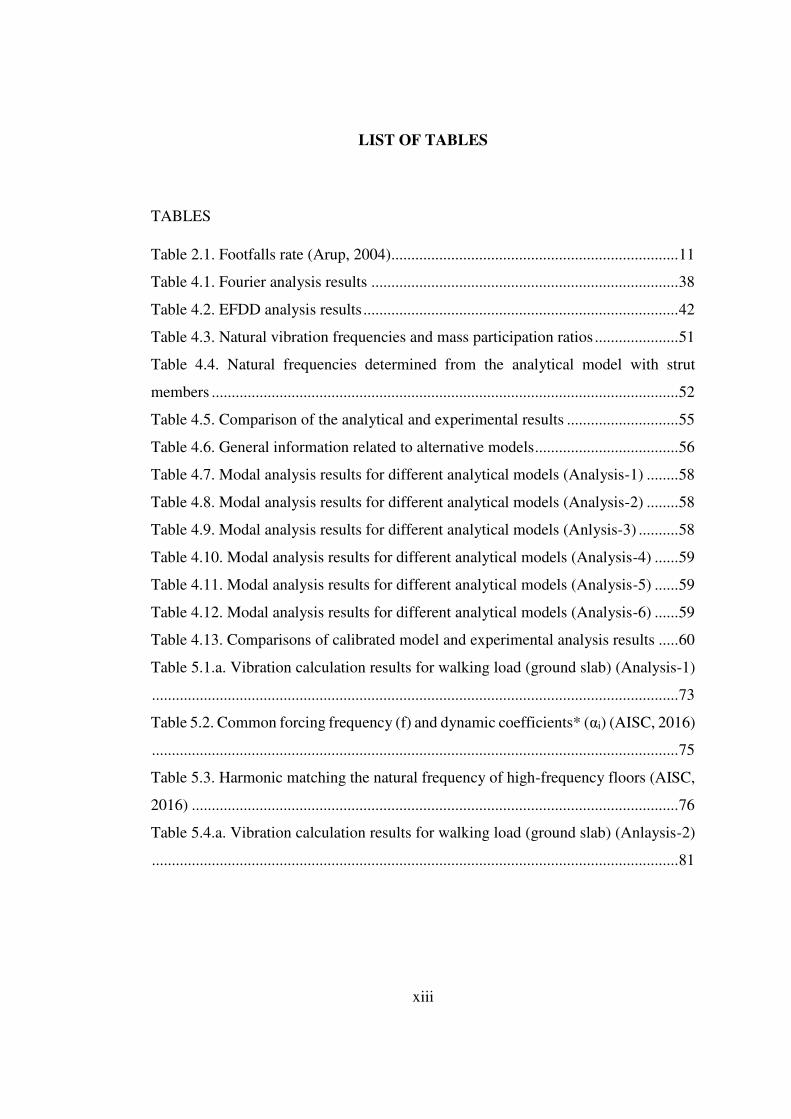
LIST OF TABLES
TABLES
Table 2.1. Footfalls rate (Arup, 2004)........................................................................ 11
Table 4.1. Fourier analysis results ............................................................................. 38
Table 4.2. EFDD analysis results ............................................................................... 42
Table 4.3. Natural vibration frequencies and mass participation ratios ..................... 51
Table 4.4. Natural frequencies determined from the analytical model with strut
members ..................................................................................................................... 52
Table 4.5. Comparison of the analytical and experimental results ............................ 55
Table 4.6. General information related to alternative models .................................... 56
Table 4.7. Modal analysis results for different analytical models (Analysis-1) ........ 58
Table 4.8. Modal analysis results for different analytical models (Analysis-2) ........ 58
Table 4.9. Modal analysis results for different analytical models (Anlysis-3) .......... 58
Table 4.10. Modal analysis results for different analytical models (Analysis-4) ...... 59
Table 4.11. Modal analysis results for different analytical models (Analysis-5) ...... 59
Table 4.12. Modal analysis results for different analytical models (Analysis-6) ...... 59
Table 4.13. Comparisons of calibrated model and experimental analysis results ..... 60
Table 5.1.a. Vibration calculation results for walking load (ground slab) (Analysis-1)
.................................................................................................................................... 73
Table 5.2. Common forcing frequency (f) and dynamic coefficients* (αi) (AISC, 2016)
.................................................................................................................................... 75
Table 5.3. Harmonic matching the natural frequency of high-frequency floors (AISC,
2016) .......................................................................................................................... 76
Table 5.4.a. Vibration calculation results for walking load (ground slab) (Anlaysis-2)
.................................................................................................................................... 81

xiv
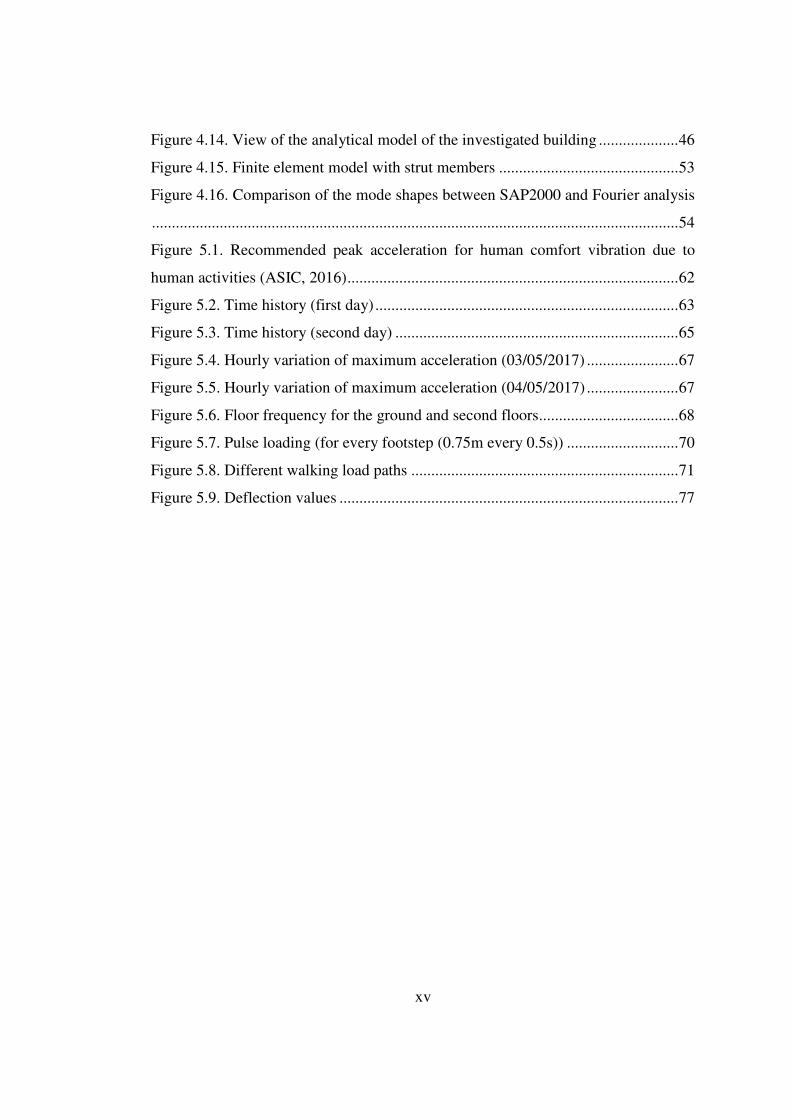
LIST OF FIGURES
FIGURES
Figure 2.1. Modified Reiher-Meister Scale (Lenzen, 1966) ........................................ 9
Figure 2.2. Recommended peak acceleration for human tolerance (ISO 2631-2) .... 10
Figure 3.1. External view of the building (a) front view, (b) NW view, (c) back view
................................................................................................................................... 14
Figure 3.2. Floor labels and elevations (in m) ........................................................... 15
Figure 3.3. Plan views ............................................................................................... 15
Figure 3.4. Beam sections .......................................................................................... 23
Figure 3.5. Uniaxial accelerometer ............................................................................ 25
Figure 3.6. Instrumentation scheme and the location of the accelerometers on the plan
................................................................................................................................... 26
Figure 3.7. Instrumentation scheme for the horizontal direction ............................... 27
Figure 3.8. Instrumentation scheme for the vertical direction .................................. 28
Figure 4.1. Time domain ........................................................................................... 31
Figure 4.2. Fourier amplitude spectra for the EW direction ...................................... 32
Figure 4.3. Fourier amplitude spectra for the NS direction ....................................... 34
Figure 4.4. Fourier amplitude spectra for two parallel accelerometers ..................... 35
Figure 4.5. The first and second translational mode shapes for the EW direction .... 36
Figure 4.6. The first and second translational mode shapes for the NS direction ..... 37
Figure 4.7. The first and second torsional mode shapes ............................................ 37
Figure 4.8. Damping ratio for mode #1 ..................................................................... 38
Figure 4.9. Hourly variation of frequencies (28/04/2017) ......................................... 39
Figure 4.10. Hourly variation of frequencies (29/04/2017) ....................................... 40
Figure 4.11. ARTeMIS model geometry ................................................................... 41
Figure 4.12. Singular values of spectral densities of the test setup ........................... 42
Figure 4.13. Mode shapes .......................................................................................... 43
xv
Figure 4.14. View of the analytical model of the investigated building .................... 46
Figure 4.15. Finite element model with strut members ............................................. 53
Figure 4.16. Comparison of the mode shapes between SAP2000 and Fourier analysis
.................................................................................................................................... 54
Figure 5.1. Recommended peak acceleration for human comfort vibration due to
human activities (ASIC, 2016) ................................................................................... 62
Figure 5.2. Time history (first day) ............................................................................ 63
Figure 5.3. Time history (second day) ....................................................................... 65
Figure 5.4. Hourly variation of maximum acceleration (03/05/2017) ....................... 67
Figure 5.5. Hourly variation of maximum acceleration (04/05/2017) ....................... 67
Figure 5.6. Floor frequency for the ground and second floors................................... 68
Figure 5.7. Pulse loading (for every footstep (0.75m every 0.5s)) ............................ 70
Figure 5.8. Different walking load paths ................................................................... 71
Figure 5.9. Deflection values ..................................................................................... 77

1
CHAPTER 1
1. INTRODUCTION
1.1. Background
Vibration serviceability is a major concern in the design of buildings with flexible
floor systems. Floor vibrations due to machinery in such buildings and daily human
activities such as walking, dancing and jumping should remain below the tolerance
limits for human comfort and sensitive equipment (Bachmann and Ammann, 1987;
Murray, 1991). Otherwise, floor vibrations can cause serviceability as well as safety
problems. For example, the Broughton Suspension Bridge in Manchester, England
collapsed due to the structural vibrations caused by marching soldiers on April, 1831
(Prakash and Anil, 2014). The Techno Mart, a 39-story shopping mall, in Seoul, Korea
had to be evacuated due to the floor vibrations caused by people training in a fitness
center in the building (Chung et al., 2016). Excessive vibrations due to rhythmic
activities such as people dancing and jumping simultaneously, which even led to
collapse of floors, have also been reported in other buildings.
Today, buildings have been designed and constructed with thinner slabs with the
developing construction technology. These flexible floors make people feel insecure
and uncomfortable due to unwanted vibrations (Gajalakshmi et al., 2015). Floor
vibration problems are not limited to steel or composite floor systems (Debney and
Willford, 2009). It is imperative to control both the deflection under existing loads and
the level of vibration caused by dynamic loads in engineering structures. The state-of-
the-art finite element platforms can be used to simulate the behavior of floor systems
under dynamic loads. However, the assumptions in developing the finite element
structural models have to be verified with the experimental data. The dynamic
properties of the floor systems (natural vibration frequencies, vibration mode shapes,
2
and modal damping ratios) identified from in-situ dynamic tests can be used to validate
the assumptions in material properties, boundary conditions, and cross sectional
dimensions of the members.
Dynamic tests are divided into three groups as forced vibration (Shabbir and
Omenzetter, 2008; Yu et al., 2008; Celik et al., 2015; Celik, 2016), ambient vibration
(Crawford and Ward, 1964; Ivanovic et al., 2000; Skolnik et al., 2006), and seismic
monitoring (Foutch et al., 1975; Trifunac et al., 2001; Celebi, 2013) depending on the
source of vibration. In ambient vibration tests, structural vibrations due to wind, road
traffic, and human activity are recorded, and upon signal processing of the records
both in time and frequency domain (Brincker et al., 2001), structural system dynamic
properties are identified. Ambient vibration tests do not interfere with the daily use of
the structure (Ventura and Horyna, 2000). In forced vibration tests, a sinusoidal
excitation is applied to the building by a shaker mounted on upper floors. These tests
are more straightforward and costly than ambient vibration tests.
1.2. Objectives and Scope
This study focuses on the floor vibration problem reported in a six-story reinforced
concrete (RC) office building in Ankara, Turkey. The building was strengthened by
replacing the interior hollow-brick partition walls with structural walls and by
jacketing of interior columns in 2004. Ambient vibration records of the building were
taken in 2017.
The objectives of this study are to identify the structural system and floor system
dynamic properties of the case study building using its available ambient vibration
records and to compare the level of human-induced floor vibrations with the tolerance
limit for human comfort. The critical steps to achieve these objectives are listed below:
(1) Identify the structural system dynamic properties of the building using its available
ambient vibration records.

3
(2) Develop a three-dimensional finite element structural model of the building and
calibrate the model with the system identification data.
(3) Identify the dynamic properties of the floor system where the vibration problem
was reported using the available floor vibration records.
(4) Perform an assessment of the floor vibration problem using AISC (2016) design
guidelines.
(5) Simulate the walking-induced floor vibrations using the developed structural
model.
(6) Recommend retrofit strategies for the floor system to reduce the excessive
vibrations.
1.3. Thesis Outline
This chapter has presented the context of the research and the objectives and scope of
the study.
Chapter 2 presents the critical appraisal of the state of the art on system identification
from ambient vibration records and assessment of floor vibrations.
Chapter 3 describes the case study building and its instrumentation scheme.
Chapter 4 presents the analysis of the ambient vibration records, the finite element
structural model of the building, and the eigenvalue analysis. The identified structural
system dynamic properties from the ambient vibration records are compared with
those determined from the eigenvalue analysis.
Chapter 5 presents the evaluation of floor vibration based on measurements and
analyses under the walking load on the ground and second floors. It also presents floor
vibration calculations and comparisons with limits after modifications applied to
reduce the floor vibration.
Finally, Chapter 6 presents the major conclusions drawn from this study.

5
CHAPTER 2
2. LITERATURE REVIEW
2.1. Overview
This chapter summarizes and discusses the previous experimental and analytical
studies in the areas of ambient vibration testing and floor vibrations.
2.2. Ambient Vibration Testing
Dynamic properties of structural systems ― natural vibration frequencies, vibration
mode shapes, and modal damping ratios ― can be identified from their ambient
vibration records. These modal properties are crucial for researchers and engineers for
structural health monitoring, understanding the structural behavior of the as-built and
retrofitted buildings, evaluating the seismic risk of structures, improving the modeling
of structural systems, and advancing the building codes (Michel et al., 2008; Celik et
al., 2015).
Structural analyses of various structures including buildings, stadiums, dams, nuclear
power plants, and historical palaces have been performed by different researchers
using various modeling methods. The ambiguities in structural modeling were
resolved by making different assumptions, which are usually validated through
experimental data. In the literature, there are various studies in updating the analytical
models of engineered structures based on their identified structural system dynamic
properties from ambient vibration records. The acceleration values for ambient
vibration tests are expected to range from 10-7 to 10-4 g. Therefore, information about
the elastic behavior of the structure can be obtained from the low level of the shaking.
In-situ dynamic tests such as ambient and forced vibration tests have been performed
for almost a decade in California. The U.S. Coast and Geodetic Survey determined the

6
fundamental periods of several buildings from their ambient vibration records in the
early 1930s (Carder, 1936). Ambient vibration testing was used to identify higher
vibration modes after 30 years (Crawford and Ward, 1964; Ward and Crawford, 1966).
Trifunac (1970a, 1970b) identified the structural system dynamic properties of a 22-
and a 39-story steel frame building from ambient vibration records. These properties
agree quite well with those identified from their previous forced vibration tests
(Trifunac, 1972).
Udwadia and Trifunac (1973) compared the dynamic properties of four buildings (a
22-story moment-resisting steel frame, a 39-story moment-resisting steel frame, a 9-
story reinforced concrete building with a central core wall, and a 9-story moment-
resisting steel frame) identified from their pre- and post-earthquake ambient vibration
records. Forced vibration tests show frequencies about 4% smaller than those obtained
from ambient vibration tests for the first building. After the San Fernando earthquake,
the reduction of the natural frequencies of the second building is approximately 15%,
19%, and 17% in the first translational mode along the EW, NS directions and first
torsional mode, respectively. For the third building, the reduction of the natural
frequencies were also calculated as 14% and 9% in the first and second EW modes
while 5% for the first mode in the stiffer NS direction.
Celebi and Safak (1991) measured translational, torsional, and rocking motions of the
Transamerica Building. This building is a vertically tapered multi-story steel structure.
The instrumentation system consisted of 13 uniaxial accelerometers and 3 triaxial
accelerometers According to analysis results of recorded earthquake response data,
the dominant frequency is 0.28 Hz in both the NS and EW directions. The rocking
frequency is 1.8 Hz in the EW direction and 2.0 Hz in the NS direction.
Ivanovic et al. (2000) reported the results of two ambient vibration records after the
1994 Northbridge earthquake and aftershocks of this earthquake to a seven-story
reinforced concrete building in California. Changes in the modal frequencies were
expected due to differences in the state of the structure like addition of wooden braces.

7
Three out of four modal frequencies in the EW directions were increased about 10%
according to the first state of the structure. The first transverse and torsional mode
frequencies did not change while the frequency of the second transverse mode in the
NS direction increased approximately 10%.
Ventura et al. (2002) performed an ambient vibration test on the One Wall Center
Tower, the tallest building in Vancouver, Canada. Dynamic properties associated with
the first eight vibration modes were identified using the frequency domain
decomposition (FDD) method (Brincker et al., 2001). A finite element model was
developed using commercially computer program. The first model demonstrates that
the fundamental frequencies differed by approximately 15%. The model was therefore
updated by modeling the façade and comparable modal frequencies were determined.
Ventura et al. (2003) investigated the dynamic properties of a 52- and a 54-story
instrumented steel frame building by analyzing their ambient vibration records using
the FDD method. They obtained the first six modes and damping ratios of both
structures using the FDD method. The damping values are determined below 5%. This
research demonstrates that comparable ground shaking at the base of two neighboring
tall structures of similar height and floor area can generate considerably distinct
reaction based on the type of lateral force resisting system (52-story building builds
on a perimeter tube system, 54-story building builds on a spine structure with outrigger
frames.
Gentile and Sais (2007) performed ambient vibration studies on a historic masonry
tower to evaluate its structural condition and to determine the presence of major cracks
in the load-bearing walls. Five vibration modes within the frequency range 0-10 Hz
were determined in this study.
Baspolat et al. (2013) determined the dynamic properties of the Deriner Dam, the
highest concrete arch dam in Turkey, from its ambient vibration records. The first five
natural frequencies of the dam (1.7–4.5 Hz), mode shapes and damping ratios were
determined. The damping ratios were below 5%.
8
Soyoz et al. (2013) performed ambient vibration tests on a six-story reinforced
concrete building at Bogazici University to investigate the impact of seismic
retrofitting on its modal properties. Ambient vibrations were recorded before, during,
and after the seismic retrofit. They also performed forced vibration tests on the
building and compared the results with those from ambient vibration tests after the
retrofit. After the retrofit, the modal frequencies increased about 96%, 90%, and 88%
for the first, second, and third mode while damping ratios did not change significantly.
Sampaio and Souza (2015) performed four ambient vibration tests on different days
to determine the vibration problems that occurred during pile driving for a 17-story
residential building. In this study, the first test was performed to obtain the dynamic
properties of the building. The second test was conducted for modal analysis of the
11th floor slabs. Comfort analysis was performed according to ISO 2301 in the second
and third ambient vibration tests. The analyses indicated that vibrations were
disturbing for the residents.
2.3. Floor Vibrations
Vibration occurs in the floor systems of many engineering structures such as stadiums,
gymnasiums, and office buildings due to human activities. In some cases, these
vibrations are annoying for building users and become unacceptable for their safety.
Floor vibrations occur due to human activity, longer floor spans, lower natural
frequency, etc. (Allen, 1990).
The first study on vibration problems in floor systems caused by human activities was
made by Tredgold in 1828. Tredgold (1828) suggested that long-span beams be deep
enough to avoid shaking of objects while walking on the floor.
The sensitivity level varies with the method and suggestions have been released by
various authors. Reiher and Meister (1931) recorded one of the earliest. These were
human reactions determined by standing topics on a shaker table with topics and
subjecting them to steady-state motion. From this data, the chart called the Reiher-
Meister scale was created.

9
Lenzen (1966) stated that the floor vibrations under dynamic loads are related to the
damping and mass of the system. In addition to deflection control, Lenzen pioneered
the creation of a new calculation method based on the floor acceleration. He also
proposed that the amplitudes of the Reiher-Meister scale be lowered by a factor of ten
to account for the transient nature of floor vibrations and modified the Reiher-Meister
scale as shown in Figure 2.1. The difference between the scales is due to the difference
in human perception to transient vibrations as compared to steady state vibrations.
Figure 2.1. Modified Reiher-Meister Scale (Lenzen, 1966)
10
In 1976, Allen and Rainer published impact-response experiments on floor systems.
Allen and Rainer (1976) developed an empirical equation for the effects of mass and
damping on vibration of the floor system based on these experiments. Murray (1981;
1991) later expanded this subject by examining on many different kinds of floor
systems.
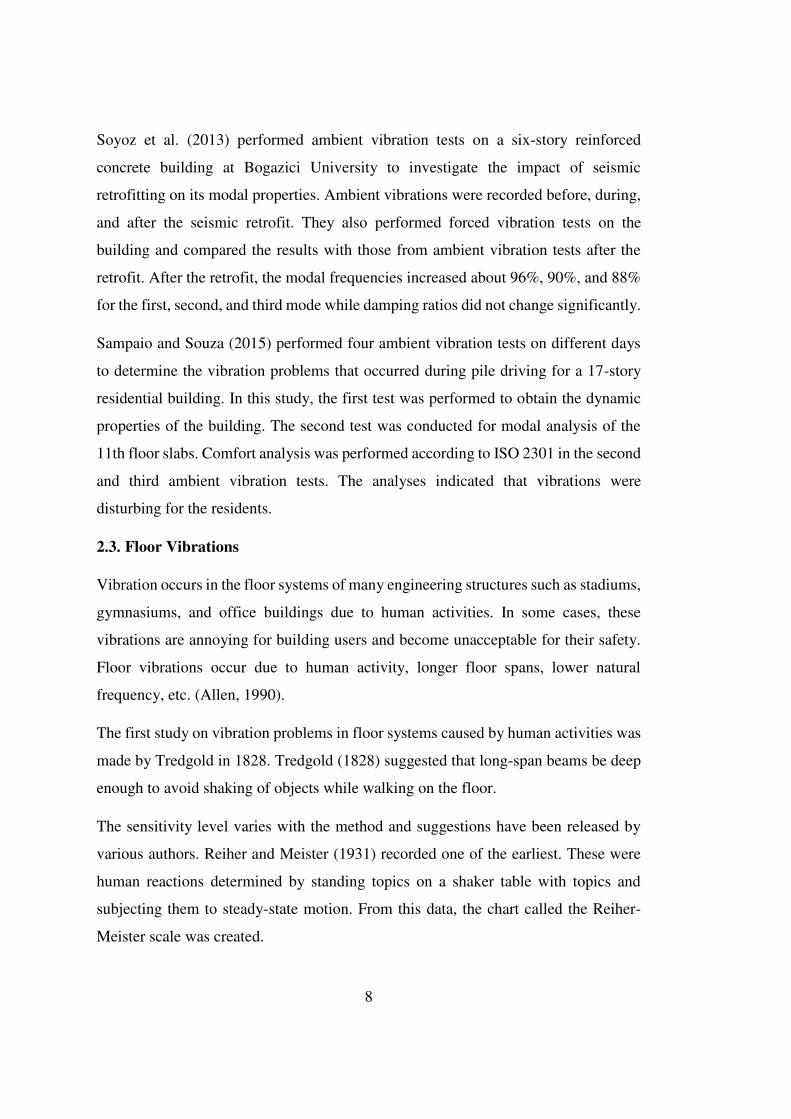
International Organization for Standardization (ISO, 1989) provided the acceleration
limits for floor vibration in terms of frequency of floor as shown in Figure 2.2. This
plot demonstrates the suggested limits of maximum acceleration for human toleration
due to walking.
Figure 2.2. Recommended peak acceleration for human tolerance (ISO 2631-2)

11
In 1991, the US Structural Steel Education Council published a guide for preventing
floor vibration. In this study, human-induced vibrations were defined, the types of
human activities were classified, factors affecting the vibration response of floors were
determined, and floor structural system parameters were calculated (Naeim, 1991).
In 1993, Allen and Murray suggested a method for designing floor systems under the
influence of walking (Allen and Murray, 1993).
In addition to these two regulations, the guidelines of AISC (2016) and EN suggested
techniques for calculating under the impact of human activity to prevent vibration in
the floor system. These two guidelines are currently being used as the latest techniques
for vibration problems.
In 2001, Murray presented precautions for avoiding excessive floor vibrations in
office buildings (Murray, 2001).
Davenny established that vibration originated by footfall is frequently the basic reason
of floor vibration compared to machine vibration. Building floor vibrates at its natural
frequency in response to a footstep impulse, and the vibration is maximum at the
middle of the floor while it is minimum near the supporting columns (Davenny, 2010).
The vibrations originated by footfalls are also associated with the speed of walking.
The suggested values for walking frequency and speed are given by Arup (2004) as
shown in Table 2.1.
Table 2.1. Footfalls rate (Arup, 2004)
Frequency (Hz) Designation
1.5–1.8 “Normal walking” for cellular areas
1.8–2.0 Someone who is in hurry
2.0–2.4 “A very brisk pace” considered likely in corridors

12
In recent years, studies have been carried out on the effects of vibrations caused by
rhythmic activities and investigations have been made to compare the analytical and
theoretical methods proposed in guidelines. Examples are the investigation of the
vibrations in the floors of the Tin Shui Wai Public Library (Li et al., 2011) and the
reaction of a slab subjected to forced transient vibration caused by rhythmic dance
(Smith and Korman, 2012).
13
CHAPTER 3
3. DESCRIPTION OF THE BUILDING AND ITS INSTRUMENTATION
3.1. Introduction
Within the scope of this thesis, available ambient and human-induced vibration
records of a reinforced concrete (RC) building were analyzed. This chapter presents
the description of the building and its instrumentation scheme.
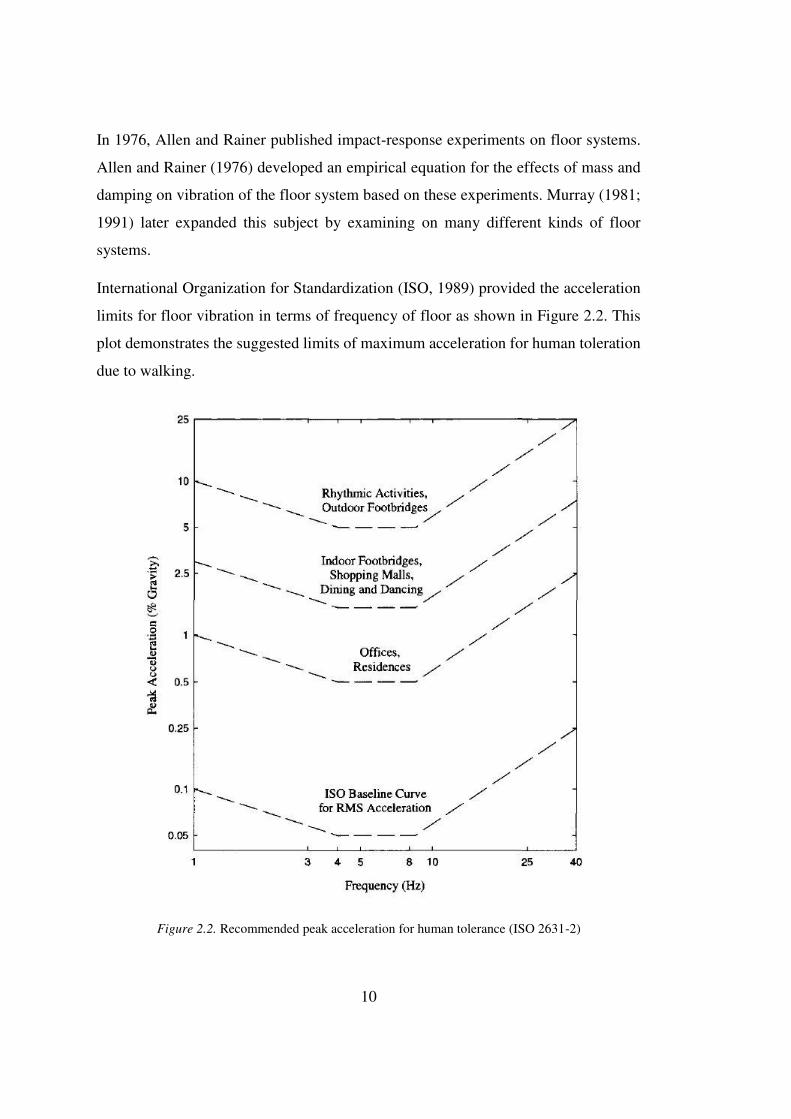
3.2. Building Description
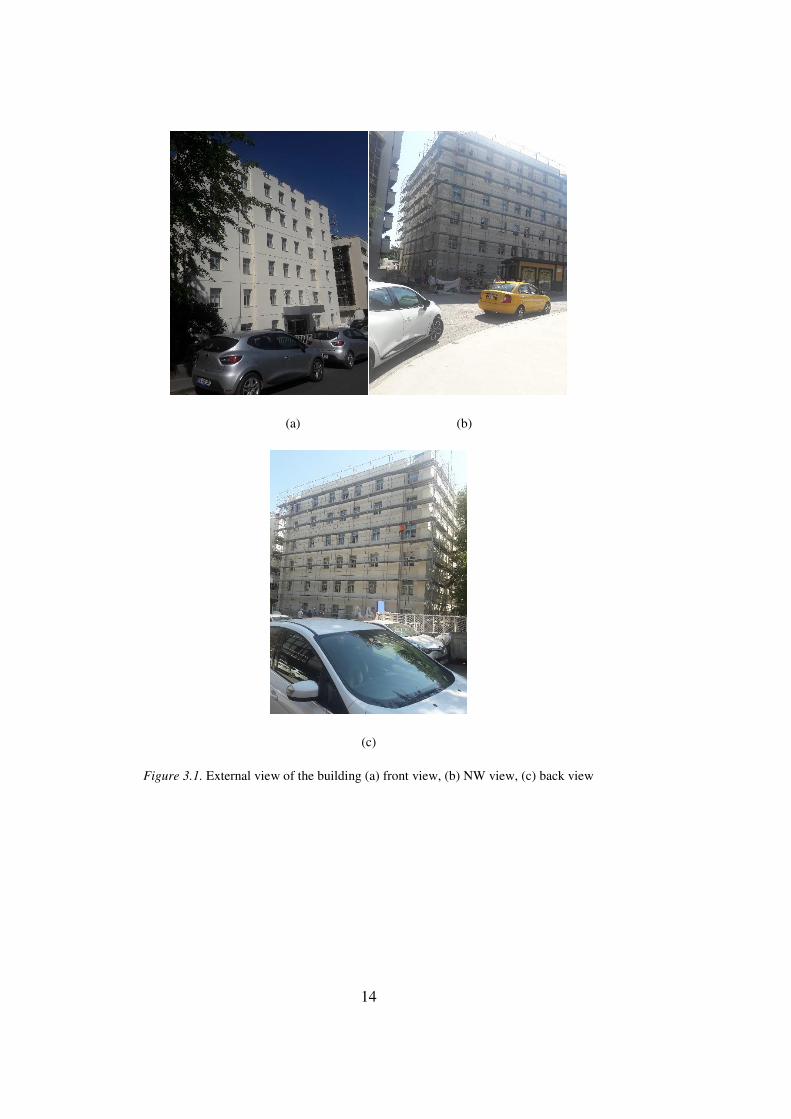
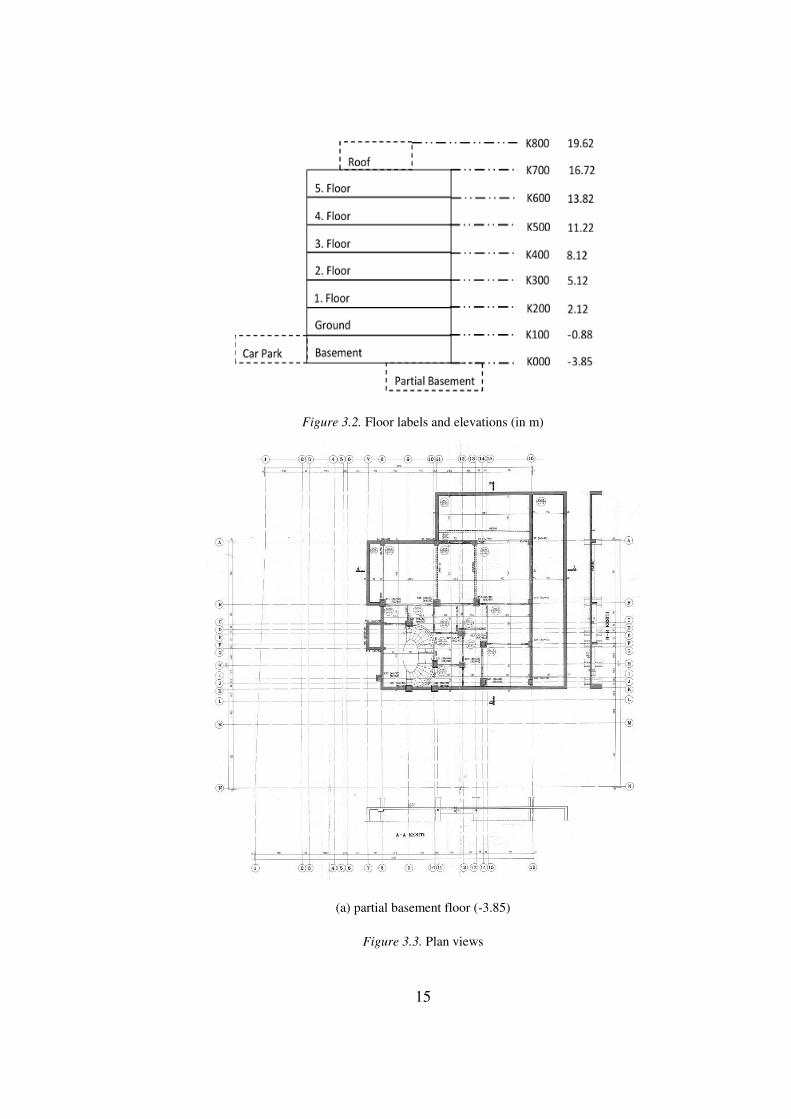
The investigated building is a six-story RC office building with two basement floors
(see Fig. 3.1), located in Cankaya district of Ankara, Turkey. It is 23.5 m tall
(including the first basement floor; see Fig. 3.2) and has a nearly square floor plan (21
× 22 m; see Fig. 3.3). The building was a four-story moment-resisting frame building
with a basement floor when its construction was completed in 1952. In 1972, two
floors and a partial basement floor were added. The building was strengthened with
0.25 m thick cast-in-place RC shear walls which were located four in the EW direction
and four in the NS direction (see Fig. 3.3), which are continuous from the foundation
to the top of the building. The interior columns were strengthened by RC jacketing.
Total column cross-sectional area to floor area ratio is 1.8 percent for the first five
floors whereas it is 2.2 percent for the ground floor and 2.8 percent for the basement
floor. During the strengthening, the interior hollow clay brick walls were removed for
reducing the mass of the building. Figure 3.3 presents the floor plans of the building
after strengthening. Elevator shaft walls are 0.20 m thick. The floor slabs are 0.14 m
thick and the roof slab is 0.12 m thick.
14
(a) (b)
(c)
Figure 3.1. External view of the building (a) front view, (b) NW view, (c) back view
15
Figure 3.2. Floor labels and elevations (in m)
(a) partial basement floor (-3.85)
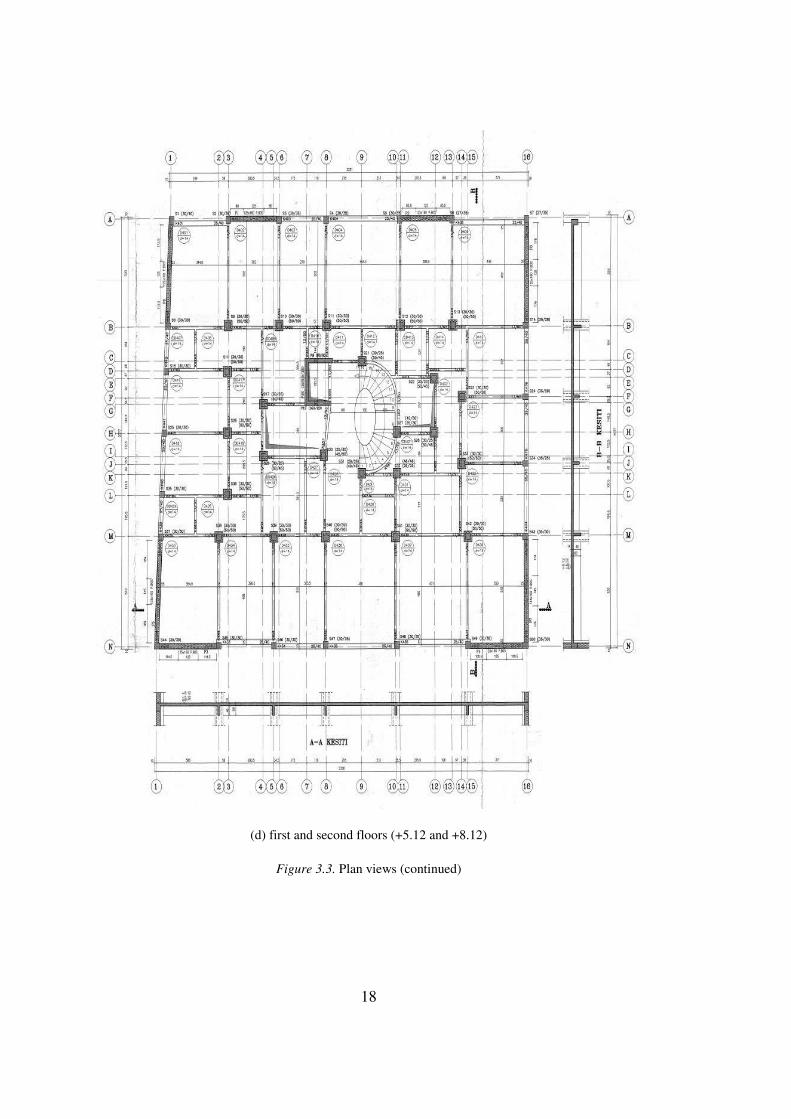
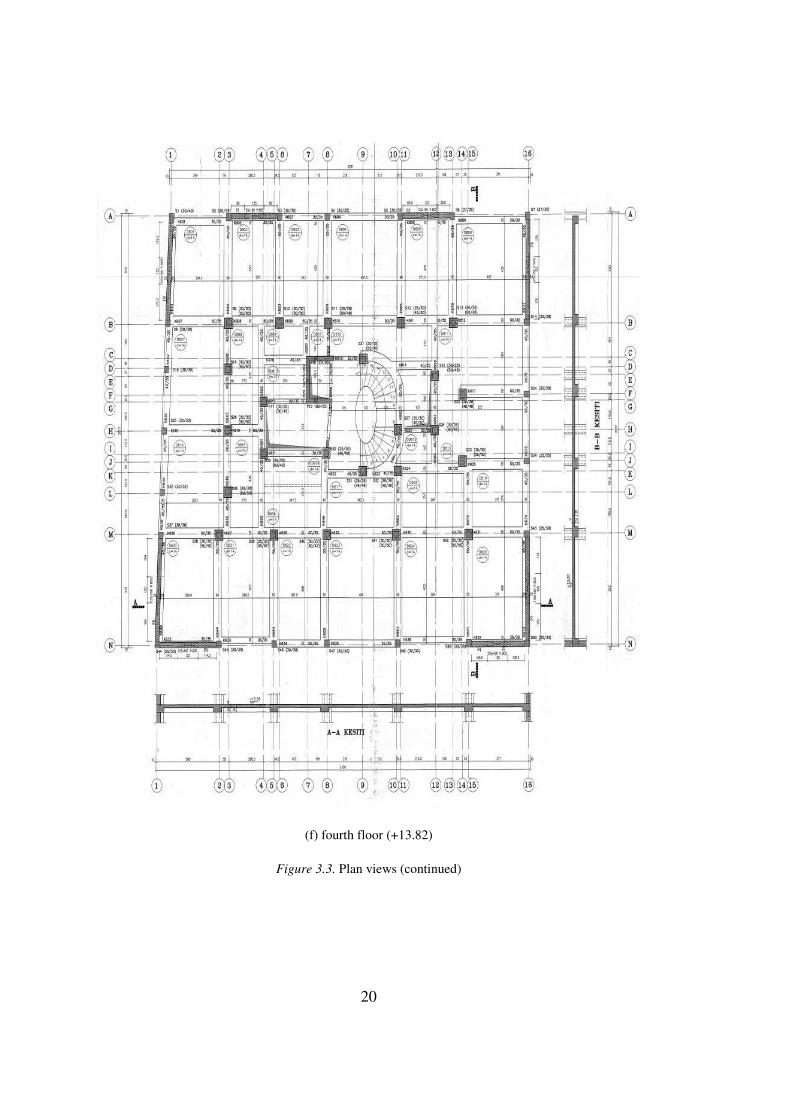
Figure 3.3. Plan views

16
(b) basement floor (-0.88)
Figure 3.3. Plan views (continued)

17
(c) ground floor (+2.12)
Figure 3.3. Plan views (continued)
18
(d) first and second floors (+5.12 and +8.12)
Figure 3.3. Plan views (continued)

19
(e) third floor (+11.22)
Figure 3.3. Plan views (continued)
20
(f) fourth floor (+13.82)
Figure 3.3. Plan views (continued)
21
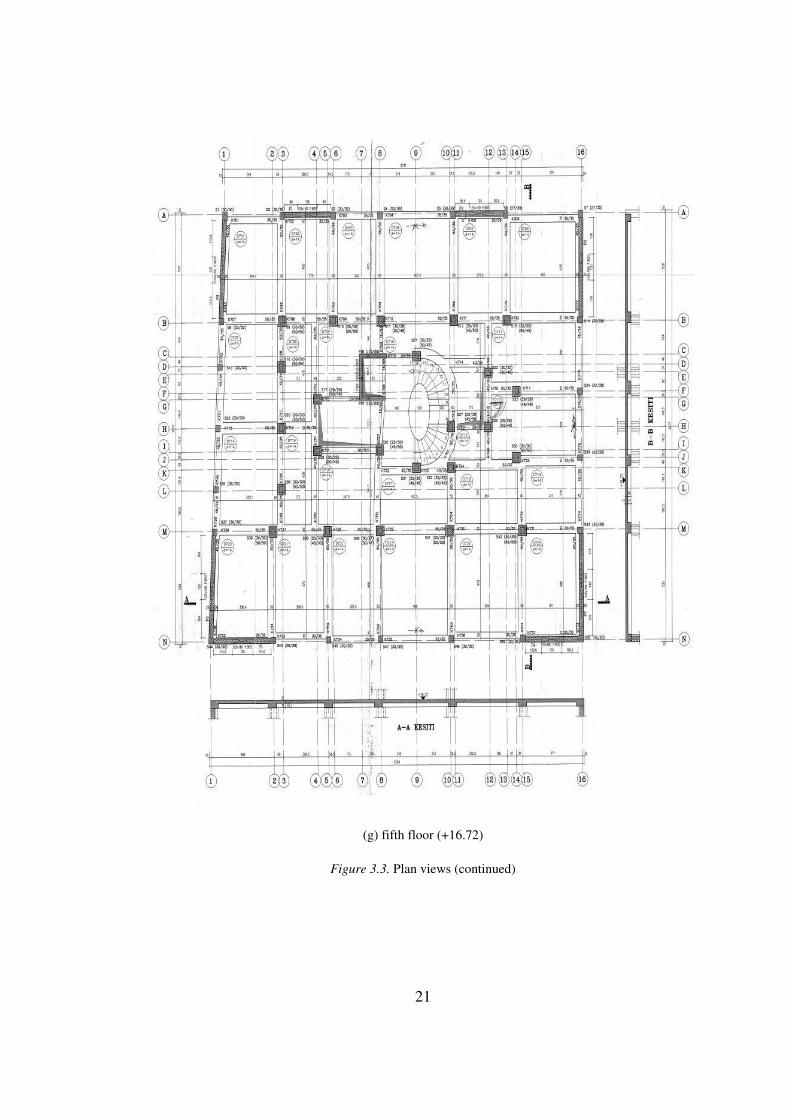
(g) fifth floor (+16.72)
Figure 3.3. Plan views (continued)
22
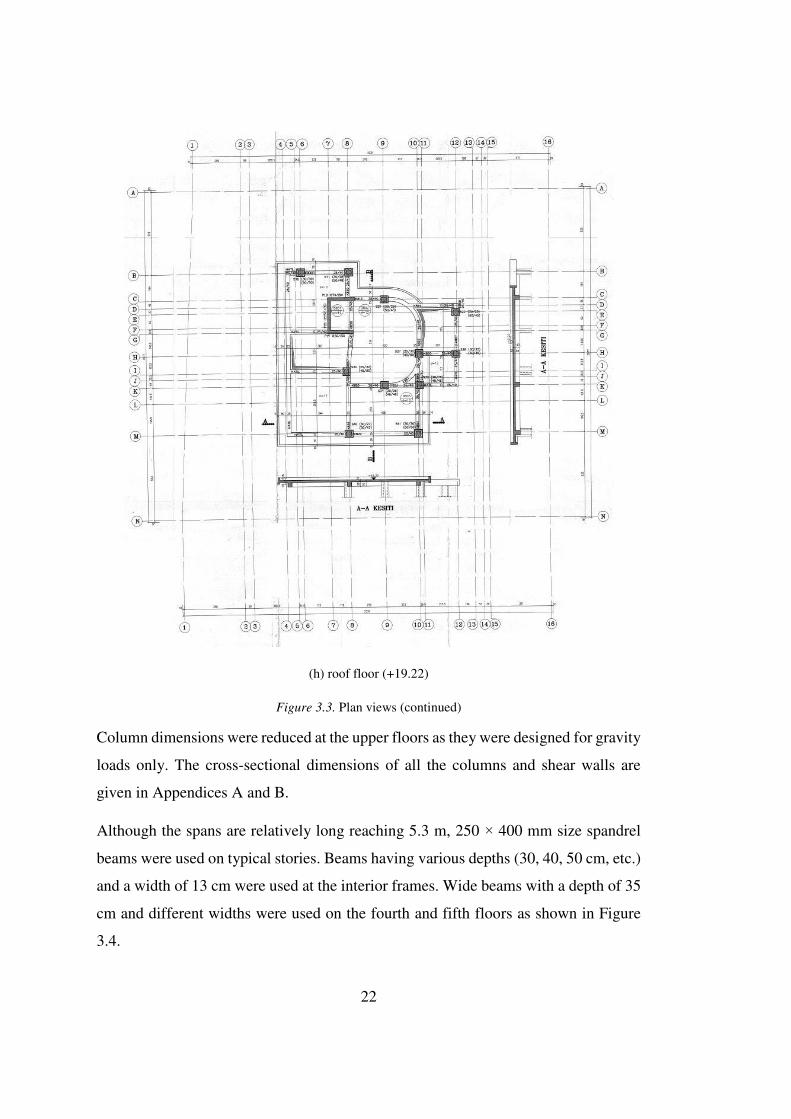
(h) roof floor (+19.22)
Figure 3.3. Plan views (continued)
Column dimensions were reduced at the upper floors as they were designed for gravity
loads only. The cross-sectional dimensions of all the columns and shear walls are
given in Appendices A and B.
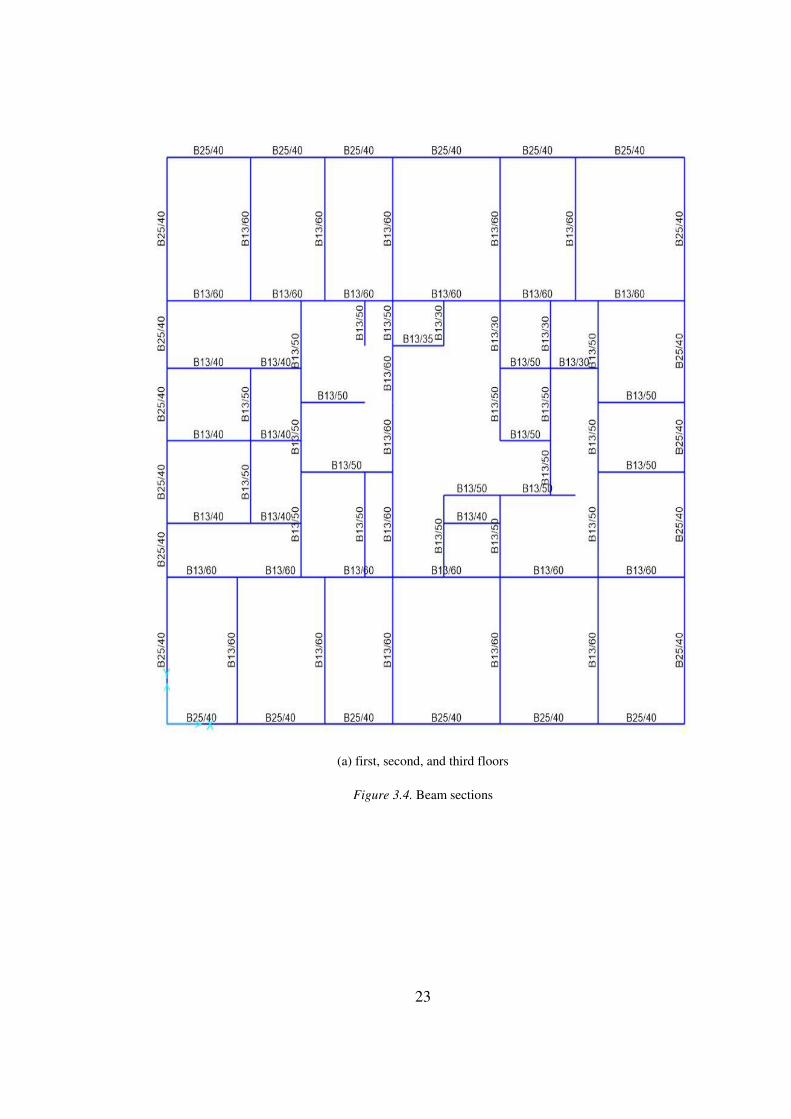
Although the spans are relatively long reaching 5.3 m, 250 × 400 mm size spandrel
beams were used on typical stories. Beams having various depths (30, 40, 50 cm, etc.)
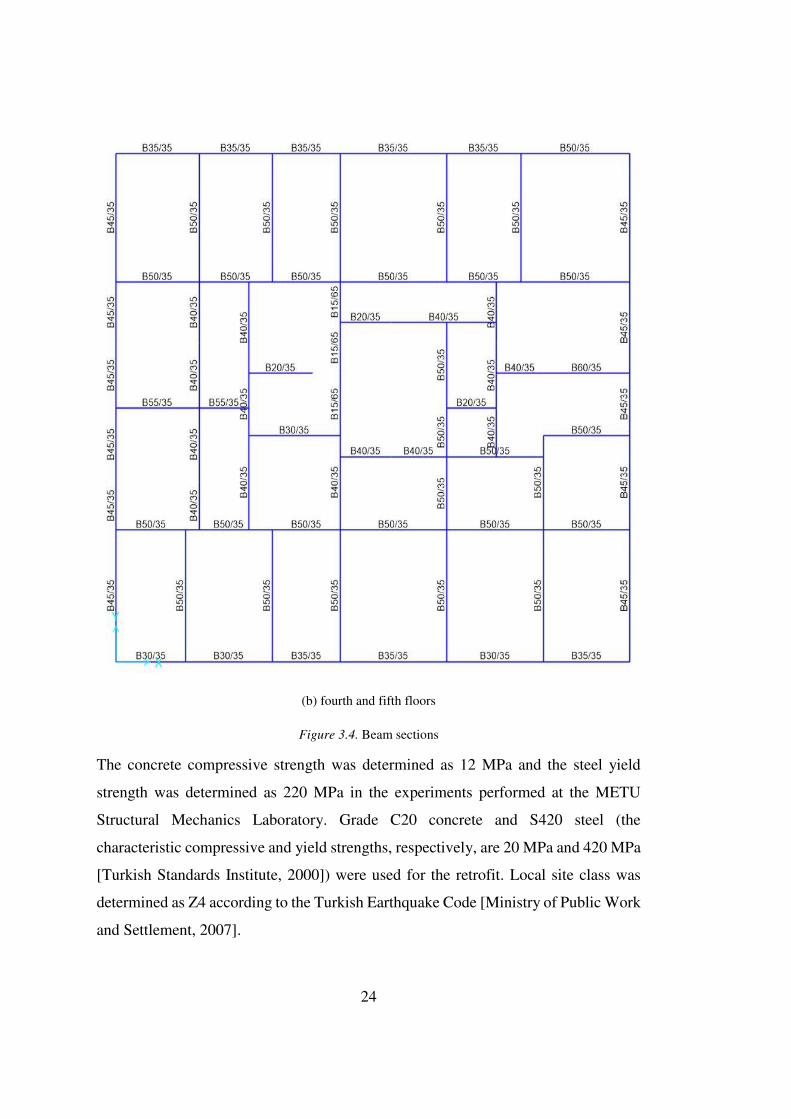
and a width of 13 cm were used at the interior frames. Wide beams with a depth of 35
cm and different widths were used on the fourth and fifth floors as shown in Figure
3.4.
23
(a) first, second, and third floors
Figure 3.4. Beam sections
24
(b) fourth and fifth floors
Figure 3.4. Beam sections
The concrete compressive strength was determined as 12 MPa and the steel yield
strength was determined as 220 MPa in the experiments performed at the METU
Structural Mechanics Laboratory. Grade C20 concrete and S420 steel (the
characteristic compressive and yield strengths, respectively, are 20 MPa and 420 MPa
[Turkish Standards Institute, 2000]) were used for the retrofit. Local site class was
determined as Z4 according to the Turkish Earthquake Code [Ministry of Public Work
and Settlement, 2007].

25
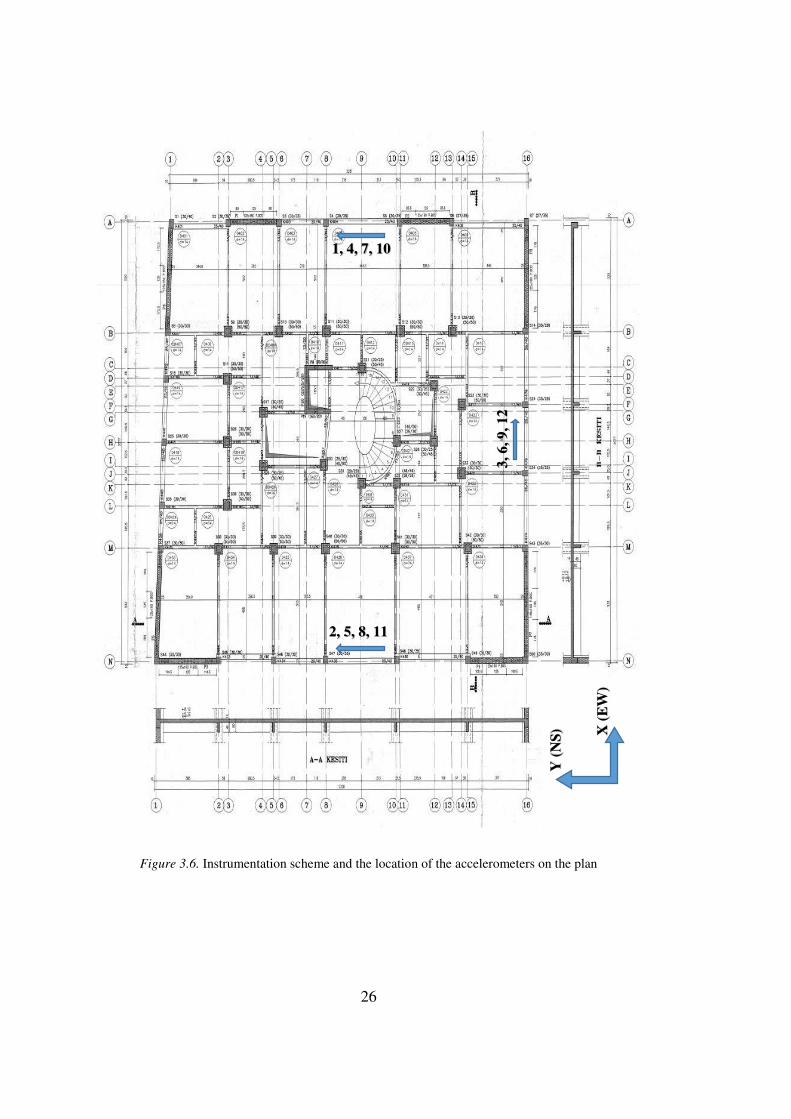
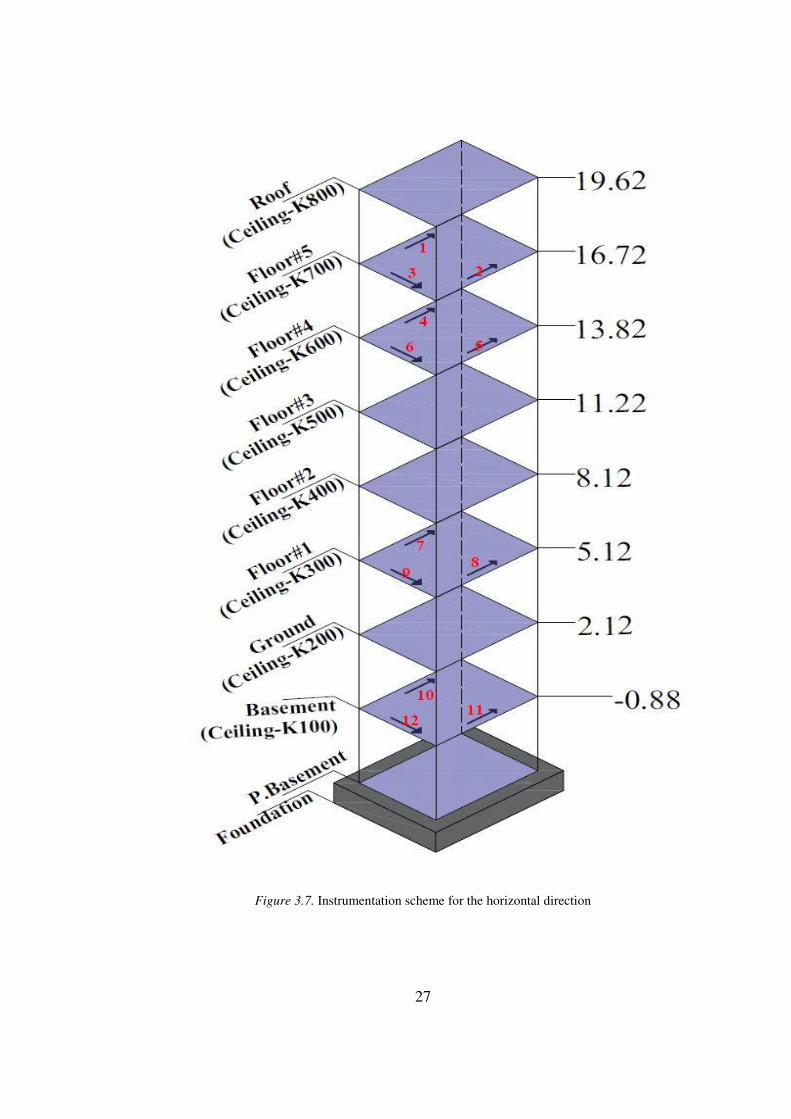
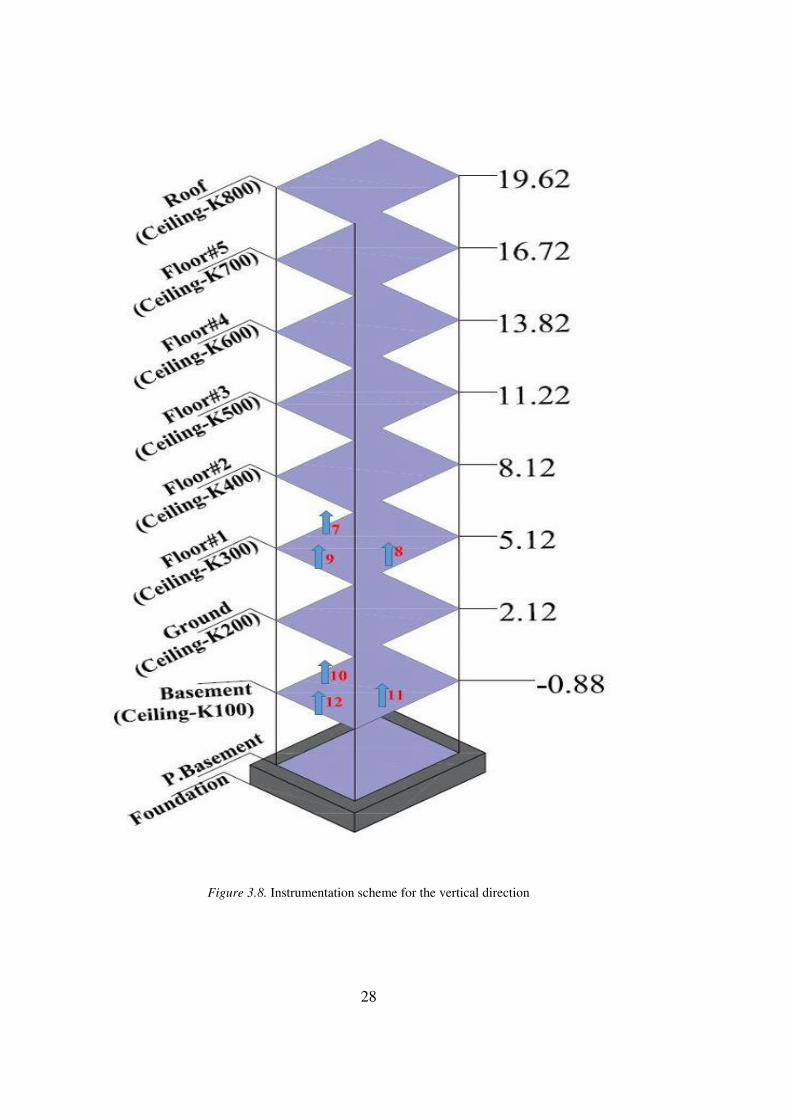
3.3. Building Instrumentation
To determine the dynamic properties of the building, twelve uniaxial accelerometers
(see Fig. 3.5) were placed throughout the building (basement, first, fourth, fifth floor
ceilings) as shown in Figure 3.6. The measurements taken from the building lasted for
seven days. In the first five days, accelerometers were oriented in the horizontal
direction (see Fig. 3.7), whereas in the last two days they were oriented in the vertical
direction (see Fig. 3.8). The sampling frequency was 100 Hz. The recorded data were
divided into an-hour-long sets. The records in the horizontal direction were used for
the system identification of the investigated building whereas records in the vertical
direction were used for the analysis of floor vibration to determine whether the limit
values were exceeded. During the experimental measurements, a multi-channel
digitizer was used. Detailed information related to the accelerometers and the data
acquisition system can be found in relevant documents (Guralp, 2009).
Figure 3.5. Uniaxial accelerometer
26
Figure 3.6. Instrumentation scheme and the location of the accelerometers on the plan
1, 4, 7, 10
2, 5, 8, 11
3,
6,
9,
12
X (
EW
)
Y (
NS
)
27
Figure 3.7. Instrumentation scheme for the horizontal direction
28
Figure 3.8. Instrumentation scheme for the vertical direction
29
CHAPTER 4
4. SYSTEM IDENTIFICATION OF THE BUILDING
4.1. Introduction
Dynamic properties of structures such as natural frequencies, mode shapes, and
damping ratios can be determined by using experimental methods. These parameters
are very important for engineers and researchers because they are used for estimating
structural behavior under earthquakes, detecting the changes in structural behavior
after retrofitting or damage, updating structural elastic properties for analytical
modeling, and developing the building codes (Michel et al., 2008; Celik et al., 2015).
Building responses are measured experimentally using accelerometers deployed
throughout the building. It is generally very difficult to shake engineering structures
(e.g. a building or a bridge) artificially due to their size. Therefore, using the recorded
structural response under ambient loads is the most practical and economical approach
for identifying the modal properties of these structures (Magalhaes et al., 2010). In
ambient vibration testing, low-amplitude structural response of the building is
measured by sensitive accelerometers. The recorded data are processed using output-
only identification tools. Currently, there are a lot of robust methods, in time or in
frequency domains, which are implemented in commercial software such as
ARTeMIS (Svibs, 2014). A review of system identification methods in civil
engineering applications can be found in Cunha and Caetano (2005).
Within the scope of this thesis, the available ambient vibration records were analyzed
by using Fourier transforms and band-pass filters and by Enhanced FDD (EFDD;
Jacobsen et al., 2006) method and the dynamic properties of the building were
identified. Then, an analytical model of the building was developed to simulate its
measured dynamic properties. This chapter presents the analysis of the ambient

30
vibration records, the finite element structural model of the building, and the
eigenvalue analysis. The identified structural system dynamic properties from the
ambient vibration records are compared with those determined from the eigenvalue
analysis.
4.2. Fourier Analysis of the recorded Horizontal Accelerations
Algorithms of signal processing are summarized below:
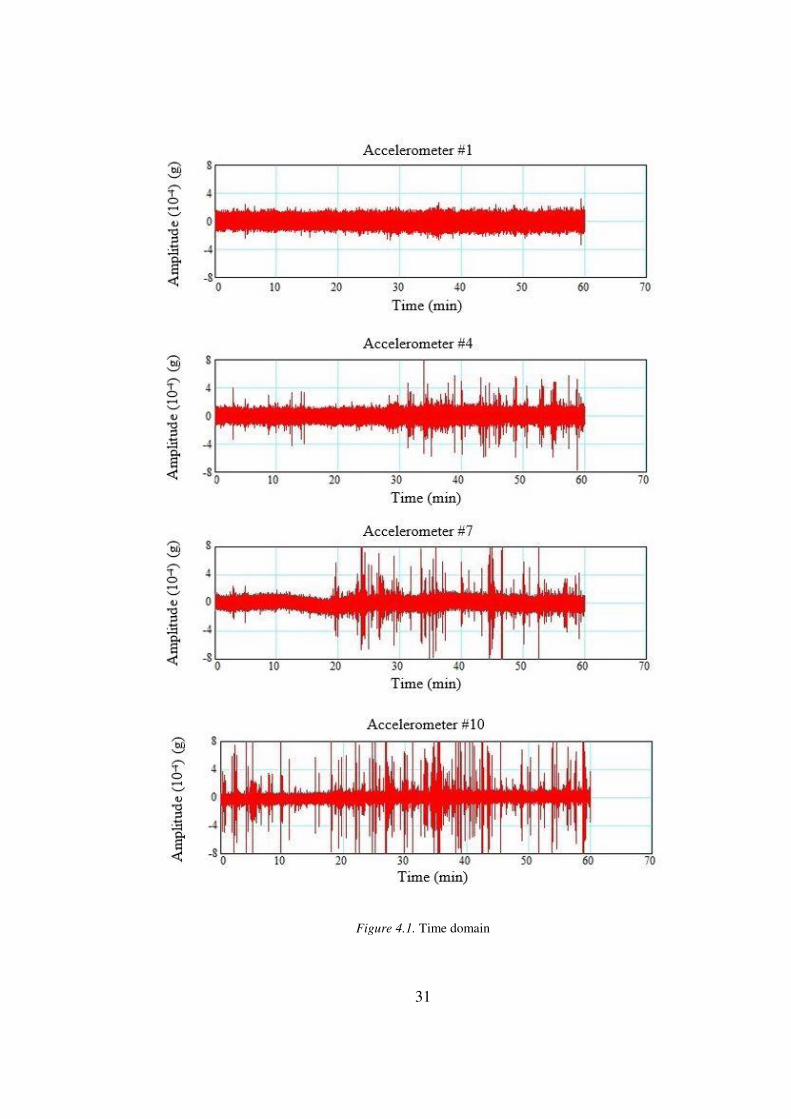
Row data is converted to acceleration data (see Fig. 4.1),
In case of acceleration data, it is easier to obtain frequency peaks since
amplitudes are higher.
Apply band-pass filter for 0.05-50 Hz,,
Compute the Fourier Amplitude Spectrum (FAS) of the filtered signals,
Smooth the data by using moving average method for twenty-one points (see
Figs. 4.2 and 4.3),
Find the natural frequency and calculate damping with half-power bandwidth
method (Rea and Bouwkamp, 1971; Trifunac et al., 2001; Safak and Cakti,
2014).
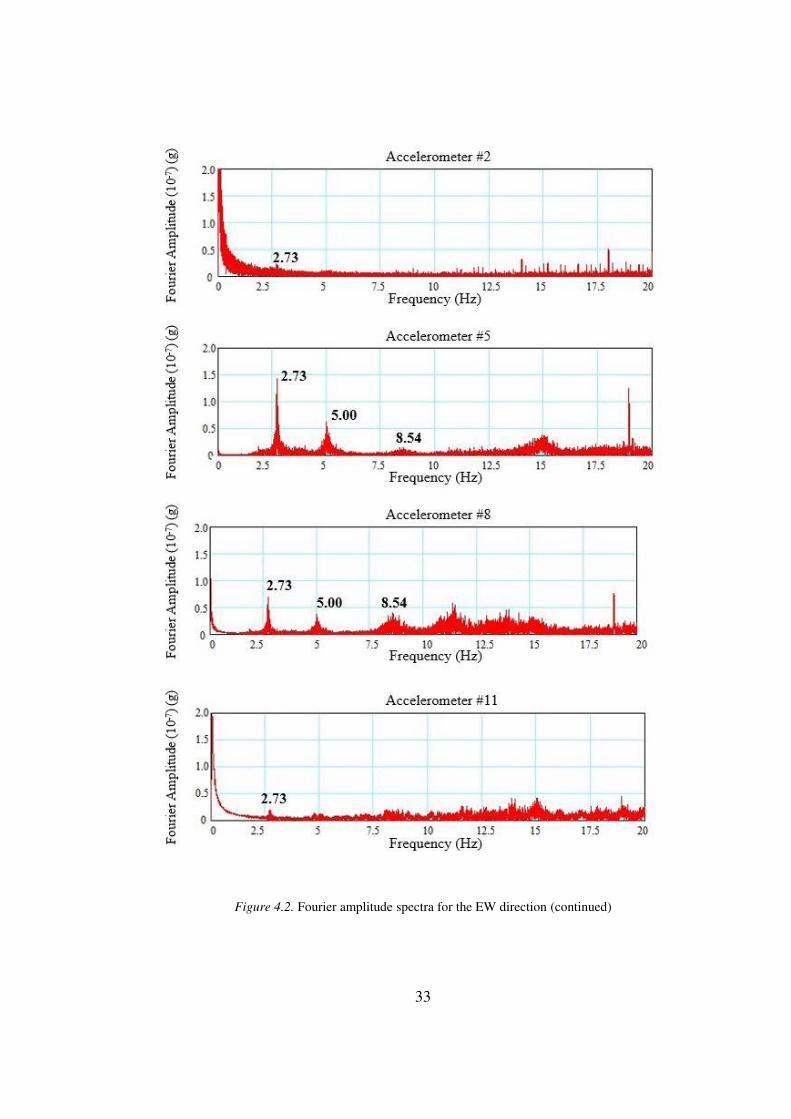
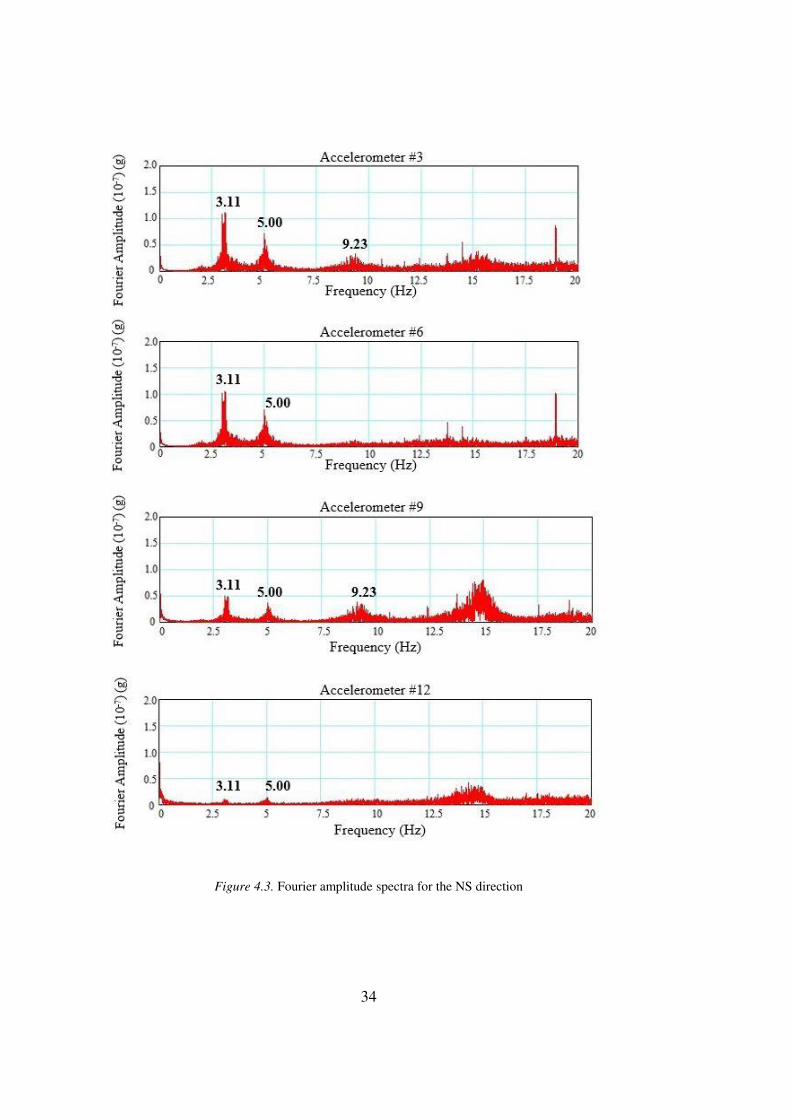
Natural vibration frequencies of the building were determined as 2.73 Hz and 3.11 Hz
for the first translational modes along the X (EW direction) and Y (NS direction)
directions, respectively, and 5.00 Hz for the first torsional mode. The fourth and fifth
modes were also determined as 8.54 Hz and 9.23 Hz which are the second modes in
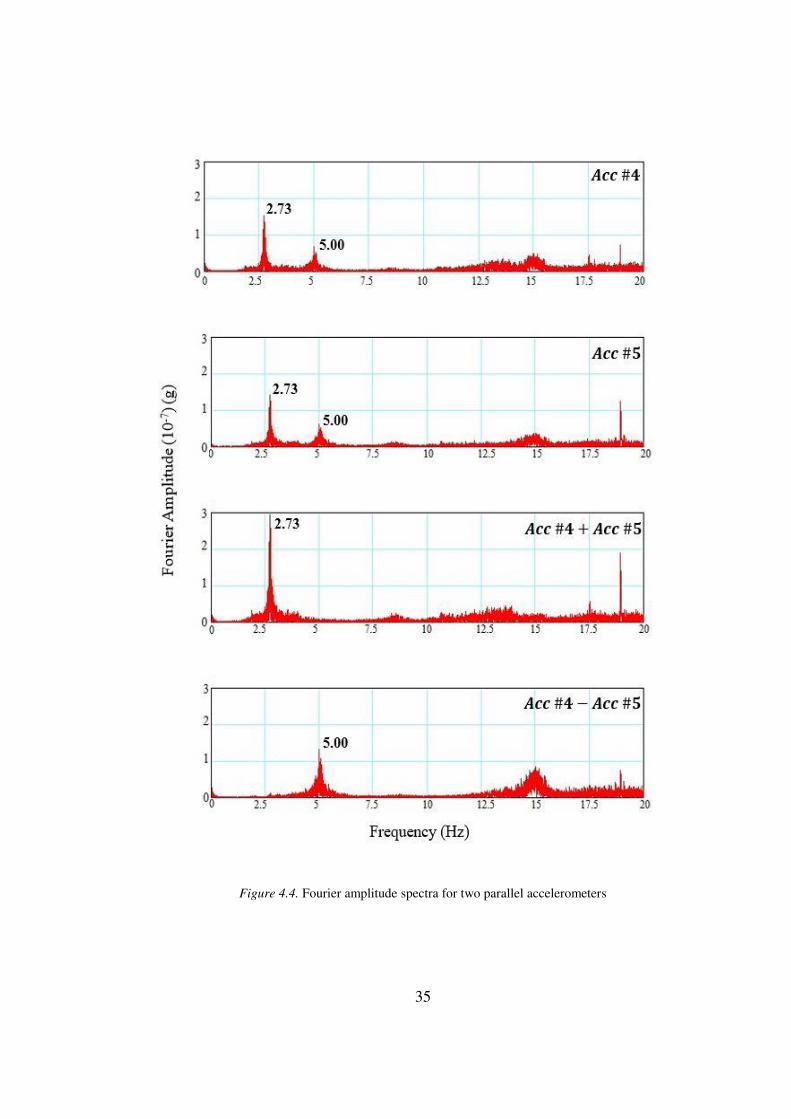
the X and Y directions, respectively (see Figs. 4.2 and 4.3). In order to identify
torsional modes, the recordings of two sensors (Acc #4 and Acc#5, locations shown
in Fig. 3.6) installed on the fourth floor are analyzed. The FAS are calculated for the
recordings at the two accelerometers, as well as the sum and the difference of both
recordings (see Fig. 4.4). This makes it possible to separate the bending modes (sum)
from the torsional modes (difference) (Safak and Celebi, 1990a).
31
Figure 4.1. Time domain

32
Figure 4.2. Fourier amplitude spectra for the EW direction
33
Figure 4.2. Fourier amplitude spectra for the EW direction (continued)
34
Figure 4.3. Fourier amplitude spectra for the NS direction
35
Figure 4.4. Fourier amplitude spectra for two parallel accelerometers
36
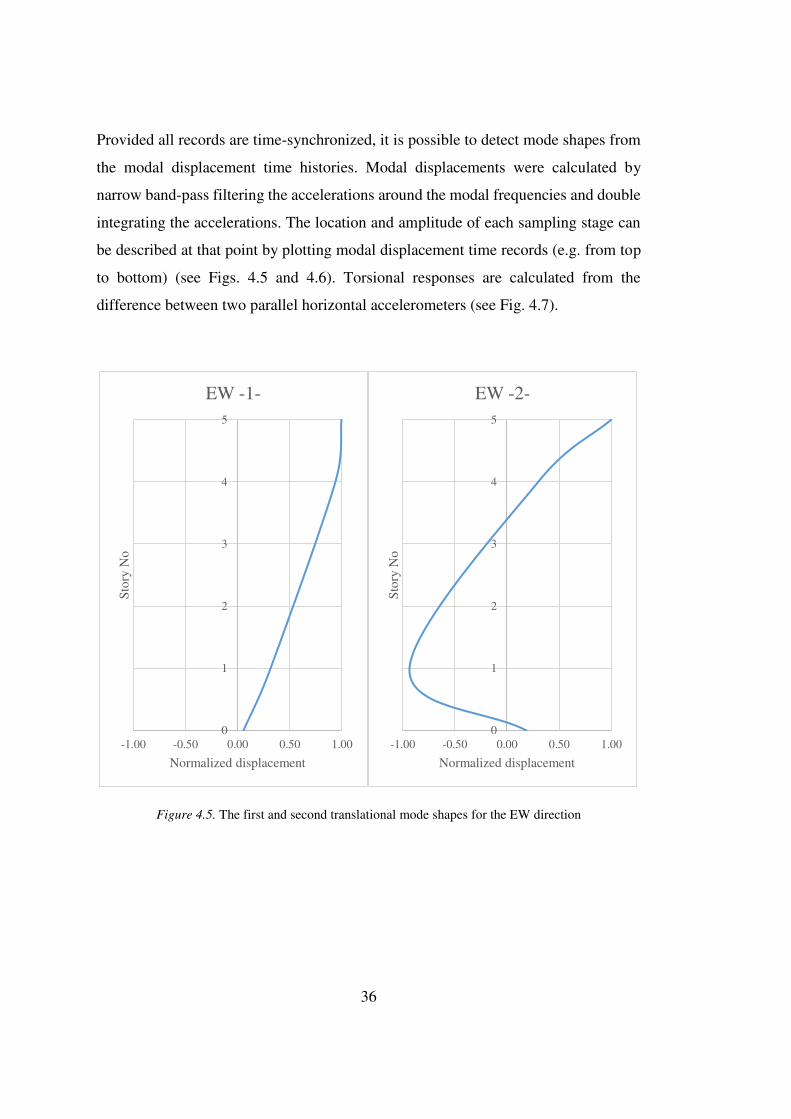
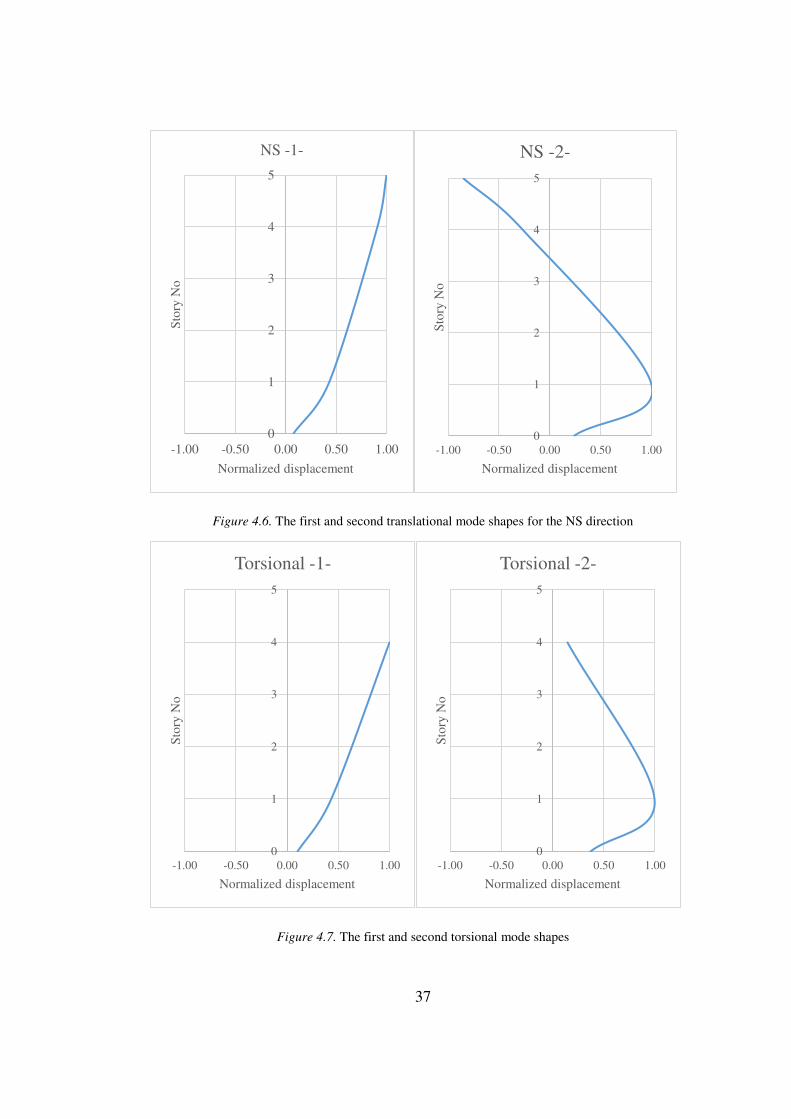
Provided all records are time-synchronized, it is possible to detect mode shapes from
the modal displacement time histories. Modal displacements were calculated by
narrow band-pass filtering the accelerations around the modal frequencies and double
integrating the accelerations. The location and amplitude of each sampling stage can
be described at that point by plotting modal displacement time records (e.g. from top
to bottom) (see Figs. 4.5 and 4.6). Torsional responses are calculated from the
difference between two parallel horizontal accelerometers (see Fig. 4.7).
Figure 4.5. The first and second translational mode shapes for the EW direction
0
1
2
3
4
5
-1.00 -0.50 0.00 0.50 1.00
Sto
ry N
o
Normalized displacement
EW -1-
0
1
2
3
4
5
-1.00 -0.50 0.00 0.50 1.00
Sto
ry N
o
Normalized displacement
EW -2-
37
Figure 4.6. The first and second translational mode shapes for the NS direction
Figure 4.7. The first and second torsional mode shapes
0
1
2
3
4
5
-1.00 -0.50 0.00 0.50 1.00
Sto
ry N
o
Normalized displacement
NS -1-
0
1
2
3
4
5
-1.00 -0.50 0.00 0.50 1.00S
tory
No
Normalized displacement
NS -2-
0
1
2
3
4
5
-1.00 -0.50 0.00 0.50 1.00
Sto
ry N
o
Normalized displacement
Torsional -1-
0
1
2
3
4
5
-1.00 -0.50 0.00 0.50 1.00
Sto
ry N
o
Normalized displacement
Torsional -2-

38
Modal damping ratios, ζ, were calculated using the half-power bandwidth method
(Chopra, 1995):
𝜁 = 𝑓𝑏 − 𝑓𝑎𝑓𝑏 + 𝑓𝑎 = 𝑓𝑏 − 𝑓𝑎2𝑓𝑛 (4.2)
where 𝑓𝑎 and 𝑓𝑏 are half-power frequency points and 𝑓𝑛 is the natural frequency.
Figure 4.8 illustrates this calculation for mode #1. The identified natural frequencies,
and damping ratios are summarized in Table 4.1.
Figure 4.8. Damping ratio for mode #1 𝜁 = 2.79 − 2.672.79 + 2.67 = 2.79 − 2.672 × 2.73 = 0.022 Table 4.1. Fourier analysis results
Mode
Number Description Frequency (Hz)
Damping Ratio
(%)
1 X–Longitudinal 2.73 2.2
2 Y–Longitudinal 3.11 2.1
3 Torsion 5.00 1.5
4 X–Translational 8.54 1.9
5 Y–Translational 9.23 2.2
39
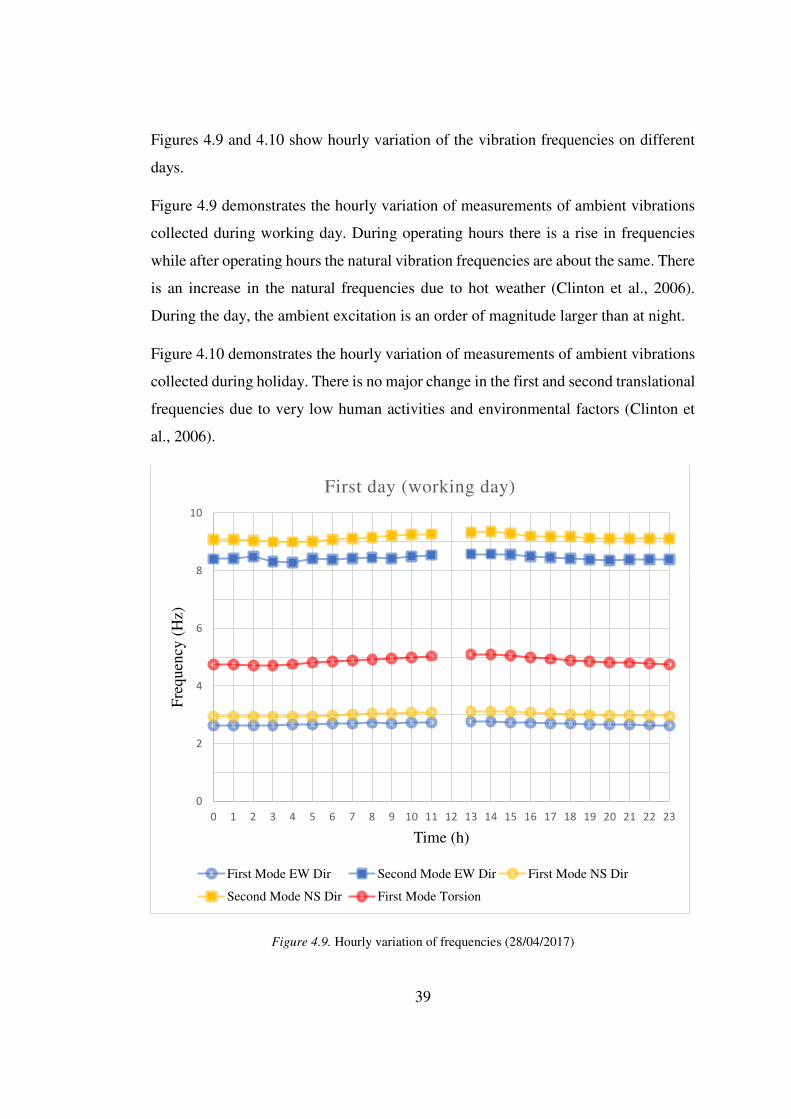
Figures 4.9 and 4.10 show hourly variation of the vibration frequencies on different
days.
Figure 4.9 demonstrates the hourly variation of measurements of ambient vibrations
collected during working day. During operating hours there is a rise in frequencies
while after operating hours the natural vibration frequencies are about the same. There
is an increase in the natural frequencies due to hot weather (Clinton et al., 2006).
During the day, the ambient excitation is an order of magnitude larger than at night.
Figure 4.10 demonstrates the hourly variation of measurements of ambient vibrations
collected during holiday. There is no major change in the first and second translational
frequencies due to very low human activities and environmental factors (Clinton et
al., 2006).
Figure 4.9. Hourly variation of frequencies (28/04/2017)
0
2
4
6
8
10
0 1 2 3 4 5 6 7 8 9 10 11 12 13 14 15 16 17 18 19 20 21 22 23
Fre
quen
cy (
Hz)
Time (h)
First day (working day)
First Mode EW Dir Second Mode EW Dir First Mode NS Dir
Second Mode NS Dir First Mode Torsion

40
Figure 4.10. Hourly variation of frequencies (29/04/2017)
4.3. Enhanced Frequency Domain Decomposition
Natural frequencies, mode shapes and modal damping ratios can also be identified by
using the EFDD method (Jacobsen et al. 2006).
In the EFDD method, the natural frequency is obtained by determining the number of
zero transition which is time-dependent, and damping is acquired with the logarithmic
reduction of the single degree of freedom normalized auto-correlation function. In this
method, the peak points of the Power Spectral Density function corresponds to the
natural frequencies. The singular vectors that compose the peak points correspond to
the mode shapes (Brincker et al., 2000).
0
2
4
6
8
10
0 1 2 3 4 5 6 7 8 9 10 11 12 13 14 15 16 17 18 19 20 21 22 23
Fre
quen
cy (
Hz)
Time (h)
Second day (holiday)
First Mode EW Dir Second Mode EW Dir First Mode NS Dİr
Second Mode NS Dir First Mode Torsion
41
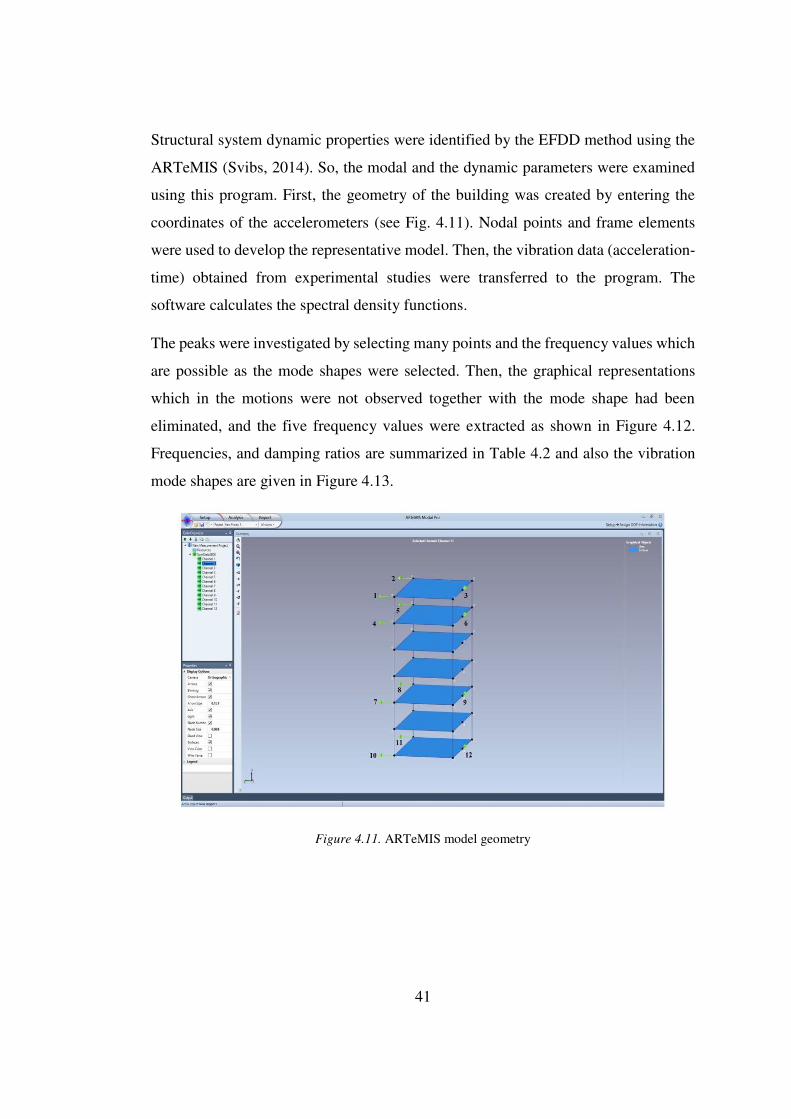
Structural system dynamic properties were identified by the EFDD method using the
ARTeMIS (Svibs, 2014). So, the modal and the dynamic parameters were examined
using this program. First, the geometry of the building was created by entering the
coordinates of the accelerometers (see Fig. 4.11). Nodal points and frame elements
were used to develop the representative model. Then, the vibration data (acceleration-
time) obtained from experimental studies were transferred to the program. The
software calculates the spectral density functions.
The peaks were investigated by selecting many points and the frequency values which
are possible as the mode shapes were selected. Then, the graphical representations
which in the motions were not observed together with the mode shape had been
eliminated, and the five frequency values were extracted as shown in Figure 4.12.
Frequencies, and damping ratios are summarized in Table 4.2 and also the vibration
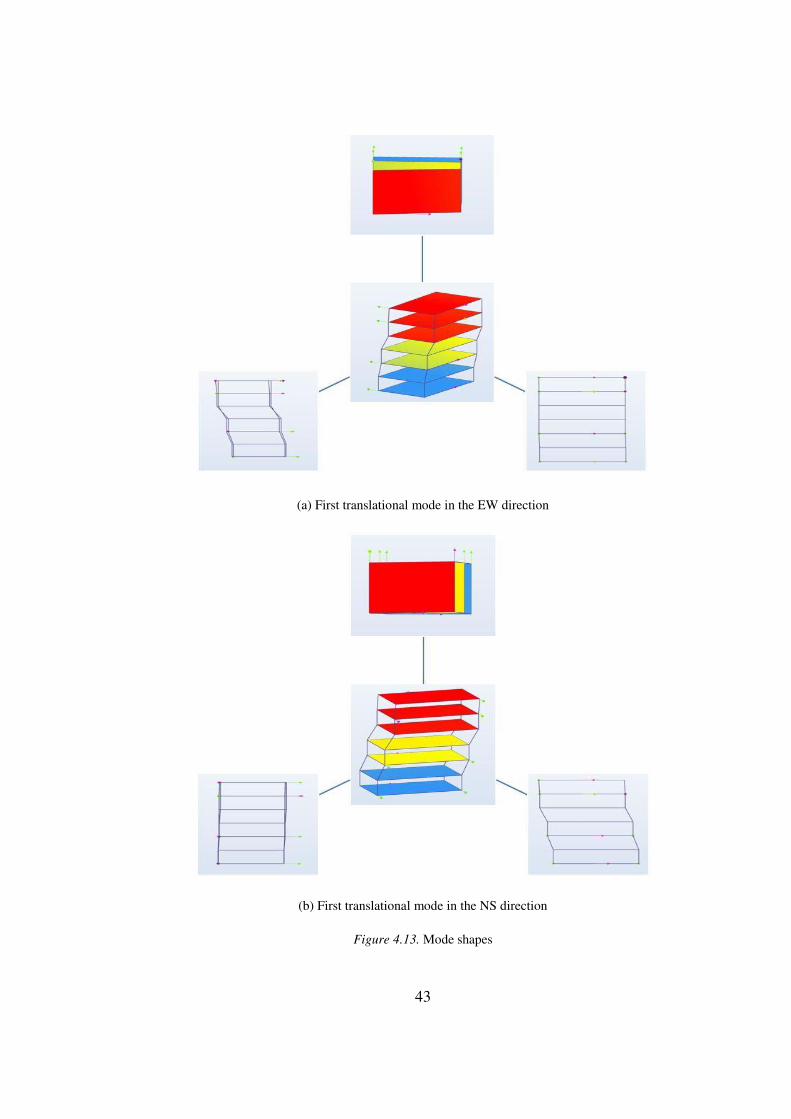
mode shapes are given in Figure 4.13.
Figure 4.11. ARTeMIS model geometry

42
Figure 4.12. Singular values of spectral densities of the test setup
Table 4.2. EFDD analysis results
Mode
Number Description Frequency (Hz)
Damping Ratio
(%)
1 X–Longitudinal 2.73 2.1
2 Y–Longitudinal 3.09 2.0
3 Torsion 5.00 1.5
4 X–Translational 8.50 1.7
5 Y–Translational 9.26 2.1
43
(a) First translational mode in the EW direction
(b) First translational mode in the NS direction
Figure 4.13. Mode shapes

44
(c) Second translational mode in the EW direction
(d) Second translational mode in the NS direction
Figure 4.13. Mode shapes (continued)
45
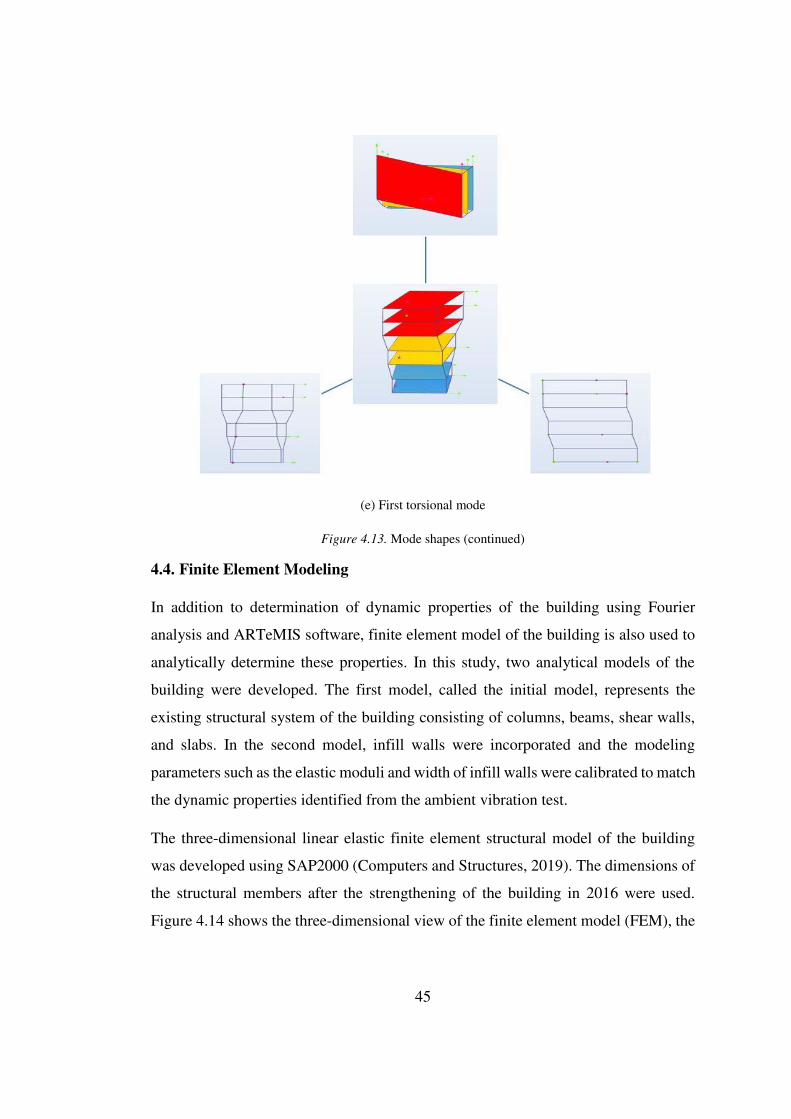
(e) First torsional mode
Figure 4.13. Mode shapes (continued)
4.4. Finite Element Modeling
In addition to determination of dynamic properties of the building using Fourier
analysis and ARTeMIS software, finite element model of the building is also used to
analytically determine these properties. In this study, two analytical models of the
building were developed. The first model, called the initial model, represents the
existing structural system of the building consisting of columns, beams, shear walls,
and slabs. In the second model, infill walls were incorporated and the modeling
parameters such as the elastic moduli and width of infill walls were calibrated to match
the dynamic properties identified from the ambient vibration test.
The three-dimensional linear elastic finite element structural model of the building
was developed using SAP2000 (Computers and Structures, 2019). The dimensions of
the structural members after the strengthening of the building in 2016 were used.
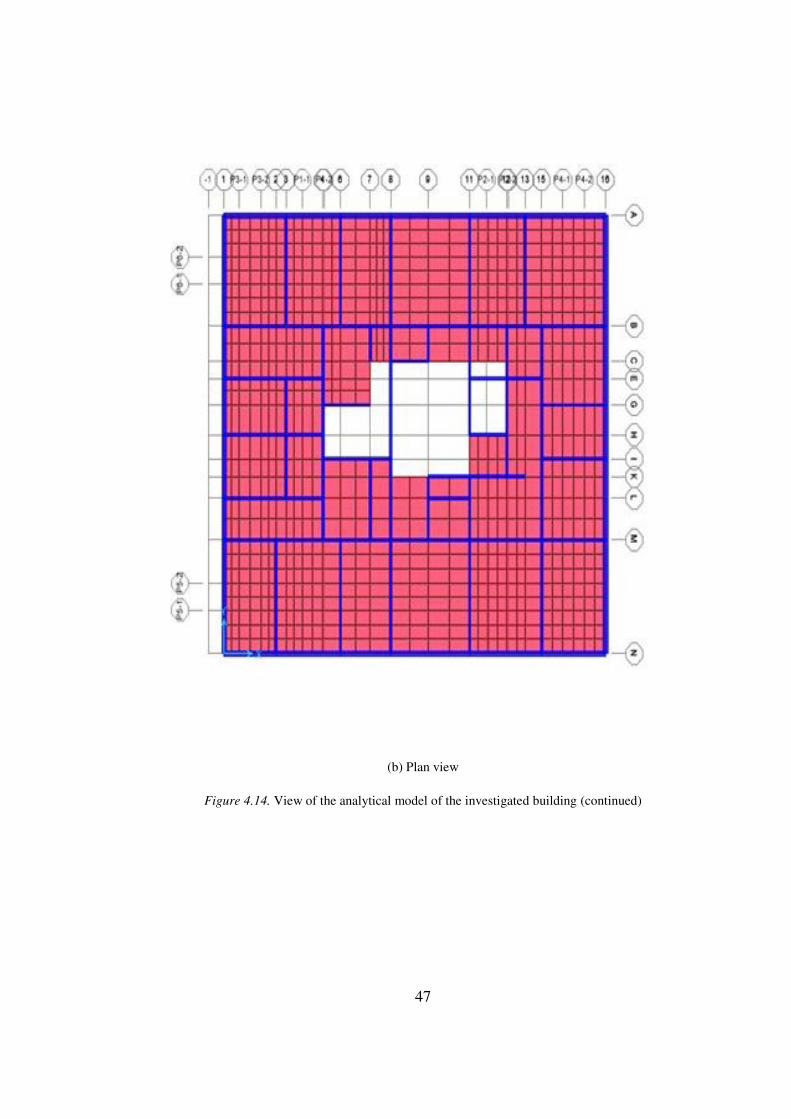
Figure 4.14 shows the three-dimensional view of the finite element model (FEM), the

46
plan view, and views of the axes strengthened by the shear walls with openings in EW
and NS directions.
(a) 3D view
Figure 4.14. View of the analytical model of the investigated building
47
(b) Plan view
Figure 4.14. View of the analytical model of the investigated building (continued)
48
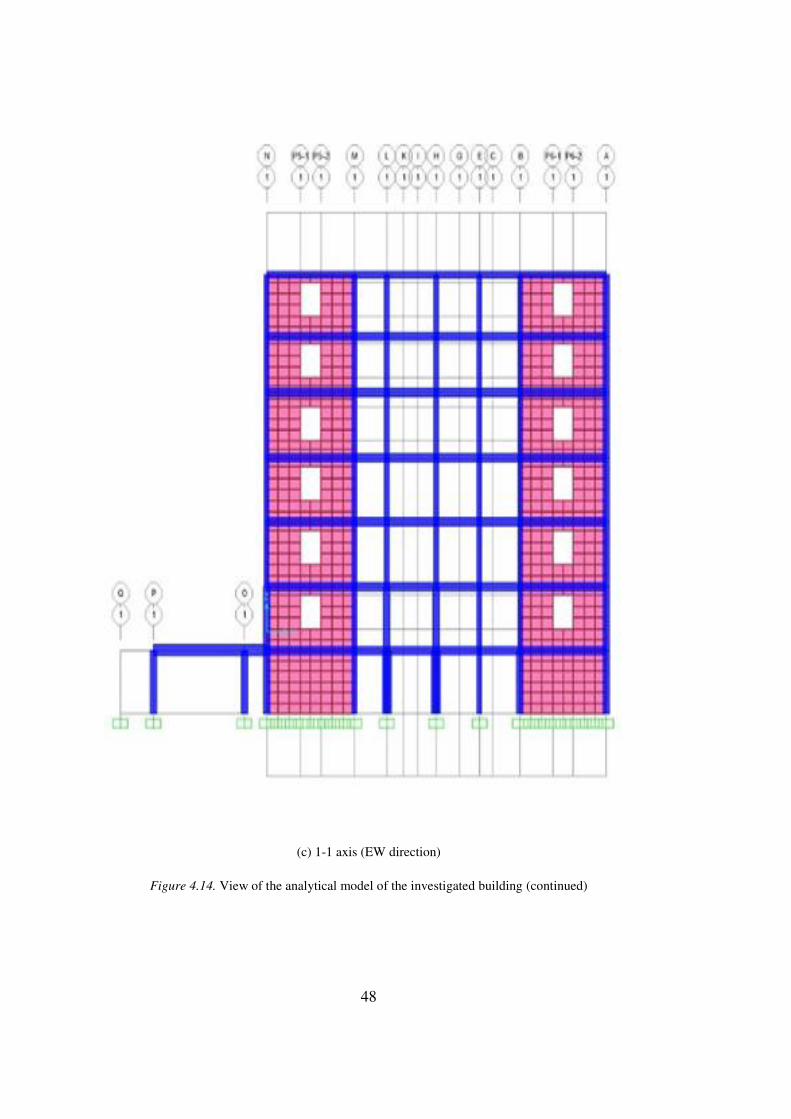
(c) 1-1 axis (EW direction)
Figure 4.14. View of the analytical model of the investigated building (continued)

49
(d) N-N axis (NS direction)
Figure 4.14. View of the analytical model of the investigated building (continued)
50
Columns and beams were modeled using frame elements whereas shear walls and
slabs were modeled using shell elements. Foundation-column joints were defined as
moment connections in the design documents; hence fixed supports were defined.
Soil-structure interaction effects were ignored. Rigid diaphragms were defined at all
floors. Door and window openings in the shear walls were modeled.
The finite element meshes were used for the ground, typical, and roof floor slabs. The
mass of the structural and non-structural components was defined as a distributed load
using unit weights of the materials. The unit weight of structural concrete was taken
as 24 kN/m3. The Poisson’s ratio for concrete was taken as 0.2 according to TS 500.
The modulus of elasticity, E, for concrete is given by
𝐸𝑐𝑗 = 3250√𝑓𝑐𝑗 + 14000 (4.3)
in Turkish Standards (TS 500, 2000). Moduli of elasticity for grade C12 and C20
concrete were taken as 25,000 MPa and 28,000 MPa, respectively, according to TS
500.
Four different loads were considered. The first load was the dead weight of the
building. The second load was the live loads determined according to TS 498 (1997).
The third load was superimposed load for non-structural components (cladding,
furniture, etc.) on floor slabs. The fourth load was a point load equal to the walking
load described in Chapter 5.
In order to determine the dynamic properties of the investigated building, an
eigenvalue analysis was performed. Dynamic masses were defined based on the load
combination DL + 0.3LL (DL and LL stand for dead and live loads, respectively).
Eigenvalue analysis of the structural model yielded the natural vibration frequencies
of the building as 1.5 Hz and 2.3 Hz for the first translational modes along the X (EW)
and Y (NS) directions, respectively, and 3.0 Hz for the first torsional mode. The fourth
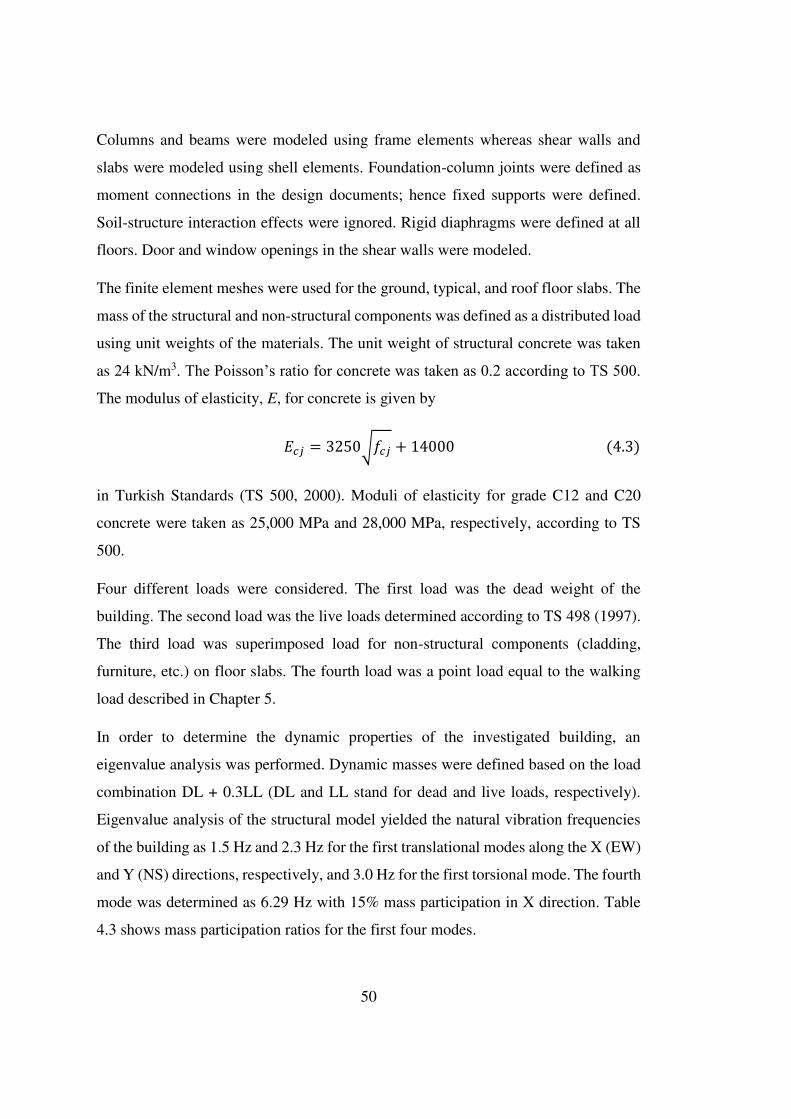
mode was determined as 6.29 Hz with 15% mass participation in X direction. Table
4.3 shows mass participation ratios for the first four modes.
51
Table 4.3. Natural vibration frequencies and mass participation ratios
Mode
Number Description Frequency (Hz)
Modal
Participating
Mass Ratio (%)
1 X–Longitudinal 1.59 57
2 Y–Longitudinal 2.43 59
3 Torsion 3.29 48
4 X–Translational 6.67 15
4.4.1. Modeling of Hollow-Brick Infill Walls
Infill walls are considered as non-structural members and ignored in the structural
design. The reasons for neglecting the contribution of the infill walls to the building
stiffness can be summarized as follow (Mainstone and Weeks, 1970; Dhanasekar and
Page, 1986):
Modeling of infill walls is relatively difficult and complicated.
The strength of infill wall materials is variable.
Construction quality significantly affects the wall strength and it is changeable
and unreliable.
Although the contribution to the capacity of energy absorption and stiffness of
the building is generally known, the impact of the infills wall is not considered
in order to remain on the safe side.
In the literature, equivalent diagonal strut members were proposed for modeling the
infill walls (Mainstone and Weeks, 1970). All exterior hollow-brick partition walls in
the building were modeled by using diagonal strut elements connected to the structural
frame at beam-column joints according to the Turkish Earthquake Code (Ministry of
Public Works and Settlement, 2007). Two diagonal struts were utilized for each infill
panel, and the equivalent strut thickness (0.25 m) and modulus of elasticity (1875
MPa) were taken the same as those of the infill panels.
52
The width of equivalent diagonal strut is given by 𝛼 = 0.175(𝜆ℎ𝑐𝑜𝑙)−0.4𝐿𝑖𝑛𝑓 (4.4)
where
𝜆 = √𝐸𝑖𝑛𝑓𝑡𝑖𝑛𝑓 sin 2𝜃4𝐸𝑓𝑐𝐼𝑐𝑜𝑙ℎ𝑖𝑛𝑓4 (4.5)
𝜃 = tan−1(ℎ𝑖𝑛𝑓/𝐿𝑖𝑛𝑓) (4.6)
α is the width of the equivalent strut member, ℎ𝑐𝑜𝑙 is the height of the column, 𝐼𝑐𝑜𝑙 is
the moment of inertia of the column, 𝐿𝑖𝑛𝑓 is the length of the infill panel, 𝑡𝑖𝑛𝑓 is the
thickness of the infill panel, ℎ𝑖𝑛𝑓 is the height of the infill panel, 𝐸𝑖𝑛𝑓 is the modulus
of elasticity of the infill panel material, 𝐸𝑓𝑐 is the modulus of elasticity of the frame
material (Mainstone and Weeks, 1970).
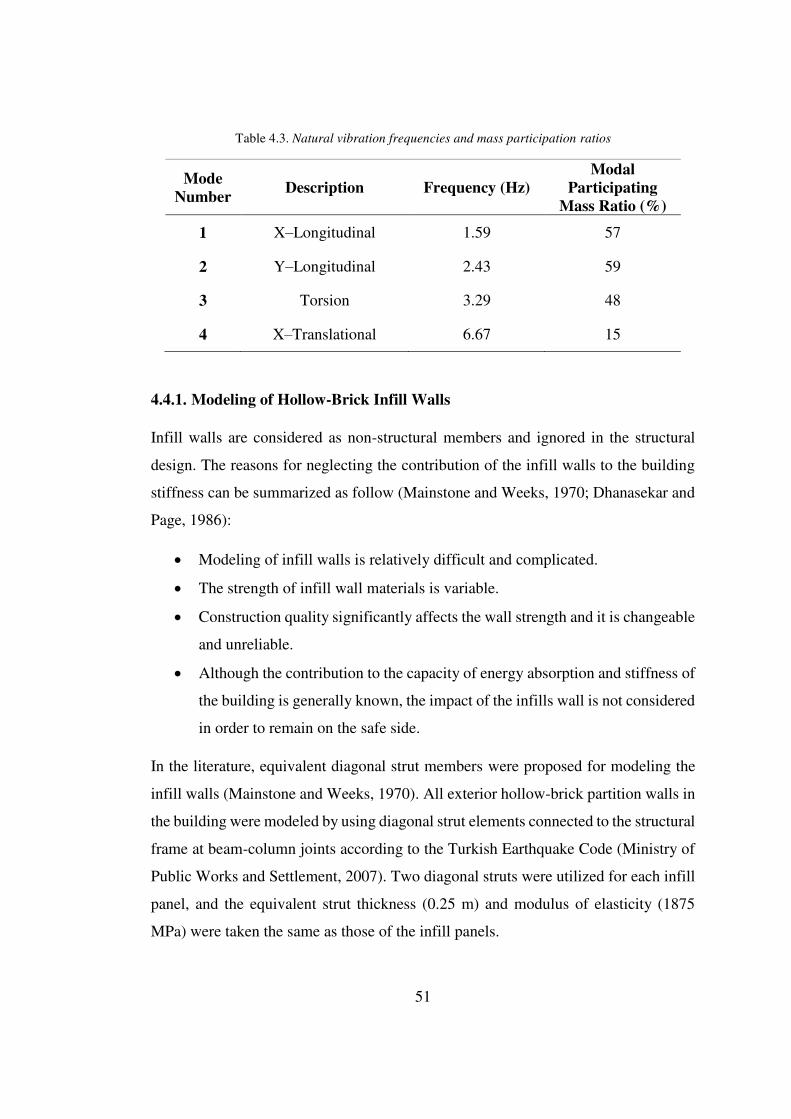
Equivalent diagonal strut members on the outer perimeter of the building were placed
as shown in Figure 4.15. Eigenvalue analysis of the structural model yielded the
natural vibration frequencies of the building as 2.03 Hz and 2.61 Hz for the first
translational modes along the X and Y directions, respectively, and 3.81 Hz for the
first torsional mode. The fourth mode was 7.14 Hz with 12% mass participation in the
X direction. The analysis results are given in Table 4.4.
Table 4.4. Natural frequencies determined from the analytical model with strut members
Mode
Number Description Frequency (Hz)
Modal
Participating
Mass Ratio (%)
1 X–Longitudinal 2.10 61
2 Y–Longitudinal 2.91 60
3 Torsion 4.09 49
4 X–Translational 7.59 13

53
Figure 4.15. Finite element model with strut members
4.4.2. Validation of the Dynamic Properties and Calibration of the FEM
The dynamic properties of structural system that were determined from the FEM were
validated using those identified from the ambient vibration records of the building.
Thus, frequency values and mode shapes obtained in Fourier analysis (determined
based on measurements) and SAP2000 software (determined from the FEM) are
compared. As shown in Figure 4.16 and Table 4.5, the frequency values are different
though the mode shapes are similar. Thus, it was imperative to update the analytical
model.

54
(a) First mode
(b) Second mode
Figure 4.16. Comparison of the mode shapes between SAP2000 and Fourier analysis
55
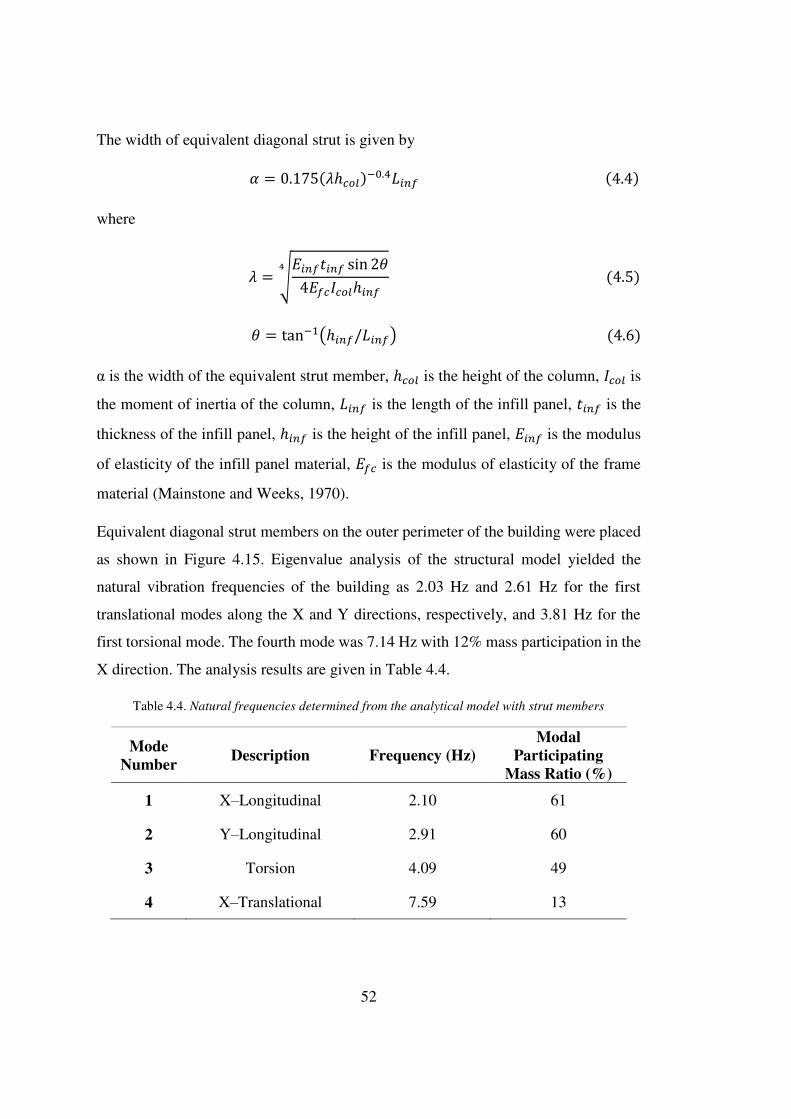
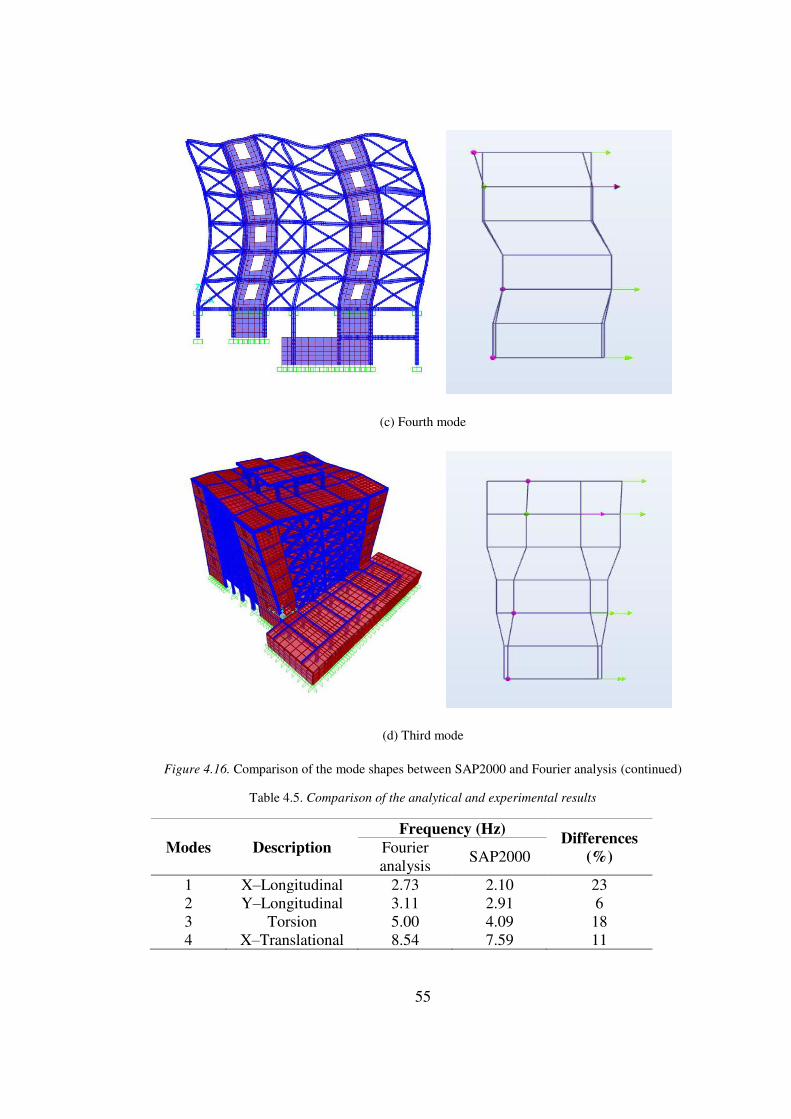
(c) Fourth mode
(d) Third mode
Figure 4.16. Comparison of the mode shapes between SAP2000 and Fourier analysis (continued)
Table 4.5. Comparison of the analytical and experimental results
Modes Description
Frequency (Hz) Differences
(%) Fourier
analysis SAP2000
1 X–Longitudinal 2.73 2.10 23
2 Y–Longitudinal 3.11 2.91 6
3 Torsion 5.00 4.09 18
4 X–Translational 8.54 7.59 11
56
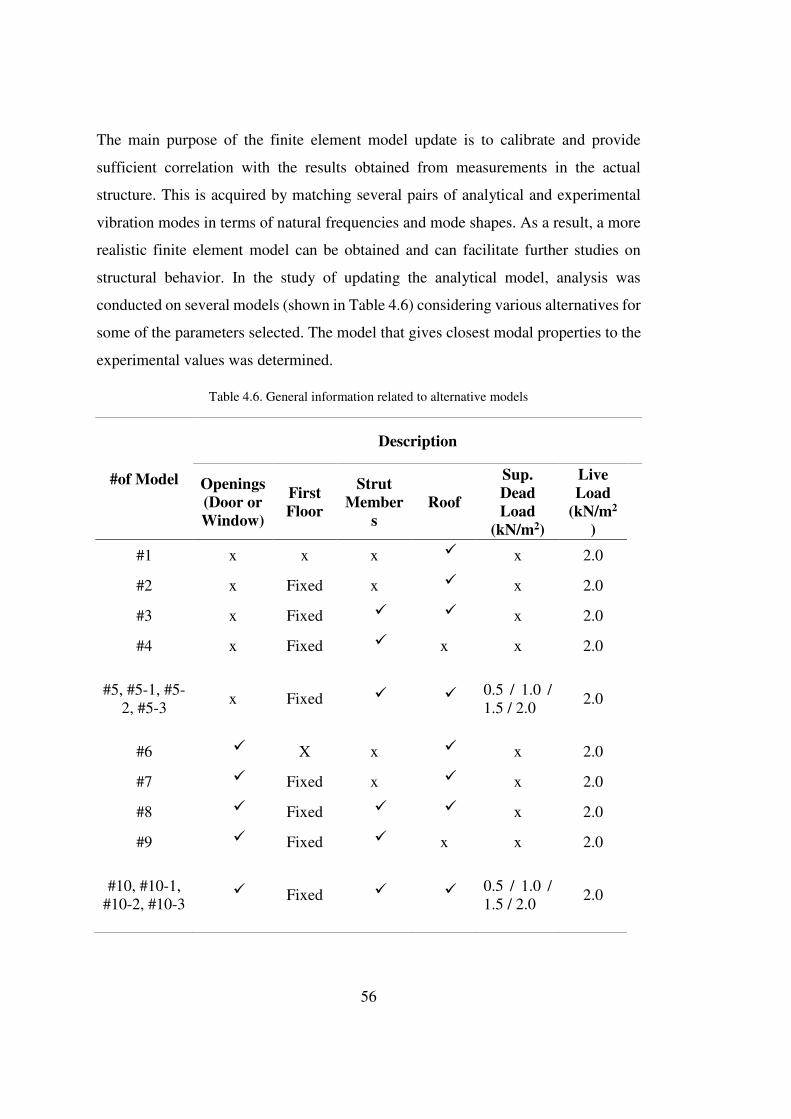
The main purpose of the finite element model update is to calibrate and provide
sufficient correlation with the results obtained from measurements in the actual
structure. This is acquired by matching several pairs of analytical and experimental
vibration modes in terms of natural frequencies and mode shapes. As a result, a more
realistic finite element model can be obtained and can facilitate further studies on
structural behavior. In the study of updating the analytical model, analysis was
conducted on several models (shown in Table 4.6) considering various alternatives for
some of the parameters selected. The model that gives closest modal properties to the
experimental values was determined.
Table 4.6. General information related to alternative models
#of Model
Description
Openings
(Door or
Window)
First
Floor
Strut
Member
s
Roof
Sup.
Dead
Load
(kN/m2)
Live
Load
(kN/m2
)
#1 x x x x 2.0
#2 x Fixed x x 2.0
#3 x Fixed x 2.0
#4 x Fixed x x 2.0
#5, #5-1, #5-
2, #5-3 x Fixed 0.5 / 1.0 /
1.5 / 2.0 2.0
#6 X x x 2.0
#7 Fixed x x 2.0
#8 Fixed x 2.0
#9 Fixed x x 2.0
#10, #10-1,
#10-2, #10-3 Fixed 0.5 / 1.0 /
1.5 / 2.0 2.0
57
While developing alternative analytical models, the parameters related to the mass and
stiffness of the structure were changed. The building mass depends on dead and live
load cases. Hence, the effects of these load cases on building mass were investigated
by trying different cases. The modulus of elasticity values of the diagonal strut
elements were selected as another update parameter. The FEMA 356 (2000), TEC
(2007), and Eurocode 6 (2005) suggested this value as 550𝑓𝑘, 750𝑓𝑘, and 1000𝑓𝑘,
respectively. The following equation was utilized in order to calculate modulus of
elasticity of infill walls to achieve a comparable result in this study: 𝐸𝑠𝑡 = 750𝑓𝑘 (4.7)
In addition, the equivalent strut width coefficient was taken 0.175 in Eq. (4.4). But in
recent studies, this coefficient was used as 0.27 (Chrysostomou and Asteris, 2012). In
this thesis, the analytical model was analyzed according to the widths determined by
using both coefficient values and the results were summarized. Moreover, in the study
conducted by Stafford Smith and Carter (1969), the equivalent diagonal strut width
was stated to change with the applied load. In studies conducted by many researchers
(Stafford and Carter, 1969; Mehrabi et al., 1996; Sattar and Liel, 2010; Celik, 2016)
it has been shown that the initial stiffness of the infill wall corresponds to
approximately twice of one strut stiffness. Based on these studies, two diagonal struts
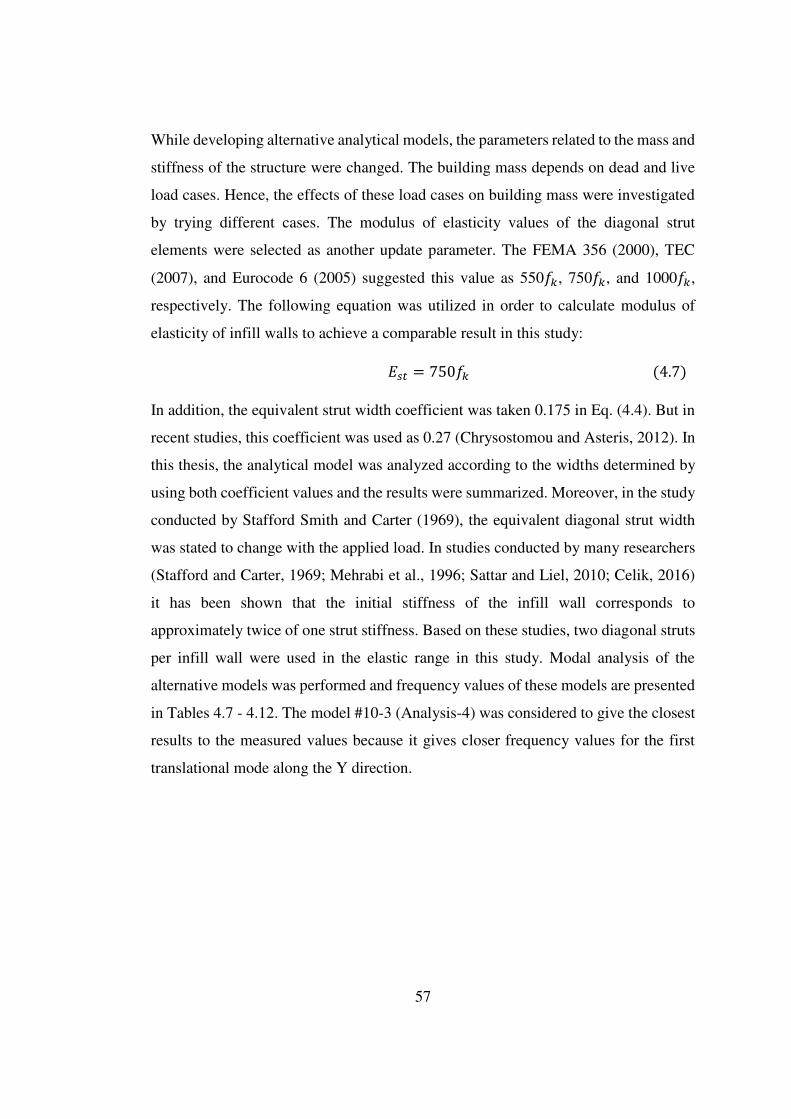
per infill wall were used in the elastic range in this study. Modal analysis of the
alternative models was performed and frequency values of these models are presented
in Tables 4.7 - 4.12. The model #10-3 (Analysis-4) was considered to give the closest
results to the measured values because it gives closer frequency values for the first
translational mode along the Y direction.
58
Table 4.7. Modal analysis results for different analytical models (Analysis-1)
Table 4.8. Modal analysis results for different analytical models (Analysis-2)
Table 4.9. Modal analysis results for different analytical models (Anlysis-3)

59
Table 4.10. Modal analysis results for different analytical models (Analysis-4)
Table 4.11. Modal analysis results for different analytical models (Analysis-5)
Table 4.12. Modal analysis results for different analytical models (Analysis-6)
60
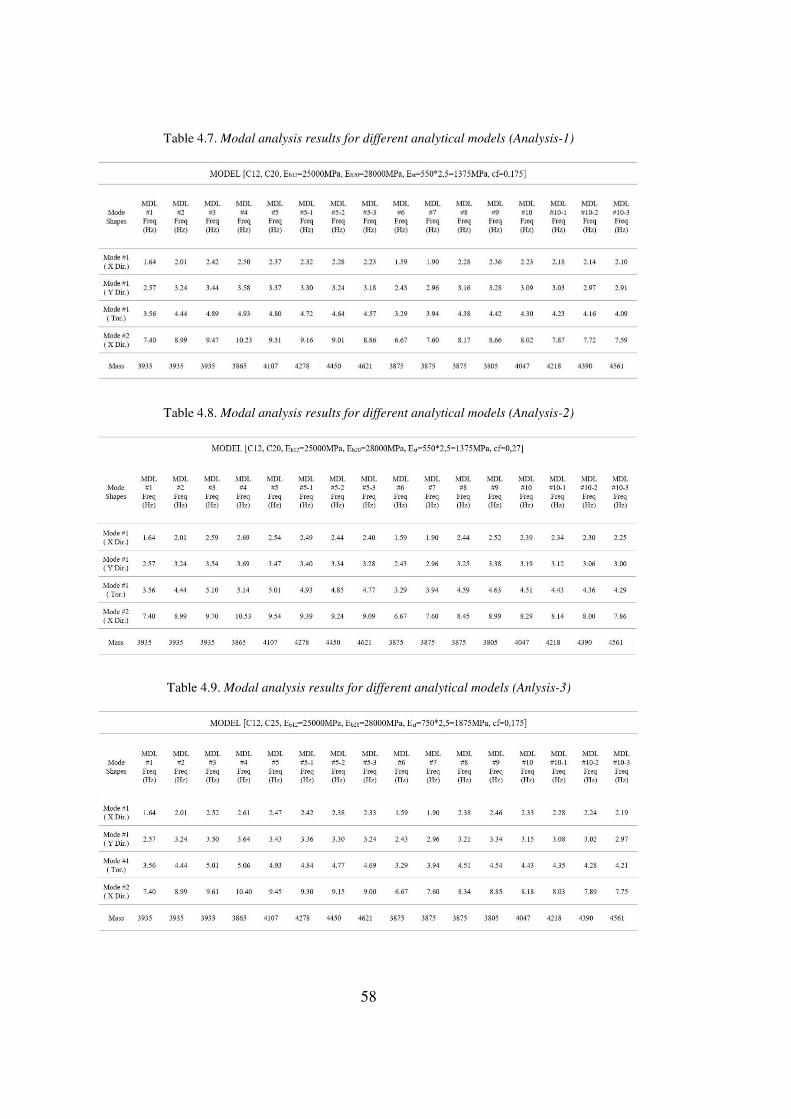
4.5. Comparison of the Test Results with the FEM
Several trials were performed on the analytical model and the results were presented
in the previous section. The calibrated models matched better the experimental mode
frequencies. For this reason, calibrated analytical model #10-3 (Analysis-4) was
chosen as the final updated model.
When the results of the selected analytical model from Analysis case 4 and the
experimental ones were compared, the frequency values were found to be closer to the
experimental results than the initial analytical model as shown in Table 4.13. The
match of analytical and experimental mode shapes demonstrates that idealizations and
assumptions made before for updating the model are reasonable.
During the comparison and calibration studies between the measurements and
analytical results, one of the encountered problems was that the analytical model
consisted of five normal stories, two basements, and roof floor, while the
instrumentation merely covered the basement, first, fourth, and fifth floors. Therefore,
the response of the roof and other floors was indirectly included in the dynamic
measurements. These measurements were also influenced by the structural properties
of these floors.
Table 4.13. Comparisons of calibrated model and experimental analysis results
Modes Description
Frequency (Hz) Differences
(%) Fourier
analysis SAP2000
1 X–Longitudinal 2.73 2.38 12.8
2 Y–Longitudinal 3.11 3.08 0.9
3 Torsion 5.00 4.45 11.0
4 X–Translational 8.54 8.09 5.3
61
CHAPTER 5
5. FLOOR VIBRATION ANALYSIS
5.1. Determining the Floor Vibration Threshold Level
At the design stage, vibrations should be regarded as one of the most important
comfort conditions in buildings. Otherwise, they cause unrest and discomfort for
residents and a loss use of the building. Allen and Murray (1993) have suggested the
methods which involve calculation for vibration in floor and include design
conditions.
The vibration detection thresholds of people show differences according to their
activity. Figure 5.1 presents these thresholds as a function of frequency of floor for
various occupancy areas. For instance, while people in offices and residences are
disturbed by accelerations reaching 0.005 g, the people in an activity are not
discomforted by the vibrations almost 10 times more (0.05 g) (American Institute of
Steel Construction (AISC), 2016). This chapter presents the evaluation of floor
vibration based on measurements and analyses under the walking load on the ground
and second floors. It also presents floor vibration calculations and comparisons with
limits after modifications applied to reduce the floor vibration.

62
Figure 5.1. Recommended peak acceleration for human comfort vibration due to human activities
(ASIC, 2016)
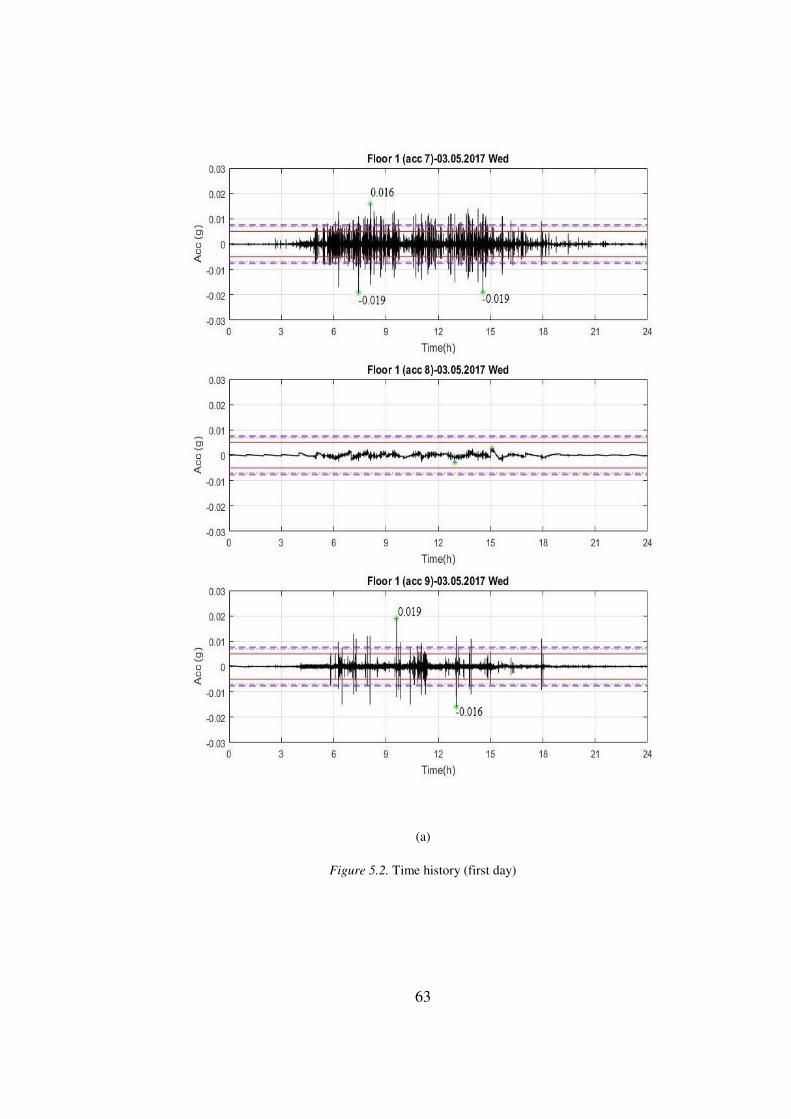
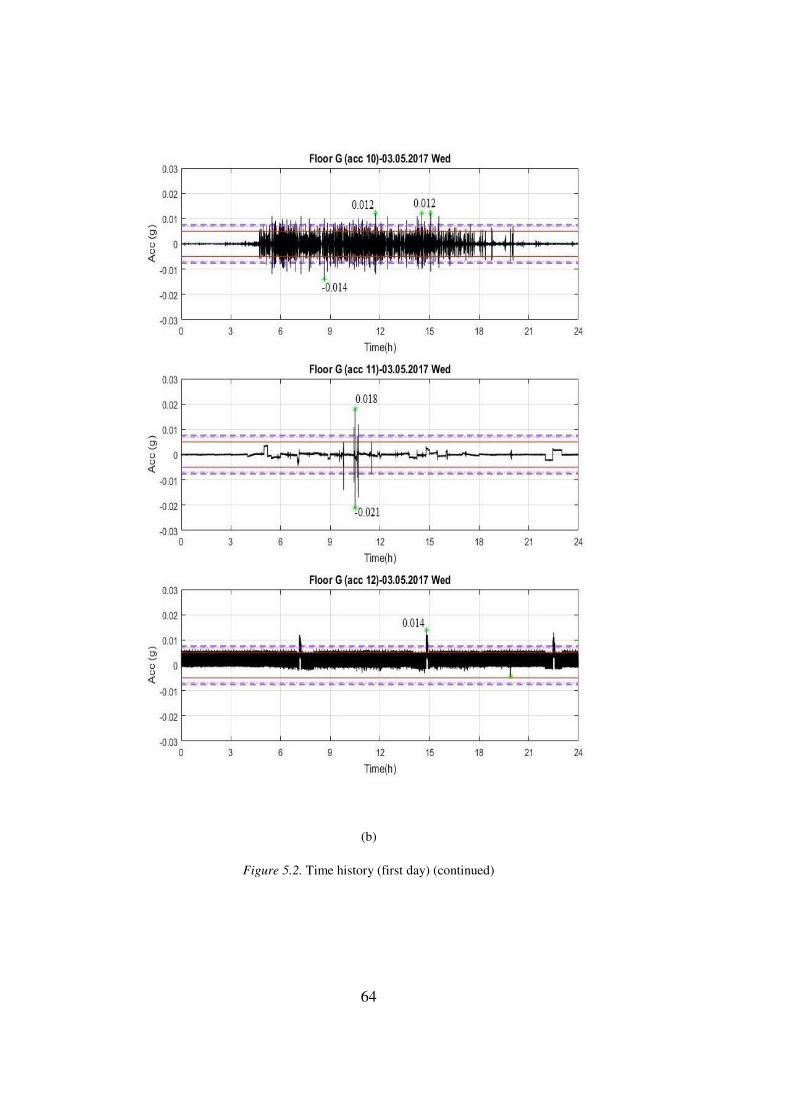
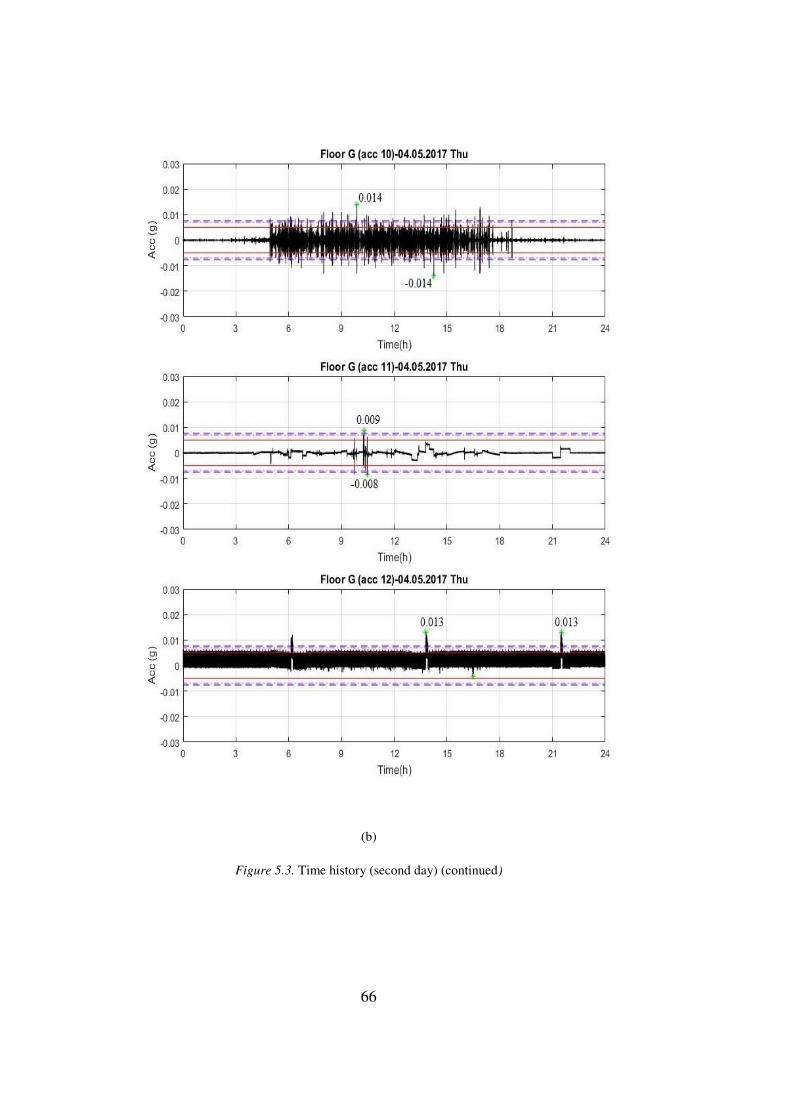
5.1.1. Vertical Acceleration Records
Within the scope of the study, measurements in the vertical direction were recorded
with uniaxial accelerometers installed on the ground and second floor slabs of the
investigated RC building. The time variations of these measurements are given in Figs.
5.2 and 5.3, and the hourly maximum values are shown in Figs. 5.4 and 5.5.
63
(a)
Figure 5.2. Time history (first day)
64
(b)
Figure 5.2. Time history (first day) (continued)
65
(a)
Figure 5.3. Time history (second day)
66
(b)
Figure 5.3. Time history (second day) (continued)
67
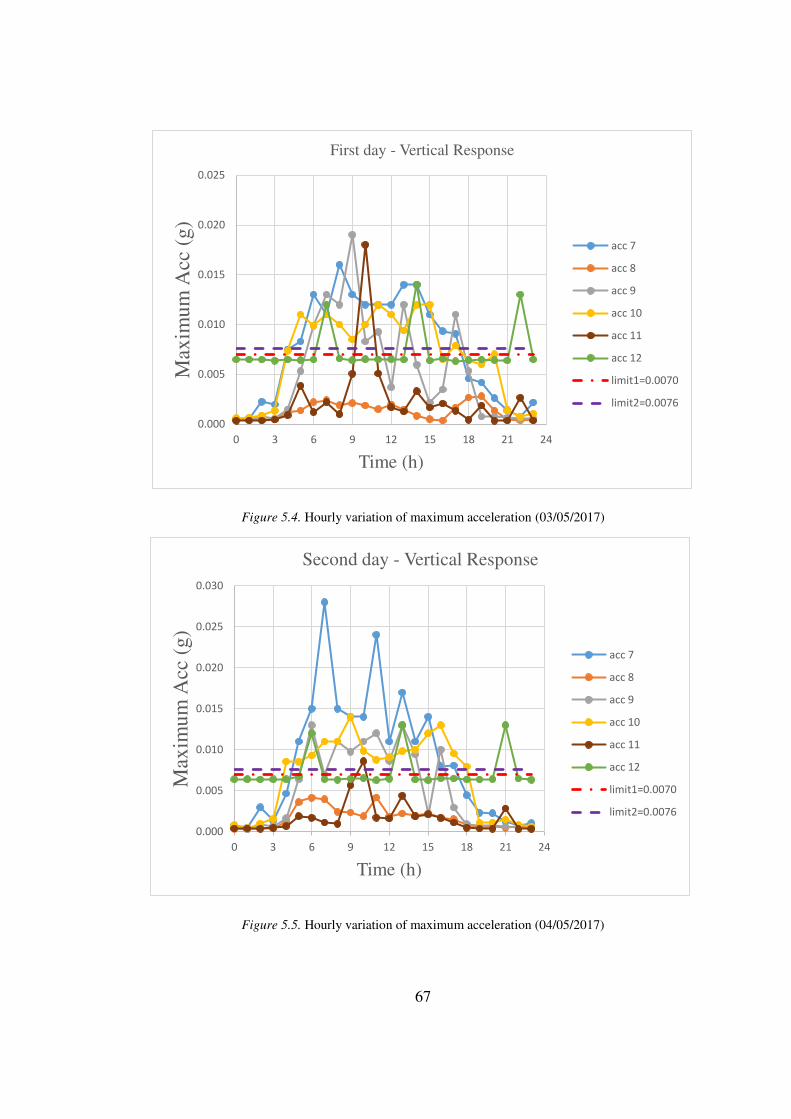
Figure 5.4. Hourly variation of maximum acceleration (03/05/2017)
Figure 5.5. Hourly variation of maximum acceleration (04/05/2017)
0.000
0.005
0.010
0.015
0.020
0.025
0 3 6 9 12 15 18 21 24
Max
imu
m A
cc (
g)
Time (h)
First day - Vertical Response
acc 7
acc 8
acc 9
acc 10
acc 11
acc 12
limit1=0.0070
limit2=0.0076
0.000
0.005
0.010
0.015
0.020
0.025
0.030
0 3 6 9 12 15 18 21 24
Max
imu
m A
cc (
g)
Time (h)
Second day - Vertical Response
acc 7
acc 8
acc 9
acc 10
acc 11
acc 12
limit1=0.0070
limit2=0.0076

68
When the recorded accelerations are examined, it is seen that high values were
measured in accelerometers 7, 9, and 10 during working hours. In order to determine
whether these acceleration values are tolerable in the conditions of use, the limit values
given in the above mentioned design guide were used. First, the frequency of the floor
was found from the Fourier analysis of the recorded vertical acceleration (see Fig.
5.6). Then, where this frequency value corresponds to Figure 5.1 was determined and
the limit value was calculated as 0.0076 g and 0.0070 g (see Figs. 5.4 and 5.5). These
comparison revealed that, accelerations recorded at accelerometers 7, 9, and 10
exceeded this limit value during working hours. Therefore, it is concluded that the
existing flooring system does not satisfy the comfort conditions of AISC (2016).
Figure 5.6. Floor frequency for the ground and second floors

69
5.1.2. Finite Element Model Analysis
Finite element analysis can be employed to estimate vibration response. Firstly, the
part of the structure being evaluated is defined in terms of its geometry, mass, stiffness,
and damping. Secondly, dynamic properties such as natural frequencies and mode
shapes are predicted using eigenvalue analysis. This step was performed in the
previous chapter. Thirdly, human-induced loads are presented by a Fourier series or
effective impulse as described below. So, in this part of the study, floor vibrations
were determined analytically and compared to the tolerance limits to determine
whether or not vibrations are excessive.
Finite element model of the slabs of the building was prepared using SAP2000. This
part of the study is conducted to obtain a time history plot of floor acceleration for a
person walking across the concrete slab that is 4.45 m by 4.80 m in plan. A graph of
the vertical accelerations at the middle of the slab was obtained to make sure that the
maximum acceleration is calculated. The dynamic effects of a person that weighs
approximately 735 N (Lee et al., 2015) walking across the middle of the slab were
modeled. The person is assumed to walk with a frequency of 2 Hz (Arup, 2004;
Saunier et al., 2011) which means the footfall impacts the slab at every half a second.
The forward speed was assumed as 1.5 m/s which results in a stride length of 0.75 m.
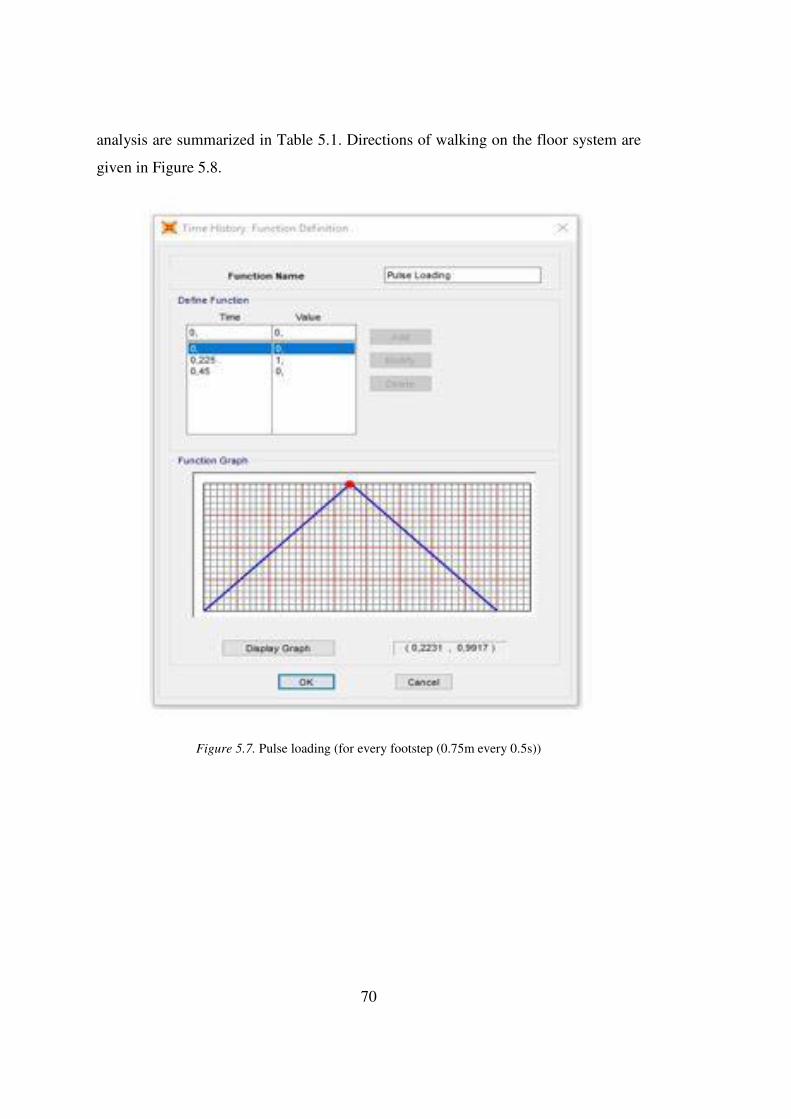
The peak load was assumed to be 1.4 times the weight (approximately 1 kN) and the
duration of impact was taken as 0.45 seconds (Saunier et al., 2011). Therefore, a pulse
load of 1 kN lasting 0.45 seconds spaced at 0.75 m apart every half a second was
applied. On the plan view, the path of the walk was defined with a line through the
middle of the slab. Nodes were added at every 0.75 m which correspond to the stride
length. The first step was to define a time history function for the footfall. A new user-
defined function was added. Figure 5.7 shows this footfall pulse. The second step was
to define a separate load pattern for each footstep. After this step, the footfall loads
were assigned to different joints to define the walking path. Modal damping was also
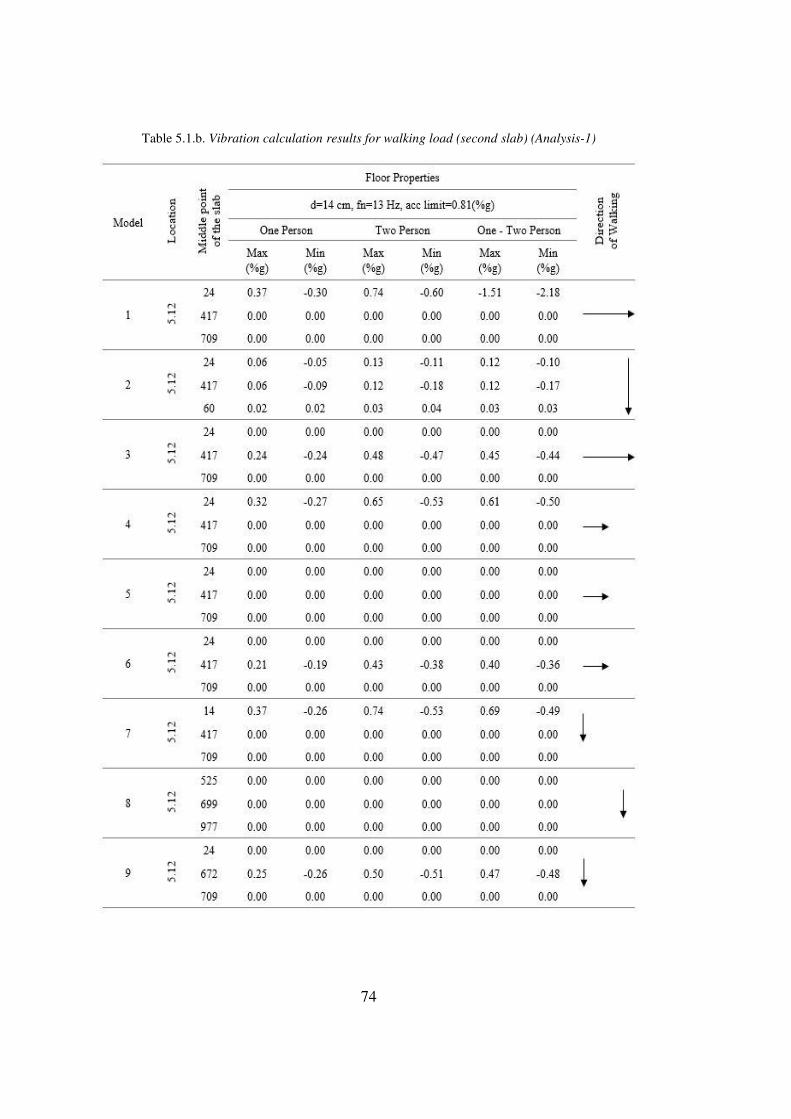
set 2 percent (see Table 4.1). The values obtained from the result of walking load
70
analysis are summarized in Table 5.1. Directions of walking on the floor system are
given in Figure 5.8.
Figure 5.7. Pulse loading (for every footstep (0.75m every 0.5s))

71
(a)
Figure 5.8. Different walking load paths

72
(b)
Figure 5.8. Different walking load paths (continued)

73
Table 5.1.a. Vibration calculation results for walking load (ground slab) (Analysis-1)
74
Table 5.1.b. Vibration calculation results for walking load (second slab) (Analysis-1)
75
5.1.3. AISC Calculations
In Turkey, there is no design guide provides design criteria for floor vibrations.
Therefore, the assessment will be produced in this part of the thesis according to the
AISC (2016) design guide. First, the system’s approximate peak acceleration ratio is
calculated and then compared with the threshold values to determine whether the
functionality of the vibration level is acceptable. The necessary parameters regarding
the vibration calculation in the guide are given below. The recommended values for
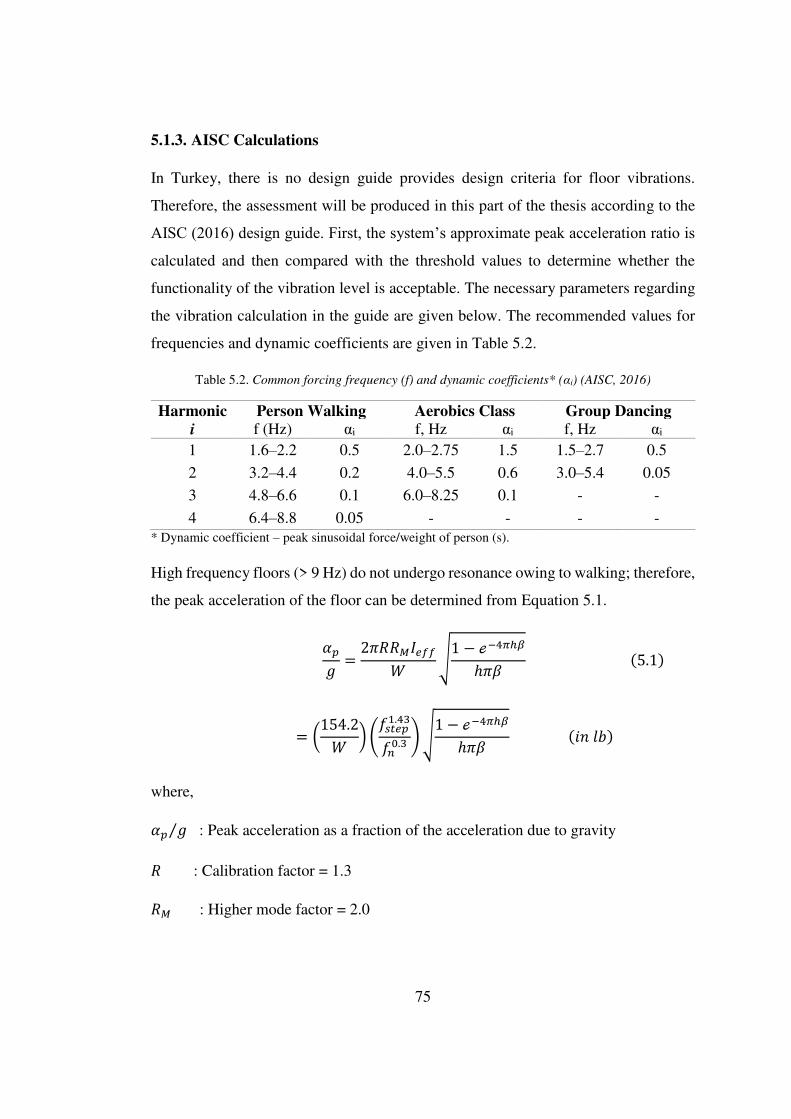
frequencies and dynamic coefficients are given in Table 5.2.
Table 5.2. Common forcing frequency (f) and dynamic coefficients* (αi) (AISC, 2016)
Harmonic
i
Person Walking Aerobics Class Group Dancing f (Hz) αi f, Hz αi f, Hz αi
1 1.6–2.2 0.5 2.0–2.75 1.5 1.5–2.7 0.5
2 3.2–4.4 0.2 4.0–5.5 0.6 3.0–5.4 0.05
3 4.8–6.6 0.1 6.0–8.25 0.1 - -
4 6.4–8.8 0.05 - - - -
* Dynamic coefficient – peak sinusoidal force/weight of person (s).
High frequency floors (> 9 Hz) do not undergo resonance owing to walking; therefore,
the peak acceleration of the floor can be determined from Equation 5.1.
𝛼𝑝𝑔 = 2𝜋𝑅𝑅𝑀𝐼𝑒𝑓𝑓𝑊 √1 − ℯ−4𝜋ℎ𝛽ℎ𝜋𝛽 (5.1)
= (154.2𝑊 ) (𝑓𝑠𝑡𝑒𝑝1.43𝑓𝑛0.3 ) √1 − ℯ−4𝜋ℎ𝛽ℎ𝜋𝛽 (𝑖𝑛 𝑙𝑏)
where, 𝛼𝑝 𝑔⁄ : Peak acceleration as a fraction of the acceleration due to gravity 𝑅 : Calibration factor = 1.3 𝑅𝑀 : Higher mode factor = 2.0
76
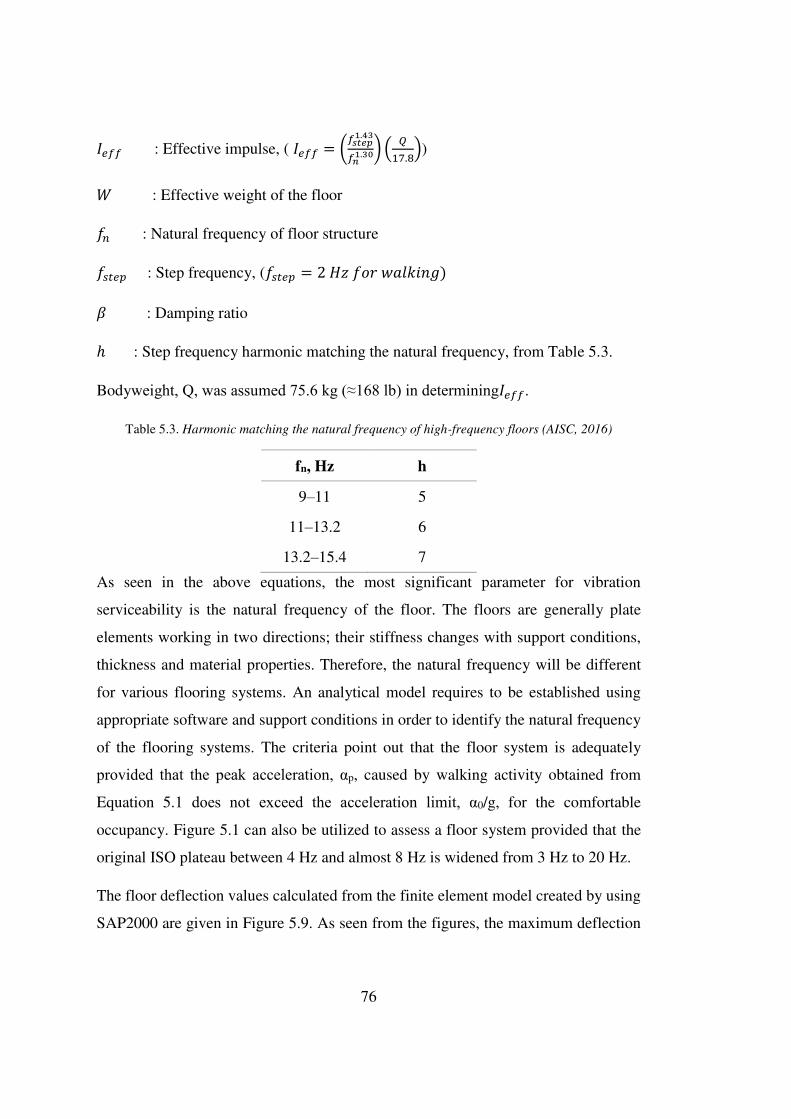
𝐼𝑒𝑓𝑓 : Effective impulse, ( 𝐼𝑒𝑓𝑓 = (𝑓𝑠𝑡𝑒𝑝1.43𝑓𝑛1.30) ( 𝑄17.8))
𝑊 : Effective weight of the floor 𝑓𝑛 : Natural frequency of floor structure 𝑓𝑠𝑡𝑒𝑝 : Step frequency, (𝑓𝑠𝑡𝑒𝑝 = 2 𝐻𝑧 𝑓𝑜𝑟 𝑤𝑎𝑙𝑘𝑖𝑛𝑔) 𝛽 : Damping ratio ℎ : Step frequency harmonic matching the natural frequency, from Table 5.3.
Bodyweight, Q, was assumed 75.6 kg (≈168 lb) in determining𝐼𝑒𝑓𝑓.
Table 5.3. Harmonic matching the natural frequency of high-frequency floors (AISC, 2016)
fn, Hz h
9–11 5
11–13.2 6
13.2–15.4 7
As seen in the above equations, the most significant parameter for vibration
serviceability is the natural frequency of the floor. The floors are generally plate
elements working in two directions; their stiffness changes with support conditions,
thickness and material properties. Therefore, the natural frequency will be different
for various flooring systems. An analytical model requires to be established using
appropriate software and support conditions in order to identify the natural frequency
of the flooring systems. The criteria point out that the floor system is adequately
provided that the peak acceleration, αp, caused by walking activity obtained from
Equation 5.1 does not exceed the acceleration limit, α0/g, for the comfortable
occupancy. Figure 5.1 can also be utilized to assess a floor system provided that the
original ISO plateau between 4 Hz and almost 8 Hz is widened from 3 Hz to 20 Hz.
The floor deflection values calculated from the finite element model created by using
SAP2000 are given in Figure 5.9. As seen from the figures, the maximum deflection
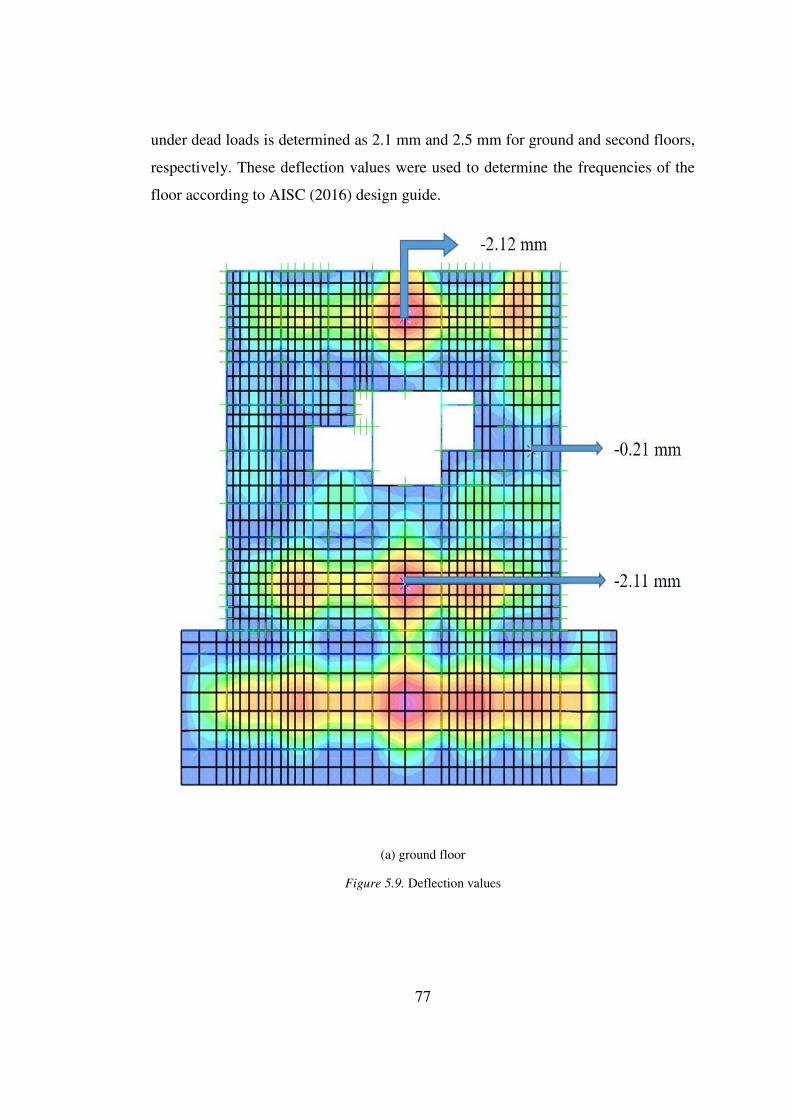
77
under dead loads is determined as 2.1 mm and 2.5 mm for ground and second floors,
respectively. These deflection values were used to determine the frequencies of the
floor according to AISC (2016) design guide.
(a) ground floor
Figure 5.9. Deflection values

78
(b) second floor
Figure 5.9. Deflection values (continued)
The load at floors are calculated as below;
Floor: 0.14 m × 2.5 t/m3 = 0.35 t/m2
Levelling: 0.05 m × 2.2 t/m3 = 0.11 t/m2
Cladding: 0.02 m × 2.7 t/m3 = 0.054 t/m2
Plaster: 0.02 m × 2.0 t/m3 = 0.04 t/m2
Total weight: 0.554 t/m2 × 4.45 m × 4.80 m = 11.83 t (for ground and second floors)

79
When the deflection value acquired from the analytical model is substituted in
Equation 5.2., the corresponding frequencies of the floor system becomes:
𝑓𝑛 = 0,18√𝑔𝛥 = 0,18√ 𝑔2.12 = 12.2 𝐻𝑧 (5.2.1)
𝑓𝑛 = 0,18√𝑔∆ = 0,18√ 𝑔2.54 = 11.2 𝐻𝑧 (5.2.2)
These frequencies were similar to those from the Fourier analysis of the vertical
acceleration. After determining the natural frequency and floor load, the acceleration
ratio is calculated from Equation 5.1. For this case, the following values for the floor
are utilized;
d = 140 mm (thickness of slabs)
For ground floor (one person):
Natural frequency of the slab: fn = 12.2 Hz
Step frequency: fstep = 2.0 Hz
Recommended limit value: α0/g = 0.76
Bodyweight: Q = 75.6 kg (≈168 lb)
Weight of the slab: W = 118.3 kN (≈26595 lb)
Damping ratio: β = 0.02
Step frequency harmonic matching: h = 6
𝛼𝑝𝑔 = ( 154.226595) ( 21.4312.20.3) √1 − ℯ−4𝜋∗6∗0.026 ∗ 𝜋 ∗ 0.02
𝛼𝑝𝑔 = 0.0106

80
The calculated peak acceleration is greater than the acceleration limit of 0.0076 g,
obtained from Figure 5.1. This indicated that the floor does not satisfy vibration
requirements.
The case for one person in the second floor leads to:
Natural frequency of the slab: fn = 11.2 Hz
Step frequency: fstep = 2.0 Hz
Recommended limit value: α0/g = 0.70
𝛼𝑝𝑔 = ( 154.226595) (2.01.4311.20.3) √1 − ℯ−4𝜋∗6∗𝛽6 ∗ 𝜋𝛽
𝛼𝑝𝑔 = 0.0109 For this case, the peak acceleration is greater than the acceleration limit of 0.0070 g,
extracted from Figure 5.1. Therefore, the second floor vibration level is also above the
limit.
As a result of the calculations made according to AISC (2016), the floor acceleration
ratios due to human movements were determined as 0.011 g for one person. As shown
in Figure 5.1, 0.0076 g and 0.0070 g acceleration ratios are limit values for frequencies
of 12.2 Hz and 11.2 Hz, respectively, when the slab is used as an office. When this
situation is considered, it is concluded that neither one of the flooring systems satisfies
the vibration criteria required in office type buildings under the situation for one
walking person.
5.2. Reduction of Floor Vibration by Stiffening the Slabs
The results obtained from the analytical model reveal that the floor acceleration values
for the examined slabs do not satisfy the limit values for two or more walking people.
Therefore, to keep them below the thresholds the floors need to be made stiffer. A
simple option to ensure this can be to increase the thickness of the slabs. The floor
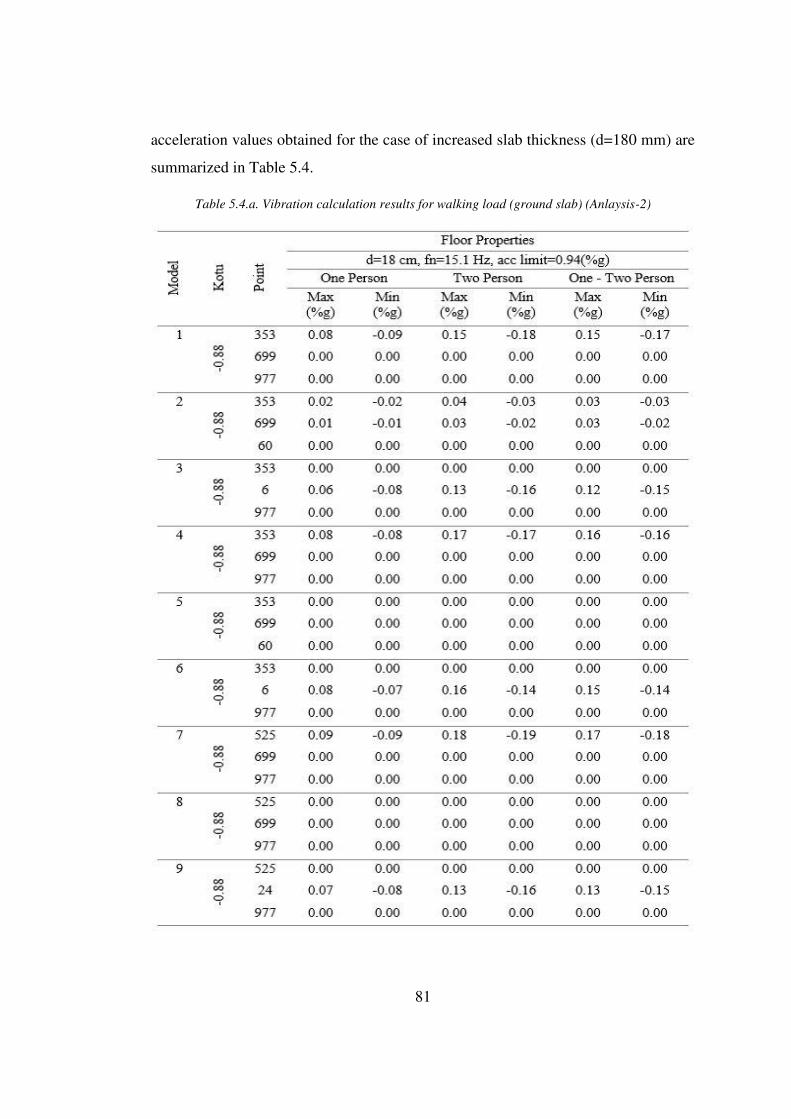
81
acceleration values obtained for the case of increased slab thickness (d=180 mm) are
summarized in Table 5.4.
Table 5.4.a. Vibration calculation results for walking load (ground slab) (Anlaysis-2)
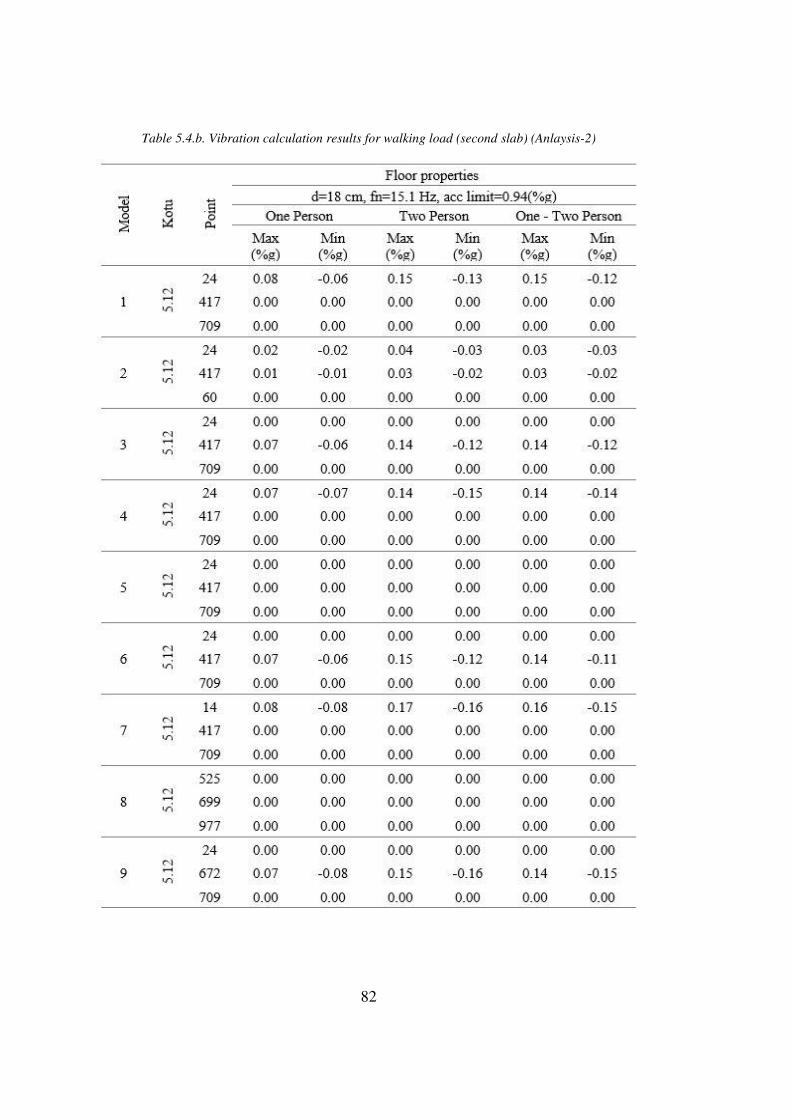
82
Table 5.4.b. Vibration calculation results for walking load (second slab) (Anlaysis-2)
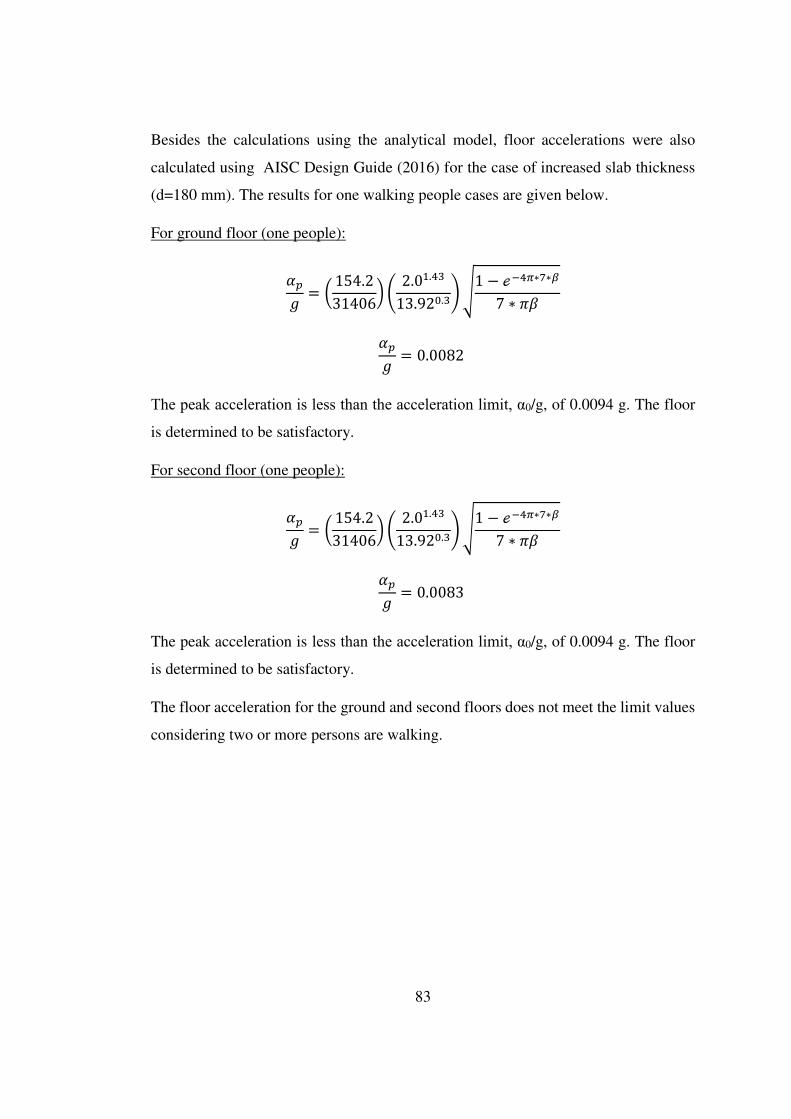
83
Besides the calculations using the analytical model, floor accelerations were also
calculated using AISC Design Guide (2016) for the case of increased slab thickness
(d=180 mm). The results for one walking people cases are given below.
For ground floor (one people):
𝛼𝑝𝑔 = ( 154.231406) ( 2.01.4313.920.3) √1 − ℯ−4𝜋∗7∗𝛽7 ∗ 𝜋𝛽
𝛼𝑝𝑔 = 0.0082 The peak acceleration is less than the acceleration limit, α0/g, of 0.0094 g. The floor
is determined to be satisfactory.
For second floor (one people):
𝛼𝑝𝑔 = ( 154.231406) ( 2.01.4313.920.3) √1 − ℯ−4𝜋∗7∗𝛽7 ∗ 𝜋𝛽
𝛼𝑝𝑔 = 0.0083 The peak acceleration is less than the acceleration limit, α0/g, of 0.0094 g. The floor
is determined to be satisfactory.
The floor acceleration for the ground and second floors does not meet the limit values
considering two or more persons are walking.

84
5.3. Discussion of Results
As a result of the calculations both AISC (2016) and the analytical model, the
estimated peak acceleration ratio due to human movement were compared with the
limits. The floor acceleration limit value for office buildings is 0.005 g in the 4–8 Hz
range. The frequencies of the floors that we examined were calculated as 12.2 Hz and
11.2 Hz so the limit values of acceleration ratio for these frequencies values were
determined as 0.0076 g and 0.0070 g, respectively. In this case, the existing floor
system was found to not meet the serviceability conditions for the case of two or less
walking people. Therefore, the floors should be made stiffer to mitigate vibration
effects and keep them below limit values. Increasing the thickness of floor can be an
alternative solution. However, while this process is made, considering the weakness
of the beams in the system, strengthening of the beams was also recommended for this
building. In the case of increased slab thickness, it was seen that the new floor system
is more convenient for the examined office building.

85
CHAPTER 6
6. CONCLUSION
6.1. Introduction
In this study, ambient vibration records were used to estimate the dynamic properties
of the building and to determine the acceleration of the floor on the ground and second
floors. In addition, the results from both the finite element analyses and measurements
were compared with the limits given in AISC Vibrations of Steel-Framed Structural
Systems Due to Human Activity Design Guide Series-11 (2016) to determine whether
the building satisfies floor vibration requirements. Due to the flexible floor system, it
has been observed that permissible floor vibration levels have been exceeded in the
current building. The floor vibration levels were shown to reduce when slabs were
made stiffer.
6.2. Conclusion
In this study, a six-story reinforced concrete office building in Ankara, Turkey was
investigated. The dynamic properties (natural frequencies, mode shapes, damping
ratios) were determined by using experimental and theoretical modal analysis
methods. When the results were considered, it was seen that there were some
differences between the analytical model and the experimental results. The exterior
infill walls represented through diagonal strut elements were added to the analytical
model, considering that these differences were due to the inadequate of the stiffness.
The modulus of elasticity and dimensions of these elements were also evaluated
according to various regulations such as TEC (2007), FEMA 356 (2000), Eurocode 6
(2005). The fist mode in the Y direction was found the same as that obtained from
experimental measurements. Also, it was seen that there was an improvement in other
modes as well. As a result, information about the dynamic characteristics of the

86
structure and the current state of the structure were identified using ambient vibration
records. Furthermore, a more accurate analytical model of existing buildings was
obtained using these records.
Vibration analysis of the ground and second floor slabs of the investigated building
were performed, and the suitability of these slabs was investigated according to the
vibration limit values given in the literature. According to the AISC Steel Design
Guide Series-11, the acceleration of the vibration movement occurred in the slabs
under the effect of walking people was found as 1.06 and 1.09 percent of g,
respectively, for one person. These values increased as the number of existing people
increased on the slabs and they exceeded the limit values of 0.76 (for ground floor)
and 0.70 (for second floor) percent of g. Therefore, these slabs were found to be
inconvenient for office buildings in terms of floor vibrations. Hence, thickness of the
slabs should be increased in order to mitigate vibration impacts and keep them under
the limit values. After increasing the slab thickness it was shown that the value of
vibration acceleration was below the limit values.

87
REFERENCES
AISC, Steel Design Guide Series-11, 2016, Vibrations of Steel-Framed Structural
Systems Due to Human Activity, American Institute of Steel Construction,
Chicago, IL.
Allen, D. E., 1990, Building Vibration from Human Activities, Concrete International:
Design & Construction, 12(6), 66-73.
Allen, D. E., and Rainer, J. H., 1976, Vibration Criteria for Long-Span Floors,
Canadian Journal of Civil Engineering, 3(2), 165-173.
Allen, D. E., Murray, T. M., 1993, Design Criterion for Vibrations Due to Walking,
Engineering Journal, AISC, 30 (4), 117-129.
ARTeMIS Extractor, 2019, Structural Vibration Solutions A/S, NOVI Science Park,
Niels Jernes Vej 10, DK-9220 Alborg East, Denmark
Arup, O., 2004, Hospital Floor Vibration Study, Comparison of Possible Hospital
Floor Structures with Respect to NHs Vibration Criteria, London.
ASCE, 2000, FEMA 356 Prestandard and Commentary for the Seismic Rehabilitation
of Buildings, ASCE for the Federal Emergency Management Agency,
Washington, D.C., November.
Bachmann, H., and Ammann, W., 1987, Vibrations in structures induced by man and
machines, Structural Engineering Document No.3e, International Association
for Bridge and Structural Engineering (IABSE), Zürich, Switzerland.
Baspolat, E., Bayraktar, A., Başağa, H. B., Türker, T., 2013, Deriner Beton Kemer
Barajının Deneysel Dinamik Özelliklerinin Belirlenmesi, 2nd Türkiye Deprem
Mühendisliği ve Sismoloji Konferansı, Hatay, Türkiye, 1-10.
Bayülke, N., 2003. Betonarme yapının dolgu duvarı, TMH, 426/4.
88
Brincker, R., Zhang, L., Andersen, P., 2000, Modal Identification from Ambient
Responses using Frequency Domain Decomposition, 18th International Modal
Analysis Conference, San Antonio, USA, 4062, 625-630.
Brincker, R., Zhang, L., Andersen, P., 2001, Modal identification of output-only
systems using frequency domain decomposition, Smart Materials and
Structures, 10, 441-445.
Carder, D. S., 1936, Observed Vibrations of Buildings, Bulletin of the Seismological
Society of America, 26, 245-277.
Celebi, M., 2013, Seismic Monitoring of Structures and New Developments,
Earthquake and Health Monitoring of Civil Structures.
Celebi, M., and Safak, E., 1991, Seismic Response of Transamerica Building I: Data
and Preliminary Analysis, J. Struct. Eng., 117(8), 2389-2404.
Celik, O. C., Sucuoglu, H., Akyuz, U., 2015, Forced Vibration Testing and Finite
Element Modeling of a Nine-Story Reinforced Concrete Flat Plate-Wall
Building, Earthquake Spectra, 31, 1069-1081.
Celik, O.C., 2016. Effect of AAC Infill Walls on Structural System Dynamics of a
Concrete Building, Journal of Earthquake Engineering, 20:5, 738-748.
CEN, 2005, Eurocode 6: design of masonry structures – part 1-1: common rules for
reinforced and unreinforced masonry structures, EN 1996-1-1:2005, Brussles.
Chopra, A. K., 1995, Dynamics of Structures, Prentice Hall, Upper Saddle River, New
Jersey.
Chrysostomou, C.Z., and Asteris, P.G., 2012. On the in-plane properties and capacities
of infilled frames, Engineering Structures, 41,385-402.
Chung, L., Park, T., Woo, S. S., 2016, Vertical Shaking Accident and Cause
Investigation of 39story Office Building, Journal of Asian Architecture and
Building Engineering, 15 (3), 619-625.

89
Clinton, J. F., Bradford, S. C., Heaton, T. H., Favela, J., 2006, The Observed Wander
of the Natural Frequencies in a Structure, Bulletin of the Seismological of
America, 96(1), 237-257.
Crawford, R., Ward, H. S., 1964, Determination of the Natural Periods of Building,
Bulletin of the Seismological Society of America. 54, 1743-1756.
CSI, 2019, CSI Analysis Reference Manual for SAP2000, Computers and Structures,
Inc., Berkeley, California.
Cunha, A., and Caetano, E., 2005, From Input-Output to Output-Only Modal
Identification of Civil Engineering Structures, IOMAC, Denmark.
Davenny, B., 2010, Footfall Induced Vibrations Healthcare Facilities, Health Care
DesignMagazine,https://www.healthcaredesignmagazine.com/architecture/fo
otfall-induced-vibrations-healthcare-facilities. Retrieved Date: 23 March
2014, time: 2.54 pm
Debney, P., and Willford, M., 2009, Footfall Vibration and Finite Element Analysis,
Sound & Vibration, 11-14.
Dhanasekar, M., and Page, A. W., 1986, The influence of brick masonry infill
properties on the behavior of infilled frames, Proc. Instn Civ. Engrs., Part 2,
81, 593-605.
Foutch, D. A., Housner, G. W., Jennings, P. C., 1975, Dynamic Responses of Six
Multistory Buildings During the San Fernando Earthquake, California Institute
of Technology Earthquake Engineering Research Laboratory, Report No.
EERL 75-02. Pasadena, California.
Gajalakshmi, G., Mohaideen, J. A., Kumar, A. R. S., 2015, Analysis of Harmonic
Behavior of Human Rhythmic Activity in A RCC Roof Slab, International
Journal of Innovative Science, Engineering & Technology, 2 (5), 628-636.
90
Gentile, C., and Sais, A., 2007, Ambient Vibration Testing of Historic Masonry
Towers for Structural Identification and Damage Assessment, Journal of
Construction and Building Materials, 21, 1311-1321.
Guralp Systems, 2009, Data Acquisition System User Manual, England.
ISO, 1989, Evaluation of Human Exposure to Whole-Body Vibration-Part:2: Human
Exposure to Continuous and Shock-Induced Vibration in Buildings (1 to 80
Hz), ISO 2631-2, International Standards Organization, Geneva, Switzerland.
Ivanovic, S. S., Trifunac, M. D., Novikova, E. I., Gladkov, A. A., Todorovska, M. I.,
2000, Ambient Vibration Tests of a Seven Story Reinforced Concrete Building
in Van Nuys, California, Damaged by the 1994 Northridge Earthquake, Soil
Dynamics and Earthquake Engineering, 19, 391-411.
Jacobsen, N. J., Andersen, P., Brincker, R., (2006), Using Enhanced Frequency
Domain Decomposition as a Robust Technique to Harmonic Excitation in
Operational Modal Analysis, Proceedings of ISMA2006: International
Conference on Noise & Vibration Engineering, Leuven, Belgium.
Japan Institute of Architects and Japan Aseismic Safety Organization, Earthquake-
resistant Design for Architects, Revised edition, 2015.
Kumar, P., and Kumar, A., 2014, Human Induced Vıbration in Structures, Int. J. Mech.
Eng. & Rob. Res., 1 (1), 44-54.
Lee, P. J., Lee, B. K., Griffin, M. J., 2015, Evaluation of Floor Vibrations Induced by
Walking Barefoot in Heavyweight Buildings, Acta Acustica united with
Acustica, 101(6), 1199-1210, November.
Lenzen, K. H., 1966, Vibration of Steel Joist-Concrete Slab Floors, Engineering
Journal, AISC, 3, 133-136.
91
Li, W. W., Wong, C. T., Leung, M. K., Fung, S. C., 2011, Floor Vibration due to
Human Rhythmic Activities: Tin Shui Wai Public Library Cum Indoor
Recreation Centre, Procedia Engineering, 14, 3285-3292.
Magalhaes, F., Brincker, R., Cunha, A., 2010, Damping Estimation Using Free
Decays and Ambient Vibration Tests, Mechanical Systems and Signal
Processing, 24(5), 1274-1290
Mainstone, R. J., and Weeks, G. A., 1970, The influence of a bounding frame on the
racking stiffness and strengths of brick walls, Proc. 2nd Int. Conf. on Brick
Masonry, Stoke-on-Trent, England, 165-171.
Mehrabi, A.B., Shing, P.B., Schuller, M.P., Noland, J.L., 1996. Experimental
evaluation of masonry-infilled RC frames, Journal of Structural Engineering,
122(3), 228-237.
Michel, C., Gueguen, P., Bard, P. Y., 2008, Dynamic parameters of structures
extracted from ambient vibration measurements: an aid for the seismic
vulnerability assessment of existing buildings in moderate seismic hazard
region, Soil Dynamics and Earthquake Engineering, 28(8), 593-604.
Murray, T. M., 1981, Acceptability Criterion for Occupant-Induced Floor Vibrations,
Engineering Journal, AISC, 18, 62-70.
Murray, T. M., 1991, Building Floor Vibrations, Engineering Journal, AISC, 28, 102-
109.
Murray, T. M., 2001, Tips for Avoiding Office Building Floor Vibration, Modern
Steel Construction.
Naeim, F., 1991, Design Practice to Prevent Floor Vibrations, Structural Steel
Educational Council, Technical Information and Product Service, California,
USA.

92
Rea, D., and Bouwkamp, J. G., 1971, Dynamic Properties of Timber School Buildings,
Bulletin of the Seismological Society of America, 4 (61), 961-974.
Reiher, H., and Meister, F. J., 1931, The effect of Vibration on People, Translated
from Forsch. Geb. Ing. Wes: 2(11) 381-6, by U.S. Air Material Command,
Translation F-TS-616-RE, Wright Field, Ohio, AMC, 1946.
Safak, E., and Cakti, E., 2014, Simple Techniques to Analyze Vibration Records from
Buildings, 7th European Workshop on Structural Health Monitoring, Nantes,
France.
Safak, E., and Celebi, M., 1990a, New Techniques in Record Analyses: Torsional
Vibrations, In Proceedings of the Fourth U. S. National Conference on
Earthquake Engineering, May 20-24, Palm Springs, California, 2, 411-420.
Sampaio, R. A., and Souza, R. M., 2015, Vibration Analysis of a Residential Building,
MATEC Web of Conference, 24, 09007.
Sanuier, N., El Husseini, A., Ismail, K., Morency, C., Auberlet, J. M., Sayed, T., 2011,
Pedestrian Stride Frequency and Length Estimation in Outdoor Urban
Environments using Video Sensors.
Sattar, S., and Liel, A.B., 2010. Seismic performance of reinforced concrete frame
structures with and without masonry infill walls, Proceedings of the 9th US
National and 10th Canadian Conference on Earthquake Engineering, Toronto,
Canada.
Shabbir, F., and Omenzetter, P., 2008, Forced Vibration Testing of a Thirteen Storey
Concrete Building, In Proceedings of the New Zealand Society for Earthquake
Engineering Annual Conference, New Zealand.
Skolnik, D., Lei, Y., Yu, E., Wallace, J. W., 2006, Identification, Model Updating,
and Response Prediction of an Instrumented 15-Story Steel-Frame Building,
Earthquake Spectra, 3 (22), 781-802.

93
Smith, V. K., and Korman, M. S., 2012, Floor Vibration Response to Irish Dancing,
The Journal of the Acoustical Society of America, 132 (3).
Soyoz, S., Taciroglu, E., Orakcal, K., Nigbor, R., Skolnik, D., Lus, H., Safak, E., 2013,
Ambient and Forced Vibration Testing of a Reinforced Concrete Building
before and after Its Seismic Retrofitting, Journal of Structural Engineering,
139(10), 1741-1752.
Stafford, S.B., and Carter, C., 1969. A method of analysis for infilled frames, ICE
Proceedings, 44(1), 31-48.
Trifunac, M. D., 1970a, Ambient Vibration Test of a 39-Story Steel Frame Building,
Report EERL 70-02, Earthq. Eng. Res. Lab., Calif. Institute of Tech.,
Pasadena, California, USA.
Trifunac, M. D., 1970b, Wind and Microtremors Induced Vibrations of a 22-Story
Steel Frame Building, Report EERL 70-011, Earthq. Eng. Res. Lab., Calif.
Institute of Tech., Pasadena, California, USA.
Trifunac, M. D., 1972, Comparison between Ambient and Forced Vibration
Experiments, Earthquake Engineering and Structural Dynamics, 1, 133-150.
Trifunac, M. D., Ivanovic, S. S., Todorovska, M. I., 2001, Apparent Periods of A
Building I: Fourier Analysis, Journal of Structural Engineering, 127 (5), 517-
526.
Turkish Earthquake Code, 2007, Ministry of Public Works and Settlement,
Specification for Structures to be Built in Disaster Areas, Government of
Republic of Turkey, Ankara.
Turkish Standards Institute, 2000, Requirements for Design and Construction of
Reinforced Concrete Structures, TS 500, Ankara, Turkey.
94
Udwadia, F. E., and Trifunac, M. D., 1973, Ambient Vibration Test of Full-Scale
Structure, Proc. 5th World Conference on Earthquake Engineering, Rome,
Italy.
Ventura, C. E., Finn, W. D. L., Lord, J. F., Fujita, N., 2003, Dynamic Characteristics
of a Base Isolated Building from Ambient Vibration Measurements and Low
Level Earthquake Shaking, Soil Dynamics and Earthquake Engineering, 23,
313-322.
Ventura, C. E., Laverick, B., Brincker, R., Andersen, P., 2003, Comparison of
Dynamic Characteristics of Two Instrumented Tall Buildings, In Proceedings
of IMAC-21: A Conference on Structural Dynamics, the Hyatt Orlando,
Kissimmee, Florida, 236-242.
Ventura, C. E., Lord, J. F., Simpson, R. D., 2002, Effective Use of Ambient Vibration
Measurements for Modal Updating of a 48 Storey Building in Vancouver,
Canada, International Conference on Structural Dynamic Modeling-Test,
Analysis, Correlation and Validation Instituto de Engenharia Macanica,
Madeira Island, Portugal.
Ventura, C.E., and Horyna, T., 2000, Measured and Calculated Modal Characteristics
of the Heritage Court Tower in Vancouver, B.C., INTERNATIONAL
MODAL ANALYSIS CCONFERENCE-XVIII: A Conference on Structural
Dynamics, 1070-1074.
Ward, H. S., and Crawford, R., 1966, Wind Induced Vibrations and Building Modes,
Bulletin of the Seismological Society of America, 50, 793-813.
Yu, E., Skolnik, D., Whang, D. H., Wallace, J. W., 2008, Forced Vibration Testing of
a Four-Story Reinforced Concrete Building, Earthquake Spectra, 4 (24), 969-
995.
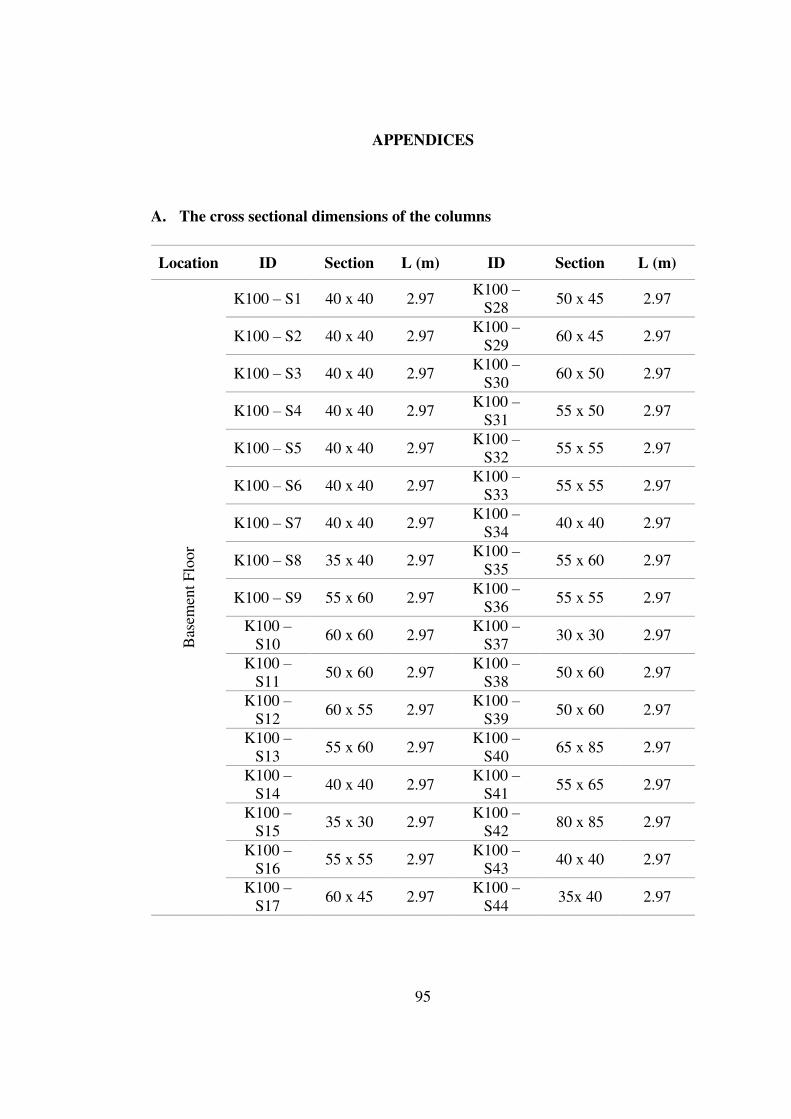
95
APPENDICES
A. The cross sectional dimensions of the columns
Location ID Section L (m) ID Section L (m)
Bas
emen
t F
loor
K100 – S1 40 x 40 2.97 K100 –
S28 50 x 45 2.97
K100 – S2 40 x 40 2.97 K100 –
S29 60 x 45 2.97
K100 – S3 40 x 40 2.97 K100 –
S30 60 x 50 2.97
K100 – S4 40 x 40 2.97 K100 –
S31 55 x 50 2.97
K100 – S5 40 x 40 2.97 K100 –
S32 55 x 55 2.97
K100 – S6 40 x 40 2.97 K100 –
S33 55 x 55 2.97
K100 – S7 40 x 40 2.97 K100 –
S34 40 x 40 2.97
K100 – S8 35 x 40 2.97 K100 –
S35 55 x 60 2.97
K100 – S9 55 x 60 2.97 K100 –
S36 55 x 55 2.97
K100 –
S10 60 x 60 2.97
K100 –
S37 30 x 30 2.97
K100 –
S11 50 x 60 2.97
K100 –
S38 50 x 60 2.97
K100 –
S12 60 x 55 2.97
K100 –
S39 50 x 60 2.97
K100 –
S13 55 x 60 2.97
K100 –
S40 65 x 85 2.97
K100 –
S14 40 x 40 2.97
K100 –
S41 55 x 65 2.97
K100 –
S15 35 x 30 2.97
K100 –
S42 80 x 85 2.97
K100 –
S16 55 x 55 2.97
K100 –
S43 40 x 40 2.97
K100 –
S17 60 x 45 2.97
K100 –
S44 35x 40 2.97
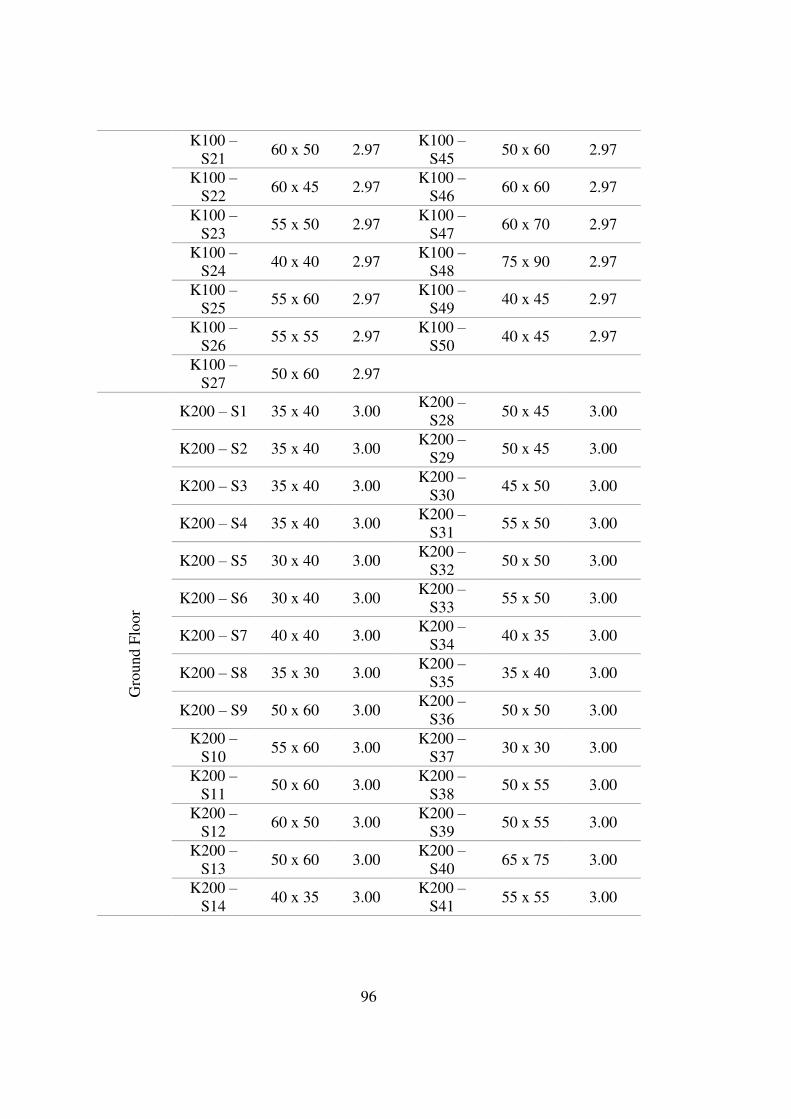
96
K100 –
S21 60 x 50 2.97
K100 –
S45 50 x 60 2.97
K100 –
S22 60 x 45 2.97
K100 –
S46 60 x 60 2.97
K100 –
S23 55 x 50 2.97
K100 –
S47 60 x 70 2.97
K100 –
S24 40 x 40 2.97
K100 –
S48 75 x 90 2.97
K100 –
S25 55 x 60 2.97
K100 –
S49 40 x 45 2.97
K100 –
S26 55 x 55 2.97
K100 –
S50 40 x 45 2.97
K100 –
S27 50 x 60 2.97
Gro
und F
loor
K200 – S1 35 x 40 3.00 K200 –
S28 50 x 45 3.00
K200 – S2 35 x 40 3.00 K200 –
S29 50 x 45 3.00
K200 – S3 35 x 40 3.00 K200 –
S30 45 x 50 3.00
K200 – S4 35 x 40 3.00 K200 –
S31 55 x 50 3.00
K200 – S5 30 x 40 3.00 K200 –
S32 50 x 50 3.00
K200 – S6 30 x 40 3.00 K200 –
S33 55 x 50 3.00
K200 – S7 40 x 40 3.00 K200 –
S34 40 x 35 3.00
K200 – S8 35 x 30 3.00 K200 –
S35 35 x 40 3.00
K200 – S9 50 x 60 3.00 K200 –
S36 50 x 50 3.00
K200 –
S10 55 x 60 3.00
K200 –
S37 30 x 30 3.00
K200 –
S11 50 x 60 3.00
K200 –
S38 50 x 55 3.00
K200 –
S12 60 x 50 3.00
K200 –
S39 50 x 55 3.00
K200 –
S13 50 x 60 3.00
K200 –
S40 65 x 75 3.00
K200 –
S14 40 x 35 3.00
K200 –
S41 55 x 55 3.00

97
K200 –
S15 35 x 30 3.00
K200 –
S42 70 x 75 3.00
K200 –
S16 50 x 55 3.00
K200 –
S43 40 x 35 3.00
K200 –
S17 50 x 45 3.00
K200 –
S44 35 x 40 3.00
K200 –
S21 50 x 45 3.00
K200 –
S45 40 x 40 3.00
K200 –
S22 50 x 45 3.00
K200 –
S46 40 x 40 3.00
K200 –
S23 55 x 50 3.00
K200 –
S47 40 x 40 3.00
K200 –
S24 40 x 40 3.00
K200 –
S48 40 x 60 3.00
K200 –
S25 35 x 40 3.00
K200 –
S49 40 x 35 3.00
K200 –
S26 50 x 50 3.00
K200 –
S50 40 x 40 3.00
K200 –
S27 45 x 50 3.00
Fir
st F
loor
K300 – S1 30 x 40 3.00 K300 –
S28 50 x 45 3.00
K300 – S2 50 x 45 3.00 K300 –
S29 50 x 45 3.00
K300 – S3 30 x 35 3.00 K300 –
S30 45 x 50 3.00
K300 – S4 30 x 35 3.00 K300 –
S31 50 x 45 3.00
K300 – S5 30 x 35 3.00 K300 –
S32 50 x 45 3.00
K300 – S6 27 x 35 3.00 K300 –
S33 50 x 50 3.00
K300 – S7 27 x 35 3.00 K300 –
S34 35 x 25 3.00
K300 – S8 30 x 30 3.00 K300 –
S35 30 x 30 3.00
K300 – S9 50 x 50 3.00 K300 –
S36 50 x 50 3.00
K300 –
S10 50 x 50 3.00
K300 –
S37 30 x 30 3.00
K300 –
S11 50 x 50 3.00
K300 –
S38 50 x 50 3.00
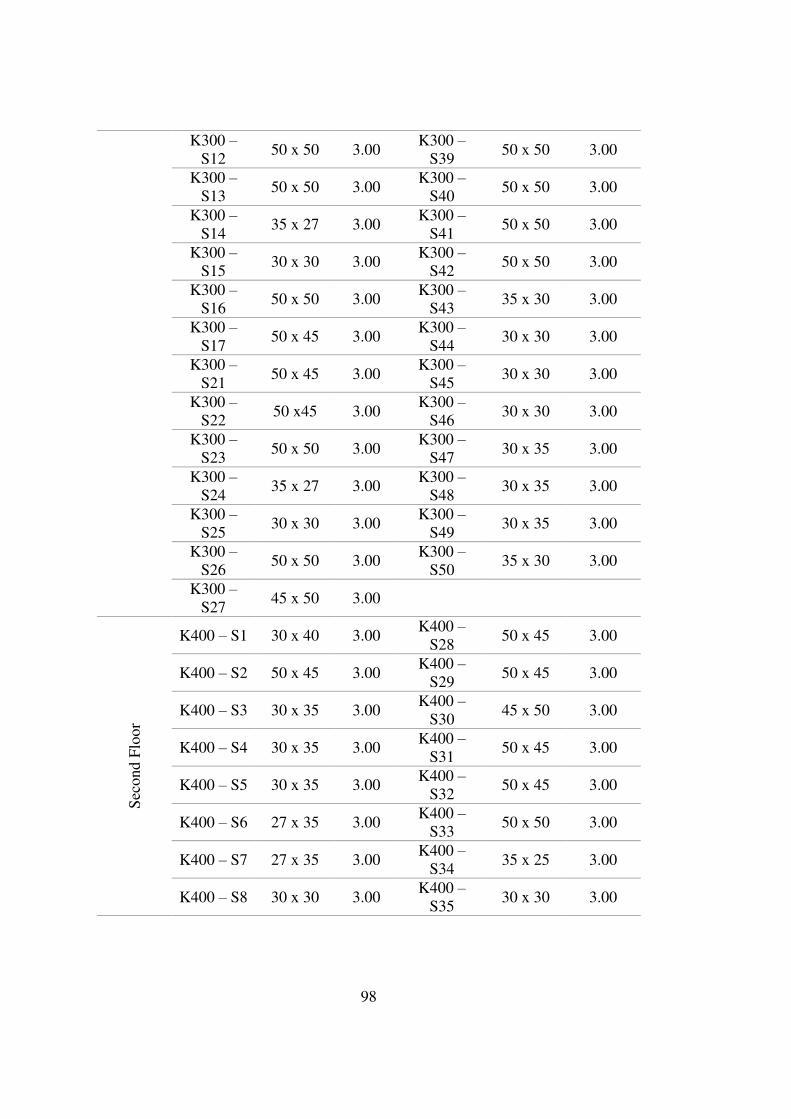
98
K300 –
S12 50 x 50 3.00
K300 –
S39 50 x 50 3.00
K300 –
S13 50 x 50 3.00
K300 –
S40 50 x 50 3.00
K300 –
S14 35 x 27 3.00
K300 –
S41 50 x 50 3.00
K300 –
S15 30 x 30 3.00
K300 –
S42 50 x 50 3.00
K300 –
S16 50 x 50 3.00
K300 –
S43 35 x 30 3.00
K300 –
S17 50 x 45 3.00
K300 –
S44 30 x 30 3.00
K300 –
S21 50 x 45 3.00
K300 –
S45 30 x 30 3.00
K300 –
S22 50 x45 3.00
K300 –
S46 30 x 30 3.00
K300 –
S23 50 x 50 3.00
K300 –
S47 30 x 35 3.00
K300 –
S24 35 x 27 3.00
K300 –
S48 30 x 35 3.00
K300 –
S25 30 x 30 3.00
K300 –
S49 30 x 35 3.00
K300 –
S26 50 x 50 3.00
K300 –
S50 35 x 30 3.00
K300 –
S27 45 x 50 3.00
Sec
ond F
loor
K400 – S1 30 x 40 3.00 K400 –
S28 50 x 45 3.00
K400 – S2 50 x 45 3.00 K400 –
S29 50 x 45 3.00
K400 – S3 30 x 35 3.00 K400 –
S30 45 x 50 3.00
K400 – S4 30 x 35 3.00 K400 –
S31 50 x 45 3.00
K400 – S5 30 x 35 3.00 K400 –
S32 50 x 45 3.00
K400 – S6 27 x 35 3.00 K400 –
S33 50 x 50 3.00
K400 – S7 27 x 35 3.00 K400 –
S34 35 x 25 3.00
K400 – S8 30 x 30 3.00 K400 –
S35 30 x 30 3.00
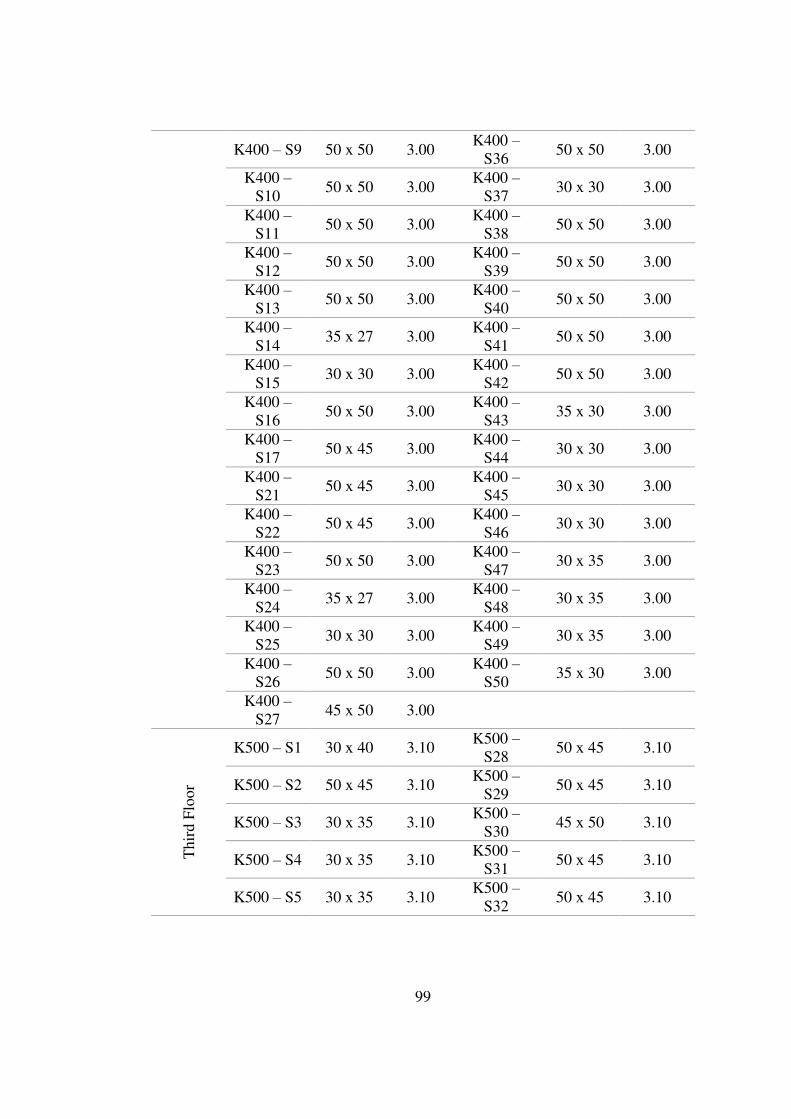
99
K400 – S9 50 x 50 3.00 K400 –
S36 50 x 50 3.00
K400 –
S10 50 x 50 3.00
K400 –
S37 30 x 30 3.00
K400 –
S11 50 x 50 3.00
K400 –
S38 50 x 50 3.00
K400 –
S12 50 x 50 3.00
K400 –
S39 50 x 50 3.00
K400 –
S13 50 x 50 3.00
K400 –
S40 50 x 50 3.00
K400 –
S14 35 x 27 3.00
K400 –
S41 50 x 50 3.00
K400 –
S15 30 x 30 3.00
K400 –
S42 50 x 50 3.00
K400 –
S16 50 x 50 3.00
K400 –
S43 35 x 30 3.00
K400 –
S17 50 x 45 3.00
K400 –
S44 30 x 30 3.00
K400 –
S21 50 x 45 3.00
K400 –
S45 30 x 30 3.00
K400 –
S22 50 x 45 3.00
K400 –
S46 30 x 30 3.00
K400 –
S23 50 x 50 3.00
K400 –
S47 30 x 35 3.00
K400 –
S24 35 x 27 3.00
K400 –
S48 30 x 35 3.00
K400 –
S25 30 x 30 3.00
K400 –
S49 30 x 35 3.00
K400 –
S26 50 x 50 3.00
K400 –
S50 35 x 30 3.00
K400 –
S27 45 x 50 3.00
Thir
d F
loor
K500 – S1 30 x 40 3.10 K500 –
S28 50 x 45 3.10
K500 – S2 50 x 45 3.10 K500 –
S29 50 x 45 3.10
K500 – S3 30 x 35 3.10 K500 –
S30 45 x 50 3.10
K500 – S4 30 x 35 3.10 K500 –
S31 50 x 45 3.10
K500 – S5 30 x 35 3.10 K500 –
S32 50 x 45 3.10

100
K500 – S6 27 x 35 3.10 K500 –
S33 50 x 50 3.10
K500 – S7 27 x 35 3.10 K500 –
S34 35 x 25 3.10
K500 – S8 30 x 30 3.10 K500 –
S35 30 x 30 3.10
K500 – S9 50 x 50 3.10 K500 –
S36 50 x 50 3.10
K500 –
S10 50 x 50 3.10
K500 –
S37 30 x 30 3.10
K500 –
S11 50 x 50 3.10
K500 –
S38 50 x 50 3.10
K500 –
S12 50 x 50 3.10
K500 –
S39 50 x 50 3.10
K500 –
S13 50 x 50 3.10
K500 –
S40 50 x 50 3.10
K500 –
S14 35 x 27 3.10
K500 –
S41 50 x 50 3.10
K500 –
S15 30 x 30 3.10
K500 –
S42 50 x 50 3.10
K500 –
S16 50 x 50 3.10
K500 –
S43 35 x 30 3.10
K500 –
S17 50 x 45 3.10
K500 –
S44 30 x 30 3.10
K500 –
S21 50 x 45 3.10
K500 –
S45 30 x 30 3.10
K500 –
S22 50 x 45 3.10
K500 –
S46 30 x 30 3.10
K500 –
S23 50 x 50 3.10
K500 –
S47 30 x 35 3.10
K500 –
S24 35 x 27 3.10
K500 –
S48 30 x 35 3.10
K500 –
S25 30 x 30 3.10
K500 –
S49 30 x 35 3.10
K500 –
S26 50 x 50 3.10
K500 –
S50 35 x 30 3.10
K500 –
S27 45 x 50 3.10
Fourt
h
Flo
or K600 – S1 30 x 40 2.60
K600 –
S28 50 x 45 2.60
K600 – S2 50 x 45 2.60 K600 –
S29 50 x 45 2.60
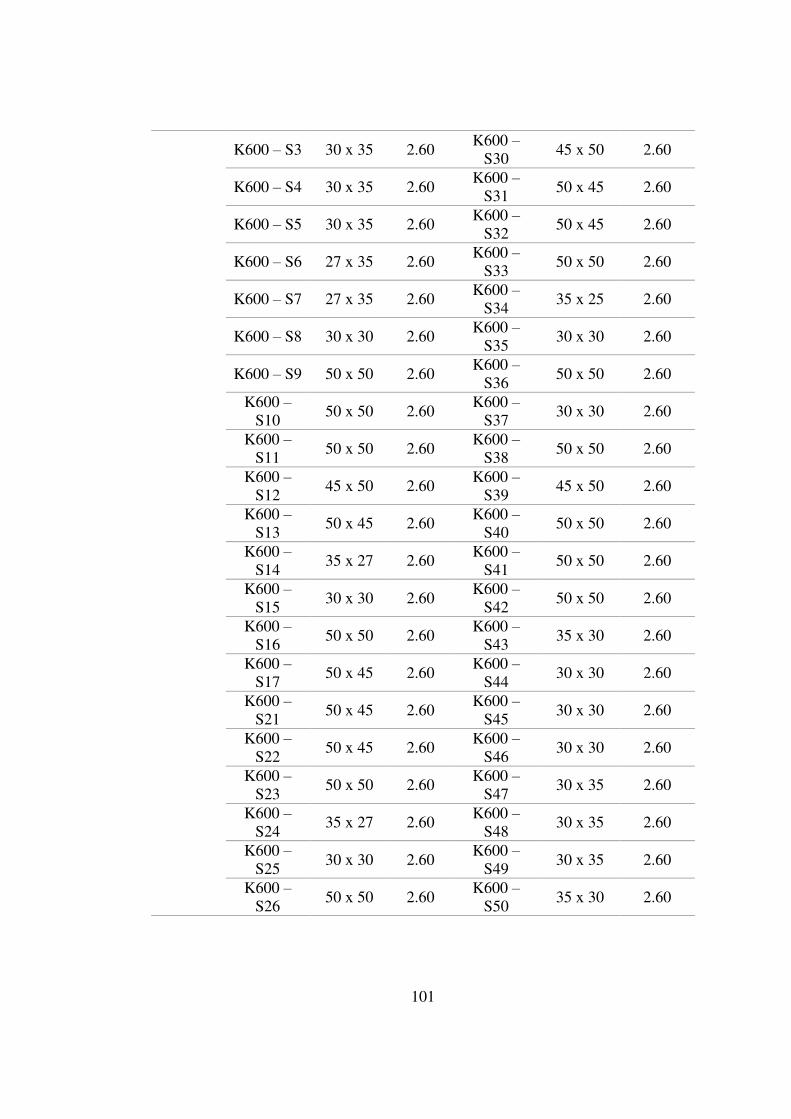
101
K600 – S3 30 x 35 2.60 K600 –
S30 45 x 50 2.60
K600 – S4 30 x 35 2.60 K600 –
S31 50 x 45 2.60
K600 – S5 30 x 35 2.60 K600 –
S32 50 x 45 2.60
K600 – S6 27 x 35 2.60 K600 –
S33 50 x 50 2.60
K600 – S7 27 x 35 2.60 K600 –
S34 35 x 25 2.60
K600 – S8 30 x 30 2.60 K600 –
S35 30 x 30 2.60
K600 – S9 50 x 50 2.60 K600 –
S36 50 x 50 2.60
K600 –
S10 50 x 50 2.60
K600 –
S37 30 x 30 2.60
K600 –
S11 50 x 50 2.60
K600 –
S38 50 x 50 2.60
K600 –
S12 45 x 50 2.60
K600 –
S39 45 x 50 2.60
K600 –
S13 50 x 45 2.60
K600 –
S40 50 x 50 2.60
K600 –
S14 35 x 27 2.60
K600 –
S41 50 x 50 2.60
K600 –
S15 30 x 30 2.60
K600 –
S42 50 x 50 2.60
K600 –
S16 50 x 50 2.60
K600 –
S43 35 x 30 2.60
K600 –
S17 50 x 45 2.60
K600 –
S44 30 x 30 2.60
K600 –
S21 50 x 45 2.60
K600 –
S45 30 x 30 2.60
K600 –
S22 50 x 45 2.60
K600 –
S46 30 x 30 2.60
K600 –
S23 50 x 50 2.60
K600 –
S47 30 x 35 2.60
K600 –
S24 35 x 27 2.60
K600 –
S48 30 x 35 2.60
K600 –
S25 30 x 30 2.60
K600 –
S49 30 x 35 2.60
K600 –
S26 50 x 50 2.60
K600 –
S50 35 x 30 2.60
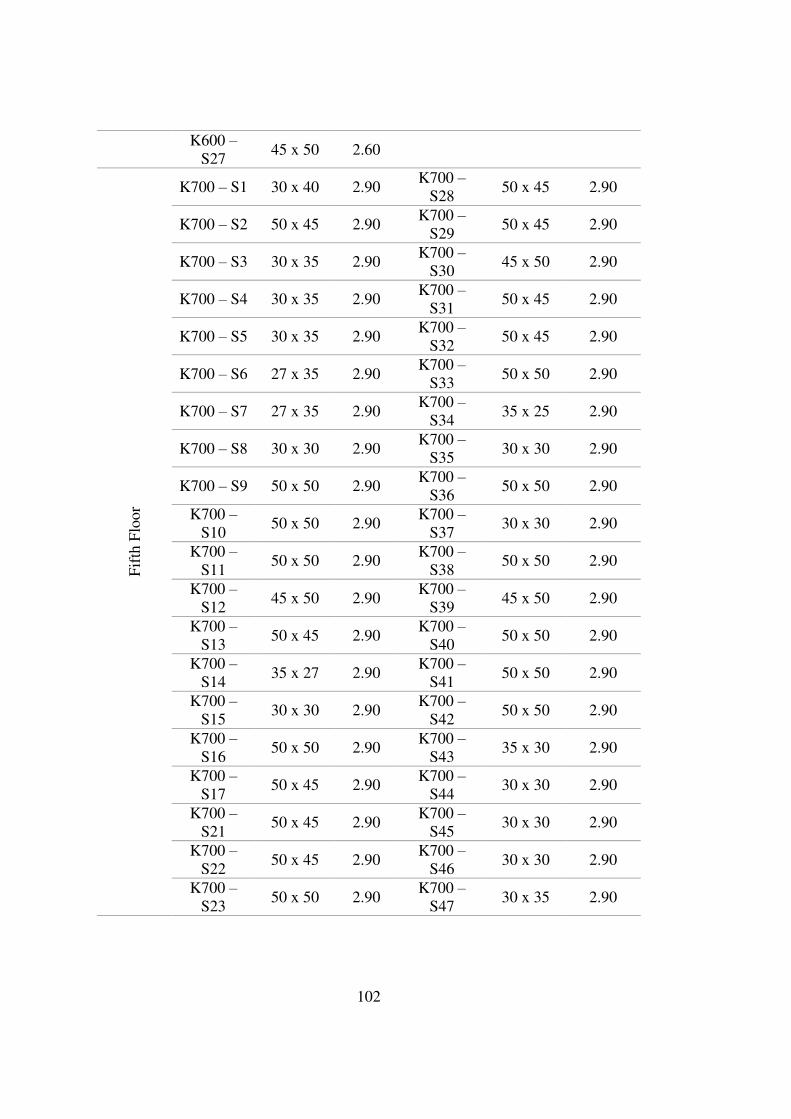
102
K600 –
S27 45 x 50 2.60
Fif
th F
loor
K700 – S1 30 x 40 2.90 K700 –
S28 50 x 45 2.90
K700 – S2 50 x 45 2.90 K700 –
S29 50 x 45 2.90
K700 – S3 30 x 35 2.90 K700 –
S30 45 x 50 2.90
K700 – S4 30 x 35 2.90 K700 –
S31 50 x 45 2.90
K700 – S5 30 x 35 2.90 K700 –
S32 50 x 45 2.90
K700 – S6 27 x 35 2.90 K700 –
S33 50 x 50 2.90
K700 – S7 27 x 35 2.90 K700 –
S34 35 x 25 2.90
K700 – S8 30 x 30 2.90 K700 –
S35 30 x 30 2.90
K700 – S9 50 x 50 2.90 K700 –
S36 50 x 50 2.90
K700 –
S10 50 x 50 2.90
K700 –
S37 30 x 30 2.90
K700 –
S11 50 x 50 2.90
K700 –
S38 50 x 50 2.90
K700 –
S12 45 x 50 2.90
K700 –
S39 45 x 50 2.90
K700 –
S13 50 x 45 2.90
K700 –
S40 50 x 50 2.90
K700 –
S14 35 x 27 2.90
K700 –
S41 50 x 50 2.90
K700 –
S15 30 x 30 2.90
K700 –
S42 50 x 50 2.90
K700 –
S16 50 x 50 2.90
K700 –
S43 35 x 30 2.90
K700 –
S17 50 x 45 2.90
K700 –
S44 30 x 30 2.90
K700 –
S21 50 x 45 2.90
K700 –
S45 30 x 30 2.90
K700 –
S22 50 x 45 2.90
K700 –
S46 30 x 30 2.90
K700 –
S23 50 x 50 2.90
K700 –
S47 30 x 35 2.90

103
K700 –
S24 35 x 27 2.90
K700 –
S48 30 x 35 2.90
K700 –
S25 30 x 30 2.90
K700 –
S49 30 x 35 2.90
K700 –
S26 50 x 50 2.90
K700 –
S50 35 x 30 2.90
K700 –
S27 45 x 50 2.90
B. The cross sectional dimensions of the shear walls
ID Section Opening L (m)
P1 – K100 285 x 25 125 2.97
P1 – K200 285 x 25 125 2.97
P1 – K300 285 x 25 125 2.97
P1 – K400 285 x 25 125 2.97
P1 – K500 285 x 25 125 2.97
P1 – K600 285 x 25 125 2.97
P1 – K700 285 x 25 125 2.97
P2 – K100 297 x 25 125 3.00
P2 – K200 297 x 25 125 3.00
P2 – K300 297 x 25 125 3.00
P2 – K400 297 x 25 125 3.00
P2 – K500 297 x 25 125 3.00
P2 – K600 297 x 25 125 3.00
P2 – K700 297 x 25 125 3.00
P3 – K100 354 x 25 125 3.00
P3 – K200 354 x 25 125 3.00
P3 – K300 354 x 25 125 3.00
P3 – K400 354 x 25 125 3.00
P3 – K500 354 x 25 125 3.00
P3 – K600 354 x 25 125 3.00
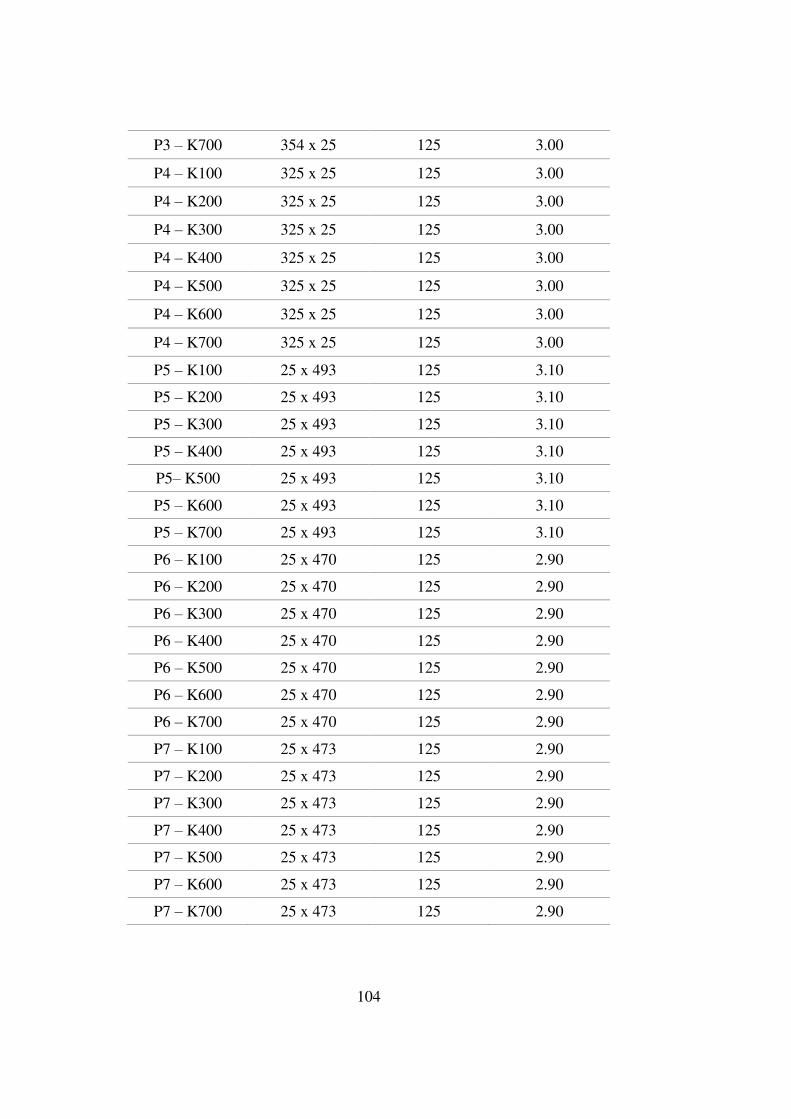
104
P3 – K700 354 x 25 125 3.00
P4 – K100 325 x 25 125 3.00
P4 – K200 325 x 25 125 3.00
P4 – K300 325 x 25 125 3.00
P4 – K400 325 x 25 125 3.00
P4 – K500 325 x 25 125 3.00
P4 – K600 325 x 25 125 3.00
P4 – K700 325 x 25 125 3.00
P5 – K100 25 x 493 125 3.10
P5 – K200 25 x 493 125 3.10
P5 – K300 25 x 493 125 3.10
P5 – K400 25 x 493 125 3.10
P5– K500 25 x 493 125 3.10
P5 – K600 25 x 493 125 3.10
P5 – K700 25 x 493 125 3.10
P6 – K100 25 x 470 125 2.90
P6 – K200 25 x 470 125 2.90
P6 – K300 25 x 470 125 2.90
P6 – K400 25 x 470 125 2.90
P6 – K500 25 x 470 125 2.90
P6 – K600 25 x 470 125 2.90
P6 – K700 25 x 470 125 2.90
P7 – K100 25 x 473 125 2.90
P7 – K200 25 x 473 125 2.90
P7 – K300 25 x 473 125 2.90
P7 – K400 25 x 473 125 2.90
P7 – K500 25 x 473 125 2.90
P7 – K600 25 x 473 125 2.90
P7 – K700 25 x 473 125 2.90

105
P8 – K100 25 x 477 125 2.90
P8 – K200 25 x 477 125 2.90
P8 – K300 25 x 477 125 2.90
P8 – K400 25 x 477 125 2.90
P8 – K500 25 x 477 125 2.90
P8 – K600 25 x 477 125 2.90
P8 – K700 25 x 477 125 2.90