Evaluation of Flame Lift of Length
14
J ournal of Ther mal Science and Technology Vol. 5, No. 2, 2010 238 Evaluation of the Flame Lift-off Length in Diesel Spray Combustion Based on Flame Extinction* Ulugbek AZIMOV**, Nobuyuki KAWAHARA**, Eiji TOMITA** and Kazuya TSUBOI** **Department of Mechanical Engineering, Okayama University , Tsushima –Naka 3, Okayama, 700-8530, Japan E-mail: uazimov2001@y ahoo.com Abstract The interaction of spray and combustion processes forms a complex system of physical phenomena undergoing in IC engines. Studying this interaction is important to determine strategies for simultaneously reducing soot and NOx emissions from diesel engines. Spray combustion interactions are evaluated by the flame lift-off length - the distance from the injector orifice to the location of hydroxyl luminescence closest to the injector in the flame jet. Various works have been dedicated to successful simulations of lifted flames of a diesel jet by use of various combustion modeling approaches. In this work, flame surface density and flamelet concepts were used to model the diesel lift-off length. Numerical studies have been performed with the ECFM3Z model and n-Heptane fuel to determine the flame lift-off length under quiescent conditions. The numerical results showed good agreement with experimental data, which were obtained from an optically accessible constant volume chamber and presented at the Engine Combustion Network (ECN) of Sandia National Laboratories. It was shown that at a certain distance downstream from the injector orifice, stoichiometric scalar dissipation rate matched the extinction scalar dissipation rate. This computed extinction scalar dissipation rate correlated well with the flame lift-off length. For the range of conditions investigated, adequate quantitative agreement was obtained with the experimental measurements of lift-off length under various ambient gas O 2 concentrations and ambient gas densities. Key words: Spray Combustion, Lift-off Length, ECFM3Z Model, Scalar Dissipation 1. Introduction The interaction of spray and combustion processes forms a complex system of physical phenomena whose time and length scales range over a wide spectrum. This inter action plays an important role in engine performance and exhaust emissions. The new combustion strategies focused on simultaneous reduction of NOx and soot emissions suggest that ignition timing is controlled to be delayed after the end of injection. Therefore, air in the combustion chamber can be properly utilized by optimizing the air-fuel mixing in the spray. To describe air-fuel mixing, the diesel flame lift-off length is evaluated. The lift-off length, as an indicator of local mixture formation, is the driving parameter for identifying the combustion rate and pollutant formation. Peters [1] conducted an extensive research on lift-off length. At the macroscopic level, this research indicates that the flame stabilization occurs along the stoichiometric mixture contour, at a location where a balance exist between *Received 10 June, 2010 (No. 10-0247) [DOI: 10.1299/jtst.5.238] Copyright © 2010 by JSME
-
Upload
aditya-gupta -
Category
Documents
-
view
218 -
download
0
Transcript of Evaluation of Flame Lift of Length
7/27/2019 Evaluation of Flame Lift of Length
http://slidepdf.com/reader/full/evaluation-of-flame-lift-of-length 1/14
Journal of Thermal Science and Technology
Vol. 5, No. 2, 2010
238
Evaluation of the Flame Lift-off Length
in Diesel Spray Combustion Based on
Flame Extinction*
Ulugbek AZIMOV**, Nobuyuki KAWAHARA**, Eiji TOMITA**
and Kazuya TSUBOI****Department of Mechanical Engineering, Okayama University,
Tsushima –Naka 3, Okayama, 700-8530, Japan
E-mail: [email protected]
Abstract
The interaction of spray and combustion processes forms a complex system of
physical phenomena undergoing in IC engines. Studying this interaction is
important to determine strategies for simultaneously reducing soot and NOx
emissions from diesel engines. Spray combustion interactions are evaluated by the
flame lift-off length - the distance from the injector orifice to the location of
hydroxyl luminescence closest to the injector in the flame jet. Various works have
been dedicated to successful simulations of lifted flames of a diesel jet by use of
various combustion modeling approaches. In this work, flame surface density and
flamelet concepts were used to model the diesel lift-off length. Numerical studies
have been performed with the ECFM3Z model and n-Heptane fuel to determine the
flame lift-off length under quiescent conditions. The numerical results showed good
agreement with experimental data, which were obtained from an optically
accessible constant volume chamber and presented at the Engine Combustion Network (ECN) of Sandia National Laboratories. It was shown that at a certain
distance downstream from the injector orifice, stoichiometric scalar dissipation rate
matched the extinction scalar dissipation rate. This computed extinction scalar
dissipation rate correlated well with the flame lift-off length. For the range of
conditions investigated, adequate quantitative agreement was obtained with the
experimental measurements of lift-off length under various ambient gas O2
concentrations and ambient gas densities.
Key words: Spray Combustion, Lift-off Length, ECFM3Z Model, Scalar Dissipation
1. Introduction
The interaction of spray and combustion processes forms a complex system of physical
phenomena whose time and length scales range over a wide spectrum. This interaction plays
an important role in engine performance and exhaust emissions. The new combustion
strategies focused on simultaneous reduction of NOx and soot emissions suggest that
ignition timing is controlled to be delayed after the end of injection. Therefore, air in the
combustion chamber can be properly utilized by optimizing the air-fuel mixing in the spray.
To describe air-fuel mixing, the diesel flame lift-off length is evaluated. The lift-off length,
as an indicator of local mixture formation, is the driving parameter for identifying the
combustion rate and pollutant formation. Peters [1] conducted an extensive research on
lift-off length. At the macroscopic level, this research indicates that the flame stabilization
occurs along the stoichiometric mixture contour, at a location where a balance exist between
*Received 10 June, 2010 (No. 10-0247)[DOI: 10.1299/jtst.5.238]
Copyright © 2010 by JSME
7/27/2019 Evaluation of Flame Lift of Length
http://slidepdf.com/reader/full/evaluation-of-flame-lift-of-length 2/14
Journal of Thermal Science and Technology
Vol. 5, No. 2, 2010
239
the convective flow downstream in the jet and turbulent flame propagation upstream. The
flame stabilization process is controlled by a complex set of interactions between turbulent
fluid mechanics and flame chemistry processes [2-5]. Recent experimental results proved
the fact that after the initial autoignition phase, the reaction zone of a diesel fuel jet
stabilizes at a location downstream of the fuel injector [6]. The flame remains lifted during
the diffusion-burn phase of heat release, allowing fuel and ambient gases to premixupstream of the reaction zone and strongly affecting combustion and soot formation
processes downstream [7, 8]. The oxygen in the entrained air is believed to react with fuel
in a rich reaction zone in the central region of the spray just downstream of the lift-off
length [9, 10]. The products of such a rich reaction zone are ideal for forming soot,
suggesting a strong link between soot formation and the amount of air entrainment, or
fuel-air mixing, that occurs upstream of the location of flame lift-off. More air-entrainment
upstream of the lift-off length is likely to lead to less soot formation.
Lift-off length was modeled and simulated by several researchers. Senecal et al. [11]
performed a multi-dimensional modeling of the direct-injection diesel flame lift-off length
using CFD and parallel detailed chemistry. They applied KIVA/SAGE modeling
methodology to model experiments of Siebers and Higgins [7]. Tap and Veynante [12]simulated the flame lift-off length of a diesel jet by using the generalized surface density
modeling approach. This modeling approach was coupled to a mixing model and a
chemistry model, based on the unsteady flamelet equations in the flamelet library.
Lehtiniemi et al . [13] modeled the lift-off length using detailed chemistry and the progress
variable approach. Venugopal and Abraham [14, 15] modeled the lift-off length and
correlated it with flame extinction. For the range of conditions explored, adequate
agreement was obtained between the numerical results and the measurements for varying
injection pressures, ambient densities, ambient temperatures and ambient O2 concentrations.
D’Errico et al. [16] compared the lift-off length computed with the Eddy Dissipation Model
(EDM) and Partially Stirred Reactor Model (PaSR). Singh et al. [17] validated hybrid
auto-ignition/flame-propagation model against flame lift-off. Campbell et al . [18]
performed the analysis of premixed flame and lift-off length in diesel spray combustion
with multi-dimensional CFD. Vishvanathan and Reitz [19] predicted the diesel flame lift-off
length under low-temperature combustion conditions. Karrholm et al. [20] performed 3-D
simulations of the diesel lift-off length using OpenFoam and KIVA-3V CFD codes with
n-Heptane reaction mechanism involving 83 species and 338 reactions.
Flame lift-off is challenging to model because of its complex nature in association with
turbulence and chemistry that result in local quenching, partial-premixing and flame
propagation. The previous research mentioned above could not recommend a single
threshold temperature value that might be applied to the wide range of diesel combustion
conditions, including the combustion at diluted ambient gas with smaller Damkohler
number, as observed in LTC. The merit of the approach proposed in this paper is that it
takes into account turbulence and chemistry interactions, autoignition and flame
propagation and that the lift-off length is evaluated using the ECFM3Z model based on the
flame surface density and flame extinction concept. Because it is confirmed that the lift-off
length is strongly affected by turbulence and chemistry interactions, autoignition and flame
propagation [1, 6, 9]. This is the original study that uses ECFM3Z model to evaluate the
lift-off length based on flame extinction.
The modeling results were compared with available experimental data from the Engine
Combustion Network of Sandia National Laboratories [21]. n-Heptane was used as the
surrogate diesel fuel, and the flamelet library was generated based on the values of pressure,
temperature, O2 concentration, reaction progress rate and scalar dissipation rate. The
influences of the chamber density and ambient gas O2 concentration on the lift-off length
were investigated.
7/27/2019 Evaluation of Flame Lift of Length
http://slidepdf.com/reader/full/evaluation-of-flame-lift-of-length 3/14
Journal of Thermal Science and Technology
Vol. 5, No. 2, 2010
240
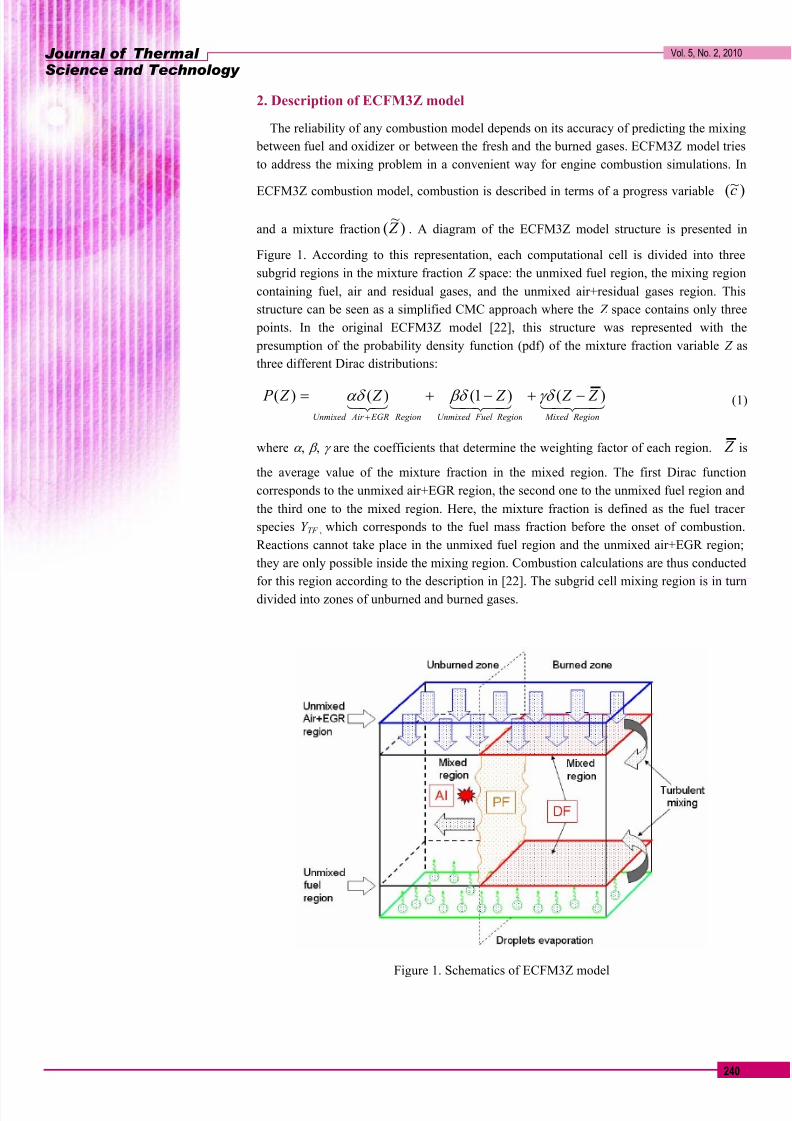
2. Description of ECFM3Z model
The reliability of any combustion model depends on its accuracy of predicting the mixing
between fuel and oxidizer or between the fresh and the burned gases. ECFM3Z model tries
to address the mixing problem in a convenient way for engine combustion simulations. In
ECFM3Z combustion model, combustion is described in terms of a progress variable )
~
(c
and a mixture fraction )~
( Z . A diagram of the ECFM3Z model structure is presented in
Figure 1. According to this representation, each computational cell is divided into three
subgrid regions in the mixture fraction Z space: the unmixed fuel region, the mixing region
containing fuel, air and residual gases, and the unmixed air+residual gases region. This
structure can be seen as a simplified CMC approach where the Z space contains only three
points. In the original ECFM3Z model [22], this structure was represented with the
presumption of the probability density function (pdf) of the mixture fraction variable Z as
three different Dirac distributions:
(1)
where α , β , γ are the coefficients that determine the weighting factor of each region. Z is
the average value of the mixture fraction in the mixed region. The first Dirac function
corresponds to the unmixed air+EGR region, the second one to the unmixed fuel region and
the third one to the mixed region. Here, the mixture fraction is defined as the fuel tracer
species Y TF , which corresponds to the fuel mass fraction before the onset of combustion.
Reactions cannot take place in the unmixed fuel region and the unmixed air+EGR region;
they are only possible inside the mixing region. Combustion calculations are thus conducted
for this region according to the description in [22]. The subgrid cell mixing region is in turn
divided into zones of unburned and burned gases.
Figure 1. Schematics of ECFM3Z model
Region Mixed Region Fuel Unmixed egion R EGR Air Unmixed
Z Z Z Z Z P )()1()()( −+−+=+
γδ βδ αδ
7/27/2019 Evaluation of Flame Lift of Length
http://slidepdf.com/reader/full/evaluation-of-flame-lift-of-length 4/14
Journal of Thermal Science and Technology
Vol. 5, No. 2, 2010
241
3. Flame lift-off length modeling
Different modeling approaches were addressed to compute the diesel lift-off length
[11-20], as was mentioned earlier. In this paper, the lift-off length is modeled based on
flame surface density and the flame extinction concept.
To compute the diesel jet lift–off length, the mean scalar dissipation rate at
stoichiometric conditions, χ st , is determined.
2"~~
~~ Z
k C st
ε χ χ = (2)
where ε and k are the Reynolds-averaged turbulent dissipation rate and the turbulent kinetic
energy.2"~
Z is the variance of mixture fraction Z . The scalar time scale ratio C χ is
assumed to be a constant [1]. One-dimensional laminar flamelet equations are used to
compute the structure of a laminar diffusion flame for the range of conditions in this paper.
ω χ ρ ρ +∂∂=
∂∂
2
2
2 Z Y
t Y ii
(3)
i
n
i p
i
p c
h
t
p
c Z
T
t
T ω
χ ρ ρ ∑
=
−∂
∂+
∂
∂=
∂
∂
1
0
2
2 1
2(4)
where p-gas pressure, T -temperature, ρ -mixture mass density, Y i- mass fraction,
-production/destruction rate, and hi – specific enthalpy of species i, c p - mixture specific
heat. All the species are assumed to have the same mass diffusion coefficient equal to the
thermal diffusivity of the mixture.
The scalar dissipation rate represents the extent of heat conduction and species
diffusion at the flame. The flame structure consists essentially of a thin inner reaction zone
embedded between two chemically inert outer zones. When χ st is increased, heat
conduction from and reactant diffusion to the reaction zone will increase. If this increase is
beyond a critical value, χ ext , incomplete reaction results in reactant leakage, and thus heat
conduction can no longer be balanced by heat production due to chemical reaction, and the
flame is extinguished. This behavior is described by the well-known S-shaped curve [1].
Extinction occurs when the characteristic time of flow of reactants through the reaction
zone becomes shorter than the time required for heat release through chemical reaction, or
as the Damkohler number, Da, that is inversely proportional to χ st , is reduced to a criticalvalue.
4. Simulation procedure
To accurately evaluate spray and combustion processes at different conditions, it is
critical that the dependence of these processes on grid size is minimized. In this work, prior
to the modeling of the lift-off length, grids with cell sizes of 0.25mm, 0.5mm, 1mm and
2mm were evaluated for vaporizing spray distributions and these distributions were
compared with ones from experiment. The dependence of flow parameters on grid size was
investigated for the conditions at fuel injection pressure, Pinj=135 MPa; nozzle orifice
diameter, Dorifice=0.163 mm; discharge coefficient, CD=0.86; nozzle length-to-diameter ratio,L/D-5.52; spray angle θ/2=9°; ambient gas pressure Pamb=4 MPa; and ambient gas
7/27/2019 Evaluation of Flame Lift of Length
http://slidepdf.com/reader/full/evaluation-of-flame-lift-of-length 5/14
Journal of Thermal Science and Technology
Vol. 5, No. 2, 2010
242
temperature Tamb=820 K. The 3-D computational grid, a cylinder-shaped constant volume
chamber 80mm in diameter and 80 mm in length, was discretized with hexahedral cells of
2mm, 1mm, 0.5mm and 0.25mm in size. Fuel vapor penetration was also compared at the
conditions with the shadowgraph experimental results available at ECN [21].
The discretization of time is set after the Courant number [23]. The time step is selected
for the minimum number of PISO correctors to ensure computation stability andconvergence. In order to optimize the computation in terms of “accuracy-stability” we used
Monotone Advection Reconstruction Scheme (MARS) with blending factor 0.5. MARS is a
multidimensional second-order accurate differencing scheme. It possesses the least
sensitivity of solution accuracy to the mesh structure and skewness. The complete duration
of spray combustion was considered to match that of the experiment. The fuel was injected
with spray characteristics adjusted according to the spray characteristics applied in the
experiments. In the spray model, atomization proceeded according to the Reitz-Diwakar
model, and the fuel droplets were formed according to the Reitz-Diwakar breakup model
[24-27]. After a reliable grid size was identified, the lift-off length was evaluated. The
ECFM3Z model was used to simulate the lift-off length with the conditions in the constant
volume combustion chamber, as shown in Tables 1 and 2, available from ECN [21].
Table 1. Simulation condition
Table 2. Ambient gas composition
The autoignition in the present simulations was controlled by the double-delay
autoignition model for ECFM3Z. The double-delay autoignition model considers the effect
of cool flames, which is characterized by a weak increase in temperature after the initial
delay, followed by a slow-down of the reaction rates until the second delay. After this
second delay, the reaction rate increases rapidly, and the main autoignition takes over. This
model makes use of pre-computed tables containing the results of complex chemistry
calculations of the autoignition of n-Heptane with 800 reactions and 100 species [23, 28].
The tables give values for the two delays, which are functions of pressure, temperature,
equivalence ratio and the EGR rate.
The mean scalar dissipation rate χ st was extracted along the mean stoichiometric
mixing line. To determine the scalar dissipation rate along the stoichiometric line of mixture
fraction, the iso-surface of mixture fraction values at a specific stoichiometry is created, as
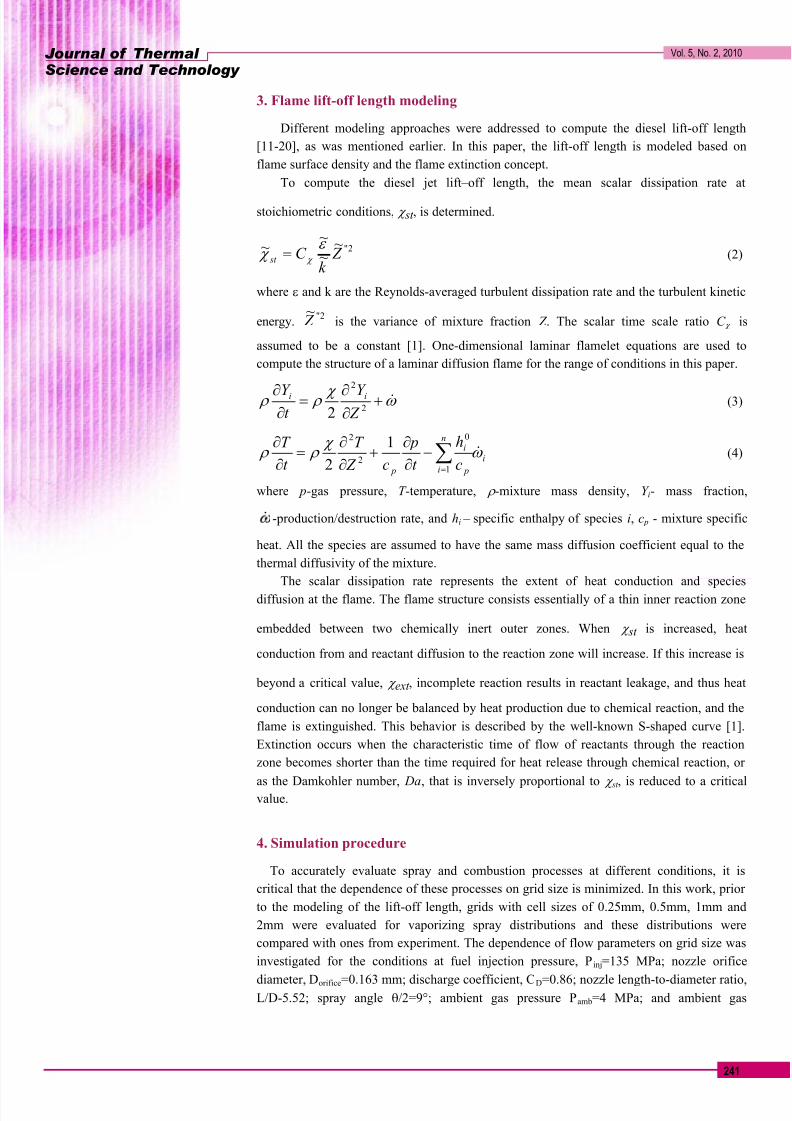
shown in Figure 2.
7/27/2019 Evaluation of Flame Lift of Length
http://slidepdf.com/reader/full/evaluation-of-flame-lift-of-length 6/14
Journal of Thermal Science and Technology
Vol. 5, No. 2, 2010
243
Figure 2. Assessment of the flame lift-off length. Top figure: extinction scalar
dissipation value on the stoichiometric scalar dissipation curve.
The red contour in the first image of Figure 2 is a stoichiometric mixture fraction line.
Computed values of the scalar dissipation rate are mapped to the iso-surface [29]. Then
based on the temperature and Damkohler number relation (S-curve), the flame temperature
along the stoichiometric line is plotted versus the inverse of the scalar dissipation rate. To
determine the scalar dissipation rate at extinction, the threshold flame temperature of 1600K
is used. This threshold flame temperature is adopted according to the conceptual model of
diesel combustion presented by Dec [10] and the analysis of the overall chemical kinetics
and potential sequence of reactions in hydrocarbon oxidation by Flynn et al. [30]. χ st is
plotted versus the distance along the jet penetration, and the χ st value that was determined
from temperature curve is projected on the graph “ χ st vs. distance from injector”. That value
on the χ st graph is the value of the scalar dissipation rate at extinction, χ ext , which
corresponds to the flame lift-off length. Details of this procedure are explained in [29]. The
computed lift-off length values were compared with experimental data from ECN of Sandia
National Laboratories [21].
5. Results and discussion
5.1 Non-reacting spray
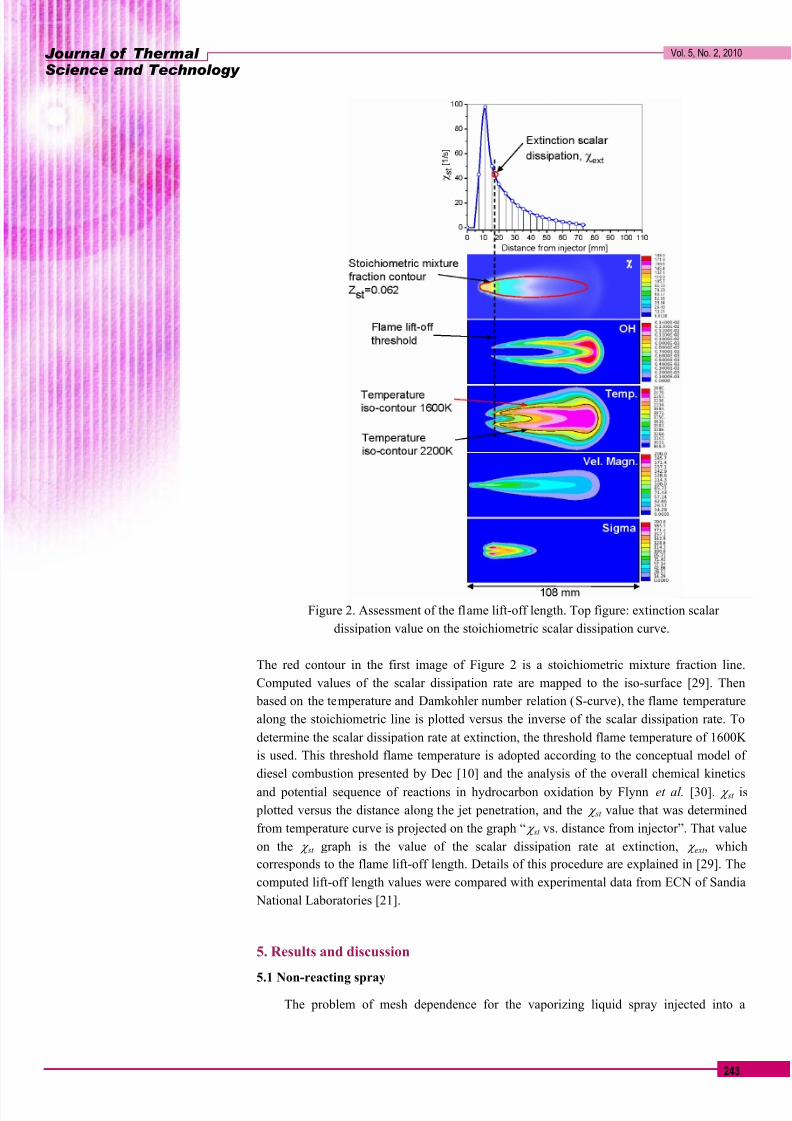
The problem of mesh dependence for the vaporizing liquid spray injected into a
7/27/2019 Evaluation of Flame Lift of Length
http://slidepdf.com/reader/full/evaluation-of-flame-lift-of-length 7/14
Journal of Thermal Science and Technology
Vol. 5, No. 2, 2010
244
constant volume chamber is illustrated in Figure 3. All computations were performed under
the same conditions mentioned in section 4. The only parameter that was varied was the
grid resolution. As this figure shows, grid size has an ambivalent effect on spray penetration.
The use of a larger number of cells decreased the penetration of the spray. When the cell
size is larger than 1mm, the penetration was longer, but when the cell size is smaller than
1mm, penetration becomes shorter with a large increase in the spray cone angle.
Figure 3. Comparison of vaporizing spray penetration from shadowgraph experiment with
simulation at different grid resolutions. Tamb=820 K, Pamb=4 MPa, Pinj=135 MPa,
Dorifice=0.163 mm.
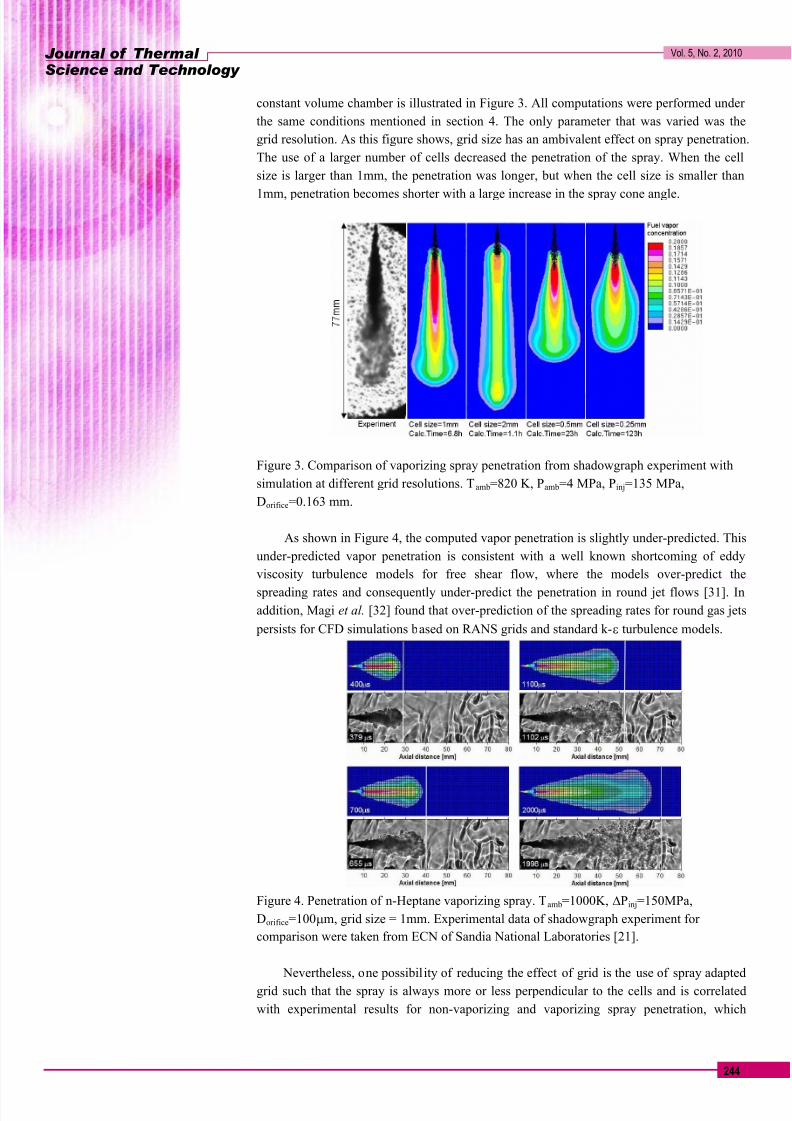
As shown in Figure 4, the computed vapor penetration is slightly under-predicted. This
under-predicted vapor penetration is consistent with a well known shortcoming of eddy
viscosity turbulence models for free shear flow, where the models over-predict the
spreading rates and consequently under-predict the penetration in round jet flows [31]. In
addition, Magi et al. [32] found that over-prediction of the spreading rates for round gas jets
persists for CFD simulations based on RANS grids and standard k-ε turbulence models.
Figure 4. Penetration of n-Heptane vaporizing spray. Tamb=1000K, ∆Pinj=150MPa,
Dorifice=100µm, grid size = 1mm. Experimental data of shadowgraph experiment for
comparison were taken from ECN of Sandia National Laboratories [21].
Nevertheless, one possibility of reducing the effect of grid is the use of spray adapted
grid such that the spray is always more or less perpendicular to the cells and is correlated
with experimental results for non-vaporizing and vaporizing spray penetration, which
7/27/2019 Evaluation of Flame Lift of Length
http://slidepdf.com/reader/full/evaluation-of-flame-lift-of-length 8/14
Journal of Thermal Science and Technology
Vol. 5, No. 2, 2010
245
exactly was demonstrated here. Therefore, a computation domain with 1mm grid size was
selected for further analysis on reacting spray and lift-off length.
5.2 Reacting spray
5.2.1 Flame lift-off length
The lift-off length values computed in this study using flame area density and the laminar
flamelet approach showed good agreement with experimental data as well as with the
numerical results obtained by other researchers. As O2 decreases, the stoichiometric mixture
fraction Z st decreases, and that the stoichiometric contour is located at radial positions
farther away from the centerline of the jet. Since the scalar dissipation rate, χ st decreases as
we move radially out from the centerline, lower O2 leads to lower χ st values in the jet. The
net effect is a higher lift-off length. The assessment of lift-off length based on the extinction
concept is shown in Figure 2. The computed values of lift-off length in this study were
compared with the closest distance from the injector orifice to the contour of flame
temperature at 1600 K, and with the distance from the injector orifice to the closest location
of OH concentration. The iso-temperature value of 1600K was used considering the results
of analysis of the overall chemical kinetics and potential sequence of reactions in
hydrocarbon oxidation [10, 30].
The results suggest that the axial location of OH concentration that is the closest to the
injector orifice, matches well the region of temperature at 1600 K, closest to the injector
orifice. The extinction scalar dissipation point also corresponds to the flame temperature at
1600 K. As the jet progresses downstream from the injector, the scalar dissipation rate
decreases and the lift-off length stabilizes at a certain distance from the injector. A
distribution of the flame surface density (Sigma) is indicated at the location of the lift-off.
Experimental results of the Sandia combustion chamber were used to validate the present
approach. The experimental flame lift-off length was measured as described in [1, 33].
Time-averaged, line-of-sight images of light emitted from a burning fuel jet at 310 nm were
acquired with an intensified CCD camera using a 310 nm band-pass filter (10 nm FWHM).
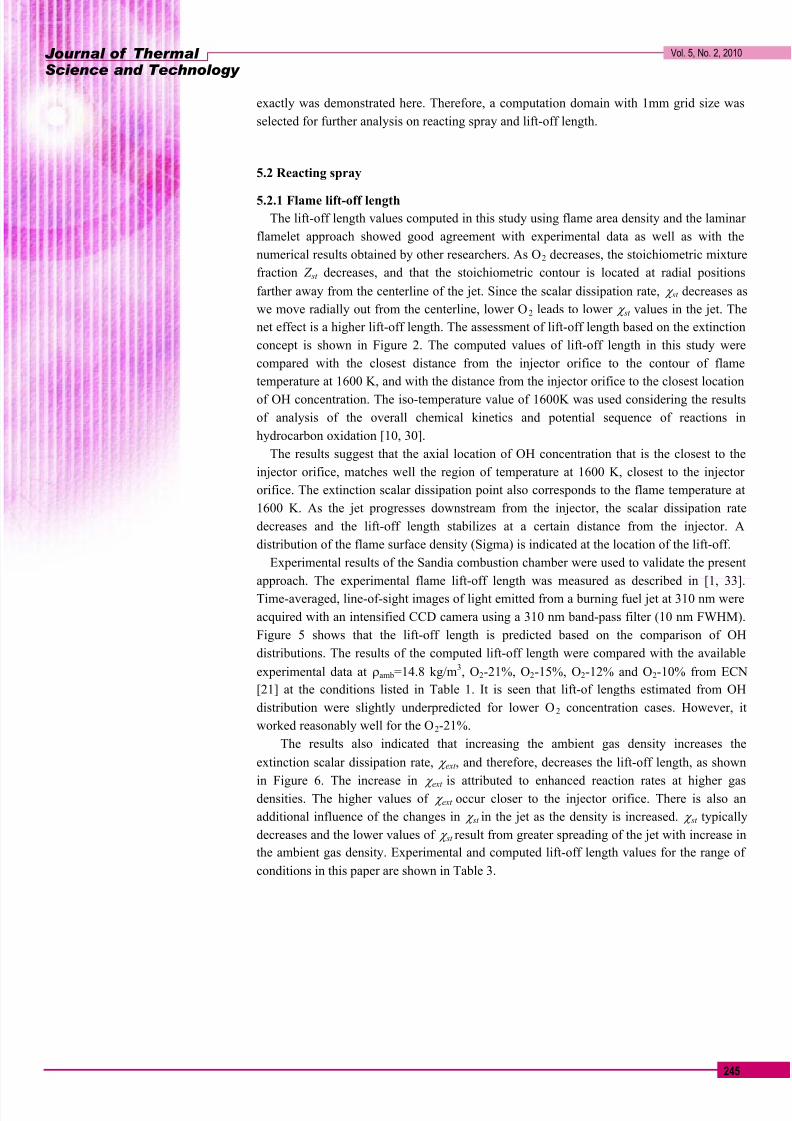
Figure 5 shows that the lift-off length is predicted based on the comparison of OH
distributions. The results of the computed lift-off length were compared with the available
experimental data at ρamb=14.8 kg/m3, O2-21%, O2-15%, O2-12% and O2-10% from ECN
[21] at the conditions listed in Table 1. It is seen that lift-of lengths estimated from OH
distribution were slightly underpredicted for lower O2 concentration cases. However, it
worked reasonably well for the O2-21%.
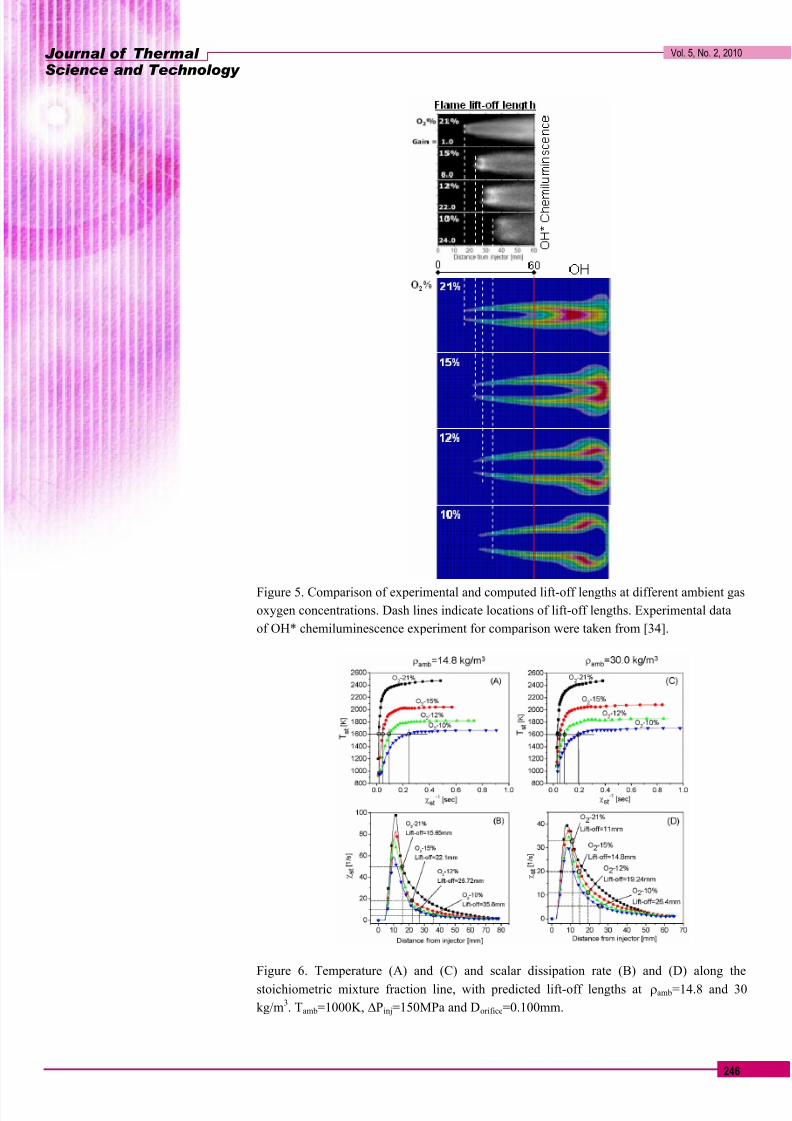
The results also indicated that increasing the ambient gas density increases the
extinction scalar dissipation rate, χ ext , and therefore, decreases the lift-off length, as shown
in Figure 6. The increase in χ ext is attributed to enhanced reaction rates at higher gasdensities. The higher values of χ ext occur closer to the injector orifice. There is also an
additional influence of the changes in χ st in the jet as the density is increased. χ st typically
decreases and the lower values of χ st result from greater spreading of the jet with increase in
the ambient gas density. Experimental and computed lift-off length values for the range of
conditions in this paper are shown in Table 3.
7/27/2019 Evaluation of Flame Lift of Length
http://slidepdf.com/reader/full/evaluation-of-flame-lift-of-length 9/14
Journal of Thermal Science and Technology
Vol. 5, No. 2, 2010
246
Figure 5. Comparison of experimental and computed lift-off lengths at different ambient gas
oxygen concentrations. Dash lines indicate locations of lift-off lengths. Experimental data
of OH* chemiluminescence experiment for comparison were taken from [34].
Figure 6. Temperature (A) and (C) and scalar dissipation rate (B) and (D) along the
stoichiometric mixture fraction line, with predicted lift-off lengths at ρamb=14.8 and 30
kg/m3. Tamb=1000K, ∆Pinj=150MPa and Dorifice=0.100mm.
7/27/2019 Evaluation of Flame Lift of Length
http://slidepdf.com/reader/full/evaluation-of-flame-lift-of-length 10/14
Journal of Thermal Science and Technology
Vol. 5, No. 2, 2010
247
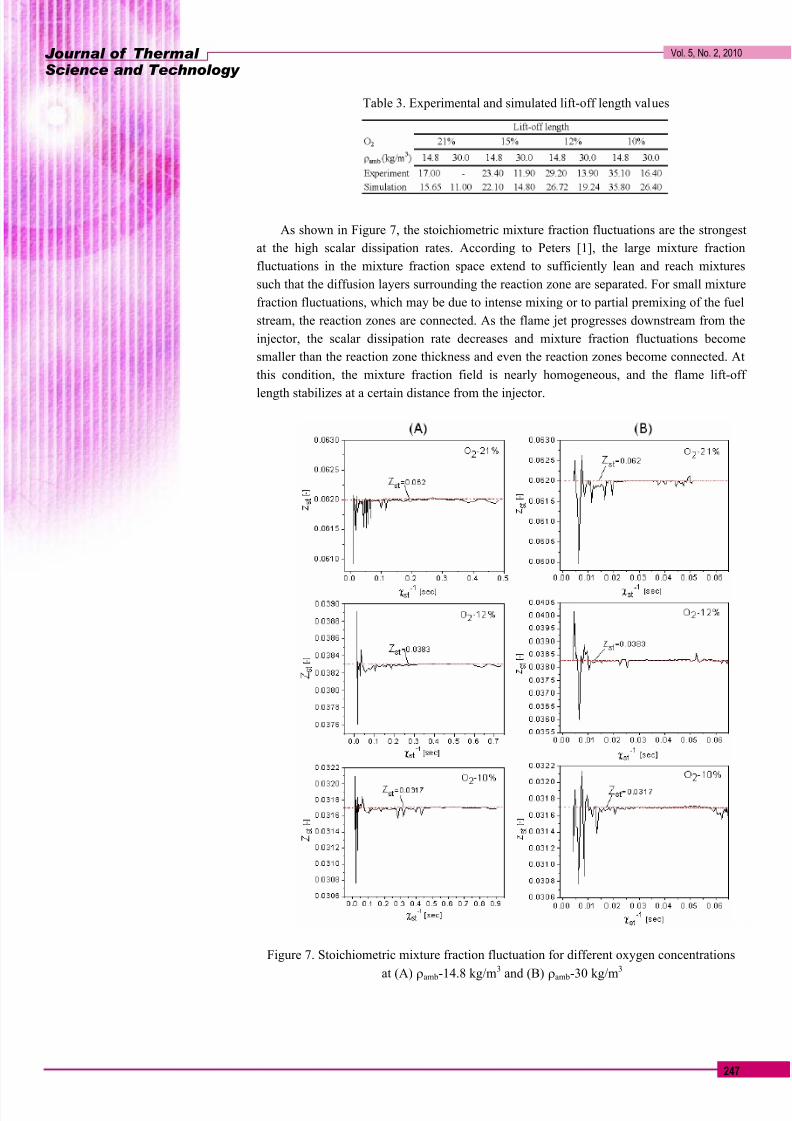
Table 3. Experimental and simulated lift-off length values
As shown in Figure 7, the stoichiometric mixture fraction fluctuations are the strongest
at the high scalar dissipation rates. According to Peters [1], the large mixture fraction
fluctuations in the mixture fraction space extend to sufficiently lean and reach mixtures
such that the diffusion layers surrounding the reaction zone are separated. For small mixture
fraction fluctuations, which may be due to intense mixing or to partial premixing of the fuel
stream, the reaction zones are connected. As the flame jet progresses downstream from the
injector, the scalar dissipation rate decreases and mixture fraction fluctuations become
smaller than the reaction zone thickness and even the reaction zones become connected. At
this condition, the mixture fraction field is nearly homogeneous, and the flame lift-off
length stabilizes at a certain distance from the injector.
Figure 7. Stoichiometric mixture fraction fluctuation for different oxygen concentrations
at (A) ρamb-14.8 kg/m3
and (B) ρamb-30 kg/m3
7/27/2019 Evaluation of Flame Lift of Length
http://slidepdf.com/reader/full/evaluation-of-flame-lift-of-length 11/14
Journal of Thermal Science and Technology
Vol. 5, No. 2, 2010
248
5.2.2 Heat release rate
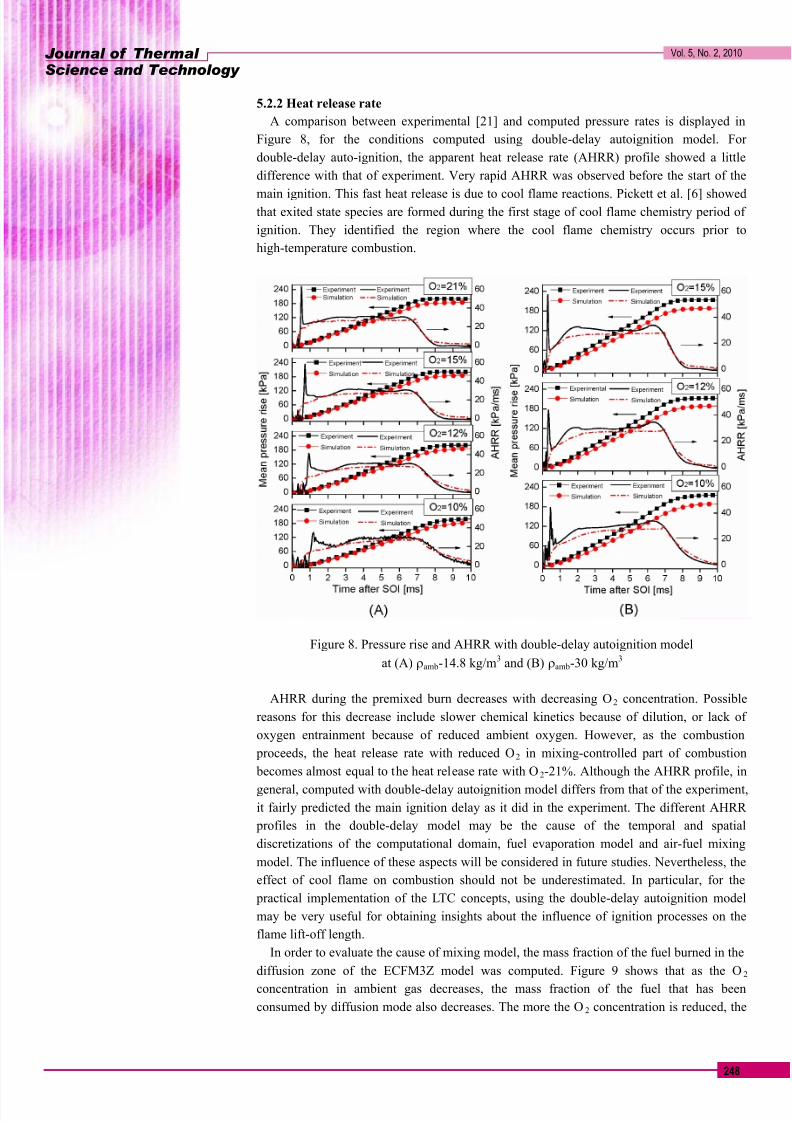
A comparison between experimental [21] and computed pressure rates is displayed in
Figure 8, for the conditions computed using double-delay autoignition model. For
double-delay auto-ignition, the apparent heat release rate (AHRR) profile showed a little
difference with that of experiment. Very rapid AHRR was observed before the start of the
main ignition. This fast heat release is due to cool flame reactions. Pickett et al. [6] showedthat exited state species are formed during the first stage of cool flame chemistry period of
ignition. They identified the region where the cool flame chemistry occurs prior to
high-temperature combustion.
Figure 8. Pressure rise and AHRR with double-delay autoignition model
at (A) ρamb-14.8 kg/m3
and (B) ρamb-30 kg/m3
AHRR during the premixed burn decreases with decreasing O2 concentration. Possible
reasons for this decrease include slower chemical kinetics because of dilution, or lack of
oxygen entrainment because of reduced ambient oxygen. However, as the combustion
proceeds, the heat release rate with reduced O2 in mixing-controlled part of combustion
becomes almost equal to the heat release rate with O2-21%. Although the AHRR profile, in
general, computed with double-delay autoignition model differs from that of the experiment,
it fairly predicted the main ignition delay as it did in the experiment. The different AHRR
profiles in the double-delay model may be the cause of the temporal and spatial
discretizations of the computational domain, fuel evaporation model and air-fuel mixing
model. The influence of these aspects will be considered in future studies. Nevertheless, the
effect of cool flame on combustion should not be underestimated. In particular, for the
practical implementation of the LTC concepts, using the double-delay autoignition model
may be very useful for obtaining insights about the influence of ignition processes on the
flame lift-off length.
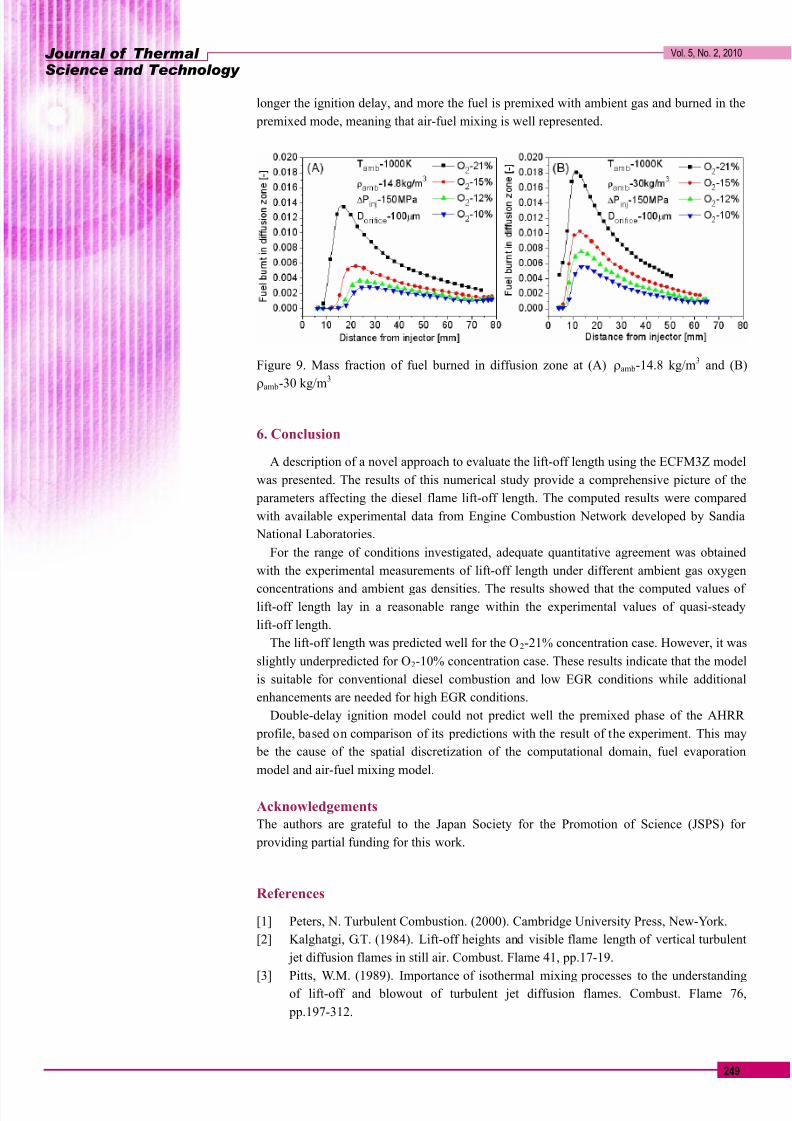
In order to evaluate the cause of mixing model, the mass fraction of the fuel burned in the
diffusion zone of the ECFM3Z model was computed. Figure 9 shows that as the O2
concentration in ambient gas decreases, the mass fraction of the fuel that has been
consumed by diffusion mode also decreases. The more the O2 concentration is reduced, the
7/27/2019 Evaluation of Flame Lift of Length
http://slidepdf.com/reader/full/evaluation-of-flame-lift-of-length 12/14
Journal of Thermal Science and Technology
Vol. 5, No. 2, 2010
249
longer the ignition delay, and more the fuel is premixed with ambient gas and burned in the
premixed mode, meaning that air-fuel mixing is well represented.
Figure 9. Mass fraction of fuel burned in diffusion zone at (A) ρamb-14.8 kg/m3
and (B)
ρamb-30 kg/m3
6. Conclusion
A description of a novel approach to evaluate the lift-off length using the ECFM3Z model
was presented. The results of this numerical study provide a comprehensive picture of the
parameters affecting the diesel flame lift-off length. The computed results were compared
with available experimental data from Engine Combustion Network developed by Sandia
National Laboratories.
For the range of conditions investigated, adequate quantitative agreement was obtained
with the experimental measurements of lift-off length under different ambient gas oxygen
concentrations and ambient gas densities. The results showed that the computed values of lift-off length lay in a reasonable range within the experimental values of quasi-steady
lift-off length.
The lift-off length was predicted well for the O2-21% concentration case. However, it was
slightly underpredicted for O2-10% concentration case. These results indicate that the model
is suitable for conventional diesel combustion and low EGR conditions while additional
enhancements are needed for high EGR conditions.
Double-delay ignition model could not predict well the premixed phase of the AHRR
profile, based on comparison of its predictions with the result of the experiment. This may
be the cause of the spatial discretization of the computational domain, fuel evaporation
model and air-fuel mixing model.
Acknowledgements
The authors are grateful to the Japan Society for the Promotion of Science (JSPS) for
providing partial funding for this work.
References
[1] Peters, N. Turbulent Combustion. (2000). Cambridge University Press, New-York.
[2] Kalghatgi, G.T. (1984). Lift-off heights and visible flame length of vertical turbulent
jet diffusion flames in still air. Combust. Flame 41, pp.17-19.
[3] Pitts, W.M. (1989). Importance of isothermal mixing processes to the understandingof lift-off and blowout of turbulent jet diffusion flames. Combust. Flame 76,
pp.197-312.
7/27/2019 Evaluation of Flame Lift of Length
http://slidepdf.com/reader/full/evaluation-of-flame-lift-of-length 13/14
Journal of Thermal Science and Technology
Vol. 5, No. 2, 2010
250
[4] Schefer, R.W., Namazian, M., Kelly, J. (1994). Stabilization of lifted turbulent-jet
flames. Combustion and Flame 99, pp.75-86.
[5] Tackle, M.M., Geyer, D., Hassel, E.P., Janicka, J. A detailed investigation of the
stabilization point of lifted turbulent diffusion flames. Twenty-Seventh Symposium
(International) on Combustion, The Combustion Institute, Pittsburgh, pp.1157-1165.
[6] Pickett, L.M., Siebers, D.L., Idicheria, C.A. (2005). Relationship between ignition processes and the lift-off length of diesel fuel jets. SAE Paper No. 2005-01-3843.
[7] Siebers, D. and Higgins, B. (2001). Flame lift-off on direct-injection diesel sprays
under quiescent conditions. SAE Paper No. 2001-01-0530.
[8] Pickett, L.M., Siebers, D.L. (2004). Soot in diesel fuel jets: Effects of ambient
temperature, ambient density, and injection pressure. Combust. Flame 138, p.114.
[9] Chomiak, J., Karlsson, A. (1996). Flame lift-off in diesel sprays. Proc. Combust. Inst.
26, pp.2557.
[10] Dec, J.E. (1997). A conceptual model of DI diesel combustion based on laser-sheet
imaging. SAE Paper No. 970873.
[11] Senecal, P.K., Pomraning, E., Richards, K.J., Briggs, T.E., Choi, C.Y., McDavid,
R.M., Patterson, M.A. (2003). Multi-dimensional modeling of direct-injection dieselspray liquid length and flame lift-off length using CFD and parallel detailed chemistry.
SAE Paper No. 2003-01-1043.
[12] Tap, F.A., Veynante, D. (2005). Simulation of flame lift-off on a diesel jet using a
generalized flame surface density modeling approach. Proc.Combustion Institute 30,
pp.919-926.
[13] Lehtiniemi, H., Mauss, F., Balthasar, M., Magnusson, I. (2006). Modeling diesel
spray ignition using detailed chemistry with a progress variable approach. Combust.
Sci. and Tech. 178, pp.1977-1997.
[14] Venugopal, R., Abraham, J. (2007). A numerical investigation of flame lift-off in
diesel jets. Combust. Sci. and Tech. 179, pp.2599-2618.
[15] Venugopal R. and Abraham, J. (2007). A review of fundamental studies relevant to
flame lift-off in diesel jets. SAE Paper No. 2007-01-0134.
[16] D’Errico, G., Ettorre, D., Lucchini, T. (2007). Comparison of combustion and
pollutant emission models for DI diesel engines. SAE Paper No. 2007-24-0045.
[17] Singh, S., Reitz, R.D., Wickman, D., Stanton, D., Tan, Zh. (2007). Development of a
hybrid, auto-ignition/flame-propagation model and validation against engine
experiments and flame lift-off. SAE Paper No. 2007-01-0171.
[18] Campbell, J.W., Gosman, A.D., Hardy, G. (2008). Analysis of premix flame and
lift-off in diesel spray combustion using multi-dimensional CFD. SAE Paper No.
2008-01-0968.
[19] Vishwanathan, G., Reitz, R.D. (2008). Numerical predictions of diesel flame lift-off
length and soot distributions under low-temperature combustion conditions. SAE
paper No. 2008-01-1331.
[20] Karrholm, F. P., Tao, F., Nordin, N. (2008). Three-dimensional simulation of diesel
spray ignition and flame lift-off using OpenFOAM and KIVA-3V CFD codes. SAE
Paper No. 2008-01-0961.
[21] Engine Combustion Network. Sandia National Laboratories, USA. Available at
http://www.ca.sandia.gov/ECN.
[22] Colin, O. and Benkenida, A. (2004). The 3-zones Extended Coherent Flame Model
(ECFM3Z) for computing premixed/diffusion combustion. Oil &Gas Sci. Technology
59, 6, 593-609.
[23] STAR-CD Methodology, v3.26. pp.11-3, 10-28.
[24] Reitz, R.D. and Bracco, F.B. (1979). On the dependence of spray angle and other
spray parameters on nozzle design and operating conditions. SAE Paper No. 790494.
7/27/2019 Evaluation of Flame Lift of Length
http://slidepdf.com/reader/full/evaluation-of-flame-lift-of-length 14/14
Journal of Thermal Science and Technology
Vol. 5, No. 2, 2010
251
[25] Reitz, R.D. (1987). Modeling atomization processes in high pressure vaporizing
sprays. Atomization and Spray Technology 3, p.309
[26] Reitz, R.D. and Diwakar, R. (1987). Structure of high-pressure fuel spray. SAE Paper
No. 870598.
[27] Reitz, R.D., 1988. Modelling atomization processes in high pressure vaporizing
sprays. GMRL Publication, GMR-6017, Detroit, MI.[28] Subramanian, G. (2007). Modeling engine turbulent auto-ignition using tabulated
detailed chemistry. SAE Paper No. 2007-01-0150.
[29] Azimov, U.B. (2009). Experimental and numerical studies of diesel low-temperature
combustion under quiescent conditions. PhD Dissertation, Chonnam National
University, South Korea.
[30] Flynn, P. F., Durrett, R. P., Hunter, G. L., Zur Loye, A. O., Akinyemi, O. C., Dec, J. E.
and Westbrook, C. K. (1999). Diesel combustion: An integrated view combining laser
diagnostics, chemical kinetics, and empirical validation. SAE Paper No.
1999-01-0509.
[31] Wilcox, D.C. (1998). Turbulence Modeling for CFD. DCW Industries, 1998.
[32] Magi, V., Iyer, V., Abraham, J. (2001). The k-epsilon model and computed spreadingrates in round and plane jets. Numerical Heat Transfer, Part A, 40, pp.317-334.
[33] Siebers, D.L., Higgins, B.S. (2001). Measurement of the flame lift-off location on DI
diesel sprays using OH chemiluminescence. SAE Paper No. 2001-01-0918.
[34] Idicheria, C.A., Pickett, L.M. (2005). Soot formation in diesel combustion under
high-EGR conditions. SAE Paper 2005-01-3834.