Evaluation of Fish Meal Supplement on Physiological ...
244
Louisiana State University LSU Digital Commons LSU Historical Dissertations and eses Graduate School 1989 Evaluation of Fish Meal Supplement on Physiological Response and Milking Performance in Lactating Dairy Cale Under Heat Stress. George Mark Toups Louisiana State University and Agricultural & Mechanical College Follow this and additional works at: hps://digitalcommons.lsu.edu/gradschool_disstheses is Dissertation is brought to you for free and open access by the Graduate School at LSU Digital Commons. It has been accepted for inclusion in LSU Historical Dissertations and eses by an authorized administrator of LSU Digital Commons. For more information, please contact [email protected]. Recommended Citation Toups, George Mark, "Evaluation of Fish Meal Supplement on Physiological Response and Milking Performance in Lactating Dairy Cale Under Heat Stress." (1989). LSU Historical Dissertations and eses. 4884. hps://digitalcommons.lsu.edu/gradschool_disstheses/4884
Transcript of Evaluation of Fish Meal Supplement on Physiological ...

Louisiana State UniversityLSU Digital Commons
LSU Historical Dissertations and Theses Graduate School
1989
Evaluation of Fish Meal Supplement onPhysiological Response and Milking Performancein Lactating Dairy Cattle Under Heat Stress.George Mark ToupsLouisiana State University and Agricultural & Mechanical College
Follow this and additional works at: https://digitalcommons.lsu.edu/gradschool_disstheses
This Dissertation is brought to you for free and open access by the Graduate School at LSU Digital Commons. It has been accepted for inclusion inLSU Historical Dissertations and Theses by an authorized administrator of LSU Digital Commons. For more information, please [email protected].
Recommended CitationToups, George Mark, "Evaluation of Fish Meal Supplement on Physiological Response and Milking Performance in Lactating DairyCattle Under Heat Stress." (1989). LSU Historical Dissertations and Theses. 4884.https://digitalcommons.lsu.edu/gradschool_disstheses/4884

INFORMATION TO USERS
The most advanced technology has been used to photograph and reproduce this manuscript from the microfilm master. UMI films the text directly from the original or copy submitted. Thus, some thesis and dissertation copies are in typewriter face, while others may be from any type of computer printer.
The quality of this reproduction is dependent upon the quality of the copy submitted. Broken or indistinct print, colored or poor quality illustrations and photographs, print bleedthrough, substandard margins, and improper alignment can adversely affect reproduction.
In the unlikely event that the author did not send UMI a complete manuscript and there are missing pages, these will be noted. Also, if unauthorized copyright material had to be removed, a note will indicate the deletion.
Oversize materials (e.g., maps, drawings, charts) are reproduced by sectioning the original, beginning at the upper left-hand corner and continuing from left to right in equal sections with small overlaps. Each original is also photographed in one exposure and is included in reduced form at the back of the book.
Photographs included in the original manuscript have been reproduced xerographically in this copy. Higher quality 6" x 9" black and white photographic prints are available for any photographs or illustrations appearing in this copy for an additional charge. Contact UMI directly to order.
Universi ty Microfilms In te rna t iona l A Bell & Howell Inform ation C o m p a n y
3 0 0 N or th Z e e b R o a d . A nn Arbor, Ml 4 8 1 0 6 - 1 3 4 6 USA 3 1 3 : 7 6 1 - 4 7 0 0 8 0 0 / 5 2 1 - 0 6 0 0


Order N um ber 9025346
E valuation o f fish m eal supplem ent on physiological response and m ilking perform ance in lactatin g dairy ca ttle under heat stress
Toups, George Mark, Ph.D.
The Louisiana State University and Agricultural and Mechanical Col., 1989
UMI300 N. Zeeb Rd.Ann Arbor, MI 48106

EVALUATION OF FISH MEAL SUPPLEMENT ON PHYSIOLOGICAL RESPONSE AND MILKING PERFORMANCE
IN LACTATING DAIRY CATTLE UNDER HEAT STRESS
A Dissertation
Submitted to the Graduate Faculty of the Louisiana State University and
Agricultural and Mechanical College In partial fulfillment of the
requirements for the degree of Doctor of Philosophy
In
The Department of Dairy Science
by
George M. ToupsB.S., Louisiana State University, 1974 M.S., Louisiana State University, 1980
December 1989

ACKNOWLEDGEMENTS
The author desires to express his gratitude to his
major professor, Dr. J. D. Roussel, for his leadership and
advice throughout the author's graduate studies at LSU.
He Is also grateful to all members of his Graduate
Committee: Dr. Edward Gassle of the Extension Education
Department, Dr. John Hebert of the Department of Poultry
Science, Dr. Robert W. Adklnson of the Department of Dairy
Science, Dr. Ronald Gough of the Department of Dairy
Science, and Dr. James W. Smith, Head of the Department of
Dairy Science, for their critical review of this manuscrlpt.
Appreciation Is extended to personnel of the Louisiana
Agricultural Experiment Station Feed Testing Laboratory for
analyzing feed samples and to the Louisiana Dairy Herd
Improvement Association for conducting milk component
analyses. Gratitude Is also directed towards Zapata Haynle
Corporation for kindly donating the specially selected fish
meal used In the feeding trial. The author Is also grateful to Dr. John Chandler for his expert aid In
composing some of the figures In this document, and to Dr. L. D. Bunting for his additional suggestions In
presentation of nutritional data.
The author extends tribute to his parents for their
Inspiration and genuine encouragement throughout his college career.
ii

The author also wishes to express deep appreciation to
his brother, Steve, for his encouraging and enlightening
weekly phone calls, that made Graduate School bearable.
Tribute to the Man Upstairs must not be omitted, for his grace of excellent health during trying periods
throughout the author's graduate program.
iii

TABLE OF CONTENTS
PageACKNOWLEDGEMENT ....................................... 11
LIST OF FIGURES...................................... vl
LIST OF T A B L E S ......................................... vll
LIST OF APPENDIX T A B L E S ............................... lxLIST OF ABBREVIATIONS................................ xl
A B S T R A C T ............................................... xlll
INTRODUCTION ......................................... 1
REVIEW OF LITERATURE
Effects of Heat Stress
A. G e n e r a l .............................. 4
B. Dietary Intake .......................... 7
C. Milk Yield and Composition.......... 16D. Physiological Responses
1. Cllmatologlcal Indexes ........... 252. Respiration R a t e .............. 283. Rectal Temperature ............... 294. Biosynthesis of Adrenal Steroids. . 315. Actions of Aldosterone
a. Mechanisms................ 33b. Heat Stress and Lactation. . . 42
6. Actions of Cortisola. Heat Stress and Lactation. . . 48b. Related Mechanisms ........... 52
Supplementary Fish Meal
A. Protein Source and Composition ......... 60B. Theory of U s e ........................ 63C. Lactation Trials ........................ 75
EXPERIMENTAL METHODS
Animal Assignments and Management ............... 82
iv

Page
Experimental Diets
A. Ration Components and Feeding .......... 84B. Dietary Intake Determinations .......... 89
Environmental ConditionsA. Cl lmatologlcal ....................... 90B. Rectal Temperature and Respiration Rates. 91
Milk Sampling and AnalysisA. S a m p l i n g .............. 93B. Transformation...................... 93
Blood AnalysisA. Blood Collection ........................ 94B. Development of Radioimmunoassays
1. Plasma Aldosterone Determination . . 952. Plasma. Cort1 sol Determination . . . 97
Statistical A n a l y s i s ............ 100
RESULTS AND DISCUSSION
Qualitative Reliability of RadioimmunoassayA. Aldosterone............................ 103B. C o r t i s o l .............................. 110
Respiration Rate and Rectal Temperature ........ 115
Feed Intake..........................................124
Plasma Aldosterone Levels ........................ 137
Plasma Cortisol Levels .......................... 144Milking Performance ................................ 153
CONCLUSIONS.............................................. 172
SELECTED BIBLIOGRAPHY ................................ 174
A P P E N D I C E S .............................................. 198V I T A .................................................... 224
APPROVAL SHEET .......................................
v

LIST OF FIGURES
Figure Page1. Relationship of temperature effect on
energy Intake, maintenance energy requirementand net energy for production............... 10
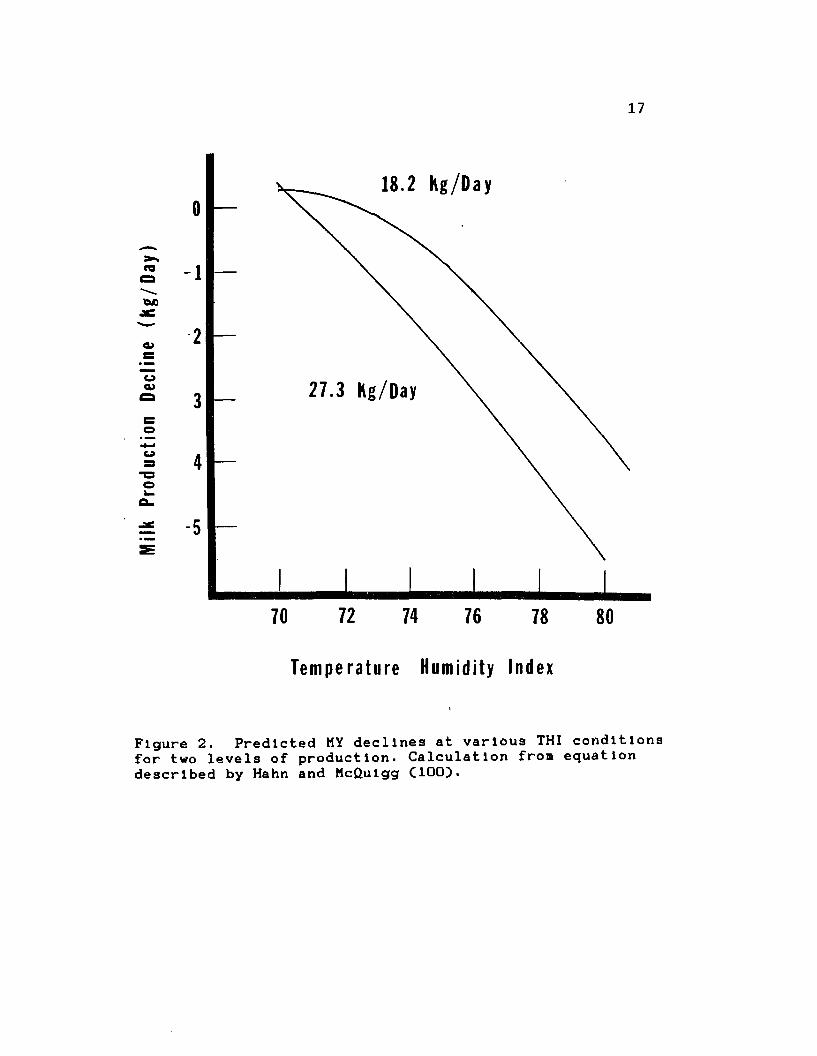
2. Predicted MY declines at various THI conditionsfor two levels of production........................ 17
3. Predicted MY declines and RT elevations toaffect of ETI at 2 m/s wind velocity................26
4. Synthesis pathways and location of majoradrenal corticolds ................................ 32
5. Some processes of acid-base balance In ruminantkidney tubule..........................................40
6. Cortisol responses to acute and chronichlgh-temperature exposure.............................49
7. Effect of dietary treatment on weekly RR ......... 1178. Effect of dietary treatment on weekly RT ......... 118
9. Effect of ETI on D M I ................................ 12510. Effect of dietary treatment on weekly means
of 3.5% F C M .........................................15411. Effect of dietary treatment on weekly DMI
and 3.5% F C M .........................................155
vi

LIST OF TABLES
Table Page
1. Nutrient composition of menhaden FM . . . . 62
2. Collective summary of FM Ingredientfeeding trials In lactating dairy cows . . . 77
3. Pre-trial description of experimentala n i m a l s ................... 83
4. Mean dally nutrient needs of experimentalanimals.......................................... 85
5. Nutrient composition of feed Ingredientsand total mixed d l e t 3 .................... 86
6. Composition of basal commercialconcentrate ................................. 87
7. THI of experimental p e r i o d .................... 928. Analysis of variance for model of
performance and physiologicalvariables.......... 101
9. Analysis of variance for model of dietv a r i a b l e s .................................... 102
10. Sensitivity of aldosterone antiserum toaldosterone standards In four RIA calibration curves ............. 104
11. Range of adrenal cortlcold concentrationsobserved In study.............................. 105
12. Sensitivity of cortisol antiserum to cortisol standards In four RIAcalibration curves .......................... 112
13. Correlation coefficients between RRand RT with climatic variables...............116
14. Cow mean dally nutrient Intakes............... 126
15. Nutrient content of DM consumed byexperimental groups ........................ 127
16. Cow selectivity of diet components...........132
17. Estimated RDP and UDP content ofdietary CP and animal requirements ......... 134
vii

Table Page
18. Correlation coefficients of cortisoland aldosterone with RR and R T ...............138
19. Effect of treatment diet on plasmacortisol and aldosterone levels ........... 140
20. Correlation coefficients of plasmacortisol with climate variables ........... 145
21. Correlation coefficients of milking performance with climate variables ......... 157
22. Effect of treatment on MY, milkcomposition and composition ratios ......... 158
23. Effect of treatment on milk compositionto diet composition r a t i o s ................... 162
viii
LIST OF APPENDIX TABLES
Table Page1. Amino acid content of SSFM reported
by commercial supplier ........................ 1992. Mineral content of SSFM reported by
commercial s u p p l i e r ............. 200
3. Vitamin content of SSFM reported bycommercial supplier .......................... 201
4. ETI of experimental p e r i o d .......................202
5. Plasma sample distribution In four RIAstandard calibration curves for both adrenal steroids................... 203
6. Listing of aldosterone RIA extractionprocedures............... 204
7. List of aldosterone RIA Incubation and separation activities of calibrationcurve and unknown s a m p l e........................ 205
8. Volumes and dilutions of aldosteroneRIA standards..................................... 206
9. List of volumes of aldosterone RIADAB and NSB s o l u t i o n s .......................... 207
10. List of cortisol RIA Incubation and separation activities of calibrationcurve and unknown s a m p l e ........................ 208
11. Volumes and dilutions of cortisol RIAstandards............. . 209
12. List of volumes of cortisol RIADAB and NSB s o l u t i o n s ............... 210
13. Other cheml.cals and reagents employed Insteroid RIA............. 211
14. List of other equipment used In steroidRIA................................................ 212
15. Linear regression statistics of loglt-log transformation of four aldosterone RIAstandard calibration curves...................... 213
ix

Table Page
16. Analysis of pool sample aldosterone andcortisol EIA variances ........................ 214
17. Linear regression statistics of loglt-logtransformation of four cortisol EIA standard calibration curves ..................... . . . 215
18. Sources of variation, degrees of freedom,and mean squares for EE and E T ..................216
19. Analysis of variance of DMI d a t a ................ 217
20. Sources of variation, degrees of freedom, and mean squares for plasma aldosteroneand cortisol ...............................218
21. Sources of variation, degrees of freedom, and mean squares for milk production and3.5% FCM ....................................... 219
22. Sources of variation, degrees of freedom,and mean squares for MFP and M F Y .............220
23. Sources of variation, degrees of freedom,and mean squares for MPP and MPY ............... 221
24. Sources of variation, degrees of freedom,and mean squares for MLP and M L Y ......... .. . 222
25. Sources of variation, degrees of freedom,and mean squares for milk component ratios . . 223
x
LIST OF ABBREVIATIONS
Abbreviation Description
ADF acid detergent fiberAF as fedAOAC Association of Official Analytical ChemistsA:P acetate:propionateASO<* ammonium sulfate solutionBGHI black, globe humidity IndexbSTH bovine somatotropinBUN blood urea nitrogenBW body weightC degrees Centigrade
carbon radioisotope CF crude fiberCl- chloride IonCOa carbon dioxideCON controlCONC concentrateCP crude proteincpm counts per minuteCS corn silaged daydf degrees of freedomDAB diluted antibodyDHIA Dairy Herd Improvement AssociationDM dry matterDMI dry matter Intakedpm dlslntergratIons per minuteECF extracellular fluidETI equivalent temperature IndexF degrees FahrenheitFAT milk fatFCM fat-corrected milkFM fish mealFMS fish meal supplementedg gramh hourH"* hydrogen IonHCO3- bicarbonate ion
potassium Ion kg kilogramLAC milk lactosem meterMeal megacalorieMFP milk fat percentMFY milk fat yieldml milliliterMLP milk lactose percentMLY milk lactose yieldmm millimeter
xi

AbbrevlatIon Descript ion
mmole ml11ixoleMPP milk protein percentMPY milk protein yieldMS mean squareMY milk yieldN nitrogenNa~ sodium IonNEj. net energy for lactationng nanogramNH*- ammonium IonNPN nonprotein nitrogenNRC National Research CouncilNSB nonspecific bindingP probability for Type I errorpC02 partial pressure of carbon dioxidepg plcogramPRO milk proteinr correlation coefflcentR2 coefficient of determinationRDP rumen degradable proteinRH relative humidityRIA radio Immunoassayrpm respirations per minuteRR respiration rateRT rectal temperatures secondSAS Statistical Analysis SystemSBM soybean mealSD standard deviationSE standard error of the meansSNF sollds-not-fatSSFM specially-selected menhaden fish mealTDN total digestible nutrientsTHI temperature-humldlty IndexTmax maximum air temperatureTMR total mixed rationUDP undegradable proteinul mlcrollterVFA volatile fatty acids

ABSTRACT
Twenty-four mld-lactatlon heat-stressed dairy cows
were paired in a completely randomized block design on
basis of breed, age, lactation number, calving date,
previous milk production and milk fat content In order to
evaluate experimental responses. Test treatment was a
50:50 DM corn s1lage-concentrate diet supplemented with A.75* DM SSFM. Animals were housed under natural summer
conditions for the duration of a 70-d experimental period
commencing In mid-June. Low roughage diets were slightly
below NRC requirements for both energy and crude protein.
DMI, MFP, and FAT:LAC ratio were statistically significant, with means and SE of 1A.56, 12.83 C±0.337)
kg/d, 3.71, 4.20 C±0.04) %, and 0.79, 0.877 C±0.010) for FMS and CON diets, respectively. Other milk component
contents and yields and component ratios were not
statistically significant. Though FM supplementation
Increased DMI, It also significantly decreased gross milk
production efficiency.Mean dally ETI and THI Index values for experiment
duration were 33.16 ± 0.86 and 78.02 ± 0.89, respectively
RR and RT for FMS and CON cows were 99.6, 105.4 C± 1.75) cycles per minute, and 39.7, 39.9 C± 0.12) C,
respectively. Differences In such high responses
Indicated that exceptional heat stress occurred.
Significant correlations between RT and climate indexes

were found only for the CON diet Cr > 0.21), while the FMS
diet lacked significance Cr < 0.03).
Plasma cortisol levels were not different between
treatments, yet plasma aldosterone was significantly lower
for the FMS group. FMS and CON diets mean plasma steroid
concentrations were 8.65, 8.61 C± 0.34) ng/ml and 217.5,
252.5 C± 6.10) pg/ml for cortisol and aldosterone, respectively. Cortisol correlated negatively with dally
Tmax In FMS cows, but not In CON cows. Cortisol
correlated positively with RR in FMS cows, only. Plasma
aldosterone did not correlate with RT, nor RR In either
treatment group. Plasma aldosterone may provide an Index
for evaluating levels of adaptability on varying Intakes
of nutrients during times of heat stress In the lactating
dairy cow.
Productive performance was not enhanced from Inclusion
of dietary FM, yet non-productive physiological
adaptability was Improved.
xiv
INTRODUCTION
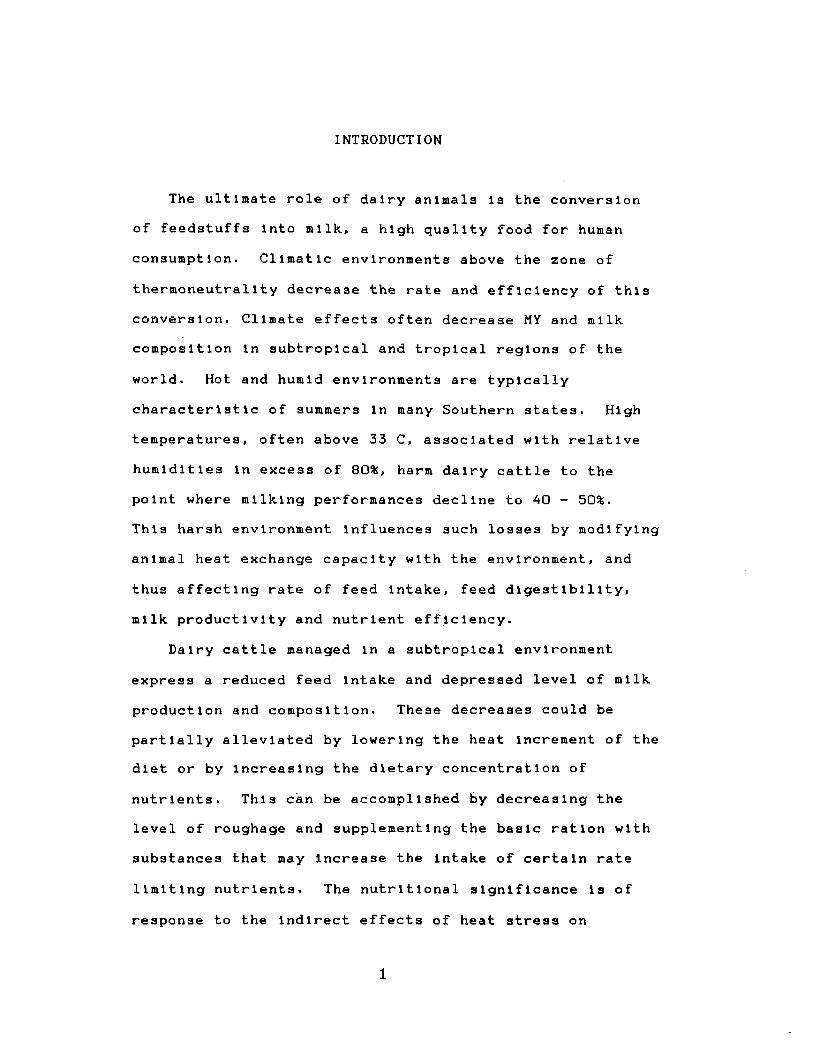
The ultimate role of dairy animals Is the conversion of feedstuffs Into milk., a high quality food for human
consumption. Climatic environments above the zone of
thermoneutrallty decrease the rate and efficiency of this conversion. Climate effects often decrease MY and milk, composition In subtropical and tropical regions of the
world. Hot and humid environments are typically
character1stlc of summers In many Southern states. High
temperatures, often above 33 C, associated with relative
humidities In excess of 80%, harm dairy cattle to the
point where milking performances decline to 40 - 50%.This harsh environment Influences such losses by modifying
animal heat exchange capacity with the environment, and
thus affecting rate of feed Intake, feed digestibility,
milk productivity and nutrient efficiency.Dairy cattle managed In a subtropical environment
express a reduced feed Intake and depressed level of milk
production and composition. These decreases could be
partially alleviated by lowering the heat increment of the diet or by Increasing the dietary concentration of
nutrients. This can be accomplished by decreasing the level of roughage and supplementing the basic ration with
substances that may Increase the Intake of certain rate
limiting nutrients. The nutritional significance is of
response to the Indirect effects of heat stress on
1

2
nutrition and physiology of the lactating cow-
Recent attention has been given to Inclusion of
elevated levels of rumlnally by-passable protein or UDP In the dairy ration. Such activity Increases total amino
acid supply at Intestinal sites of absorption at a time
when dietary Intake of nutrients Is In negative balance
relative to production potential. Since heat stress Imparts such drastic declines In protein consumption by
lactating dairy cattle, increasing the protein quantity
and quality per unit of dry matter has potential for
fulfilling protein and energy voids In demands of high
mllk-produclng animals.
Menhaden fish meal Is abundantly produced In Louisiana
as a by-product of the menhaden fish oil Industry. In
1988 more than 607,000 metric tons were produced In
southern Louisiana alone. The high level of CP and high amounts of UDP fractions suggest a favorable potential for
utilization as a superior protein supplement In early
lactation and periods of heat stress.
While the results of this study give no Indication ofthe optimum amount of SSFM to be Included In the lactatingcow's diet, It does correlate many facets of dairy
nutrition to heat stress physiology In the lactating dairy
cow.
The objectives of this study were:
1. To evaluate the level of dietary DM and nutrient
Intake of a dairy ration In response to FM supplementation

3
In heat-stressed lactating dairy cows.
2. To evaluate the Influence of highly undegradable SSFM as a dietary supplement upon milking performance In
mld-lactatlon dairy cattle exposed to naturally occurring
ambient heat stress.
3. To determine the responses of physiological heat
stress Indicators and evaluate glucocorticoid and mineral
cortlcold levels as Indicators of carbohydrate,
electrolyte and water metabolisms upon differences In UDP
Intake from supplementary FM.

REVIEW OF LITERATURE
Effects of Heat Stress
A . Genera 1
Physiological and nutritional posture of the lactating
dairy cow ultimately determines the state of equilibrium
with the environment. Eminent priority Is set on
regulation of homeostasis, which encourages domestic
animals to physiologically compensate for adverse
conditions. These compensations sway the efficiencies of
growth, reproduction and milk production.
Thermal, energy and water balances must be observed to
maintain mean body temperature and sustain animal
endurance. Many physiological mechanisms are Involved In the acclimation to stressors, I.e. heat stress. Various physiological schemes Include decreased feed Intake,
Increased sweating and fluid consumption, alterations In body fluid distribution and decreased lacteal secretion. These changes and compensations, among other homeothermlc behaviors, are largely Influenced by the additive effects
of all stressors, and are Indirectly mediated by the
animal's neuroendocrine system.
Severe nutritional and metabolic changes often seen as
responses to heat stress Include adjustments In feed
consumption and digestibility, energy, protein and
electrolyte metabolisms, water balance, acid-base balance,
4

5
and endocrine status.Morrison C162) and Dantzer and Mormede C61) attempted
to modernize the definition of heat stress In farm
animals. A collective synopsis of their definitions would
lie In discussion of afferent and efferent mechanisms,
many of which are poorly understood. However, this author
defines heat stress aa a normal, short and long term
physiological reflex, precipitated by unfavorably high
ambient temperatures, high air humidities, high thermal
radiation and low air movement, which results In temporary
failure of efficient adaptive mechanisms maintaining
homeothermy. Dantzer and Mormede C61) state that today's
livestock, are prone to higher levels of unfavorable consequences of total stress, as Increasing genetic
selection, environmental management and heat stress orient
metabolism towards anabolism instead of catabolic defense
mechanlsms.
Dairy cattle, known for large production of human-
consumed nutrients per animal, undergo much higher degrees of metabolic rates than other ruminant or nonruminant
species. Dairy cattle diets lead to induction of large thermogenic effects resulting from higher degrees of heat
of fermentation C16, 170).
When dairy cattle are managed In environments above
their zone of thermoneutrallty, metabolic adjustments must
be generated to maintain homeothermlc conditions. Higher
milk producing animals are more heat sensitive, due to the

6
additivity of common stressor agents C118, 119, 120, 121).

7
B . Dietary Intake
In order to maintain homeothery, heat production needs to balance heat loss. Reduction of feed Intake and consequently, consumption of optimum amounts of essential
nutrients for production are decreased, unless their diet density Increases In scale to the lower dietary DMI C7,
19, 170}- Since feed nutrients must enter the blood, I.e.
serum protein, glucose, VFA, before conversion or
filtration Into milk synthesis, any alteration causing
Inefficient utilization of these substrates will compound
the effect of lowered DMI.
An Increase In water Intake due to elevated body temperatures reduces DMI, as gut fill becomes a larger percent of rumlnal content. When a certain level of
rumlnal distention occurs, cattle will terminate a meal. However these tension or pressure receptors have not yet
been histologically Identified C16D. Thus, If water Is
the predominant mass occupier In the rumen, there could be
Insufficient potential space for future DM.Frequency of rumlnal and gut motility Is also
decreased, which leads to a reduction In rate of dlgesta
passage C13, 170). This rate-llmltlng process will
decrease the amount of food material that can be lnputed
due to limited rumen space. Lowered DMI will subsequently
result in a lower energy input. Much as dietary energy
and fiber are of higher digestibility In a heat-stressing

environment* total efficiency of utilization of energy for
MY Is reduced about 30 to 40% C19.170, 219, 248). In
addition, sustained RE may also Interfere with the choice
of physical activity of feeding and rumination C143). The
cost of the muscular effort to respire rapidly stems from
Increased body metabolism to decrease the extra heat load, and makes an exhibition In higher maintenance requirements. Ames and Ray C7) described the maintenance
requirement as becoming elevated 7% for short rapid panting due to heat stress. The mechanism of cooling
costs about 4 times more energy than the cost of an
equivalent cooling effect observed via sweating C143).
Body temperature will elevate when the higher rate of
respiration falls to compensate the excess body heat.
Brobeck C32), In 1948, was one of the first to describe
the relationships between ambient temperature, body
temperature and feed Intake. He observed a decline of
feed Intake with rising temperatures, and that the start of this decrease was concurrent with an elevation In BT
C32). Worstell and Brody C254) found the upper temperature at which Intake begins to decline Is 24 to 26 C for Holstelns and 26 to 29 C for Jerseys. Davis et al.
C62) reported that lactatlng Holstelns decrease voluntary
feed Intake by 20% at an environmental temperature of 32
C. Ragsdale et al. C203) revealed that a 40 C environment
caused a complete cessation of Intake In both Holstelns
and Jerseys. McDowell C152) reported that a 5% dietary

reduction of concentrate and a 22% decrease of hay consumption was observed In lactatlng dairy cows exposed to 30 C as opposed to those housed at 18 C. Ll et al. C139J observed feed Intake decreases of 10.0 kg/d and 16.A
kg/d of lactatlng Holstein cows subjected to 32 C-50% RH
and 32 C-80% RH, respectively, over a control group housed at 20 C-50% RH.
With reduced DMI and elevated maintenance
requirements, MY can decline by 33% at an ambient
temperature of 35 C, while at 40 C, yields may drop to 50%
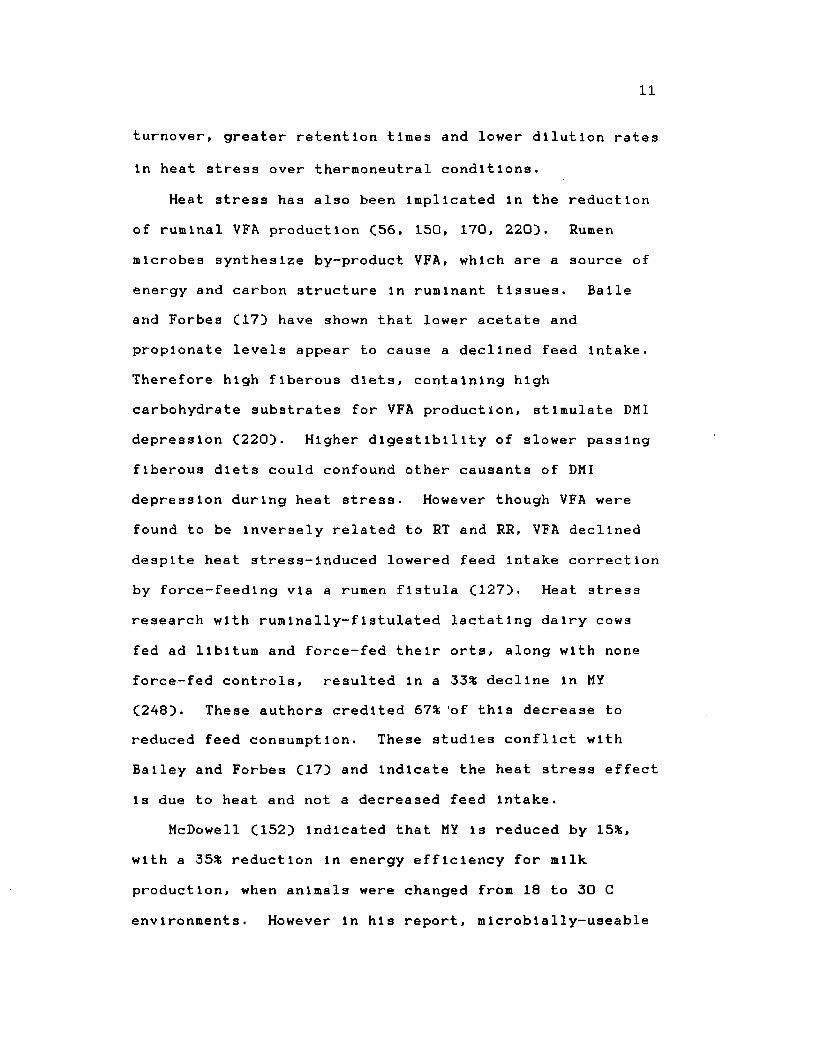
C169}- Figure 1 Illustrates the relationship between
voluntary DMI and physiological maintenance requirements to environmental temperatures.
The NRC C169) states that statistical correlations
between climatic variables and dally MY range from -0.35 to 0.30. The temperature range possibly Included low to
above normal temperatures and may not be consistent with
heat-stressing climates alone.
Wayman et al. C248J have shown that slowei— paced dlgesta passage may rationalize greater coefficients of digestion during hot temperatures. Supporting this concept, Warren et al. C247J observed an 18% longer
rumlnal retention time at 32 C compared to 18 C. In 1988,
Schneider et al. C220J were the first to measure actual
rates of solid and liquid rumlnal phases passage In
lactatlng dairy cattle during heat stress. These
researchers found significantly lower rates of solid

Meg
acal
orie
s
Lower Cri t i ca l Upper C r i t i c a lT e m p e r a t u r e T e m p e r a t u r e
X - .... _ 1N
s \ ne t i n t a k e\ \ \ \ \
ma i n t enance \ N\ \" ' U ' '
c o l d - T N Z — h e a t
T e m p e r a t u r eFigure 1. Relationship of temperature effect on energy Intake, maintenance energy requirement and net energy for production. Drawing is modified from Ames and Ray C7).
11
turnover, greater retention times and lower dilution rates
in heat stress over thermoneutral conditions.
Heat stress has also been implicated in the reduction
of rumlnal VFA production C56, 150, 170, 220}. Rumen
microbes synthesize by-product VFA, which are a source of
energy and carbon structure in ruminant tissues. Balle and Forbes C17} have shown that lower acetate and propionate levels appear to cause a declined feed intake.
Therefore high flberous diets, containing high
carbohydrate substrates for VFA production, stimulate DMI
depression C220}. Higher digestibility of slower passing
flberous diets could confound other causants of DMI
depression during heat stress. However though VFA were
found to be Inversely related to RT and RR, VFA declined
despite heat stress-induced lowered feed Intake correction
by force-feeding via a rumen fistula C127}. Heat stress
research with rumlnally-f1stulated lactatlng dairy cows
fed ad libitum and force-fed their orts, along with none
force-fed controls, resulted in a 33% decline in MY C248). These authors credited 67% of this decrease to reduced feed consumption. These studies conflict with
Bailey and Forbes C17} and indicate the heat stress effect
is due to heat and not a decreased feed Intake.
McDowell C152} indicated that MY is reduced by 15%,
with a 35% reduction in energy efficiency for milk
production, when animals were changed from 18 to 30 C
environments. However in his report, microbially-useable

12
N may have been limited, possibly explaining large energy def flclency.
During thermoneutrallty, lactatlng cows may consume 4
times maintenance DM because of milk, production demands, lower rumen digestibility and faster dlgesta passage
C158). CP supplementation to such diets has been shown to
help correct this decrease (243, 178, 186}. Higher N
Input apparently permits Increased microbial growth, and
thus fermentablllty of organic matter. Theoretically this supplement should be one of high rumen solubility or degradabl1lty.
Under heat stress conditions, however, the lower DMI
levels may possess appropriate N fermentation potential,
but at a lower overall level. As a result the animal's
requirement for protein Is Increased similarly to that
elevation required for very high milk producers. Under
either condition, a substantial level of additional rumen
UDP should be of benefit to fulfilling the protein requirement (170).
HRC (171) states that any extra energy that Is not fermented by the microbes will tend to reduce overall carbohydrate digestibility and voluntary energy Intake.
An appropriate reserve of RDP Input la constitutive to
magnify both DMI and rumlnal digestibility. On the other
hand, excess N, especially from RDP sources, not utilized
by bacteria and protozoa will be lost to the system as
ammonia. Kaufmann (126) states that under these
13
conditions, elevated BUN concentrations will result along
with lowered protein content In the milk.. Low MPP Is
thought to result from a mlcroblally-produced protein
shortage generated by a deficiency of fermentable energy
sources C171). Futhermore, the consumption of sufficient
energy, with excess RDP, will result In high BUN along with normal milk protein concentrations C126). In
addition, excesses of dietary CP may tend to diminish the
energy source, since there appears to exist an energy cost for deamination of the protein In preparation for
excretion as ammonia or urea. This energy expenditure seems to be taken as a larger portion of ME not Included
In the NEi fraction, and appears as heat production C171}.
Oldham and Smith C178) determined that this Inefficiency
was accountable to declined milk production.Formation of ammonia must be nullified by
detoxification Into urea via the liver C84, 950 or
excreted as NH*'* C106J. Thus the steroid, aldosterone and
Its relationship to heat stress enters the scheme. This
Is discussed In detail In another chapter.Kamal and Johnson C1250 detected a 69% decrease In N
retention when cows were 32 C housed, a3 compared to those
In a 18 C environment. DMI In their warmer treatment was
observed to be only 60% of the 18 C control treatment
cows' Intake, and was a contributing factor In such a
negative N balance. Ammonia detoxification activity has
been shown to decrease blood glucose formation from
14
propionate C249), thus lowering a major substrate normally
used for milk carbohydrate synthesis C4, 113, 119, 138, 206). This also Implies that depressed glucocorticoid production from continued heat stress conditions may cause
gluconeogenic depression In muscle and liver tissue C239).
In addition, propionate levels may be depressed from heat stress factors C17, 88).
Potassium and sodium appear extremely Important during
heat stress C19, 20, 55, 57, 67, 219, 220, 221), and are
chief regulators of body water balance. Since heat stress
causes a decline of serum K* and Na"*", research has proven
that supplemental dietary additions of the cations will Increase MY by Increasing DMI C207, 219, 250). The
greater potassium and/or sodium concentrations In the feed
and the Increase In DMI aids to fill a physiological void
of K-* and Na"* In the tissues.
Other potential strategies for feeding heat stressed
lactatlng dairy animals Include dietary provisions of rumlnally-bypassable fats, fatty acid salts and weak caustic salts C94, 196, 197). Weak alkali Is often fed to buffer the high acid production Clow pH) from high grain and starch diets, to permit higher cellulytlc activity of
rumen microbes. This would thus Increase energy
efficiency of utilization for milk production, yet cause
Increases In feed Intake. Rumlnally bypassable dietary
fat Is frequently fed to Increase the energy available for
post-rumen absorption. If fed correctly, Its levels do
15
not Interfere with digestibility, nor DMI. Both of these
recent approaches may Influence MY and composition, but
neither fall within the subject of this document. NRC
C171) has recently published excellent reviews in those
area s.
Prediction equations are available for estimating DMI
and milk, yield based upon Intake C38). However, as
specific as the coefficients appear, there are no climatic
variables included as correction factors. Those equations often lead to development of computerized programs for
ration formulation that should fulfill the needs of modern
dairy cattle. Some equations, however, contain variables that accurately reflect production responses of cows to
varying quantities and qualities of feed DM during times
of heat stress. These have arisen from the agricultural
engineering society C15, 100}, and are most appropriate
for estimating DMI and MY declines stemming from various climatic conditions.

16
C . Milk. Yield and Composition
As previously discussed, elevating environmental
temperatures beyond the zone of thermoneutra1lty result In
lowered DMI and thus, nutrients available as substrates for milk synthesis. The optimum temperature for MY was
evaluated to be approximately 10 C by Ragsdale et al.
C202). At 40 C productivity of experimental cows was only
25% of MY at optimum temperatures. Johnson and Vanjonack
C119J described the zone of thermoneutrallty for lactatlng
cows to be 1.7 to 21 C. Johnson et al. C117, 118} noticed
that milk production responses to high temperatures was
dependent upon heat tolerance and on current MY. In a
review article, Johnson and Vanjonack C119} stated that
physiological compensations Influencing MY depend upon
observance of Individual lactatlng cows' zone of
thermoneutrallty, and that this depends upon breed, degree
of acclimation, level of MY and/or DMI.
Brody C34J determined that a chamber temperature pattern of 20 to 38 C caused MY declines of about 20% In Holstelns and 8% In Jerseys. However, after an acclimation period of 7 d, this depression became much
smaller, Indicating adaptation to the temperature
stressor. In Louisiana, Branton et al. C29}, found an
average dally 4% FCM decline of 0.97 kg per degree F
Increase In RT above normal.
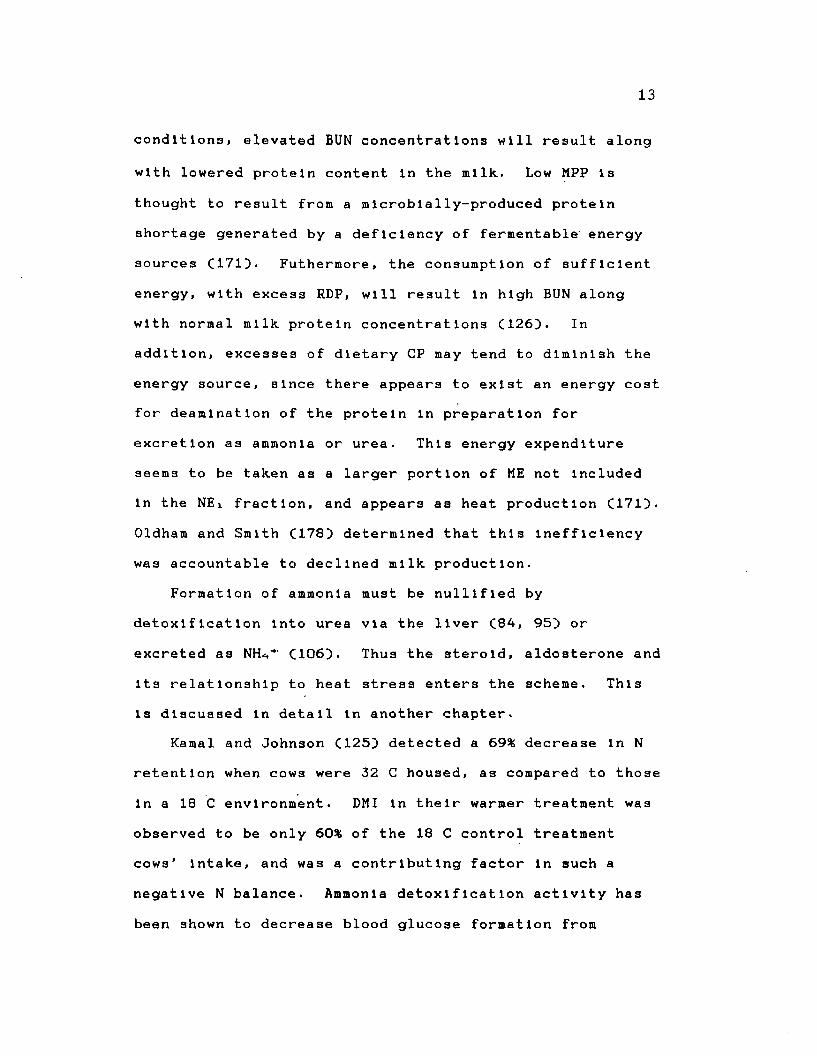
Figure 2 was calculated from the equation described by
Milk
Prod
uctio
n De
cline
(K
g/D
ay)
17
1 8 . 2 K g / D a y0
1
22 7 . 3 K g / D a y3
4
5
7270 74 76 78 8 0
T e m p e r a t u r e H u m i d i t y I n d e x
Figure 2. Predicted MY declines at various THI conditions for two levels of production. Calculation fron equation described by Hahn and McQulgg ClOO).

18
Hahn and McQulgg C10CO upon 18.2 and 27.3 kg dally milk
yielding dairy cows. MY decline starts at approximately 70 to 72 THI, with drastic decreases at 77 to 79 THI. The
relationships express the importance of heat stressful
environments on cow productivity.In New York, Moust and McDowell C163D determined that
only 9% of the variation In milk yield was attributable to
climate during the summer conditions. Through milk
decline prediction equations, Including combinations of
meterologlcal variables of air temperature, dew point
temperature, RH and air velocity, Hahn et al. C100D and
Baeta et al. C15) demonstrated extremely low levels of MY
could be expected. These predicted reductions are 3.2 kg
milk per day from THI values of 77.75 F and 10.2% from ETI
values of 32 C.
Ingraham et al. CHID found milk production decreased
0.32 kg/d for each 1 unit Increase In THI. Johnson et al.
C118D also estimated a similar milk decline of 0.318 kg/d for each unit Increase In THI above 72 units. Johnson C120D cited that differences in rate of milk decline varied with period of lactation curve. Declines of 0.9,
0.43 and 0.48 kg/d per unit THI Increase were reported
from data collected at the University of Missouri C120D.
Higher producing lactatlng dairy cattle are Influenced
more by heat stress, because the zone of thermoneutrallty
Is shifted downwards for the lower producers C57, 99, 100,
117, 119, 120, 121, 202}. This Is especially observed

19
among the higher and lower producing dairy breeds (119,
143, 257). Surpassing priority Is positioned on thermoregulation, shifting away from the productive functions of lactation (549-
Blanca C239 reported that lactatlng cows Increase
metabolic heat production by 22 kcal/h for each kilogram of 4% FCM produced. This would offer an explanation for
higher producers appearing to suffer from heat stress to a
greater extent than lower producers.
Feeding high and low CP diets to lactatlng dairy cows
during heat stress exposures significantly Influenced milk
production In favor of the high (20.8%9 diet (1039- However, since the high protein diet also Increased DMI,
It was possible that Increased protein Intake was
confounded with Increased total energy Intake. Higher
correlation coefficients of dally MY to DMI and TDN were
higher than that with CP Intake (0.36, 0.36, 0.25,
respectlvely9 (1039-Ott and Roussel (1949 obtained significantly higher MY
responses from a high protein diet (17%9 over low (13%9 protein diets and diets of high protein consisting of untreated whole cottonseed.
Heat stress trials with dairy cattle utilizing varying
dietary levels of CP are not common. However, there are
many documented that Include quantity and quality of CP
Intakes within diets that are highly energy concentrated,
containing 11 to 15% ADF. Such diets are thought to be

20
applicable to any condition which decreases DMI, I.e. heat
stress C7, 1325.
The negative relationship that frequently exists
between MY and MFP has also been shown to occur under
under heat stress C53, 151, 152, 163, 2025* In Arizona,
Davis et al. C625 examined variations of milk components by seasons. Those efforts determined that MFP declined
0.1% for each 10 F rise In dally Tmax. It was concluded
that environmental temperature exerted a more pronounced Influence on milk and milk fat production than did the
advancing stage of lactation.
McDowell et al. C151} found that changing the air
temperature from 15-24 to 32 C, decreased MFP from 3.4 to
2.4%, but Increased to 2.8% after a two-week acclimation
period. Moust and McDowell C1635 calculated that the variation In MFP during naturally heat stressing periods was approximately 10%. In another report by McDowell
C1525 a drop of 39.7% occurred In MFP when cows were exposed to a 30 C environment opposed to an 18 C environment. However, Collier et al. C555 found no such effect of heat stressful environments upon MFP. In
addition, Stanley et al. C232) observed that temperature
had no effect on MFP when cows were fed low C0NC diets.
It was concluded that high C0NC diets depress MFP to large
extents during heat stress periods. Apparently metabolic
rates Influence MFP but not heat stress directly. Recent
studies using somatotropin to artificially elevate

21
metabolism during heat stress have shown slight Increases In MFP and MFY, along with higher RR and RT C231).
Dietary protein levels have caused conflicting results on MFP and MFY C112, 115, 164). Ipsen C112) reported that
a high fraction of digestible protein In a 18% CP diet
lowered MFP. Contrary to this, Mudgal and Lai C164) found
higher levels of MFP when cows were fed diets high In digestible protein.
Feeding diets high In digestible protein and energy to
heat-stressed cows may be lucrative, since the heat
increment of these types of diets Is lower than those of
higher roughages. However such diets tend to decrease
rumen pH. In addition, Increased respiratory alkalosis
caused by heat stress, disrupts acid-base equilibrium further C174, 219).
Jacquette et al. C115) participating In non-heat
stress research with a CS diet, found that high protein
concentrations did not lower MFP. Similar MFP were found
with low CP and high degradable-hlgh CP diets, and these
provided higher MFP than a conventional high CP diet. However when diets were changed to that of lower fiber content Cll% ADF) MFY Increased 9% for the high CP diet,
yet decreased 15.6 and 8.9% for the low CP and highly
degradable-hlgh CP diets, respectively. This suggests
that diets conducive to normal fat tests may not allow the
higher level .of responses as those of a lower milk fat
tendency C182, 185, 193). High protein diets with

22
appreciable amounts of UDP may attenuate the severity of
milk, fat depression. The observed effects of high protein
on milk fat depression were not uniquely due to higher
dietary nitrogen Intake C115}. The more undegradable the protein source, perhaps the less rumen ammonia available
for microbial propagation. This would explain the results
of Jacquette et al. C115}, especially If the high fiber
diet C23 % ADF} provided optimum substrate for microbial
catabolism. Others have observed similar results C179, 230}.
Other workers C103, 193, 219, 222} however, failed to
observe any effect of varying protein levels on MFP.
Hassan C103} In a Louisiana heat stress study, failed to
show any difference between high and low CP diets In MFP
nor MFY. This Investigator concluded that dietary CP Is
not Involved In milk fat synthesis, even though observed non-slgnlfleant correlation coefficients of MFP and MFY
with CP Intake were -0.14 and 0.27, respectively.
However, Russel and Hespell C212} suggest that rumlnal degradation of protein Into amino acids could provide a source of acetate that could elevate A:P ratios, and thus
MFY. This possibility has not been Investigated under
heat stress conditions.
Oldham et al. C182} provided a discussion on the
effects of high protein levels by using a FATsLAC ratio
variable to Indicate tissue energy balance. Milk fat ha3
been observed to Increase to the point where the ratio Is
23
elevated. Oldham (182) stated that the mechanism responsible for this occurence has yet to be dl stlngulshed.
Despite the abundance of literature on milk
composition, the number of Instances In which milk lactose
Is partitioned out of the SNF fraction Is scarce. If milk
ash content Is assumed to remain constant, milk protein
and milk lactose variables could vary Independently of
each other, possibly leading to erroneous conclusions.
According to Oldham (182), when an Increase In MY Is
observed from feeding protein supplement, almost always a
concurrent Increase In MLY results. MLP normally does not
vary with dietary or environmental factors that Influence
MFP and MPP C182, 218). Therefore positive MY responses
Indicate that dietary protein Is associated with lactose
synthesis from glucose (182, 185, 193). At this time, It Is unclear as to whether this results from Increased
glucose production from pyruvate In the liver, or from
Increased efficiency of the liver or from Increased efficiency of the conversion of glucose Into lactose of the milk secreting cell.
Increasing dietary energy or digestible protein
components has resulted In elevated MPP C103, 164, 201).
Prevltt et al. C201) revealed that Increasing CP levels In
the diet significantly raised the MPP. However, others
have not found such differences (156, 176, 230).
Hassan (103) found significantly larger MPP and MPY In
24
a 20.8% CP diet over one of 14.3% CP fed to heat stressed
dairy cows. He al3o determined that most of the protein
Increase arose from casein. Casein Is generally known to
be synthesized from blood amino acid precursors C218}.
Hassan C103) suggested that an Increase In the uptake of amino acids permitted Increased synthesis of milk protein and that these substrates were ultimately supplied by the
higher protein diet.
Horner and Herzer C107) studied milk composition from
field-collected milk samples throughout a 12 month period,
and determined that total protein levels were lower In the
summer than In the winter. That study Indicated that MPY
become diminished during natual heat stress, as
significant decreases In MY have more Impact on MPY than
MPP.Milk protein can be responsive to DMI and has been
observed to Increase at a higher rate than lactose C182}.
However the Influence of dietary protein to milk protein
Is usually minor and difficult to detect statistically
C182, 196}.

25
D . Physiological Repsonses
1. Cllmatologlcal Indexes.
Coppock et al. C57) said that two of the first
physiological strategies Initiated In cattle exposed to
heat burdens are elevation In RR and body temperature. It
has been observed that the RR and RT of lactatlng dairy
cattle under heat stress with high humidity Is greater
than those under a lower humidity C15, 23, 78, 100, 119,
143, 202). The THI and ETI were developed as consequences
of those observations C15, 100). Physiological responses
approach a practical parallelism of air moisture slopes of
the psychrometrlc chart. Thus, a high correlation exists
between environmental Indexes that correct minimally, for
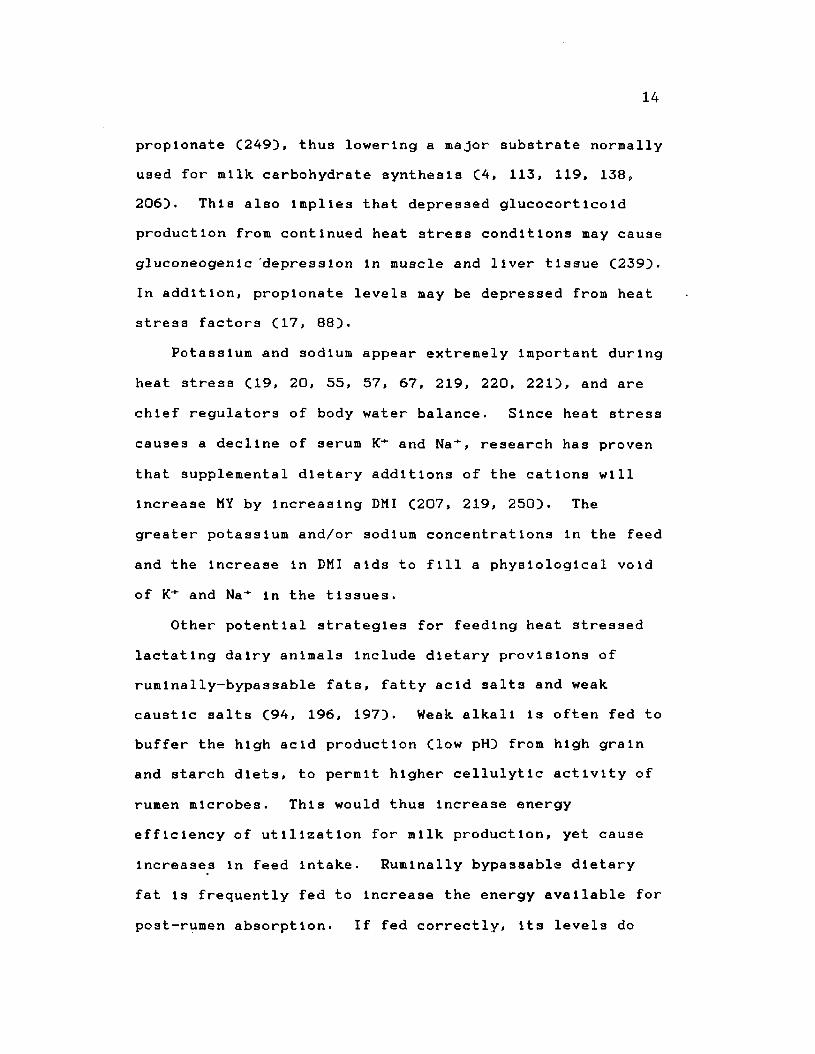
air temperature and air moisture content. Figure 3, taken
from Baeta et al. C15), Illustrates slopes of predicted RT
and MY declines for temperature-humldlty combinations with
an air velocity of 2 m/s.
These Indexes have been validated as describing animal
responses to the climatic environment much more effectively than maximum temperatures or average dally
temperatures. This results from the Inclusion of a
physiological latent heat of evaporation of animal
moisture capable of cooling the heat-stressed animal.
This evaporation occurs from expired pulmonary air
Cpantlng) and from the air— animal Interface Csweat
evaporation). High air moisture content will Inhibit

RELA
TIVE
HU
MIDI
TY
(%)
26
M il k Change (%) 0.4 0.5 6.3 13.7 22J 32.4146.9 63.9
(C)
9038.5 38.5 38.6 38.9 39.3 39£ 40.5141.4 42.4
80
70
60
50
40 4226 34T E M P E R A T U R E ( ° C )
Figure 3. Predicted milk, declines and rectal temperature elevations to effect of ETI at 2 m/s wind velocity.

27
animal moisture evaporation and thus rate of cooling.
As dehydration commences In a heat-stressed animal,
core body temperature will elevate, causing an Increased
need to eliminate extra heat production, especially
through evaporative cooling C128, 257}. Worstell and Brody C254} and Yousef et al. C257} also discuss the response of RT to Increasing animal heat production upon
Increasing ambient temperature and RH.
Body temperature can be defined as core temperature
and denotes the specific degree of Input that the
thermally-respons1ve hypothalamus responds In temperature
regulating mechanisms. The normal path of radiation Is
from deep body core through tissue to the skin surface
C82}. Skin temperature Is considered as an output, while
core temperature, an Input. The heat load from
environmental disturbances affects the rate of heat
transfer through skin temperature resistance. Extra heat
at the skin surface may be dissipated directly through radiation to the air or through latent heat of evaporation
via evaporation of skin moisture from sweating or breathing. Nevertheless, rate of core temperature dispersal Influences body temperature at any given time
C78).The BGHI of Buffington et al. C42} assimilates effects
of air temperature, net radiation flux, air movement and
air humidity Into ah Index to describe non-evaporat1ve
heat loss potential, as It relates to RR. Finch C78}
28
estimated body heat storage and tissue conductance by
using ET and mean skin temperatures weighted In a ratio of 86:14, respectively.
Under natural conditions, physical apparatus of thermocouple attachments often makes skin temperature data
collection Infeasible. Accordingly, most current research
uses RT alone without adjustment for estimation of body
temperature. However researchers who enjoy the resource
of environmental chambers, especially In recent years,
actively use BGHI C57, 219}.
As a result of higher response correlations, many
animal scientists C57, 220, 231, 253} are adapting Index use In evaluating climatic stress of animals.
2. Respiration Rate
RR and volume of respired tidal air Increases rapidly
from 16 C In lactatlng Jersey, Holstein and Brown Swiss cattle C74, 254}. Gaalas C81} witnessed sharp Increases
at temperatures greater than 20 C. Normal RR for non
stressful conditions are described at 20 to 22 cycles per minute C81, 130, 211}. At weekly mean THI values of 77.6
to 79.4, Coppock et al. C57} reported a mean rate of 67.2
cycles per minute. In a Louisiana study, Hassan C103}
reported significant rates of 75.3 and 72.9 cycles per
minute for low protein and high protein diets,
respectively. He concluded that cows consuming higher
protein diets are less thermally stressed In environments

29
with a mean THI of 78.6, thus explaining the lower rates
Incidental to the higher protein-fed cows. Ll et al.
C139} reported Increases of 54 and of 65 cycles per minute
for lactatlng Holstelns housed at 32 C-50% RH and 32 C-80%
RH over a thermoneutral control at 20 C-50% RH. Relk. and
Lee C205}, from their study of lactatlng Jerseys, concluded that elevated RR Is a bodily attempt to redeem
the failure of other heat dissipating mechanisms, since body temperatures are not controlled exclusively by higher respiratory levels. However, Ott and Roussel C194} and
Hassan C103} have shown that higher RR prevents elevations
In RT. In Arizona, Higginbotham and Huber C105} reported
that 16% CP diets of high degradabl1lty lowered RR
compared to a diet of equal protein, but of lower RDP.
However, It was also seen that In a 19% CP diet, the
highly degradable protein diet was responsible for higher
RR. In no diets was RT statistically different C105}.
3. Rectal TemperatureEsmay C74} states that typical body temperature for
cattle Is 38.5 C. Significant elevation of body temperatures occur when evaporative and non-evaporat1ve means of heat dissipation are Inadequate to purge surplus
body heat C24, 57, 152}. RT Is one of the better
Indicators of physiological response to heat stress, as It
nearly always remains constant under non-stressful
environments C57, 152}. Finch C78} detected a significant
positive curvilinear relationship CR2 “ 0.67 to 0.82}
30
between RT and ambient temperature, and a very significant linear regression of air temperature with skin temperature. The regression coefficients Indicated a +0.22 C Increase In skin temperature above normal body temperature per degree C Increase In ambient temperature
C78}. Hahn and McQulgg C100} also observed mean RT
Increases of 0.12 C for each unit Increase In THI, above 72 units.
Ll et al. C139D reported Increases In RT of 1.4 and
2.5 C In lactatlng Holstelns exposed to 32 C-50% RH and 32
C-80% RH over a experimental control environment of 20 C-
50% RH. McDowell C152} states that a RT of only 1 C or
less Is sufficient to reduce performance In most species
of livestock.
Johnson et al. C123} reported RT of lactatlng Holstein
cows of 100.8 and 101.7 F, reared In 70 F-74% RH chamber
and permanent pasture, respectively. Klehl C129} compared
two groups of lactatlng Holstein cows exposed to 20 C and
29 C, and encountered a statistical difference at a mean RT mean difference of only 1.0 C.
Hassan C103} failed to find differences In RT between
cows fed 14.2% CP and 20.7% CP. It was concluded that the
higher RR observed In the lower protein group was adequate
to keep RT at control levels. Ott and Roussel C194J also
observed significantly lowered RR In a high protein diet
fed to lactatlng dairy cattle, without a change in RT.

31
4. Biosynthesis of Adrenal Steroids
Aldosterone is the major mlneralcorticold produced by
the zona glomerulosa of the adrenal gland C96, 242} and
exhibits about 95% of the mlneralcortleal activity of the
adrenal. The only other mlneralcorticold is 11-
deoxycortlcosterone, which is normally found only in trace
amounts C65, 110}.
The chief glucocorticoid hormones produced by the
bovine adrenals are cortisol and corticosterone C97, 242},
with cortisol being the higher of the two. Since the low
levels of corticosterone contingent to cortisol, as well
as the mostly constant scale of the two cortical steroids in most studies, experimental determination need not be so
specific for cortisol alone C119, 234}. Others C97, 242} have also shown that these two glucocortlcoids commonly
respond to identical stimulators, i.e. ACTH.
Ayres et al. C14} were the first to obtain evidence
that the zona glomerulosa was the anatomical site of aldosterone origin in cattle. Tissue incubations Included pure glomerulosa and pure fasciculate slices, which were analyzed for steroid production. Those researchers found
that the per unit weight glomerulosa slices produced 500%
more aldosterone, 40% more corticosterone and 60% less
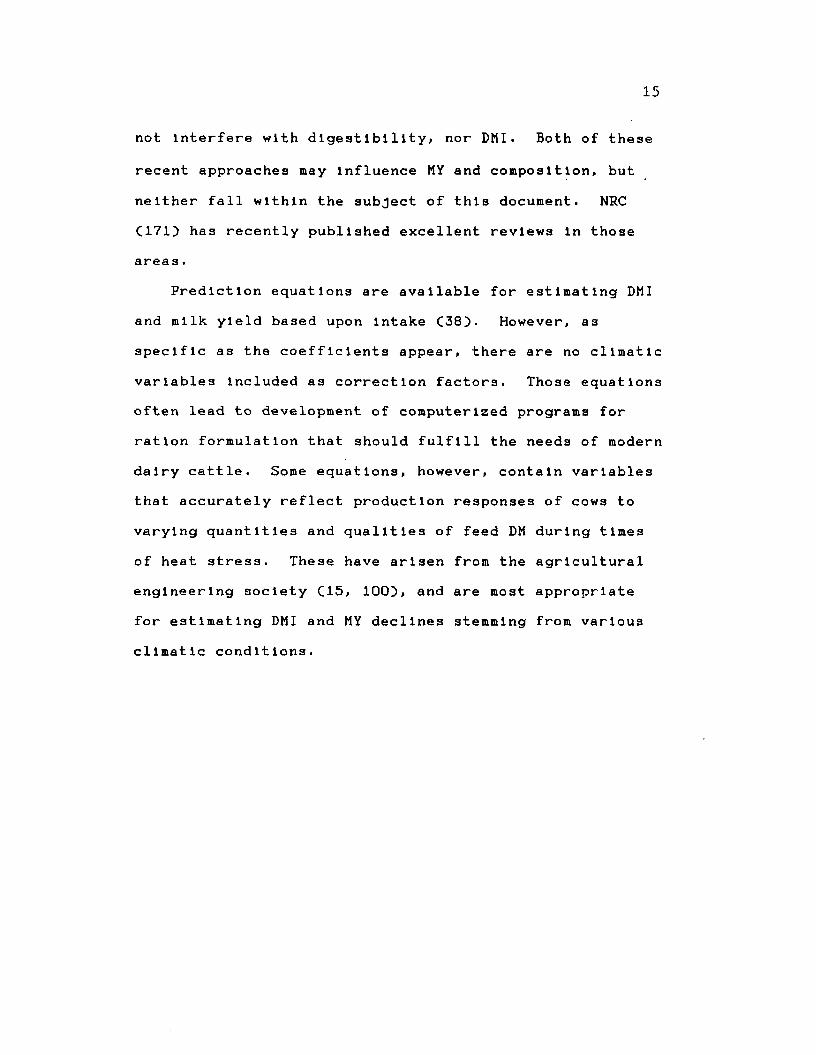
cortisol, than the fasclculata slices. Figure 4 outlines
zona differences and biosynthetic pathways of the three
major adrenal steroids. As indicated, all adrenal

32
Cholesterol Pregnenolone
Progesterone 17 - Hydroxypregnenolone CH3i °c=o
c h 2 o h
- O H
11 - DeoxycorticosteroneCH2 OH
CorticosteroneI 9 9h2°hHC C = 0
A l d o s t e r o n e
17 -HydroxyprogesteroneCH2 OH
11 - Deoxycortisol
C o r t i s o
9 H 2 OHc=o
- O H
'Figure 4. Synthesis pathways and location of aajor adrenal cortlcolds.

33
steroids are derived from cholesterol, which Is abundantly found In the gland's llpld-laden Inactive cyctoplasm. The
cyclopentanophenanthrene ring of cholesterol undergoes transformation by hydrolytic, dehydogenlc and oxdlc enzymes at specific positions, to produce specific
Intermediates of synthesis. The glucocortlcoIds are
characterized by an alpha-keto group and hydroxyl group at
carbon position number 20 and 17, respectively. Mineral
cortlcolds do not have the hydroxyl attachment at carbon
position 17 C25, 165). Chemical structures can be seen In
Figure A.
5. Actions of Aldosterone
a. Mechanisms
The primary function of aldosterone Is the regulation of electrolyte equilibrium In the mammal. Secondary
responsibilities Include maintenance of blood volume and
blood pressure C85, 106). The major action of this
hormone Is the conservation of Na"*", which It attains
predominately In the proximal convoluted tubules of the kidney nephrons via stimulating reabsorption. This Increased reabsorpt1vlty Is due to an lon-exchange process
that Involves Na"" reabsorption In exchange of H"*" or K*.
To maintain refined equilibrium It also regulates minor
adjustments In the ascending loops of Henle and the distal
convoluted tubule C85, 106).
Most of the excess acid originating from body

34
metabolism is eventually excreted as C0-, from the lungs.
Withal, It remains for the kidneys to conserve Na* through
effective maintenance of blood pH 7.4 C241}.Na* In early nephron filtrate exchange for H* and/or
K*. The charge of this lon-exchange CNa* to H*, K*) is
predominantly regulated by aldosterone levels. The greater the secretion of aldosterone, the more Na* that Is
reabsorbed and the more H* or K* that Is taken into the
distal filtrate and excreted In the urine.Na* and K* are both actively transported across the
epithelial wall In the proximal region, while being
passively transported In the distal end of the loop. H*
transport chiefly occurs In the early and late nephron,
and Is essential to acid-base regulation. The
physiological stimulation for K* excretion Is the
transport of Na* from the tubular filtrate, particularly
If H* secretion Is restrained. K* and H* utilize a common
specific transport pathway via a reciprocal relationship. The active transport of Na* out of cells and K* Into cells Involves a cellular membrane protein called sodlum- potasslum activated adenosine triphosphate CNa*-K* ATP)
C86). Energy required for transport Is via ATP, as
phosphorylation occurs with Na* binding and
dephosphorylatIon with K* binding. There Is a net movement of positive charge out of the cell, as three Na*
are transported outside, while two K* are transported
Inside. The amount of Na* and/or K* provided to this pump

35
could be a rate-1imltlng factor In efficiency of milk synthesizing cells obtaining substrate for milk production. The metabolic state of the animal determines
which Ion will preferentially become excreted Into the urine, In order to keep the coupling ratio of Na*/K* at 3:2 C106, 241).
Potassium, like sodium Is required for a diversity of
physiological functions, Including osmotic balance, acid-
base equilibrium, several enzyme systems and water balance
at the cellular level. In addition, Na* is generally known
to participate In a "pump system" that Is concurrently
linked to glucose transport In the same direction across
celluar membranes C85, 150, 218). Glucose absorption In
the kidneys Is similar to glucose absorption In the
Intestine. It shares the same carrier molecule with the
sodium Ion. Ganong C86) states that Na* moves through the
Inner cell wall Into the cell along Its concentration
gradient, while glucose follows with Na* and Is released
Into the cytoplasm. The Na* Is then transported Into the Inner cellular spaces, while glucose diffuses out through the distal border and Into the capillaries. The required energy for this transport Is furnished by the Na*-K* ATP
that pumps Na* out of the cell C86). The mechanism also appears to transport galactose, another hexose used In the
mammary synthesis of milk lactose C87). A variety of
other substances Including amino acids, lactate, citrate,
phosphate and chloride, are also transported through

36
cellular epithella by this active Na+ transport. Edelman
et al. C64) showed that pyruvate, a 3-carbon Intermediate
in rumen microbial VFA production, as well as glucose
production, enhanced cellular Na+ transport by aldosterone. Ganong C87) states that separate carriers
exist for hexoses, neutral amino acids, dibasic amino acids, dlcarboxyllc amino acids and the imlno acids and
glycine. At the systemic cellular level, rate of glucose
entry and ultimately, lactose production may be limited by
a flux of Na~ to extracellular locations.
Volume of ECF and blood pH are subject to great
variation, and are given highest priorities by the mammal
C67, 68, 229). Plasma proteins are of primary
significance in regulation of osmotic balance between the
interstitial fluid and blood plasma. Plasma volume is
related to the amount of total circulatory plasma protein,
particularly, albumin. In addition the extracellular
volume is a function of the total amount Na'* available.If sodium availability is depressed, the kidney will retain Na-*-, along with sufficient water to maintain
Isotonicity and extracellular fluid volume.There are relative contributions of various blood
plasma components that Impact plasma osmolarlty. The
following formula provided by Ganong C85), estimates plasma osmolality:
Osmolality - 2[Na*] + 0.05[glucose] + 0.33[BUN]
Cmosm/1) Cmeq/1) Cmg/dl) Cmg/dl)

37
The protein concentration influence was found to be approximately 0.33 times the level of BUN, and is included indirectly because of the ease of measurement and relation of BUN to plasma protein C85). [Na""] represents
contributions made by Na"" and its accompanying anions of
Cl“ and HC03” . Therefore, if either glucose, protein, BUN,
Cl“ or HC03~ Increase, osmolality is Increased without a concurrent Increase In Na"-. This may be an occurence of high protein diets during periods of heat stress.
Osmoreceptors In the supra-optlc nuclei of the
mammalian hypothalamus will respond, via antl-dluretlc
hormone CADH3 release, only to Na"* concentration and not
any other osmolality-increasing agents C68}. Therefore,
If Na"" levels are low In the extracellular fluid, ADH
secretion will be lowered and urinary volumes will Increase.
An Increase of K"* concentration In extracellular
fluids, either from diet or cell cytoplasm Insufficiency,
Increases plasma aldosterone concentration to dictate to the kidneys to excrete higher rates of K"* Into the forming urine. This will reduce K* concentration In the EGF.
However, higher H"* concentrations will affect that
efficiency, since H"" competes with K"* for secretion In the kidney tubules C106}. For each K"*" excreted Into urine,
one Na"" Is reabsorbed out of the tubule. Here lies the
most Important function of aldosterone In the mammalian
body. In order to prevent significant Na"*" loss Into the
V

38
urine, large quanltlles of K- mUst be excreted.
Aldosterone Is the only potent mechanism known to control
the ECF concentration of K* C96).On the other hand, Na-* rarely Increases In
concentration, since the body responds to the thirst
center and consumes additional water. This dilutes the Na* concentration preventing such an Increase in Na*
concentration C96, 68).
The source of H* that Interferes with the normally
functioning feedback system, arises from dissociation of
carbonic acid, yielding H* and HCO-n” Ions. As a result,
for each H* excreted, one HCO*- remains In the ECF,
Increasing alkalinity and thus ECF pH. Consequently, aldosterone attempts to promote an acidosis condition to
nullify an existing alkalosis condlton C96). One HCO3- Is normally urine-excreted for each K* excreted to balance
electrical charge to neutrality. If more K* Is excreted,
then urine will become more alkaline, since small H* levels are available to counteract the carbonate C106).
The metabolism of protein In ruminants invokes a critical ammonia buffer system, because of the urea cycle
or shunt between the rumen and blood. Rumen
microorganisms release ammonia from deamination of natural
protein or NPN molecules of which Is detoxified In the
liver by urea formation. Consequently, the concentration
of blood urea Is Immediately contingent on the partial
pressure of ammonia In the rumen atmosphere. Figure 5

39
taken from Hllwlg C1065 and Trenkle C2415, Illustrates the pathways Involved. Under low urinary buffer elimination Chlgh H* excretlon5* ammonia Is easily diffused Into the acidic low pH luminal fluid. At that location It binds
with H-*, forming poorly or non-d 1 ffusable NH*,"’", and Is
routed for elimination via urine excretIon.Alternat1vely. luminal ammonia may be transported to the liver and formed
Into urea and reabsorbed Into the blood plasma. In highly
ammonlated urine, If Cl~, HPO*“ and/or SO**” Is present,
NH/,'*' Is prevented from disassociating Into ammonia, thus
decreasing the opportunity for ammonia reabsorption Into
the blood stream. NH*,"* remains unassociated In Ionic form
with Cl“, HPOa “ or S0*“ and Is excreted as such.
Therefore, H"* and NH-t,"* are essentially exchanged for Na-’"
In the kidney tubules, to provide additional Na"*
conservation and HC03“ retention C106, 1655.
If appropriate levels of carbohydrate are available,
reabsorbed urea and consequently the NH*,"* is capable of
promoting bacterial and protozoal protein synthesis, with these being available to the ruminant C1065- Lower dietary consumption leads to decreased dietary protein Intakes, If protein concentrations are not Increased In
the diet C19, 2255. Hllwlg C1065 suggests that under this
condition as In heat stress, urea could be conserved by
the kidney through an active transport system. As of this
date, It Is known that urea absorption Is via passive
diffusion only. This Is based upon level of water present

Blood T u b u la r cell40
Lumenamino acids
HCOo
Na+
Na+ ;
U r e a
Figure 5. Some processes of acid-base balance In ruminant kidney tubules.
■* +

41
In the distal tubules, which In turn Is established by
gradients of other Ions. The more urine water excreted,
the higher urea excretion potential. Those mechanisms
help explain why ruminants excrete more urine during heat stress than do other sweating species, such as humans.
Such species decrease excretion of urine volumes during heat stress, as a water conserving mechanism C68}.
The ruminant also produces massive doses of VFA
fermentation end-products: proprlonate, acetate, butyrate
and valerate, which provide additional sources of H* for
the animal to dispense C136}. Those acids are not
appreciably used by microorganisms, but are absorbed from
the rumen for utilization as an energy and carbon source
for synthesis of body tissue and/or milk production C134,
241).Acid Increases in ruminant blood from soluble
carbohydrate fermentation occurs rapidly, but for highly
structured Cflbrous) carbohydrate the response is delayed.
The disassociated plasma acids Cacetate, propionate, butyrate and valerate} decrease the carbonate concentrations, thus lowering plasma pH C136}. The acidosis condition has been shown to Impair glucose
utilization by further microbial activity, and thus
decreases overall metabolic efficiency, as heat increment
In the rumen is Increased C208}. The kidney responds by
excreting H* Into urine and a decrease In urine pH occurs
C2205.
42
b . Heat StressPlasma aldosterone concentration has been shown to
decrease during periods of heat stress C68, 1503* El-
Nouty et al. C68} suggested that this decrease may be the
main factor Implicated with Increased urinary production observed In heat-stressed cattle. As previously
discussed, the most recognized function of aldosterone Is
for Na* conservation and water reabsorption via actions on
the kidney glomeruli. Lowered aldosterone will permit
high Na+ excretion, followed by water outflux to maintain Isotonic concentration C20, 28}. As with Na*, K*
decreases In blood and urine, and may be the predominant
factor Inhibiting aldosterone release during heat stress
C67, 68}. However, Yousef C258} and El-Nouty et al. C68}
state that an elevated plasma ADH and Its subsequent rise
In ECF may be contributing to aldosterone reduction. El-
Nouty et al. C68} failed to find aldosterone responses In
dairy cows after 8 h of 35 C exposure. However, longer
high temperature exposure caused aldosterone to decline approximately 40% of the control group which was exposed only to 20 C. Along with lower aldosterone levels,
significantly higher water Intake, higher urinary output,
and declined serum and urinary potassium secretion concentration were observed C68}. Apparently the
depression In serum K* encouraged lower aldosterone
secretion, which caused the decline In urinary K*. Those
43
researchers also noted an Increase In urinary Na-*,
concurrent with the decrease In plasma aldosterone. It
was concluded that heat stress caused an Increase In Na" excretion In the urine and that the physiological control of aldosterone was serum K-" conentratlon C68).
In adrenal transplant studies, Blalr-West et al. C28) observed a significant gradual rise In aldosterone secretion from either decreasing the sodium concentration,
Increasing the potassium concentration and both
concurrently. A large positive aldosterone response was
seen in the low sodium and high potassium combination over
each provided separately C28). Kosunen et al. C135)
observed that a 20 minute exposure to 85-90 C In a Finnish
sauna Induced substantial, but delayed elevations In
aldosterone In human subjects. Since no changes In
hematocrit, serum sodium, nor protein concentrations were
detected, It was concluded that aldosterone secretion by
heat may not be due to water and sodium losses and their Impact on osmolality C135). Unfortunately these
Investigators did not measure changes In blood potassium.
During heat stress, RR normally Increase Cpantlng) 2
to 4 fold C81, 139), which drastically Increases the
elimination of carbon dioxide CC02) through the lurlgs
C106, 220). Many have shown that such activity results In
respiratory alkalosis C136, 220, 258). A decrease of CO^
partial pressure In the ECF results In H2CO3 concentration
Increase. In turn, a decreased pH encourages a decrease

44
In secretion of H"" by the kidney tubules and a decrease of H C C >3.~ reabsorption. Accordingly, more H C O 3 - will be excreted, along with an equivalent amount of Na'*' C87,
136). This H C O 3 - loss causes a decrease In alkalinity In
ECF, thus providing more H"" development to bring ECF pH to
mormal pH 7.4.
In a recent report from Florida, Schneider et al.
C220), studied acid-base responses to heat stress In lactatlng dairy cows fed a 60-62 % concentrate diet. They
observed lower C03 and HCO3- concentrations, higher plasma
protein, lower urine pH, higher urine NHA'*', higher plasma
K"*, lower urine Na"*" concentrations and higher RT and RR In
the more heat-stre3sed treatment group. Those results
Indicate that heat-stressed lactatlng dairy cows undergo
replratory alkalosis with successive renal compensation.
Also, blood pH was found to be more alkaline during the
cooler hours of the day, as opposed to the warmer times
C220). El-Nouty et al.C68) did not find such increases In
plasma osmolality. Two other recent Investigations by
Schneider et al. C219, 221) using heat-stressed lactatlng
dairy cows, revealed similar results by modifying acid- base states through dietary mineral adjustments of
potassium and sodium salts. Due to the apparent dietary
need for greater sodium and potassium, above NRC
recommendations C167) for heat-stressed dairy cattle,
production Increases could be achieved by Investigators
C219, 220, 221). That result could only occur If the
45
alkalosis condition was reversed. Aranas et al. (9) cited
highest serum aldosterone concentrations at 0600 to 0800
hours during a heat stressful season. Aldosterone levels In that study were also shown to be positively correlated
Cr=0.68) with THI throughout a 24 hour period. Those same
Investigators also showed negative associations of aldosterone with K* and Na* during the cooler hours, and
positive relationships during the warmer times.
This conflicts with the research of Schneider et al.
(220), who reported that respiratory alkalosis was
exhibited only during heat-stressful hours. In accordance
with the generally accepted theory, respiratory alkalosis
occurs concurrent with lowered plasma Na* and K*. Most
studies have shown that elevated concentration of K* and
decrease of plasma Na+ Increases aldosterone levels. This discrepancy Is difficult to explain. Another study by most of the same authors C210), using the same aldosterone
RIA procedures, found that aldosterone levels followed serum sodium concentration In a laggard manner. That
study better fits the general mechanism of aldosterone response. Apparently In the previous study (9), cows were
not sufficiently heat-stressed (Tmax = 25.3 C) compared to
Schneider et al.C220) study of 37 C. This would explain a
potential of less K* loss via sweating In the
Investigation of Aranas C9), and a consequent high ECF
level of K*, causing a higher aldosterone concentration.
Efforts by Peaker et al.(198), Included Infusing

46
lactatlng dairy goats with 150 to 300 ng aldosterone per minute to evaluate production performance. Since no
effects on MY nor composition were revealed, It was concluded that sodium secretion In the milk Is controlled by some other mechanism.
Bardwell C18} studied the levels of serum aldosterone responsive to effects of season and milk production In
Louisiana lactatlng dairy cattle. He found an Inverse
relationship between aldosterone and milk production.
Though aldosterone aids In retaining Na^ and water from
the kidney and other tissues, It appears that the steroid does not attempt to control these activities at the mammary gland C198).
Beede et al. C20} observed a diphasic dally pattern of aldosterone following each morning and evening milking,
and noted that these steroid levels were reduced for the
more extreme heat-stressed treatments. Since milk
contains 0.15% potassium, and active milk synthesis Is
maximized Immediately post-mllklng C218}, IC* enroute to
the mammary gland at this time would be expected to be elevated, possibly causing an Increased release of blood aldosterone. Lowest aldosterone concentrations were
observed Immediately pre-mllklng when active K-"- blood
transport would be lower C20}. This same pattern was also
observed for the afternoon milking during the hotter part
of the day, when blood potassium would normally be In
transit to the sweat glands for maximum sweat production

47
C56}. Beede et al. C20) showed that potassium secretion
rate In sweat was at highest levels from 0.3 h preceding
milking to milking, and that extracellular potassium was
higher, Intracellular potassium lower in hotter
treatments. Whole system potassium levels were not affected by environment, since dietary potassium was over 3-fold NRC recommendations C167). Thus high dietary
potassium levels prevented a shortage of potassium and
thus lowering of aldosterone, at a time when the system needs to conserve sodium.
Those observations are In general disagreement with
Bardwell C18}, who stated that serum aldosterone levels
were higher during lower production. One explanation
could be that the aldosterone mechanism of higher
producing dairy cows may respond more drastically to heat stress, as their level of milk production Is already
taxing homeothermy. Another explanation could be that
lower dietary potassium was consumed by cows used by Bardwell, as those animals were limited to NRC C1974)
recommendations of 0.7% of diet dry matter.Both of those explanations could lead to more drastic
aldosterone responses, confounding the effects of milk
production. However Bardwell C18) and Beede et al. C20)
may be In agreement; If aldosterone encourages K"" to route
to sweat production and Into urine, and not Into milk
secreting cells. Since potassium levels do not change In
milk to varying milk yields C218}, aldosterone could be

. 48
be limiting maximum milk production by creating potassium
deficiencies In the alveolar milk producing cells. Research Is lacking In this area.
6. Actions of Cortisol
a. Heat stress and lactation
Plasma glucocorticoids are lower In cattle routinely
exposed to heat stressful conditions. Johnson and Vanjonack C119) state that previous to acclimation to
thermal stress, cortlcold concentratIons elevate
drastically to as much as two-fold normal levels. This
Increase may remain as long as 2 to 4 days or more, then dwindle to values similar, or below that of
thermoneutrality C119). Reports of several authors C6,
21, 137) showed similar trends of cortisol levels
responding to heat stress. Glucocorticoids, like
thyroxine are calorlgenlc C251). Suppression of cortisol
during heat exposure results In a lowered systemic heat production, therefore assisting the animal to maintain homeothermy C256). Dantzer and Mormede C61) Indicate that abrupt changes In cattle cortisol levels fall to be
observed when heat stress Is gradually Imposed. Figure 6
Illustrates the curvilinear responses of cortisol to
chronic and acute heat stress. When dairy cattle are
allowed to gradually adapt to natural heat stressful
conditions, milk reductions are not as drastic, yet
gradually decline and fix at a plane below baseline for
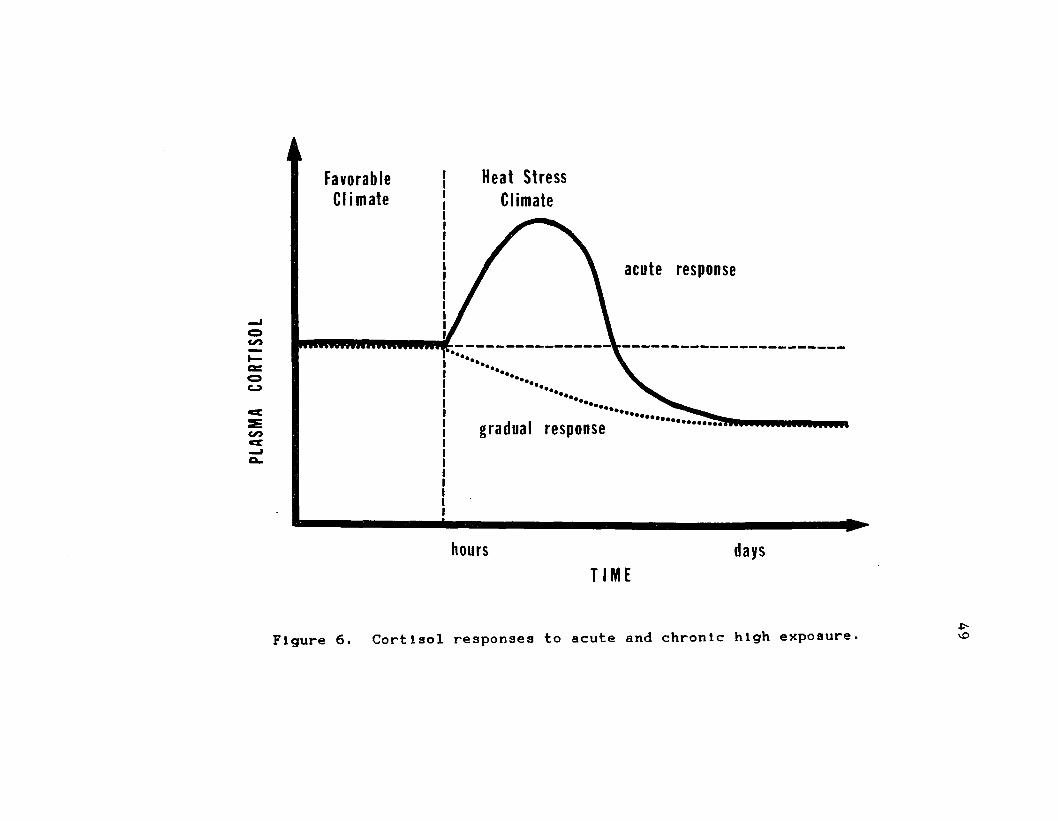
PLAS
MA
CORT
ISOL
H e a t Stress Cl im ate
FavorableC l i m a t e
acute response
iff vwvffm
gradual response
hours daysT I M E
Figure 6. Cortisol responses to acute and chronic high exposure. vO

50
the duration of the heat stress exposure. Though acute heat stress does not normally occur In most milk,
production activities, It Is valued In cllmatlc-controlled chambers to study exaggerated responses and gain basic knowledge of thermoregulatory mechanisms.
Though most previous cortisol studies Include only
short experimental periods, cortisol becomes elevated, and
the acclimation phase of cortisol secretion Is frequently
not seen. Bergman and Johnson C21} In Missouri conducted
a long term study of 9 weeks and found that Increasing environmental temperature from 18.3 C, 50% RH to 28.9 C,
50% RH on lactatlng Holstelns almost doubled cortlcold
levels within 1 h after exposure. From 48 h to 96 h,
cortlcolds slowly declined to base line levels. By day3 5
to 10, levels were observed slightly below baseline, then
declined further for the remainder of the heat stress
study C21J. Also at Missouri, Alvarez and Johnson C6J
found Identical results In an experimental period of only 24 days. Previous work In Louisiana, by Lee et al. C137)
In a 12 month ambient condition experiment, demonstrated the warm season Cgradual and chronic heat stress} of June through September caused significant suppression of
circulating cortisol levels In lactatlng Holstein cows to
approximately half of winter period levels.
Cortisol has been reported to adversely affect milk
production In dairy cattle C38, 119, 215). Johnson and
Vanjonack C119J cited unpublished data where higher
producing Holstein cows C35 kg/d]) had higher corticoid
levels than lower producing Holstelns C25 kg/d) at a
thermoneutral temperature. Exposing such cows to 30 C for
18 h concluded in a significant decrease in glucocorticoid concentration In the high producers, along with a
significant decrease In MY. Lower producers had much
advanced glucocorticoid levels, with also a significantly
decreased milk yield from their base level. Highly
significant correlation coefficients of glucocorticoid with milk production were +0.31 at 15 C and -0.49 at 30 C.
Those authors suggest that a lactational variance may
affect the glucocorticoid responses of dairy cattle during
heat stress (119). Higher milk producing cows apparently
are heat stressed earlier due to an additive effect beyond
a physiological stress caused by higher milk yields and
dietary Intake. This would permit the compensatory
decrease In glucocorticoid to occur sooner and thus yield
such results.Recently Sartln et al. C215) observed significantly
lower cortisol levels In higher producers at 30 d compared to 90 d post-partum. In addition, lower producing cows
expressed similar cortisol levels at 30d and 90d of
lactation. Apparently compensatory acclimation from
continued hypotroplc cortisol levels occurred sooner with the removal of high peak yield stress and negative energy
balance In lower producers.

52
b. Related mechanisms.Concurrent with a decreased Insulin:glucagon ratio and
Increased growth hormone level, Sartln et al. C215) suggested that the lowered cortisol concentrations of high
milk producing cows may diminish' gluconeogenes 1 s from
amino acid and protein sources while promoting llpld
mobilization and gluconeogenes1s at the liver, during early lactation.
Due to the regulatory functions of Insulin and
glucagon on energy metabolism, I.e. propionate In the
ruminant, periods of negative energy balance In the
lactatlng dairy cow can be partially negated by stimulated
mobilization of energy depots C27, 199, 214).
Insulin Is generally known to stimulate rates of
glycogen, llpld and protein synthesis, while causing
decline In protein degradation and glucose synthesis. In
addition, Insulin helps prevent protein degradation In
tissue, Increases blood amino acid levels, Increases amino acid cellular uptake, and decreases rate of glycogenesls
C86, 255). On the other hand, glucagon generally Increases protein catabolism, gluconeogenes1s from amino acids, glycogenolys1s and stimulates urea production,
while decreasing rates of protein and glycogen synthesis.
Glucagon Is also more positively correlated to stressor
agents whereas insulin Is correlated negatively C124,
215).Bines and Hart C27), Peel et al. C199), and Vasllatos

53
and Wangsness C244) have shown decreases In plasma Insulin
concentrations In early lactation, with elevated levels
later when positive energy balance Is restored. However,
Sartln et al. (214) have shown glucagon concentrations not
to change throughout early lactation. This leads to
decreased lnsulIn:glucagon molar ratios, which Is denotlve
of augmented glucagon actions on the liver (215). Those
authors suggest a possible role of Intensified glucagon
behavior at the level to Increase glucose availability for milk production.
Cortisol is generally known for Increasing
gluconeogenes1s, Increasing amino acid release from tissue, Increasing amino acid degradation In liver,
decreasing protein synthesis, and reducing nitrogen
retention C80, 86, 113, 125, 178, 215, 251, 256}.
Roles In regulation of gluconeogenes1s appear to be
contained with all three hormones: Insulin, glucagon, and
cortisol. Gluconeogenes1s is the conversion of non
carbohydrate precursors Into glucose. Since rumen fermentation of dietary carbohydrate to VFA results In only small amounts of glucose produced, gluconeogenes1s Is
the major source of glucose for ruminants C223, 138, 229}.
Glucose may be the most limiting element for optimum milk
production In dairy cattle. Chalyabutr et al. (46)
determined that 65% of total glucose Is consumed by the
mammary gland in lactatlng dairy goats.
Reynolds et al. C206) determined liver removal of

54
lactate and amino acid from blood of lactatlng Holsteins,
and determined accountabilities of 17.4 and 16.5% respectively, of measured hepatic glucose production. The remaining 66.1% of net glucose liver production could be
supplied by propionate, glycerol, and pyruvate. Net
glucose production by the liver should image Intake of digestible energy and MY.
In agreement with Reynolds et al. C206), Oldham and
Smith C178) suggest that the net offering of amino acids
to gluconeogenesis is small, relative to the glucose
demands of milk lactose synthesis. Though metabolizable
energy of the diet may undergo decreased efficiency of
utilization, amino acid drain on distribution of amino
acids to the mammary gland could be devastating during
times of gluconeogenes1s.
As stated previously, heat stress and high concentrate
feeding decreases blood pH. Somero C229J describes a
sensitive reduction in glycolytic activity, associated with a low blood pH. This causes a larger portion of
carbon from glucose or glycogen to assemble as lactate instead of pyruvate. Lactate is the primary end-product of the glycolytic pathway, and can reduce the flow of
pyruvate towards the tricarboxylic acid cycle and
gluconeogenes1s C229J. Thus, heat stress can shunt energy
metabolism away from the path predominantly used by
ruminants as an energy source. Since pyruvate production
declines under this condition, production of the 4 major

55
VFA Cacetate, propionate, butyrate, valerate} decreases.
Propionate Is a major substrate of glucose synthesis
from gluconeogenes1s In the ruminant liver, and has been
shown to provide adequate glucose levels C4, 138}.
However, Wlltrout and Setter C252} Indicate that available
propionate may not be converted to glucose, as It may be
oxidized Into acetyl-coenzyme A and thus made unavailable.
Aiello and Armentano C4} Incubated ^C-proplonate with
Isolated caprine hepatocytes and observed a 22% Increase In 1 ■‘‘C-glucose production when complete amino acid
mixtures were added. They also observed a greater 1,£<C-
glucose to 1‘COz ratio with Incubations of other unlabled
VFA, with the exception of butyrate. This demonstrates that most short-chaln fatty acids do not Inhibit
gluconeogenes1s from propionate, and that any fatty acids
that provide oxaloacetate production may stimulate
propionate carbons towards gluconeogenes1s, rather than
oxidative pathways. This also Indicated that Improved
quantities and qualities of plasma protein could Increase
glucose production available to the mammary gland.Jacquemet and Prlggs C113} also reported that
propionate Infusions In lactatlng dairy goats, elevated
plasma glucose with or without concurrent Increases of
glucagon and insulin concentrations. These authors
suggested that certain ant1-lnflammatory agents may cause
glucose Increases without glucagon nor Insulin
alterations. Cortisol Is considered as an anti-

56
Inflammatory compound and could provide similar results.
However, during chronic heat stress, cortisol Is secreted at lower than base-line levels. Therefore, less cortisol
could be available, and glucose would be at the mercy of Insulin and glucagon. Responses observed by these
Investigators were studied for only 4 h after propionate
Infusion, Indicating that chronic responses could be
entirely different over longer periods C113).
Scott et al. C223D Illustrated that milk lactose production predominately utilizes glucose as substrate,
with only minor uses of glycerol. Essentially no use of
lactate, pyruvate, and acetate Is Involved In glucose synthesis of mammary tissue of lactatlng dairy cattle.
During gluconeogenes1s, those researchers showed that key
enzymes are altered to promote a hexose flow away from
lactose, glucose and fatty acid production In order to Increase oxaloacetic acetate, which Is Incorporated Into amino acid transamination reactions. Apparently glucose
and pre-glucose substrates are not successful In exiting
the bovine liver and thus, never reach the mammary gland C223}. This places more significance on gluconeogenic precursors, I.e. lactate and pyruvate, required for milk
synthesis to be derived from the diet and/or fat depots. Body tissue stores, however, may be recalled and would
need to be replenished at a later date. These routes of
energy metabolism led to very Inefficient energetic
production of glucose, which Is brought-forth from heat
57
stress directly and indirectly by declined DMI.
Reynolds et al. C206D showed that plasma glucose
concentrations were lower at negative energy balance
periods compared to positive energy balance periods. This
was observed with no differences in net hepatic glucose
production. Similar results were obtained by Ingraham et al. C111D, who found that plasma glucose was strongly
correlated in a negative manner with MY. Plasma glucose
declined after calving, with Increasing MY till peak lactation. At that time, glucose elevated as MY declined.
Those researchers also found a negative correlation of
plasma glucose with THI during the time of peak production
CHID.In the study of Reynolds et al. C206D, It was found
that net hepatic glucose production CplasmaD was still 35% In excess of glucose needed for milk lactose synthesis In
those Holstein cows.
Sartln et al. C215D suggests that the rise In plasma glucose from gluconeogenic activities, may be temporarily compensated by an Increase In Insulin from the beta cells of the pancreas. However, excess cortisol levels for
prolonged periods, can exhaust the beta-pancreatlc cells
and possibly cause a steroid metadlabetlc condition C80D-
The absence of appropriate cortisol levels during heat
stress allows the animal to cope with the stressful
environment through adaptive measures. All such measures
however, appear negatively correlated with satisfactory

58
milking performance.
Using ammonla-lntoxlcated steers, Fernandez et al.C77) established that hyperammonemia Is associated with glucose metabolism. In responses to ammonium chloride
Infusion, blood glucose and lactate significantly
Increased, enduring till Infusion terminated. Glucagon
levels remained unchanged, yet Insulin levels dropped to a constant level of approximately 65% of the original
baseline. Mean molar Insulin:glucagon ratio followed a
similar response to Insulin, also dropping to a similar degree C77).
Since the results of Aiello et al. CA) Indicated
reduced gluconeogenes1s from propionate Creceptlve to
glucagon) and thus lowered glucose production, the
Increase of blood glucose and lactate observed by
Fernandez et al. C77), Indicates glucagon was prevented
from regulating the glucose precursor Cpnoplonate). This
Inhibition occured In the presence of constant glucagon
levels to hyperammonemia.Normally higher molar lnsulIn:glucagon ratios promote
glucose utilization by systemic tissues, while a lower ratio stimulates gluconeogenes1s and glycogenolys1s.
Those researchers suggest that the elevated blood glucose
concentration and lower lnsulIn:glucagon ratio Indicates a declined glucose utilization by lnsulln-sensltlve tissues
rather than Increased glucose production C77). The extent
of mammary gland sensitivity to Insulin, thus glucose

59
availability at a time when blood glucose is elevated,
remains to be seen.
In agreement, Segura et al. C224J detected significantly higher blood glucose and lower BUN levels
after an ACTH injection. Such responses remained for 48 h
and 12 h, respectively. ACTH has been shown to Increase
cortisol secretion, and as a result, gluconeogenes1s C67, 98, 2243- This would potentiate higher glucose levels for
short-term periods Cdays}, butperhaps fall to exist appreciably during natural ambient heat stressful
environments. Lower BUN levels indicate N disappearance
to unknown routes. According to reports previously
described In the aldosterone literature review, nitrogen
may have been excreted through urine as NHa"* and/or urea. If such activity occured, and especially If a higher H""
condition existed, aldosterone levels would have bean
expected to rise. The competition of NH*,"*" and H'*' for
excretion by kidney tubules for K"- would tend to keep
plasma aldosterone levels elevated. Such observations would suggest specific physiological responses to excess
dietary protein and/or Imbalanced RDP:UDP ratios.
60
Supplementary Fish Meal
A . Protein Source and CompositionRecent Interest has centered on by-product feeds that
are high In ability to bypass rumen degradation. FM has
been shown to be a slowly-degraded, high quality source of
protein In many ruminants C89, 91, 260). Menhaden species
CBrevotrla tyrannus) represents 90% of the FM processed In
the United States. The species Is primarily harvested for
Its high oil content, with FM remaining as a by-product of
processing. In Louisiana, harvests of menhaden represent
80% of all seafood weight landed annually, though the
harvest season exists for only six months C160). Most
menhaden plants are located on navltable channels,
allowing short access to Gulf waters. Louisiana typically harvests 80 percent of the total domestic menhaden catch
In the Gulf of Mexico, with an annual yield of over
600,000 metric tons C160). The entire Gulf Industry Is
managed and regulated by the Menhaden Advisory Committee of the Gulf of Mexico and various Gulf states' wildlife
and fisheries departments C41D.Goldhor C91) states that fresh fish contains a very
low DM content. Because of the protein portion being
bound to the water fraction, heat denaturatlon Is applied
to release the moisture from the fresh product. After application of pressure and centrifugation to remove the
oils, a water soluble liquid phase Is removed, leaving a

solids press cake of high DM cooked material, which
contains 80 % of the original DM C91J. Due to the nature
of the physical process, the fish cake contains large
amounts of UDP, whereas the water phase contains a high
degree of soluble, degradable protein. In the U. S. the
fish soluble protein fraction Is commonly condensed by heat and returned to the fish cake before final
evaporation and grinding of the fish meal product C41J.
Presence of fish soluble addition or not, therefore
Influences the fraction of FM that Is undegradable. Some
menhaden processors have recently modified harvesting
techniques, which Improves the quality and freshness of by-product FM C259}. Instead of ambient temperature
holding of raw menhaden, captured fish on route for SSFM
processing are Immediately refrigerated throughout voyage
to the processing facility. This permits use of lower
drying temperatures resulting In a high quality protein
source C259). Table 1 lists the major nutrients contained
In FM, as provided by commercial supplier C259) and NRC C171} and laboratory testing.

62Table 1. Nutrient composition of menhaden FM.
Nutrient ContentDM - 91.31 %CP 61.80 %UDP fc> 78.00 %NEi fc. 1.67 Mcal/kgCF tr> 1.00 %TDN to 73.00 %ADF c r 0.86 %Ash m 20.00 %Fat m 9.38 %
* Hapata Haynle Corporation, Hammond, LA*=■ NRC C171}, International Feed Number 5-02-009." Louisiana Agricultural Experimental Station Feed
Testing Laboratory.
63
B . Theory of Use
Mathers et al. C146) cited that FM contains larger amounts of UDP than most other protein sources. The
soluble and small degradable portions of FM protein have
also shown more of a linear reponse compared to a
curvilinear degradation of most other protein supplements.
This would permit a more uniform distribution of amino acids available at the Intestinal site for optimum
absorption. It Is also essential that RDP and UDP exist
In an appropriate balance to yield optimum forage and
energy utilization and thus, efficiency of production
C171, 188).
Amino acid composition of soluble and Insoluble
fractions of total protein has been shown to vary C51,
144). Crooker et al. C58) and Clark et al. C51) have
shown that the amino acid composition of In situ remains,
have a different amino acid profile than that of the
original mass. It Is suggested by Clark et al.(51) that the total amount of protein escaping rumlnal degradation
causes more variation In the passage of amino acids to the small Intestine than variation among the amino acids In degradable and undegradable fractions. In addition, the
fraction of FM that bypasses the rumen has been found to
contain large levels of lysine and methionine, two amino
acids often found to be rate-llmltlng In ruminant diets C51). A detailed profile of the amino acids found In
specially selected menhaden FM are listed In Appendix

64
Table 1.
Mantysaarl et al. C145) found that menhaden fish meal
samples exhibited 65 ± 2.58 % CP and an In vitro
determination of undegradation of 48.1 ± 7.97 %. Those
Investlgators also observed that differences In processing
method, especially In the fish solubles content of the
meal, allowed more variation In protein degradation than did species of other fishes.
Broderick et al. C33) evaluated seven largely-
lnsoluble protein sources for rumen degradation
estimation, using In situ and In vitro procedures. In
both methods, FM ranked second to capra meal In
undegradabl1lty, with a mean undegradable estimate of 55%
Cln vitro) and 46 % Cln situ). This document was also the
first to report chemical analysis that partitioned FM Into
a ruminant fish meal and a nonruminant fish meal. Under
those classifications, ruminant FM has equal percent N,
much less water soluble N components, less low-molecular
weight N components, much lower degradation rate, much less ammonia N production and a much higher UDP fraction
than the nonruminant variety C33).
Generally, rumlnal degradation of protein supplements
varies greatly, depending upon rate cellulose degradation.
Usually, the more efficient the cellulytlc activity, the
higher the protein supplement fermented C178). This does
not appear to be the case with animal protein sources,
however, I.e., FM C83, 101). Rumen microflora are highly

65
proteolytic, with efficacy measured by determining ammonia production and rate of disappearance In situ C186). Nocek
C175} suggests that the soluble N-fractlon of FM may be
slower to protease digestion than Insoluble potentially digestible fractions.
Rumen pH Is largely under the Influence of dietary
starch content, which normally opposes dietary fiber
concentration. High starch Intakes lead to rapid
formation of lactic acid and small heat Increments,
whereas fibrous feeds lead to slowly fermented products of
short-chaln VFA and significant heat production C5). The
elevated levels of lactic acid causes rumen pH to decline, which does not favor proteolysis of plant proteins C186). This disagrees somewhat with the discussion of Clark et al. C51), that claims a declining pH elevates the ratio of
bacteria to protozoa, and thus allows a higher yield of
bacterial protein and amino acids to reach the small
lntestIne.
Though FM has high undegradable fractions, It also has
a higher soluble protein proportion than vegetable proteins C187}. It appears that protein supplementation would be more suitable under heat stress conditions
because of the lower Intakes and lower outflow rates on
lngesta C58). Orskov C188} claims that FM would have an
advantage over SBM and linseed meal, as the latter two
decline In degradabl1lty as dlgesta flow rate increases.
On the otherhand, vegetable protein sources may be
66
suitable at high out flow rates, observed under
thermoneutral conditions.
Orskov C1883 depicts two consequences to dietary N
deficiency: 13 reduction In DMI, and 23 decrease In
organic matter digestibility. These both lead to
decreased microbial protein synthesis and thus, amount of
potentially absorbable protein available to the ruminant.
However, the most grievous result of N deficiency to rumen
microflora applies to energy rather than protein
usefulness C51, 171, 1783- This Is especially true when
cows consume diets that.are high In fermentable organic
matter, while the protein supplements are largely
undegradable. In such cases, ammonia, amino acids and/or
peptides may be Insufficient for optimum microbial
activity C513- Deficiencies of N for microflora could cause a decline In microbial yield per unit of fermentable
substrate. This could result from a higher energy
requirement for microbial maintenance or a destruction In
fermentation ability.Megglson et al. C1533 found an Increase In the
microbial N yield per unit fermentable organic matter,
when a N deficiency was corrected. However others have
not found such a response C1913. Though efficiency
remained constant, total amount of fermentation was shown
to Increase, thus possibly leading to an Increase In
overall digestibility and Increases In DMI and CP Intake.
Dietary NPN and probably the soluble fraction of FM,

67
do not increase the potential digestibility. Both can only aid in realizing the potential digestibility already present. Small changes in digestibility can reflect
drastic Increases in DMI, because of the faster dlgesta
passage per unit of time C178, 192}.
McAllan and Smith C148} working with sheep, observed that low degradable FM supplemented diets, compared to
both urea supplemented and a basal control diet, allowed a
drastically greater organic matter digestion contributed
by cellulose and hemicellulose. However, those
investigators failed to find a difference in DMI in the
more efficiently digested diets. Oldham and Smith C178}
reported results of a study, that when DMI was constant,
and adjusted for zero body weight change, Increasing CP
concentration Increased FCM yield linearly. McAllan and
Smith C148J suggest that the stimulating effect of FM may
be caused by presence of preformed amino acids, being
favored by a specific class of microorganisms. This is
the only study that the author could locate that describes
an UDP stimulating fiber digestion without Increasing microbial protein levels at the abomasum. Muscato et al. C166) points out that specific amino acids binds to fiber
particles, and this extent can vary greatly among by
product feeds. Owens and Bergen C195} and Thomas C238)
also agree with this possibility. This could give additional credit to the study of McAllan and Smith C148J.
Perhaps a population of microbes that is more energy-

68
producing efficient la favored to predominate, while
concurrent decreases In other species are occurlng. This
would help explain the observations of Oldham and Smith C178).
According to Orskov (188) and Orskov and McCleod
(189), tissue requirement of amino acid N per unit of metabolizable energy Is elevated at higher rates of MY.
Relevance of this finding to dairy cows under heat stress
has not been Investigated. Speculation Indicates that
Increasing dietary CP concentration to such animals would
be of benefit, especially If dietary Intake of energy Is
low due to decreased DMI. It would stand to reason that
If milk protein could be higher and microbial population was low because of a corn sllage-based diet, then a
response to protein supplementation could be expected.
Prewitt et al. (201) compared the amino acid profiles
of milk and microbial protein and noted only minor
differences in the spectrum. Thus amino acid profile
presented for absorption to the Intestine would not require as much energy cost for transformations to meet the profile found In milk protein. Post-rumlnal
administration of casein studies with lower dietary energy
levels have shown to obtain positive N balance In lambs
(109).
Microbial yields of N are lower In small partlcle-
slzed and low protein roughages, I.e. corn silage (51).
This roughage may elicit an energy deficiency, since

69
recent work, suggests that silages produce lower microbial protein yields than hay C188).
Work by Orskov et al. (193) showed that In early
lactation, a low quality, high roughage diet allowed higher milk production and higher body weight loss when FM
was supplied, as compared to feeding a highly degradable
protein supplement. When energy needs became balanced In
post-peak lactation, there were no observable production
differences between the two supplements. In that study,
compensatory body weight gain In the Fll group was
recaptured at a significantly faster rate (193). Those
findings Imply that in early lactation, available protein to the tissue may be a limiting nutrient greater than that
of dietary energy. Body reserves of fat depot can provide
great supplies of tissue-available energy. This Is In
general agreement with Oldham and Smith (178). Orskov et
al. (193) and Clark C50) observed no dairy production
responses to protein supplementation when sufficient metabolizable energy was consumed.
It has been suggested that high levels of protein available to the tissues can elevate an energy deficiency
in lactatlng cows, currently in a negative balance, I.e.
early lactation, and perhaps heat stress (178, 185).
Since cows experiencing a net tissue mobilization may
require additional amino acids to match the mobilized energy from tissue, increased Intestinal absorption of
rumen-bypassed amino acids may provide a benefit. Oldham

and Smith C178) have reported evidence from published
trials that elevating the protein content of many diets has Increased MY at the cost of a higher body weight loss.
This may not occur, however, If high protein diets caused
an Increase In DMI, and an Increase In available energy.
Those same authors have observed Increases In Intestinal absorption of amino acids, and this may stimulate further
tissue mobilization C178). Perhaps by the addition of
protein supplements Celther degradable or undegradable5 provided to elevate amino acid supply to the Intestine,
higher MY and body weight loss occurs with a low Intake of
high roughage diets, but not with low roughage diets at a
higher Intake. The mystery of priority remains
unresolved.
With low fiber rations, body fat deposition could be
increased when amino acid uptake Is low. By Increasing
the absorption of amino acids, metabolic need for fat deposition Is reduced. This could result In more
mobilization of tissue and more energy available for milk
production. On the other hand, If amino acid uptake Is low, as In Improperly balanced proteln-dlets, surplus
energy relative to the amino acids available, could be
metabolized Into an extra heat load during times of environmental heat stress.
High concentrate diets fed to Increase amino acid
supply at the Intestines, can have catabolic affects upon
llpld metabolism In lactatlng cows C235). Oldham and Smith
71
(178} and Tamminga et al. (235} suggest that this
mechanism may be surpassed by a high level of ruminal
propionate production and hence, stimulation for llpo- genesls in fat depots. This activity would then be under
the mediation of insulin, glucagon and glucocorticoid in
the animal (145}. As a result, protein supplementation on
high roughage diets may Increase body weight losses, but
Is less prone to do so on diets high In concentrate (178}.
Such diets are often fed during times of heat stress.
In addition to the high protein quality and quantity
of FM, there are other nutrient components that may enhance Its usefulness (91, 171, 183, 237, 259}. Fish
meal contains 9 to 11% llpld fractions, which are high In
long-chaln unsaturated fatty aclda (171, 183, 237}.
According to Tarr and Blely (237), the unsaturatedness of
the FM fat portion explains why FM lipids are 90 to 95%
digestible.
Opstvedt (183) reports that menhaden tissue contains
about 8.2% total llpld, and of this, 27.3% are unsaturated and 26.1% are of the omega-3 variety. Studies have shown
that In feeding fish lipids, high levels of polyethylenlc
fatty acids can cause a MFP decline (173, 183). Opstvedt
(183) determined the decline In MFP caused by excess dietary fat was due to physiological changes similar to
those found when high levels of concentrates were fed,
I.e. lowered acetate and Increased propionate levels.
This caused elevated adipose tissue deposition and

72
decreased mammary milk fat synthesis. Nicholson and
Sutton C173) suggested that fish lipids may modify rumln'al
VFA ratios because of their high levels of polyunsaturated
long-chaln fatty acids.
Palmqulst C197) found that dietary oils, In general,
transfer organic matter digestion from the rumen to the post-rumen gut. However Tammlnga et al. C236) failed to
show any decline In rumen fermentation, when tallow was
fed at 7 and 12% of the diet DM to lactatlng cows. In
addition, others C196) have used the high caloric density
of fats to Increase milk fat production. Those authors
substituted concentrate with fat and Increased the
roughage:concentrate ratio while maintaining energy
Intake. Results proved that MY remained constant, while
MFP Increased over the controls. It was suggested that those responses were due to an Increase In rumen
fermentation as A:P ratio Increased from 1.96 to 2.41,
over the control diet C196}. Harris et al. C101} also
found no differences from a bypass fat diet over a control diet In MY, MFP, MPP and 4% FCM. However Nicholson and
Sutton C173) found rumlnal VFA proportions are not
affected nearly the extent that milk fat synthesis Is
altered. Significant declines In MFP occured without
changes In A:P ratios when fish oil was supplemented at
moderate levels. The NRC C171} cautions about the use of
fats, In general, and suggests a limit of 5% addition to
the ration.

73
Studies Including dietary fat Influences on MLC are few, and none have been documented that describe the Influence of hormonal regulation on carbohydrate
metabolism as It relates to lactose formation In the milk secreting cell.
Data from Bines et al. (26) demonstrates a significant
decline In milk protein as fish fat Increases In the diets
of lactatlng dairy cows. Their study used levels for
linear regression fitting, beyond practical application to be of Interest to the small amount of fish llpld present
In diets supplemented with conventional levels of FM. In
conflict to the above findings, Palmqulst and Conrad (196)
did not locate any declines In MPP.If the limitations of Brelren (30) are followed, the
effect of dietary fish llpld will not result In a
decreased MFP. At the 100 to 150 g per cow dally level,
no alteration should be observed In MPP (26).
Opstvedt (183) cited work In Europe where FM diets did
not Impart any off-flavors to milk nor milk products at fish llpld levels equivalent up to 1.1 kg of FM per cow dally. In many countries, FM Is Increasingly utilized and no reports have been associated with an oxidized flavor In
such diets (183).
FM contains approximately 18 to 20% ash, harboring
many Important minerals (171, 259). Since the whole fish Is utilized In processing, mineral content Is high, with
major minerals of calcium, phosphorus, potassium, sodium

and magnesium in highest concentrations. Appendix Table 2
lists the minerals found In SSFM, as provided by Zapata
Haynle Corporation C259).
FM Is also wealthy In vitamin content, being
particularly high In choline and niacin, two vitamins that
have shown significant Increases In stimulating milk
and/or milk fat production In lactatlng dairy cows C12,
108). Appendix Table 3 provides values selected from the
literature provided by Zapata Haynle Corporation C259).

75
C. Lactation TrialsRecommendations of feeding FM In the diets of
lactatlng dairy cattle are not common. However Miller and Pike C157) state that FM Included In the diet of early
lactation dairy cattle should be fed as a high UDP source
at the dally rate of 0.5 to 0.75 kg per animal. It Is
suggested that this level will provide optimum essential
amino acids and permit mobilization of body fat depots to
meet the high metabolic energy demands In early lactation.
Those authors caution against excessive weight loss,
probably causing acetonemia, and as a result recommend
decreasing the concentrate portion to prevent such an
occurence C157).
Only one study has been reviewed by this author that
evaluates dietary addition of FM to mid- and late
lactation dairy cattle C49). Thus no documented
recommendations specifically addressing those phases of
the lactation curve, are available.
Since highest peak yields appear essential In order to
obtain a higher lactation yield, elevation of dally MY early In lactation could lead to substantial Increases for entire lactations C36). In addition, dietary CP may be
decreased during mid- and late lactation without causing
decreases In MY C66).
Of the 10 reports C13 experiments) reviewed,
specifically Involving FM Inclusion In the diets o'f
lactatlng dairy cows, only 2 bear physiological

76
significance to the purpose of this current study.
However, none reported that environmental climates were a
factor In any of the trials. Table 2 has been constructed
to summarize the performance characteristics of all 10 studies.
Of the 4 citations reporting DMI, only one study
showed an Increase In DMI, while 3 reported no differences, though one expressed a tendency for a higher
Intake. Though milk production efficiency was tested only
In the study by Zerblnl et al. C261), and found to be
nonsignificant, MY Increased In 8 of the studies, along
with obvious tendencies for Increase In 2 others. Only 3
studies provided means of milk production that were
obviously similar. MFP decreased drastically In 5
reports, Increased In 1, and was not significant In 2. In the statistically nonsignificant reports, MFP showed
tendencies for lower percentages. Collectively, only 2
studies cited decreases In total MFY, 3 of non-
slgnlflcance and 3 of Increases. MPP Increased In 3 studies, with 6 reporting no differences. This led to 8
studies reporting significant Increases In MPY, with only
2 reporting no differences. Only 3 documents described
MLP In this review. One expressed a slight decrease, with
the remaining 2 exhibiting very similar contents among FM
and non-FM diets. It Is Interesting that In these 2
studies, not only was MLP non-slgnlfleant, but MY also.
In general, the survey of these 13 studies provided

Table 2. Collective summary of FM Ingredient feeding trials In lactatlng dairy cows.
--------------------- Milk parameterSource Citation
Number MY FCM MFP MFY MPP MPY MLP MLY DMI DMD BW<
Erfle et al. 73 + +Oldham et al. 179* + - + 0 0 0 0 0 + +
179* 0 - - + + 0 + 0 +Zerblnl et al . 261 0 - - 0 0 0 0 0 0Oldham et al. 176 + 0 + 0 + + +Oldham et al. 177 + + + 0Orskov et al. 193= 0 0 + + +
193* + + 0 + -Spain et al. 230 0 - - -Oldham et al. 180 + + + +Miller et al. 156- 0 0 0
156r + - 0 0 +Miller et al. 157 + + 0 +
a early lactation. DMDb a mld-lactatlon. BWGc wt high energy.d WB low energy. +e St high producers. -f = low producers. 0
Blank
dry matter digestibility, body weight gain.
significant Increase, significant decrease.lack of significant difference CP<«05). data not reported.

78
Information that Is expected, as Is In research feeding of other UDP sources, with the exception of reduced MFP and' MFY.
In addition to milk performance data, Oldham et al.
C179) also Investigated blood changes In BUN, glucose,
albumin and total blood protein content, In one of two
studies. Their highest production treatments were
lsonltrogenous supplements composed of mixtures of urea
and FM at ratios of 2:1 and 1:2, which represented 1.0 to
2.5% and 0.4 to 4.0% of the diet DM, respectively. Concentrate plus supplement was approximately 60 to 62% of
the DM, with corn silage and alkali-treated straw cubes as
the remainder. Though no differences were observed In DMI
between the diets, higher DM and CF digestibilities were
observed for the 2FM:1U diet. Also, this diet resulted In
significantly more MPY, MFY and equal MFP. As expected,
MLP did not vary between the treatments, as MLY followed
MY. The 1FM:2U diet gave similar responses except that CP
Intake was higher, MFP significantly lower, but body
weight gain post-partum at week 12 was significantly higher.
This agrees with Oldham et al. C176) and Orskov et al.
C193), where higher FM diets In early lactation responded
with an Increase In body weight gain over an
lsonltrogenous control diet soon after peak lactation. Zerblnl et al. C261) feeding FM supplements, found no
significant differences In body weight gain, yet the diet
79
expressed a trend to Increase over a body weight-
decreasing trend of a highly degradable SBM supplement.
Less body weight gain or higher body weight loss In early
lactation suggests that higher quantity and protein undegradabl1Ity encourages fat depot mobilization, as
theorized originally by Oldham and Smith (178).Oldham et al. (179) found a significant elevation In
blood glucose concentration In the 1FM:2U diet, and a
reduction In BUN. Zerblnl et al. (261) also found similar
results. This suggests more BUN Is being Incorporated
Into rumen microbial protein or Is being eliminated In the urine as NH*."*' or urea. Neither metabolite In urine was
determined In neither study. However, Zerblnl et al.
(261) found a smaller amount of fecal N flow to feces and
a slgnlflcantly lower amount of microbial N produced.
Since that study Indicated the lack of differences In MPP,
It may be that a higher portion of the N was eliminated
via urinary excretion. It was concluded that RDP was less
than adequate for microbial growth In the FM diet (261). However, Orskov et al. (191) found higher urinary N, but
no fecal N differences, in FM diets fed to sheep. This
suggests that N Is routed to the urine In competition with
direction to milk protein.
Hespell and Bryant (104) suggested UDP sources also
act as slowly-releasing N sources In the rumen. This may have significance during times of heat stress, when solid
digests passage Is normally slower. Oldham et al. (176)

80
found significantly higher total blood protein
concentrations 4 hours after feeding of a FM supplemented
diet when comparing FM and non-FM diets. This may correlate well with higher MPY, but was not Investigated stat1stlcally.
Zerblnl et al. C261} also observed lower VFA
production, and that 70% of this reduction was due to lower synthesis of acetate. However the A:P ratio was not different. Rumen pH was definitely lower for SBM than for
FM supplemented diets, yet the difference was not
significant. The higher SBM content of the diet, may have
promoted greater Intermediate fermentation, providing
larger levels of lactic acid. Together with the higher
blood glucose levels observed by Oldham et al. C176}, one
could speculate that In the presence of a low rumen pH, gluconeogenes1s was actively consuming pyruvate, Instead
of pyruvate utilization by microbes for VFA production.The significantly higher pH found by Zerblnl et al.
C261} for FM supplement, may be explained by a reduction In cellulytlc hydrolysis. Argyle and Baldwin CIO} have found , as rumen pH declines, acetate declines while propionate and butyrate Increase. However, others have
not found such differences In rumen pH, even while blood
ammonia was decreased 30 to 40% by addition of other UDP
compared to RDP supplements C51, 213}. However, Waldo has
also described rapid rumen fermentation of RDP sources
leads to elevated production of VFA and thus a higher pH

81
decline C246). Such obvious discrepancies may be
resulting from an unresolved combination of factors, such
as ration digestibility, roughage quality, environmental
stress, varying oil contents among FM sources and/or
dietary electrolyte variations among the different
studies. It Is unlikely that CONC level, roughage source
or DMI are factors Involved, as those were similar across the diets.

EXPERIMENTAL METHODS
Animal Assignments and Management
Two groups of twelve lactatlng dairy cows representing
three breeds CJersey, Guernsey, Holstein) were selected
from the LSU Production, Research and Teaching Center
milking herd. Animals were paired Cblocked) upon breed,
age, lactation number, date of calving, level of 2X-305-ME
production of milk and milk fat of previous lactation
record or estimated from current performances, and body
weight. Animals were randomly assigned to one of two
dietary treatments, consisting of a FMS diet or a CON
diet. Anals of mean group pre-study variables Included In
blocking efforts are given In Table 3.Each of the groups were housed In divided free—stall
lots and milked twice dally for a 70-d experimental period
beginning June 19, 1987. Data collection started after a
10-d acclimation to new locations and diet change. Both herds were group-fed twice dally, following each milking.
82

83
Table 3. Pre-trial description of experimental animals.
TREATMENTGROUP Age Days In Lactation MP MF FCM
CMo.) Milk Number Ckg) C%D Ckg)MeansSD
FMS 37.3 125.3 1.83 20.45 4.17 20.6219.4 38.3 1.75 4.64 0.84 3.64
BWCkg)
48094
CON 40.2 140.2 1.92 20.68 4.22 21.08 49622.2 40.2 1.56 5.58 0.56 4.71 96

84
Experimental Diets
A . Ration Components and Feeding
Both experimental diets were based on CS and 20* CP
CAF) commercial pelleted CONC, proportioned at 50:50 DM
ratio, and presence or exclusion of SSFM CZapata Haynle,
Hammond, LA) as protein supplement. Nutrient requirements partitioned by pre-trial status are shown In Table 4.
Composition of the feed Ingredients and the overall
composition of the two experimental diets are found In
Table 5. Table 6 lists Ingredients composing the pelleted
CONC. Chemical composition of FM, as provided by Zapata
Haynle C259) Is found In Table 2 and Appendix Tables 1, 2
and 3 .
CS and CONC were mixed by a commercial mixer truck
CEnsllmlxer, Butler, Garden City, KS) with FM being top-
dressed and mixed by pitchfork. Shaded fresh water was
available at all times, along with a free-choice mineral mixture consisting of feed grade salt, dlcalclum phosphate
and oystershell flour In a 4:3:1 ratio, repsect1vely.
Body weights were taken during the adjustment period
to satisfy the body weight requirements for ration
balancing. Since animals averaged 133 ± 39 d In milk at
the onset of the experiment, no adjustments were made for
trend of body weight change. Other variables Included In
nutrient balancing of the rations as described by the NRC
C167, 170) Included level of MY, MFP, lactation number,

85
Table 4. Mean daily nutrient needs of experimental animals.
Source NE1 CMca1)
TDNCkg)
ADF- CP Ckg) Cg)
DMCkg)
Malntenance C488 kg) 8.31 3.65 425LactatIon Number Cl.875) 0.94 0.41 48Milk Yield C20.57 kg. 4.2 % MF) 15.55 6 . 85 1831Total Dally Requirement 24.80 10.91 4.27 23043.5 % BW DM Requirement C1.45/kg) C63.88%) C25.01%) C13.49%) 17.08
calculated from ADF% = 90.8058 - 1.03 TDN%.

86
Table 5. Nutrient composition of feed Ingredients and total mixed diets.
Dry Matter
— % AF—Crude
Prote InCrudeFiber
Acid Deter. Fiber
% D M --------
CrudeFat
NEi*-Meal/kg
CS 32. 1 8.8 21.8 26.9 2.6CONC 88.6 23.2 9.7 13. 1 3.5
FM 90.3 61.9 1.0 1.2- 9.4
Total
CON
mixed rations
47.1 16.0 15.8 20.0 3.1 1.67
FMS 48.2 18.2 15. 1 19. 1 3.4 1.69
- from ADF% = 1.25CCF%).from NEi - C2.291 - 0.0245C1.03 ADFSO} - 0.12

Table 6. Composition of basal commercial concentrate. *
Ingredients Fraction of totalC% AFD
Wheat middlings 40.00
Cottonseed meal 28.00
Corn screenings, ground 24.70Soybean meal, 44 % 0.50
Sodium chloride 1.00Limestone 3.20Dlcalclum phosphate 0.25Vitamin A & D premix 0 . 10Binder 2.25
manufactured by MFC, Jackson, MS. Formula Number 373-4.
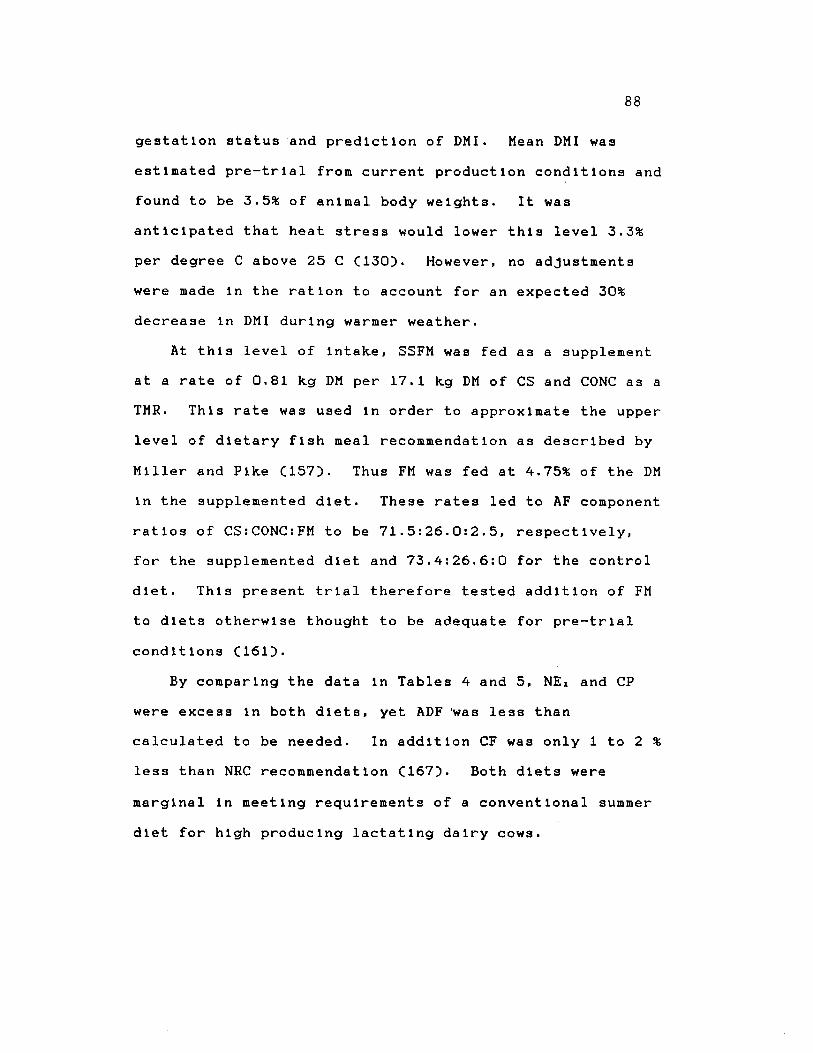
88
gestation status and prediction of DMI. Mean DMI was
estimated pre-trial from current production conditions and found to be 3.5% of animal body weights. It was
anticipated that heat stress would lower this level 3.3%
per degree C above 25 C C130J. However, no adjustments
were made In the ration to account for an expected 30%
decrease In DMI during warmer weather.
At this level of Intake, SSFM was fed as a supplement
at a rate of 0.81 kg DM per 17.1 kg DM of CS and CONC as a TMR. This rate was used In order to approximate the upper level of dietary fish meal recommendation as described by
Miller and Pike C157). Thus FM was fed at 4.75% of the DM
In the supplemented diet. These rates led to AF component
ratios of CS:C0NC:FM to be 71.5:26.0:2.5, respectively, for the supplemented diet and 73.4:26.6:0 for the control
diet. This present trial therefore tested addition of FM
to diets otherwise thought to be adequate for pre-trial
conditions C161J.
By comparing the data In Tables 4 and 5, NEi and CP
were excess In both diets, yet ADF was less than calculated to be needed. In addition CF was only 1 to 2 %
less than NRC recommendation C167J. Both diets were
marginal In meeting requirements of a conventional summer
diet for high producing lactatlng dairy cows.

89
B . Dietary Intake Determination
Feed consumption was recorded at each feeding, with
levels on offer adjusted at feeding to approximate 5 to
10% refusal. This permitted ad libitum Intakes and
regulation of the DM roughage:concentrate ratio at
approximately 50:50. Representative samples of CS, CONC
pellets, FM and ort refusal were taken dally and
composited for the week. These samples were dried at 60
C, and ground through a 2 mm sieve using a macro Wiley
mill. Samples were analyzed for DM, CP, NDF, ADF and CF
by the Louisiana Agricultural Experimental Station Feed
and Fertilizer Laboratory, using AOAC procedures (11).
Various ratios of these feed data to production components
provided additional variables pertinent to this study.

90
Environmental Conditions
A . Cllmatoloqlcal
Planning of trial Initiation and duration was for
lactatlng groups to be exposed to hot and humid summer
conditions of Louisiana. Baton Rouge Is located
approximately 85 miles North of the Gulf of Mexico, with weather largely Influenced by climate variables associated
with the Gulf. Dry bulb temperatures, dew points,relative humidities and air velocities were taken from
monthly statements recorded by the National Weather
Service, NOAA, located In Baton Rouge, Louisiana, latitude
30° 32' N and longitude 91° 08' W. This data was converted to dally observations of Tmax temperature, mean
dally THI and mean dally ETI.THI was determined because of the significant
Influence air moisture Imparts on latent heat of
evaporation to wet surfaces. Cargill et al.C44D
satisfactory described this In Holstein cattle, and provides the following equation for THI determination In
cattle:
THI =0.55 CTcdtO + 0.2 CTc*0 + 17.5 where,
THI = temperature-humldltlty Index
Tcdt. = dry bulb temperature In F
Tdp = dew point In F
Furthermore, ETI values were determined by an equation

91
from Baeta et al. C15}. This more recently developed comfort Index uses similar variables as THI, except for
different Intercepts, addition of quadratic functions and utilizes air velocities. Both authors report prediction
equations for MY decline with elevating levels within the
Indexes. However these were not computed, as results
would be confounded with the effect of advancing post-peak
lactation persistency. Frequency occurences of the THI
and ETI variables made discontinuous are found In Table 7
and In Appendix Table 4, respectively.
B . Rectal Temperatures and Respiration Rates
As an Indicator of animal stress, RT and RR were
recorded each week on all experimental animals during the
period of 1400 to 1500 h. Rectal temperatures were taken
with glass thermometer, with a placement time of 4
minutes. RT were recorded to the nearest 0.1 degree F,
then transformed Into C. RR were determined by counting
flank movements for one minute with the aid of a
stopwatch.

Table 7. THI of experimental period.
92
Mean Dally THI Observed Fraction ofRange Frequency Experimental Period
Cdays} C^O
1 73.4 0 073. 5 - 74.4 1 1.79
74. 5 - 75.4 3 5.36
75.5 - 76.4 2 3. 57
76.5 - 77.4 12 21.43
77.5 - 78.4 14 25.00
78.5 - 79.4 13 23.21
79.5 - 80.4 11 19.642 80.5 0 0
Total 56 100.00

93
Milk Sampling and Analysis
A . Sampllna
Kilograms of morning and evening MY were recorded
dally throughout the trial from scales on weigh Jars
CSurge, Babson Bros. Co, Oakbrook, IL). AM and PM milk
sampling, was conducted for each cow every 7 d for a total
of 8 weeks. Approximately 32 ml of well-agitated milk was
dispensed Into a plastic vial CLlncoln Suppliers, Inc.,
Owatonna, MNJ and stored at 4 C. Vials were boxed In
blind arrangement and delivered for analysis to the
testing facility within 3 h of collection. Milk fat, protein and lactose were Immediately analyzed on a Milk 0
Skan 605 Analyzer CFoss Electric Co., Hlllerod, Denmark}
by the Louisiana DHIA Laboratory. Morning and evening
milk data were pooled for one dally observation per cow.
B . Transformation
Gaines formula C12J was used to describe the energy
content of milk as 4.0% FCM. Since he observed a ± 1.5 % change In milk energy per 0.1% change In percent milk fat varying from the 4.0% milk fat level, 3.5% FCM was
subsequently calculated to be used In gross Input - output
energy efficiency determinations. The appropriate
correction factor was calculated to be a 1.08108
multiplier of 4% FCM.

94
Blood Analysis
A . Blood Collection
Blood samples were collected weekly from all
experimental cows between 0300 to 0500 h, Immediately
following the morning milking. Aranas C8} suggested that
cattle sampled for aldosterone determination while
recently having consumed feed gave erroneous results.
Animals appear to consume adequate levels of cations to
alter the level of circulating level of aldosterone. In
this study, animals were not permitted access to feed
until completion of blood sampling. Blood was collected
by Jugular venipuncture Into labeled evacuated 16 x 100 mm
glass tubes CVacutalner system, Rutherford, NJ} containing sodium heparin as anticoagulant. Each tube was
Immediately chilled In an Ice water bath for approximately
1 h before 20 minute refrigerated centrifugation at 900xg.
Resultant plasmas were withdrawn, stored In duplicate 4 ml screw-cap glass vials CKlmble, Toledo, OH} at -10 C until subsequent analysis for aldosterone' and cortisol concentrat Ions.
B . Development of Radiolmmunassavs
RIA procedures were developed for bovine aldosterone and cortisol using antiserum from Endocrine Sciences,
Tarzana, CA C70, 71}. Several modifications were made In
order to obtain Increased sensitivity at lower steroid

95
concentrations, Increased tracer counts per mass of steroid antigen and to decrease system variability between duplicates of extractions, Incubations and bound-free separatIons.
Forty-eight C48D plasma unknowns and two pools were quantitated In duplicate, while standards and total count
tubes were evaluated In triplicate for both steroids.
Plasma samples were dlstlbuted among four calibration
curves or assays to control potential variation due to
week of sampling, breed of dairy cow, pairing and
experimental treatment. See Appendix Table 5 for
laboratory sample layout.
Tracer counting of the free tracer fraction was
followed by Inserting raw data Into prepared spreadsheet
templates CSuperCalcA} to reduce and transform data to
physiological units.
1. Plasma Aldosterone Determination
Quantitation of bovine plasma aldosterone was achieved
by modification of the RIA methods described by the Endocrine Science C7CQ. The assay Included three main phases: extraction of steroid aldosterone from plasma
samples CAppendlx Table 6}, Incubation of natural antigen,
radioactive-labeled antigen and antiserum CAppendlx Table
7}» and separation of bound and free fractions CAppendlx
Table 105-
An unusally large volume of bovine plasma sample was
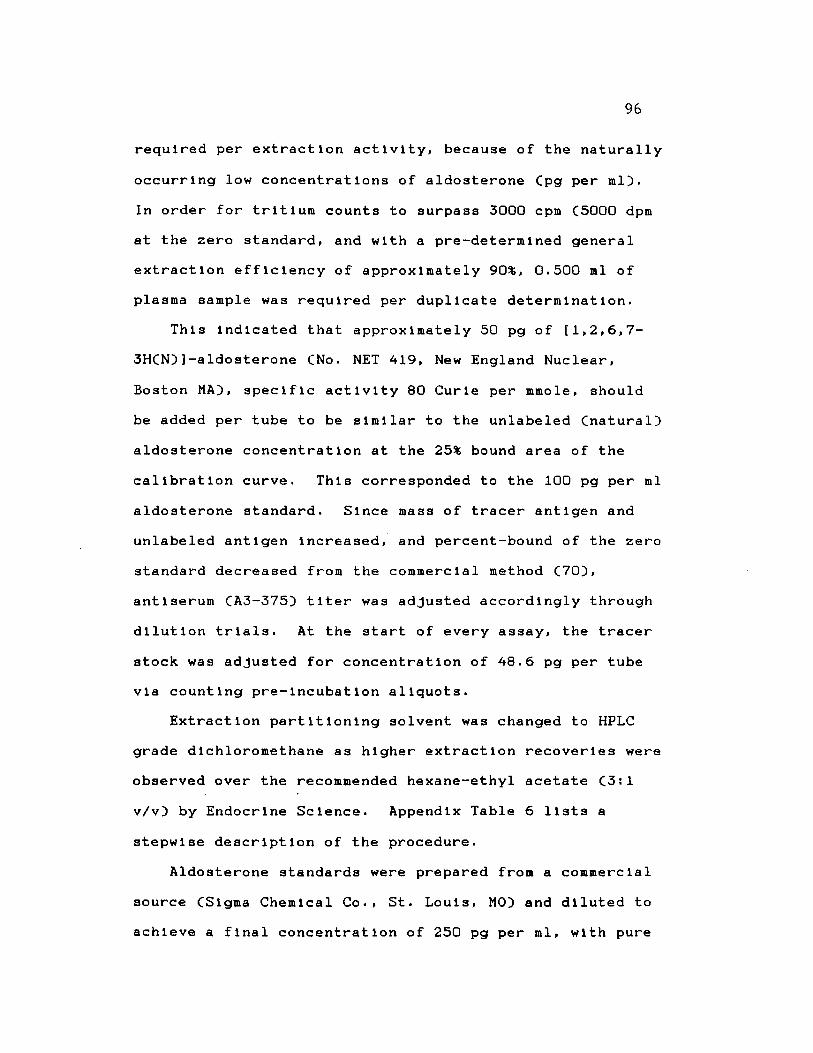
96
required per extraction activity, because of the naturally
occurring low concentrations of aldosterone (pg per ml).
In order for tritium counts to surpass 3000 cpm (5000 dpm
at the zero standard, and with a pre-determlned general
extraction efficiency of approximately 90%, 0.500 ml of
plasma sample was required per duplicate determination.
This Indicated that approximately 50 pg of [1,2,6,7-
3H(N)]-aldosterone (No. NET 419, New England Nuclear,
Boston MA), specific activity 80 Curie per mmole, should
be added per tube to be similar to the unlabeled (natural)
aldosterone concentratIon at the 25% bound area of the
calibration curve. This corresponded to the 100 pg per ml
aldosterone standard. Since mass of tracer antigen and
unlabeled antigen Increased, and percent-bound of the zero
standard decreased from the commercial method (70),
antiserum (A3-375) titer was adjusted accordingly through
dilution trials. At the start of every assay, the tracer
stock was adjusted for concentration of 48.6 pg per tube via counting pre-lncubatIon aliquots.
Extraction partitioning solvent was changed to HPLC
grade dlchloromethane as higher extraction recoveries were
observed over the recommended hexane-ethyl acetate (3:1
v/v) by Endocrine Science. Appendix Table 6 lists a
stepwise description of the procedure.
Aldosterone standards were prepared from a commercial
source (Sigma Chemical Co., St. Louis, M0) and diluted to
achieve a final concentration of 250 pg per ml, with pure

97
nanograde methyl alcohol. See Appendix Table 9 for specific tube volumes constituting the calibration curves.
The radioactive aldosterone tracer was prepared similarly as described by Endocrine Science, with the
exception of slight component volume alterations to
Increase concentration In the final DAB solution. See Appendix Table 9 for specific volumes. The described
activity of radioactive aldosterone used In this study was
reduced, by calculation, to 492.8 tritium dpm per pg of material. With a 63% counting efficiency of the
scintillation counter used CModel LS 8000, Beckman
Instruments, Fullerton, GAD, 311 cpm were recorded per pg
of 1,2,6,7-3HCN}-aldosterone in the system.
2. Plasma Cortisol DeterminationMeasurement of bovine plasma cortisol was from a
developed and vallded RIA published procedure C71D
modified to fit previously mentioned laboratory criteria.
Due to high degree of antiserum specificity, no sample
preparation was required. Thus, only Incubation and separation phases of RIA were required for this steroid quantitation. This allows specific measurement of
cortisol directly In bovine plasma, without the risks of potential errors associated with steroid purification
procedures. The RIA assay was modified In a similar
manner as was done for bovine'aldosterone.
Due to higher specific activity of the [1,2,6,7-

98
3HCN)]-cortisol antigen CNET-396, New England Nuclear#
Boston, MA,), Increasing tritium dlslntergratIons In the
assay tubes was found to Increase assay flexibility. Endocrine Science C71) recommended adding 62.9 pg of a two
tritium-labeled cortisol per tube, whereas this study
Incorporated 70 pg per tube of a four tritium-labeled
cortisol molecule. The half-mass equilibrated with
approximately 35 pg of unlabeled standard cortisol per
tube, which approximated the 1.5 ng per ml standard level.
This led to very steep dose-response curves.
Specific activity for the cortisol tracer was 98.5 Cl
per mmole, which converted to 603 dpm per plcogram and 380 cpm per pg with an LS 8000 sclnt1 H a t Ion tritium counter.
As with aldosterone, antiserum dilution trials were
conducted to determine the 50% bound titer of the
antiserum of the new level of tracer antigen and lower
level of bound fraction that Is favored. The sensitivity
reported by Endocrine Science C71) at the low end of the
standard curve did not approximate conventional research
standards with bovine research. By Increasing the antiserum level per tube to bind with 40 pg of labeled
cortisol, a steeper, more sensitive calibration curve
resulted In the levels of Interest to bovine research CO.5 to 20.0 ng per ml).
As with aldosterone RIA, tracer stock was adjusted for
radioactive cortisol concentration before actual assay.
Cortisol mass required to be 70 pg per assay tube, which

99
provided total cpm per half-tube volume of approximately14,000. This also provided the zero standard with
readings of about 7000 cpms.Cortisol standards were prepared from commercially
available standardized vials (Sigma Diagnostics, St.
Louis. M0) and diluted with methyl alcohol to obtain a
terminal concentration of 4000 pg per ml In the stock, solution. See Appendix Table 11 for specific volumes required for the standard calibration curves. Incubation procedures are listed In Appendix Table 12.
Volumes of both antiserum and tracer stocks used In the DAB solution are found In Appendix Table 13.
Due to the similarities between the two RIA systems of
the antiserum supplier, many of the conventional solutions
required were Identical and are described In procedure
bulletin (71). In both assay systems, radioactive bound
phase was separated from free phase by addition of
saturated ammonium sulfate solution and centrifuged at 4 C
at 2000 x g for 20 minutes. Aliquot aspirations are described In Appendix Table 10 (aldosterone) and Appendix
Table 14 (cortisol). Specific commercial sources of the reagents and equipment used are listed In Appendix Tables
15 and 16.
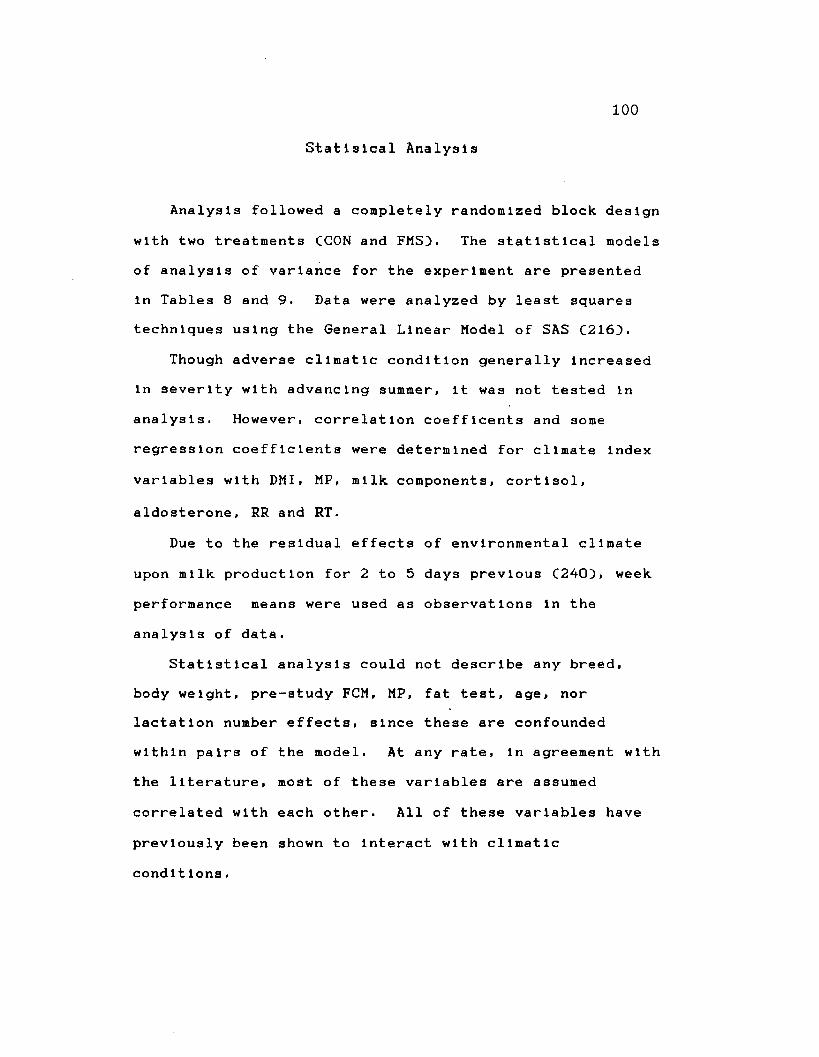
100
Statlslcal Analysis
Analysis followed a completely randomized block, design
with two treatments CCON and FMS}. The statistical models of analysis of variance for the experiment are presented In Tables 8 and 9. Data were analyzed by least squares techniques using the General Linear Model of SAS C216}.
Though adverse climatic condition generally Increased In severity with advancing summer. It was not tested In
analysis. However, correlation coefflcents and some
regression coefficients were determined for climate Index
variables with DMI, MP, milk, components, cortisol,
aldosterone, RR and RT.
Due to the residual effects of environmental climate
upon milk, production for 2 to 5 days previous C240), week,
performance means were used as observations In the
analysis of data.
Statistical analysis could not describe any breed, body weight, pre-study FCM, MP, fat test, age, nor lactation number effects, since these are confounded within pairs of the model. At any rate, In agreement with
the literature, most of these variables are assumed
correlated with each other. All of these variables have
previously been shown to Interact with climatic
condltIons.

101
Table 8. Analysis of variance for model of performance and physiological variables.
Source df Ef fects
Diet 1 random
Cow pair 11 random
Diet * Cow pair 11 random
Week 7 fixed
Week * Diet 7 random
Error 154 random
C. Total 191

102
Table 9. Analy3l3 of variance for model of diet variables.
Source df Effects
Diet 1 random
Week 7 fixedError 7 random
C. Total 15

RESULTS AND DISCUSSION
Qualitative Reliability of Radiolmmunassays.
Since RIA techniques Involve the use of small amounts
of expensive materials, measured and dispensed with
sophisticated equipment, these novel procedures were
monitored through quality control evaluations.Calculation of certain basic statistical parameters (228}
permitted describing the sensitivity, precision and
accuracy of each steroid's RIA assay system. The 192
samples originated from 24 lactatlng cows distributed
among 2 treatments, sampled weekly for 8 weeks. Individual
blood samples were systematically assigned In order to
distribute any steroid concentration variation associated
with breed, pair and treatment over 4 RIA curves of assay.
A . Aldosterone.
Data from the mean of 4 calibration curves and
standard errors are given In Table 11. The range of observed plasma concentrations was within the limits of the standard significantly different from zero and the
highest standard in the calibration curve. The
concentrations of natural steroid antigen and diluted
antiserum expressed a congenial fit to the equivalent
concentrations of prepared standards for aldosterone
determination In the lactatlng dairy bovine. The mean
103
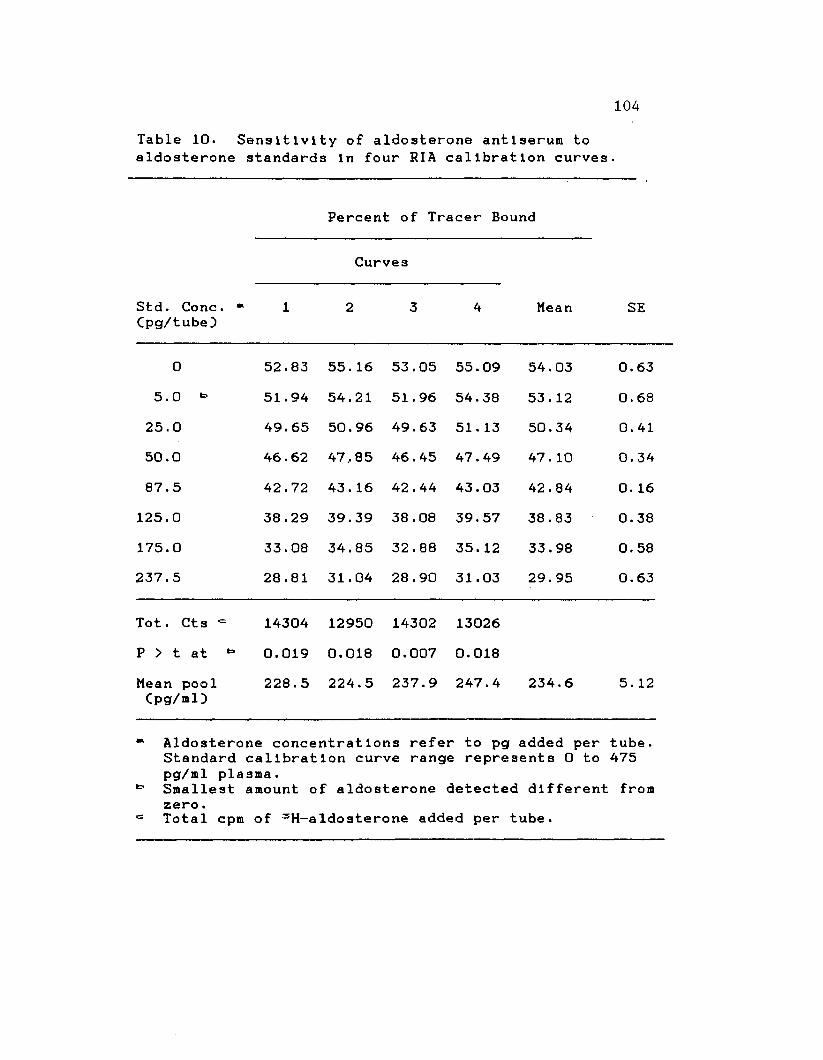
104
Table 10. Sensitivity of aldosterone antlserum to aldosterone standards In four RIA calibration curves.
Percent of Tracer Bound
Curves
Std. Cone. * Cpg/tube}
1 2 3 4 Mean SE
0 52.83 55. 16 53.05 55.09 54.03 0.635.0 * 51.94 54.21 51.96 54.38 53.12 0.6825.0 49.65 50.96 49.63 51. 13 50.34 0.4150.0 46.62 47,85 46.45 47.49 47. 10 0.34
87.5 42.72 43. 16 42.44 43.03 42.84 0. 16125.0 38.29 39.39 38.08 39.57 38.83 0.38175.0 33.08 34.85 32.88 35. 12 33.98 0.58237.5 28.81 31.04 28.90 31.03 29.95 0.63
Tot. Cts ■= 14304 12950 14302 13026
P > t at *» 0.019 0.018 0.007 0.018
Mean pool Cpg/ml}
228.5 224.5 237.9 247.4 234.6 5. 12
* Aldosterone concentrations refer to pg added per Standard calibration curve range represents 0 to pg/ml plasma.
** Smallest amount of aldosterone detected different zero.
* Total cpm of 3H-aldosterone added per tube.
tube . 475
from

105Table 11. Range of adrenal corticold concentrations observed In study.
Aldosterone CortisolCpg/ml) Cng/ml)
Highest Standard 475.0 30.72
Observed ConcentrationsCMean ± SE) 232.9 ± 6.1 8.63 ± 0.34
Individual Observations,CRange of ConcentratIons) 95.2 - 472.3 3.15 - 22.57

plasma aldosterone values observed In this study were
232.9 ± 6.1 pg/ml. This value Is much higher than those
reported In similar cattle by Roussel et al. (2103 and Aranas (83* whose values were 176.4 ± 27.0 pg/ml and 62.7
± 3.6 pg/ml, respectively. Both of those studies Included
blood sampling at 0700 to 0800 h. Aranas (83 observed the highest values at that time and lowest values at the
warmer periods of the day. Blood samples in this
current study were taken between 0300 and 0500 h,
before animals were permitted to feed, after the morning
milking operation. Aranas (83 reported that the animals
under study were treated with ACTH or anglotenslon II,
0.25 to 0.50 h before blood sampling. That study was conducted during the cooler month of May, while Roussel
et al. (2103 collected blood samples during the winter and spring. Blood samples In this current study were
taken during late June to late August, when environmental conditions were extremely heat stressful. Any of these
variables may explain the higher values and larger variability observed In this study.' However, range of
Individual aldosterone determinations observed In this
study are very similar to Beede et al. (203 where 0200 h
means were 200 pg/ml, while those of 1200 h averaged
400 pg/ml.
Least amount of aldosterone detected In the studies of
Aranas (83 and Roussel et al. (2103 were 25 pg/ml. Mean
coefficients of determination (R23 currently observed
107
ranged from 0.9909 to 0.9993, with a mean of 0,9958 Cn = 4). This value Is more favorable and consistent with other scientific findings and recommendations as described by Abraham and Garza CD- Linear regression statistics
for aldosterone RIA are found In Appendix Table 17.
As conventionally employed In RIA laboratories, the
percent-bound variables and calibrated standard
concentrations were transformed Into logit and natural log
values to linearize the response of the dependent variable
Cpercent of tracer antigen bound to antisera) to the dose
of the Independent variable Cstandard concentration).
Data reported In Table 10 shows descriptive statistics for assay sensitivity and variability on the Independent
variable of steroid concentration. The least amount of
aldosterone that could be detected from zero was below the
first non-zero standard of 5 pg/tube CP<-02). The high
degree of repeatability among replicates Cn=3) at the zero
and first non-zero standard yields a more easily detected
difference, using student-t test for least significant differences C228).
Estimates for lntra and Interassay variation were obtained by statistical analysis of nested variances of
repeated determinations of aldosterone concentrations from
a constant pool sample source. The pool sample was a
random mixture of plasma from 2 cows each of Holstein,
Guernsey and Jersey breeds within each treatment herd,
during Week 4 of the experiment. The mean and standard

108
error plasma aldosterone values for pooled sample was
234.6 ± 5.12 pg/ml.
Aldosterone assays were accounted as precise, as no
significant differences were observed In any of the levels
or repetition from between duplicates of 3lngle
determinations, replications within assays and replication
among assays CAppendlx Table 180. These capabilities led
coefficients of variation for between duplicates, repltltions and assays to be 2.29, 2.58 and 4.35%, respectively. These compare favorably with the 5.25%
coefficient of variation reported by Roussel et al. C210).
In addition the mean coefficient observed among duplicate determinations for all unknowns In this study was 1.06%.
The sensitivities and precisions observed In this
study were well below scientific recommendation C2, 43, 47). The finding of a consistent 5 pg per tube CIO pg/ml)
sensitivity using triplicate determinations Is below that
observed by others using similar antisera sources C8, 18, 210, 217). The low level of coefficients of variation observed Is favored, so as not to Inflate the mean square of the error term In the experimental model. This prevents
masking detection of statistical differences among higher
sources.
Cross reactivity efficacies of the aldosterone
antiserum determined by commercial supplier CEndocrlne
Science) satisfied those criteria for assay specificity,
described by Chen et al. C48).
109Skelley et al- C226} and Abraham and Garza Cl} have
reviewed the Idiosyncrasies and features of determining
assay acuracy. They recommend antigen recovery greater
than 80%, after In vitro additions of antigen to plasma.
This recovery evaluation assesses relative accuracy of the
specific RIA system. Additions of 5, 50 and 100 pg per
assay tube of unlabeled aldosterone were made to 0.500 ml
of pooled sample and reassayed. Mean assay recoveries
Cn=6} were 99.3, 100.1 and 97.9%, respectively. This
Indicated that all Incubated aldosterone was available for
detection In the developed assay system.
Mean extraction efficiency for aldosterone pooled
samples was 91.3 ± 2.1% Cn=8} and was utilized for
correcting post-tube aldosterone determinations. The
addition of 10 pg of 1,2,6,7-3HCN}-aldosterone
Capproxlmately 3800 dpm} was allowed to Incubate at least
60 minutes till added steroid equilibrated with natural
steroid, as described by Abraham C2}. Afterwards, spiked
pooled samples were extracted with dlchloromethane, as
described In Experimental Methods, with fraction recovery being determined.
Negative blanks were evaluated as NSB of the tracer
hapten with non-ant 1 serum sources. NSB values averaged 1.29 ± 0.04% for buffered standards and 1.29 ± 0.24% for
plasma samples. Both were used In correcting the total
reactivity of aldosterone tracer for antlgen-ant1 serum
reaction, for standards and unknowns, respectively.

110
Endocrine Science C70} recommends values less than 7% NSB as criteria, while Abraham and Garza C1D use 10% NSB as . limit for curve rejection. The low levels observed In this study Indicates a small chance of under estimating
aldosterone levels. Positive blanks, which could lead to
steroid over-est1 mat Ion, were also an unlikely occurence
due to the degree of curves sensitivity between the zero and first non-zero standard.
B . Cort 1 so 1
Mean and range of cortisol data from 4 calibration
curves are presented In Table 11. Observed plasma
concentrations were within limits of the first non-zero standard and the highest reference of 30.72 ng/ml.
Cortisol mean and standard error observed In this study
were 8.63 ± 0.34 ng/ml. These values agree with the
magnitudes reported by Sartln et al. C215J, El-Nouty C67J,
Macaulay et al. C142) and Gwazdauska3 et al. C97, 98).
However, the overall mean for this study was lower than that reported by Aranas C8} 12.5 ± 0.5 ng/ml. The lower concentrations observed In this current study may be due to the varying positions of the experimental animals
within respective lactation curves as described by
Bardwell C18J or the tremendously higher level of heat
stress imposed and physiological adaptation required than
that of cows used by Aranas C8). Table 3 indicates that
cows average 139 ± 39 d Into current lactation at the

Ill
onset of this experiment. However, others participating
In bovine plasma cortisol determinations, convincingly
report large degrees of cortisol variability (.67, 142,
211). It Is also Interesting that highest values of Aranas C8) In a clrcadlun rythym study, were observed
between 1700 to 0900 h, with 0400 and 0500 h means of 12.9
± 2.3 and 7.5 ± 1.2 ng/ml, respectively. This agrees well with the means observed In this study. El-Nouty C68) at
Missouri, reported mean cortisol values of 8.31 ± 1.26 ng/ml at 33 C and 6.23 ± 0.59 ng/ml at 20 C, with ranges
of 4.11 to 8.86 and 3.24 to 16.24 ng/ml, respectively.
Roussel et al. C211) reported ranges of 2.74 ± 0.52 to 14.66 ± 10.78 ng/ml In reproduct 1vely cycling lactatlng
dairy cows.
As with aldosterone, loglt-log transformations were
utilized to linearize the bound response to dose
concentration. Table 12 shows cortisol assay sensitivity and variability of percent-bound on cortisol
concentration. The least amount of cortisol detected
different from zero was always located below the first non-zero standard CP<*001, n=3). Thus, assay sensitivity
In this study was more discriminating than those systems
by Sartln and Kemppalnen C215) and Roussel et al. C211).
Mean coefficients of determination CR31) for loglt-log
transformed data ranged from 0.9985 to 0.9994, with a mean
of 0.9976 Cn=4). This compares favorably with 0.9959 reported by Roussel et al. C211). Linear regression

112
Table 12. Sensitivity of cortisol antiserum to cortisol standards In four RIA calibration curves.
Percent of Tracer Bound
Curves
Std. Cone. * 1 2 3 A mean s.e.Cpg/tube}
0 54,,79 54,.74 55. 65 56,, 10 55,.32 0 .3325.,0 •= 51,,89 51,.86 53. 03 52,,80 52,,40 0 .3050.,0 48 ,,57 48,,57 49. 54 48,,32 48,,75 0 .27
100.,0 43,, 14 43,, 19 43. 48 42,,73 43,, 14 0 .15200.,0 32.,74 32.,87 32. 70 33,,01 32,,83 0 .07400,,0 23.,50 23.,71 22. 66 24,,09 23,,49 0 .30800,,0 15., 46 15,,73 14. 07 16,, 18 15,,36 0 .451600.,0 9.,96 10.,27 8. 22 10.,32 9.,69 0 .50
Tot. Cts ■= 26252 26460 25896 26162
P > t at b 0.001 0.001 0.001 0.001Mean pool 9.57 9.64 9.61 9.20 9.51 0.10Cng/ml)
Cortisol concentrations refer to pg added per tube. Standard calibration curve range represented Is from 0 to 30.72 ng/ml plasma.Smallest amount of cortisol detected different from zero.
,=: Total cpm of 3H-Cortlsol added per assay tube.

113
coefficients and Intercepts for cortisol RIA are listed In Appendix Table 19.
Estimates for lntra- and lntei— assay variation In cortisol assays were also made from statistical analysis
of nested variances of repeated determinations of a plasma
pool source. Mean plasma cortisol value for this sample among all assays was 9.51 ± 0.10 ng/ml CTable 12}. No
differences were detected In any level of repetition
between duplicates of single determinations, replications
within assays and replication among assays CAppendlx Table
18). These findings led coefficients of variation to be
1.34, 1.53, and 2.13%, respectively. These compare
similarly with 1.58% lntra- and 5.4% lntei— assay
varablllty of Roussel et al. C211). In addition, the mean
coefficient among all duplicate determinations In this
study was 0.63%.
Cross reactivity with other structurally-related
steroids determined by Endocrine Science C71) also complied with those criteria for assay specificity,
described by Chen et al. C48).As a measure of relative accuracy, antigen recovery In
this cortisol RIA system was determined. Additions of
25.0, 100.0, and 400.0 pg/ml of unlabeled cortisol were
made Into 0.050 ml of pooled sample and reassayed. Mean
cortisol assay recoveries Cn=6) were 94.7, 99.7 and
101.3%, respectively. Thus, a very high potential for
cortisol assay accuracy was evident.

As with the aldosterone RIA system, negative blanks
were evaluated as NSB. These values averaged 1.24 ± 0.43%
for buffered standards, and 1.30 ± 0.61% for plasma
samples. As routinely practiced, these fractions were employed In adjusting total tracer Isotope reactivity
concentrations, before calculation of fraction bound of
unlabeled antigen Cstandard and unknown}.
Both RIA systems developed for the purpose of this
current study were proven to be highly sensitive, accurate and precise for bovine plasma aldosterone and cortisol.

115
Respiration Rate and Rectal Temperature
Maximum dally temperatures averaged 33.16 ± 0.86 C, while mean dally THI and ETI values were 78.02 ± 0.89 and 32.94 ± 1.27, respectively. Table 7 Illustrates that 89%
of the experimental period observed mean dally THI values
over 76.5. Additionally, Appendix Table 4 Illustrates that 93% of the experimental period saw dally mean values In excess of 30.5. According to prediction equations of
Baeta et al. C15), the mean ETI observed In this study,
estimates a rise In thermoneutral RT of 1.5 C, above
normal 38.5 C C119). Hahn and McQulgg C100) estimates use 0.12 C of RT per unit of THI Increase. Under this
description, an Increase of RT would be expected to rise
to 39.5 C. Both estimates approach that observed In this study C39.7 and 39.9 C). Due to the highly significant
curvilinear relationship CR2 = 0.67 to 0.82) between RT
and RR, determined by Finch C78), RR would also be expected to rise.
Figures 7 and 8 Illustrate graphically the gradual rise In RR and RT, respectively, with advancing Summer during the experimental period. RT and RR correlated
poorly with Tmax, THI and ETI In the FMS cows, while RT of
CON cows expressed a significant association with Tmax
CO.17, P.C-10), THI CO.21, PC.04) and ETI CO.22, PC.03), as
shown In Table 13.
Along with a significantly higher RR and an

116Table 13. Corre RT with climatic
Diet
RR FMS
CON
RT FMS
CON
at Ion coef flcle variables.
N Tmax
96 0.10
96 0.14
96 -0.07
96 0.17
s between RR and
THI ETI
0.15 0.09
0.07 0.03
0.02 0.03
0 .21* 0 .22*
* P < .05

RESP
IRAT
ION
RATE
(CPM)
800
Figure 7. Effect of dietary treatment on weekly RR. 117
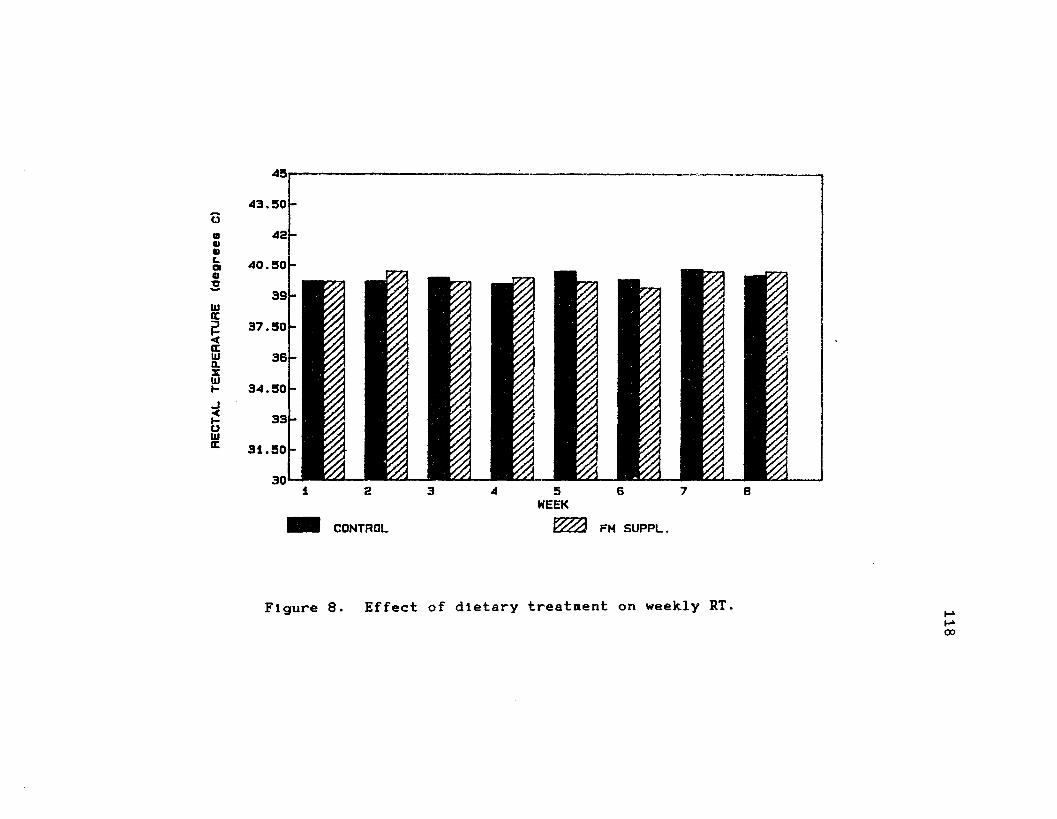
RECTAL
TEMP
ERAT
URE
(degrees
C)
454 3 .5 0
42
4 0 .5 0
39
3 7 .5 0
36
3 4 .5 0
33
3 1 .5 0
30
WEEKCONTROL FM SUPPL.
Figure 8. Effect of dietary treatment on weekly RT. 118

119
approaching significantly higher CP<0.11} RT In CON cows,
a meaningful relationship Is seen. Cows apparently more
heat stressed, expressed adaptive responses of Increased
RR associated with changes In higher RT. Since cows were quantitated for RT and RR simultaneously, a high
correlation between these two variables was anticipated.
Comparisons between both groups Indicate this
relat lonshlp.
Analysis of variance for RR and RT is provided in
Appendix Table 18, with Illustrations of weekly means
reported as bar graphs In Figures 7 and 8. Significant
week effects are also noted, which followed a general trend for lower RT and RR for the first-half of the
experimental period and for elevated levels in both
variables during the second-half. This also corresponded
within ambient temperatures and climate Indexes.Mean RR and RT for FMS and CON groups were 99.6 ± 1.75
cycles per minute and 39.7 ± 0.12 C, and 105.4 ± 1.75
cycles per minute and 39.9 ± 0.12 C, respectively. Though others have shown accelerated RR and RT In heat stress studies, these current values compare slightly lofty to
responses of most other similar studies C220, 103, 194}.
Those studies occurred during cooler months, Included
sampling at cooler periods of the day, and/or reported
dally means of repeated measurements from cool and hot
periods. -Recordings In this current study were taken
during peak thermal stress times of 1400 to 1500 h.

120
Normal rates of respiration in thermoneutral lactating
dairy cattle are 20 to 22 rpm C81, 130), while
thermoneutral rectal temperature is declared at 38.5 G C74). At any rate, physiological responses of these
magnitudes provide a surety of heat stress, as planned for the evaluation of treatment effects in this study.
The results of this study suggest that FMS cows may
have been spared maximum degrees of heat stress or have
benefited from lowered rates of heat production. Though RT were not significant, a trend to approach significance
was evident CP<0.11). Lower RR may be due to slightly less RT, though treatment difference was only 0.2 C.
However, Coppock et al. C57) have shown that 0.2 C between
treatments has led to statistically significant
dl f ferences.Either less metabolic heat was produced and thus less
heat needed to be dissipated by FMS cows or these cows
were more efficient In removing equal heat loads from
Internal spaces via sweating. Both mechanisms could have lowered RT. Macfarlane C143) describes animals using respiratory ventilation as a mechanism of cooling expend four times more energy than an equivalent amount for heat
dissipated from sweating. Whether the small 0.2 C
difference was sufficient to elicit other physiological
alterations, dietary Intakes and changes In milking performance Is not certain.
Elevated RT usually represents a minor state of

dehydration In cattle, as described by Klbler and Brody
C128). Perhaps less dehydration was occurring In FMS cows
and more systemic fluids Ce.g., water) were available and responsible for additional differences In heat stress and
MY responses. Finch C78) states that redirection of blood
from body core to skin could permit more efficient radiation of heat loss. Nonevaporat1ve heat losses of 55-
65% of total heat loss radiated from skin, leaving 35-45%
from evaporation of skin moisture, at thermoneutral condition. However, at high temperatures and humidities,
evaporative cutaneous heat loss may represent 67 to 73% of
the total body heat loss C78). Klbler and Brody C128) also have found very similar results, with slopes of total
heat dissipation being closely and Inversely related to
skin surface evaporation levels. It Is not certain
whether dehydration causes primary higher RT or vice
versa. Though RR elevates drastically during heat stress,
It may represent only 12 to 15% of total evaporative heat loss C78). Coppock et al. C57) declare that body
temperatures rise when elevated RR falls to eliminate
excess heat.Thermally Induced hyperventilation Chlgh RR) was shown
to decrease blood pCOa by Schneider et al. C220).
Resulting alkalosis Chlgh pH) Is accompanied by elevated
kidney excretion of bicarbonate CHCO®-) with H*
reabsorption Into blood. Those Investigators showed that
activity occurlng only during the hot portion of the day,

122
with opposite trends during cooler hours. Furthermore, RR increases to even greater extents when blood Increases in
H"* concentration, compounding the alkalosis condition and sodium loss into urine.
Collier et al. C56) indicated a change in body water
partitioning during heat stress. At 30 C, cows drank 29% more water than at 18 C, yet Increased urination by only
15%. RR Increased by 50% with surface evaporation
Increasing 59%. Water loss from the body surface Increased
176% C56). Such inclined evaporative heat losses may effect mineral cation balances through direct loss of
potassium in elevated sweating rates and elevated urinary loss of sodium, and through acid-base lnbalances through
Increased lung alveolar ventilation.
The higher intake of CP and UDP in this study may have
implications in lessening animal discomfort. Ott and
Roussel C1045 and Hassan C103} in two Louisiana studies,
feeding high levels of CP, have shown lower RR in
lactatlng dairy cows, without a change in RT. Those results are similar to the observations collected in this study. The results of this current study however, disagree with work in Arizona, where higher UDP diets of
medium CP content caused significantly higher RR, without
change in RT C105). However in a 19% CP lsonltrogenous
treatment, high RDP diets caused greater RR than the UDP diet.
It seems apparent from feed Intake and MY data, that

higher rates of metabolic heat production should have occurred In the FMS group. If such thermogenic treatment responses occurred, the lowered RT may have been from levels potentially higher than that of the CON group.Thus RT reflects origin from two possible effects: ID that
of the difference from the control, and 2D that of
potential RT above controls due to Increased metabolic
heat production. This could only occur, If the FM
supplement stimulated other more efficient heat
dissipating mechanisms Ce.g. higher sweating ratesD-
Staples et al. C231D have shown Increased body tissue
mobilization with administration of bSTH treatment to late
lactation dairy cows under natural heat stress conditions
In Florida. Such mobilization caused higher heat
production rates, as evidenced by higher RR, along with Increased milk synthesis and without Increased RT. It was
also observed that responses to bSTH was only about half
that obtained In other similar studies conducted during
thermoneutral conditions. Those results along with these
of the current study, may Indicate that the nonsignificant
0.2 G difference In RT of the FMS group may not reflect true heat production differences, regardless If the 0.2 C
dlfferencelt was significant. Instead the small
difference may reflect more heat dissipation efficiency,
especially via non-evaporat1ve means.

124
Feed Intake
Due to the high thermally-stressful conditions of the
experiment, DMI depression was anticipated. Differences
from experimental period onset and termination were
drastic, as were differences In climate. The relationship by treatment Is given In Figure 9. Highly significant
CP<.002) correlation coefficients for THI and ETI with DMI for FMS and CON groups were -0.40, -0.47, and -0.44,
-0.52, respectively. Association of DMI with maximum
dally temperatures were not significant. Observed
coefficients were much higher than that stated by NRC
C169). However, their values were derived from climate
spectrums of heat stress through thermoneutrallty and
further through cold stress. Sequential regression
analysis expressed significant quadratic effects without cubic responses for THI and ETI. Apparently cllmatologlcal Indexes describe physiological and physical
compensatory adjustments to heat stress more accurately. Relationships of DMI with THI are given In Figure 9. At
any rate, the DMI responds favorably with that proposed by
Ames and Ray C7).
A synopsis of mean dally dietary Intakes for each
treatment are given In Table 14, and actual nutrient
content of consumed dry matter Is presented In Table 15.
Analysis for variance for DMI Is provided In Appendix
Table 19. According to the prediction equation of DMI

DRY
MATT
ER
INTA
KE
(Kg
/d)
20 T DMIfm s = -1 1 0 5 .6 + 69.3X - 1.07X2 ( r 2 =.74)
1 8 + — DMIcon = -5 8 6 .9 + 37.4X - .5 8 X 2 (R2 = .64)
1 6 -
1 4 -
1 2 -
10
• CONTROLO FISH MEAL SUPPLEMENT
30 31 32 33 34EQUIVALENT TEMPERATURE INDEX
35
Figure 9. Effect of ETI on DMI.
125

Table 14. Cow mean dally nutrient Intakes.126
Nutrient Intake FMS
Treatments
CON
DM Ckg/dD 14.56 12.83
CP Cg/d} 2302.00 1798.00CF Ckg/d} 2.23 2.02ADF Ckg/d) 2.75 2.48
NDF Ckg /d) 5.22 5.32
Fat Cg/d} 376.00 304.00
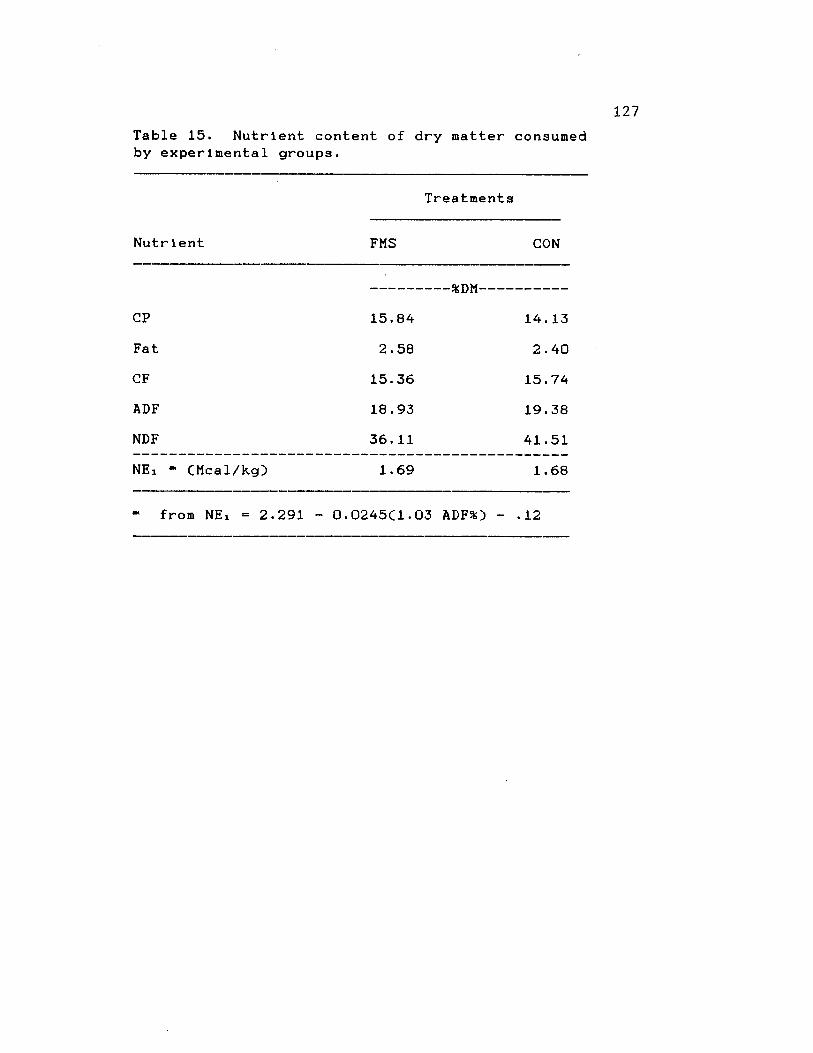
Table 15. Nutrient content of dry matter consumed by experimental groups.
Nutrlent FMS
Treatments
CON
--- %DM----CP 15.84 14. 13
Fat 2.58 2.40CF 15.36 15.74ADF 18.93 19.38NDF 36. 11 41.51
NEi m CMcal/kgD 1.69 1.68
from NEi = 2.291 - 0.0245C1.03 ADFSO - .12

128
during periods of heat stress C15) a reduction of 2.4 kg/d
was anticipated from a conventional 3.5% of BW. For both
groups at 3.5% BW, DMI was 17.1 kg. However actually consumed DMI mean over both groups over an 8-week period was 13.70 kg. This calculates to a decline of 3.4 kg'per
d, which does not compare favorably with prediction
equations. However, since 3.5% BW Is excessively high,
such comparison may be misleading. Baeta et al. C15)
equation predicts DMI under conditions of this study to be14.7 kg/d, while actually consumed DM for FMS and CON cows
were 14.56 and 12.83 kg/d, respectively. The FMS cows
were similar to that of prediction equation, whereas CON
cows were deficit by approximately 2 kg/d.
Average dally DMI for treatments was highly
significant CP<-0001), being greater for FMS group by 1.73
kg. The data suggests that FM supplementation Increased
DMI, CP Intake and corresponding Intakes of all other
nutrients with exception of NDF. These results are
comparable with others feeding higher CP levels C178, 186,
243), and higher UDP fractions C153, 157, 170) In apparently non-heat stressful locations. Results specifically agree with those studies feeding higher
protein levels during heat stress periods C103, 194).
In FMS cows, the higher DMI, higher nutrient Intakes,
higher quantity of CP Intake and lower degradablllty of CP
may be explained by an Increase In diet digestibility
and/or a faster rate of dlgesta passage. The postulated
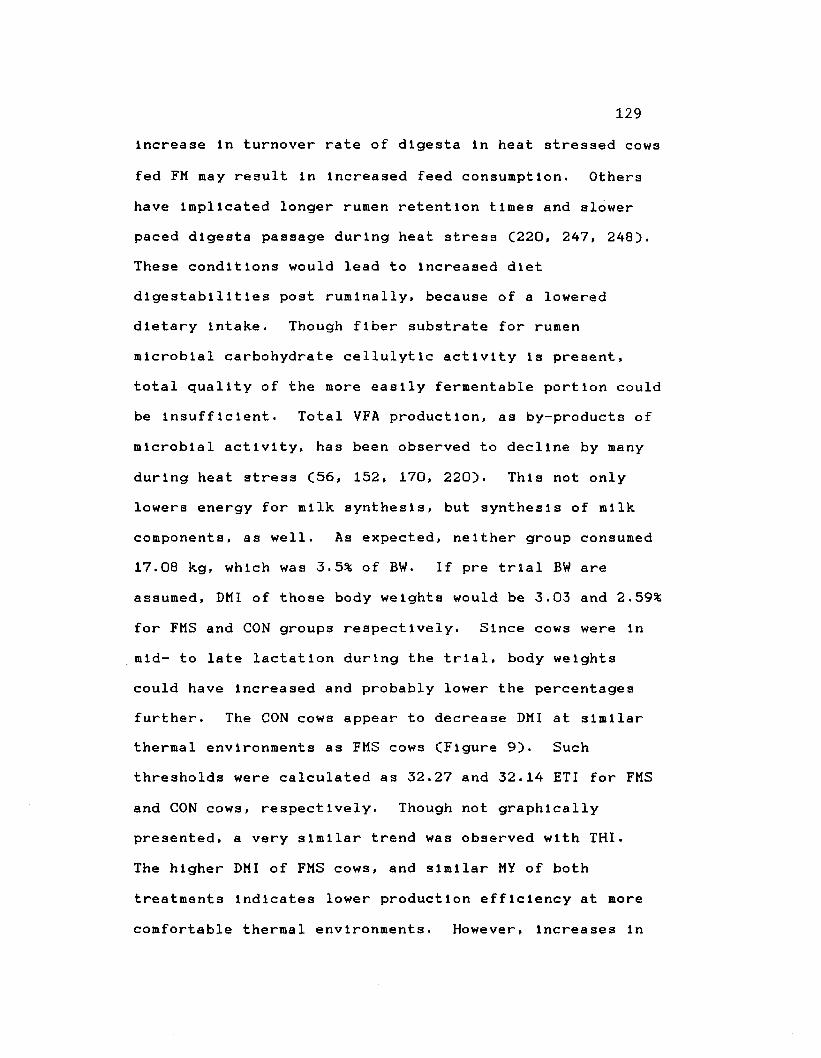
Increase In turnover rate of digests In heat stressed cows
fed FM may result in Increased feed consumption. Others
have implicated longer rumen retention times and slower paced digests passage during heat stress C220, 247, 248).
These conditions would lead to increased diet
dlgestabl1 ities post rumlnally, because of a lowered dietary intake. Though fiber substrate for rumen
microbial carbohydrate cellulytlc activity is present,
total quality of the more easily fermentable portion could
be insufficient. Total VFA production, as by-products of
microbial activity, has been observed to decline by many
during heat stress C56, 152, 170, 220). This not only
lowers energy for milk synthesis, but synthesis of milk
components, as well. As expected, neither group consumed
17.08 kg, which was 3.5% of BW. If pre trial BW are
assumed, DMI of those body weights would be 3.03 and 2.59%
for FMS and CON groups respectively. Since cows were in
mid- to late lactation during the trial, body weights
could have Increased and probably lower the percentages further. The CON cows appear to decrease DMI at similar thermal environments as FMS cows CFlgure 9). Such
thresholds were calculated as 32.27 and 32.14 ETI for FMS
and CON cows, respectively. Though not graphically
presented, a very similar trend was observed with THI.
The higher DMI of FMS cows, and similar MY of both
treatments indicates lower production efficiency at more
comfortable thermal environments. However, Increases in

130
DMI may be a function of Increased body weight due to FM supplementation. DMI as a percentage of body weight could have been less for FMS cows.
Cows fed FMS diets consumed significantly higher CP
levels, due to greater levels of DMI and to a 2.2% higher
level of CP In the diet DM. Table 14 shows that FMS cows
consumed 504 g/d more CP than CON cows. It Is Interesting
that the FMS diet had only 14% greater CP levels, yet FMS
cows consumed 28% more protein than CON cows from totally
mixed rations. According to Table 14, FMS cows consumed
exactly equal and CON cows ate 506 g Cor 22%} less than
calculated as dally requirement from Table 4. Therefore,
though diet protein contents were higher than required,
Insufficient protein may have occurred, providing the
limiting nutrient for milk, performances. There would be speculated low blood ammonia and urea levels present In
these cows, since rumen microbes and tissue did not have
access to potentially excess N. Microbial bacteria
starved of N cannot proliferate and produce energy, nor
digest more resistant degradable plant tissue. Thus, digestibility of ration can be lowered by Insufficient N. Lower rates of microbial protein synthesis has been shown
to occur with faster rates of rumlnal dilutions C101}.
Rumlnal fluid dilution rates are also associated with low
levels of propionate production. If water Intake was greater for CON cows, water gut fill would have limited
DMI, and decreased propionate production by microbes.

131
This would also limit Intake of other nutrients, as such
components depend on DMI level.
Nutrient analysis of dally refusals of the FMS group
Indicated a higher fraction of CP and dietary fat than In the feed on offer CTable 16). As a result, both FMS and
CON cows consumed less CP and dietary fat thananticipated. Since CON cows were offered equal amounts of
CONC and CS, such elevated CP and dietary fat levels are
thought to result from powdery FM settling to bottom of
the feed bunker. If such assumptions are made, a decrease
In the apparent level of FM consumed was 0.403 kg Instead
of 0.692 kg has resulted. It Is concluded that top
dressing mealy dietary supplements are not favored when
conducting feeding trials where constant levels of dietary
components are designed to occur. Accordingly FMS cows
apparently consumed 2.77% of dietary DM as FM, Instead of
calculated 4.75%. Thus cows apparently consumed only
58.2% of that anticipated In a TMR with FM added and mixed at time of feeding. Table 16 also Indicates that cows ate
more than a 50% DM CONC. Apparently cows are able to select CONC pellets from the TMR. This Is evidenced by
the extremely decreased protein content of CON group orts,
and the relatively unchanged level of fat content.Using NRC values for protein undegradabl1lty, UDP on-
offer was below recommended levels of 60 to 70% of CP dry
matter. Such computations Indicated that CON cows were
offered only 38.9% of available protein as undegradable,

132Table 16. Cow selectivity of diet components.
Nutrlent FMS
Treatment
CON
percentCP content:
Orts 16.89 11.58
On offer 15.93 13.69
Dlf ference 0.96 -2. 11
Fat content:
Orts 3.32 2.52
On offer 2.86 2.45
Dlf ference 0.46 0.07

133
whereas FMS cows were presented with 46.5% UDP of the CP dry matter. These low levels may be responsible for non-optimum production performance In the study. Table 17Illustrates predicted status of protein degradabl1lty of TMR on-offer. These percentages Indicate sufficient
levels of UDP were available In the FMS group. However
all other fractions were below NRC recommendations C171).
A portion of FMS UDP may have been deamlnated and thus
used as a N source by rumen bacteria. This would In
reality, lowering Its value as a UDP.
Tables 4, 14, and 15 also Indicate that both groups
consumed excess ADF, yet FMS consumed NEi C24.61 Mcal/dD
similar to NRC recommendations of 24.80 Mcal/d. CON cows
consumed 23.74 Mcal/d which represents a deficit of 4.3%.
Thus, CON cows consumed apparent shortages In CP C22%5 and
In energy C4.3%5, while FMS cows consumed NRC
recommendations C1715. Energy to protein ratio was
evidently far Inferior to that of the FMS group, In
addition to being below requirements. This may have caused excess energy to become less efficiently utilized
In the CON group for milk production. Researchers have shown Increases In body weight at the expense of lowered
milk production when dietary protein Is relatively below
available energy levels. On the other hand, body weight
losses may Increase when protein supplements are fed as
energy deficiency can be enhanced C178, 185, 2355-
Table 14, expresses a higher mean dietary fat Intake

134Table 17. Estimated RDP and UDP content of dietary CP and animal requirements.
TreatmentsNRC
Protein Requirement CON FMSFract ion g/d ([calculated g/d}
RDP
UDP
1462
907
1100700
1232
1071

135
for FMS cows. Since FM contained 9.4% fat, most of this
elevation came from dietary FM. FMS cows consumed 72 g/d
additional fat over the CON cows. Though consumed levels
were below that taken to be limiting to production, some
significant nutrient partitioning may have resulted from this higher level. Low level fish fat supplementation has
been shown to maintain MY while increasing MFP and/or MFY
C101, 1965. However.lt also has been shown to Interfere with microbial cellutytlc activity and decrease MY and MFY
C173, 1835-.The additional fat consumed by FMS cows probably was
not at a level to cause milk fat depression C183, 1715,
nor Interfere with rumen microbial cellulytlc activity
C101, 2365. The small amount of additional FM fat may
have elevated MY and MPY in FMS cows from potentially
lower levels caused by other factors. Fish fat found in the level used in this experiment would not have much
potential for increasing MFY, as the short chain fatty acids of milk fat do not arise from degradation of long
chain fatty acids C90, 218, 2515 such as those found in FM.
Due to the high kevel of CONC C50% DM5, diets in this
study were already conducive to low milk fat tests, and
rumen pH was probably very low. Niles et al. C1745
reported significantly lower rumen pH in heat stress cows.
Those authors also report that less HC03~ from saliva was
a factor in providing less rumen alkali to buffer acidic

conditions. In this current study, neither blood nor rumen pH was measured, but It Is likely that acid conditions existed since RR was excessively above 22 cycles per minute. Coppock et al. C57) showed that RR
Increase when low blood pH results from bicarbonate
elimination via the kidneys. Such physiological adjustments likely occured In both groups, as RR were
approximately 100 cycles per minute. The CON cows,
however may have had a higher blood H^ concentration
because of the higher plasma aldosterone levels and a
higher RR than FMS cows.

137
Plasma Aldosterone Levels
Weekly mean plasma aldosterone concentrations did not
statistically correlate with any nutrient variables In
either diet, any climate Indexes In CON, nor with RR and
RT In either diet. Unlike cortisol, aldosterone also did
not correlate with RR In the FMS treatment CTable 18}.
Lack of similarity with cortisol responses Indicates
different metabolic stimuli for each hormone. Researchers
have found that aldosterone secretion can be Influenced by
ACTH, which controls cortisol release from the adrenal fasclculata, other agents also Influence plasma
aldosterone levels C8, 67, 68}.
Since each hormone Is mainly responsible for very
different roles In monitoring homeothermy, e.g. cortisol In carbohydrate metabolism, and aldosterone In
electrolyte-water balance, such a finding Is not
startling. No previous research has been reported that
refers to a linkage between the two metabolic systems. It Is also possible that each mechanism experiences different degrees of response to the general adaptation syndrome. Thus, specific periods after acute or chronic stressors
may provide different trends In each hormone at any one
t lme.
The lack of a relationship of aldosterone with
climatic variables does not Indicate conclusively that
such Is the case over a wider range of climate variable

138
Table 18. Correlation coefflcenta of cortisol and aldosterone with RR and RT.
Aldosterone Cort1 solTreatments Responses
FMS RR 0.05 0.24 -RT 0 . 12 0.11
CON RR -0. 10 0.05RT -0.03 0.08
* P < 0.02

139
units> Throughout the experimental period, THI values
were Inclusively above 72 CTable 7), which Is the level that suggests a declined Intake and production commences.
In addition, mean dally ETI values were 32.93 units
CAppendlx Table 4), which has been described as a extreme
caution zone C15). Correlation coefficients calculated
over wider spectrums, I.e. thermoneutral environments, may
provide different results. Also, due to potential excess
ECF potassium, blood samples taken at hotter periods of
the day may provide evidence of a significant linkage to
climatic environment C8).
Since experimental period followed a naturally
developing chronic heat stress, and experimental animals
thus followed a physiological post-alarm stage adjustment.
It was anticipated that cows were behaving In a slight
hypo-aldosteronlsm condition.Plasma aldosterone concentrations CTable 19) were
negatively affected by addition of FM to the basal diet
CP<.01). Appendix Table 20 lists the analysis of variance for aldosterone levels observed In this study. The highly significant decrease In plasma aldosterone concentrations of FMS cows during chronic heat stress indicates a more
rapid recovery from thermal environment than that observed
of CON cows. There are apparent differences In rate of
acclimation of carbohydrate and mineral metabolisms. FM
supplementation may contain substances that aid In
fulfilling a metabolic void created by chronic heat

140Table 19. Effect of treatment diet on plasma cortisol and aldosterone levels.
Treatments
Plasma steroid N FMS CON SE
Aldosterone Cpg/ml} 96 217.5 252.5** 6 . 10
Cortisol Cng/ml) 96 8.65 8.61 0.34
** P < .01
141
stress. Such substances, however, have not been specifically Identified as of this date.
Plasma sampling time In this study occurred at a
period when aldosterone levels were anticipated to be at
lowest concentrations. Aranas et al. C8, 9) found a highly significant positive correlation of 0.68 between
lactatlng dairy cow aldosterone and THI throughout a 24 h
period, during mild heat stress. Climatic Indexes In the
current study were at lowest values during 0300-0500 h,
when blood samples were taken. Due to the lack of significant correlations with climate variables over an 8-
week period found In this study, apparently aldosterone
level Is related to changes In Immediate alterations
Chours) In heat stress-causing environments, but not In
changes over gradual periods Cdays or weeks).
El-Nouty et al. (68) failed to find differences In
aldosterone levels In dairy cows exposed to 8 h of 35 C
temperatures, compared with thermoneutra1ly-housed control cows, yet located significant differences after extended periods C90 h) However, that study utilized evaluations In the acute stage of heat stress as opposed to the current study and the work of Aranas C9). Beede et al.
C20) detected diphasic dally Increases In aldosterone
following each morning and evening milking activity, and
that those levels were In lower octaves during greater
heat stress periods. Blood sampling time In this current
study should not have been a variable Influencing plasma

142
aldosterone.
Previous discussion has Indicated that FMS cows may have experienced lowered blood pH than CON cows due to significantly lowered RR, and thus less blood HC03~
concentration. Though both treatment groups panted
heavily, Capprox. 100 cycles per minute) FMS cows may not have developed the degree of respiratory alkalosis that
CON cows may have experienced C136, 220, 258). Such high
blood bicarbonate levels promote urinary excretion of
HC03~ along with elevated urinary losses of Na* C86, 136). Schneider et al. C220) feeding 60% DM CONC diets to
lactatlng dairy cattle observed higher blood K-*, lower
urine Na"“, higher blood protein, lower urine pH, and higher urine NH "*", along with higher RT and RR In more
heat stressed treatments. The observation of higher
levels of respiratory alkalosis and renal compensation during cooler hours of the day C220) opposes the
physiological status claimed by Aranas C8).Aranas C8) showed positive associations of serum Na*
and K* with aldosterone during hotter hours of the same day. Since respiratory alkalosis occurs concurrent with
lowered plasma Na-*- and K"*" concentration C40, 38, 42. 31,
32), aldosterone levels normally decrease In response to the decreased serum K* level C68, 136, 150, 220, 258).
Such declined aldosterone levels would be expected to
occur after periods of excessive sweating or other means
of K"" deletion. Though serum Na^ and K"* concentrations

143
were not quantitated In this study, based on data of others, It Is speculated that aldosterone levels of plasma samples taken in this current study C0300-0500 h) would be lower than if samples were taken during warmer periods of the day. Concurrent with this speculation, serum K-*"
levels would be lower, along with higher urinary pH.
However, work by Beede et al. C20) revealed lower ECF K*
concentrations and aldosterone levels immediately pre-
milking, with gradual Increases during periods immediately
following both morning and evening milking activities.
Thus sampling times observed in this current study may
have been during a period of low, yet gradually rising
blood K"*" and aldosterone concentrations.

Plasma Cortisol Levels
144
Weekly mean plasma cortisol did not significantly
correlate with any nutrient variable In either diet.
Furthermore, levels did not correlate well with climate
Indexes CTable 20). However, significant negative
association was found with Tmax In FMS cows (P<.05), but
not In CON cows CP<-13). The negativity of coefficients
Is very Interesting. Apparently FMS cows were In the
adaptation stage of the stress cycle, since lower cortisol
levels became depressed during chronic heat exposure C6»
7, 21, 119) CFlgure 63- On the other hand, CON cortisol
may have had no associations with higher dally maximum
temperatures. This data Indicates diet may Influence
physiological heat stress adaptability In lactatlng dairy cattle. In addition, correlation coefficients of cortisol
related to RE and RT, In FMS cows, were 0.24 and 0.11,
respectively, with only the RR association In FMS cows
being statistically significant CP<-02). Cortisol of CON
cows was essentially not related to RR nor RT CTable 18). Since RR and RT previously did not significantly correlate
with climate variables In the FMS cows, yet did so In the
CON cows. These observations were not anticipated.
Apparently physical heat stress Indicators CRR and RT) are not related to cortisol levels In the CON treatment,
though RR and RT do appear related.
The significantly positive correlation between FMS

145
Table 20. Correlation coefficients of plasma cortisol with climate variables.
Climate Variables N
Treatments
FMS CON
Tmax 96 -0.21 * 0. 15THI 96 -0.09 0.11
ETI 96 -0.03 0 . 10
P < 0.05

146
cortisol and RR, and the significantly negative
association between FMS cortisol and maximum temperature are difficult to explain. Apparently early morning C0300
h} cortisol levels In FMS cows reflect a negative response
to previous periods of maximum temperatures, but not to
elevated RR and RT. In addition, the significant
relationship of higher cortisol levels with higher RR
Indicates that FMS cows may be responding to physiological
alterations In the blood caused by Increased RR and not RR directly. Since no similar relationships were observed In
the CON cows, FM encouraged higher RR and higher plasma
cortisol levels, without alteration In RT.
The significant correlation between cortisol and RR In
the FMS cows CP<-02}, and lack of correlation with RR In
CON cows CP<0.66) suggests that some agent other than
cortisol may be regulating carbohydrate metabolism In the CON cows. Such a relationship may not overlde the effect
of cortisol In the FMS group. It may be that glucagon,
because of a potentially lower Insulin level In the CON
cows, might be this agent. Such a scenario would explain
the relationship to environmental heat stress.Plasma cortisol levels were not Influenced by dietary
treatment. Cortisol means observed by treatment are
listed In Table 19, with analysis of variance for cortisol
found In Appendix Table 20. Lack of significant
differences among diets may Lndlcate similarities during
temporary fasting and post-mllklng periods, but not at

147
other periods, I.e. feeding and Immediate post-feeding,
when FM consumption may promote declined blood
metabolites. Data suggests that FM metabolites causing elevated RR may be short-lived Chours) In the circulatory
blood. Blood samples taken at other periods of the day
may therefore express differences in cortisol levels between diets. Since no week efects were noted, It Is
assumed that cows achieved a constant plateau of plasma
cortisol concentrations and sustained acclimated levels throughout the trial.
The possibility of elevated cortisol levels In FMS
cows during hot hours may reflect lower actual amino acids
available to the animal than Indicated by NRC requirements
C171). The CON cows may also have been In a negative N-
balance, as energy Intake was 4.3% less than requirement
CTables 4, 14, 155- Reynolds et al. C206} Indicate that
66% of net hepatic glucose production is supplied
predominately by propionate, pyruvate and glycerol, and
only 17.4% and 16.5% by lactate and amino acid, respectively. Though elevated gluconeogenic activity could produce more glucose from amino acid degradation,
the effect would be more devastating upon destruction of
the protein that was near or below cow requirement.
However, lower respiration rates observed In FMS cows and Its Indication of higher blood pH over CON cows, would
Indicate that less glycolytic activity reduction occurred
In FMS cows. Thus, more pyruvate would be available and

148
higher rates of gluconeogenes1s would occur, In addition to more pyruvate entering the tricarboxylic acid cycle.As a result, if cortisol levels did elevate during the
hotter hours of the day, higher energy levels could have
been available to the mammary gland, compared to the CON
cows. This would also be followed by less protein
degradation In FMS cows than In CON cows. Since
propionate Is the major substrate for glucose synthesis In
hepatic gluconeogenesls, any reduction In Its microbial
production would lead to lower blood glucose levels.
Jacquemet and Prlggs C113J suggest that certain anti
inflammatory agents can cause glucose Increases without
responses from Insulin nor glucagon. Since cortisol Is
classified as such a compound, It could promote
gluconeogenesls without the corresponding Increases of the
other two antl-gluconeogenlc protein hormones. Responses
observed by those Investigators were made only 4 h after
propionate Infusion, reflecting a rapid response to an ant1-lnflammatory compound C113J. Forsham C8CQ suggested that higher cortisol levels for extended periods can cause
the Insulin producing cells of the pancreas to become
atrophic. The possibly elevated cortisol levels during
hot periods of the day could explain a more direct role
for immediacy of cortisol response during heat stress In
the lactatlng bovine.
Of the major VFA, Aiello and Armentano C4J found that
butyrate was the only one which Inhibited glucose

149
production from propionate* Rumen environments that
promote higher butyrate formation could therefore lower
glucose production. Whether FM additions to the rumen
substrate pool alter this specific VFA concentration is unknown. Such information could help explain drastic
alterations in energy partitioning when FM diets are fed.
Ingraham et al. C111D reported a significant negative correlation of plasma glucose with THI during periods of
peak production, but not at others. Those researchers
also determined plasma glucose was negatively correlated with MY thoughout lactation. Those observations do not
fit well with Scott et al. C223D illustration of milk
lactose being formed from plasma glucose. MY normally
follows lactose synthesis with no change in MLP.
Apparently plasma glucose is inhibited from transformation
Into lactose at the mammary gland. This suggests that the
results of Reynolds et al. C2Q6D which agreed with
Ingraham et al. CHID, that glucose levels are lower at
negative energy balance, may prove that glucose production
at the liver was not changed, but that glucose uptake by tissue, i.e. mammary tissue is occurring. Thu3, heat
stress and its associated lowered cortisol response may
reduce MY.In addition to stimulated glyconeogenes1s by glucagon,
the hormone also influences a cessation of liver synthesis
of fatty acids from acetate. Liver utilizes fatty acids
from itself and lipid depots as oxidative substrates.
150
Such llpolysls 1s also enhanced by plasma cortisol C251}. Glucagon has also Increased glomerular filtration rate in the kidney, with augmented excretion of Na^, K*, Cl~, and
NHz."*", which could lead to dehydration and a negative nitrogen balance during extreme heat stress.
Segura et al. C224} found lower BUN levels when blood
glucose was higher during administration of an acute
stressor agent to stimulate cortisol secretion. Lower BUN
levels Indicate an Increase of rumen recapture or urinary
excretion of ammonia as NH*,'*". Hassan C1033 however found
significantly positive correlations of NPN with RT and thus, heat stress. That study was conducted under a
chronic heat stress environment as apposed to an acute system of Segura et al. C224}. Accordingly, results
obtained by Hassan C1Q3} would be expected, I.e., no
Increase In plasma glucose and an Increase In BUN or NPN.
With the mechanisms described by White et al. C251) and
Fernandez et al. C77} cortisol and glucagon are providing
a "starvation In the midst of plenty" situation. Though cows In the current study probably were not
hyperammonemlc, glucagon would not have lost portions of Its regulation on liver propionate. However If available
energy was below that capable of being utilized by rumen
microflora, a mild hyperammonemia environment could exist and cause glucagon to Influence propionate metabolism to a
lesser extent.
Oldham et al. C179) and Zerblnl et al. C261) found

151
higher glucose and lower BUN levels In lactatlng diets
supplemented with FM. Since Zerblnl et al. C2615 found
less fecal N, less microbial N produced, and no Increases
In MPP, a larger protlon of total N may have been excreted
via the kidney. As In this current study, RDP of diets
used by Zerblnl et al. C261), were well below adequacy for
optimum microbial growth C261}. Those researchers also found a lack of body weight gain differences, yet a trend
for Increase In the FMS treatment cows over a highly degradable protein control group. Together with the
results of Oldham et al. C176}, those data suggests that
FMS diets encourage Increased body depot mobilization and
additional body weight loss during negative energy balance
periods. In addition, during periods of advanced
lactation, such as the current study, FM allowed more
rapid compensatory gain after peak lactation C193D.
With the high concentrate rations provided In this
study, the lower protein content of the CON group may have
encouraged energy flow towards body fat deposition, especially If Insulin levels were higher and cortisol levels lower than the FMS group. Less available amino acids In the CON group could have created surplus energy
relative to the amino acids present. This extra energy would then be deposited Into tissue. However, If glucagon was regulating the glucose system, as would occur with low
Insulin or high cortisol levels, this energy could not
undergo appreciable glycogenes1s, and probably be excreted
152
via the kidney as urinary sugar. This naturally would lead to very inefficient utilization of dietary energy.On the other hand, If CON cows were previously more heat
stressed, the extra energy could be utilized as part of
the malntaince requirement used to elevate levels of
panting, as was observed in higher RR.
Sartln et al. C215) found lower cortisol levels In
higher producing dairy cows at 30 d compared to 90 d post
partum, but did not find such differences In lower
producing cows. Lactatlng cows In this current study were
much beyond 90 d post-partum C132 d}, and since the
majority of the cows were not of the Holstein breed, cows
could be considered as lower producers. Since FMS cows
appear to have experienced less heat stress Cfrom RR and
RT data}, and produced no Increases In MY during mid- to late lactation over CON cows, the lack of lower cortisol
concentration during cooler period sampled may not have
allowed greater gluconeogenesls from amino acids and proteins In FM consumption, while encouraging fat depot mobilization. Body weights In this study were not taken,
but would have provided some Insight to this possibility.

Milking Performance
Significant increases in MY were not obtained by the
inclusion of FM in the diet CTable 22). Probability for
actual differences to exist were less than 0.19. Data in
Figure 11 demonstrates a definite trend for a constantly
improved MY response. Oldham et al. C179), feeding FM to
lactatlng dairy cows, found* smaller differences in
positive responses to MY, as lactation advanced. Since
cows in this study averaged 18.62 kg of dally milk, similar differences observed by others adding UDP sources
to early lactation cows were not anticipated. However, in
a previous report by this author C240), significant differences in MY were found when data of early lactation
palred-cows were added during the trial to the groups.Such cows were not Included in sampling nor analysis
because of Incomplete physiological and milking
performance data. Presence of such animals in the experimental herds was due only because of physical
limitations at the research facility. Dairy cows past peak-lactation consistently maintained yields of milk,
protein, lactose, and fat or at a slightly reduced level
C209). The only milk component that did not remain
constant between treatments was MFP and FAT:LAC ratio
CAppendlx Tables 22, 23, 24, and 25). Data in Figures 9
and 11 indicate that the FMS cows produced consistently
more milk throughout the trial than CON cows.
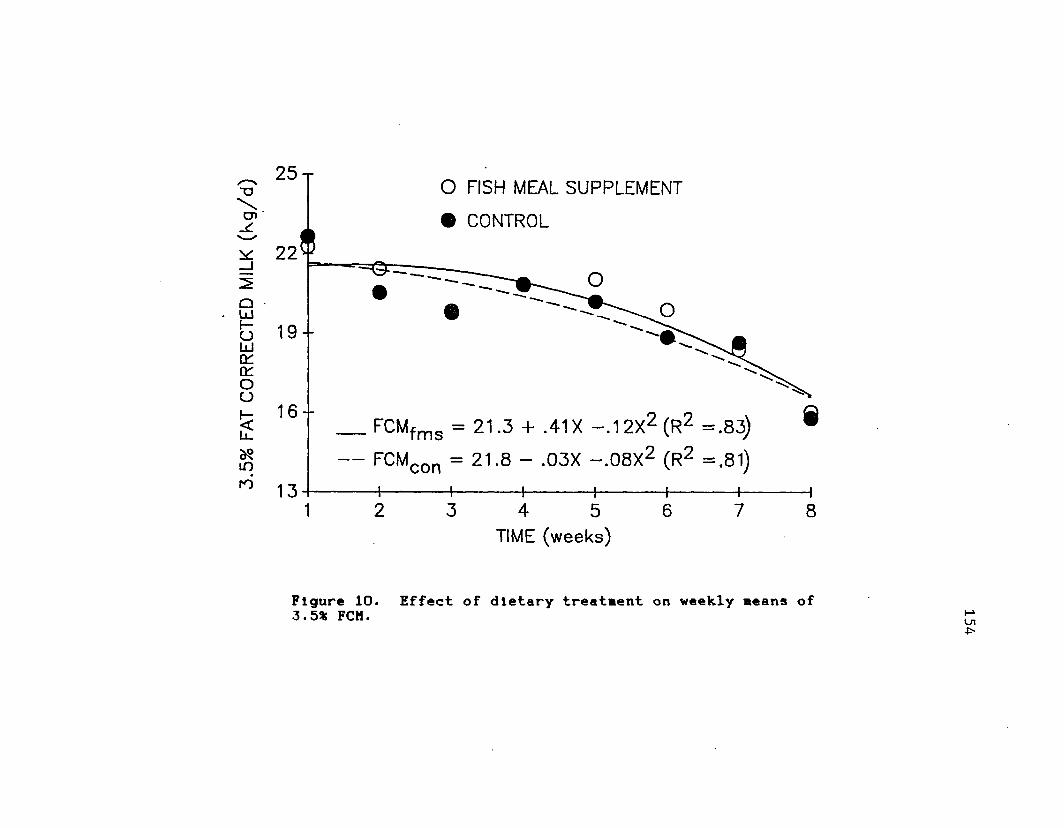
3.5%
FAT
CORR
ECTE
D MI
LK
(Kg
/d) 25 T
13
O FISH MEAL SUPPLEMENT
• CONTROL
FCMfm s = 21.3 + .41X —.12X2 (R2 =
FCMcon = 21.8 - .03X —.08X2 (R2 =.81)
4 5TIME (weeks)
7 8
Figure 10. Effect of dietary treatment on weekly scans of 3.5% FCM. 154

25
a
cou3■DOC.a.TJctowxm4->c
21
17
13
5*— 1
WBM 3.5X FCM-FM5 I I Mean DMI
Figure 11. Effect of 3.5% FCM.
Weeks3.5X FCM-CON
dietary treataent on weekly DMI

156
Experimental means of MY were 19.38 and 17.85 kg/d and of 3.5% FCM were 19.97 and 19.54 kg/d for FMS and CON cows,, respectively CTable 22}.
Differences are far less for FCM, due to the highly
significant declined MFP In FMS cows CFlgure 10}. Milking
performance data of this study generally agrees with
trends reported by Ekern C66}, feeding FM over SBM during
apparently non-heat stressful conditions. However,
decreases In MFP are more drastic In the current study,
and are similar to those reported by 4 studies listed In
Table 2. Slight changes or lack of other milk component
contents and yields are also in general agreement with
previous trials feeding FM as a supplement or as an
1sonltrogenous replacement for portions of the dietary
protein content CTable 22}.Some researchers C45, 51, 58, 105} have shown that no
Increase MY Is observed when protected protein source was
added to the diet to Increase rumen by-passabl1lty
fraction of the total dietary CP. Clark et al. C51}
states that although more protein escapes rumen degradation, decreased microbial activity and thus amounts of organic matter fermented would result In reduced
microbial synthesis and microbial protein production. The
total amount of amino acids reaching the intestines would
therefore be less, especially If degradable protein
fractions are Insufficient. In agreement, Voss et al.
C245} found that a decreased microbial growth resulted

157
Table 21. Correlation coefficients of milking performance and composition with climate Indexes.
Parameter "
Cllmate Index
THI ETI
FMS CON FMS CON
MY -0.33* * -0.34** -0.32** -0.34**
3.5% FCM -0.23* * -0.40* * -0.23** -0.40* *
MFP 0 . 14 0. 13 0.11 0 . 10MPP 0.28* * 0.43* * 0.27** 0.35* *MLP 0.20 0.38** 0 . 16 0.30* *
MFY -0. 17 -0.27** -0. 16 -0.28**MPY -0.27* * -0.22* -0.21* -0.23*MLY -0.34* * -0.24* -0.28** -0.21*
PRO:LAC 0 .22* 0.31** 0 .22* 0.28**FAT:LAC 0 . 12 0.07 0 . 10 0.07PRO:FAT 0.03 0.09 0.04 0.08
* P < .05 ** P < .01
a N = 96 observations.
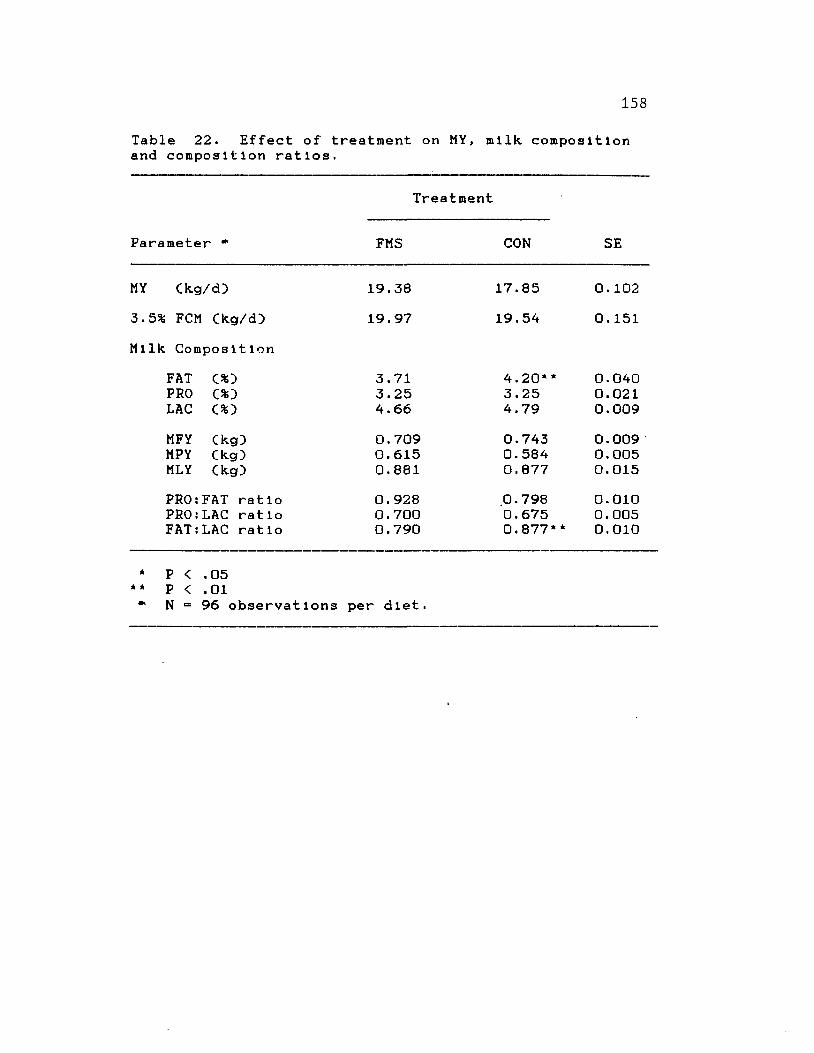
158
Table 22. Effect of treatment on MY, milk, composition and composition ratios.
Parameter *
Treatment
FMS CON SE
MY Ckg/d) 19.38 17.85 0 . 102
3.5% FCM Ckg/d) 19.97 19.54 0. 151
Milk Composition
FAT C%) 3.71 4.20** 0.040PRO C%) 3.25 3.25 0.021lac c % ) A. 66 4.79 0.009
MFY Ckg) 0.709 0.743 0.009MPY Ckg) 0.615 0.584 0.005MLY Ckg) 0.881 0.877 0.015
PRO:FAT ratio 0.928 0.798 0.010PRO:LAC ratio 0.700 0.675 0.005FAT:LAC ratio 0.790 0.877* * 0.010
* P < .05 ** P < .01 " N = 96 observations per diet.
159
from insufficient RDP. However, Brlcenco et al. C31D have
shown Increases In MY greater In response to higher levels
of UDP rather than total protein content of the diet.The results of this current study conflict with those
of Hassan C103D who conducted a feeding trial using high
C20.8%D and low CP C14.3%D levels of a soluble protein
supplement CSBMD on lactatlng dairy cattle during heat-
stressful periods. That work Indicated a 15.3% increase
In dally milk yield, with no differences In milk fat content nor yield, and lower milk protein content and
yield. The lack of negative effects of highly rumen
degradable proteln-SBM supplementation on heat-stressed
dairy cattle possesses several considerations: ID higher
levels of CP may nullify to some extent the decline In MF
production. 2D UDP supplementation may Inhibit milk
production compared to RDP supplementation during heat
stress or depressed nutrient intake, and 3D FM may
contain substances that greatly Interfere with milk
synthesis or milk secreting cell absorption of nutrients.
Higher correlation coefficients between dally MY and composition with THI and ETI than with Tmax were observed.
Table 2 describes the correlations of THI and ETI with
milking performances. Though both Indexes were
significantly negative, coefficients were larger for CON
cows than for FMS cows In both MY and 3.5% FCM. All milk
composition coefficients were positive, with MPP and MLP
being significantly associated. MFP was associated with

160
climatic Indexes. FMS diets expressed a lower association to heat stress than CON diet In MPP and MLP. Such data
Indicates percentages of milk, lactose and milk, protein could be Influenced more by heat stress without the
Inclusion of FM. Apparently FM lessens the Impact of heat
stress on these two variables, by providing some metabolite that alters the normal heat stress blocllmate
relatlonshlp.
Milk, composition yields were all negatively correlated with climate Indexes. It Is also clear that the
coefficients for MFY In CON cows were almost double those
In FMS cows. Though such differences were not seen In
MFP, such findings suggest a greater decline In total milk
fat produced by CON cows with elevating envlronmenta1
temperatures. However, there were no treatment differences In MFY. The actual 13.3% higher MFY CP<-56}
along with the higher negative association of MFY with
climate, Indicates that FM consumption promotes fat production decline from some other major causant besides heat stress. FM supplementation apparently overrides bodily mechanisms responding directly to heat stress. Jaquette et al. CH6D found a sparing effect of higher
dietary protein concentrations on milk fat test In low
fiber diets, concurrent with a drop In MY and A:P ratio.
Though both milk protein and milk lactose were
negatively correlated with climate, along with a lack of
treatment differences, a significant PR0:LAC ratio

161
CPRO:LAC) association with climate was observed CTable
21). This indicates either milk protein or milk lactose
changed at different rates as level of heat stress
changed. Since the relationship is positive, either milk
protein rises faster or milk lactose elevates slower than
their ratio counterpart.
A trend for lowered MLP in FMS cows CP<-15) and the
lack of correlation of climatic Indexes with MLP in FMS
cows, indicate that higher rates of milk protein elevation affect the ratio more than the slower rising lactose.
This agrees with the high PRO:LAC coefficients with
climates found in CON cows over FMS cows. Therefore, the higher level of MPP relative to MLP is linked to higher
MFY, as observed in CON cows. This indicates that higher
rates of high UDP consumption of the FM do not lead to
efficient utilization of protein during heat stress
periods. The FMS cows were fed a diet meeting NRC
requirements, while CON were not. Apparently the CON cows
are more efficient in milking performance under below- dietary requirement condition. This is also substantiated
in the highly significant Increases in efficiency of dally MY and all milk components per unit CP consumed by CON
cows CTable 23).
If the slightly higher PRO:FAT ratio CP<-10) is real, it probably did not originate from higher amino acid
levels available from elevated microbial synthesis, nor
pre-formed via the diet, as MPP nor MPY were different

162
Table 23. Effect of treatment on milk composition to diet composition ratios.
Parameter *Treatment
FMS CON SE
Production efficiency
MY/DMI 1.337 1.402** 0.0133.5% FCM/DMI 1.371 1.523** 0.015
Milk performance/ADFMY 7.077 7.226 0.080MFP 0.626 0.791** 0.019MFY 0.259 0.302** 0.004MPP 0.539 0.594* * 0.007MPY 0.226 0.238* 0.003MLP 0.789 0.911** 0.017MLY 0.323 0.353** 0.005
Milk performance/CP
MY 8.487 9.989* * 0.085MFP 0.756 1.094** 0.021MFY 0.312 0.418** 0.005MPP 0.641 0.820** 0.017MPY 0.271 0.328* * 0. 004MLP 0.960 1.258** 0. 017MLY 0.391 0.484** 0. 004
Milk performance/Fat
MY 52.840 60.213** 0.789MFP 4.725 6.626** 0. 159MFY 1.940 2.520** 0.043MPP 3.934 4.856** 0 . 118MPY 1.691 1.983** 0.032MLP 6 . 125 7.781** 0. 157MLY 2.494 2.993** 0.056
* P < .05** P < .01** N = 8 observations per diet.

163
between diets. The significantly lower MFP would have
more Impact on the ratio. In addition, the significantly higher FAT:LAC ratio would result from significantly
higher milk fat levels In CON cows, as milk lactose levels
were not different between treatments. Therefore, data Indicates that milk fat production was altered by FM
supplementation without directly Influencing those
mechanisms Involved with protein and carbohydrate metabolism. The lack of significant FAT:LAC and PRO:FAT
ratios with climate Indexes furtherly Justifies those
responses. Unfortunately reporting of statistical evaluations of milk component ratios upon dietary
treatments have not been observed by this author. Since
such data Is unavailable, no comparison with data from the
current study can be made.
The lack of a treatment difference In efficiency of
milk produced per unit of ADF consumed Indicates that
fiber digestion Is not responsible for changes In MY.This result agrees with Zerblnl et al. C261), where FMS
did not Increase gross efficiency. Levels of dietary ADF significantly Influence rumlnal VFA production and In turn, amounts of substrate VFA available for milk fat
synthesis, and percursors for entrance Into citric acid
cycle CCAC). Lack of difference In MPP and MPY to ADF
consumed, along with significant Increases In ADF Intake
by FMS cows CTable 23), Indicates equal levels of amino
acid substrate available to mammary gland for milk protein

164
synthesis. This may have arisen from equal rumen
microbial protein production or lower milk protein by FMS
with the benefit of preformed amino acid. A population of microbes that produced equal levels of milk protein but
without acetate production as a major by-product VFA could
have occured C166, 195, 238J. Net energy from total VFA
may not have been different, this leading to similar blood
glucose and thus mammary substrate for lactose production.
Since ADF Intakes were higher In the FMS groups, it Is
likely that fiber portion was more Inefficiently utilized.
The higher DMI, and thus apparent Increase In rate of
passage and decrease In digestibility may account for this
lnef f1clency.
Emery C69J and Gordon C93J found a sparing effect of
higher dietary protein concentratIons on milk protein.
Such was not observed In this study. MPP and MPY relative
to ADF consumed was also higher In CON than In FMS cows.
With the above discussion, this may reflect that a similar
absolute amount of fiber was cellulytlcally digested by microbes, yet producing similar ml l'k-ava 1 lable amino
acids.On the other hand, absolute ADF digestibility In FMS
cows could have been below that of CON cows, with preformed protein In FM making up the deficit from protein
not produced mlcroblally. If such occurrences were real,
total VFA production or those VFA capable of
gluconeogenes1s and entrance Into the CAC should have been

165
decreased, with a resulting lower MLP and MLY In the FMS
cows. Since plasma cortisol levels were not different between treatments. It appears that rates of
gluconeogenes1s were not different between FMS and CON cows.
Ganong C84) Indicates that obviously less pyruvate and
more amino acid enters the CAC for production of glucose.
Since cortisol concentrations were not different, yet
protein Intake was Increased In FMS cows, many amino acids
could have entered the CAC at various positions. Those
specific amino acids known to enter the CAC C84) are also
In high levels of the total amino acids found In FM CAppendlx Table ID. Thus, It appears that a larger
portion of gluconeogenic activity In the FMS cows utilized
dietary amino acids as substrate rather than propionate or
other VFA substrate produced from rumen cellulytlc
hydrolysis. It may be that amino acids present from FM
provide substrate for more than 16.5% of total hepatic
glucose production observed by Reynolds et al. C206),
during times of heat stress or by the Inclusion of a certain amino acid profile found In FM. The higher MLP
and MLY relative to ADF consumed of the CON cows compared
to FMS cows Indicates less milk lactose produced per
potentially available substrate for VFA, Cl.e. propionate)
and gluconeogenes1s. Gluconeogenic activity upon other
substrate would explain this difference. Therefore If
rate of gluconeogenes1s was not different between

166
treatments, and similar glucose substrate was available to
the mammary gland, perhaps gluconeogenic activity In FMS
cows utilized the extra dietary amino acids for substrate, Instead of propionate, as the CON cows may have used. If such activity occurred, energy metabolism ranks higher In'
priority over protein metabolism In heat stressed
lactatlng dairy cows. However, If rate of gluconeogenes1s
and thus blood glucose levels, were higher In FMS cows,
some barrier may be restricting entry Into mammary cells.
Higher gluconeogenic destruction of plasma protein from
the protein supplemented diet would explain a lack of
differences In milk protein, and without a difference In
milk lactose between the treatments. In addition, the
higher energy cost for urea synthesis as a means of
eliminating excess ammonia from deamination processes C92}, would explain a lack of higher lactose In FMS cows.
Normally rumlnal ammonia concentrations are found to
be lower when diets are higher In UDP C213}. However, due
to the nature of heat stress upon blood pH balance, the UDP source in this heat stress experiment CFMD may have
been largely treated as a RDP by rumlnal microflora. This
philosophy, however, Is In disagreement with Jaquette et
al. CHAD. Oldham and Smith C178D determined that when
DMI Is Increased from Increasing dietary CP, 20 to 50% of
change In production responses arise from beneficial
effects of Increased energy production. When combined
with the associative effects of Increased DMI, these

167
percentages were 25-65% of the Increase In milking performance C178).
Work by Konlg et al. C132) has shown that forced-
proteln supplementation via Infusion techniques results In Increases In blood acetate and palmltate. However such
Increases In potential Incorporation being transformed
Into milk fat failed. Thus not only Is glucose restricted
from the milk secretion processes, apparently fatty acids are as well.
Rumlnal degradation of proteins permits amino acid
conversion Into acetate C212), which could Increase MFP
and/or MFY. Results from this study do not confirm this possibility. However Increased blood acetate could be
present without glandular uptake and utilization In
production of milk fat. The lower VFA production observed
by Zerblnl et al. C261) In SBM and FM supplemented diets
was largely from acetate decline C70). Such results also
Indicated higher rumen pH In FMS cows. Argyle and Baldwin
CIO) found as rumen pH declines, acetate decreases, with
Increases In propionate and butyrate Increases. The potentially higher level of propionate from FM
supplementation could be negated by the Increase In
butyrate production. Butyrate has been shown to decrease
gluconeogenic activity on propionate In vitro C4) when
complete mixtures of amino acids were added. That study Indicated that Improved quantity and quality of plasma
proteins could Increase glucose production available to
the mammary gland. Ralston and Patton C204) describe that
low rumen pH, resulting from high dietary levels of
soluble carbohydrate favors decarboxylation of amino acids. Therefore, If Indicators are accurate In this
current study, CON cows experienced less usage of preformed amino acids than FMS cows, because of lowered
rumen pH. Higher levels of propionate do not Indicate
higher blood glucose levels. Bernard et al. C22) using
diets high In wheat middlings, supplemented with corn
gluten as an UDP source, found lowered rumen pH, higher
rumlnal ammonia and higher propionate levels compared to
SBM supplemented diets. Those diets may have been similar
to that In this current trial, as both shared an
Inadequate N level for microbial propagation. Wheat
middling based CONC diets as used In this current trial,
also reduce the escapablllty of UDP In silage diets C22).
Rumlnal ammonia levels resulted from Increases In amino
acid degradation and Increases In non-acetate and non-
proplonate VFA. Such activity from a higher UDP diet could be Increasing butyrate, thus destroying an already
low level of propionate, yielding less glucose produced from gluconeogenes1s . Wheat middlings and similar feed
components' addition to lactatlng cows may not be an
appropriate approach In times of heat stress. In addition
the lower RR of FMS cows may Indicate less blood HCO.?.-,
.less urine H+, more urinary K"*, lower blood K"", and a
lowered plasma aldosterone concentration C68, 221).
169
Higher rumen acidity equilibrates with blood acidity
rapidly C219, 221). If CON cows experienced higher rumen H"*- concentration from higher VFA production, blood H"4 concentratIon would be higher relative to HC03“ , thus
being directed towards kidney excretion, with conservation
of H C O 3 " " . The excess H-4' could then compete with Na* and
K* for excretion, lowering the rate K"4 would be excreted
C106). As an acldogenlc factor, higher VFA production may
thus elevate plasma K"4’ with a concurrent Increase In
plasma aldosterone, and a higher RE. In this study CON
cows Indicated significantly higher aldosterone levels
than FMS cows. Many have Indicated positive relationships
of aldosterone with blood K-4- C28, 68, 150, 241) and
negative correlations of urinary K-4" and H"".
Since concentrate was fed at equal levels It Is unlikely that different levels of lactic acid were
produced from readily fermentable dietary carbohydrate
occurred among treatments. Thus differences In rumlnal
acidity could be explained by differences In VFA product Ion.
It Is also unlikely that the lower aldosterone levels
In FMS cows resulted from lower ECF K-4-, which may have In
turn been due to Increased sweating during the previous
day’s hot afternoon. If such was the case, higher
sweating rates would stimulate higher water intakes.
Higher water Intake has been shown to decrease DMI C16)>
Since FMS cows experienced significantly higher DMI, lower

170
aldosterone levels observed In FMS cows due to this course
are unlikely. In addition, less dietary water would be
needed to replace that moisture lost through the lower RR
observed in FMS cows. Hafez C99} states that high protein diets Increase water consumption, which may Increase ECF.
Among the free amino acids, glycine, alanine, and prollne are commonly employed in fluid osmotic regulation C229}.
These amino acids as listed in Table 1, are high In
concentration in FM protein. Since glucose makes a small contribution to total osmolal concentration of plasma C85), elevations in glucose may not be responsible for
higher water Influx into ECF. In addition, plasma
proteins have high molecular weights, and a high mass
level in plasma would indicate small total numbers of
molecules and a small impact on blood osmolality. If Increases in ECF occur from FM supplementation, it is
likely to have occurred from rumlnal H"* production and not
on circulating levels of glucose nor protein. Since less sodium would be needed for reabsorption, and less serum potassium from less leakage of cellular potassium would be needed to maintain osmotic fluid pressure, higher plasma
protein concentrations would preserve osmolytic balance
with a concurrent decrease in need of plasma aldosterone.
The results of this study Indicate that plasma
aldosterone determinations may serve as an Important
diagnostic tool for levels of acldogenlc substances in
ruminant nutrition trials evaluating UDP sources. No such

data has previously been reported describing such potential for study. This Is the first reported scientific evidence that an UDP source Influences different degrees of relationship among milk content
performances and thermal environment, and In describing
significant alterations In milk component ratios affected by an undegradable protein source. The study Is also
first In providing evidence that Implicates aldosterone
with undegradable protein. Such findings may provide the
physiological explanation for depressed milk fat content
observed In scientific reports Investigating undegradable
protein Inclusion on lactatlng dairy cattle.

CONCLUSIONS
The Justified conclusions drawn from the results of this experiment are:
1. Increasing the UDP level In a low roughage, low
energy, low protein and undegradable protein deficient
ration of mid- to late lactation dairy cows during
heat stress did not have a beneficial effect on milk
performances.
2. Inclusion of A.75% FM DM Into a 50:50 DM CS:C0NC
base diet stimulated feed DMI In lactatlng dairy cows
during heat stress.
3. Non-productive physiological adaptability of heat
stressed lactatlng dairy cows was Improved by dietary
Inclusion of FM.
4. Changes In plasma cortisol Is of limited value In accessing total carbohydrate metabolism In heat stressed lactatlng dairy cattle.
5. Plasma aldosterone determinations provide an Index
for assessing levels of heat stress adaptability on
varying Intakes of nutrients.
172

173
6 . Plasma aldosterone and cortisol do not follow the
same rate of response to chronic heat stress In
lactatlng dairy cows.
7. THI and ETI are greater correlated with feed DMI
and milk, performance response than Tmax and mean dally
temperature.
8 . Commercial antiserum source and RIA procedure
modifications permit highly accurate, sensitive, and
precise determinations of plasma aldosterone and
cort1 sol.

SELECTED BIBLIOGRAPHY
1. Abraham, G.E. and R. Garza. 1977. Radioimmunoassay of steroids. Pages 591-655 l_n_ Handbook, ofRadiolmmunoassy. G.E. Abraham, ed. Marcel Dekker,Inc., New York.
2. Abraham, G.E. 1980. Reliability criteria for steroid radioimmunoassay. Pages 6-17 ln_ Radioimmunoassay of steroid hormones. 2nd ed. D. Gupta, ed. Vertag Chemle, Wlenhelm, Germany.
3. Adeyemo, 0., E. Heath, B.K. Adadevoh, and J.Stelnbach. 1981. Plasma cortisol In Bos taurus and Bos lndlcus heifers In seasonal tropical climate. J. Dairy Scl. 64:1586.
4. Aiello, R.J. and L.E. Armentano. 1987. Effects of volatile fatty acids on propionate metabolism and gluconeogenes1s In caprine hepatocytes. J. Dairy Scl. 70:2504.
5. Allison, M.J. 1976. Population control In the rumen and microbial adaptation to dietary change. Pages 10- 18 ln_ Buffers In Ruminant physiology and metabolism. M.S. Weinberg and A.L. Sheffner, ed. Church and Dwight Company, Inc., New York.
6 . Alvarez, M.B. and H.D. Johnson. 1973. Environmental heat exposure on cattle plasma catecholamine and glucocorticoids. J. Dairy Scl. 56:189.
7. Ames, D.R. and D.E. Ray. 1983. Environmental manipulation to improve animal productivity. J.Anlm. Scl. 57 CSuppl. 2}:209.
8 . Aranas, T.J. 1983. The mechanism of aldosterone secretion In dairy cattle and the clrcadlum rhythm of aldosterone, cortisol and progesterone In dairy cattle during summer In Loulsana. Ph.D. Dissertation, Louisiana State University, Baton Rouge, LA.
9. Aranas, T.J., J.D. Roussel, and S.H. Sebyt. 1987. Clrcadlum rhythm of aldosterone in dairy cattle during summer. Int. J. Blometeor. 31C3}:237.
10. Argyle, J.L. and R.L. Baldwin. 1988. Modeling ofrumen water kinetics and effects of rumen pH changes. J. Dairy Scl. 7:1178.
174

175
11. Association of Official Analytical Chemists. 1980. Official methods of analysis. 13th ed. Assoc. Offlc. Anal. Chem., Washington, DC.
12. Atkins, K.B., R.A. Erdman, and J.H. Vandersall. 1988. Dietary choline effects on milk yield and duodenal choline flow In dairy cattle. J. Dairy Scl. 71:109.
13. Atterby, J.T. and H.D. Johnson. 1968. Effect of environmental temperature, controlled feeding, and fasting on rumen motility. J. Anlm. Scl. 29:734.
14. Ayres, P.J., A.P. Gould, S.A. Slmpon, and J.F. Talt. 1956. The In vitro demonstration of different corticosteroid production within the ox adrenal gland. Blochem. J. 63:19 P CabstractJ.
15. Baeta, F.C., N.F. Meador, M.D. Shanklln, and H.D. Johnson. 1987. Equivalent temperature Index at temperatures above the thermoneutral for lactatlng dairy cows. Paper no. 87-4015, AMSAE.
16. Baile, C.A. and M.A. Della-Fera. 1981. Nature of hunger and satiety control systems In ruminants. J. Dairy Scl. 64:1140.
17. Balle, C.A. and M.J. Forbes. 1974. Control of feed Intake and regulation energy balance In ruminants. Physiol. Rev. 54:160.
18. Bardwell, R.D. 1978. Factors affecting serum aldosterone levels In Holstelns. Masters Thesis, Louisiana State University, Baton Rouge, LA.
19. Beede, D.K. and R.J. Collier. 1986. Potentialnutritional strategies for Intensively managed cattleduring thermal stress. J. Anlm. Scl. 62:543.
20. Beede, D.K., R.J. Collier, P.G. Mallonee, C.J. Wilcox,and D.E. Buffington. 1982. Heat stress and dietary potassium effects on circadian profiles of blood prolactin and aldosterone In lactatlng cows. Pages 556-564 In Livestock environment II. Proceedings of the second International livestock environment symposium ASAE.
21. Bergman, R.K. and H.D. Johnson. 1963. Temperature effects of plasma cortisol In cattle. J. Anlm. Scl. 22:854.
22. Bernard, J.K., H.E. Amos, M.A. Froetschel, and J.J. Evans. 1988. Influence of supplemental energy and protein on protein synthesis and crude protein reaching the abomasum. J. Dairy Scl. 71:2658.

176
23. Blanca. W. 1961. Heat tolerance In cattle - Its concept, measurement, and dependence on modifying factors. Int. J. Blometeorol. 5:5.
24. Blanca, W. 1963. Rectal temperature and respiratory rate as Indicators of heat tolerance In cattle. J. Agrlc. Scl. 60:113.
25. Blglleri, E.G. 1963. Aldosterone. Page 23 Jin. Clinical Symposia, Vol. 15., No. 1.
26. Bines, J.A., P.E. Brumby, O.E. Storry, R.J. Fulford, and G.D. Bralthwalte. 1978. The effect of protected lipids on nutrient Intakes, blood and rumen metabolites and milk secretion In dairy cows during early lactation. J. Agrlc. Scl., Camb. 91:135.
27. Bines, J.A. and I.C. Hart. 1982. Metabolic limits to milk production, especially roles of growth hormone and Insulin. J. Dairy Scl. 65:1375.
28. Blal:— West, J.R., A. Brodle, J.P. Coghlan, C.A.Denton, C. Floor, J.R. Godlng, B.A. Scoggins, J.F. Talt, S.A.S. Talt, R.M. Wlntour, and R.D. Wright.1970. Studies on the biosynthesis of aldosterone using sheep adrenal transplant: effect of sodium depletion on the conversion of corticosterone to aldosterone. J. Endocrinology 46:453.
29. Branton, C., J.E. Johnston, and G.D. Miller. 1953. Physiological and heredity responses of lactatlng Holsteln-Frleslan and Jersey cows to natural environmental temperature and humidity. J. Dairy Scl. 36:585.
30. Brelren, K. 1949. Norwegian experiments regarding the effects of the feed on the composition and quality of milk and milk products. Pages 28-60 In Proceedings, XII Int. Dairy Congr., Stockholm.
31. Brlcenco, J.V., H.H. Van Horn, B. Harris, Jr., and C.J. Wilcox. 1988. Comparisons of different methods for expressing dietary protein for lactatlng dairy cows. J. Dairy Scl. 71:1647.
32. Brobeck, J.R. 1948. Food Intake as a mechanism of temperature regulation. Yale J. Biol. Med. 36:545.
33. Broderick, G.A., R.J. Wallace, E.R. Orskov, and L. Hansen. 1988. Comparison of estimates of rumlnal protein degradation by In vitro and In situ methods.J. Anlm. Scl. 66:1739.

177
34. Brody, S. 1949. Influence of ambient temperature, 50 to 100 F on the blood compostlon of Jersey and Holstein cows. Mo. Agrlc. Expt. Sta. Bell 433.
35. Brody. S., E.H. Dale, and E.R. Stewart. 1955. Environmental physiology and shelter engineering XXXVI. Interrelations between temperatures of rumen Cat various depths), rectum, blood, and environmental air, and the effect of an ant Id 1uretlc, feed and water consumption. Mo. Agrlc. Expt. Sta. Bull. 593.
36. Broster, W.H., V.J. Broster, and T. Smith. 1969.Effect of milk, production of level of feeding at two stages of the lactation. J. Agrlc. Scl. Camb.72:229.
37. Brown, C.A., P.T. Chandler, and J.B. Holter. 1977. Development of predictive equation for milk yield and dry matter Intake In lactatlng cows. J. Dairy Scl.60:1739.
38. Brown, R.K., E.N. Bergman, and T.F. Albert. 1970. Effects of various synthetic glucocorticoids on milk production and blood glucose and ketone body concentrations In normal and ketonlc cows. J. Am.Vet. Med. Assoc. 157:941.
39. Bruckental, I. J.D. Oldham, and J.D. Sutton. 1978.Glucose and urea kinetics In cows In early lactation.Proc. Nutr. Soc. 37:107A.
40. Bruckental, T., J. D. Oldham, and J. D. Sutton. 1980.Glucose and urea kinetics In cows In early lactation.Br. J. Nutr. 44:33.
41. Bruner, R., Personal communication. Plant manager, Zapata Haynle Corporation, Dulac, LA.
42. Buffington, D.E., E.A. Collazo-Arocho, G.H. Conton, D. Pitt, W.W. Thatcher, and R.J. Collier. 1981. Black globe humidity Index CBGHI) as comfort equation for dairy cows. Trans. Amer. Soc. Agrlc. Eng. 24:711.
43. Calbreath, D.F. 1980. Quality control in RIA. Pages 1-2 In. Technical Bulletin No. 3, New England Nuclear, Medical Diagnostics Division, North Billerica, MA.
44. Cargill, B.F., R.E. Stewart, and H.D. Johnson. 1962. LXIII. Effect of humidity on total room heat and vapor dissipation of holsteln cows at 65, 80, and 95 F. Mo. Agrlc. Exp. Sta. Bull 794.

178
45. Casper, D.P. and D.J. Schlngoethe. 1988. Lactational response of dairy cows to diets varying in rumlnal solubilities of carbohydrate and crude protein. J. Dairy Sc 1. 72:928.
46. Chalyabutr, N., A. Faulkner, and M. Peaker. 1982. Glucose metabolism in vivo in fed and 48 h starved goats during pregnancy and lactation. Br. J. Nutr. 47:87.
47. Challand, G.S. 1976. The wlthln-laboratory validation of radioimmunoassay results. Protldes of the biological fluids 24:731.
48. Chen, J.C., E.M. Zorn, M.C. Hallberg, and R.G.Wleland. 1971. Antibodies to testosterone-3-bovlne serum albumin applied tp assay of serum 17-B-ol androgens. Clin. Chem. 17:581.
49. Chmlel, S.L., J.E. Wohlt, and J.L. Evans. Protein level and quality from soybean meal, fishmeal, and corn gluten meal for nitrogen utilization and performance in early lactation by Holstein cows. J. Dairy Scl. 70 CSuppl. 1):261CAbstr.D.
50. Clark, J.H. 1975. Lactational responses to post- rumlnal administration of proteins and amino acids.J . Dairy Scl. 58:1178.
51. Clark, J.H., M.R. Murphy, and B.A. Crooker. 1987. Supplying protein needs of dairy cattle from byproduct feeds. J. Dairy Scl. 70:1092.
52. Cobble, J.W. and A.C. Ragsdale. 1949. The effect of increasing environmental temperature on the composition of milk. J. Dairy Sci. 32:713.
53. Cobble, J.W. and H.A. Hermon. 1951. The Influence of environmental temperatures on the composition of milk of the dairy cows. Mo. Agrlc. Expt. Sta. Bull. 485.
54. Collier, R.J. 1979. Endocrinological and physiological effects of heat stress on lactation. p. 116 ln_: Proc. Florida Nutr. Conf.
55. Collier, R.J., R.M. Eley, A.R. Sharma, R.M. Pereira, and D.E. Buffington. 1981. Shade management in subtropical environment for milk yield and composition in Holstein and Jersey cows. J. Dairy Scl. 64:844.
56. Collier, R.J., D.K. Beede, W.W. Thatcher, L.A. Israel, and C.J. Wilcox. 1982. Influences of environment and its modification on dairy animal health and production. J. Dairy Scl. 65:2213.
179
57. Coppock, C.E., P.A. Grant, S.J. Portzer, and A. Eacobosa. 1982. Effect of varying dietary ratio of sodium and chloride on the response of lactatlng dairy cows In hot weather. J. Dairy Scl. 65:552.
58. Crooker, B.A., J.H. Clark, and E.D. Shanks. 1983. Effects of formaldehyde treated soybean meal on milk yield, milk composition and nutrient digestibility In the dairy cow. J. Dairy Scl. 66:492.
59. Cummins, K.A., 1987. Effect of environmental heat stress and breed Interactions on milk production and feed Intake of dairy cows. J. Dairy Scl. 70CSuppl.19:197CAbstr.).
60. Danfaer, A., I. Thysen, and B. Ostergaard. 1980. Beretn. St. Husdyrbrugs. forsog. No. 492.
61. Dantzer, E. and P. Mormede. 1983. Stress In farm animals: a need for reevaluatIon. J. Anlm. Scl. 57:6.
62. Davis, E.N., F.G. Hagland, A.B. Caster, and E.H. Kellner. 1947. Variations In milk from Jersey, Guernsey, Holstein, and mixed herds. J. Dairy Scl. 30:435.
63. Drorl, D. and Y. Floman. 1970. Protein requirements of dairy cows fed high energy rations. XVIII. Int. Dairy Congr. IE:533.
64. Edelman, I.S., E. Bogoroch, and G.A. Porter. 1963.On the mechanism of aldosterone on sodium transport: the role of protein synthesis. Proc. Natl. Aead. Scl. 50:1169.
65. Edelman, I.S. and D. Marver. 1980. Mediating events In the action of aldosterone. J. Steroid Blochem. 12:219.
66. Ekern, A. 1982. Eesults of feeding trials and practical experience concerning protein feeding of ruminants In Norway. Pages 66-102 In Protein contribution of feedstuffs for ruminants. E.L.Miller, I.H. Pike, and A.J.H. Van Es, ed.Butterworths, London.
67. El-Nouty, F.D., I.M. Elbanna. and H.D. Johnson. 1978. Effect of adrenocorticotropic hormone on plasma glucocorticoids and antldluretlc hormone of cattle exposed to 20 and 33 C. J. Dairy Scl. 61:189.
68. El-Nouty, F.D., I.M. Elbanna, T.P. Davis, and H.D. Johnson. 1980. Aldosterone and ADH response to heat and dehydration In cattle. J. Appl. Phys. 48:249.

180
69. Emery, R.S. 1978. Feeding for Increased milk protein. J. Dairy Scl. 61:825.
70. Endocrine Sciences. 1981. Urine aldosteroneradioimmunoassay procedure, antiserum no. A3-375.18418 Oxnard Street, Tarzana, CA.
71. Endocrine Sciences. 1986. Plasma cortisolradioimmunoassay procedure antiserum F3-314. 18418Oxnard Street, Tarzana, CA.
72. Erdman, R.A. 1988. Dietary buffering requirements ofthe lactatlng dairy cow: A review. J. Dairy Scl.71:3246.
73. Erfle, J.E., 1987. Trials with fish meal for dairycows. Pages 16-18 lji Milk quotas - new feedingstradegles to reduce milk production costs. E. L. Miller and I. H. Pike, eds., Assoc. Fish Meal Manu. and Int. Assoc. Fish Meal Manu.
74. Esmay, M.L. 1978. .Homeostatls of animals. Pages 17-31 l_n Principles of animal environment. M.L. Esmay, ed. AVI Publishing Company, Inc., Westport,Connectlcut.
75. Esmay, M.L. 1978. Homeothermy of animals. Pages 33-52 In. Principles of animal environment. M.L. Esmay, ed. AVI Publishing Company, Inc., Westport,Connectlcut.
76. Esmay, M.L. 1978c. Humidity and Its effects onanimals. Pages 100-103 .In. Principles of animal environment. M.L. Esmay, ed. AVI Publishing Company, Inc., Westport, Connecticut.
77. Fernandez, J.M., W.J. Croom, Jr., A.D. Johnson, R.D. Jacquette, and F.W. Edens. 1988. Subcllnlcal ammonia toxicity In steers: effects on blood metabolite and regulatory hormone concentrations. J. Anlm. Scl. 66:3259.
78. Finch, V.A. 1985. Comparison of nonevaporat1ve heattransfer In different cattle breeds. Aust. J. Agrlc. Res. 36:497.
79. Foldager, J. and J. T. Huber. 1979. Influence of protein percent and source on cows In early lactation. J. Dairy Scl. 62:954.
80. Forsham, P.H. 1963. Action of glucocorticoids. Page 10 l_n_ The adrenal gland. J.H. Walton, ed. Clba Pharmaceutical Company, Summit, N.J.

181
81. Gaalas, R.F. 1947. A study of heat tolerance In dairy cows. J. Dairy Scl. 30:79.
82. Gaines, W.L. 1928. The energy basis of measuringmilk, yield In dairy cows. University of 111. Agrlc.Expt. Sta. Bull. 308.
83. Ganev, G. , E.R. Orskov, and R.I. Smart. 1979. The effect of roughage or concentrate feeding and rumen retention time on total degradation of protein In the rumen. J. Agrlc. Scl. Camb. 93:651.
84. Ganong, W.F. 1985. Energy balance, metabolism, andnutrition. Page 240 ln_ Review of medical physiology. 12th ed. Lange Medical Publications, Los Altos, CA.
85. Ganong, W.F. 1985. Physiologic principles. Pages17-20 lji Review of medical physiology. 12th ed.Lange Medical Publications, Los Altos, CA.
86. Ganong, W.F. 1985. Digestion and absorption. Page387 j n Review of medical physiology. 12th ed. LangeMedical Publications, Los Altos, CA.
87. Ganong, W.F. 1985. Renal function. Pages 581-583 ljiReview of medical physiology. 12th ed. Lange Medical Publications, Los Altos, CA.
88. Gengler, W.R., F.A. Martz, H.D. Johnson, G.F. Krause, and L. Hahn. 1970. Effect of temperature on food andwater Intake and rumen fermentation. J. Dairy Scl. 53:434.
89. Gill, M. and D.E. Beever. 1982. The effect of protein supplementation on digestion and glucose metabolism In young cattle fed on silage. Brit. J. Nutr. 48:37.
90. Glascock, R.L. and L.R. Relnus. 1961. Studies on theorigin of milk fat. Blochem. J. 62:55.
91. Goldhor, S. 1986. Fishmeal for ruminants. Feed Management 37C8):20.
92. Gordon, F.J. and C.H. McMurray. 1979. The optimumlevel of protein In the supplement for dairy cows with access to grass silage. Anlm. Prod. 29:283.
93. Gordon, F.J., 1979. The effect of protein content on the supplement for dairy cows with access to ab libitum to high digestibility, wilted grass silage. Anlm. Pro. 28:183.

182
94. Grummer, R.R. 1988. Influence of prilled fat and calcium salt of palm oil fatty acids on rumlnal fermentation and nutrient digestibility. J. Dairy Scl. 71:117.
95. Guyton, A.C. 1976. Protein metabolism. Pages 933- 934 in Textbook of medical physiology. 5th ed. W.B. Saunders Co., Philadelphia, PA.
96. Guyton, A.C. 1986. Textbook of medical physiology. 7th ed. W.B. Saunders Co., Philadelphia, PA.
97. Gwazdauskas, F.C., W.W. Thatcher, and C.J. Wilcox. 1972. Adreno-cortlcotropin alteration of bovine peripheral plasma concentrations of cortisol, corticosterone, and progesterone. J. Dairy. Scl.55:1165.
98. Gwazdauskas, F.C., J.E. Keys, Jr., and M.L. McGllllard. 1985. Adrenal response during perlparturlent period to adrenocortlcotropin In dairy cattle fed corn silage and grass legume silage. J. Dairy Scl. 69:2134.
99. Hafez, E.S.E. 1968. Environmental effects on animalproductivity. Pages 74-241. in. Adaptation ofdomestic animals. E.S.E. Hafez, ed. Leat Feblger, Philadelphla.
100. Hahn, L. and J.D. McQulgg. 1971. Evaluation of climatic data for environmental engineering design. Am. Meteorol. Society, 1st Blometeorologlcal Conference, Columbia, MO.
101. Harris, B., Jr., J.V. Brlceno, and H.H. Van Horn.1987. Influence of feeding a bypass fat during hot weather on performance of lactatlng cows In a large dairy. J. Dairy Scl. CSuppl. 1):252CAbstr.J.
102. Harrison, D.G. and A.B. McAllan. 1980. Factors affecting microbial growth yields In the retlculo- rumen. Page 205 In. Digestive physiology and metabolism In ruminants. Y. Ruckebusch and P.Thlvend, ed. AVI Publishing Company, Inc., Westport,CT.
103. Hassan, A.M. 1971. Effect of dietary protein levels on the physiological performance of lactatlng dairy cattle under heat stress. Ph.D Dissertation, Louisiana State University, Baton Rouge, LA.

183
104. Hespell, R.B. and M.P. Bryant. 1979. Efficiency of rumen microbial growth: Influence of some theoreticaland experimental factors In YftTp. J. Anlm. Scl.49:1640.
105. Higginbotham, G.E. and J.T. Huber. 1987. Influence of protein level and degradabl1lty, of hormones and physiological parameter of cows during hot and moderate environmental temperatures. J. Dairy Scl. 70 CSuppl. 1):108CAbstr.}.
106. Hllwlg, R.W. 1976. Excretion and renal regulation of neutrality. I_n_: Buffers in ruminant physiology and metabolism. M.S. Weinberg and A.L. Sheffner, ed. Church and Dwight Company, Inc., New York.
107. Horner, C.J. and E.H. Herzer. 1950. A study of the composition of milk produced In different areas of Mississippi. Miss. Agrlc. Expt. Sta. Bull. 474.
108. Horner, J.L., L.M. Wlndle, C.E. Coppock, J.M. Labore, J.K. Lanham, and D.H. Nave. 1988. Effects of whole cottonseed, niacin, and niacinamide on In vitro rumen fermentation and on lactatlng Holstein cows. J. Dairy Scl. 71:3334.
109. Hovell, F.D., N.A. McCleod, R.A. Stlrton, and E.R. Orskov. 1981. The effect of energy Intake on nitrogen retention by lambs totally nourished by lngastrlc Infusion. Proc. Nutr. Soc. 40:107A.
110. Huston, G. V.I. Martin, E.A.S. Al-Dujalll, and C.R.W. Edwards. 1981. Evaluation of the mineral cortlcold activity of 18-hydroxycortlcosterone. Clin. Scl. 61:201.
111. Ingraham, R.H., L.C. Kappel, E.B. Morgan, and D.K. Babcock. 1982. Temperature-humldlty versus seasonal effects on concentration of blood constituents of dairy cows during the pre and postcalving periods: relationship to lactation level and reproductive functions. Pages 565-570 in. Livestock environmentII., Proc. 2nd. Int. Lives. Environ. Symp. ASAE.
112. Ipsen, E.J. 1970. The effect of various protein levels In concentrate used as a supplement to pasture feeding under tropical conditions. XVIII. Int. Dairy. Congr. 535.
113. Jacquemet, N. and E.C. Prlggs. 1989. Effect of lndomethacln administration on glucose homeostasis and pancreatic hormones In lactatlng goats. J. Dairy Scl. 72:1302.

184
114. Jacquette, R.B., A.H. Rok.es, and W.J. Croon, Jr.1986. Effects of dietary protein on milk., rumen, and blood parameters In dairy cattle fed low fiber diets. J. Dairy Scl. 69:1026.
115. Jacquette, R.D., A.H. Rakes, and W.J. Groom, Jr.1987. Effect of amount and source of dietary nitrogen on milk fat depression In early lactation cows. J. Dairy Scl. 70:1202.
116. Jacquette, R.D., A.H. Rakes, and W.J. Groom, Jr.1988. Effects of body condition and protein on milk fat depression In early lactation dairy cows. J.Dairy Scl. 71:2123.
117. Johnson, H.D., H.H. Klbler, A.C. Ragsdale, I.L. Berry, and M.D. Shanklln. 1961. Role of heat tolerance and production level In responses of lactatlng Holstelns to various temperature-humldlty conditions. J. Dairy Scl. 44 CSupplO:1191CAbstr. J.
118. Johnson, H.D., A.C. Ragsdale, I.L. Berry, and M.D. Shanklln. 1962b. Environmental physiology and shelter engineering. LXII. Effect of various temperature-humldlty combinations on milk production of holsteln cattle. Mo. Agrlc. Expt. Sta. Res. Bull. 791.
119. Johnson, H.D. and W.J. Vanjonack. 1976. Effects of environment and other stressars on blood hormone patterns In lactatlng animals. Symp: stress and health of the dairy cow. J. Dairy Scl. 59:1603.
120. Johnson, H.D. 1987. Biocllmate effects on growth, reproduction, and milk production of livestock. Pages 47-56 lri_ Blocllmatology and the adaptation of livestock. H.D. Johnson, ed. Elsevier, New York.
121. Johnston, J.E. 1958. The effects of high temperatures on milk production. J. Heredity.XLIX:65.
122. Johnston, J.E., R.E. McDowell, R. Shrode, and J.E. Legates. 1959. Summer climate and Its effect on dairy cattle In the southern region. South. Coop.Ser. Bull. No. 63.
123. Johnston, J.E., E.J. Stone, and J.B. Frye, Jr. 1966. Effect of hot temperature on the productive function of dairy cows. 1. Temperature control during hot weather. Louisiana State UnlveTrslty Dairy Dept. Bull. No. 608.

185
124. Kamal, T.H., I.I. Ibrahim, S.M. Self, and H.D.Johnson. 1970. Plasma Insulin and free amino acids changes with heat exposure In bovine. J. Dairy Scl. 53:651 CAbstr.).
125. Kamal, T.H. and H.D. Johnson. 1970. Whole body 40K loss as predictor of heat tolerance In cattle. J. Dairy Scl. 53:1734.
126. Kaufmann, V.W. 1982. The significance of using special proteins In early lactation. p. 117 In: Protein and energy supply for high production of milk and meat. Pergamon Press, New York.
127. Kelley, R.O., F.A. Martz, and H.D. Johnson. 1967. Effect of environmental temperature on rumlnal volatile fatty acid levels with controlled feed Intake. J. Dairy Scl. 50:531.
128. Klbler, H.H. and S. Brody. 1950. Influence of temperature 5 to 95 F, on evaporative cooling from the respiratory and exterior body surfaces of Jersey and Holstein cows. Mo. Agrlc. Expt. Sta. Res Bull. 461.
129. Klehl, E.R. 1967. Heat and acclimation Influences on lactation of Holstein cattle. Mo. Agrlc. Expt. Sta. Bull. 916.
130. Klleber, M. 1975. The fire of life. pp. 331-332. R.E. Krleger Publishing Company, Huntlgnton, New York.
131. Konlg, B.A., D.S. Parker, and J.D. Oldhom. 1981. Theeffect of abomasal casein on acetate and palmltate kinetics In cows during early lactation. Proc. Nutr. Soc. 40:18A.
132. Konlg, B.A., J.D. Oldham, and D.S. Parker. 1984. Theeffect of abomasal casein on acetate and palmltatekinetics In cows during early lactation. Br. J. Nutr. 52:319.
133. Koong, L.J. and R.L. Baldwin. 1976. Mathematical analysis of factors affecting rumen microbial fermentation pathways and growth. Pages 1-2 in. Buffers In ruminant physiology and metabolism. M.S. Weinberg and A.L. Sheffner, ed. Church and Dwight Company, Inc., New York.
134. Koong, L.J. and R.L. Baldwin. 1976. Mathematical analysis of factors affecting rumen microbial fermentation pathways and growth. Pages 3-9 in: Buffers in ruminant physiology and metabolism. M.S. Weinberg and A.L. Sheffner, ed. Church and Dwight Company, Inc., New York.

186
135. Kosunen, K.J., A.J. Pakarlnen, K. Kuoppasalml, and H. Adlercreutz. 1976. Plasma renin activity, angiotensin II, and aldosterone during Intense heat stress. J. Appl. Physiol. 41:323.
136. Kronfleld, D.S. 1976. Metabolic and respiratory adjustments of acid-base balance and the burden of exogenous acid In ruminants. Pages 36-42 In. Buffers In ruminant physiology and metabolism. M.S. Weinberg and A.L. Sheffner, ed. Church and Dwight Company,Inc., New York.
137. Lee, J.A., J.D. Roussel, and J.F. Beatty. 1976.Effect of temperature season on bovine adrenal cortical function, blood cell profile and milk production. J. Dairy Scl. 59:104.
138. Leng, R.A., W. Steel, and J.R. Lulck. 1967. Contribution of propionate to glucose synthesis In sheep. Blochem. J. 103:785.
139. Ll, R., H.D. Johnsoh, W. Manala, N. Meador, P. Kattl. 1987. Influence of temperature, humidity, wind, and water sprays above the thermoneutral zone on thermoregulatory functions of lactatlng Holstein cattle. J. Dairy Scl. 70 CSuppl. 1}:122 CAbstr.J.
140. Llndberg, J.E., 1981. Dry matter disappearance of fish meal was significantly affected by forage to concentrate ratio. Swed. J. Agrlc. Res. 11:159.
141. Lucas, H.L., Jr. 1959. Experimental designs and analyses for feeding efficiency trials with dairy cattle. Page3 181-182 .In. Nutritional and economic aspects of feed utilization by dairy cows. C.R. Hoglund, G.L. Johnson, C.A. Lassiter, and L.D. McGllllard, ed. lowas State College Press, Ames,Iowa.
142. Macaulay, A.S., J.D. Roussel, and S.H. Seybt. 1986. Cortisol response In heifers to artificial Insemination, natural mating, and no mating at estrus. Therlogenology 26:117.
143. Macfarlane, W.V. 1968. Adaptation of ruminants to tropics and events. Page 171 In. Adaptation of domestic animals. E.S.E. Hafez, ed. Lea and Feblger, Philadelphia, PA.
144. MacGregor, C.A., C.J. Snlffen, and W.H. Hoover. 1978. Amino acid profiles of total and soluble protein In feedstuffs commonly fed to ruminants. J. Dairy Scl. 61:566.

187
145. Mantysaari, P.E., C.J. Sniffer, and T.V. Muscato.1987. Protein fractions in animal and marine byproducts. J. Dairy Scl. 70 CSuppl. 1):263CAbstr.}.
146. Mathers, J.C. C.M. Horton, and Miller. 1977. Rate and extent of protein degradation In the rumen. Proc. Nutr. Soc. 36:37A.
147. Maust, L.R. and R.E. McDowell. 1971. Effect of summer condition on feed Intake and milk yield of Holstein cows. J. Darly Scl. 54:793.
148. McAllan, A.B. and R.H. Smith. 1983. Factors Influencing the digestion of dietary carbohydrates between the mouth and abomasum of steers. Br. J.Nutr. 50:445.
149. McClymont, G.L. and S. Vallance. 1962. Depression In blood glycerides and milk fat synthesis by glucose Infusion. Proc. Nutr. Soc. 21:xll.
150. McDowell, L.R. 1972. Common salt, magnesium, and potassium. Pages 214-233 In Nutrition of grazing ruminants In warm climates. Academic Press, Inc.
151. McDowell, R.E., E.A. Moody, P.J. Van Soest, R.P. Lehmann, and A.L. Ford. 1969. Effect of heat stress on energy and water utilization of lactatlng cows. J. Dairy Scl. 52:188.
152. McDowell, R.E. 1972. Improvement of livestock production In warm climates. 2nd ed., W.H. Freeman and Co., San Francisco, CA.
153. Megglson, P.A., N.P. McMenlman, and D.G. Armstrong. 1979. Efficiency of microbial protein synthesis In cattle. Proc. Nutr. Soc. 38:146A.
154. Mehrez, A.Z., E.R. Orskov, and J. Opstredt. 1980. Processing factors affecting degrablllty of fish meal In the rumen. J. Anlm. Scl. 50:737.
155. Mertens, D.R. 1985. Recent concepts useful Inoptimizing substrate of dairy cows. Pages 99-123 lji Monsanto Technical Symposium. Monsanto Co., St.Louis, M0.
156. Miller, E.L., N.W. Galwey, G. Newman, and I.H. Pike.1982. Report of co-ordinated trials carried out oncommercial forms In the UK. In.: Protein contribution of feedstuffs for ruminants. E.L. Miller, I.H. Pike, and A.J.H. Vanes, ed. Butterworth's London.

188
157. Miller, E.L. and I.H. Pike. 1987. Use of fish meal to Improve feed efficiency and reduce feeding costs. Pages 20-22 in Milk quotas: new feeding strategies to reduce milk productive costs. Assoc. Fish Meal Manu. and Int. Assoc. Fish Meal Manu.
158. Moe, P.W., J.T. Reid, and H.F. Tyrrell. 1965. Effectof level of Intake on digestibility of dietary energy of high producing cows. J. Dairy Scl. 48:1053.
159. Mohammed, O.E. and R.H. Smith. 1977. Measurement ofprotein degradation In the rumen. Proc. Nutr. Soc.36:152A.
160. Moody, M. 1989. Personal communlcatIon. Seafood technology specialist, LCES, Baton Rouge, LA.
161. Morris, S. 1987. Personal communication. Herdsman, Louisiana State Unverslty Dairy Production, Teaching,and Research Center. LA Agrlc. Expt. Sta. BatonRouge, LA.
162. Morrison, S.R. 1983. Ruminant heat stress: effect onproduction and means of alleviation. J. Anlm. Scl.57:1594.
163. Moust, L.R. and R.E. McDowell. 1971. Effect ofsummer condition on feed Intake and milk yield of Holstein cows. J. Dairy Scl. 54:793.
164. Mudgal, V.D. and G.M. Lai. 1970. Effect of feeding different levels of energy and protein on the yield and composition of milk of Tharparker cows. XVIII.Int. Dairy Congr. IE:534.
165. Muller, J. 1988. Regulation of aldosteronebiosynthesis. 2nd new ed. Springer— Verlag, New York. Monographs on endocrinology. Vol. 29.
166. Muscato, T.V., C.J. Snlffen, U. Kr1shnamoorthy, and P.J. Van Soest. 1983. Amino acid content of noncell and cell wall fractions In feedstuffs. J. Dairy Scl. 66:2198.
167. National Research Council. 1978. 5th ed. NationalResearch Council. Nutrient requirements of dairy cattle. Natl. Acad. Scl., National Academy Press, Washington, DC.
168. National Research Council. 1981. Feed intake. Pages27-29 in. Effect of environment on nutrient requirements of domestic animals. Natl. Acad. Scl. National Academy Press, Washington, DC.
189
169. National Research Council. 1981. Dairy cattle.Pages 75-84 ln Effect of environment on nutrient requirements of domestic animals. Natl. Acad. Scl. National Adademy Press, Washington, DC.
170. National Research Council. 1987. Pages 48-54 In.Predicting Intake of food producing animals. Natl. Acad. Scl. National Academy Press, Washington, DC.
171. National Research Council. 1988. Nutrientrequirements of dairy cattle. 6th revised ed. Natl. Acad. Scl. National Academy Press, Washington, DC.
172. Neter, J., and W. Wasserman. 1974. Aptness of model and redemlal measures. Pages 113-121 In. Applied statistical methods, Richard D. Irwin, Inc.,Homewood, IL.
173. Nicholson, J.W.G. and J.D. Sutton. 1971. Someeffects of unsaturated oils given to dairy cows withrations of different roughage content. J. Dairy Res. 38:363.
174. Nlle3, M.A., R.J. Collier, and W.J. Croom. 1980. Effects of heat stress on rumen and plasma metabolites and plasma hormone concentration of Holstein cows. J. Anlm. Scl. 51 CSuppl. 1):152CAbstr.).
175. Nocek, J.E. 1988. In situ and other methods to estimate rumlnal proteins and energy digestibility: A review. J. Dairy Scl. 71:2051.
176. Oldham, J.D., W.D. Broster, D.J. Napper, and T. Smith. 1979. Predicted and measured performance of Holstein cows fed rations calculated to differ In rumen degradable protein and undegraded protein. Nutr. Abstr. 49:128A.
177. Oldham, J.D., R.J. Rutherford, and D.J. Napper. 1981. Source and level of supplemental nitrogen for cows early In lactation. Nutr. Abstr. 51:30A.
178. Oldham, J.D. and T. Smith. 1982. Proteln-energy Interrelationships for growing and for lactation cattle. I_n: Protein contribution of feedstuffs for ruminants. E.L. Miller, I.H. Pike, and A.J.H. Vanes, ed. Butterworths, London.
179. Oldham, J.D., D.J. Napper, T. Smith, and R.J. Fulford. 1985a. Performance of dairy cows offered lsonltrogenous diets containing urea or fish meal In early and In mid-lactation. Br. J. Nutr. 53:337.

190
180. Oldham, J.D., R.J. Phipps, D.J. Fulford, T.J.Napper, and F. R. Weller. 1985. Response of dairy cows to rations varying In fish meal or soybean meal content In early lactation. Anlm. Prod. 40:519.
181. Oldham, J.D. and D.S. Parker. 1981. Rumen degradabl1lty of animal products in lactatlng sheep. Process. Blochem. 30 TP500. Page 68.
182. Oldham, J.D. 1987. Dairy cow responses differ depending on amino acid supply. Page 15 lji Feedstuffs. October 19, 1987.
183. Opstvedt, J. 1984. Fish fats. Pages 53-82 ljn Fats In animal nutrition. J. Wiseman, ed. Butterworths, London.
184. Orskov, E.R. and D.A. Grubb. 1978. Validationof new systems for protein evaluation In ruminants by testing the effect of urea supplementation on Intake and digestibility of straw with and without sodium hydroxide treatment. J. Agrlc. Scl. Camb. 91:483.
185. Orskov, E.R., D.A. Grubb, and R.N.B. Kay. 1977. Effect of post-rumlnal glucose or protein supplementation on milk yield and composition In Freslan cows In early lactation and negative energy balance. Br. J. Nutr. 38:397.
186. Orskov, E.R. 1982. Rumen microorganisms and theirnutrition. Page3 19-39 l_n Protein nutrition In ruminants. Academic Press, Inc., New York.
187. Orskov, E.R. 1982. Dynamics of nitrogen In therumen. Pages 40-84 lrL Protein nutrition In ruminants. Academic Press, Inc., New York.
188. Orskov, E.R. 1982. Host animal protein requirementand protein utilization. Pages 85-136 l_n. Protein nutrition In ruminants. Academic Press, Inc., New York.
189. Orskov, E.R. and N.A. McCleod. 1982. The determination of the minimal of nitrogen excretion In steers and dairy cows and Its physiological and practical Implication. Br. J. Nutr. 47:625.
190. Orskov, W.E., M.H. Jones, and M.E. Ellman. 1983. Studies on degradation and outflow rate of protein supplements In the rumen of sheep and cattle.Llvest. Prod. Scl. 10:17.

191
191. Orskov, E.R., C. Fraser, and I. McDonald. 1972.The effects of urea on digestion nitrogen retention and growth In young lambs. Br. J. Nutr. 27:491.
192. Orskov, E.R., C. Fraser, I. McDonald, and R.I.Smart. 1974. The effect of adding fishmeal and urea together to cereal diets on protein digestion and utilization by young sheep. Br. J. Nutr. 31:89.
193. Orskov, E.R., R.W. Reid, and I. McDonald. 1981. Theeffects of protein degradabl1lty and food Intake onmilk yield and composition In cows In early lactation. Br. J. Nutr. 45:547.
194. Ott, F.J. and J.D. Roussel. 1987. Effect of protein level and composition on milk yield, body weight, body temperature, and respiration rate. J. Dairy Scl. 70 CSuppl. 1J:249CAbstr.}.
195. Owens, F.N. and W.G. Bergen. 1983. Nitrogen metabolism of ruminant animals: historical perspective, current understanding and future Implication. J. Anlm. Scl. 57 CSuppl. 2):498.
196. Palmqulst, D.L. and H.R. Conrad. 1978. High fat rations for dairy cows. Effects on feed Intake, milk and fat production, plasma metabolites. J. Dairy Scl. 61:890.
197. Pamlqulst, D.L. 1984. Use of fats In diets for lactatlng dairy cows. Pages 357-381 l_n Fats In animal nutrition. J.‘ Wiseman, ed. Butterworths, London.
198. Peaker, N. and J.L. Llnzell. 1973. The lack of effect of aldosterone on milk secretion In the goat. J. Endocrinol. 58:139.
199. Peel, C.J., T.J. Fronk, D.E. Bauman, and R.C. Gorewlt. 1983. Effects of exogenous growth hormone In early and late lactation on lactational performance of dairy cows. J. Dairy Scl. 66:776.
200. Pike, I. H., 1987. Use of fish meal as a means ofsparing concentrates. Pages 20-21. 1_!L Milk quotas -new feeding stradegles to reduce milk production costs. Assoc. Fish Meal Manu. and Int. Assoc. Fish Meal Manu.
201. Prewitt, L.R., A.F. Kertz, A.G. Lane, J.R. Campbell, and D.E. Weinman. 1971. Effect of dietary protein on blood, urine, and milk composition. Am. J. Vet. Res. 32:393.

192
202. Ragsdale, A.C., H.J. Thompson, D.M. Worstell, and S. Brody. 1953. The effect of humidity on milk production and composition, feed and water consumption and body weight on cattle. Mo. Agrlc. Expt. Stat. Res. Bull. 521.
203. Ragsdale, A.C., S. Brody, H. Thompson, and D. M. Worstell. 1948. Environmental physiology. Influence of temperature 50 to 105 F on milk production and feed consumption In dairy cattle. Mo. Agr. Axp.Sta. Res. Bull. 425.
204. Ralston, A.T. and W.R. Patton. 1976. Controlled ruminant response to abrupt ration changes. Page3 140-148 l_n Buffers In ruminant physiology and metabolism. M. S. Weinberg and A. L. Sheffner, ed. Church and Dwight Company, Inc., New York.
205. Relk, R.F. and D.H.K. Lee. 1948. Reactions to hot temperatures of Jersey cows In milk. J. Dairy. Res. 15:227.
206. Reynolds, C.K., G.B. Huntington, H.F. Tyrrell, and P.J. Reynolds. 1988. Net portal-drained visceral and hepatic metabolism of glucose, L-lactate, and nitrogenous compounds In lactatlng Holstein cows.J. Dairy Scl. 71:1803.
207. Rogers, J.A., C.L. Davl3, and J.H. Clark. 1982. Alteration of rumen fermentation, milk fat synthesis, and nutrient utilization with mineral salts In dairy cows. J. Dairy Scl. 65:577.
208. Rogers, T.A. 1958. Inhibition of glucose uptake by acidosis In vitro. Proc. Soc. Expt. Biol. Med. 97:646.
209. Rook, J.A., 1979. The role of carbohydrate metabolism In the regulation of milk production. Proc. Nutr. Soc. 38:309.
210. Roussel, J.D., T.J. Clement, and T.J. Aranas. 1983. Changes of aldosterone In blood serum of dairy cattle during estrous cycle. J. Dairy Scl.66:1734.
211. Roussel, J.D., T.J. Clement, T.J. Aranas, and S.H. Sebyt. 1983. Changes In circulating plasma levels of cortisol In lactatlng and non-lactatlng dairy cattle during the estrous cycle. Therlogenology 19:535.

193
212. Russell, J.B. and R. B. Hespell. 1981. Rumlnal degradation of proteins. J. Dairy Scl. 64:1153.
213. Santos, K.A., M.D. Stern, and L.D. Satter. 1984. Protein degradation In the rumen and amino acid absorption In the small Intestine of lactatlng dairy cows fed various protein sources. J. Anlm. Scl. 58:244.
214. Sartln, J.L., K.A. Cummins, R.J. Kemppalnen, D.N. Marple, and J.C. Williams. 1985. Glucagon,Insulin, and growth hormone responses to glucose Infusion In lactatlng dairy cows. Am. J. Physiol. 248:E108.
215. Sartln, J.L., R.J. Kemppalnen, K.A. Cummins, and J.C. Williams. 1988. Plasma concentratIons of metabolic hormones In high and low producing dairy cows. J. Dairy Scl. 71:650.
216. SAS Institute. 1985. SAS user's guide: statistics. 5th ed. SAS Institute, Inc., Cary, NC.
217. Satterlee, D.G., R.B. Abdullah, and R.P.Glldersleve. 1980. Plasma corticosteroneradlolmmunloassay and levels In the neonate chick. Poultry Scl. 59:900.
218. Schmidt, G.H. 1971. Lactose, minerals, and vitamins. Pages 221-263 ljn Biology of lactation. W.H. Freeman and Company, San Francisco, CA.
219. Schneider, P.L., D.K. Beede, and C.J. Wilcox. 1986.Responses of lactatlng cows to dietary sodium source and quantity and potassium quantity during heat stress. J. Dairy Scl. 69:99.
220. Schneider, P.L., D.K. Beede, and C.J. Wilcox. 1988.Nycterohemera1 patterns of acid-base balance, mineral concentratIons and digestive function of lactatlng cows during heat stress. J. Anlm. Scl.66:112.
221. Schneider, P.L., D.K. Beede, and C.J. Wilcox. 1988.Effects of supplemental potassium and sodiumchloride salts on rumlnal turnover rates, acid-base, and mineral status of lactatlng dairy cows during heat stress. J. Anlm. Scl. 66:126.
222. Schwab, C.G., G.A. Broderick, and L.D. Salter.1971. Comparison of medium and high protein rations for lactatlng cows. J. Darly Scl. 54:788.

194
223. Scott, R.A., D.E. Bauman, and J.H. Clark. 1976. Cellular gluconeogenea1 a by lactatlng bovine mammary tissue. J. Dairy Scl. 59:50.
224. Segura, E.T., J.D. Roussel, and D.G Satterlee.1974. Responses of certain plasma constituents to ACTH and environmental temperatures. J. Dairy Scl. 57CSuppl. 1}: 133CabstrO.
225. Shirley, R.L. 1986. Effects of ambient temperature on utilization of nutrients. Pages 289-300 l_n_ Nitrogen and energy nutrition of ruminants. T.J. Cunha, ed. Academic Press, Inc., New York.
226. Skelley, D.S., L.P. Brown, and P.K. Besch. 1973. Radioimmunoassay. Clin. Chem. 19C2}:146.
227. Small, J. and F.J. Gordon. 1985. The effect ofsource of supplementary protein on the performanceof darly cows offered grass silage as the basal diet. Anlm. Prod. 40:520.
228. Snedecor, G.W. and W.G. Cochran. 1967. One-way classification. Analysis of variance. Pages 258- 298. In. Statistical Methods, 6th ed., Iowa State Unlver. Press, Ames, IA.
229. Somero, G.N. 1986. Protons, osmolytes, and fitness of Internal mlleu for protein function. Am. J. Physiol. 251:R197.
230. Spain, J.N., C.N. Miller, and C.E. Polan. 1987.Effect of protein source on milk composition Incows fed low fiber diets. J. Dairy Scl. 70 CSuppl. 1J:254CAbstr.J.
231. Staples, C.R., H.H. Head, and D.E. Darden. 1988. Short-term administration of bovine somatotropin to lactatlng dairy cows In a subtropical environment.J. Dairy Scl. 71:3274.
232. Stanley, R.W., S.E. Olbrlch, F.A. Martz, H.D.Johnson, and E.S. Hilderbrance. 1975. Effect ofroughage level and ambient temperature on milk production, milk composition and rumlnal volatile fatty acids. Trop. Agr. 52:213.
233. Storry, J.E. 1981. The effect of dietary fat on milk composition. Pages 3-33 In. Recent advances In animal nutrition. W. Hareslgn, ed. Butterworths, London.

195
234. Swanson, L.V., H.D. Hafs, and D.A. Morrow. 1972. Ovarian characteristics and serum LH, prolactin, progesterone and glucocorticoid from first estrus to breeding size In Holstein heifers. J. Anlm. Scl. 34:284.
235. Tammlnga, S., C.J. Van der Koelan, and A.M. Van Vuuren. 1979. Effect of level of feed Intake on protein entering the small Intestine of dairy cows. Llvest. Prod. Scl. 6:255.
236. Tammlnga, S. 1982. Energy-proteIn relationships In ruminant feeding: similarities and differences between rumen fermentation and postruminal utilization. Page 4 lri Protein contribution of feedstuffs for ruminants. E.L. Miller, I.H. Pike,A.J.H. Van Es, ed. Butterworth Scl., Boston, MA.
237. Tarr, H.L. and J. Blely. 1973. Effect of processing on the nutritional value of fish meal and related products. Pages 252-281 ljn Effect of processing on the nutritional value of feeds. Natl. Acad, of Scl. National Academy Press, Washington, DC.
238. Thomas, P.C. 1973. Microbial protein synthesis. Proc. Nutr. Soc. 32:85.
239. Thompson, R.D., J.E. Johnston, C.P. Breldensteln,A.J. Guidry, and W.T. Burnett. 1963. Effect of hot conditions on adrenal cortlcol, . thyroldal, and other metabolic responses of dairy heifers. J. Dairy Scl. 46:227.
240. Toups, G.M. and J.D. Roussel. 1988. Response of dairy cows to dietary supplementation of specially selected fish meal during the hot season. J. Dairy Scl. 71 CSuppl. 1J: 277 CAbstr.}.
241. Trenkle, A.H. 1979. Basic physiology of' electrolytes and acid-base balance In body fluids. Pages 4-21 l_n Sodium bicarbonate In beef, poultry, swine nutrition. A.H. Trenkle, D.H. Baker, and P.G. Harris, ed. Church and Dwight Company, Inc., New York.
242. Turner, C.D. and J.T. Bagnara. 1971. General endocrinology. 5th ed. W.B. Saunders Co.,Philadelphla.
243. Tyrrell, H.'F. and P.W. Moe. 1980. Limits on milkproduction efficiency by the dairy cow. J. Anlm. Scl. 51:1441.

196
244. Vasllatos, R. and P.J. Wangsness. 1981. Diurnal variations In plasma Insulin and growth hormone associated with two stages of lactation In high producing dairy cows. Endocrinol. 108:300.
245. Voss, V.L., D. Stehr, L.D. Satter, and G.A. Broderick. 1988. Feeding lactatlng cows protein resistant to rumlnal degradation. J. Dairy Scl. 71:2428.
246. Waldo, D.R. 1973. Extent and partition of cereal grain starch digestion In ruminants. J. Anlm. Scl. 37:1062.
247. Warren, W.P., F .A . Martz, K.H. Asay, E.S. Hllderbrand, C.G. Pagne, and J.R. Vogt. 1974. Digestibility and rate of passage by steers fed tall fescue, alfalfa and orchardgrass hay In 18 and 32 C ambient temperature. 3. Anlm. Scl. 39:93.
248. Wayman, 0., H.D. Johnson, C.P. Merl3an, and I.C. Berry. 1962. Effect of ad libitum or force-feeding of two rations on lactatlng dairy cows subject to temperature stress. J. Dairy Scl. 45:1472.
249. Weeks, T.E.C., R. I. Richardson, and N. Geddes.1979. The effect of ammonia on gluconeogenes1s by Isolated sheep liver cells. Proc. Nutr. Soc. 38:3A.
250. West, J.W., C.E. Coppock, K.Z. Milam, D.H. Nave, and J.M. LaBore. 1985. Effect of dietary potassium concentration on lactatlng holsteln cows during hot weather. J. Dairy Scl. 68 CSuppl. 1}:140.
251. White, A., P. Handler, and E.L. Smith. 1973. Principles of biochemistry. 5th ed. McGraw-Hill Book Company, New York, NY.
252. Wlltrout, D.W., and L.D. Satter. 1971.Contribution of propionate to glucose synthesis In the lactatlng and nonlactatlng cow. J. Dairy Scl. 55:307.
253. Wise, M. E.,D.V. Armstrong, J.T. Huber, R. Hunter, and F. Wlersma. 1988. Hormonal alterations In the lactatlng dairy cow In response to thermal stress. J. Dairy Scl. 71:2480.
254. Worstell, D.M. and S. Brody. 1953. Comparative physiological reactions of European and Indian cattle to changing temperature. Mo. Agrlc. Expt. Sta. Res. Bull. 515.
197
255. Young, V., 1980. Hormonal control of protein metabolism with particular reference to body protein gain. I_n: Protein deposition In animals. P.J. Buttery and D.B. Lindsay Ced.) Butterworth Pub., Inc., Boston, MA.
256. Yousef, M.K. and H.D. Johnson. 1967. Calorlgenes1s of cattle Influenced by hydrocortisone and environmental temperature. J. Anlm. Scl. 26:1087.
257. Yousef, M.K., L. Hahn, and H.D. Johnson. 1968. Adaptation of cattle. Pages 233-243 in. Adaptation of domestic animals. E.S.E. Hafez, ed. Lea & Feblger, Philadelphia, PA.
258. Yousef, M.K. 1985. Stress physiology In livestock. Vol. I. CRC Press, Boca Raton, FL.
259. Zapata Haynle Corporation. 1987. Personal communication. Hammond, LA.
260. Zerblnl, E. and C.E. Polan. 1985. Protein sources evaluated for rumlnantlng Holstein calves. J. Dairy Scl. 68:1416.
261. Zerblnl, E., C.E. Polan, and J.H. Herbeln. 1988. Effect of dietary soybean meal and fish meal on protein dlgesta flow In Holstein cows during early and mld-lactatlon. J. Dairy Scl. 71:1248.

A P P E N D I C E S
198

Appendix Table 1. Amino acid content of SSFMreported by commercial supplier. ■*
Amino Acid Content
Glutamic acid 9.02Aspartic acid 5.95Lys1ne 5. 15Glyc1ne 5. 15Arginine 4.65Alan 1ne 4.25Prollne 3.42Leuclne 3.06Vallne 2.86Threonine 2.52Phenylalanine 2.40Serine 2.37Isoleuc1ne 2.32Tyroslne 1.87Methionine 1.82Histldlne 1. 41Cystlne 0.54Tryptophan 0.49Taur1ne 0.35
Zapata Haynle Corporation, Hammond, LA
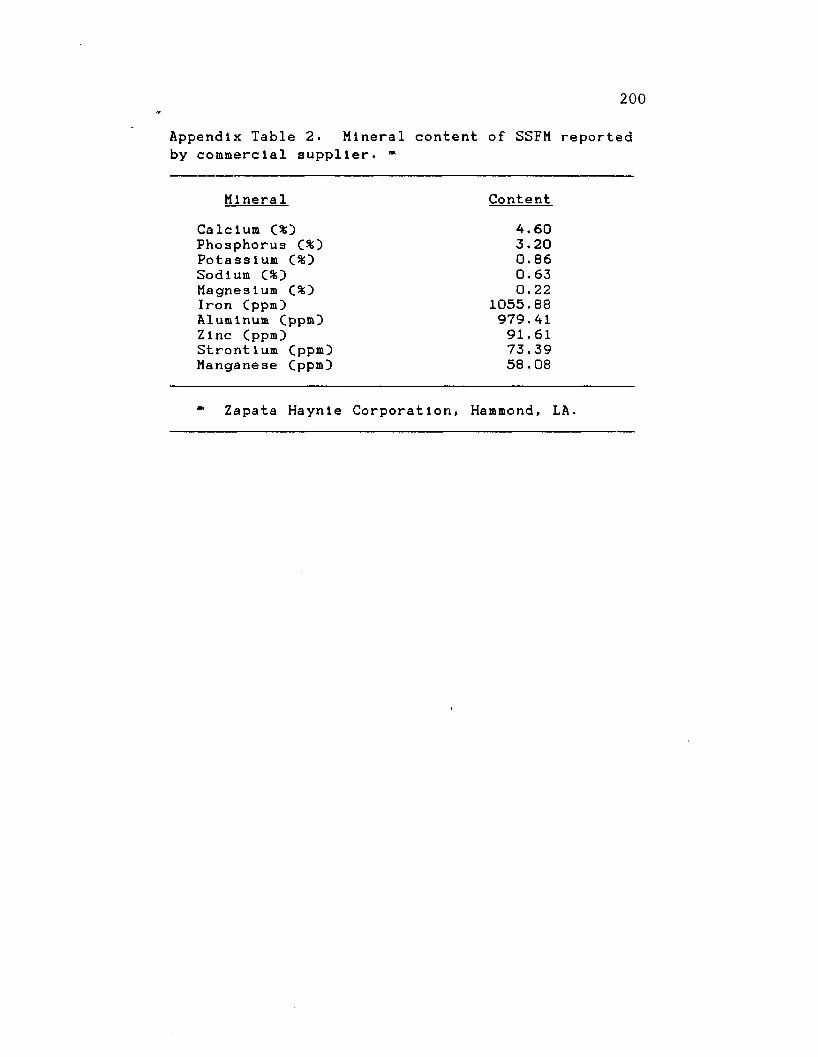
200
Appendix Table 2. Mineral content of SSFM reportedby commercial supplier. *
Mineral Content
Calcium C%D 4.60Phosphorus C%D 3.20Potassium C%D 0.86Sodium C%D 0.63Magnesium C%D 0.22Iron CppmD 1055.88Aluminum CppmD 979.41Zinc CppmD 91.61Strontium CppmD 73.39Manganese CppmD 58.08
m Zapata Haynle Corporation, Hammond, LA.

201
Appendix Table 3. Vitamin content of SSFM reportedby commercial supplier. »
V 1 tarn 1 n Content Cma/k.cOCho11ne 618.182Niacin 11.364Vitamin E 2. 473Pantothenic acid 1. 182Pyr1doxlne 1.227Riboflavin 1.000Thiamine 0. 136Vitamin B12 0.038Blot In 0.027Fol lc acId 0.023
“ Zapata Haynle Corporation, Hammond, LA.

202Appendix Table 4. ETI of experimental period.
Mean Dally ETI Range CCD
ObservedFrequencyCday3}
Fraction of Experimental Period
c*o
L 27.4 0 027.5 - 28.4 1 1.7928.5 - 29.4 1 1.7929.5 - 30.4 2 3.5730.5 - 31.4 9 16.0731,5 - 32.4 8 14.2932 .5 - 33.4 7 12.50
33.5 - 34.4 17 30.36
34.5 - 35.4 11 19.64
1 35.5 0 0
Total 56 100.00

203
Appendix Table 5. Plasma sample distribution In four RIA standard calibration curves for both adrenal steroids.
Standard Pos It Ions
Curve 1 Curve 2 Curve 3 Curve 4
1 - 2 pool pool pool pool
3 - 1 8 J3 8 F i G53 8 F S5 J32 8 F<? J46 8 F l a
19 - 34 J37 8 C i G50 8 C-p H132 8 Cs- H139 8 C l a
35 - 50 G39 8 f2 J31 8 F * J32 8 F 7 H138 8 F n
51 - 66 G43 8 c = J44 8 C « J49 8 C r H136 8 C n
67 - 82 H125 8 F 3 H128 8 F*. G323 8 F © J46 8 F i o
83 - 98 HI 14 8 C 3 H130 8 C © G729 8 c © J612 8 Ci o
99 -100 poo 1 poo 1 pool poolTotal 50 50 50 50
First letter and number8FC
Subscript Number
cow Identification.8 weekly samples.FMS treatment.CON treatment, pair Identification.

204
Appendix Table 6. Aldosterone RIA extraction procedures.
1) Warm thawed plasma samples to room temperature C25 CD, aspirate 0.500 ml sample and dispense with 5.0 ml dlchloromethane Into previously methyl alcohol-rinsed, dried and labeled 16 x 125 mm disposable glass test tubes CCMS, Inc., Harahan, LAD-
2D Vortex 20 tubes at one time on multlple-head Big Vortex unit for 5 minutes, at a speed setting of 50.
3D Centrifuge all tubes at once, at 2000 x g, for 5 minutes.
4D Decant plasma layer quantitatively as waste using dlsposabale pasteur transfer pipette. Immediately decant remaining organic layer Into prelabeled 12 x 75 mm disposal glass test tubes CCMS, Inc., Harahan, LAD that have been previously rinsed with methyl alcohol, dried and labeled.
5D Place test tubes In 37 C water bath and dry solvent under compressed air manifold. Also dry standards concurrently.
6D Dispense 0.500 ml methyl alcohol Into each tube of unknowns, standards, blanks and pools.
7D Vortex 24 tubes per cycle on multiple head Big Vortex, at a setting that vortexes to the upper most level of previously dried solvent, for 3 minutes.
8D Place tubes a 37 C water bath and dry alcohol solvent under compressed air to complete dryness.
9D Remove each tube from water bath, dry outer walls, and rack In numerical order. Cover each rack with parafllm and set aside till DAB and NSB solutions are prepared for dispensing.
Note: One entire curve Is extracted and Incubated withinthe same day, with separation and counting of the 50% tube fraction performed on the next day.

205
Appendix Table 7. List of aldosterone RIA incubation and separation activities of calibration curve and unknown sample.
Tube Tube Incubation Separat ionNo. ID
Dispense Dispense AsplratantDAB NSB H^O SOa
CO.25 ml) CO.25 ml) CO.25 ml) CO.250 ml)
1 T C 3 H + + +2 1 1 + + +
3 11+ + +
4 T C N S D b + + +5 1 1 + + +6 1 I + + +
7 T C r s i e ; o p s + + +
8 > i + + +
10 • •+ + +
11 0 pg + + +
12 ■ i + + +
13 a a + + +14 10 pg + + +15 aa + + +16 a a + + +17 50 pg + + +18 a a + + +19 aa + + +20 100 pg + + +21 a a + + +22 a a + + +23 175 pg + + +24 i a + + +25 a a + + +26 250 pg + + +27 a a + + +28 aa + + +29 350 pg + + +30 a a + + +31 aa + + +32 475 + + +33 a a + + +34 aa + + +35 N S B t : . + + +36 a a + + +3 7
• a + + +38 NSBp, + + +39 a a + + +40 a a + + +41 Unknown 1 + + +42 ■ ■ + + + +

206
Appendix Table 8. Volumes and dilutions for aldosteroneRIA standards.
Standard Reference
Cpg/ml)
Aldosteroneamounts
MassCpg)
diluted standard per tube “ t:'
Volume ■=Cul)
0 0 010 5.0 2050 25.0 100
100 50.0 200175 87.5 350250 125.0 500
350 175.0 700475 237.5 950
Total volume C3X, ml) Plasma volume Cml/tube)
8.460.50
" Dry solvent under compressed air manifold In a 37 C water bath, for approximately 5 minutes or until completely dry.
Remove tubes, dry outer walls and set aside till addition of DAB solution.
■= Aldosterone Standard Stock, solution made by appropriate serial dilutions of 1 mg commercial vial to a final concentration of 250 pg/ml, with methyl alcohol.

207
Appendix Table 9. Volumes for aldosterone DAB and NSB solutIons.
Temp.CC) Components Volumes Cml)IX 5X 10X
20 borate buffer 6.5A5 32.725 65.A50
20 3H-aldosterone * 0. 105 0.525 1.050A BSA solution 0. 150 0.750 1.500
A BGG solution 0. 150 0.750 1.500
20 Antiserum or water 0. 100 0.500 1.000
Tota 1 volumes 7.050 35.250 70.500
~ adjusted dally to 6A.000 250 ul added per tube CA8
dpm per 10 .6 pg, 2A,
ul stock 000 dpm).
•
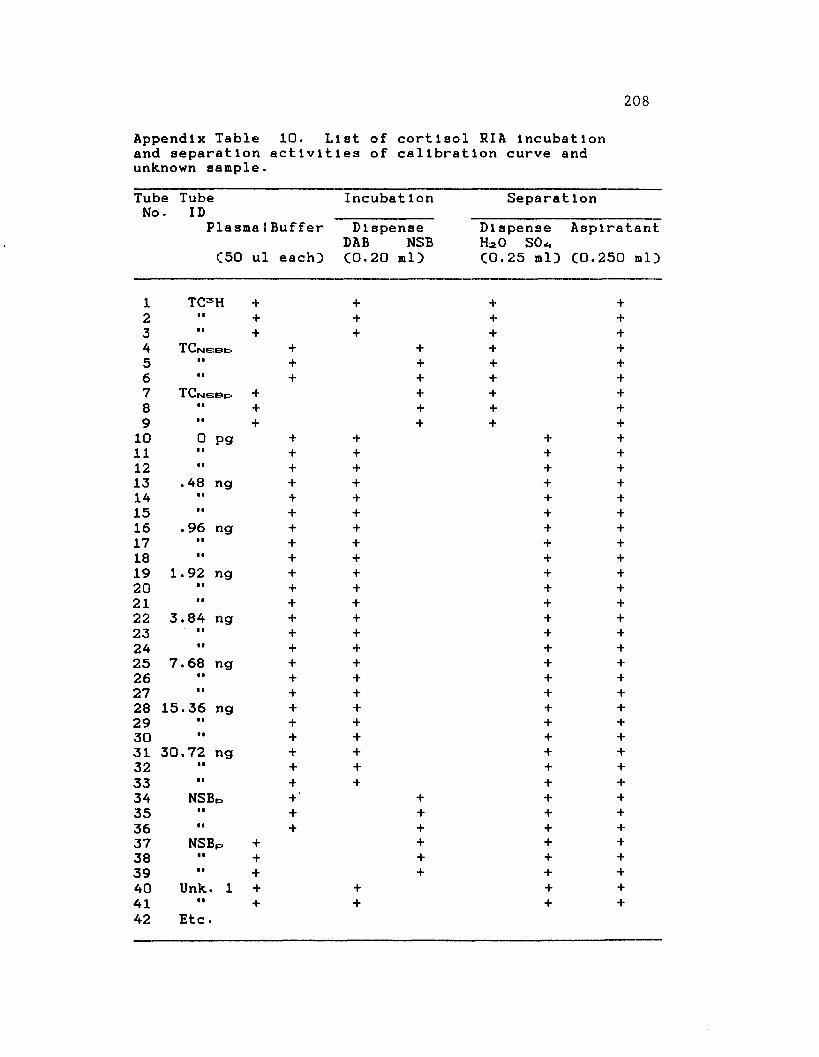
208
Appendix Table 10. List of cortisol RIA Incubation and separation activities of calibration curve and unknown sample.
Tube Tube IncubatIon SeparatIonNo. ID
Plasma 1 Buffer Dlspense Dispense AsplratantDAB NSB H*0 SO*.
C50 ul each) CO.20 ml) CO.25 ml) CO.250 ml)
1 T C 3 H + + + +2 II + + + +3 • • + + + +4 TCfMISBfc. + + + +5 • I + + + +6 + + + +7 T C n GBp + + + +8 • I + + + +9 • I + + + +10 0 pg + + + +11 • 1 + + + +12 II + + + +13 . 48 ng + + + +14 • I + + + +15 • I + + + +16 . 96 ng + + + +17 II + + + +18 II + + + +19 1.92 ng + + + +20 • I + + + +21 + + + +22 3.84 ng + + + +23 11 + + + +24 • I + + + +25 7.68 ng + + + +26 II + + + +27 II + + + +28 15.36 ng + + + +29 • I + + + +30 tl + + + +31 30.72 ng + + + +32 II + + + +33 • I + + + +34 NSBo + ' + + +35 • I + + + +36 • I + + + +37 NSBp. + + + +38 II + + + +39 II + + + +40 Unk. 1 + + + +41 II + + + +42 Etc.
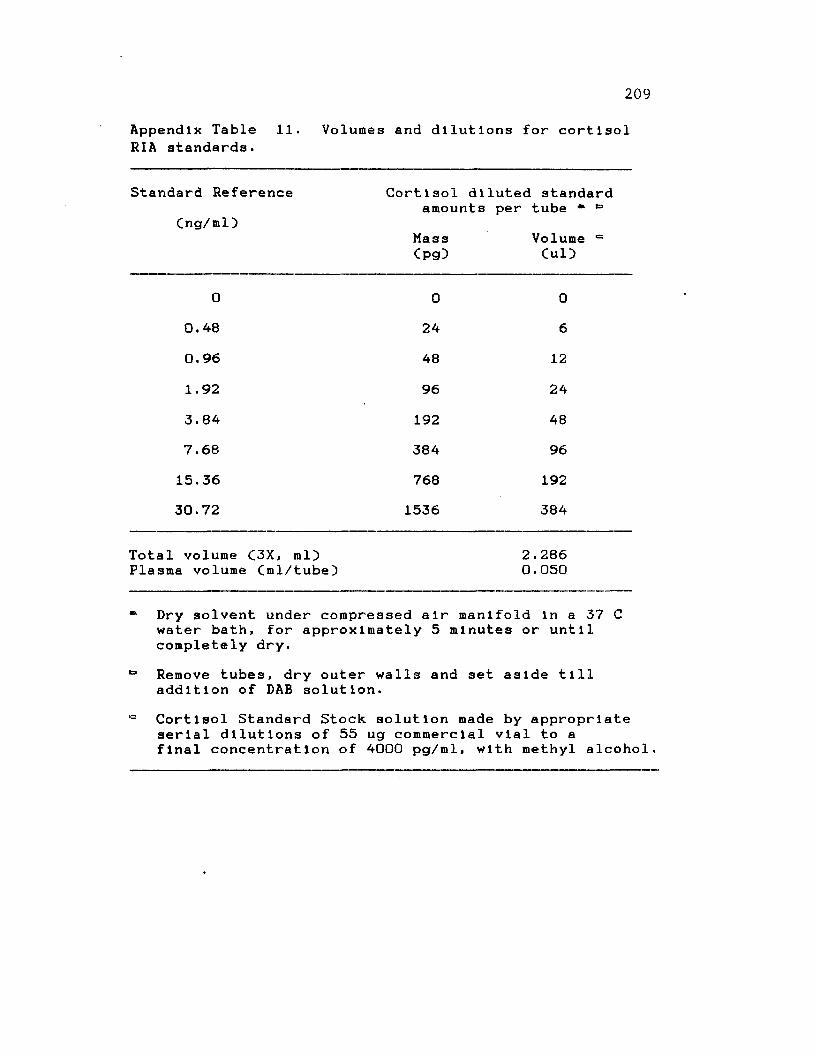
209
Appendix Table 11. Volumes and dilutions for cortisol RIA standards.
Standard Reference
Cng/ml)Cortisol diluted standard
amounts per tube *
Mass Volume 05 Cpg) Cul)
0 0 00.48 24 6
0.96 48 12
1.92 96 24
3.84 192 48
7.68 384 96
15.36 768 19230.72 1536 384
Total volume C3X, ml) Plasma volume Cml/tube)
2.2860.050
** Dry solvent under compressed air manifold In a 37 G water bath, for approximately 5 minutes or until completely dry.
*=■ Remove tubes, dry outer walls and set aside till addition of DAB solution.
,= Cortisol Standard Stock solution made by appropriate serial dilutions of 55 ug commercial vial to a final concentration of 4000 pg/ml, with methyl alcohol.

210Appendix Table 12. List of volumes for cortisol DAB and NSB solutions.
Temp. CC)
Components
IX
Volumes Cml)
2X 4X
20 borate buffer 15.000 30.000 60.00020 3H-cortlaol " 0.040 0.080 0 . 1604 BSA solution 0.300 0.600 1.2004 BGG solution 0.300 0.600 1.200
20 Antiserum or water 0 . 100 0.200 0.40020 Distilled water 1.100 2.200 4.400
Total volumes fc‘ 16.840 33.680 67.360
“■ adjusted dally to 888,800 dpm per 10 ul stock. *=• 200 ul added per tube C70.0 pg, 42,000 dpm}.

211Appendix Table 13. Other chemicals and reagents employed In steroid RIA.
Items
Dlchloromethane, HPLC
Boric acid, reagent
Sodium hydroxide, pellets
Methyl alcohol, nanograde
Ammonium sulfate, reagent
Bovine gamma globulin
Bovine serum albumin
Sodium azlde
d-Aldosterone std. CA6628)
Cortisol, std. 55 ug/vlal
Sodium chloride, reagent
LS cocktail CAqualyte Plus)
Sources
Malllnckrodt, Paris, KY
Sigma Chemical Co., St. Louis, MO
Sigma Diagnostics,St. Louis, MO
J. T. Baker Chemical Co., Phi11lpsburg, NJ

212Appendix Table 14. List of other equipment used In steroid RIA.
Items Sources
Chest freezer. So Low, C-100 C capacity)
Big Vortexer, speed- regulated
Refrigerated centrifuge, benchtop, Sorvall
LS Scintillation Counter, Model LS 8000
Serological water bath
Environmental Cabinet Co., Cincinnati, OH
Glas-Col Apparatus Co., Terre Haute, IN
Ivan, Inc., Norwalk, CT
Beckman Instruments, Fullerton, CA
Fisher Scientific Co., Pittsburg, PA
Automatic mlcroplpette Model Dlglflex
Micromedic Systems, Inc., Horsham, PA

213
Appendix Table 15. Linear regression statistics of loglt-log transformat Ion of four aldosterone RIA standard calibration curves.
Calibration Curve Identification
1 2 3 4
Logit Intercept 0.852 0.824 0.823 0.851
Regression Coefficient -1.027 -0.966 -0.987 -1.037
Coef. of Determination 0.9936 0.9993 0.9909 0.9994
Test of Linearity: MSLF 0.0080 0.0010 0.0011 0.0010
MSPE 0.0021 0.0015 0.0040 0.0018
P > F 0.0218 0.6550 0.0832 0.7322

214
Appendix Table 16. Analysis of pool sample aldosterone and cortisol RIA variances.
Source of Variation d. f. M. S. P > F
ALDOSTERONE:
Assays
RepsCAssay)
DuplIcatesCRep}
CORTISOL:Assays 3 .164074 0.1477
RepsCAssayD 4 .051917 0.1285DuplIcatesCRep) 8 .021008
3 416.58 0.1100
4 106.28 0.1103
8 39.76
Total 15

215
Appendix Table 17. Linear regression statistics of loglt-log transformation of four cortisol RIA standard calibration curves.
Calibration Curve Identification
1 2 3 4
Logit Intercept 0.850 0.852 0.855 0.769Regression Coefficient -1.183 -1.170 -1.190 -1.090Coef. of Determination 0.9989 0.9985 0.9994 0.9989
Test of Linearity: MSLF 0.0020 0.0030 0.0010 0.0020MSPE 0.0012 0.0012 0.0008 0.0021
P > F 0.1444 0.0756 0.2619 0.4918

216
Appendix Table 18. Sources of variation, degrees of freedom, and mean squares for RR and RT.
Sources of varlatIon
degrees of freedom
Mean
RR
squares
RT
Diet 1 1564.08 * 4.471
Pa lr 11 984.36 * 3.852
Diet *palr 11 266.54 1.490
Week 7 2410.14 A * 7.199 **
Diet *week 7 1126.80 * A 3.097
Error 154 294.48 1.427
* P < .05** P < .01

217
Appendix Table 19. Analysis of variance of DMI data.
VarlanceDegrees of Freedom MS PR > F
Diet 1 57.961 .0001Week 7 39.294 .0001
Error 7 .906Total 15

218
Appendix Table 20. Sources of variation, degrees of freedom and mean squares for plasma aldosterone and cort1 sol.
Sources of VarlatIon
Degrees of Freedom
Mean
Cort1 sol
squares
Aldosterone
Diet 1 0.0631 58856.01
Pa lr 11 30.1866 6348.83
Diet *palr 11 34.2333 6541.88
Week. 7 32.1500 30314.54 ~~
Week*dlet 7 20.5279 21468.78 **
Error 154 11.0943 5702.94
Total 191
* P <.05'* P <.01
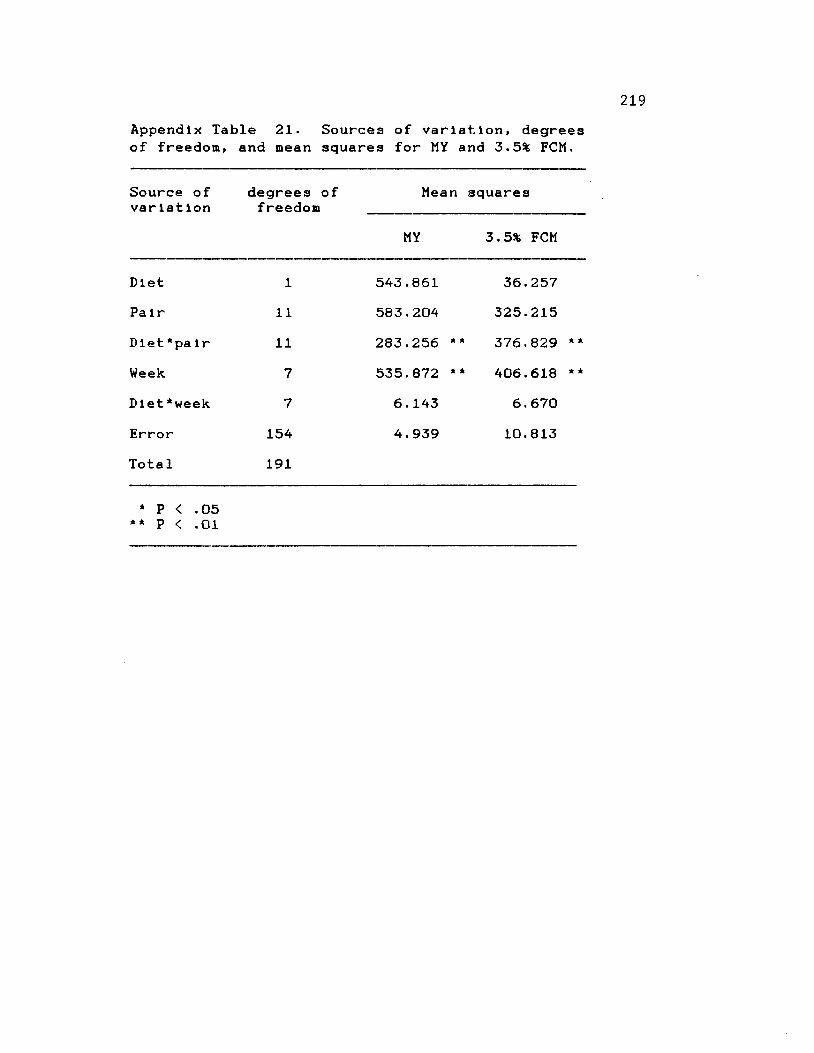
219Appendix Table 21. Sources of variation, degrees of freedom, and mean squares for MY and 3.5% FCM.
Source of var lat ion
degrees of freedom
Mean squares
MY 3.5% FCM
Diet 1 543.861 36.257
Pa lr 11 583.204 325.215
Diet *palr 11 283.256 ** 376.829 **
Week 7 535.872 ** 406.618 **
Diet‘week 7 6 . 143 6.670
Error 154 4.939 10.813
Total 191
* P < .05** P < .01

220Appendix Table 22. Source of variation, degrees of freedom, and mean squares for MFP and MFY.
Source of varlatIon
degrees of freedom
Mean
MFP
squares
MFY
Diet 1 11.6181 * .28021
Pair 11 7.8387 * .88006
Diet *pa lr 11 1.8902 ** .79273 **
Week 7 0.8502 “ .64286 **
Diet *week 7 0.1087 ** .03865
Error 154 0.1520 .04293
Total 191
* P < .05** P < .01

221Appendix Table of freedom, and
23. Sources mean squares
of variation for MPP and
, degrees MPY.
Source of varlatIon
degrees of freedom
Mean squares
MPP MPY
Diet 1 .00163 .22980
Pa lr 11 .63670 .32693
Dlet*palr 11 .35167 “ .20679 “
Week. 7 1.14769 “ .41118 “
Diet‘week 7 .10721 * .36286 *
Error 154 .04224 .01305
Total 191
* P < .05“ P < .01

222Appendix Table of freedom, and
24. Sources mean squares
of variation for MLP and
, degrees MLY.
Source of variation
degrees of freedom
Mean squares
MLP MLY
Diet 1 .70202 .15125
Pa lr 11 .44698 .94057
Diet *palr 11 .29987 ** .74715 “Week 7 .22480 ** 1.05892 **Diet *week 7 .00993 .04399 *Error 154 .00660 .01981Total 191
* P < .05** P < .01

223
Appendix Table 25. Sources of variation, degrees of freedom, and mean squares for milk component ratios.
Source of degrees of Mean squaresvariation freedom ___________________________
Ratios
'“RO: LAC FAT: LAC PRO: FAT
Diet 1 .02732 .32153 * .81763
Pa lr 11 .02862 .31499 ** .33612
Diet * pa 1r 11 .02155 ** .06974 ** .26055 *
Week 7 .03381 ** .01808 * .02632 *
Diet *week 7 .00332 ** .00716 .00795
Error 154 .00222 .00831 .01031
Total 191
* P < .05** P < .01

VITA
George M. Toups was born October 8, 1952 In New
Orleans, Louisiana, and raised In Thlbodaux, Louisiana.He graduated from Thlbodaux High School In May of 1970.
He entered Nlcholls State University In June 1970, then
transferred to Louisiana State University In August 1971.
Upon completing requirements for the Bachelor of Science
degree In Dairy Production Science In May 1974, he entered Graduate School under Dr. J. D. Roussel. A research
assoclateshlp soon followed, along with receiving his
Master of Science degree In Dairy Physiology In December
1980. After working as a parish agent for the Louisiana
Cooperative Extension Service for nearly 5 years, he re
entered Graduate School at Louisiana State University In
January 1986, In pursuit of the degree of Doctor of
Philosophy In the Department of Dairy Science. He will receive his Ph."). degree In December 1989.
224

DOCTORAL EXAMINATION AND DISSERTATION REPORT
Candidate: George M. Toups
Major Field: Dairy (Physiology) S c ie n c e
Title of Dissertation: Evaluation of Fish Meal Supplement on Physiological Response and Milking Performance in Lactating Dairy Cattle Under Heat Stress.
Approved:'
Major Professor am / Chairman
EXAMINING COMMITTEE:
A . /A/' om~ \
JdZ. d.,/ „ ) ^ -L -- J, C C.
Date of Examination:
August 23, 1989